Embed Size (px)
Citation preview
Too Much of a Good Thing? Product Proliferation and Organizational FailureAuthor(s): William P. Barnett and John FreemanSource: Organization Science, Vol. 12, No. 5 (Sep. - Oct., 2001), pp. 539-558Published by: INFORMSStable URL: http://www.jstor.org/stable/3085998 .Accessed: 04/04/2011 08:22
Your use of the JSTOR archive indicates your acceptance of JSTOR's Terms and Conditions of Use, available at .http://www.jstor.org/page/info/about/policies/terms.jsp. JSTOR's Terms and Conditions of Use provides, in part, that unlessyou have obtained prior permission, you may not download an entire issue of a journal or multiple copies of articles, and youmay use content in the JSTOR archive only for your personal, non-commercial use.
Please contact the publisher regarding any further use of this work. Publisher contact information may be obtained at .http://www.jstor.org/action/showPublisher?publisherCode=informs. .
Each copy of any part of a JSTOR transmission must contain the same copyright notice that appears on the screen or printedpage of such transmission.
JSTOR is a not-for-profit service that helps scholars, researchers, and students discover, use, and build upon a wide range ofcontent in a trusted digital archive. We use information technology and tools to increase productivity and facilitate new formsof scholarship. For more information about JSTOR, please contact [email protected].
INFORMS is collaborating with JSTOR to digitize, preserve and extend access to Organization Science.
http://www.jstor.org
Too Much of a Good Thing? Product
Proliferation and Organizational Failure
William P. Barett * John Freeman Graduate School of Business, Stanford University, 518 Memorial Way, Stanford, California 94305-5015
Haas School of Business, University of California, Berkeley, Berkeley, California 94720
Abstract When organizations make important changes, such as introduc- ing products based on new technologies, they may gain strategic advantages but they also experience disruptions. We argue that these disruptions are especially strong when organizations in- troduce multiple products simultaneously, leading to a tempo- rary increase in the hazard of organizational failure. To test this hypothesis, we study the effects of new product introduction on the survival of U.S. semiconductor manufacturers. We find that having a large number of products-especially innovative prod- ucts-lowers organizational mortality rates, but that mortality rates increase because of the simultaneous introduction of mul- tiple products. This hazard is substantial, amounting to an in- crease in the market exit rate of over 40% for the "average" case of simultaneous product innovation. These results are ro- bust in models that control for a wide variety of other factors. Our findings call into question the idea that organizations can overcome disruptions from structural inertia by introducing multiple products simultaneously. (Organizational Ecology; Organizational Change; Technological Change; Technological Innovation; Complexity; Organizational Inertia; Organiza- tional Failure; Technological Competition; First-Mover Advantage)
Two antagonistic facts make organizational adaptation difficult. The first is that new developments, such as tech- nical innovations, rapidly change the basis on which or- ganizations compete. These events typically are marked by the entry of new organizations pursuing novel strate- gies, employing new organizational processes, producing innovative products, and offering new services (Schumpeter 1934, Tushman and Anderson 1986). The second fact is that change by existing organizations is difficult and often slow or error-prone for various reasons (Stinchcombe 1965, Hannan and Freeman 1984). New social roles take time to develop and to be learned by organization mem- bers. Existing structures produce patterns of reward dis- tribution whose disruption engenders resistance (Baron et al. 1991). Political processes slow and sometimes block
change initiatives within organizations (Frost and Egri
1047-7039/01/1205/0539/$05.00 1526-5455 electronic ISSN
1991). Change by organizations is slowed further by com- mitments to existing technologies (Henderson and Clark 1990), and in many cases, organizations employ outdated practices to deal with new circumstances (Levinthal and March 1993). As a result of these various forces, when dramatic organizational change does occur it tends to be disruptive, so that attempts by organizations to adapt to changing circumstances can be hazardous.
Since Hannan and Freeman (1977, 1984) elaborated this idea in their theory of structural inertia, a literature has developed looking at the causes and consequences of organizational change. Researchers now typically ac-
knowledge the once controversial idea that organizational change is difficult and hazardous. Instead of debating whether organizations are inert, researchers look for the conditions under which organizations are more or less adaptive (see Barnett and Carroll 1995 for a review). This literature catalogues various factors that affect the strength of organizational inertia, including organizational char- acteristics (e.g., Haveman 1993a, Amburgey et al. 1993, Huber et al. 1993, Carroll and Teo 1996), the position of an organization in its environment (e.g., Miner et al. 1990, Singh et al. 1991), and the extent or type of change in question (e.g., Carroll 1984, Singh et al. 1986, Zajac and Shortell 1989, Anderson and Tushman 1990, Delacroix and Swaminathan 1991). Overall, research has progressed to the point where we are now beginning to understand the various conditions that affect the extent, benefits, and hazards of organizational change.
An interesting consequence of this progress is the re- cent renaissance in adaptationist thinking, in which re- searchers accept the reality of structural inertia but con- sider it to be a manageable variable. Researchers then look for cases of "best business practice," where organi- zations have been particularly capable of reacting to a
changing environment (Burgelman 1994). So focused, at- tention goes to what makes some organizations change rap- idly: what makes them decisive (Bourgeois and Eisenhardt 1988), quick to market products (Hansen 1996), or more
ORGANIZATION SCIENCE, ? 2001 INFORMS Vol. 12, No. 5, September-October 2001, pp. 539-558
WILLIAM P. BARNETT AND JOHN FREEMAN Product Proliferation and Organization Failure
generally to what gives organizations the capability to change (Teece and Pisano 1994).
One of the more widely accepted ideas in this body of work is that organizations may typically remain inert, but that they occasionally engage in multifaceted transfor- mations when environmental demands are acute. The ra- tionale behind this idea builds on the workings of struc- tural inertia. Incremental changes are inhibited because organizations are systems made up of interdependent parts. When such systems do change, they are likely to do so in all-at-once jumps from one organizational con- figuration to another (Miller and Friesen 1984, Tushman and Romanelli 1985, Milgrom and Roberts 1990, Romanelli and Tushman 1994). Crucial to such transformations is the ability of an organization to simultaneously innovate, coordinating multiple innovations on different fronts at the same time (Iansiti and Khanna 1995, Tushman and O'Reilly 1997). In this way, large-scale innovation is thought to be a strategy for managers to overcome orga- nizational inertia.
Clearly it is important to understand how organizations adapt through product innovation. We are concerned, however, that in their search for instances of adaptation, researchers may be overlooking the unintended conse- quences that may also result from such change (Merton 1936, March 1981). In particular, we think that when or- ganizations add multiple products at once, they may ben- efit in some ways but also experience disruptions that increase their hazard of failure. These disruptions result, we argue, because product innovation typically requires adjustments in various parts of the organization. For the introduction of a single new product, these accompanying adjustments throughout the organization may be straight- forward. When multiple innovations occur at once, how- ever, adjustments made for one change may complicate adjustments made for the others. Consequently, we think it is hazardous for organizations to implement multiple, simultaneous product introductions.
To test our idea, we investigate how new product in- troductions have affected organizational survival chances in the U.S. semiconductor industry. To build an empirical model, we distinguish between two general consequences of change. On the one hand, change alters the content of organizational activity, bringing differences in the prod- ucts and services offered by an organization. When re- searchers identify instances of adaptive, innovative or- ganizations, they usually focus on such content effects of change. Controlling for these content effects, however, change also has process effects. These are the conse- quences that result from change per se: the often disrup- tive effects of altering organizational structures, proce- dures, capabilities, norms, roles, partnerships, and the like (Barnett and Carroll 1995). Our idea concerns the process
effects of introducing multiple products simultaneously, which we think increases the chances of organizational failure, even when the resulting changes succeed in terms of content effects. Before conducting our empirical test, we first explain our thesis in more detail.
Organizational Inertia and Product Innovation Hannan and Freeman (1984) argue that natural selection processes favor reliable, accountable organizational forms that maintain themselves in a relatively inert state. More recently, Kreps (1996) reasons that boundedly ra- tional players sometimes prefer relatively inert behavior to coordinate with others. By either logic, theories of or- ganizational inertia conclude that the organizations we see at any given time will tend to resist significant changes. In particular, inertia is thought to be strongest in an organization's "core" functions-its mission, au- thority structure, technology, or fundamental marketing strategy-when these would require new or different or- ganizational structures, routines and procedures, roles among organizational members, and associations with other organizations (Hannan and Freeman 1984). Such deep-seated changes tend to be resisted, especially in es- tablished organizations that have learned well from their experiences (March 1988).
When organizational change does occur, new roles, pro- cedures, and structures take time to build (Stinchcombe 1965, Hannan and Freeman 1984). It also takes time to form informal network relations within organizations, and to establish ties with other organizations. The effort and resources devoted to solving these managerial problems are not available for other purposes, some of which have direct effects on the probability of survival. For these rea- sons, structural inertia theory predicts that the process of organizational change initially causes higher rates of or- ganizational failure, with a changed organization suffering from much the same liabilities as a brand-new organization (Hannan and Freeman 1984). As time passes after an organ- ization changes, this hazard dissipates as the organization adjusts to its new form and circumstances (Amburgey et al. 1993).
These ideas apply well to new product introductions. New routines are put in place to design, produce, and dis- tribute the new product. These routines often require different workforce and organizational capabilities (Tushman and Anderson 1986). The formal job responsibilities of some positions in the organization may be changed, including those of managers responsible for controlling the work activities of those using the new routines. With new and changing roles among the workforce come changes in the
ORGANIZATION SCIENCE/Vol. 12, No. 5, September-October 2001 540
WILLIAM P. BARNETT AND JOHN FREEMAN Product Proliferation and Organization Failure
networks of relations and communications within the or- ganization (Henderson and Clark 1990). Similarly, rela- tionships with other organizations may need to be changed to accommodate the requirements of the new product, and new ties with other organizations may need to be formed (Rosenbloom and Christensen 1994). Fol- lowing the logic of structural inertia theory, these various adjustments are unlikely to occur optimally at first, and so the organization is likely to experience disruption im- mediately following product innovation. Over time, these initial problems are then likely to dissipate as the orga- nization learns how to support the new product.
This pattern of temporary resistance and disruption plagued some transistor producers, for example, when they initially attempted to produce integrated circuits (Brittain and Freeman 1980). At that time, transistors were sorted by their electrical properties after production. Consequently, there was no need to link specific customer needs to a producer's production, R&D, marketing, dis- tribution, or sales organization. Instead, producers man- ufactured inventory that was sold "off the shelf." By con- trast, integrated circuits typically were manufactured to order, with functionality specified by customer needs and
designed prior to manufacture. This required consider- ably more attention to customer needs in virtually all stages of the research, development, production, distri- bution, and sales processes. It proved to be very difficult to adapt transistor production organizations to these very different requirements. Motorola, for instance, only suc- ceeded in raising its semiconductor yields (the percentage of each batch that would pass inspection) when it pulled production out of its transistor manufacturing division and placed it in a new plant and organization dedicated to the new products. After a period of adjustment, the
company's yields improved to competitive levels. In this
way, product innovation can trigger the temporary dis-
organization predicted by structural inertia theory.
Inertia and Disruption in Multiple Product Innovation We think that these difficulties during product innovation
vary, depending on how many new products are added
simultaneously. When only a single new product is intro- duced, an organization's systems need to adjust only to this product's requirements, and so the resulting disrup- tion is likely to be relatively minor. When multiple prod- ucts are introduced all at once, however, each will require an adjustment of organizational systems. These different, simultaneous organizational adjustments may each constrain, contradict, or interfere with one another in unexpected ways, increasing coordination uncertainty (Camerer and
Weber 1998). This increase in uncertainty implies a greater chance that problems will occur during product introduction. For example, Iansiti (1997) reports that Intel suffered from problems coordinating concurrent innova- tions during the firm's development. According to Iansiti, these problems have been relieved since Intel has reduced its number of concurrent product development initiatives. More generally, we expect that problems of coordination uncertainty increase with the number of products that are introduced simultaneously by an organization.
We qualify our argument, however, because in many cases organizations avoid coordination uncertainty by "decoupling" weakly related innovations. In these cases, an organization is able to isolate innovations from one another, in separate groups or divisions, allowing inde-
pendent adjustments to the requirements of each new
product (Simon 1962, Hannan and Freeman 1984). This
decoupling should decrease problems of coordination un-
certainty among less-related innovations. By contrast, when innovations are closely related in either their tech- nologies or their product markets, they are more likely to
require adjustments in the same parts of the organization. Such mutual interdependency is known to increase the
strength of organizational inertia, because adjustments for each of the interdependent products are then more likely to interfere with the others (Hannan and Freeman 1984, Henderson and Clark 1990, Carroll and Teo 1996, Soren- son 1997). For this reason, we think that problems of coordination uncertainty are greatest when the innova- tions being simultaneously adopted are more closely re- lated.
To operationalize our prediction, we note that as the number of simultaneous innovations increases, the num- ber of uncertainty-causing interactions among them in- creases at an increasing rate. (For a fully interdependent system, the number of interactions increases as a square of the number of new products.) For this reason, we ex-
pect the total amount of coordination uncertainty to in- crease nonlinearly with the number of related products introduced at once. Assuming that this uncertainty is haz- ardous to organizational life chances, we predict:
The simultaneous introduction of multiple, related
products by an organization make it more likely to fail, an effect that increases at an increasing rate with the number of products introduced at once.
This increase in the failure rate is likely to abate over
time, however, as coordination problems are resolved by trial-and-error learning. So we also predict:
This increase in the failure rate falls away as time
passes after the change. To test our ideas, we follow the approach used by
ORGANIZATION SCIENCE/Vo. 12, No. 5, September-October 2001 541
WILLIAM P. BARNETT AND JOHN FREEMAN Product Proliferation and Organization Failure
Miner et al. (1990) in their study of changes among news- paper publishing organizations. They distinguished be- tween cases where a newspaper changed one aspect of its publication and cases where more than one aspect was changed simultaneously, finding that failure rates in- creased more when more than one aspect of the paper was changed at once. To investigate our idea, we need to adapt this approach to distinguish between cases accord- ing to the number of innovations that take place simul- taneously-a variable that ranges along an interval scale. Specifically, in our model we will distinguish cases of single-product innovation from cases of multiple-product innovation, and then specify the latter term according to the number of related innovations that occur at once. To allow the effects of these innovations on the failure rate to change over time, we also include backward- recurrence clocks as used by Amburgey et al. (1993). These terms are then included together in the following model:
rj(t) = rj(t)* exp[6(APy) + Y7('cAj)
+ 6mNapj) + YM(NAPjTAPj)],
where rj(t) is the instantaneous failure rate of organization j, which is allowed to vary over the organization's time in the market t. The term rj(t)* represents the baseline hazard rate for organization j, which we will specify as a function of variables thought to be important to organi- zational failure (as we discuss below). APj is an indicator variable equal to zero until organization j changes its product offerings and equal to one thereafter (starting with the year after the first change). TA^p is the time since the last change in organization j's product offerings (if any). Working together, APj and 'rA, allow change to have an immediate effect on the failure rate (measured by coefficient 6) that then increases or decreases over time (as revealed by coefficient y). These effects distinguish organizations that have changed their products from those that remain with their initial product offerings.
The variable NApj is the number of related new products introduced all-at-once by organization j in its most recent product introduction (if more than 1 were introduced at once), and NAP^rAPj is the interaction of this term and the time since these products were added. These two terms allow the effects of product introduction to differ accord- ing to the number of related new products added all-at- once. If our predictions are correct, then we will find that 5M > 0 and YM < 0, where adding multiple, related prod- ucts temporarily increases the failure rate. Our theory pre- dicts a disruptive effect that increases with NaPj at an increasing rate. In our model, this functional form arises by construction, because we use an exponential specifi-
cation. Questioning this specification, we will also esti- mate the model with NApj specified in the natural loga- rithm and as a quadratic-both functions that allow the effects of NaPj to increase at a decreasing rate.
Two Alternative Hypotheses
Punctuated Change. Contrary to our thinking, some analysts argue that multifaceted change is more adaptive because of organizational complexity.1 Various scholars agree that integrated organizational systems find it more adaptive to change in multifaceted reorientations toward radically different configurations (Miller and Friesen 1984, Tushman and Romanelli 1985, Henderson and Clark 1990). If value-adding "complementarities" exist among parts of an organization, as in Milgrom and Robert's (1990) theoretical model, then it may be more adaptive to change many parts of the organization at once than it is to change just one part. The idea here is that changing just one part of such an organization incurs the cost of lost complementarities. Changing many parts, in contrast, allows the organization to "jump" to a new configuration with a different set of valuable complementarities. Fur- thermore, the existence of a small number of possible, discrete configurations should serve to simplify the de- cision at hand (Milgrom and Roberts 1995). As these au- thors conclude, "... changes need to be coordinated, mul- tidimensional, and large ... It also means that half-way measures-partial adjustments in the right general direc- tion-are likely to yield worse results than staying at the original position." (Milgrom and Roberts 1995, p. 248). Applied to the question of new product introduction, this thinking motivates an alternative to our prediction: Si- multaneous product introductions by an organization make it less likely to fail. If correct, this idea suggests that we will find 6M < 0, where adding a greater number of products all-at-once lowers the failure rate.
Interestingly, analysts taking this perspective have ob- served that organizations are unlikely to make this kind of reorientation perfectly. Instead, they speculate that af- ter a major reorientation, an organization will probably benefit from continued local search and learning (Tushman and Romanelli 1985, Milgrom and Roberts 1995). This agrees with our prediction that organizational failure rates will fall as time passes after a major organizational change (7M < 0). Those who argue for the adaptiveness of punctuated change, then, disagree with our prediction about the immediate effects of such change while they agree with our prediction about improvement after the change.
In our view, all-at-once change may possibly shift an organization into a valuable new configuration, but such
ORGANIZATION SCIENCE/Vol. 12, No. 5, September-October 2001 542
WILLIAM P. BARNETT AND JOHN FREEMAN Product Proliferation and Organization Failure
change nonetheless creates considerable coordination un- certainty. We doubt that the existence of discrete struc- tural alternatives will serve to reduce this uncertainty to the point where such "bet-the-company" shifts are im- mediately adaptive. Rather, we think that the search for a new configuration probably begins with a low initial starting point. Furthermore, because this uncertainty com- pounds with the number of simultaneous changes, we ex- pect that managers are likely to underestimate the diffi- culties involved. Over time, an improved configuration may be discovered through local search, but not before the organization has suffered a period of increased failure chances. In this way, we agree that all-at-once reorien- tations may be adaptive eventually, but only after a period of readjustment to the multifaceted change as we predict. With these arguments in mind, our approach is to resolve this disagreement empirically.
Technological Distance. Another alternative hypothe- sis is well established in the literature on technological change. We predict that coordination uncertainty is strong when multiple new products are related, but many schol- ars argue precisely the opposite, that organizational in- ertia is more of a problem when new products are tech- nologically unrelated (Tushman and Anderson 1986, Anderson and Tushman 1990, Henderson and Clark 1990, Henderson 1993, Iansiti 1997). This disagreement results from a difference in underlying logic. Our argu- ment focuses on disruption because of problems of co- ordination among multiple changes that constrain and in- terfere with one another. Such interdependencies are more likely the more that products are related to one an- other. By contrast, the alternative view focuses on the availability or appropriateness of organizational capabil- ities. When organizations add products that build on ex-
isting organizational and technological capabilities, these
changes are predicted to be less disruptive and so less hazardous, while changes that require entirely different
capabilities are thought to be more hazardous. In testing our hypothesis, it is important that we sepa-
rately control for the effect of moving into technologi- cally distant product areas. We do this by including in the model the variable N^j, which counts the number of
product groups being entered by organization j that are
technologically distant from j's current products. If
change is (temporarily) hazardous when it involves movement into technologically distant product areas, then we will find 6D > 0 and YD < 0, where 8D is the effect of moving into technologically distant product groups, and YD allows for a time decay in that effect. Furthermore, if the adoption of technologically distant products is more hazardous than adopting related products, then we also
will find b6 > bM (where bM is the effect of adding mul- tiple, related products). By contrast, our hypothesis pre- dicts that change is hazardous for simultaneous product additions especially when they are technologically re- lated, so our hypothesis will be supported if 6D < 6M. In this way, separating out the effects of change according to technological distance allows a more precise test of our hypothesis. Also, this approach will prevent disruption because of technological distance from being mistakenly interpreted as support for our hypothesis.
Modeling the Consequences of Change A problem pervading much of the research on organiza- tional change is that different studies control for or con- dition on different variables, making it difficult to rec- oncile inconsistent results. This problem is made worse by the fact that models of the effects of organizational change are often sensitive to specification error (Barnett and Carroll 1995). With this in mind, our strategy is to
lay out in advance a relatively comprehensive set of con- trol variables and conditions that, according to prior re- search, should be explicitly incorporated in our model
specification (over and above control variables that are particularly relevant to the semiconductor industry). Two general types of conditions appear in the literature: dif- ferences in the consequences of change having to do with the characteristics of organizations and differences that result from the competitive or institutional environment. We review each of these differences to build them into our empirical model, either as control variables determin- ing the baseline hazard rate rj(t)* or as additional speci- fications of the change variables.
Growth and Decline Trajectories. Contrary to our pre- diction, some studies that operationalize change in terms of new product introduction find that such changes de- crease the hazard of organizational failure (Delacroix and Swaminathan 1991, Haveman 1992). However, organi- zations that add new products are likely to be experienc- ing good times generally, in which case they will also be less likely to fail. This coincidence may have spuriously affected the estimates of previous studies on the effects of product introduction, showing apparent support for the idea that change improves organizational life chances. If
so, then these results are not causal but occur because other factors both make some organizations less likely to fail and allow them the opportunity to grow. This problem may also affect studies that operationalize change in terms of the market growth or alteration (Kelly and Amburgey 1991, Miller and Chen 1994). When this problem occurs, then the apparent "effects" of new product introduction
simply reflect the fact that some organizations are on a
ORGANIZATION SCIENCEVo1. 12, No. 5, September-October 2001 543
WILLIAM P. BARNETT AND JOHN FREEMAN Product Proliferation and Organization Failure
growth trajectory, in which case it is unlikely that they would fail (Barnett and Carroll 1995).
To capture the effects of being on a growth (or decline) trajectory, we decompose the change indicator variable
APj and clock T,^p to distinguish between product addi- tions and product deletions. This approach allows us to separate the effect of adding products (6A) and the time decay in this effect (yA) from the effect of exiting from product categories (6E) and its time decay (YE). If product additions indicate that an organization is on a growth tra- jectory, then we would find 6A < 0 and YA > 0. These effects together predict lower failure rates for organiza- tions experiencing more frequent product additions. Meanwhile, the opposite pattern of effects (6E < 0 and YE > 0) is likely for the event of exiting from product categories, because frequent events of this sort suggest that an organization is on a decline trajectory. Our pre- diction of a temporary disruption because of multiple product introductions should hold after separately con- trolling for these effects of being on a growth or decline trajectory.
Organizational Age and Size. Many researchers argue or find that the causes and consequences of organizational change depend on an organization's age or size. Hannan and Freeman's (1984) theory argued that inertia increases with age, as organizational practices and relationships be- come institutionalized, suggesting that change is less likely and more hazardous as organizations age (see also Barron et al. 1994). Consistent with this idea, various studies find that older organizations are less likely to change (Delacroix and Swaminathan 1991, on California wineries; Baron et al. 1991, on California state agencies; Amburgey et al. 1993; on Finnish newspaper publishing organizations; Halliday et al. 1993, on state bar associa- tions; Miller and Chen 1994, on airlines), although Baron et al. (1991) find that change again becomes more likely among very old California state agencies. Studies of the con- sequences of change show more mixed results. Amburgey et al. (1993) find that change is more hazardous for older newspaper publishing organizations, while Baum and Singh (1996) find the opposite effect among expanding child care centers.
There is some disagreement in the literature about whether larger organizations are more or less inert. Some have argued that the greater resources of larger organi- zations give them the wherewithal to change (Galbraith 1967, Kimberly 1976, Aldrich and Auster 1986). By con- trast, Hannan and Freeman (1984) predicted that larger organizations are more complex, making them less likely to change and more likely to fail when they try. Empiri- cally, Huber et al. (1993) find a positive relationship be- tween organizational size and the likelihood of change in
a retrospective study of surviving organizations. Several studies find a negative relationship between size and change (Delacroix and Swaminathan 1991, on the Cali- fornia wine industry; Halliday et al. 1991, on U.S. state bar associations; Baron et al. 1991, on California State agencies), while Haveman (1993a) finds that diversifi- cation is more likely among middle-sized savings and loans. On the consequences of change, two studies show that change is more hazardous for larger organizations: Carroll and Teo (1996) study technology change covering the entire history of the American automobile industry, and Baum and Singh (1996) study Toronto day care cen- ter expansion. Clearly, it is important to allow for size- and age-dependent effects of change on failure, and we do so in our analysis.
Innovation and Competition. Thus far, we have focused on the possibly disruptive process effects of change per se. We have not considered, however, the fact that prod- uct introduction is usually carried out with the intention of improving the content of an organization's strategy: making it more appealing to customers, better able to re- tain revenues as profits, and in general better able to com- pete with its rivals. We think that product introductions often result in these intended, adaptive consequences for organizations, and our model must control for these con- tent effects of change for us to distinctly identify whether product innovation also carries the unintended, disruptive process effects that we predict (Barnett and Carroll 1995). For instance, Barnett's (1994) study of technological in- novation among early telephone companies found evi- dence that such change increased failure rates, but this was revealed only in models that separately controlled for the strategic advantages conferred by newer technologies.
The content effects of innovation are well described in theories of industrial evolution, which identify two gen- eral ways that product innovation affects the fates of or- ganizations (Schumpeter 1934). On the one hand, there are benefits to being the first organization to offer a par- ticular type of product (Williamson 1975, Lieberman and Montgomery 1988). First-mover products establish a market position that later entrants may not be able to take away, as when innovative products cultivate a good rep- utation or gain a loyal customer base. Furthermore, first- to-market organizations benefit from learning advantages not had by those who follow. On the other hand, there are competitive advantages for waiting to come to market with the most advanced products, because these products typically outcompete earlier ones on the basis of price, qualitative characteristics, or both (Nelson and Winter 1982, Dosi 1984, Mitchell 1989, Khanna 1995, Carroll and Teo 1996).
ORGANIZATION SCIENCE/Vol. 12, No. 5, September-October 2001 544
WILLIAM P. BARNETT AND JOHN FREEMAN Product Proliferation and Organization Failure
Our objective is to control for each of these conse- quences of innovation: both the advantage of having an early market position and the counteradvantage of being more up-to-date. To control for the first effect, we note that during the period of our study, the semiconductor industry comprised 80 distinct product types. Organiza- tion j's presence in the market, then, can be described in terms of which of these products it offered in any given year. As a baseline, the survival implications ofj's prod- uct offerings can be modeled in terms of an undifferen- tiated summary statistic %;jPj, where Pj is a vector of 80 binary variables corresponding to the industry's possible set of products. Each variable is equal to one in a given year if organization j offers a given product, and zero otherwise. So defined, EjPj is simply the size of organi- zationj in a given year measured as its number of product offerings, and Xk is the effect of size so measured on the failure rate.
To allow the timing of product arrivals to matter, we then decompose this sum and its effect into two terms,
IESjPIJ and XFEyPjy, corresponding to the number of in- novative and follower products, respectively, offered in a given year by organization j. (We define a product to be innovative if it is the first ever of a given product category to appear in the industry, and all product offerings that come later within that category are considered followers.) The coefficient A,, then, is the effect of an organization having an innovative product, while kF is the effect of
having a follower product. As specified in our model, the first-mover advantage is then equal to exp[k, - F]. Note that in our empirical tests, we are likely to exaggerate the size of this first-mover advantage. Often, innovative prod- ucts fail to make it to market, a fact that makes experi- mentation a risky strategy (March 1991). Like most data taken from market guides, however, ours suffer from
sample selection bias because they omit these most- onerous failures. For this reason, we probably overesti- mate the first-mover advantage (cf. Fleming 1998).
Separate from these effects, we also incorporate the
competitive consequences of product introduction. Our
approach here is based on the fact that as organizations change the content of their strategy, they encounter dif- ferent-and potentially more formidable-competitors (Barett 1990, Baum and Singh 1996, Greve 1996). In the case of these semiconductor firms, adding a product implies moving into competition with those organizations that already produce that product or who will produce it in the future. To measure this, we count the "product den-
sity" faced by each organization j: the number of products offered by other organizations in a given year in the same
product categories wherej offers products. In contrast to the
density of organizations, which counts all organizations
whether or not they are in the same or in different parts of the market, product density distinguishes between rival and nonrival products, similar to measures of "niche over-
lap" used in other studies (McPherson 1983, McPherson and Smith-Lovin 1988, Baum and Mezias 1992, Podolny et al. 1996).
We include in the model o(xEjkPk, as a baseline mea- sure of product density, where jOkkPk is the number of
products offered by j' s rivals k in the same product cate-
gories in whichj offers products, and xo is the competition coefficient representing the effect of these rival products on j's failure rate. The "average" strength of product competition is reflected in co, which we expect to be
greater than zero. For comparison, we also include the number of products in categories where organizationj has no products, which we call "nonrival product density." By comparing the effects of rival and nonrival product density, we measure the empirical importance of product overlap.
These measures of product density allow for niche
overlap in product space, but they make no allowance for whether products are close or distant in time. Yet, as our discussion of Schumpeter's theory suggests, differences in time of arrival are likely to be very important to com-
petition in technology-driven markets. Consequently, we also allow competitive intensity to vary according to whether j's rivals are more or less up-to-date. Our ap- proach is to decompose the product density term into two
parts, (xE>j;kPEk and OL>S;ikPLk, corresponding to
whether rival products arrived to market earlier or later in a given product category than j's product offering did. In our model, separating the effects orE and OtL allows rivals to generate stronger competition by introducing a more recent product. Both terms represent the effects of other firms' products on organization j's failure rate, and so we expect them each to be positive. There would be no significant difference between these coefficients if all
products generate competition of equal intensity. If more
recently-introduced products and technologies generate stronger competition, as discovered in Carroll and Teo's
(1996) study of innovation in the U.S. automobile indus-
try, then we should find that aL > tE.
Taken together, these market timing and competition effects allow for a reasonably complete specification of the Schumpeterian tradeoff between being first-to-market and being up-to-date. Organizations with the greatest first-to-market advantage will face all of their competition (if any) in the form of more up-to-date rivals. Conversely, organizations that arrive to market consistently late miss out on the first-mover advantage, but instead reap the ad-
vantage of having less up-to-date rivals. Furthermore, by
ORGANIZATION SCIENCE/Vl. 12, No. 5, September-October 2001 545
WILLIAM P. BARNETT AND JOHN FREEMAN Product Proliferation and Organization Failure
measuring these distinctions among the 80 different prod- uct categories in our data, we allow organizations to fol- low "mixed" strategies of being early in some parts of the market while they are more up-to-date in others.
Institutional Linkages. The consequences of organiza- tional change also depend on the institutional position held by organizations, defined specifically in terms of re-
lationships to other important organizations in its envi- ronment. In general, we know that such institutional af- filiations matter to survival as a main effect (Carroll and Delacroix 1982, Baum and Oliver 1991). We also know that changes in an organization's institutional environ- ment affect its likelihood of changing (Edelman 1990, 1992, Baron et al. 1991, Singh et al. 1991, Dobbin et al. 1993, Sutton et al. 1994). Our concern here is whether institutional affiliations may buffer organizations from the otherwise disruptive effects of organizational change, as Miner et al. (1990) found in their study of Finnish newspapers. In our data, the most obvious institutional distinction appears among semiconductor producers that are divisions of larger organizations. For these divisions, exit rates are known to be lower than is the case for stand- alone semiconductor firms (Hannan and Freeman 1989), and so we will control for this distinction in our models.
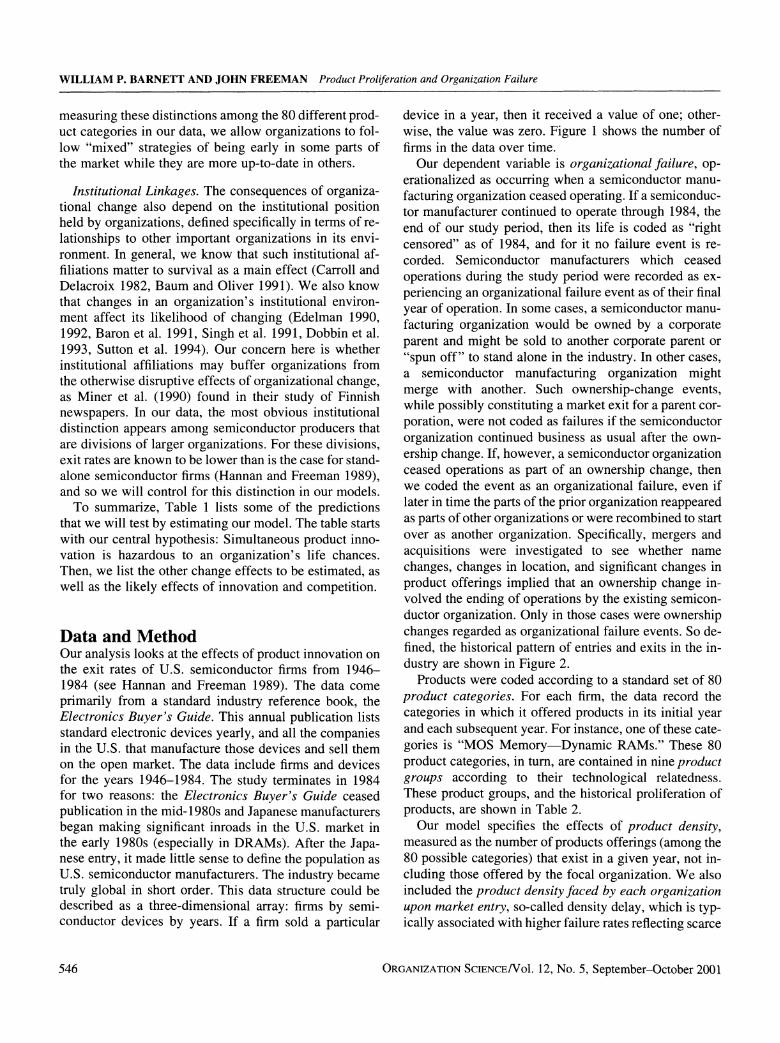
To summarize, Table 1 lists some of the predictions that we will test by estimating our model. The table starts with our central hypothesis: Simultaneous product inno- vation is hazardous to an organization's life chances. Then, we list the other change effects to be estimated, as well as the likely effects of innovation and competition.
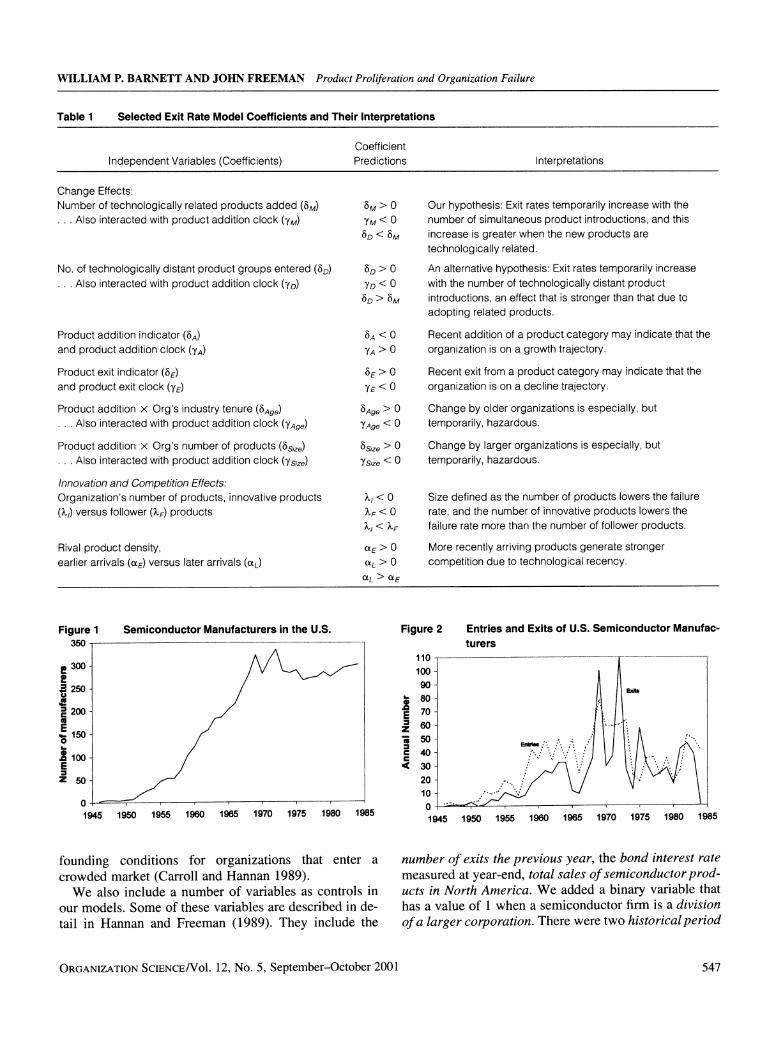
Data and Method Our analysis looks at the effects of product innovation on the exit rates of U.S. semiconductor firms from 1946- 1984 (see Hannan and Freeman 1989). The data come primarily from a standard industry reference book, the Electronics Buyer's Guide. This annual publication lists standard electronic devices yearly, and all the companies in the U.S. that manufacture those devices and sell them on the open market. The data include firms and devices for the years 1946-1984. The study terminates in 1984 for two reasons: the Electronics Buyer's Guide ceased publication in the mid-1980s and Japanese manufacturers began making significant inroads in the U.S. market in the early 1980s (especially in DRAMs). After the Japa- nese entry, it made little sense to define the population as U.S. semiconductor manufacturers. The industry became truly global in short order. This data structure could be described as a three-dimensional array: firms by semi- conductor devices by years. If a firm sold a particular
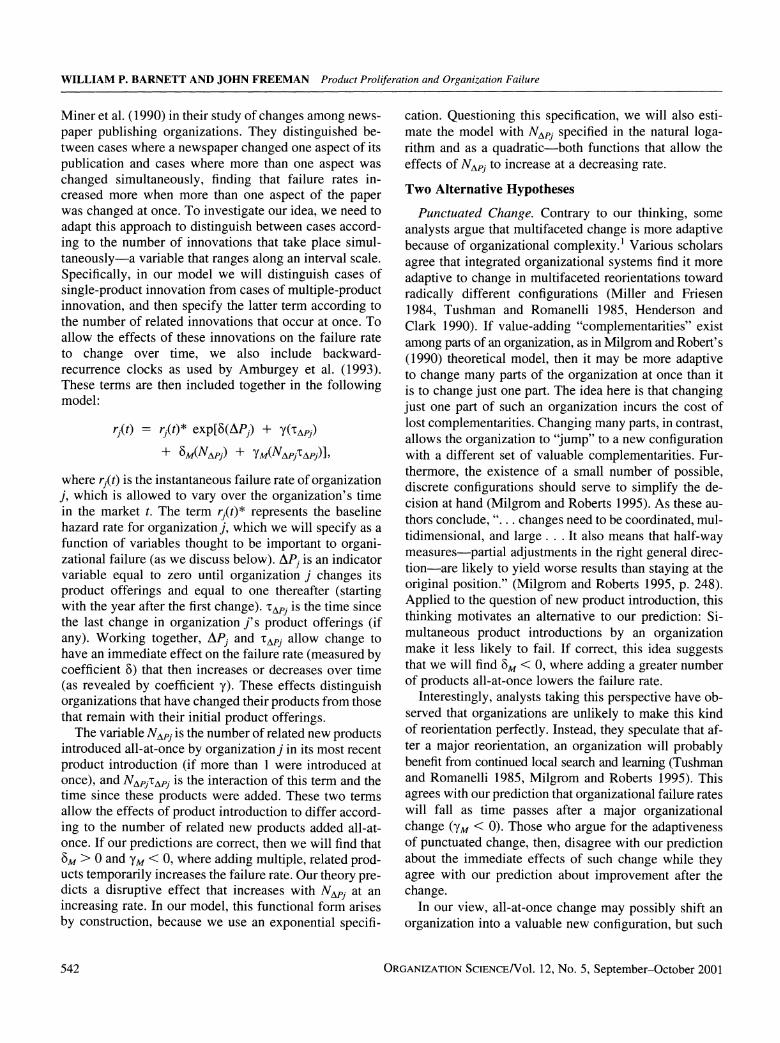
device in a year, then it received a value of one; other- wise, the value was zero. Figure 1 shows the number of firms in the data over time.
Our dependent variable is organizational failure, op- erationalized as occurring when a semiconductor manu- facturing organization ceased operating. If a semiconduc- tor manufacturer continued to operate through 1984, the end of our study period, then its life is coded as "right censored" as of 1984, and for it no failure event is re- corded. Semiconductor manufacturers which ceased operations during the study period were recorded as ex- periencing an organizational failure event as of their final year of operation. In some cases, a semiconductor manu-
facturing organization would be owned by a corporate parent and might be sold to another corporate parent or "spun off" to stand alone in the industry. In other cases, a semiconductor manufacturing organization might merge with another. Such ownership-change events, while possibly constituting a market exit for a parent cor-
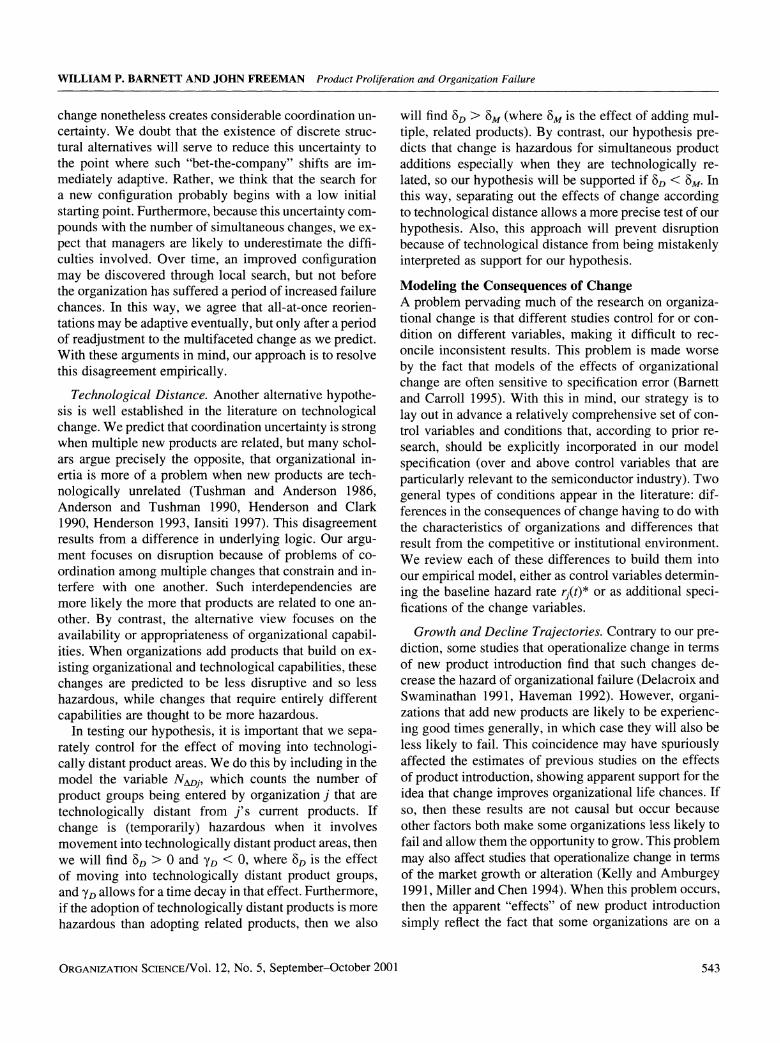
poration, were not coded as failures if the semiconductor organization continued business as usual after the own- ership change. If, however, a semiconductor organization ceased operations as part of an ownership change, then we coded the event as an organizational failure, even if later in time the parts of the prior organization reappeared as parts of other organizations or were recombined to start over as another organization. Specifically, mergers and acquisitions were investigated to see whether name changes, changes in location, and significant changes in product offerings implied that an ownership change in- volved the ending of operations by the existing semicon- ductor organization. Only in those cases were ownership changes regarded as organizational failure events. So de- fined, the historical pattern of entries and exits in the in- dustry are shown in Figure 2.
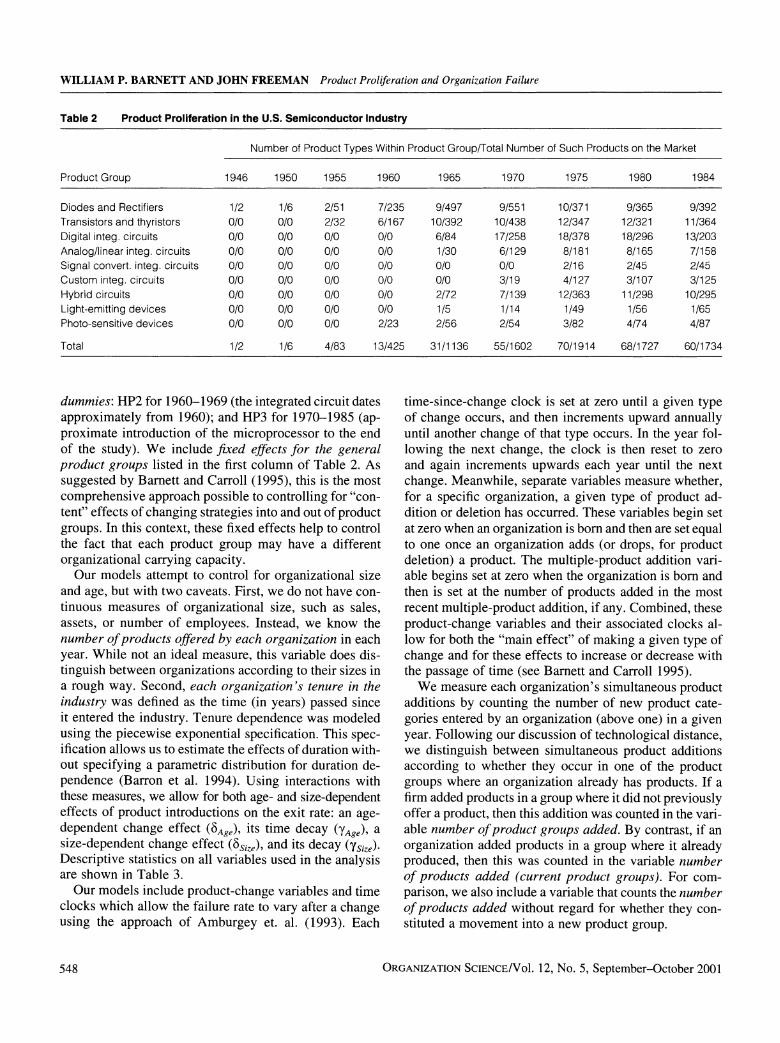
Products were coded according to a standard set of 80 product categories. For each firm, the data record the categories in which it offered products in its initial year and each subsequent year. For instance, one of these cate- gories is "MOS Memory-Dynamic RAMs." These 80 product categories, in turn, are contained in nine product groups according to their technological relatedness. These product groups, and the historical proliferation of products, are shown in Table 2.
Our model specifies the effects of product density, measured as the number of products offerings (among the 80 possible categories) that exist in a given year, not in- cluding those offered by the focal organization. We also included the product density faced by each organization upon market entry, so-called density delay, which is typ- ically associated with higher failure rates reflecting scarce
ORGANIZATION SCIENCE/Vol. 12, No. 5, September-October 2001 546
WILLIAM P. BARNETT AND JOHN FREEMAN Product Proliferation and Organization Failure
Table 1 Selected Exit Rate Model Coefficients and Their Interpretations
Coefficient Independent Variables (Coefficients) Predictions Interpretations
Change Effects: Number of technologically related products added (6M) 6M > 0 Our hypothesis: Exit rates temporarily increase with the . . Also interacted with product addition clock (YM) YM < 0 number of simultaneous product introductions, and this
?D < 6M increase is greater when the new products are
technologically related.
No. of technologically distant product groups entered (6D) 6D > 0 An alternative hypothesis: Exit rates temporarily increase ... Also interacted with product addition clock (YD) YD < 0 with the number of technologically distant product
80 > 6M introductions, an effect that is stronger than that due to adopting related products.
Product addition indicator (6A) 6A < 0 Recent addition of a product category may indicate that the and product addition clock (YA) YA > 0 organization is on a growth trajectory.
Product exit indicator (6E) 6E > 0 Recent exit from a product category may indicate that the and product exit clock (YE) YE < 0 organization is on a decline trajectory.
Product addition x Org's industry tenure (6Age) Age > 0 Change by older organizations is especially, but ... Also interacted with product addition clock (YAge) YAge < 0 temporarily, hazardous.
Product addition x Org's number of products (6size) 6s,ze > 0 Change by larger organizations is especially, but
... Also interacted with product addition clock (Ysize) Ysize < 0 temporarily, hazardous.
Innovation and Competition Effects: Organization's number of products, innovative products X, < 0 Size defined as the number of products lowers the failure
(;/) versus follower (XF) products kF < 0 rate, and the number of innovative products lowers the
/, < kF failure rate more than the number of follower products.
Rival product density, LE > 0 More recently arriving products generate stronger earlier arrivals (aE) versus later arrivals (aL) tL > 0 competition due to technological recency.
OLL > OlE
Figure 1 Semiconductor Manufacturers in the U.S.
e 300
250
' 200
E 150
S 10
z 50-
0 1. 1
1945 1950 1955 1960 1965 1970 1975 1980 1985
founding conditions for organizations that enter a crowded market (Carroll and Hannan 1989).
We also include a number of variables as controls in our models. Some of these variables are described in de- tail in Hannan and Freeman (1989). They include the
Figure 2 Entries and Exits of U.S. Semiconductor Manufac- turers
110 100- 90 -
Exb
$ 80 -
E 70-
2 50 - Zr X 0 -50
-30-20-
Enbk , ,
; X ,. -*
0 1945 1950 1955 1960 1965 1970 1975 1980 1985
number of exits the previous year, the bond interest rate measured at year-end, total sales of semiconductor prod- ucts in North America. We added a binary variable that has a value of 1 when a semiconductor firm is a division
of a larger corporation. There were two historical period
ORGANIZATION SCIENCE/Vol. 12, No. 5, September-October 2001 547
WILLIAM P. BARNETT AND JOHN FREEMAN Product Proliferation and Organization Failure
Table 2 Product Proliferation in the U.S. Semiconductor Industry
Number of Product Types Within Product Group/Total Number of Such Products on the Market
Product Group 1946 1950 1955 1960 1965 1970 1975 1980 1984
Diodes and Rectifiers 1/2 1/6 2/51 7/235 9/497 9/551 10/371 9/365 9/392 Transistors and thyristors 0/0 0/0 2/32 6/167 10/392 10/438 12/347 12/321 11/364 Digital integ. circuits 0/0 0/0 0/0 0/0 6/84 17/258 18/378 18/296 13/203 Analog/linear integ. circuits 0/0 0/0 0/0 0/0 1/30 6/129 8/181 8/165 7/158 Signal convert. integ. circuits 0/0 0/0 0/0 0/0 0/0 0/0 2/16 2/45 2/45 Custom integ. circuits 0/0 0/0 0/0 0/0 0/0 3/19 4/127 3/107 3/125 Hybrid circuits 0/0 0/0 0/0 0/0 2/72 7/139 12/363 11/298 10/295 Light-emitting devices 0/0 0/0 0/0 0/0 1/5 1/14 1/49 1/56 1/65 Photo-sensitive devices 0/0 0/0 0/0 2/23 2/56 2/54 3/82 4/74 4/87
Total 1/2 1/6 4/83 13/425 31/1136 55/1602 70/1914 68/1727 60/1734
dummies: HP2 for 1960-1969 (the integrated circuit dates approximately from 1960); and HP3 for 1970-1985 (ap- proximate introduction of the microprocessor to the end of the study). We include fixed effects for the general product groups listed in the first column of Table 2. As suggested by Barnett and Carroll (1995), this is the most comprehensive approach possible to controlling for "con- tent" effects of changing strategies into and out of product groups. In this context, these fixed effects help to control the fact that each product group may have a different organizational carrying capacity.
Our models attempt to control for organizational size and age, but with two caveats. First, we do not have con- tinuous measures of organizational size, such as sales, assets, or number of employees. Instead, we know the number of products offered by each organization in each year. While not an ideal measure, this variable does dis- tinguish between organizations according to their sizes in a rough way. Second, each organization's tenure in the industry was defined as the time (in years) passed since it entered the industry. Tenure dependence was modeled using the piecewise exponential specification. This spec- ification allows us to estimate the effects of duration with- out specifying a parametric distribution for duration de- pendence (Barron et al. 1994). Using interactions with these measures, we allow for both age- and size-dependent effects of product introductions on the exit rate: an age- dependent change effect (6Age), its time decay (YAge), a size-dependent change effect (6Size), and its decay (YSize).
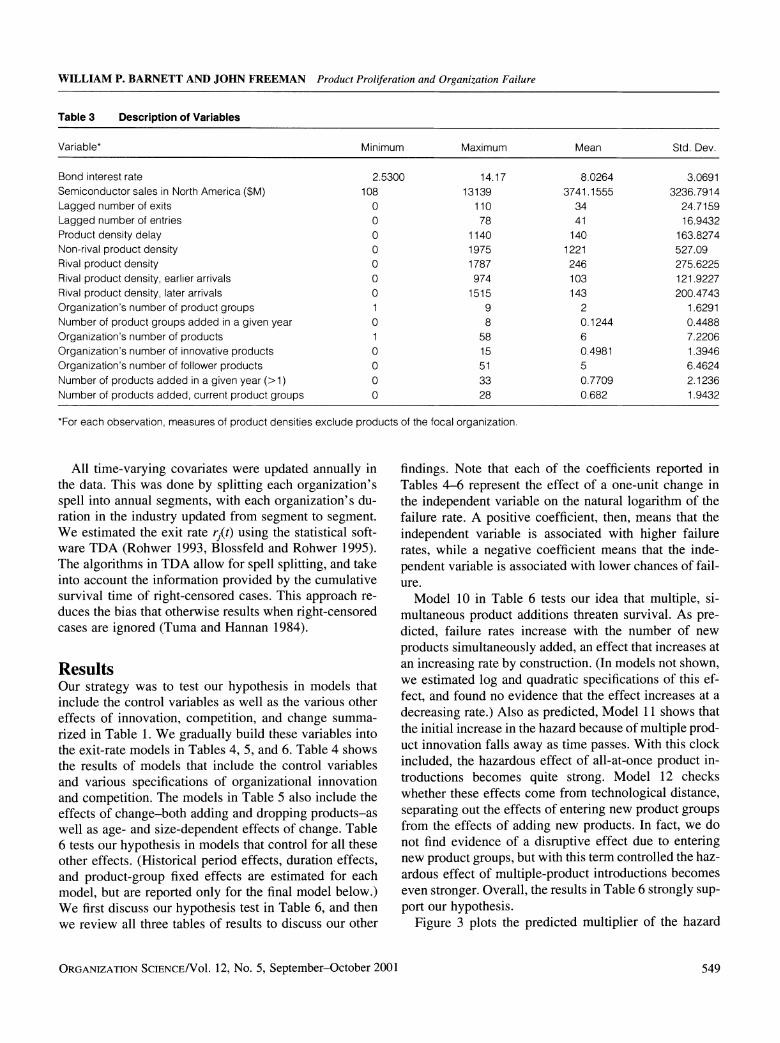
Descriptive statistics on all variables used in the analysis are shown in Table 3.
Our models include product-change variables and time clocks which allow the failure rate to vary after a change using the approach of Amburgey et. al. (1993). Each
time-since-change clock is set at zero until a given type of change occurs, and then increments upward annually until another change of that type occurs. In the year fol- lowing the next change, the clock is then reset to zero and again increments upwards each year until the next change. Meanwhile, separate variables measure whether, for a specific organization, a given type of product ad- dition or deletion has occurred. These variables begin set at zero when an organization is born and then are set equal to one once an organization adds (or drops, for product deletion) a product. The multiple-product addition vari- able begins set at zero when the organization is born and then is set at the number of products added in the most recent multiple-product addition, if any. Combined, these product-change variables and their associated clocks al- low for both the "main effect" of making a given type of change and for these effects to increase or decrease with the passage of time (see Barnett and Carroll 1995).
We measure each organization's simultaneous product additions by counting the number of new product cate- gories entered by an organization (above one) in a given year. Following our discussion of technological distance, we distinguish between simultaneous product additions according to whether they occur in one of the product groups where an organization already has products. If a firm added products in a group where it did not previously offer a product, then this addition was counted in the vari- able number of product groups added. By contrast, if an organization added products in a group where it already produced, then this was counted in the variable number of products added (current product groups). For com- parison, we also include a variable that counts the number of products added without regard for whether they con- stituted a movement into a new product group.
ORGANIZATION SCIENCE/Vol. 12, No. 5, September-October 2001 548
WILLIAM P. BARNETT AND JOHN FREEMAN Product Proliferation and Organization Failure
Table 3 Description of Variables
Variable* Minimum Maximum Mean Std. Dev.
Bond interest rate 2.5300 14.17 8.0264 3.0691 Semiconductor sales in North America ($M) 108 13139 3741.1555 3236.7914 Lagged number of exits 0 110 34 24.7159 Lagged number of entries 0 78 41 16.9432 Product density delay 0 1140 140 163.8274 Non-rival product density 0 1975 1221 527.09 Rival product density 0 1787 246 275.6225 Rival product density, earlier arrivals 0 974 103 121.9227 Rival product density, later arrivals 0 1515 143 200.4743 Organization's number of product groups 1 9 2 1.6291 Number of product groups added in a given year 0 8 0.1244 0.4488 Organization's number of products 1 58 6 7.2206 Organization's number of innovative products 0 15 0.4981 1.3946 Organization's number of follower products 0 51 5 6.4624 Number of products added in a given year (>1) 0 33 0.7709 2.1236 Number of products added, current product groups 0 28 0.682 1.9432
*For each observation, measures of product densities exclude products of the focal organization.
All time-varying covariates were updated annually in the data. This was done by splitting each organization's spell into annual segments, with each organization's du- ration in the industry updated from segment to segment. We estimated the exit rate rj(t) using the statistical soft- ware TDA (Rohwer 1993, Blossfeld and Rohwer 1995). The algorithms in TDA allow for spell splitting, and take into account the information provided by the cumulative survival time of right-censored cases. This approach re- duces the bias that otherwise results when right-censored cases are ignored (Tuma and Hannan 1984).
Results Our strategy was to test our hypothesis in models that include the control variables as well as the various other effects of innovation, competition, and change summa- rized in Table 1. We gradually build these variables into the exit-rate models in Tables 4, 5, and 6. Table 4 shows the results of models that include the control variables and various specifications of organizational innovation and competition. The models in Table 5 also include the effects of change-both adding and dropping products-as well as age- and size-dependent effects of change. Table 6 tests our hypothesis in models that control for all these other effects. (Historical period effects, duration effects, and product-group fixed effects are estimated for each model, but are reported only for the final model below.) We first discuss our hypothesis test in Table 6, and then we review all three tables of results to discuss our other
findings. Note that each of the coefficients reported in Tables 4-6 represent the effect of a one-unit change in the independent variable on the natural logarithm of the failure rate. A positive coefficient, then, means that the
independent variable is associated with higher failure rates, while a negative coefficient means that the inde-
pendent variable is associated with lower chances of fail- ure.
Model 10 in Table 6 tests our idea that multiple, si- multaneous product additions threaten survival. As pre- dicted, failure rates increase with the number of new
products simultaneously added, an effect that increases at an increasing rate by construction. (In models not shown, we estimated log and quadratic specifications of this ef- fect, and found no evidence that the effect increases at a
decreasing rate.) Also as predicted, Model 11 shows that the initial increase in the hazard because of multiple prod- uct innovation falls away as time passes. With this clock included, the hazardous effect of all-at-once product in- troductions becomes quite strong. Model 12 checks whether these effects come from technological distance, separating out the effects of entering new product groups from the effects of adding new products. In fact, we do not find evidence of a disruptive effect due to entering new product groups, but with this term controlled the haz- ardous effect of multiple-product introductions becomes even stronger. Overall, the results in Table 6 strongly sup- port our hypothesis.
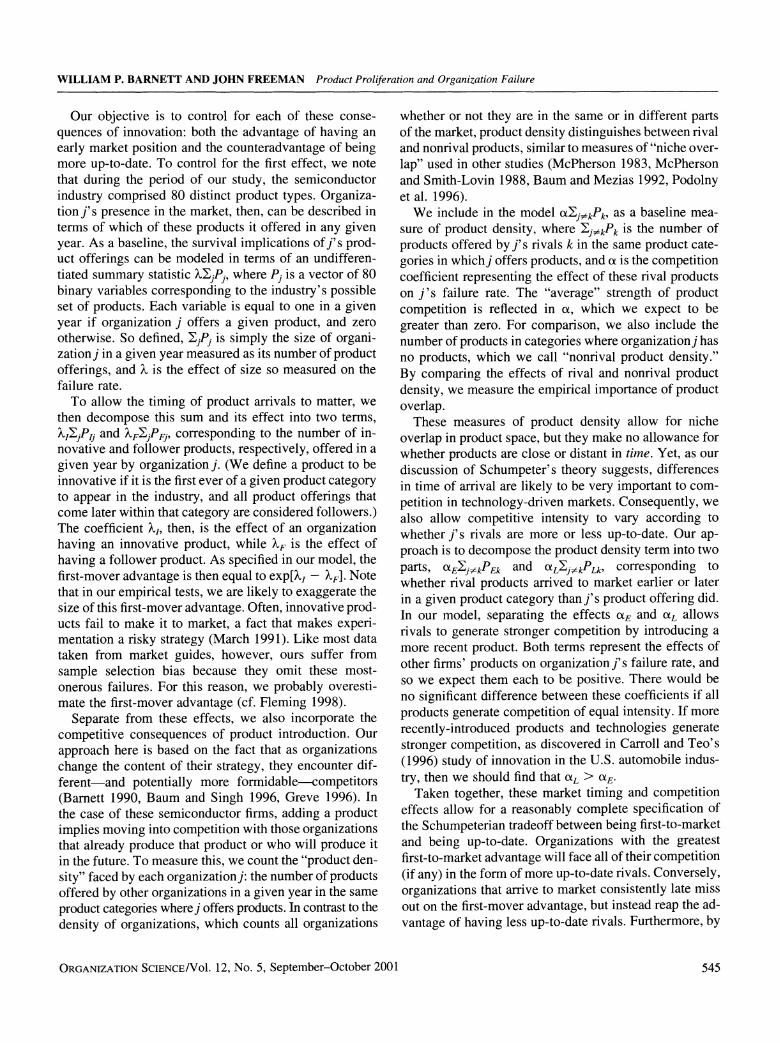
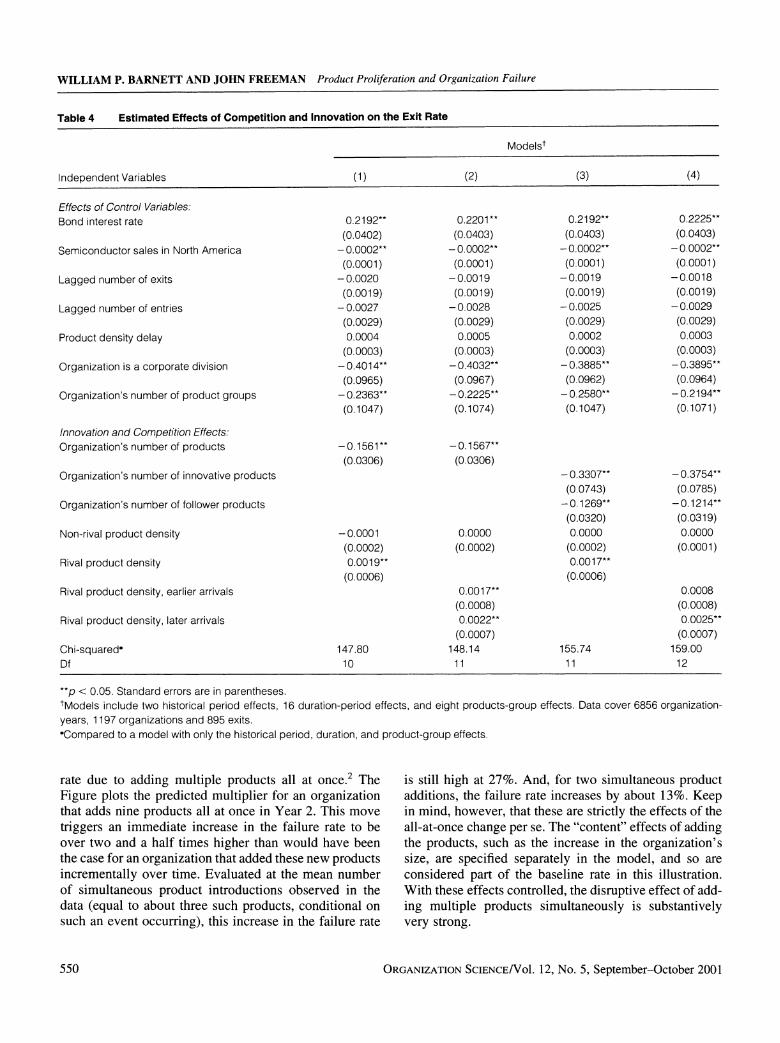
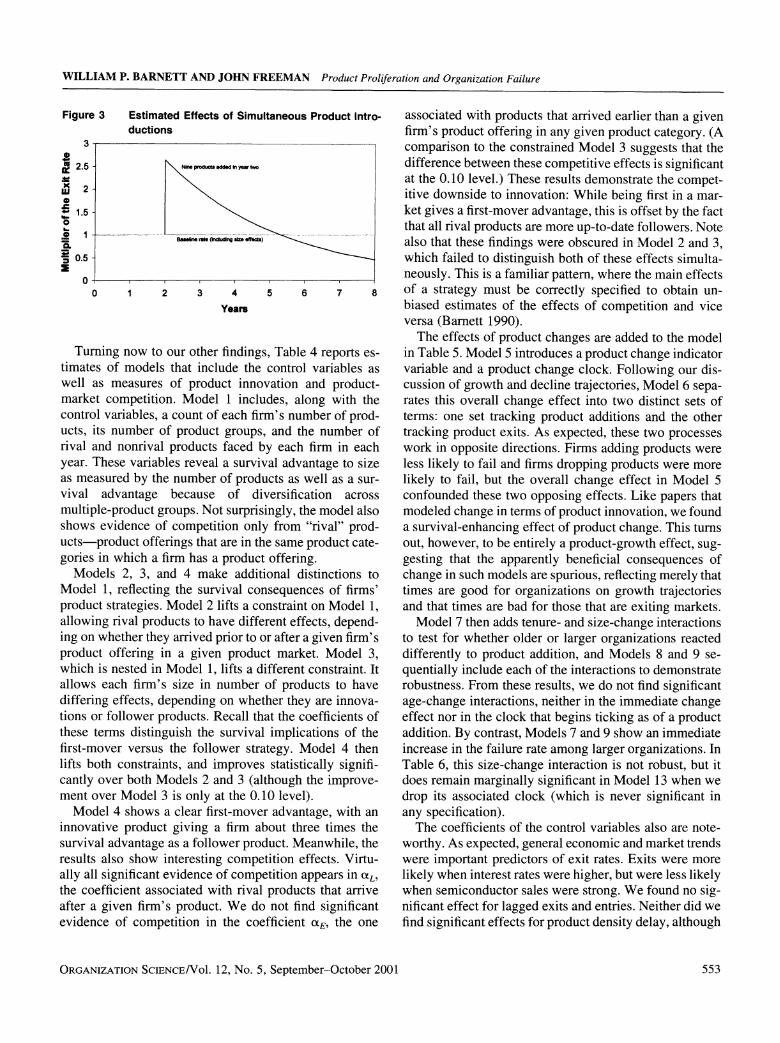
Figure 3 plots the predicted multiplier of the hazard
ORGANIZATION SCIENCE/Vol. 12, No. 5, September-October 2001 549
WILLIAM P. BARNETT AND JOHN FREEMAN Product Proliferation and Organization Failure
Table 4 Estimated Effects of Competition and Innovation on the Exit Rate
Modelst
Independent Variables (1) (2) (3) (4)
Effects of Control Variables: Bond interest rate 0.2192** 0.2201** 0.2192** 0.2225**
(0.0402) (0.0403) (0.0403) (0.0403) Semiconductor sales in North America - 0.0002** - 0.0002** - 0.0002** - 0.0002**
(0.0001) (0.0001) (0.0001) (0.0001)
Lagged number of exits -0.0020 -0.0019 -0.0019 -0.0018
(0.0019) (0.0019) (0.0019) (0.0019) Lagged number of entries - 0.0027 -0.0028 -0.0025 -0.0029
(0.0029) (0.0029) (0.0029) (0.0029) Product density delay 0.0004 0.0005 0.0002 0.0003
(0.0003) (0.0003) (0.0003) (0.0003) Organization is a corporate division -0.4014** -0.4032** -0.3885** -0.3895**
(0.0965) (0.0967) (0.0962) (0.0964) Organization's number of product groups -0.2363** -0.2225** -0.2580** -0.2194**
(0.1047) (0.1074) (0.1047) (0.1071)
Innovation and Competition Effects: Organization's number of products -0.1561 * -0.1567**
(0.0306) (0.0306) Organization's number of innovative products -0.3307** -0.3754**
(0.0743) (0.0785) Organization's number of follower products - 0.1269** -0.1214**
(0.0320) (0.0319) Non-rival product density -0.0001 0.0000 0.0000 0.0000
(0.0002) (0.0002) (0.0002) (0.0001) Rival product density 0.0019** 0.0017**
(0.0006) (0.0006) Rival product density, earlier arrivals 0.0017** 0.0008
(0.0008) (0.0008)
Rival product density, later arrivals 0.0022** 0.0025**
(0.0007) (0.0007) Chi-squared, 147.80 148.14 155.74 159.00
Df 10 11 11 12
**p < 0.05. Standard errors are in parentheses. tModels include two historical period effects, 16 duration-period effects, and eight products-group effects. Data cover 6856 organization-
years, 1197 organizations and 895 exits.
*Compared to a model with only the historical period, duration, and product-group effects.
rate due to adding multiple products all at once.2 The is still high at 27%. And, for two simultaneous product Figure plots the predicted multiplier for an organization additions, the failure rate increases by about 13%. Keep that adds nine products all at once in Year 2. This move in mind, however, that these are strictly the effects of the triggers an immediate increase in the failure rate to be all-at-once change per se. The "content" effects of adding over two and a half times higher than would have been the products, such as the increase in the organization's the case for an organization that added these new products size, are specified separately in the model, and so are incrementally over time. Evaluated at the mean number considered part of the baseline rate in this illustration. of simultaneous product introductions observed in the With these effects controlled, the disruptive effect of add- data (equal to about three such products, conditional on ing multiple products simultaneously is substantively such an event occurring), this increase in the failure rate very strong.
ORGANIZATION SCIENCE/Vol. 12, No. 5, September-October 2001 550
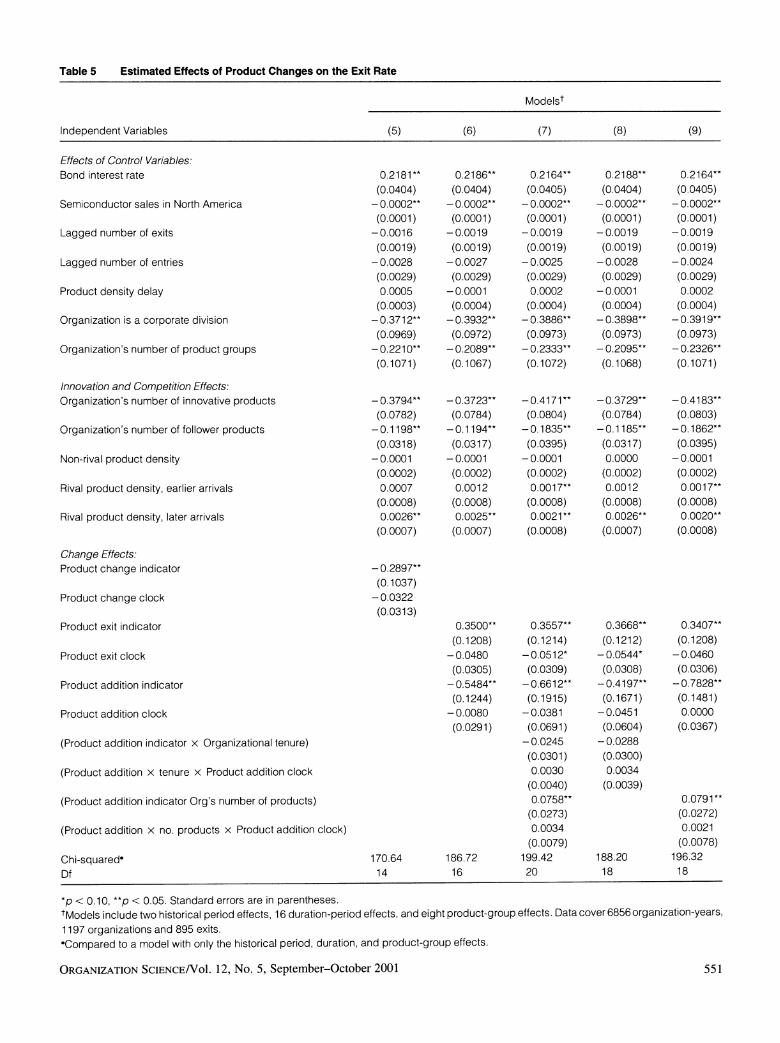
Table 5 Estimated Effects of Product Changes on the Exit Rate
Modelst
Independent Variables (5) (6) (7) (8) (9)
Effects of Control Variables: Bond interest rate
Semiconductor sales in North America
Lagged number of exits
Lagged number of entries
Product density delay
Organization is a corporate division
Organization's number of product groups
Innovation and Competition Effects: Organization's number of innovative products
Organization's number of follower, products
Non-rival product density
Rival product density, earlier arrivals
Rival product density, later arrivals
Change Effects: Product change indicator
Product change clock
Product exit indicator
Product exit clock
Product addition indicator
Product addition clock
(Product addition indicator x Organizational tenure)
(Product addition x tenure x Product addition clock
(Product addition indicator Org's number of products)
(Product addition x no. products x Product addition clock)
Chi-squared" Df
0.2181 ** 0.2186** 0.2164** 0.2188** 0.2164** (0.0404) (0.0404) (0.0405) (0.0404) (0.0405) - 0.0002** - 0.0002** -0.0002** - 0.0002** -0.0002~* (0.0001) (0.0001) (0.0001) (0.0001) (0.0001)
-0.0016 -0.0019 -0.0019 - 0.0019 -0.0019 (0. 00 19) (0. 00 19) (0. 00 19) (0. 00 19) (0. 00 19)
-0.0028 -0.0027 - 0.0025 -0.0028 -0.0024 (0.0029) (0.0029) (0.0029) (0.0029) (0.0029) 0.0005 -0.0001 0.0002 - 0.0001 0.0002
(0.0003) (0.0004) (0.0004) (0.0004) (0.0004) - 0.3712** - 0.3932** -0.3886** - 0.3898** - 0.3919** (0.0969) (0.0972) (0.0973) (0.0973) (0.0973)
- 0.221 0* -0,2089** -0.2333** - 0.2095** -0.2326** (0.1071) (0.1067) (0.1072) (0.1068) (0.1071)
- 0.3794** - 0.3723** - 0.4171~ ** -0.3729** - 0.4183** (0.0782) (0.0784) (0.0804) (0.0784) (0.0803)
- 0. 1198** - 0. 1194** -0. 1835** - 0. 1185** - 0. 1862** (0.0318) (0.0317) (0.0395) (0.0317) (0.0395)
- 0.0001 - 0.0001 -0.0001 0.0000 -0.0001 (0.0002) (0.0002) (0.0002) (0.0002) (0.0002) 0.0007 0.0012 0.001 7* 0.0012 0.001 7**
(0.0008) (0.0008) (0.0008) (0.0008) (0.0008) 0.0026** 0.0025** 0.0021 ** 0.0026** 0.0020**
(0.0007) (0.0007) (0.0008) (0.0007) (0.0008)
- 0.2897**
(0.1037) - 0.0322 (0.0313)
0Q3500** 0Q3557** 0.3668** 0.3407** (0.1208) (0.1214) (0.1212) (0.1208)
-0.0480 - 0. 051 2* -Q0544* -0.0460 (0.0305) (0.0309) (0.0308) (0.0306) - 0.5484** - 0.6612** - 0.4197** -0.7828** (0.1244) (0.1915) (0.1671) (0.1481)
-0.0080 -0.0381 -0.0451 0.0000 (0.0291) (0.0691) (0.0604) (0.0367)
-0.0245 -0.0288 (0.0301) (0.0300) 0.0030 0.0034
(0.0040) (0.0039) 0.0758** 0.0791~
(0.0273) (0.0272) 0.0034 0.0021
(0.0079) (0.0078) 186.72 199.42 188.20 196.32
1 6 20 1 8 1 8 170.64 14
*P<0.10, **p < 0.05. Standard errors are in parentheses. tModels include two historical period effects, 16 duration-period effects, and eight product-group effects. Data cover 6856 organization-years, 1 197 organizations and 895 exits. "Compared to a model with only the historical period, duration, and product-group effects.
ORGANIZATION SCIENCE/Vol. 12, No. 5, September-October 200151 551
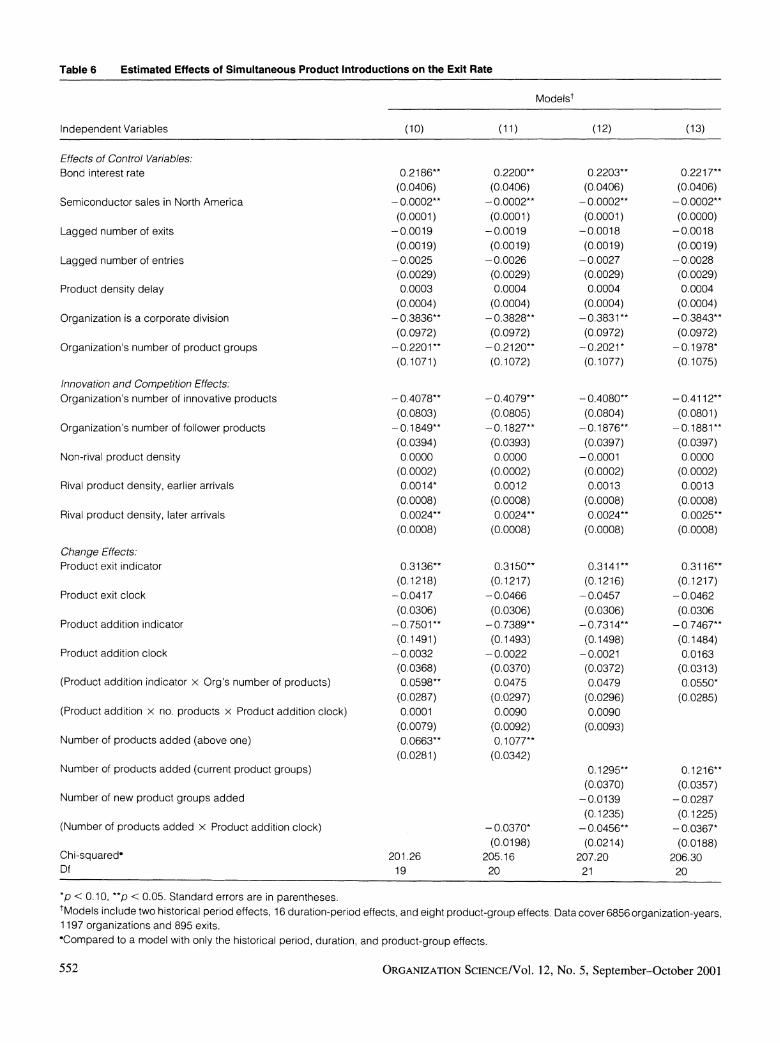
Table 6 Estimated Effects of Simultaneous Product Introductions on the Exit Rate
Modelst
Independent Variables (1 0) (1 1) (12) (13)
Effects of Control Variables: Bond interest rate
Semiconductor sales in North America
Lagged number of exits
Lagged number of entries
Product density delay
Organization is a corporate division
Organization's number of product groups
Innovation and Competition Effects: Organization's number of innovative products
Organization's number of follower products
Non-rival product density
Rival product density, earlier arrivals
Rival product density, later arrivals
Change Effects: Product exit indicator
Product exit clock
Product addition indicator
Product addition clock
(Product addition indicator x Org's number of products)
(Product addition x no. products x Product addition clock)
Number of products added (above one)
Number of products added (current product groups)
Number of new product groups added
(Number of products added x Product addition clock)
Chi-squared" Df
0.21 86** (0.0406) - 0.0002** (0.0001)
- 0.0019 (0. 00 19)
- 0.0025 (0.0029) 0.0003
(0.0004) - 0.3836** (0.0972)
- 0.2201* (0.1071)
- 0.4078** (0.0803) - 0. 1849** (0.0394) 0.0000
(0.0002) 0.0014*
(0.0008) 0.0024**
(0.0008)
0.31 36** (0.1218)
- 0.0417 (0.0306)
- 0.7501 *
(0.1491) - 0.0032 (0.0368) 0.0598**
(0.0287) 0.0001
(0.0079) 0.0663**
(0.0281)
201.26 19
0.2200** (0.0406)
- 0.0002**
(0.0001) - 0.0019 (0. 00 19)
- 0.0026 (0.0029) 0.0004
(0.0004) - 0.3828** (0.0972) - 0.2120** (0.1072)
- 0.4079** (0.0805)
- 0. 1827** (0.0393) 0.0000
(0.0002) 0.0012
(0.0008) 0.0024**
(0.0008)
0.3150** (0.1217)
- 0.0466 (0.0306)
- 0.7389** (0.1493)
- 0.0022 (0.0370) 0.0475
(0.0297) 0.0090
(0.0092) 0. 1077**
(0.0342)
- 0.0370* (0.0198)
205.16 20
0. 2203** (0.0406)
- 0.0002** (0.0001)
- 0.0018 (0. 00 19)
- 0.0027 (0.0029) 0.0004
(0.0004) - 0,3831 **
(0.0972) - 0.2021 *
(0. 1077)
- 0.4080~* (0.0804) - 0. 1876** (0.0397)
- 0.000 1 (0.0002) 0.0013
(0.0008) 0.0024**
(0.0008)
0.3141 *
(0.1216) -0.0457 (0.0306)
- 0.7314** (0. 1498)
- 0.0021 (0.0372) 0.0479
(0.0296) 0.0090
(0.0093)
0. 1295** (0.0370)
- 0.0139 (0.1235)
- 0.0456** (0.0214)
207.20 21
0.221 7* (0.0406)
- 0.0002** (0.0000)
- 0.0018 (0. 00 19)
- 0.0028 (0.0029) 0.0004
(0.0004) - 0.3843**
(0.0972) - 0. 1978W (0. 1075)
- 0.4112** (0.0801) - 0. 1881* (0.0397) 0.0000
(0.0002) 0.0013
(0.0008) 0.0025**
(0.0008)
0.31 16** (0.121 7)
- 0.0462 (0.0306
- 0.7467**
(0. 1484) 0.0163
(0.0313) 0.0550*
(0.0285)
0. 1216** (0.0357)
- 0.0287 (0.1225)
- 0.0367*
(0.01 88) 206.30 20
*p < 0.10, **p < 0.05. Standard errors are in parentheses. tModels include two historical period effects, 16 duration-period effects, and eight product-group effects. 1197 organizations and 895 exits. "Compared to a model with only the historical period, duration, and product-group effects.
Data cover 6856 organization-years,
552 ~~~~~~~~~~~~ORGANIZATION SCIENCE/Vol. 12, No. 5, September-October 2001 552
WILLIAM P. BARNETT AND JOHN FREEMAN Product Proliferation and Organization Failure
Figure 3 Estimated Effects of Simu ductions
3
a 2 2.5
iS 2 0
I-
_ 1 1.5 = 0.5 a
1 2 3 4
Years
Turning now to our other findings timates of models that include the well as measures of product inno market competition. Model 1 inclu control variables, a count of each fir ucts, its number of product groups rival and nonrival products faced t year. These variables reveal a surviP as measured by the number of prodi vival advantage because of di multiple-product groups. Not surpris shows evidence of competition onl: ucts-product offerings that are in th gories in which a firm has a product
Models 2, 3, and 4 make addit Model 1, reflecting the survival coi product strategies. Model 2 lifts a cc allowing rival products to have diffe ing on whether they arrived prior to ( product offering in a given produc which is nested in Model 1, lifts a d allows each firm's size in number differing effects, depending on whet tions or follower products. Recall th these terms distinguish the survival first-mover versus the follower stra lifts both constraints, and improves cantly over both Models 2 and 3 (al ment over Model 3 is only at the 0.]
Model 4 shows a clear first-move innovative product giving a firm at survival advantage as a follower pro( results also show interesting compe ally all significant evidence of comp< the coefficient associated with rival after a given firm's product. We dc evidence of competition in the coe
Itaneous Product Intro- associated with products that arrived earlier than a given firm's product offering in any given product category. (A comparison to the constrained Model 3 suggests that the difference between these competitive effects is significant at the 0.10 level.) These results demonstrate the compet- itive downside to innovation: While being first in a mar- ket gives a first-mover advantage, this is offset by the fact that all rival products are more up-to-date followers. Note also that these findings were obscured in Model 2 and 3, which failed to distinguish both of these effects simulta- neously. This is a familiar pattern, where the main effects
5 6 7 8 of a strategy must be correctly specified to obtain un- biased estimates of the effects of competition and vice versa (Barnett 1990).
The effects of product changes are added to the model s, Table 4 reports es- in Table 5. Model 5 introduces a product change indicator control variables as variable and a product change clock. Following our dis- vation and product- cussion of growth and decline trajectories, Model 6 sepa- ides, along with the rates this overall change effect into two distinct sets of m's number of prod- terms: one set tracking product additions and the other , and the number of tracking product exits. As expected, these two processes )y each firm in each work in opposite directions. Firms adding products were val advantage to size less likely to fail and firms dropping products were more ucts as well as a sur- likely to fail, but the overall change effect in Model 5 versification across confounded these two opposing effects. Like papers that ;ingly, the model also modeled change in terms of product innovation, we found y from "rival" prod- a survival-enhancing effect of product change. This turns ie same product cate- out, however, to be entirely a product-growth effect, sug- t offering. gesting that the apparently beneficial consequences of ional distinctions to change in such models are spurious, reflecting merely that nsequences of firms' times are good for organizations on growth trajectories )nstraint on Model 1, and that times are bad for those that are exiting markets. rent effects, depend- Model 7 then adds tenure- and size-change interactions )r after a given firm's to test for whether older or larger organizations reacted :t market. Model 3, differently to product addition, and Models 8 and 9 se- lifferent constraint. It quentially include each of the interactions to demonstrate of products to have robustness. From these results, we do not find significant ther they are innova- age-change interactions, neither in the immediate change tat the coefficients of effect nor in the clock that begins ticking as of a product I implications of the addition. By contrast, Models 7 and 9 show an immediate itegy. Model 4 then increase in the failure rate among larger organizations. In , statistically signifi- Table 6, this size-change interaction is not robust, but it [though the improve- does remain marginally significant in Model 13 when we 10 level). drop its associated clock (which is never significant in r advantage, with an any specification). bout three times the The coefficients of the control variables also are note- duct. Meanwhile, the worthy. As expected, general economic and market trends .tition effects. Virtu- were important predictors of exit rates. Exits were more etition appears in OtL, likely when interest rates were higher, but were less likely products that arrive when semiconductor sales were strong. We found no sig- not find significant nificant effect for lagged exits and entries. Neither did we
.fficient OtE, the one find significant effects for product density delay, although
ORGANIZATION SCIENCE/Vol. 12, No. 5, September-October 2001 553
WILLIAM P. BARNETT AND JOHN FREEMAN Product Proliferation and Organization Failure
the direction of the effect was positive as predicted. Con- sistent with earlier analyses of these data, organizations that were divisions of larger corporations were less likely to exit the industry.
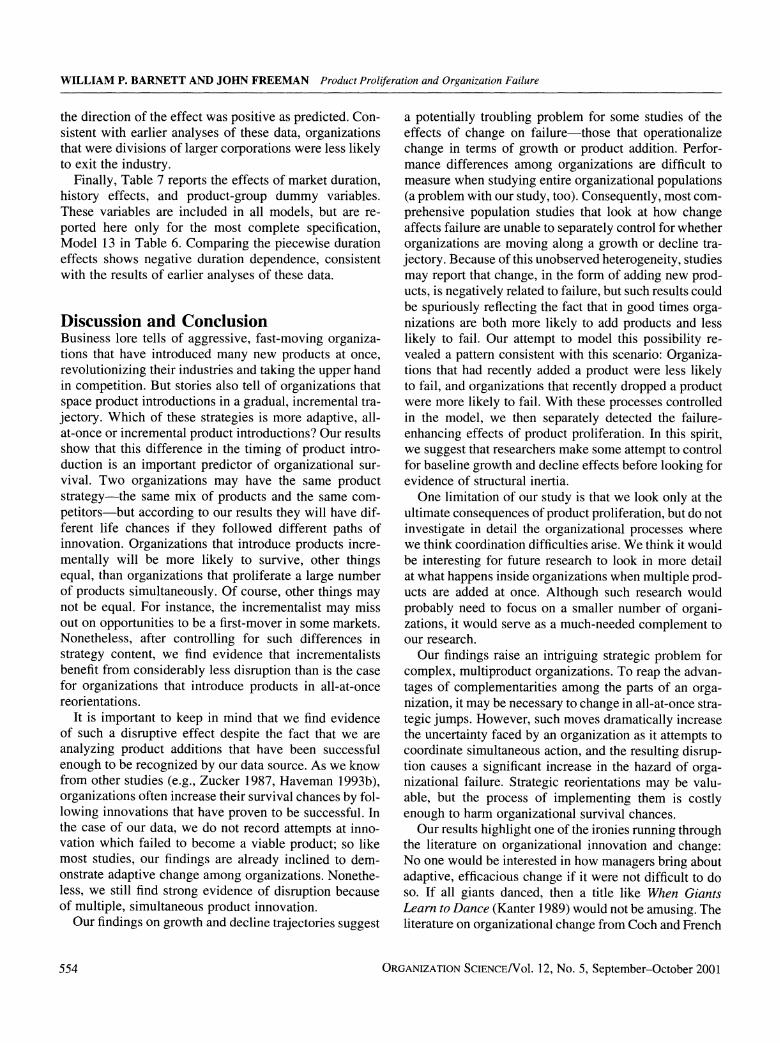
Finally, Table 7 reports the effects of market duration, history effects, and product-group dummy variables. These variables are included in all models, but are re- ported here only for the most complete specification, Model 13 in Table 6. Comparing the piecewise duration effects shows negative duration dependence, consistent with the results of earlier analyses of these data.
Discussion and Conclusion Business lore tells of aggressive, fast-moving organiza- tions that have introduced many new products at once, revolutionizing their industries and taking the upper hand in competition. But stories also tell of organizations that space product introductions in a gradual, incremental tra- jectory. Which of these strategies is more adaptive, all- at-once or incremental product introductions? Our results show that this difference in the timing of product intro- duction is an important predictor of organizational sur- vival. Two organizations may have the same product strategy-the same mix of products and the same com- petitors-but according to our results they will have dif- ferent life chances if they followed different paths of innovation. Organizations that introduce products incre- mentally will be more likely to survive, other things equal, than organizations that proliferate a large number of products simultaneously. Of course, other things may not be equal. For instance, the incrementalist may miss out on opportunities to be a first-mover in some markets. Nonetheless, after controlling for such differences in strategy content, we find evidence that incrementalists benefit from considerably less disruption than is the case for organizations that introduce products in all-at-once reorientations.
It is important to keep in mind that we find evidence of such a disruptive effect despite the fact that we are analyzing product additions that have been successful enough to be recognized by our data source. As we know from other studies (e.g., Zucker 1987, Haveman 1993b), organizations often increase their survival chances by fol- lowing innovations that have proven to be successful. In the case of our data, we do not record attempts at inno- vation which failed to become a viable product; so like most studies, our findings are already inclined to dem- onstrate adaptive change among organizations. Nonethe- less, we still find strong evidence of disruption because of multiple, simultaneous product innovation.
Our findings on growth and decline trajectories suggest
a potentially troubling problem for some studies of the effects of change on failure-those that operationalize change in terms of growth or product addition. Perfor- mance differences among organizations are difficult to measure when studying entire organizational populations (a problem with our study, too). Consequently, most com- prehensive population studies that look at how change affects failure are unable to separately control for whether organizations are moving along a growth or decline tra- jectory. Because of this unobserved heterogeneity, studies may report that change, in the form of adding new prod- ucts, is negatively related to failure, but such results could be spuriously reflecting the fact that in good times orga- nizations are both more likely to add products and less likely to fail. Our attempt to model this possibility re- vealed a pattern consistent with this scenario: Organiza- tions that had recently added a product were less likely to fail, and organizations that recently dropped a product were more likely to fail. With these processes controlled in the model, we then separately detected the failure- enhancing effects of product proliferation. In this spirit, we suggest that researchers make some attempt to control for baseline growth and decline effects before looking for evidence of structural inertia.
One limitation of our study is that we look only at the ultimate consequences of product proliferation, but do not investigate in detail the organizational processes where we think coordination difficulties arise. We think it would be interesting for future research to look in more detail at what happens inside organizations when multiple prod- ucts are added at once. Although such research would probably need to focus on a smaller number of organi- zations, it would serve as a much-needed complement to our research.
Our findings raise an intriguing strategic problem for complex, multiproduct organizations. To reap the advan- tages of complementarities among the parts of an orga- nization, it may be necessary to change in all-at-once stra- tegic jumps. However, such moves dramatically increase the uncertainty faced by an organization as it attempts to coordinate simultaneous action, and the resulting disrup- tion causes a significant increase in the hazard of orga- nizational failure. Strategic reorientations may be valu- able, but the process of implementing them is costly enough to harm organizational survival chances.
Our results highlight one of the ironies running through the literature on organizational innovation and change: No one would be interested in how managers bring about adaptive, efficacious change if it were not difficult to do so. If all giants danced, then a title like When Giants Learn to Dance (Kanter 1989) would not be amusing. The literature on organizational change from Coch and French
ORGANIZATION SCIENCE/Vol. 12, No. 5, September-October 2001 554
WILLIAM P. BARNETT AND JOHN FREEMAN Product Proliferation and Organization Failure
Table 7 History, Duration, and Product-Group Effects on the Exit Ratet (Corresponding to Model 13 in Table 6)
Variables Estimates Variables Estimates
Duration 0-1 year - 1.655** 1960-1969 period -0.1559 (0.2211) (0.2174)
Duration 1-2 years -2.027** 1970-1985 period -0.1130 (0.2369) (0.1423)
Duration 2-3 years - 1.973** Transistors and thyristors 0.2813** (0.2463) (0.1169)
Duration 3-4 years - 2.035** Digital integrated circuits 0.5253** (0.2570) (0.1255)
Duration 4-5 years - 1.888** Analog/linear integrated circuits 0.1449 (0.2671) (0.1654)
Duration 5-6 years -2.138** Signal converting integrated circuits 0.0904 (0.2892) (0.4570)
Duration 6-7 years - 2.088** Custom integrated circuits 0.0002 (0.2978) (0.1967)
Duration 7-8 -1.982** Hybrid circuits 0.2795** (0.3096) (0.1115)
Duration 8-9 years - 1.996** Light-emitting devices -0.1172 (0.3276) (0.1718)
Duration 9-10 years - 2.500** Photo-sensitive devices 0.3622** (0.3876) (0.1527)
Duration 10-11 years -2.511** 0.4008)
Duration 11-12 years -1.916** (0.3656)
Duration 12-13 years - 2.976** (0.5326)
Duration 13-14 years - 2.056** (0.4238)
Duration 14-15 years -2.054** (0.4498)
Duration 15 years and up -2.551** (0.3887)
**p < 0.05. Standard errors are in parentheses. tFor product-group effects, diodes and rectifiers is the left-out category.
(1948) on emphasizes how hard it is for manager to bring about wholesale change and how often they fail when they attempt it. Bums and Stalker (1961) is mainly about how managers fail when they attempt to reorganize from "mechanistic systems" to "organic systems" of produc- tion. Inertia is really just a name for all the things that make such reorganizations difficult. Another way of put- ting this is that if "best practice" can generate flexible organizations, and all organizations employed best prac- tice, there would be nothing to write about. Sadly, most organizations do not employ best practice, which is why such treatments are interesting and useful.
This paper attempts to look in more detail at the com- plexities of competitive outcomes to organizations that
innovate. The irony discussed above becomes even more salient when one realizes that in industries characterized by rapid, erratic change, failure to innovate is potentially life threatening (Jelinek and Schoonhoven 1990). It really is a tough world if the disruptive effects of innovation punish companies for introducing new products while condemning them to obsolescence and ultimate failure if they do not.
How do we get out of this theoretical box? This paper offers some suggestions. First, it is perhaps advantageous to think about the timing, as well as the extensiveness, of change. Few would argue that more fundamental change is more disruptive. So, if Proctor and Gamble decides to pull out of the cleaning product market, redeploying those
ORGANIZATION SCIENCE/Vol. 12, No. 5, September-October 2001 555
WILLIAM P. BARNETT AND JOHN FREEMAN Product Proliferation and Organization Failure
resources to some very different field, such as machine tools, one would expect the disruption to be substantial. Our findings, however, shift attention to the timing of such changes. Managing several important changes si- multaneously threatens to overwhelm a company. The greater the number of such changes occurring at once, the more we multiply the agony.
A second issue concerns the rivals to which a firm gains exposure when it innovates. The good news of such in- novation is that it gives the organization access to re- sources that may not have been available before. The bad news is that those resources are likely to have other claim- ants who now react to the focal organization as a com- petitor. The obvious question is whether those new rivals are proficient or inept. When the product offerings of those competitors are more up to date, exposure to their competition is hazardous and may outweigh the advan- tages resulting from having an additional product to sell.
Another issue raised by this research is the motivation to innovate. Sometimes, companies innovate out of des- peration. Their last dying gasp is to announce a new prod- uct they hope will save them as Hitler hoped his "secret weapons" would save Germany from the Allies. In other situations, companies launch new products one after an- other because the business they are currently in generates the resources to do so. Success breeds innovation. This may be because previous innovations have been success- ful, but this is not necessarily the case. Perhaps the market for existing products expands rapidly. Being in the right place at the right time can sometimes be confused with managerial acumen and the sort of overconfidence that the Midas touch stamps on a manager. So, studies of the strategic effects of innovation would be well advised to consider path dependence and possible spuriousness in the correlation between innovation and success.
To some degree, the ironies that have preoccupied us in this last section of the paper revolve around the scholar's intentions. Is research about rare examples of best practice, or is it about ordinary practice? If most organizations are ordinary-indeed, if this is what we mean by "ordinary"-then theories should explain their existence. This knowledge then supplies the baseline from which to understand the extraordinary.
Acknowledgments The authors would like to thank Jim Baron, Glenn Carroll, Mike Hannan, Thomas Hellmann, Marco Iansiti, Kevin Murdock, Joel Podolny, John Roberts, and Olav Sorenson for their helpful comments. The analysis re- ported here was completed while Barnett was a fellow at the Center for Advanced Study in the Behavioral Sciences. The authors are grateful for financial support provided by the National Science Foundation (SES-85- 10227, to Freeman and Hannan, and SES-9022192, to Barnett), by the Stanford Graduate School of Business, and by the Haas School of Business.
Endnotes 'Peli et al. (1994), in their formalization of Hannan and Freeman's
(1984) structural inertia theory, point out the implicit assumption in the theory that complexity does not facilitate restructuring. 2The multiplier is found by computing exp[6M(NAPj) + YM(NAPjtAP)]
based on the estimates of Model 13, where N is equal to the number of simultaneous product additions (above one).
References Abernathy, W. J., J. M. Utterback. 1978. Patterns of industrial inno-
vation. Tech. Rev. 80(7) 2-9.
Aldrich, Howard E., Ellen R. Auster. 1986. Even dwarfs started small: Liabilities of age and their strategic implications. Staw, Cum-
mings, eds. Research in Organizational Behavior 8 JAI Press, Greenwich, CT. 165-198.
Amburgey, Terry L., Kelly Dawn, Barnett William P. 1993. Resetting the clock: The dynamics of organizational failure. Admin. Sci. Quart. 38(1) 51-73.
Anderson, Phillip, Michael L. Tushman. 1990. Technological discon- tinuities and dominant designs: A cyclical model of technological change. Admin. Sci. Quart. 35(4) 604-633.
Barnett, William P. 1990. The organizational ecology of a technolog- ical system. Admin. Sci. Quart. 35(1) 31-60.
- . 1994. The liability of collective action: Growth and change among early telephone companies. J. A. C. Baum, J. V. Singh, eds. Evolutionary Dynamics of Organizations. Oxford University Press, New York. 337-354.
- , Glenn R. Carroll. 1995. Modeling internal organizational change. Annual Rev. Sociology 21 217-236.
Baron, James N., Brian S. Mittman, Andrew E. Newman. 1991. Targets of opportunity: Organizational and environmental determinants of gender integration within the California civil service, 1979- 1985. Amer. J. Sociology 96(6) 1362-1401.
Barron, David N., Elizabeth West, Michael T. Hannan. 1994. A time to grow and a time to die: Growth and mortality of credit unions in New York, 1914-1990. Amer. J. Sociology 100(2) 381-421.
Baum, Joel A. C., Steven J. Mezias. 1992. Localized competition and
organizational failure in the Manhattan hotel industry, 1898- 1990. Admin. Sci. Quart. 37(4) 580-604. , Christine Oliver. 1991. Institutional linkages and organizational mortality. Admin. Sci. Quart. 36(2) 187-218.
-, Jitendra V. Singh. 1996. Dynamics of organizational responses to competition. Soc. Forces 74(4) 1261-1297.
Blossfeld, H. P., G. Rohwer. 1995. Techniques of Event-History Mod-
eling. Lawrence Erlbaum, Hillsdale, NJ.
Bourgeois, L.J., Kathy M. Eisenhardt. 1988. Strategic decision pro- cesses in high velocity environments: Four cases in the micro-
computer industry. Management Sci. 34(7) 816-835. Brittain, Jack, John Freeman. 1980. Organizational proliferation and
density-dependent selection. John R. Kimberly, Robert H. Miles, eds. The Organizational Life Cycle. Jossey-Bass, San Francisco, CA. 291-338.
Burgelman, Robert A. 1994. Fading memories: A process theory of strategic business exit in dynamic environments. Admin. Sci. Quart. 39(1) 24-56.
Burns, Tom, George M. Stalker. 1961. The Management ofInnovation. Tavistock, London, U.K.
ORGANIZATION SCIENCE/Vol. 12, No. 5, September-October 2001 556
WILLIAM P. BARNETT AND JOHN FREEMAN Product Proliferation and Organization Failure
Camerer, Colin, Roberto Weber. 1998. Sustaining coordination in growing firms: Experimental explorations. Paper presented at the Stanford Strategic Management Conf February 1998.
Carroll, Glenn R. 1984. Dynamics of publisher succession in news- paper organizations. Admin. Sci. Quart. 29(1) 93-113.
- , Jacques Delacroix. 1982. Organizational mortality in the news- paper industries of Argentina and Ireland: An ecological ap- proach. Admin. Sci. Quart. 27(2) 169-198.
- , Michael T. Hannan. 1989. Density delay in the evolution of organizational populations: A model and five empirical tests. Ad- min. Sci. Quart. 34(3) 411-430.
- , Albert C. Teo. 1996. Creative self-destruction among organiza- tions: An empirical study of technical innovation and organiza- tional failure in the American automobile industry, 1885-1981. Indust. Corporate Change 5(2) 619-644.
- , Lyda S. Bigelow, Marc-David Seidel, L. B. Tsai. 1996. The fates of De Novo and De Alio producers in the American automobile industry, 1885-1981. Strategic Management J. 17(s) 117-138.
Coch, L., J. R. P. French, Jr. 1948. Overcoming resistance to change. Human Relations 1(4) 512-532.
Delacroix Jacques, Anand A. Swaminathan. 1991. Cosmetic, specu- lative and adaptive change in the wine industry: A longitudinal study. Admin. Sci. Quart. 36(4) 631-661.
Dobbin, Frank, John R. Sutton, John W. Meyer, W. Richard Scott. 1993. Equal opportunity law and the construction of internal labor markets. Amer. J. Sociology 99(2) 396-427.
Dosi, Giovanni. 1984. Technical Change and Industrial Transforma- tion. Macmillan, London, U.K.
Edelman, Lauren. 1990. Legal environments and organizational gov- ernance: The expansion of due process in the American work- place. Amer. J. Sociology 95(6) 1401-1440.
-. 1992. Legal ambiguity and symbolic structures: Organizational mediation of civil rights law. Amer. J. Sociology 97(6) 1531- 1576.
Fleming, Lee. 1998. Explaining the source and tempo of technological variation: Recombinant learning and exhaustion in technological evolution. Working paper, Stanford University Department of In- dustrial Engineering, Stanford University, Stanford, CA.
Freeman, John, Michael T. Hannan. 1989. Technical innovation, in- ertia, and organizational failure. Working paper, Cornell Univer- sity, New York.
Frost, Peter J., Carolyn P. Egri. 1991. The political process of inno- vation. Staw, Cummings, eds. Research in Organizational Be- havior. 13 JAI Press, Greenwich, CT. 229-295.
Galbraith, John Kenneth. 1967. The New Industrial State. Houghton- Mifflin, Boston, MA.
Greve, Henrich. 1996. Patterns of competition: The diffusion of a mar- ket position in radio broadcasting. Admin. Sci. Quart. 41(1) 29- 60.
Halliday, Terence C., Michael J. Powell, Mark Granfors. 1993. After minimalism: Transformations of state bar associations from mar- ket dependence to state reliance, 1918-1950. Amer. Sociological Rev. 58(4) 515-535.
Hannan Michael T., John Freeman. 1977. The population ecology of organizations. Amer. J. Sociology 82(5) 929-964.
--, ---. 1984. Structural inertia and organizational change. Amer. Sociological Rev. 49 149-164.
-- , . 1989. Organizational Ecology. Harvard University Press, Cambridge, MA.
Hansen, Morten. 1996. Knowledge integration in organizations. Un-
published Ph.D. dissertation, Stanford University Graduate School of Business, Stanford University, CA.
Haveman, Heather. 1992. Between a rock and a hard place: Organi- zational change and performance under conditions of fundamental environmental transformation. Admin. Sci. Quart. 37(1) 48-75. . 1993a. Organizational size and change: Diversification in the savings and loan industry after deregulation. Admin. Sci. Quart. 38(1) 20-50.
-. 1993b. Follow the leader: Mimetic isomorphism and entry into new markets. Admin. Sci. Quart. 38(4) 593-627.
Henderson, Rebecca. 1993. Underinvestment and incompetence as re- sponses to radical innovation: Evidence from the photolitho- graphic alignment equipment industry. RAND J. Econom. 24(2) 248-270.
Henderson, Rebecca, Kim B. Clark. 1990. Architectural innovation: The reconfiguration of existing product technologies and the fail- ure of established firms. Admin. Sci. Quart. 35(1) 9-30.
Huber, George P., Kathleen M. Sutcliffe, C. Chet Miller, William H. Glick. 1993. Understanding and predicting organizational change. George P. Huber, William H. Glick, eds. Organizational Change and Redesign. Oxford University Press, New York. 215-254.
Iansiti, Marco. 1997. Managing technological transitions: Empirical evidence from the semiconductor industry. Working paper, Har- vard Business School, Harvard University, MA.
-, Tarun Khanna. 1995. Technological evolution, system architec- ture and the obsolescence of firm capabilities. Indust. Corporate Change 4(2) 333-361.
Jelinek, Mariann, Claudia B. Schoonhoven. 1990. Innovation Mara- thon: Lessons from High Technology Firms. Blackwell, New Jer-
sey. Kanter, Rosabeth Moss. 1989. When Giants Learn to Dance. Simon
and Schuster, New York. Kelly, Dawn, Terry L. Amburgey. 1991. Organizational inertia and
momentum: A dynamic model of strategic change. Acad. Man- agement J. 34(3) 591-612.
Khanna, Tarun. 1995. Racing behavior: Technological evolution in the high-end computer industry. Res. Policy 24(6) 933-958.
Kimberly, John R. 1976. Organizational size and the structuralist per- spective: A review, critique, and proposal. Admin. Sci. Quart. 21(4) 571-597.
Kreps, David M. 1996. Markets and hierarchies and (mathematical) economic theory. Indust. Corporate Change 5(2) 561-595.
Lieberman, Marvin, David Montgomery. 1988. First-mover advan- tages. Strategic Management J. 9(1) 41-58.
Levinthal, Daniel A., James G. March. 1993. The myopia of learning. Strategic Management J. 14(2) 95-112.
March, James G. 1981. Footnotes on organizational change. Admin. Sci. Quart. 26(4) 563-597. . 1988. Decisions and Organizations. Basil Blackwell, New York. . 1991. Exploration and exploitation in organizational learning. Organ. Sci. 2(1) 71-87.
McPherson, J. Miller. 1983. An ecology of affiliation. Amer. Socio- logical Rev. 48(4) 519-532.
-, L. Smith-Lovin. 1988. A comparative ecology of five nations: Testing a model of competition among voluntary organizations.
ORGANIZATION SCIENCE/Vol. 12, No. 5, September-October 2001 557
WILLIAM P. BARNETT AND JOHN FREEMAN Product Proliferation and Organization Failure
Glenn R. Carroll, ed. Ecological Models of Organizations. Bal-
linger, Cambridge, MA. 85-110. Merton, Robert K. 1936. The unanticipated consequences of purposive
social action. Amer. Sociological Rev., 1(6) 894-904.
Milgrom, Paul, John Roberts. 1990. The economics of manufacturing: Technology, strategy, and organization. Amer. Econom. Rev. 80(3) 511-528.
-. 1995. Continuous adjustment and fundamental change in busi- ness strategy and organization. Horst Siebert, ed. Trends in Busi- ness Organization. J. C. B. Mohr, Tiibingen
Miller, Danny, M. J. Chen. 1994. Sources and consequences of com- petitive inertia: A study of the U.S. airline industry. Admin. Sci. Quart. 39(1) 1-23.
- , Peter H. Friesen. 1984. Organizations: A Quantum View.
Prentice-Hall, Englewood Cliffs, NJ. Miner, Anne S., Terry L. Amburgey, Tim M. Steams. 1990. Interor-
ganizational linkages and population dynamics: Buffering and transformational shields. Admin. Sci. Quart. 35(4) 689-713.
Mitchell, Will. 1989. Whether and when: Probability and timing of incumbents' entry into emerging industrial subfields. Admin. Sci. Quart. 34(2) 208-230.
Nelson, Richard R., Sidney G. Winter. 1982. An Evolutionary Theory of Economic Change. Harvard, Cambridge, MA.
Peli G., M. Masuch, J. Bruggeman, B. O. Nuallain. 1994. A logical approach to formalizing organizational ecology. Amer. Socio- logical Rev. 59(4) 571-593.
Podolny, Joel M., Toby E. Stuart, Michael T. Hannan. 1996. Networks, knowledge, and niches: Competition in the worldwide semicon- ductor industry, 1984-1991. Amer. J. Sociology 102(3) 659-689.
Rohwer, G. 1993. TDA (Transitional Data Analysis). European Uni-
versity Institute, Florence, Italy. Romanelli, Elaine, Michael L. Tushman. 1994. Organizational trans-
formation as punctuated equilibrium: An empirical test. Acad. Management J. 37(5) 1141-1166.
Rosenbloom, Richard S., Clayton M. Christensen. 1994. Technological discontinuities, organizational capabilities, and strategic commit- ments. Indust. Corporate Change 3(3) 655-685.
Schumpeter, Joseph A. 1934. The Theory of Economic Development. Harvard University, Cambridge, MA.
Accepted by Claudia Bird Schoonhoven.
Singh, Jitendra V., Robert J. House, David J. Tucker. 1986. Organi- zational change and organizational mortality. Admin. Sci. Quart. 31(4) 587-611.
- , David J. Tucker, A. G. Meinhard. 1991. Institutional change and ecological dynamics. Woody W. Powell, Paul J. DiMaggio, eds. The New Institutionalism in Organizational Analysis. University of Chicago Press, Chicago, IL.
Sorenson, Olav. 1997. The complexity catastrophe: Interdependence and adaptability in organizational evolution. Unpublished manu- script, Stanford University Department of Sociology, Stanford University, CA.
Stinchcombe, Arthur L. 1965. Social structure and organizations. James G. March, ed. Handbook of Organizations. Rand McNally, Chicago, IL.
Stuart, Toby E., Joel M. Podolny. 1996. Local search and the evolution of technological capabilities. Strategic Management J. 17 21-38.
Sutton, John R., Frank Dobbin, John W. Meyer, W. Richard Scott. 1994. The legalization of the workplace. Amer. J. Sociology 99(4) 941-971.
Teece, David J., Gary Pisano. 1994. The dynamic capabilities of firms: An introduction. Indust. Corporate Change 3(3) 537-556.
Tuma, Nancy Brandon, Michael T. Hannan. 1984. Social Dynamics. Academic Press, Orlando, FL.
Tushman, Michael L., Philip Anderson. 1986. Technological discon- tinuities and organizational environments. Admin. Sci. Quart. 31(3) 439-465. , Elaine Romanelli. 1985. Organizational evolution: A metamor- phosis model of convergence and reorientation. Lawrence L. Cummings, Barry M. Staw, eds. Research in Organizational Be- havior. 7 JAI Press, Greenwich, CT. 171-222.
-, Charles A. O'Reilly. 1997. Winning Through Innovation: A Practical Guide to Leading Organizational Change and Renewal. Harvard Business School Press, Cambridge, MA.
Williamson, Oliver E. 1975. Markets and Hierarchies: Analysis and Antitrust Implications. Free Press, New York.
Zajac, Edward J., Steven M. Shortell. 1989. Changing generic strate- gies: Likelihood, direction, and performance implications. Stra- tegic Management J. 10(4) 413-430.
Zucker, Lynn G. 1987. Normal change or risky business: Institutional effects on the "hazard" of change in hospital organizations, 1959- 1979. J. Management Stud., 24(6) 671-700.
ORGANIZATION SCIENCE/Vol. 12, No. 5, September-October 2001 558