Embed Size (px)
Citation preview

1
Product Proliferation Strategies and Firm Performance in a
Complex Product Space
ABSTRACT
In the Spanish automobile market between 1990 and 2000, significant reductions in tariff and nontariff
protection increased the complexity of the product space, through the penetration of new car brands and
models. Acknowledging these environmental dynamics, this study details conditions in which across-
niche (intra-industry diversification) and within-niche (product versioning) product proliferation exerts a
positive impact on firm performance, as well as how key relationships change according to the
complexity of the product space.
JEL codes: M10, M30
Keywords: Product proliferation, Firm performance, Automotive industry

2
1. Introduction
When firms market variations of their products, they may be able to build a competitive
advantage based on differentiation (Kotha 1995; Li and Greenwood 2004). Yet years of empirical
research still have not resolved just how product proliferation affects firm performance: Some scholars
indicate a null or negative relationship (Bayus and Putsis 1999; Kekre and Srinivasan 1990), whereas
others insist on a positive link (Bayus and Agarwal 2007; Sorenson 2000). To resolve the puzzle, recent
research considers two new viewpoints.
First, product proliferation encompasses two types (Dowell 2006; Ramdas 2003; Sorenson 2000):
across-niche and within-niche. Across-niche product proliferation (or intra-industry diversification or
variegation) arises when a firm sells products to different submarket niches simultaneously, whereas
within-niche product proliferation (or product versioning) implies augmenting the quantity of different
variants to sell in one submarket niche.1 Because firms can perform these two strategies independently
(i.e., they might not be correlated), perhaps divergent results in extant research occur when scholars do
not treat them separately.
Second, most prior research is focused on supply-side factors, such as differences in firm
resources (Dyer 1996), vertical integration (Kotabe, Martin, and Domoto 2003; Novak and Stern 2008),
or lean manufacturing (Lieberman and Dhawan 2005). Yet other explanations could be just as important
for explaining variance in the relationship between product proliferation and performance. For example,
Ramdas and Sawhney (2001) show that component sharing drives product proliferation but also
influences performance because it affects how customers evaluate variety. Hui (2004) cites the need to
consider customers who treat different products of the same brand as close substitutes, which would
generate cannibalization effects within the firm’s portfolio. Siggelkow (2003) also suggests that the link
1 A submarket consists of a group of products with homogenous characteristics that satisfy homogenous needs (Klepper and Thompson, 2006; Sutton, 1998).

3
between product proliferation and performance depends on how customers add options to their
consideration set; if firms engage in across-niche product proliferation, the likelihood that customers at
least consider their products increases. This line of research thus evokes the importance of assessing the
link between product proliferation strategies and performance through a customer behavior lens.
We consider both views. Assuming the well-established importance of resources and cost
differences, we aim to study other contingencies that cause across- or within-niche product proliferation
to improve performance. By answering this research question, we offer guidelines for adapting product
proliferation strategies to the amount of heterogeneity in product attributes in an industry, a measure also
known as the complexity of the product space. In so doing, we mirror the approach raised by Ron Shaich,
executive CEO of Panera Bread, a leader in the quick-casual restaurant business: “Rather than
succumbing to product proliferation … think about how to best use your menu to drive competitive
advantage” (Nation’s Restaurant News 2010). Complex product spaces have become the norm; for
example, Britain’s Tesco grocery chain stocks 91 different shampoos, 93 varieties of toothpaste, and 115
household cleaners (The Economist 2010). Accordingly, we argue that complex product spaces are
associated with rules consumers use to simplify their decisions, which then affect the relationship
between performance and product proliferation strategies.
To test this argument, we draw on data from the automobile industry. This market offers
significant heterogeneity across firms’ product proliferation strategies, as well as many competing brands,
each of which markets multiple product models with different features. Therefore, each firm competes
with a heterogeneous portfolio of products, often sold to different submarkets. In particular, we focus on
the Spanish automobile market between 1990 and 2000, in which setting we can exploit the presence of
external conditions that perturb product space complexity. Since the end of the 1980s, the Spanish
automobile industry has been subject to a gradual but significant reduction in tariff and non-tariff
protections, due to Spain’s integration into the European Union. The number of car models offered by
non-European foreign producers thus increased fivefold during the 1990s, which implies a notable shift
4
that is independent from the actions of the incumbents. To address firm heterogeneity, we control
dynamically for firm size and advertising expenditures, as well as statically for firm and time-fixed
effects.
We find a parabolic shape between performance and across-niche product proliferation. In
contrast, we uncover a positive relationship between performance and within-niche product proliferation
for specialized firms that do not pursue across-niche product proliferation simultaneously. With a
consistency analysis, we offer evidence that the complexity of the product space moderates across-niche
product proliferation, but it does not affect within-niche product proliferation.
Our study thus contributes to research into the performance impact of a firm’s product variety
(Ramdas 2003), particularly because it analyzes across- and within-niche product proliferation in the
same research context. By going beyond product variety implementation (Bayus and Agarwal 2007;
Chong, Ho, and Tang 1998; Putsis and Bayus 2001), this research shows that the shape of the link
between product proliferation strategies and performance depends on more than resources and cost
determinants.2 We also highlight the complexity of industry product space as an important moderator.
Empirically, we complement performance research focused on survival (Dowell 2006; Sorenson 2000) or
accounting (Kekre and Srinivasan 1990) by revealing that two measures of performance—the number of
products sold by firms in the market and this number multiplied by product margins estimated by a
supply–demand structural model (Kadiyali, Vilcassim, and Chintagunta 1998)—convey similar results.
2. Theoretical development
2.1 Product proliferation strategies
Product proliferation is a pivotal strategic choice for a firm (Ramdas 2003; Sorenson 2000), with both
benefits and costs. Greater product proliferation might enable the firm to capture more customers (Fosfuri
2 In this sense, we test the link between performance and product proliferation, while controlling but also being agnostic about the resources that drive product strategies, which we treat as given (Hui 2004; Siggelkow 2003)
5
and Giarratana 2007), charge higher prices for customized versions (Bayus and Putsis 1999; Kekre and
Srinivasan 1990), raise entry barriers by saturating product niches (Lancaster 1990), or exploit economies
of scale and scope (Gimeno and Woo 1999). Yet it also can induce backlash, including product
cannibalization (Hui 2004) or cost increases (Anderson 1995; MacDuffie, Sethuraman, and Fisher 1996).
These contrasting forces lead to conflicting empirical results regarding the link between product
proliferation and performance. Kekre and Srinivasan (1990) find that product proliferation does not lead
to higher returns on investments across a sample of large firms in different industries; in the personal
computer industry specifically, Bayus and Putsis (1999) show that the net market share impact of product
proliferation is negative. When they focus on firm survival in the same computer industry, Sorenson
(2000) and Bayus and Agarwal (2007) indicate that firms with higher across-niche product proliferation
initially can exploit their competitive advantage but not in later stages, when specialized firms benefit.
Siggelkow (2003) instead provides evidence from the mutual fund industry that product proliferation
enhances performance.
Recent works have used two tactics to try to resolve this conflict. First, some studies try to
complement a canonical resource and cost approach. Kekre and Srinivasan (1990) and Bayus and Putsis
(1999) recognize that manufacturing trends to cut costs and increase production flexibility are vastly
diffused; recent globalization trends that make markets more international and dynamic also have forced
companies to improve their logistics and manufacturing processes (Chase, Jacobs, and Aquilano 2005).
Thus product proliferation strategy profitability might depend on other mechanisms, such as those
associated with demand or customer behavior (Hui 2004; Ramdas and Sawhney 2001; Siggelkow 2003).
Second, a finer grained classification of product proliferation strategies might be insightful, to
distinguish across-niche from within-niche efforts (Ramdas 2003). In across-niche product proliferation,
the firm simultaneously sells products to different submarkets, whereas with within-niche product
proliferation, it augments the quantity of the different variants that it sells to one submarket. Firms could
6
choose to perform the two product strategies independently; i.e. they might not correlate, Ulrich, Randall,
Fisher, and Reibstein (1998) and Sorenson (2000) investigate within-niche product proliferation, whereas
Chong et al. (1998), Siggelkow (2003), and Draganska and Jain (2005) study only the across-niche
version. Still other works (e.g., Dowell 2006) try to assess their combined effects on firm survival and
find generally positive effects of the two strategies in specific environmental conditions.
We similarly acknowledge the distinction between across- and within-niche product proliferation
to explain their impact on firm profitability. We aim to isolate the direct link between product strategies
and performance, beyond differences in resources and costs. Our approach thus focuses on a firm’s ability
to adapt its product portfolio to the dynamics of overall product space complexity in an industry.
2.2 Product space complexity
As a well-diffused phenomenon (The Economist 2010), a complex product space indicates
heterogeneity in the product attributes marketed in a particular industry (Lenk, DeSarbo, Green, and
Young 1996). The level of complexity of the product space directly influences customers’ buying process.
Search (Beatty and Smith 1987), evaluation (Alba and Hutchinson 1987; Shugan 1980), and opportunity
(Schmalensee 1982) costs confront customers during their purchase decision processes. These costs tend
to be significant in contexts characterized by many available alternatives and product attribute
heterogeneity (Chakavarti and Janiszewski 2003; Johnson and Payne 1985; Keller and Staelin 1987;
Lussier and Olshavsky 1979; Payne 1976). Behavioral theories therefore suggest that people adopt simple
decision rules to minimize their search costs and cognitive effort (Knudsen and Levinthal 2007; Simon
1955).
Consumer behavior literature (Hauser and Wernerfelt 1990) further argues that customers apply
relatively simple rules to screen and map alternatives, especially in complex product spaces (Hauser,
Toubia, Evgeniou, Rene, and Dzyabura 2010; Roberts and Lattin 1991). They simplify their decision
making by using decision rules, anchored on a few or even single product attributes (Bettman 1979;
7
Gensch 1987; Johnson and Payne 1985; Shocker, Ben-Akiva, Boccara, and Nedungadi 1991; Wright and
Barbour 1977). Some customers screen for brand names; others eliminate alternatives that do not meet a
predetermined price cut-off (Hauser et al. 2010). In laboratory experiments, Iyengar and Lepper (2000)
show that customers change their decisions when they view different versions of the same product,
because they have altered their decision rules.
Several tangible product characteristics and brands offer common attributes that customers use as
anchors to simplify their purchasing decisions (Gilbride and Alleby 2005; Hauser et al. 2010; Lapersonne,
Laurent, and Le Goff 1995; Terech, Bucklin, and Morrison 2009; Urban, Kim, MacDonald, Hauser, and
Dzyabura 2010). To generalize our theory across industries, instead to referring to a particular product
characteristic, we introduce the concept of a submarket niche, which we define as a collection of products
with homogenous tangible characteristics (Klepper and Thompson 2006; Sutton 1998). Selecting by
submarket niches thus implies that the customer selects according to homogenous product characteristics.
We anticipate two main types of purchasing rules, which define two sets of customers: brand
loyalists and submarket niche loyalists. The first type chooses a brand to which they show fidelity or
attraction (e.g., Toyota, Honda, Ford, GM, VW); the second focuses on a particular range of product
characteristics that determines their preferred submarket niche (e.g., compact car, minivan, sports car).
All else being equal, behavioral and marketing theories suggest that higher levels of complexity in the
product space should increase the number of customers who anchor their decisions on either brands or
submarket niches.
When a firm engages in across-niche product proliferation, it should capture more value,
especially from brand loyalists, because it obtains the positive effects of one-stop shopping. One-stop
shopping advantages emerge when a vast array of products offered under the same umbrella brand
increase customers’ utility. For such brand loyalists, across-niche product proliferation not only
minimizes search costs (i.e., customers just look for the brand to find what they want) but also meets their
8
needs better (Sappington and Wernerfelt 1985). These effects then might increase consumption frequency
and willingness to pay.
However, across-niche product proliferation likely weakens the link with submarket loyalists,
who require the brand to be linked closely to the focal submarket for it to gain access to their
consideration set (Anderson and Spellman 1995; Osgood 1948; Posavac, Sanbonmatsu, Cronley, and
Kardes 2001; Posavac, Sanbonmatsu, and Fazio 1997). Because a submarket follower’s choice of a
particular brand depends on how strongly he or she associates that brand with the product submarket
(Punj and Moon 2002; Urban, Hulland, and Weinberg 1993), firms with strong links to a specific
submarket usually gain a superior image and reputation among these consumers. For example, Porsche
likely appears in the consideration set of sports car buyers, because Porsche primarily offers sport cars.
The association of a brand with a submarket niche in turn depends on the concentration of the brand’s
product offer (Meyvis and Janiszewski 2004). Increasing across-niche product proliferation (i.e.,
increasing brand presence across different submarkets) instead disrupts this brand–submarket association
and might lead to a loss of submarket loyalists. The stronger the brand’s initial submarket association, the
more it relies on submarket loyalists, and the greater its loss will be if it undertakes across-niche product
proliferation (Keller and Aaker 1992; Loken and John 1993). We thus predict a positive link between
across-niche product proliferation and performance for firms that are not overly specialized, that is, those
with at least a minimum threshold level of across-niche product proliferation.3 In turn, we expect that
other things being equal, the relationship between across-niche product proliferation and firm
performance displays a parabolic shape.
In contrast, within-niche product proliferation should not affect brand loyalists significantly.
However, this type of proliferation should enhance performance, because firms, by continuously refining
their products within their niche, develop versions that work better and exactly match the needs of
submarket loyalists. In addition to focusing primarily on product characteristics that are salient to a niche,
3 The level of this threshold depends on the importance of brand versus submarket loyalists for a particular market.
9
submarket loyalists tend to demand that firms respond to their needs and feedback (Schmalensee 2000;
Von Hippel 1986). According to Shapiro and Varian (1998), within-niche product proliferation signals a
responsive market orientation, because the firm adapts its product offering to the preference heterogeneity
of customers within a particular submarket niche.
However, within-niche product proliferation should not increase performance when it appears
together with greater across-niche product proliferation. That is, more within-niche product proliferation
implies equal or lower across-niche product proliferation if the additional versions appear in the main
submarket niche, but it indicates higher across-niche product proliferation if the new versions appeal to
marginal or new niches. In this latter case, the firm loses its valuable initial brand–submarket association;
the strength of the negative effects of this development depends on the strength of the initial association.
The more specialized the firm is, the more it stands to lose if it combines within- and across-niche product
proliferation.
Thus, all else being equal, we predict a positive relationship between within-niche product
proliferation and performance for firms that are relatively specialized (below a threshold minimum level
of across-niche product proliferation) and that do not perform this strategy jointly with across-niche
product proliferation.
3. Empirical analysis
3.1 Empirical setting
The automobile industry is characterized by many competing brands and multiple product models
that appeal to different market niches. Therefore, this industry is appropriate for studying and
disentangling the effects of product proliferation on performance. Within the industry, our empirical
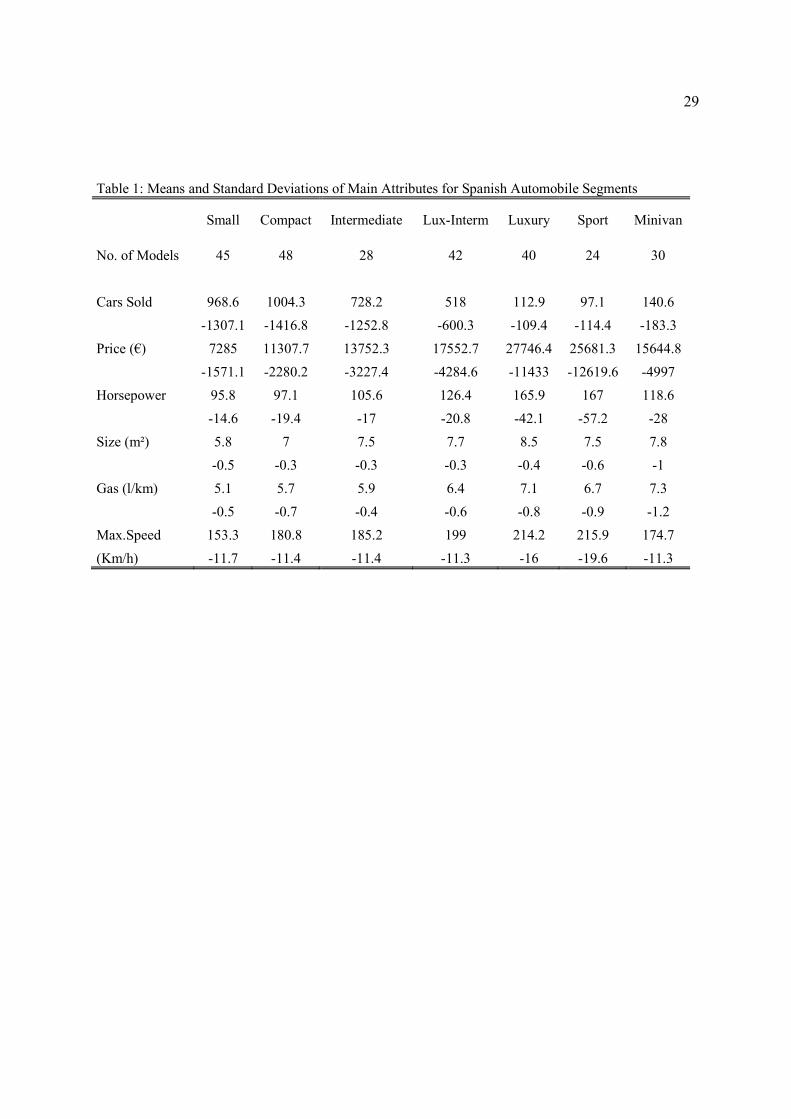
analysis focuses on the Spanish automobile market between 1990 and 2000, which contained seven major
submarkets: small, compact, intermediate, luxury intermediate, luxury, sport, and minivan. Each model

10
can be classified according to its mechanical, design, and equipment characteristics, such that all models
in a submarket have homogenous characteristics, as we detail in Table 1.
------------------------------------
Insert Table 1 about here
-----------------------------------
Furthermore, and specific to the Spanish automobile market, a gradual but significant reduction of tariff
and nontariff protections began after Spain joined the European Union in the late 1980s. In 1987, these
tariffs reached 34.3% for non-European producers, but by 1993, they had fallen to 10%.
The tariff reductions led to a fivefold increase in the number of models offered by non-European
foreign producers in Spain during the 1990s, from 14 models in 1990 to almost 60 in 2000. This
proliferation also sparked the arrival of 6 new brands, such that customers who once searched among 97
car models in 1990 could consider 169 models in 2000. Furthermore, the 169 models represented only
some of the real dynamics of the industry, because we excluded 98 culled models and noted the entry of
180 new ones.
This market thus reveals important heterogeneity over time in terms of the complexity of the
product space, so it offers a good setting for identifying the relationship between product proliferation and
performance. We also must isolate a sample of firms for which this dynamic is exogenous; we select
European incumbents before the tariff reduction, that is, all European automobile brands present in Spain
before 1990. With this approach, we are confident that the relationship between performance and product
proliferation strategies results from environmental conditions over which the sample firms had no control.
Because these firms are multinational corporations that make product proliferation decisions at a global
level, product strategies can be also considered fairly independent of the dynamics of the Spanish market.
11
We employ quarterly panel data from 1990–2000 (33 quarters), with car brand as the unit of
analysis.4 These data come from ANFAC (Asociación Nacional de Fabricantes de Automóviles y
Camiones) and Guía del comprador de coches, a Spanish magazine. The data cover all 31 brands sold in
the Spanish automobile market during the sample period, including 19 incumbents with 621 brand/time
observations, as well as 7 brands that entered and 2 that exited the Spanish automobile industry during the
observation period. The gathered information about each brand includes size and advertising
expenditures, as well as the price, sales, submarkets, and characteristics of its offered models. Our sample
firms represent approximately 60% of all brands in the Spanish automobile industry.5
3.3 Dependent Variable
Various performance measures might reflect the impact of product proliferation (e.g., firm
survival, Bayus and Agarwal 2007; Dobrev et al. 2002; Dowell 2006; Fosfuri and Giarratana 2007;
Sorenson 2000; return on investments, Kekre and Srinivasan 1990; market shares, Bayus and Putsis 1999;
Putsis and Bayus 2001; Chong et al. 1997). We thus consider two dependent variables, the first of which
is very intuitive: units sold by the firm in each time period (Cars sold = ∑rЄFit qrt). However, our
theoretical predictions might be explained by variations in demand (q) or margins (p – mc), and the
number of cars sold measure cannot assess different markups, which would constitute a significant
omission if there is nontrivial heterogeneity across products. Thus we use a second dependent variable to
account explicitly for markups (Draganska and Jain 2005; Hui 2004; Siggelkow 2003). In this decision,
we follow Kadiyali, Vilcassim, and Chintagunta (1998), who use a supply–demand structural model to
estimate firm margins. With a system of simultaneous equations, we can derive for each brand the
equilibrium profit-maximizing price, after specifying all demand functions. This dependent variable has
4 We extend the panel with advertising data provided by Infoadex, a Spanish firm that computes expenditures by monitoring communication markets, and data on total firm assets, provided by Bureau van Dijk’s OSIRIS. 5 The sample brands are Citroen, Peugeot, Ford Europe, Opel, Renault, Seat, Volkswagen, Audi, Alfa-Romeo, BMW, Fiat, Jaguar, Lancia, Porsche, Rover, Saab, Skoda, Volvo, and Yugo. The non-incumbent brands are Honda, Mazda, Hyundai, Nissan, Toyota, Mitsubishi, Suzuki, Subaru, KIA, Galloper, Daewoo, and Chrysler.

12
the additional advantage of not leaving in the background consumer behavior because it embeds a model
in which consumer utility is directly taken into account and estimated (Hui 2004).
Specifically, we model the demand function of different car models using a random coefficient
logit model (Berry 1994; Berry, Levinsohn, and Pakes 1995; McFadden 1974; Nevo 2000), and we derive
the first-order price condition for each product, assuming optimal multiproduct firm decisions in an
oligopolistic market (i.e., firms make choices to maximize profits). To estimate the equations
simultaneously, we use a generalized method of moments and control for possible heterogeneity in firm
resources, which might lead to different firm cost structures, cost variations according to product
attributes, or potential economies of scale associated with the number of models produced (see the
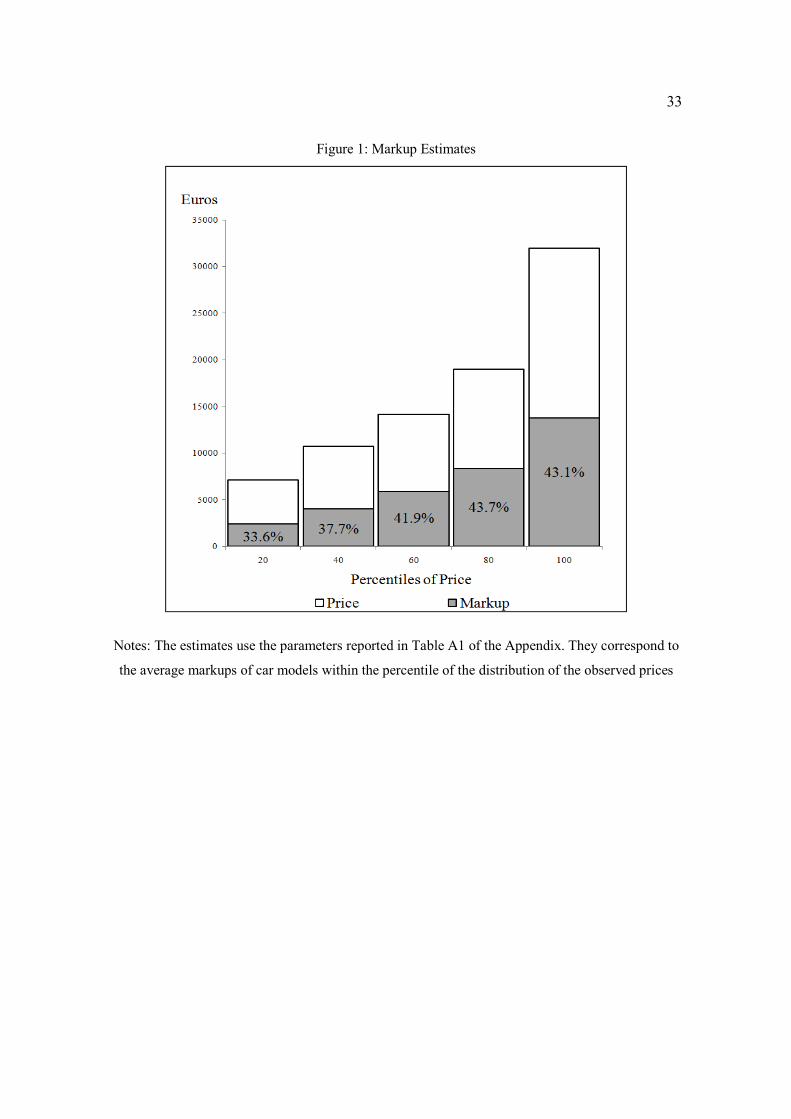
Appendix). Figure 1 contains the observed prices and estimated margins for the different car models.
------------------------------------
Insert Figure 1 about here
-----------------------------------
Similar structural models appear in previous studies of the automobile market (Berry, Levinsohn,
and Pakes 1999; Goldberg 1995; Verboven 1996). The margins and demand–price elasticities are in line
with prior research, with a mean elasticity of approximately 3 and an inverse relationship between
margins and elasticities (i.e., higher price – cost margins for models with less demand–price elasticity).
Therefore, we define the Performance dependent variable as the product of the margins multiplied by the
number of model units sold at time t for each brand i. Performance reflects the firm’s ability to charge
higher prices and increase its market shares, while also controlling for the underlying cost structure:
Performanceit=∑rЄFit (prt-mcrt) qrt,
where Fit is the set of products offered by firm i at period t, and prt, mcrt, and qrt are the price, marginal
cost, and units sold of product r during period t.
13
By comparing the differences or similarities of the regressions when we use Performance versus
Cars sold as dependent variables, we also determine whether our hypotheses mainly reflect a quantity
demand effect (Cars sold) or product margin effects, given the quantity sold (Performance). The basic
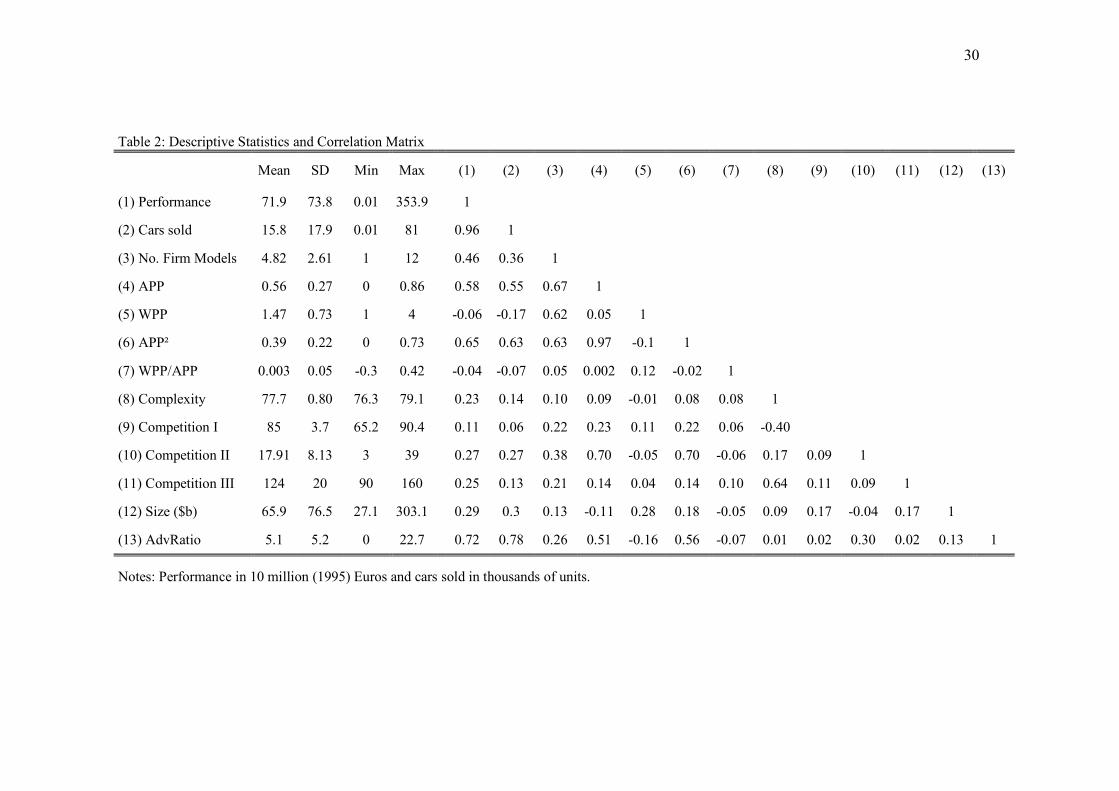
statistics for the two dependent variables show a high correlation, which suggests a strong relationship
between market shares and margins but also reflects the aggregation of complex portfolios of products
characterized by different margins.
------------------------------------
Insert Table 2 about here
-----------------------------------
3.4 Variables of theoretical interest: Across- and within-niche product proliferation
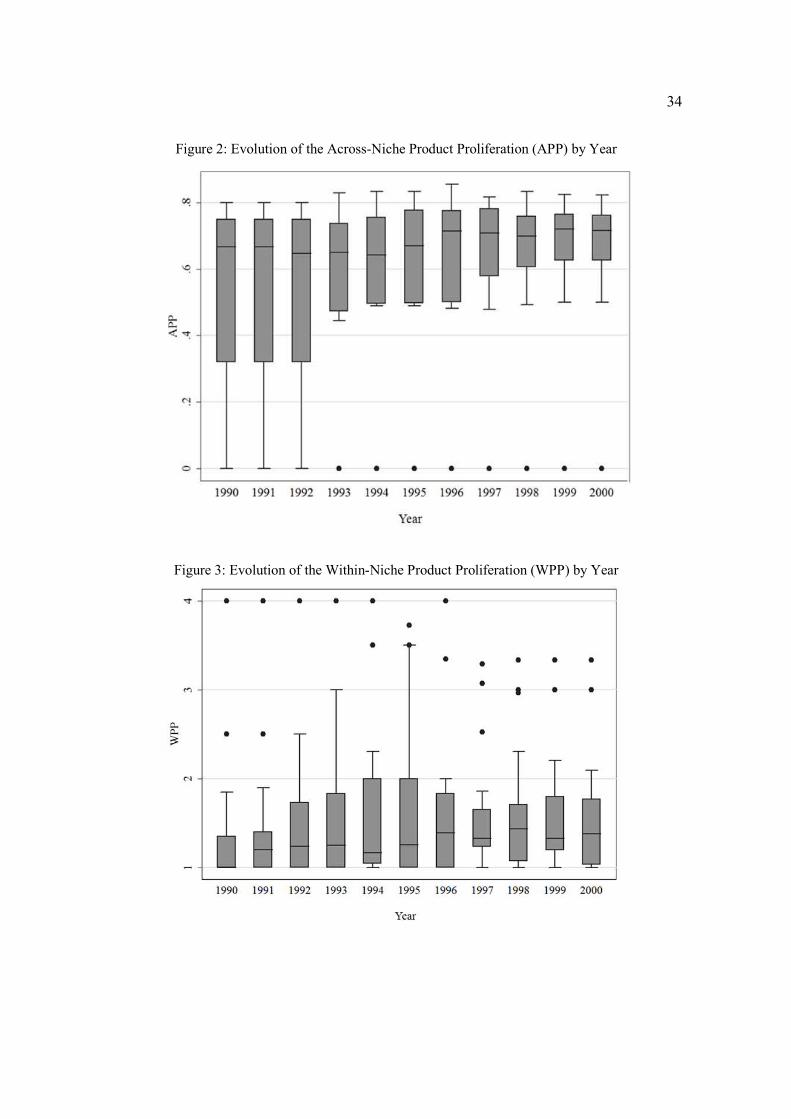
To measure across-niche product proliferation (APP), we use the Berry index of dispersion. For
firm i at time t, it is defined as
APPit= 1 - ∑s (Nist/Nit)2,
where Nist is the number of products offered by firm i in niche s at time t. The Berry index varies
theoretically from 1 (maximum APP) to 0 (firm sells in only one niche); it offers a precise, standard
measure of dispersion (see Fosfuri and Giarratana 2007). In turn, to calculate within-niche proliferation
(WPP), we count the average number of products a firm offers in the niches in which it operates, such that
WPP for firm i at time t is
WPPit=∑s Φist (Nist/Nit),
where Φist is a dummy variable equal to 1 if firm i offers some product in niche s at time t, and 0
otherwise. Previous literature calculates WPP as the number of products introduced by the firm in the
most important niche or the total stock of products in the portfolio (Dowell 2006). For our study, we
prefer a variable that captures WPP for all submarkets. However, calculating the total number of products
14
would confound the APP and WPP effects, because it would correlate with the number of submarkets in
which the firm operates. Therefore, our measure of WPP instead captures within-niche product
proliferation in each firm submarket, which ensures appropriate exogeneity compared with a proxy for
across-niche product proliferation.
With Figures 2 and 3, we depict the evolution of both variables during the sample period and
highlight important heterogeneity across firms and time. The basic statistics for both variables appear in
Table 2. Their low correlation (0.05) confirms that our variables capture two different product strategies.
--------------------------------------------
Insert Figure 2 and 3 about here
-------------------------------------------
We construct additional variables to determine the conditions in with APP and WPP lead to better
performance. Specifically, because we predict a parabolic effect for APP, we introduce a square term
(APP2). We also identify a twofold condition for a positive relationship between WPP and firm
performance, and to address these conditions empirically, we introduce a new covariate, WPP/APP, that
comprises two factors: (1) a component that captures the initial level of across-niche product proliferation
and empirically should correlate positively with within-niche product proliferation, such that it provides a
specialization, not a diversification, index (i.e., Herfindhal, not Berry, index), and (2) a factor to capture
whether the level of across-niche product proliferation increases with within-niche product proliferation.
Therefore,
WPP/APPit =WPP*× (1 - APPit) × DummyAPPit,
where DummyAPPit equals 1 if the across-niche product proliferation has increased from the previous
period, and 0 otherwise, and WPP* is the rate of growth of the within-niche product proliferation, starting
15
from the initial period of the sample.6 Thus, APP and WPP test the direct effects of the hypotheses; APP2
and WPP/APP test the conditions in which the hypotheses can be verified.
3.5 Environmental and control variables
We must rule out every possible effect on performance that can be attributed to competition. We
thus jointly consider three measures of competition: Competition I, Competition II, and Competition III.
Competition I is the weighted average of the Berry indexes calculated using the market shares in the
different niches in which the firm competes. These weights represent the proportion of the firm’s total
revenue earned in each niche. Therefore, it varies by time and firm and captures not only the niches in
which the firm competes but also how important each niche is for the firm and the level of competition in
each niche. The Berry indices are multiplied by 100 for scaling. Competition II is equal to the number of
(European and non-European) firms that specialize in the same niches as a focal firm i. Thus, it measures
the closest competition that firm i faces. Santalò and Becerra (2008) highlight the importance of
introducing this measure when specialized firms compete against more diversified ones. A firm i is
considered specialized in a niche j if the weight of the niche j in the firm’s product portfolio (i.e., number
of models) is greater than the observed weight of the niche j in the industry. That is, firm i is specialized
in niche j at time t if (Nijt/Nit) > (Njt/Nt). Finally, we include the number of car models sold in the market
(Competition III) to proxy for the density of the product offer at any time t. As Table 2 shows, these
variables are not highly correlated and capture different aspects of rivalry.
We also introduce firm- and market-level controls. Quarterly and annual dummies control for
seasonal components and common market shocks, such as variations in market demand or industry
production costs. We control for firm-fixed effects using brand dummies, which capture relevant factors
6 To pose a stricter test, over time the identification of WPP/APP should be proven by the variation of the within-niche product proliferation over time for a firm, not by cross-sectional variation among firms. We therefore multiply WPP/APP by the firm growth rate associated with within-niche product proliferation (time-variant condition). We use the rate of growth of within-niche product proliferation, starting from the initial period of the sample, to capture the dynamic effect generated by the sample initial conditions (King and Tucci 2002; Tripsas 1997).
16
that determine firm performance and explain heterogeneity across firms, such as the vertical integration
level (Dowell 2006; Kotabe et al. 2003; Novak and Stern 2008), firm reputation (Rao 1994), or resource
specificity (Dyer, 1996).
In addition, we include time-specific firm controls. Size equals total assets (obtained from Bureau
van Dijk’s OSIRIS), and Advertising refers to the percentage of the firm’s advertising expenditures,
standardized by the industry total. With this ratio, we capture firm heterogeneity in advertising
investments and isolate the effect of common variations in advertising expenditures driven by industry
trends. We employ ordinary least squares for these assessments.
4. Results
4.1 Main results
Table 2 contains the descriptive statistics and correlation coefficients for all variables in the
regression, as well as the number of models offered by each firm (Dowell 2006), which correlates closely
with both across- and within-niche product proliferation (0.67 and 0.62, respectively). However, as we
noted previously, the correlation between our core covariates WPP and APP is low (0.05). Table 3
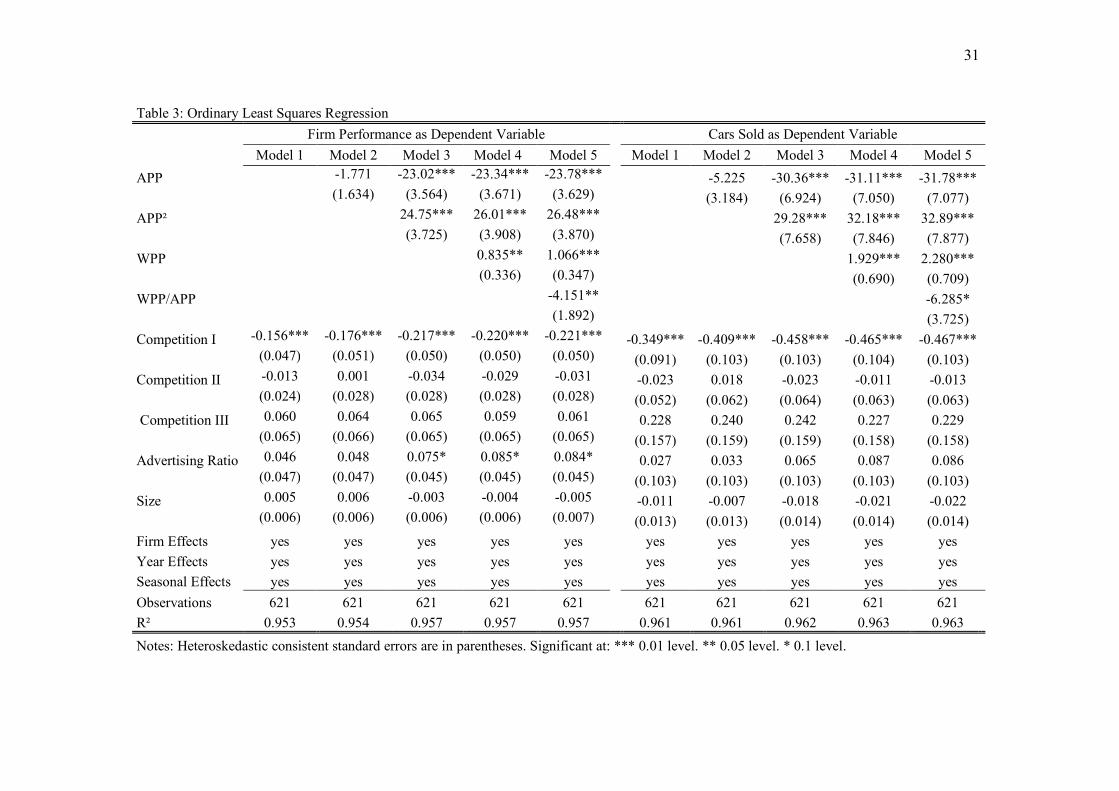
includes the estimation results with Performance and Cars sold as the dependent variables. Model 1
represents the baseline model with only the control variables; Models 2–5 progressively add each variable
of interest.
------------------------------------
Insert Table 3 about here
-----------------------------------
We find that across-niche product proliferation has a positive impact on Performance and Cars
sold beyond a certain threshold. For example, in Model 3 (Table 3), for both dependent variables, the
squared term of across-niche product proliferation produces a U-shaped effect on firm performance:
17
When firms engage in low levels of across-niche product proliferation, the cost associated with increasing
these levels, because they lose submarket loyalists, dominates the benefit of attracting more brand
loyalists. The threshold level at which greater across-niche product proliferation achieves higher
performance is around 0.5 in Model 3 (both dependent variables). This result is robust in the different
model specifications (Models 4 and 5).
With regard to WPP, we find a positive impact on firm performance under our condition. We
jointly consider the coefficients of WPP and WPP/APP: Higher within-niche product proliferation has a
significant positive impact on firm performance for specialized firms that are not undertaking across-
niche product proliferation too. These results remain strongly consistent across both dependent variables;
therefore, gains or losses in sales influence the profit function without any significant bias.
For the control variables, all estimates are in the expected directions, though their significance
varies across models. The negative coefficient of the competition terms indicates that performance suffers
for firms that operate in more competitive environments, especially if they function in more competitive
niches. Firms with higher advertising expenditures, compared with their competitors, achieve better
performance (significantly in Model 4 and 5). The size coefficient has no straightforward interpretation; it
is not significantly robust across regression models. However, this result might imply the declining
importance of scale in mature oligopolistic industries.
The differences in the R-square values between the baseline and the full model are quite
marginal. This finding occurs because firm fixed effects consistently capture the average slopes and
therefore the main variance in the model.
4.2 Consistency analysis
We undertook a consistency analysis to provide a more rigorous test of our results. Because the
complexity of product space plays an important role in our theoretical mechanisms, we evaluate whether
18
the estimates of our covariates change at different levels of product space complexity. Our theoretical
discussion suggests that negative effects of lost associations and positive effects from one-stop shopping
benefits may grow stronger with more complex product spaces.
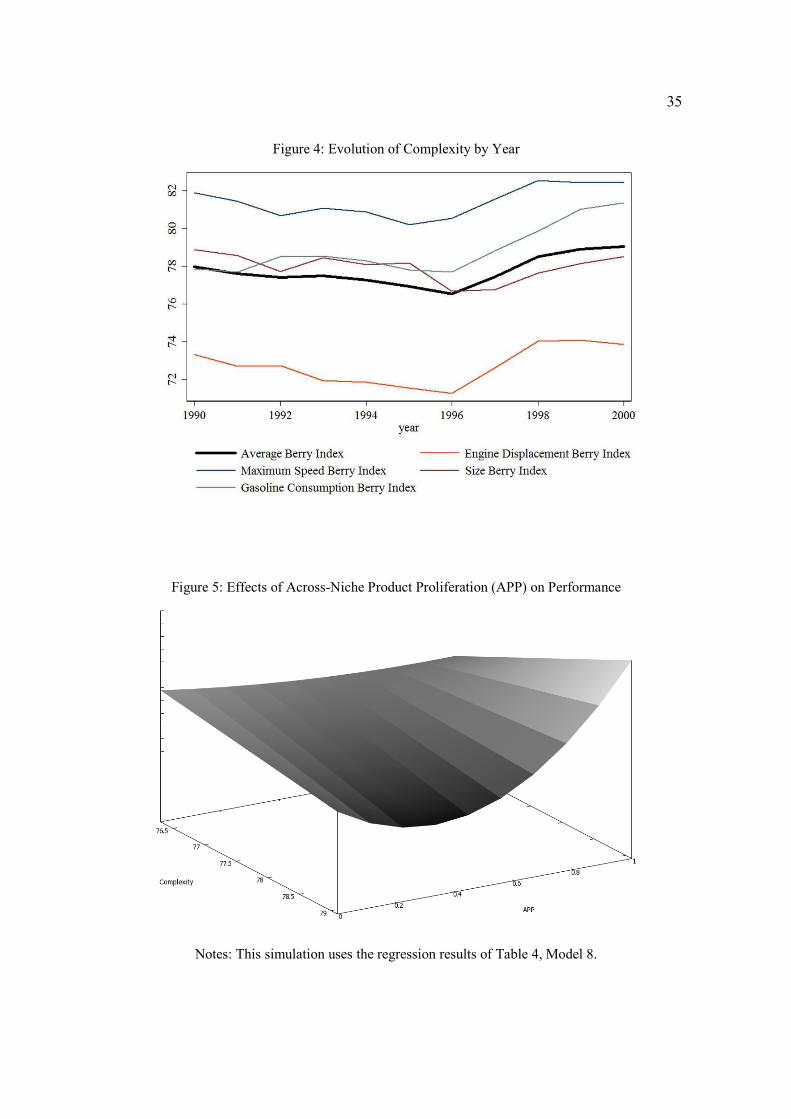
The complexity of a product space is a function of the heterogeneity and interdependences of its
product characteristics. We follow McEvily and Chakravarthy (2002) and measure complexity as the
dispersion of characteristics, keeping interdependence fixed. A concentration ratio, computed for the set
of characteristics in Table 1, defines each submarket niche. Thus, we build Complexity as a Berry index of
the product characteristics (size, maximum speed, gasoline consumption, and engine displacement)
offered in each period. We identify 10 intervals of equal size for each attribute, starting with the minimal
value and ending with the maximum value observed in the sample. We then calculate the proportion of
models in each interval to compute a Berry index for each attribute. The Complexity variable ultimately
equals the average of these Berry indices for each firm (multiplied by 100 for scaling). We depict the
evolution of Complexity over time in Figure 4.
------------------------------------
Insert Figure 4 about here
-----------------------------------
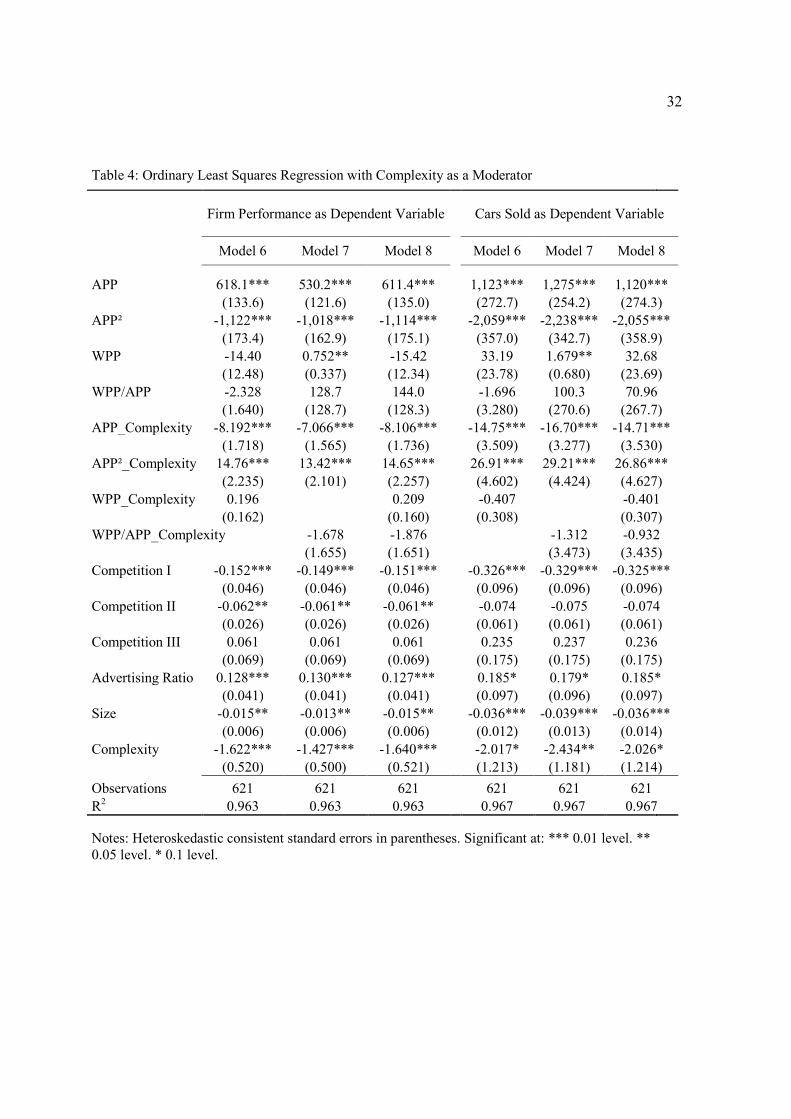
To test for consistency with our previous results, we also model the interaction effects of
Complexity together with our variables of interest: APP, WPP, APP2, and WPP/APP. If the complexity-
moderated results align with our Table 4 results, the importance of product space complexity as a driver is
supported by these data. In Table 4, we provide corresponding estimation results, including all interaction
terms between the covariates of theoretical interest and Complexity, as well as the complexity measure as
a control. It is worth noting that we maintain all controls from the previous estimation, including the three
competition covariates and time and firm fixed effects.
19
------------------------------------
Insert Table 4 about here
-----------------------------------
For APP, the results are perfectly consistent with our theory for both dependent variables. The
multiplicative effects for APP and APP2 are significant and of the expected sign. We display in Figure 5
the estimated effect of across-niche product proliferation on firm performance for minimum (0) and
maximum (21) levels of Complexity, using Cars sold as the dependent variable
--------------------------------
Insert Figure 5 about here
-----------------------------------
As this figure shows, the effects of APP on Cars sold are greater at higher levels of product space
complexity. Therefore, the forces that attract brand loyalists or deflect submarket loyalists exert
increasing impacts when the complexity of the product space increases. In particular, the Model 6 results
indicate that the lower bound equals 0.6 if Complexity is fixed at the median level, but it drops to 0.4 if
Complexity reaches its maximum.
Figure 5 also reveals that the increasing part of the graph, compared with the decreasing part,
pertains to higher levels of Complexity. It thus seems that product space complexity in this industry
affects brand loyalists (positive effect of APP) more than submarket loyalists (negative effect of APP).
This intuition is consistent with the stylized fact that we find no significant variation of the effect of WPP
for different levels of Complexity. If submarket loyalists are not significantly affected by complexity
levels, WPP should not be affected either. These results could be idiosyncratic to this empirical context;
submarket loyalists in this industry probably were important from the beginning and did not grow
significantly over the course of our study period, as implied by insignificant effect of the mediation with
Complexity.
20
5. Conclusions
To investigate the relationship between product proliferation strategies and firm performance, we
have studied the Spanish automobile market between 1990 and 2000 and exploited the presence of an
external trend (EU trade policy) that significantly increased the complexity of the product space. Our
findings reveal conditions in which across- and within-niche product proliferation exert a positive impact
on firm performance, measured as both units sold and the product of product margins multiplied by units
sold. Accordingly, our study complements a mainstream perspective (Bayus and Agarwal 2003), which
has focused more on the heterogeneity of firm assets and resources to explain the link between product
proliferation and performance. We put more emphasis on the direct link between performance and
product strategies (Hui 2004; Siggelkow 2003), and we propose the complexity of the overall industry
product space as an important moderator.
This analysis thus offers several important management implications. Product proliferation
strategies produce benefits (e.g., differentiation, entry barriers, one-stop shopping), but managers cannot
ignore their costs, which extend beyond production abilities to include a potential loss of the association
between a brand and a niche. The magnitude of these costs depends on the complexity of the product
space, which could change the distribution of customers according to their different decision-making
rules. If customers mainly rely on brands (submarkets), firms that pursue across- (within-) niche product
proliferation enjoy an advantage. In markets characterized by a bimodal distribution of customers, both
polar strategies are optimal—a stylized fact that resonates with population ecology research (Dobrev,
Kim, and Carroll 2002).
The main implication for managers thus is to avoid being stuck in the middle. A firm that aims to
increase its across-niche product proliferation from a specialized position should move quickly and invest
significantly to speed up the process. However, we do not recommend pursuing within-niche product
differentiation together with across-niche proliferation, as might be attempted by firms that want to

21
change their segment. In this case, they should design organizational processes to introduce different
versions of new products while also culling and retiring older models, to keep the level of specialization
constant (Sorenson 2000).
Managers also should recognize that within- and across-niche product proliferation are two very
different strategies. Across-niche implies typical intra-industry diversification; within-niche proliferation
is associated with product versioning (Shapiro and Varian 1998). The choice of approaches is pivotal for
firms that target a particular niche.
Ultimately, our study suggests avenues for further research as well. We find that the parabolic
effect of across-niche product proliferation on firm performance is U-shaped, but it could vary across
markets. Additional research should consider explicitly when U- versus L-shaped forms arise, using data
that include heterogeneity across industries. In particular, the market we study is special in that customers
cannot move freely across every submarket niche, largely because of the importance of price differences.
Moreover, we assert that across-niche product proliferation is better for capturing customers who
rely on brand information, whereas within-niche product proliferation fits better for customers who turn
to submarket information. Brand advertising seemingly should be more effective for firms that follow an
across-niche proliferation strategy, whereas firms with a within-niche product proliferation strategy
apparently should advertise product models and characteristics. Further work should test the different
effects of these types of advertising on performance, given a particular product strategy.
22
References
Alba, J. W., and Hutchinson, W. J. 1987. Dimensions of consumer expertise. Journal of Consumer
Research, 13: 411–54.
Anderson, M. C., and Spellman, B. A. 1995. On the status of inhibitory mechanisms in cognition: Memory
retrieval as a model case. Psychological Review, 102 (January): 68–100.
Anderson, S. J. 1995. Measuring the impact of product mix heterogeneity on manufacturing overhead cost.
Accounting Review, 70 (July): 363–387.
Bayus, B. L., and Agarwal, R. 2007. The role of pre-entry experience, entry timing, and product technology
strategies in explaining firm survival. Management Science, 53 (12): 1887-1902.
Bayus, B. L., and Putsis, W. P. 1999. Product proliferation: An empirical analysis of product line
determinants and market outcomes. Marketing Science, 18: 137–153.
Beatty, S. E., and Smith, S. M. 1987. External search efforts: an investigation across several product
categories. Journal of Consumer Research, 14: 83-95.
Berry, S. T. 1994. Estimating discrete-choice models of product differentiation. RAND Journal of
Economics, 25: 242–262.
Berry, S. T., Levinsohn J., and Pakes A. 1995. Automobile prices in market equilibrium. Econometrica,
63: 841–890.
Berry, S. T., Levinsohn, J., and Pakes, A. 1999. Voluntary export restraints on automobiles: Evaluating a
trade policy. American Economic Review, 89: 400-430.
Bettman, J. R. 1979. An information processing theory of consumer choice. Reading, MA: Addison-
Wesley.
Chakravarti, A., and Janiszewski, C. 2003. The influence of macro-level motives on consideration set
composition in novel purchase situations. Journal of Consumer Research, 30 (September): 244-58.
Chase, R. B., Jacobs, R., and Aquilano, N. J. 2005. Operations management for competitive advantage
(11th edition). Boston, MA: Irwin/McGraw-Hill.
Chong, J., Ho, T., and Tang, C. 1998. Product structure, brand width and brand share. In Product
Variety Management: Research Advances, Ho, T-H and Tang, C (eds.). Kluwer: Boston, MA; 39–64.
Dobrev, S., Kim T. Y, and Carroll, G. R. 2002. The evolution of organizational niches: U.S. automobile
manufacturers 1885–1981. Administrative Science Quarterly, 47: 233-264.
Dowell, G. 2006. Product line strategies of new entrants in established industries: Evidence from the U.S.
bicycle industry. Strategic Management Journal, 27: 959-979.
Draganska, M., and Jain, D. 2005. Product line length as a competitive tool. Journal of Economics and
Management Strategy, 14 (1):1–28.

23
Dyer, J. H. 1996. Specialized supplier networks as a source of competitive advantage: evidence from the
auto industry. Strategic Management Journal, 17 (4): 271-291.
Fosfuri, A., and Giarratana, M. S. 2007. Product strategies and survival in Schumpeterian environments:
Evidence from the security software industry. Organization Studies, 28 (6): 909–929.
Gensch, D. H. 1987. A two-stage disaggregate attribute choice model. Marketing Science, 6 (Summer):
223-231.
Gilbride, T. J., and Allenby, G. M. 2004. A choice model with conjunctive, disjunctive, and compensatory
screening rules. Marketing Science, 23(3): 391-406
Gimeno, J., and Woo, C. Y. 1999. Multimarket contact, economies of scope, and firm performance.
Academy of Management Journal, 43: 239–259.
Goldberg, P. K. 1995. Product differentiation and oligopoly in international markets: The case of the U.S.
automobile industry. Econometrica, 63: 981-951.
Hauser, J. R., Toubia, O., Evgeniou, T., Rene, B., and Dzyabura, D. 2010. Disjunctions of conjunctions,
cognitive simplicity and consideration sets. Journal of Marketing Research, 47 (June): 485-496.
Hauser, J. R., and Wernerfelt, B. 1990. An evaluation cost model of consideration sets. Journal of
Consumer Research, 16 (March): 393-408.
Hui, K. L. 2004. Product variety under brand influence: An empirical investigation of personal computer
demand. Management Science, 50 (5): 686-700.
Iyengar, S. S., and Lepper, M. R. 2000. When choice is demotivating: Can one desire too much of a good
thing?. Journal of Personality and Social Psychology, 79: 995-1006.
Johnson, E. J., and Payne, J. W. 1985. Effort and accuracy in choice. Management Science, 31: 395-414.
Kadiyali, V., Vilcassim, N., and Chintagunta, P. 1999. Product line extensions and competitive market
interactions: An empirical analysis. Journal of Econometrics, 89: 339–363.
Kekre, S., and Srinivasan, K. 1990. Broader product lines: A necessity to achieve success? Management
Science, 36: 1216–1231.
Keller, K. .L., and Aaker, D. A. 1992. The effects of sequential introduction of brand extensions. Journal
of Marketing Research, 29 (February): 35–50.
Keller, K. L., and Staelin, R. 1987. Effects of quality and quantity of information on decision and
effectiveness. Journal of Consumer Research, 14: 200-213.
King, A. A., and Tucci, C. L. 2002. Incumbent entry into new market niches: The role of experience and
managerial choice in the creation of dynamic capabilities. Management Science, 48 (2) 171–186.
Klepper, S., and Thompson, P. 2006. Submarkets and the evolution of market structure. RAND Journal of
Economics, 37: 861–886.

24
Knudsen, T., and Levinthal, D. A. 2007. Two faces of search: Alternative generation and alternative
evaluation. Organization Science, 18: 39-54.
Kotabe, M., Martin, X., and Domoto, H. 2003. Gaining from within partnerships: Knowledge transfer,
relationship duration, and supplier performance improvement in the U.S. and Japanese automotive
industries. Strategic Management Journal, 24: 293–316.
Kotha, S. 1995. Mass customization: Implementing the emerging paradigm for competitive advantage.
Strategic Management Journal, 16: 21–42.
Lancaster, K. 1990. The economies of product variety: A survey. Marketing Science, 9: 189–206.
Lapersonne, E., Laurent, G,, and Le Goff, J. J. 1995. Consideration sets of size one: An empirical
investigation of automobile purchases. International Journal of Research in Marketing, (12): 55-66.
Lenk, P.J., DeSarbo, W.S., Green, P.E. Young, M.R. 1996. Hierarchical Bayes conjoint analysis: Recovery
of partworth heterogeneity from reduced experimental designs. Marketing Science, 15(2): 173-191.
Li, S. X., and Greenwood, R. 2004. The effect of within-industry diversification on firm performance:
Synergy creation, multi-market contact and market structuration. Strategic Management Journal,
25(12): 1131–1153.
Lieberman, M. B., and Dhawan, R. 2005. Assessing the resource base of Japanese and U.S. auto producers:
A stochastic frontier production function approach. Management Science, 51 (7): 1000-1075.
Loken, B., and John, D. R. 1993. Diluting brand beliefs: When do brand extensions have a negative
impact? Journal of Marketing, 57 (July): 71–84.
Lussier, D., and Olshavsky, R. 1979. Task complexity and contingent processing in brand choice. Journal
of Consumer Research, 6: 154–165.
MacDuffie, J. P., Sethuraman, K., and Fisher, M. L. 1996. Product variety and manufacturing performance:
evidence from the international automotive assembly plant study. Management Science, 42: 350–369.
McEvily S.K., Chakravarthy B. 2002. The persistence of knowledge-based advantage: an empirical test for
product performance and technological knowledge. Strategic Management Journal, 23: 285–305.
McFadden, D. 1974. Conditional logit analysis of quantitative choice behavior. New York: Academic
Press.
Meyvis, T., and Janiszewski, C. 2004. When are broader brands stronger brands? An accessibility
perspective on the formation of brand equity. Journal of Consumer Research, 31 (September): 346-
357.
Nation’s Restaurant News.2010. Menus should define concepts. 44 (18): 16-17.
Nevo, A. 2000. A practitioner’s guide to estimating random coefficients logit models of demand. Journal
of Economics and Management Strategy, 9: 513–548.
25
Novak, S., and Stern, S. 2008. How does outsourcing affect performance dynamics? Evidence from the
automobile industry. Management Science, 54 (12): 1963-1979.
Osgood, C. E. 1948. An investigation into the causes of retroactive interference. Journal of Experimental
Psychology, 38: 132–54.
Payne, J. W. 1976. Task complexity and contingent processing in decision making: An information search
and protocol analysis. Organizational Behavior and Human Performance, 16: 366-387.
Petrin, A. 2002. Quantifying the benefits of new products: The case of the minivan. Journal of Political
Economy, 110: 705-729.
Posavac, S. S., Sanbonmatsu, D. M, Cronley, M. L, and Kardes, F. R. 2001. The effects of strengthening
category-brand associations on consideration set composition and purchase intent in memory-based
choice. Advances in Consumer Research, 28: 186-189.
Posavac, S. S., Sanbonmatsu, D. M, and Fazio, R. H. 1997. Considering the best choice: Effects of the
salience and accessibility of alternatives on attitude-decision consistency. Journal of Personality and
Social Psychology, 72 (February): 253-261.
Punj, G., and Moon J. 2002. Positioning options for achieving brand association: a psychology
categorization framework. Journal of Business Research, 55: 275–283.
Putsis, W. P., and Bayus, B. L. 2001. An empirical analysis of firms’ product line decisions. Journal of
Marketing Research, 38 (1): 110–118.
Ramdas K. 2003. Managing product variety: An integrative review and research directions. Production
and Operation Management, 12(1): 79-101
Ramdas K., and Sawhney M.S. 2001. A cross-functional approach to evaluating multiple line extensions
for assembled products. Management Science, 47(1): 22-36
Rao, H. 1994. The social construction of reputation: Certification contests, legitimation, and the survival of
organizations in the American automobile industry, 1895–1912. Strategic Management Journal, 15
(S1): 29-44
Roberts, J. H., and Lattin, J. M. 1991. Development and testing of a model of consideration set
composition. Journal of Marketing Research, 28 (November): 429-440.
Rosen, S. 1974. Hedonic prices and implicit markets: Product differentiation in pure competition. Journal
of Political Economy, 82 (1): 34-55.
Santalo J., and Becerra M. 2008. Competition from specialized firms and the diversification-performance
linkage. Journal of Finance, 63(2): 851-883.
Sappington, D., and Wernerfelt, B. 1985. To brand or not to brand. Journal of Business, 58: 279-94.
Schmalensee, R. 1982. Another look at market power. Harvard Law Review, 95: 1789-1816.
26
Schmalensee, R. 2000. Antitrust issues in Schumpeterian industries. American Economic Review, 90 (2):
192-96.
Shapiro, C., and Varian, H. R. 1998. Versioning: The smart way to sell information. Harvard Business
Review, 76 (6): 106–107.
Shocker, A. D., Ben-Akiva, M., Boccara, B., and Nedungadi, P. 1991. Consideration set influences on
customer decision-making and choice: Issues, models and suggestions. Marketing Letters, 2: 181-198.
Shugan, S. M. 1980. The cost of thinking. Journal of Consumer Research, 7 (2): 99-111.
Siggelkow, N. 2003. Why focus? A study of intraindustry effects. Journal of Industrial Economics, 51
(2): 121–148.
Simon, H. A. 1955. A behavioral model of rational choice. Quarterly Journal of Economics, 69 (1): 99-
118.
Sorenson, O. 2000. Letting the market work for you: An evolutionary perspective on product strategy.
Strategic Management Journal, 21 (5): 577–592.
Sutton, J. 1998. Technology and market structure. MIT Press: Cambridge, MA
Terech, A, Bucklin, R. E, and Morrison, D. G. 2009. Consideration, choice, and classifying loyalty.
Marketing Letters, 20 (3): 209-225.
The Economist. 2010. The tyranny of choice. December 16: http://www.economist.com/node/17723028.
Tripsas, M. 1997. Unraveling the process of creative destruction: Complementary assets and incumbent
survival in the typesetter industry. Strategic Management Journal, 18: 119–142.
Ulrich, K., Randall, T., Fisher, M., and Reibstein, D. 1998. Managing product variety: a study of the
bicycle industry. In Product Variety Management. Ho, T and Tang, C (eds.). Kluwer: Boston, MA;
177–206.
Urban, G. L., Hulland, J. S, and Weinberg, B. D. 1993. Premarket forecasting for new consumer durable
goods: Modeling categorization, elimination, and consideration phenomena. Journal of Marketing,
57: 47– 63.
Urban, G., Kim, J., MacDonald, E., Hauser, J., and Dzyabura, D. 2010. Developing consideration rules for
durable goods markets. INFORMS Marketing Science Conference, Cologne, June.
Verboven, F. 1996. International price discrimination in the European car market. RAND Journal of
Economics, 27: 240-268.
Von Hippel, E. 1986. Lead users: A source of novel product concepts. Management Science, 32 (7): 791-
805.
Wright, P., and Barbour, F. 1977. Phased decision making strategies: Sequels to an initial screening. TIMS
Studies in the Management Sciences, 6: 91-109.
27
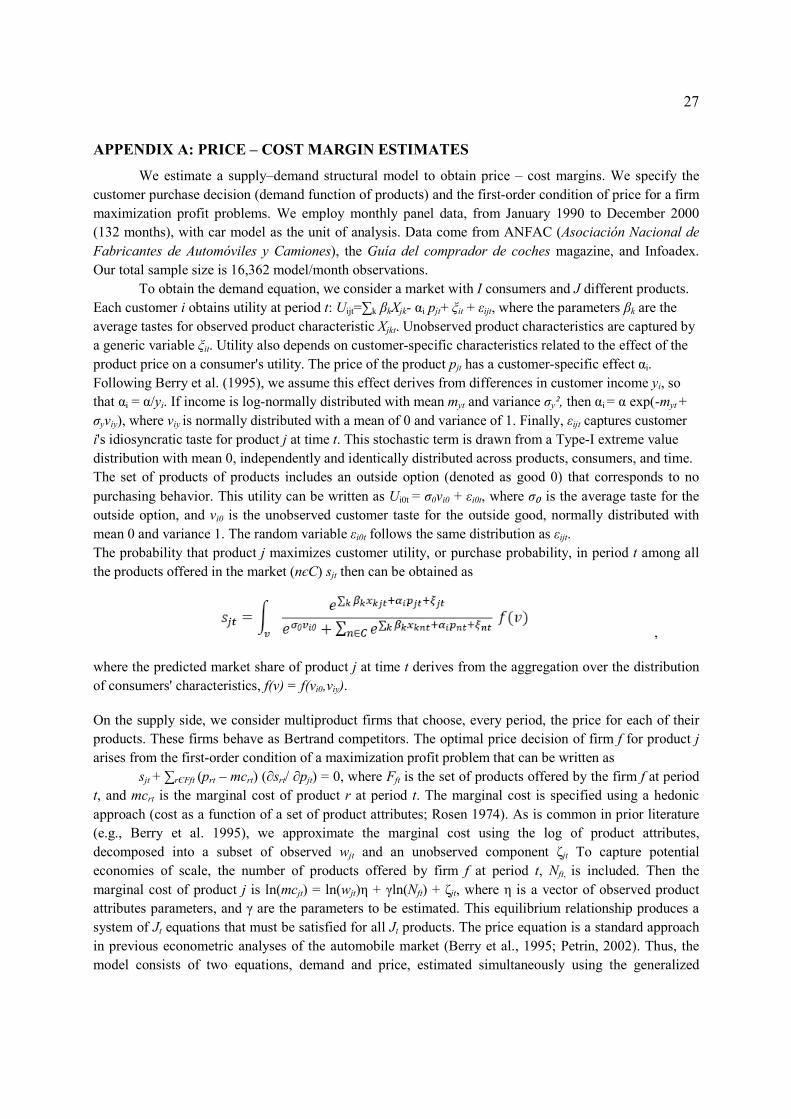
APPENDIX A: PRICE – COST MARGIN ESTIMATES
We estimate a supply–demand structural model to obtain price – cost margins. We specify the
customer purchase decision (demand function of products) and the first-order condition of price for a firm
maximization profit problems. We employ monthly panel data, from January 1990 to December 2000
(132 months), with car model as the unit of analysis. Data come from ANFAC (Asociación Nacional de
Fabricantes de Automóviles y Camiones), the Guía del comprador de coches magazine, and Infoadex.
Our total sample size is 16,362 model/month observations.
To obtain the demand equation, we consider a market with I consumers and J different products.
Each customer i obtains utility at period t: Uijt=∑k βkXjk- αi pjt+ ξit + εijt, where the parameters βk are the
average tastes for observed product characteristic Xjkt. Unobserved product characteristics are captured by
a generic variable ξit. Utility also depends on customer-specific characteristics related to the effect of the
product price on a consumer's utility. The price of the product pjt has a customer-specific effect αi.
Following Berry et al. (1995), we assume this effect derives from differences in customer income yi, so
that αi = α/yi. If income is log-normally distributed with mean myt and variance σy², then αi = α exp(-myt +
σyviy), where viy is normally distributed with a mean of 0 and variance of 1. Finally, εijt captures customer
i's idiosyncratic taste for product j at time t. This stochastic term is drawn from a Type-I extreme value
distribution with mean 0, independently and identically distributed across products, consumers, and time.
The set of products of products includes an outside option (denoted as good 0) that corresponds to no
purchasing behavior. This utility can be written as Ui0t = σ0vi0 + εi0t, where σ₀ is the average taste for the
outside option, and vi0 is the unobserved customer taste for the outside good, normally distributed with
mean 0 and variance 1. The random variable εi0t follows the same distribution as εijt.
The probability that product j maximizes customer utility, or purchase probability, in period t among all
the products offered in the market (nєC) sjt then can be obtained as
,
where the predicted market share of product j at time t derives from the aggregation over the distribution
of consumers' characteristics, f(v) = f(vi0,viy).
On the supply side, we consider multiproduct firms that choose, every period, the price for each of their
products. These firms behave as Bertrand competitors. The optimal price decision of firm f for product j
arises from the first-order condition of a maximization profit problem that can be written as
sjt + ∑rЄFft (prt – mcrt) (∂srt/ ∂pjt) = 0, where Fft is the set of products offered by the firm f at period
t, and mcrt is the marginal cost of product r at period t. The marginal cost is specified using a hedonic
approach (cost as a function of a set of product attributes; Rosen 1974). As is common in prior literature
(e.g., Berry et al. 1995), we approximate the marginal cost using the log of product attributes,
decomposed into a subset of observed wjt and an unobserved component ζjt To capture potential
economies of scale, the number of products offered by firm f at period t, Nft, is included. Then the
marginal cost of product j is ln(mcjt) = ln(wjt)η + γln(Nft) + ζjt, where η is a vector of observed product
attributes parameters, and γ are the parameters to be estimated. This equilibrium relationship produces a
system of Jt equations that must be satisfied for all Jt products. The price equation is a standard approach
in previous econometric analyses of the automobile market (Berry et al., 1995; Petrin, 2002). Thus, the
model consists of two equations, demand and price, estimated simultaneously using the generalized
28
method of moments. To compute the objective function, the unobservable components are solved
following the technique proposed by Berry et al. (1995). As explanatory variables that approximate the
utility function and marginal cost, we employ product attributes: size (m2), auto cubic capacity per kg
(cm3/kg), gas mileage (kms covered at a constant speed of 90 kph with a liter of gasoline), maximum
speed, and weight (Kgm). For the demand function, we also include advertising expenditures as an
endogenous variable. The time-based control variables capture common variation over time, and brand
controls capture heterogeneity across firms. Several sets of instruments were tested to check for
independence and relevance. The instruments in the reported estimate are the twelfth lags of the price in
differences, the number of models and new models, characteristics of the product, products produced by
the same multiproduct firm, and products produced by rival firms. Other combinations of instruments do
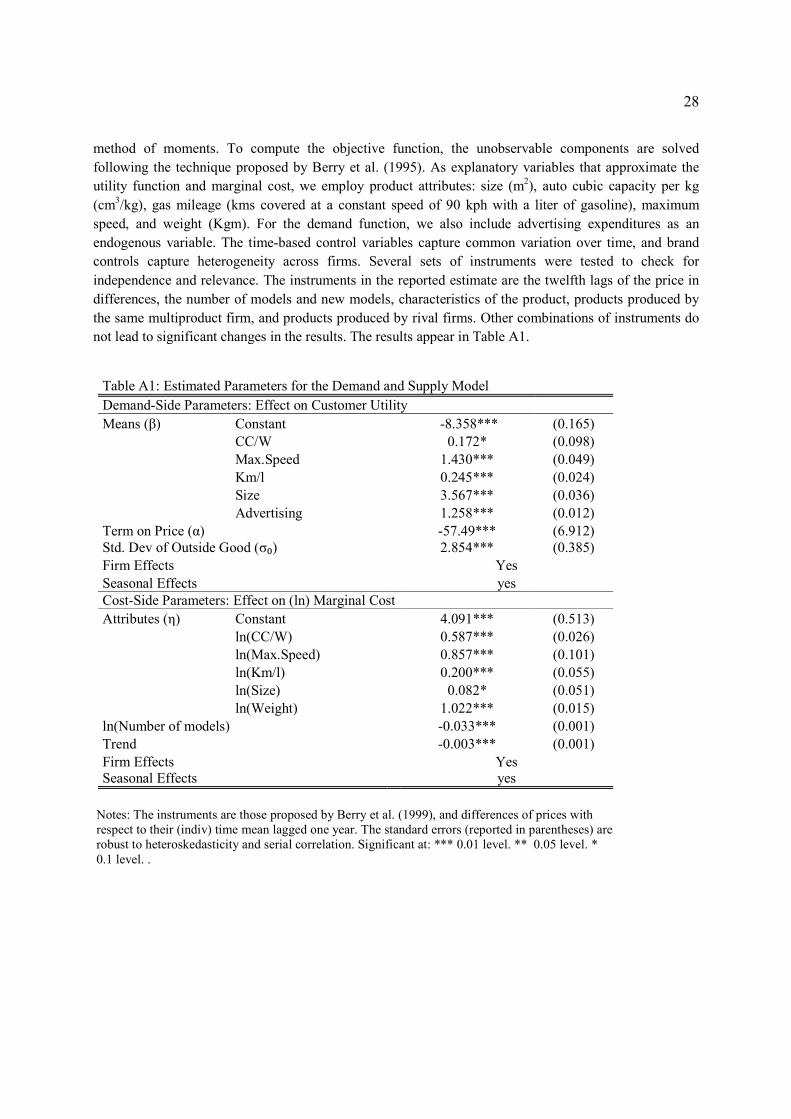
not lead to significant changes in the results. The results appear in Table A1.
Table A1: Estimated Parameters for the Demand and Supply Model
Demand-Side Parameters: Effect on Customer Utility
Means (β) Constant -8.358*** (0.165) CC/W 0.172* (0.098) Max.Speed 1.430*** (0.049) Km/l 0.245*** (0.024) Size 3.567*** (0.036) Advertising 1.258*** (0.012) Term on Price (α) -57.49*** (6.912) Std. Dev of Outside Good (σ₀) 2.854*** (0.385) Firm Effects Yes Seasonal Effects yes Cost-Side Parameters: Effect on (ln) Marginal Cost
Attributes (η) Constant 4.091*** (0.513) ln(CC/W) 0.587*** (0.026) ln(Max.Speed) 0.857*** (0.101) ln(Km/l) 0.200*** (0.055) ln(Size) 0.082* (0.051) ln(Weight) 1.022*** (0.015) ln(Number of models) -0.033*** (0.001) Trend -0.003*** (0.001) Firm Effects Yes Seasonal Effects yes
Notes: The instruments are those proposed by Berry et al. (1999), and differences of prices with respect to their (indiv) time mean lagged one year. The standard errors (reported in parentheses) are robust to heteroskedasticity and serial correlation. Significant at: *** 0.01 level. ** 0.05 level. * 0.1 level. .
29
Table 1: Means and Standard Deviations of Main Attributes for Spanish Automobile Segments
Small Compact Intermediate Lux-Interm Luxury Sport Minivan
No. of Models 45 48 28 42 40 24 30
Cars Sold 968.6 1004.3 728.2 518 112.9 97.1 140.6
-1307.1 -1416.8 -1252.8 -600.3 -109.4 -114.4 -183.3
Price (€) 7285 11307.7 13752.3 17552.7 27746.4 25681.3 15644.8
-1571.1 -2280.2 -3227.4 -4284.6 -11433 -12619.6 -4997
Horsepower 95.8 97.1 105.6 126.4 165.9 167 118.6
-14.6 -19.4 -17 -20.8 -42.1 -57.2 -28
Size (m²) 5.8 7 7.5 7.7 8.5 7.5 7.8
-0.5 -0.3 -0.3 -0.3 -0.4 -0.6 -1
Gas (l/km) 5.1 5.7 5.9 6.4 7.1 6.7 7.3
-0.5 -0.7 -0.4 -0.6 -0.8 -0.9 -1.2
Max.Speed 153.3 180.8 185.2 199 214.2 215.9 174.7
(Km/h) -11.7 -11.4 -11.4 -11.3 -16 -19.6 -11.3
30
Table 2: Descriptive Statistics and Correlation Matrix
Mean SD Min Max (1) (2) (3) (4) (5) (6) (7) (8) (9) (10) (11) (12) (13)
(1) Performance 71.9 73.8 0.01 353.9 1
(2) Cars sold 15.8 17.9 0.01 81 0.96 1
(3) No. Firm Models 4.82 2.61 1 12 0.46 0.36 1
(4) APP 0.56 0.27 0 0.86 0.58 0.55 0.67 1
(5) WPP 1.47 0.73 1 4 -0.06 -0.17 0.62 0.05 1
(6) APP² 0.39 0.22 0 0.73 0.65 0.63 0.63 0.97 -0.1 1
(7) WPP/APP 0.003 0.05 -0.3 0.42 -0.04 -0.07 0.05 0.002 0.12 -0.02 1
(8) Complexity 77.7 0.80 76.3 79.1 0.23 0.14 0.10 0.09 -0.01 0.08 0.08 1
(9) Competition I 85 3.7 65.2 90.4 0.11 0.06 0.22 0.23 0.11 0.22 0.06 -0.40
(10) Competition II 17.91 8.13 3 39 0.27 0.27 0.38 0.70 -0.05 0.70 -0.06 0.17 0.09 1
(11) Competition III 124 20 90 160 0.25 0.13 0.21 0.14 0.04 0.14 0.10 0.64 0.11 0.09 1
(12) Size ($b) 65.9 76.5 27.1 303.1 0.29 0.3 0.13 -0.11 0.28 0.18 -0.05 0.09 0.17 -0.04 0.17 1
(13) AdvRatio 5.1 5.2 0 22.7 0.72 0.78 0.26 0.51 -0.16 0.56 -0.07 0.01 0.02 0.30 0.02 0.13 1
Notes: Performance in 10 million (1995) Euros and cars sold in thousands of units.
31
Table 3: Ordinary Least Squares Regression
Firm Performance as Dependent Variable Cars Sold as Dependent Variable
Model 1 Model 2 Model 3 Model 4 Model 5 Model 1 Model 2 Model 3 Model 4 Model 5
APP -1.771 -23.02*** -23.34*** -23.78*** -5.225 -30.36*** -31.11*** -31.78***
(1.634) (3.564) (3.671) (3.629) (3.184) (6.924) (7.050) (7.077)
APP² 24.75*** 26.01*** 26.48*** 29.28*** 32.18*** 32.89***
(3.725) (3.908) (3.870) (7.658) (7.846) (7.877)
WPP 0.835** 1.066*** 1.929*** 2.280***
(0.336) (0.347) (0.690) (0.709)
WPP/APP -4.151** -6.285*
(1.892) (3.725)
Competition I -0.156*** -0.176*** -0.217*** -0.220*** -0.221*** -0.349*** -0.409*** -0.458*** -0.465*** -0.467***
(0.047) (0.051) (0.050) (0.050) (0.050) (0.091) (0.103) (0.103) (0.104) (0.103)
Competition II -0.013 0.001 -0.034 -0.029 -0.031 -0.023 0.018 -0.023 -0.011 -0.013
(0.024) (0.028) (0.028) (0.028) (0.028) (0.052) (0.062) (0.064) (0.063) (0.063)
Competition III 0.060 0.064 0.065 0.059 0.061 0.228 0.240 0.242 0.227 0.229
(0.065) (0.066) (0.065) (0.065) (0.065) (0.157) (0.159) (0.159) (0.158) (0.158)
Advertising Ratio 0.046 0.048 0.075* 0.085* 0.084* 0.027 0.033 0.065 0.087 0.086
(0.047) (0.047) (0.045) (0.045) (0.045) (0.103) (0.103) (0.103) (0.103) (0.103)
Size 0.005 0.006 -0.003 -0.004 -0.005 -0.011 -0.007 -0.018 -0.021 -0.022
(0.006) (0.006) (0.006) (0.006) (0.007) (0.013) (0.013) (0.014) (0.014) (0.014)
Firm Effects yes yes yes yes yes yes yes yes yes yes
Year Effects yes yes yes yes yes yes yes yes yes yes
Seasonal Effects yes yes yes yes yes yes yes yes yes yes
Observations 621 621 621 621 621 621 621 621 621 621
R² 0.953 0.954 0.957 0.957 0.957 0.961 0.961 0.962 0.963 0.963
Notes: Heteroskedastic consistent standard errors are in parentheses. Significant at: *** 0.01 level. ** 0.05 level. * 0.1 level.
32
Table 4: Ordinary Least Squares Regression with Complexity as a Moderator
Firm Performance as Dependent Variable Cars Sold as Dependent Variable
Model 6 Model 7 Model 8 Model 6 Model 7 Model 8
APP 618.1*** 530.2*** 611.4*** 1,123*** 1,275*** 1,120*** (133.6) (121.6) (135.0) (272.7) (254.2) (274.3) APP² -1,122*** -1,018*** -1,114*** -2,059*** -2,238*** -2,055*** (173.4) (162.9) (175.1) (357.0) (342.7) (358.9) WPP -14.40 0.752** -15.42 33.19 1.679** 32.68 (12.48) (0.337) (12.34) (23.78) (0.680) (23.69) WPP/APP -2.328 128.7 144.0 -1.696 100.3 70.96 (1.640) (128.7) (128.3) (3.280) (270.6) (267.7) APP_Complexity -8.192*** -7.066*** -8.106*** -14.75*** -16.70*** -14.71*** (1.718) (1.565) (1.736) (3.509) (3.277) (3.530) APP²_Complexity 14.76*** 13.42*** 14.65*** 26.91*** 29.21*** 26.86*** (2.235) (2.101) (2.257) (4.602) (4.424) (4.627) WPP_Complexity 0.196 0.209 -0.407 -0.401 (0.162) (0.160) (0.308) (0.307) WPP/APP_Complexity -1.678 -1.876 -1.312 -0.932 (1.655) (1.651) (3.473) (3.435) Competition I -0.152*** -0.149*** -0.151*** -0.326*** -0.329*** -0.325*** (0.046) (0.046) (0.046) (0.096) (0.096) (0.096) Competition II -0.062** -0.061** -0.061** -0.074 -0.075 -0.074 (0.026) (0.026) (0.026) (0.061) (0.061) (0.061) Competition III 0.061 0.061 0.061 0.235 0.237 0.236 (0.069) (0.069) (0.069) (0.175) (0.175) (0.175) Advertising Ratio 0.128*** 0.130*** 0.127*** 0.185* 0.179* 0.185* (0.041) (0.041) (0.041) (0.097) (0.096) (0.097) Size -0.015** -0.013** -0.015** -0.036*** -0.039*** -0.036*** (0.006) (0.006) (0.006) (0.012) (0.013) (0.014) Complexity -1.622*** -1.427*** -1.640*** -2.017* -2.434** -2.026* (0.520) (0.500) (0.521) (1.213) (1.181) (1.214)
Observations 621 621 621 621 621 621 R2 0.963 0.963 0.963 0.967 0.967 0.967
Notes: Heteroskedastic consistent standard errors in parentheses. Significant at: *** 0.01 level. ** 0.05 level. * 0.1 level.
33
Figure 1: Markup Estimates
Notes: The estimates use the parameters reported in Table A1 of the Appendix. They correspond to
the average markups of car models within the percentile of the distribution of the observed prices
34
Figure 2: Evolution of the Across-Niche Product Proliferation (APP) by Year
Figure 3: Evolution of the Within-Niche Product Proliferation (WPP) by Year
35
Figure 4: Evolution of Complexity by Year
Figure 5: Effects of Across-Niche Product Proliferation (APP) on Performance
Notes: This simulation uses the regression results of Table 4, Model 8.