Embed Size (px)
Citation preview
Annual Report 2010AnnualReport2010
For the fiscal year ended March 31, 2010
TOKYO STOCK EXCHANGE GROUP, INC.
2 Snapshot
4 Financial Highlights
6 To Our Shareholders
8 An Interview with President & CEO Atsushi Saito
12 Review of Operations
Cash Equities Market and Derivatives Markets
IT Infrastructure
Improving the Corporate Governance of Listed Companies
Self-Regulation
20 Board of Directors
22 Corporate Governance
24 Financial Section
Review of Operations and Finances
Consolidated Financial Statements
Notes to Consolidated Financial Statements
Independent Auditors’ Report
44 Market Data
46 Organization
47 Corporate Data
Contents
1TOKYO STOCK EXCHANGE GROUP, INC. Annual Report 2010
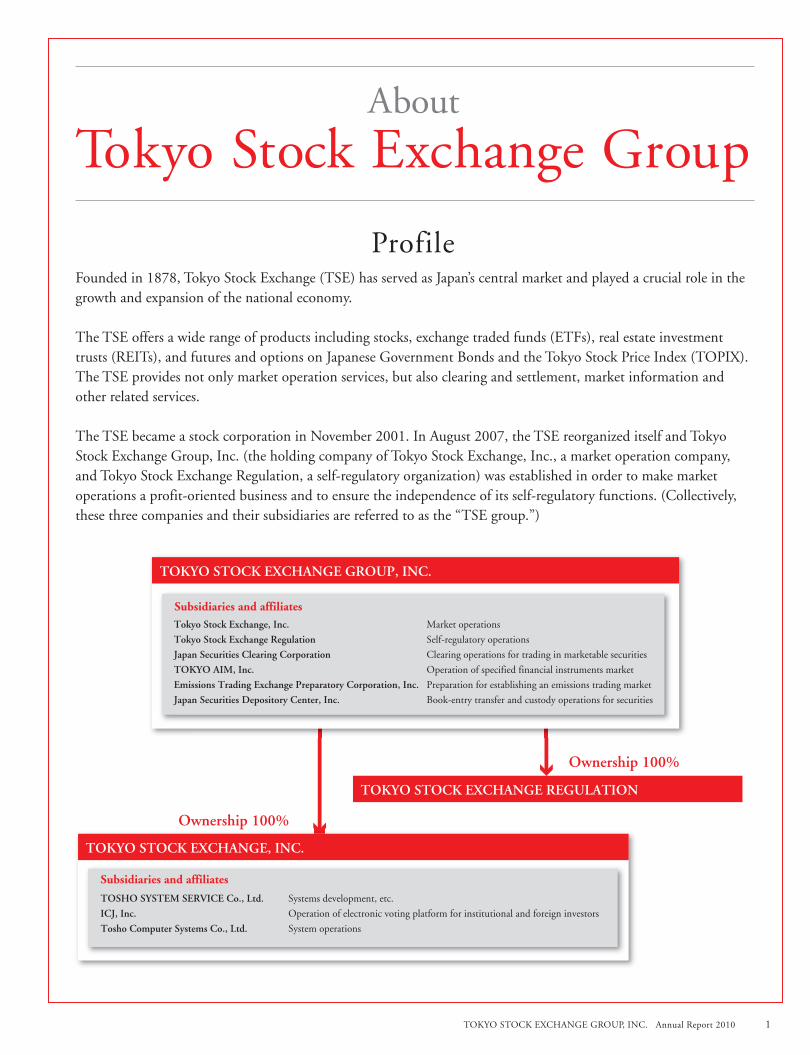
About
Tokyo Stock Exchange Group
Founded in 1878, Tokyo Stock Exchange (TSE) has served as Japan’s central market and played a crucial role in the growth and expansion of the national economy.
The TSE offers a wide range of products including stocks, exchange traded funds (ETFs), real estate investment trusts (REITs), and futures and options on Japanese Government Bonds and the Tokyo Stock Price Index (TOPIX). The TSE provides not only market operation services, but also clearing and settlement, market information and other related services.
The TSE became a stock corporation in November 2001. In August 2007, the TSE reorganized itself and Tokyo Stock Exchange Group, Inc. (the holding company of Tokyo Stock Exchange, Inc., a market operation company, and Tokyo Stock Exchange Regulation, a self-regulatory organization) was established in order to make market operations a profit-oriented business and to ensure the independence of its self-regulatory functions. (Collectively, these three companies and their subsidiaries are referred to as the “TSE group.”)
TOKYO STOCK EXCHANGE REGULATION
TOKYO STOCK EXCHANGE GROUP, INC.
Ownership 100%
Ownership 100%
Subsidiaries and affiliatesTokyo Stock Exchange, Inc. Market operations
Tokyo Stock Exchange Regulation Self-regulatory operations
Japan Securities Clearing Corporation Clearing operations for trading in marketable securities
TOKYO AIM, Inc. Operation of specified financial instruments market
Emissions Trading Exchange Preparatory Corporation, Inc. Preparation for establishing an emissions trading market
Japan Securities Depository Center, Inc. Book-entry transfer and custody operations for securities
Subsidiaries and affiliates
TOKYO STOCK EXCHANGE, INC.
Systems development, etc.
Operation of electronic voting platform for institutional and foreign investors
System operations
TOSHO SYSTEM SERVICE Co., Ltd.
ICJ, Inc.
Tosho Computer Systems Co., Ltd.
TOKYO STOCK EXCHANGE GROUP, INC. Annual Report 2010
Profile
2 TOKYO STOCK EXCHANGE GROUP, INC. Annual Report 2010 TOKYO STOCK EXCHANGE GROUP, INC. Annual Report 2010
Snapshot
0
150
100
50
200
250
300
2009.32008.32007.32006.3
0
5,000
10,000
15,000
2008.32007.32006.3
2009.32008.32007.32006.3 2009.32008.32007.32006.3 2009.32008.32007.32006.3
Monthly Trading Value (left scale) TOPIX Closing Value (right scale)
(¥ trillions) (Points)
322010.1121110987652009.4
Yearly Trading Value (left scale)
TOPIX Closing Value (right scale)
(¥ trillions) (Points)
Monthly Trading Value (left scale)
Stock Price Index Futures(monthly)
TOPIX Futures Price (right scale)
(¥ trils.) (Points)
0
10
20
30
40
0
400
800
1,200
1,600
Yearly Trading Value (left scale)
(fiscal year)
TOPIX Futures Price (right scale)
(¥ trils.) (Points)
0
900
600
300
1,200
1,500
1,800
Japanese Government Bond Futures(monthly)
Monthly Trading Volume (left scale) 10 Year JGB Futures Price (right scale)
(thous. contracts) (¥)
120
130
140
150
0
500
1,000
1,500
(fiscal year)
Yearly Trading Volume (left scale)
10 Year JGB Futures Price (right scale)
(thous. contracts) (¥)
120
130
140
150
322009.1121110987652008.4
ETF’s Yearly Trading Value
(¥ bils.)
0
2,000
1,000
3,000
4,000
2009.3
REIT’s Yearly Trading Value
(¥ bils.)
0
4,000
2,000
6,000
8,000
Number of Newly Listed Companies, Number of Listed Companies
(Companies) (Companies)
0
50
100
150
0
1,000
2,000
3,000
Number of Newly Listed Companies (left scale)
Number of Listed Companies at the End of Fiscal Year (right scale)
2010.3
2010.3 2010.3 2010.3
2010.3322010.1121110987652009.4
0
150
100
50
200
250
300
2009.32008.32007.32006.32005.3
0
5,000
10,000
15,000
2008.32007.32006.32005.3
2009.32008.32007.32006.32005.3
Yearly Trading Value (left scale)
(fiscal year)
TOPIX Futures Price (right scale)
(¥ trils.) (Points)
0
900
600
300
1,200
1,500
1,800
(fiscal year)
Yearly Trading Volume (left scale)
10 Year JGB Futures Price (right scale)
(thous. contracts) (¥)
120
130
140
150
2009.3
Number of Newly Listed Companies, Number of Listed Companies
(Companies) (Companies)
0
50
100
150
0
1,000
2,000
3,000
Number of Newly Listed Companies (left scale)
0
10
20
30
40
50
0
200
400
600
800
Monthly Trading Volume (left scale) 10 Year JGB Futures Price (right scale)
(thousand contracts) (¥)
322010.1121110987652009.4
Yearly Trading Volume (left scale)
10 Year JGB Futures Price (right scale)
(thousand contracts) (¥)
0
30
60
90
0
50
100
150
120
130
140
150
Monthly Trading Value (left scale) TOPIX Futures Price (right scale)
(¥ trillions) (Points)
322010.1121110987652009.4
Yearly Trading Value (left scale)
TOPIX Futures Price (right scale)
0
5
10
15
20
2009.32008.32007.32006.3 2010.3
(¥ trillions) (Points)
0
50
100
150
200
250
300
0
300
600
900
1,200
1,500
1,800
2009.32008.32007.32006.3 2010.3
2009.32008.32007.32006.3 2010.3
(¥ billions)
0
1,000
2,000
3,000
4,000
2009.32008.32007.32006.3 2010.3
(¥ billions)
0
2,000
4,000
6,000
8,000
2009.32008.32007.32006.3 2010.3
Number of Newly Listed Companies (left scale)
Number of Listed Companies at the End of Fiscal Year (right scale)
(Companies) (Companies)
0
50
100
150
0
1,000
2,000
3,000
2009.32008.32007.32006.3 2010.3
0
250
500
750
1,000
120
130
140
150
0
500
1,000
1,500
2,000
Yearly Trading Value (left scale)
TOPIX Closing Value (right scale)
(¥ trillions) (Points)
0
200
400
600
800
2009.32008.32007.32006.3 2010.30
500
1,000
1,500
2,000
0
200
400
600
800
1,000
2,313companies
Tokyo Stock Exchange:
Exchange Number of Listed Companies
Bombay Stock Exchange 4,975NASDAQ OMX 2,823London Stock Exchange 2,749NYSE Euronext (US) 2,323Hong Kong Exchanges 1,332Shanghai Stock Exchange 878Singapore Exchange 774
Exchange US$ millions
NYSE Euronext (US) 12,423,557
Tokyo Stock Exchange 3,534,685
NASDAQ OMX 3,500,875
NYSE Euronext (Europe) 2,793,199
London Stock Exchange 2,773,395
Shanghai Stock Exchange 2,630,841
Hong Kong Exchanges 2,325,349
TSX Group 1,817,263
Bombay Stock Exchange 1,373,016
National Stock Exchange India 1,338,495
Source: World Federation of Exchanges As of March 31, 2010
Source: World Federation of Exchanges As of March 31, 2010
As of March 31, 2010
Number of Listed Companies on Major Stock Exchanges
TSE Ranks Second Globally in Total Market Capitalization
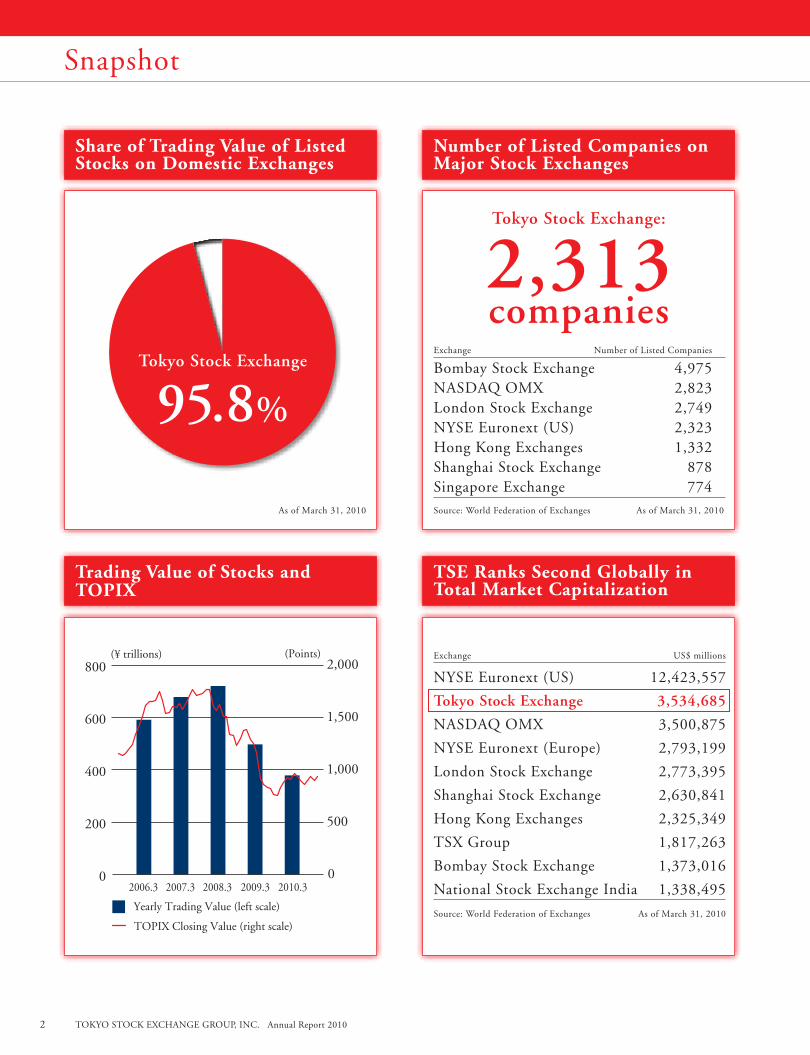
Share of Trading Value of Listed Stocks on Domestic Exchanges
Trading Value of Stocks and TOPIX
95.8%Tokyo Stock Exchange:Tokyo Stock Exchange
TOKYO STOCK EXCHANGE GROUP, INC. Annual Report 2010 3TOKYO STOCK EXCHANGE GROUP, INC. Annual Report 2010
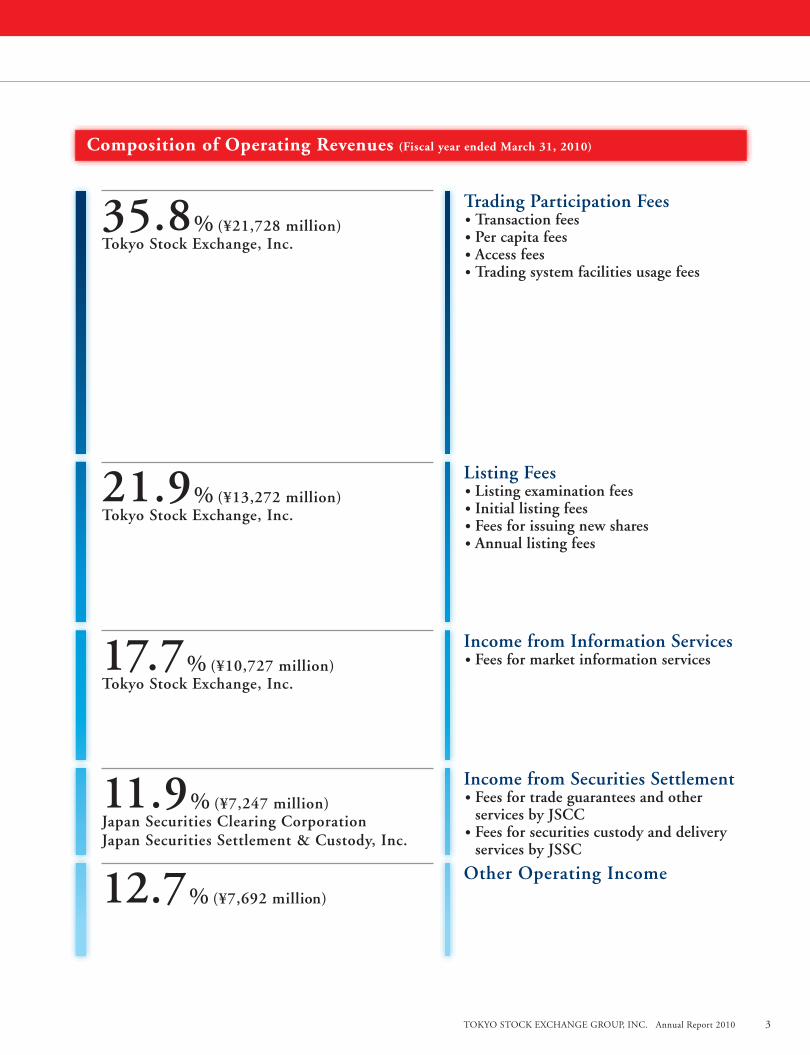
35.8% (¥21,728 million)Tokyo Stock Exchange, Inc.
Trading Participation Fees. Transaction fees. Per capita fees. Access fees. Trading system facilities usage fees
Listing Fees. Listing examination fees. Initial listing fees. Fees for issuing new shares. Annual listing fees
Income from Information Services. Fees for market information services
Income from Securities Settlement. Fees for trade guarantees and other services by JSCC. Fees for securities custody and delivery
services by JSSC
Other Operating Income
21.9% (¥13,272 million)Tokyo Stock Exchange, Inc.
17.7% (¥10,727 million)Tokyo Stock Exchange, Inc.
11.9% (¥7,247 million)Japan Securities Clearing CorporationJapan Securities Settlement & Custody, Inc.
12.7% (¥7,692 million)
Composition of Operating Revenues (Fiscal year ended March 31, 2010)
4 TOKYO STOCK EXCHANGE GROUP, INC. Annual Report 2010 TOKYO STOCK EXCHANGE GROUP, INC. Annual Report 2010
Financial Data US$ thousands6
¥ millions except per share data and ratios except per share data
2010.3 2009.3 2008.3 2007.3 2006.3 2010.3
FOR THE YEAR
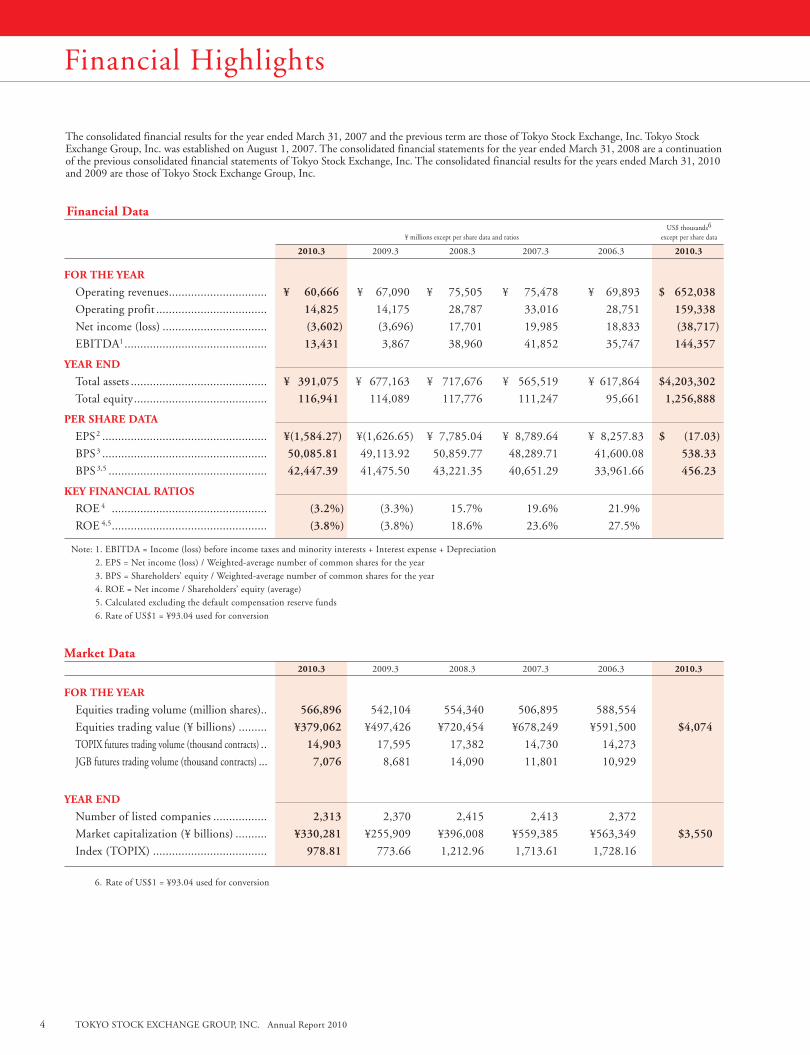
Operating revenues ............................... ¥ 60,666 ¥ 67,090 ¥ 75,505 ¥ 75,478 ¥ 69,893 $ 652,038
Operating profit ................................... 14,825 14,175 28,787 33,016 28,751 159,338
Net income (loss) ................................. (3,602) (3,696) 17,701 19,985 18,833 (38,717)
EBITDA1 ............................................. 13,431 3,867 38,960 41,852 35,747 144,357
YEAR END
Total assets ........................................... ¥ 391,075 ¥ 677,163 ¥ 717,676 ¥ 565,519 ¥ 617,864 $4,203,302
Total equity .......................................... 116,941 114,089 117,776 111,247 95,661 1,256,888
PER SHARE DATA
EPS2 .................................................... ¥(1,584.27) ¥(1,626.65) ¥ 7,785.04 ¥ 8,789.64 ¥ 8,257.83 $ (17.03)
BPS3 .................................................... 50,085.81 49,113.92 50,859.77 48,289.71 41,600.08 538.33
BPS 3,5 .................................................. 42,447.39 41,475.50 43,221.35 40,651.29 33,961.66 456.23
KEY FINANCIAL RATIOS
ROE 4 ................................................. (3.2%) (3.3%) 15.7% 19.6% 21.9%
ROE 4,5 ................................................. (3.8%) (3.8%) 18.6% 23.6% 27.5%
Note: 1. EBITDA = Income (loss) before income taxes and minority interests + Interest expense + Depreciation
2. EPS = Net income (loss) / Weighted-average number of common shares for the year
3. BPS = Shareholders’ equity / Weighted-average number of common shares for the year
4. ROE = Net income / Shareholders’ equity (average)
5. Calculated excluding the default compensation reserve funds
6. Rate of US$1 = ¥93.04 used for conversion
Market Data 2010.3 2009.3 2008.3 2007.3 2006.3 2010.3
FOR THE YEAR
Equities trading volume (million shares).. 566,896 542,104 554,340 506,895 588,554
Equities trading value (¥ billions) ......... ¥379,062 ¥497,426 ¥720,454 ¥678,249 ¥591,500 $4,074
TOPIX futures trading volume (thousand contracts) .. 14,903 17,595 17,382 14,730 14,273
JGB futures trading volume (thousand contracts) ... 7,076 8,681 14,090 11,801 10,929
YEAR END
Number of listed companies ................. 2,313 2,370 2,415 2,413 2,372
Market capitalization (¥ billions) .......... ¥330,281 ¥255,909 ¥396,008 ¥559,385 ¥563,349 $3,550
Index (TOPIX) .................................... 978.81 773.66 1,212.96 1,713.61 1,728.16
6. Rate of US$1 = ¥93.04 used for conversion
The consolidated financial results for the year ended March 31, 2007 and the previous term are those of Tokyo Stock Exchange, Inc. Tokyo Stock Exchange Group, Inc. was established on August 1, 2007. The consolidated financial statements for the year ended March 31, 2008 are a continuation of the previous consolidated financial statements of Tokyo Stock Exchange, Inc. The consolidated financial results for the years ended March 31, 2010 and 2009 are those of Tokyo Stock Exchange Group, Inc.
Financial Highlights
TOKYO STOCK EXCHANGE GROUP, INC. Annual Report 2010 5TOKYO STOCK EXCHANGE GROUP, INC. Annual Report 2010
2006.3 2007.3 2008.3 2009.3
80
60
40
20
0
(¥ billions)
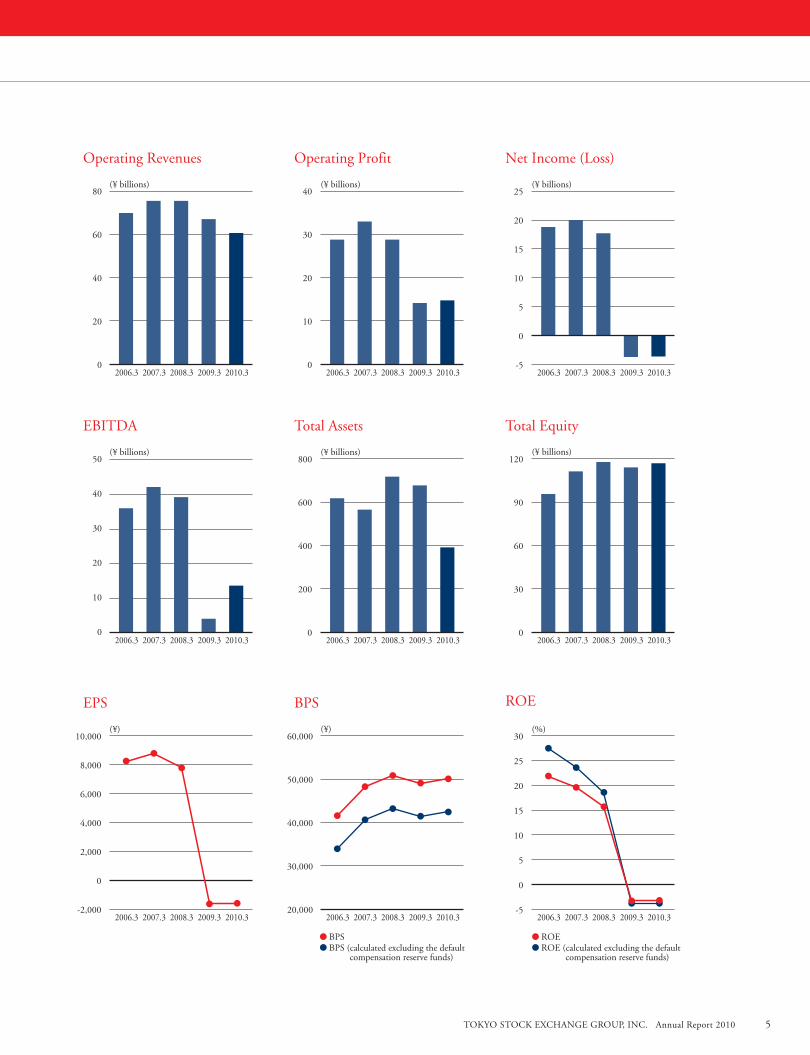
Operating Revenues
2006.3 2007.3 2008.3 2009.3
40
30
20
10
0
(¥ billions)
Operating Profit
2006.3 2007.3 2008.3 2009.3
50
40
30
20
10
0
(¥ billions)
EBITDA
2006.3 2007.3 2008.3 2009.3
25
20
15
10
0
5
-5
(¥ billions)
Net Income (Loss)
2006.3 2007.3 2008.3 2009.3
800
600
400
200
0
(¥ billions)
Total Assets
2006.3 2007.3 2008.3 2009.3
120
90
60
30
0
(¥ billions)
Total Equity
2006.3 2007.3 2008.3 2009.3
30
25
20
15
10
5
-5
(%)
ROE
0
ROEROE (calculated excluding the default compensation reserve funds)
2006.3 2007.3 2008.3 2009.3
(¥)
EPS
2006.3 2007.3 2008.3 2009.3
(¥)
BPS
10,000
8,000
6,000
4,000
2,000
-2,000
0
60,000
50,000
40,000
30,000
20,000
BPSBPS (calculated excluding the default compensation reserve funds)
2010.3 2010.3
2010.3
2010.3
2010.3 2010.3
2010.32010.3 2010.3
6 TOKYO STOCK EXCHANGE GROUP, INC. Annual Report 2010 TOKYO STOCK EXCHANGE GROUP, INC. Annual Report 2010
To Our Shareholders
Atsushi SaitoPresident & CEOTokyo Stock Exchange Group, Inc.
ProfileAtsushi Saito was with Nomura Securities Co. Ltd. for 35 years, starting in 1963.After 2 stints in New York, he became a member of the board in 1986 and Executive Vice President in 1995. Over the course of his career with Nomura, he took charge of a wide range of projects in different divisions including Treasury & Fixed Income Dealing, Equity, Syndicate & New Products, and so on. In the late 1980s he focused on securitization of non-performing loans in the United States such as Financial Center Building in Manhattan. Prior to becoming President & CEO of the TSE in June 2007, he tackled various revitalization projects as President & CEO of the Industrial Revitalization Corporation of Japan since its inception in 2003.
TOKYO STOCK EXCHANGE GROUP, INC. Annual Report 2010 7TOKYO STOCK EXCHANGE GROUP, INC. Annual Report 2010
Although the global economy underwent a financial crisis triggered by the bankruptcy of Lehman Brothers in the fall of 2008, cooperation between national governments and industry has supported a moderate recovery from the bottom in March 2009. However, fiscal problems emerged during 2010 in Greece and other Euro-zone countries, while the pace of economic recovery in the US is slowing. A steady recovery of the global economy is likely to require more time. Under these economic conditions, global capital flows into equity investments decreased substantially. While continued strong growth in developing countries such as China, India, and the countries of Southeast Asia is enhancing their economic importance, investor interest in Japanese equities has decreased. Moreover, remarkably fast-growing IT-driven ECNs, MTFs, and other off-exchange trading facilities are giving rise to noticeable issues such as market fragmentation, regulatory discrepancies between markets and free-riding on the self-regulatory functions of incumbent exchanges in the EU and US. In the near future, this trend is also likely to affect Japanese stock markets. The “flash crash” that occurred in the US in May 2010 is an example of a phenomenon arising from these factors. The TSE group (Tokyo Stock Exchange Group, Inc., Tokyo Stock Exchange, Inc., Tokyo Stock Exchange Regulation and other subsidiaries) is in the midst of a three-year medium-term management plan formulated in 2008. Its target is to create a “Universal Exchange”, a reliable and user-friendly market that attracts investors and listed companies from across the globe. The TSE group is working together to achieve this target through two basic strategies: (1) quantitative expansion, which involves diversifying lines of trading products and providing top-caliber trading systems; and (2) qualitative enhancement, which involves strengthening self-regulatory functions, including disseminating our message to facilitate enhanced corporate governance of listed companies and promote compliance among market participants. We are thus devoting our efforts to securing our position as the premier exchange for the effective flow of funds in Asia. Meanwhile, the significant changes in the global economy and market conditions are exerting a profound impact on the TSE group’s operating environment. To respond appropriately to these changes in light of the initiatives of the past two years and the current business environment, the TSE group will dedicate the final year of its medium-term management plan to constructing a robust profit structure by expanding the size of the market and constructing a growth framework on a diversified revenue base. At the same time, we will continue to strive for growth and the next leap forward by conducting highly active strategic marketing. The TSE group will be counting on the continued support and cooperation of all market users.
We are preparing for global economic recovery by constructing a robust profit structure as well as a growth framework for our next leap forward.
8 TOKYO STOCK EXCHANGE GROUP, INC. Annual Report 2010 TOKYO STOCK EXCHANGE GROUP, INC. Annual Report 2010
Based on the medium-term management plan formulated in 2008, the TSE has moved aggressively to generate new growth by further enhancing the value of the TSE markets while upgrading its infrastructure to satisfy the needs of participants. In particular, advances in information technology have given rise to off-exchange transactions in ECNs and MTFs, which have siphoned off significant liquidity from exchanges in major markets in the EU and US. Consequently, rapid and smooth execution of orders is a major factor determining the competitiveness of incumbent exchanges. The TSE has therefore devoted itself to fundamentally enhancing its trading systems as befits the premier exchange in Asia. The next-generation trading system “arrowhead”, launched in January 2010, is one of the major outcomes of this approach. Developed as a trading system with the world’s highest standards, “arrowhead” offers superior stability while dramatically shortening the time required for both order response and information distribution. Even in its early stages of operation, the system has achieved an order response time of 2.0 milliseconds and an information distribution time of 2.5 milliseconds. Moreover, “arrowhead” has brought about a significant evolution in the execution environment, with the daily average number of trades increasing from 300 to 400 per stock. As the participation of investors using sophisticated trading techniques such as high-frequency trading grows, we expect a wide array of investors in Japan and overseas will use this leading-edge trading system to buy and sell Japanese cash equity products. Furthermore, in October 2009 we renovated the options trading platform of the derivatives market with the launch of “Tdex+ System”, which is based on the trading system LIFFE CONNECT® of NYSE Liffe,a subsidiary of NYSE Euronext and one of the largest derivatives exchanges in Europe. This has equipped the TSE derivatives market with a world-class trading environment that boasts a greatly enhanced execution speed for options transactions and the ability to perform sophisticated strategy trading. The TSE has also begun offering a “Co-location Service” that minimizes the latency of order acceptance notices and quote information distribution between the systems of market users and exchange data centers by allowing trading participants to install order placement servers next to TSE trading systems. Meanwhile, one of the TSE group’s policies for quantitative expansion is to increase the number of exchange traded funds (ETFs) to provide investors with a diverse array of attractive investment opportunities. Over the past two years, the number of ETFs listed on the TSE increased by 52 to 86, and stood at 93 as of July 2010. We have been working to provide products that meet a wide range of investor needs by diversifying our product lineup. This
What is the TSE group’s status after two years of the medium-term management plan?
An Interview with President & CEO Atsushi Saito
Q1:
TOKYO STOCK EXCHANGE GROUP, INC. Annual Report 2010 9TOKYO STOCK EXCHANGE GROUP, INC. Annual Report 2010
includes commodity ETFs for gold and other precious metals, which have attracted interest as relatively safe investments, ETFs for global sovereign bonds, and emerging country equities. We also introduced dividend index futures and, in addition, will create a position transfer scheme with NYSE Liffe for TOPIX futures and other products in October 2010. As for qualitative enhancement, improving corporate governance of listed companies is a crucial management issue for us. We have worked to create an environment in which everyone can invest with confidence by dealing with corporate conduct that infringes significantly upon the rights of existing shareholders, such as capital increases through third-party allotments, which adversely affect the rights of minority shareholders. To protect the interests of general shareholders, we introduced the requirement for all listed companies to secure at least one independent director or auditor. Also, in light of recent changes in disclosure of corporate information, we amended the TSE rules to increase listed companies’ discretion and flexibility for reporting financial results.
Based on changes in the current business environment, the TSE group will dedicate the fiscal year ending March 2011 to constructing a robust profit structure by expanding the size of the market and constructing a growth framework on a diversified revenue base. Concurrently, the TSE group will continue to strive for growth and the next leap forward through highly active strategic marketing. We will support these activities through both quantitative expansion and qualitative enhancement – the basic strategies of the medium-term management plan. For quantitative expansion, we will strengthen derivatives markets by expanding the lineup of listed products and improving trading rules and frameworks. We will also add to the number of newly listed companies and ETFs to increase the depth of the cash
What is the TSE group’s business plan for thefiscal year ending March 2011?
Q2:
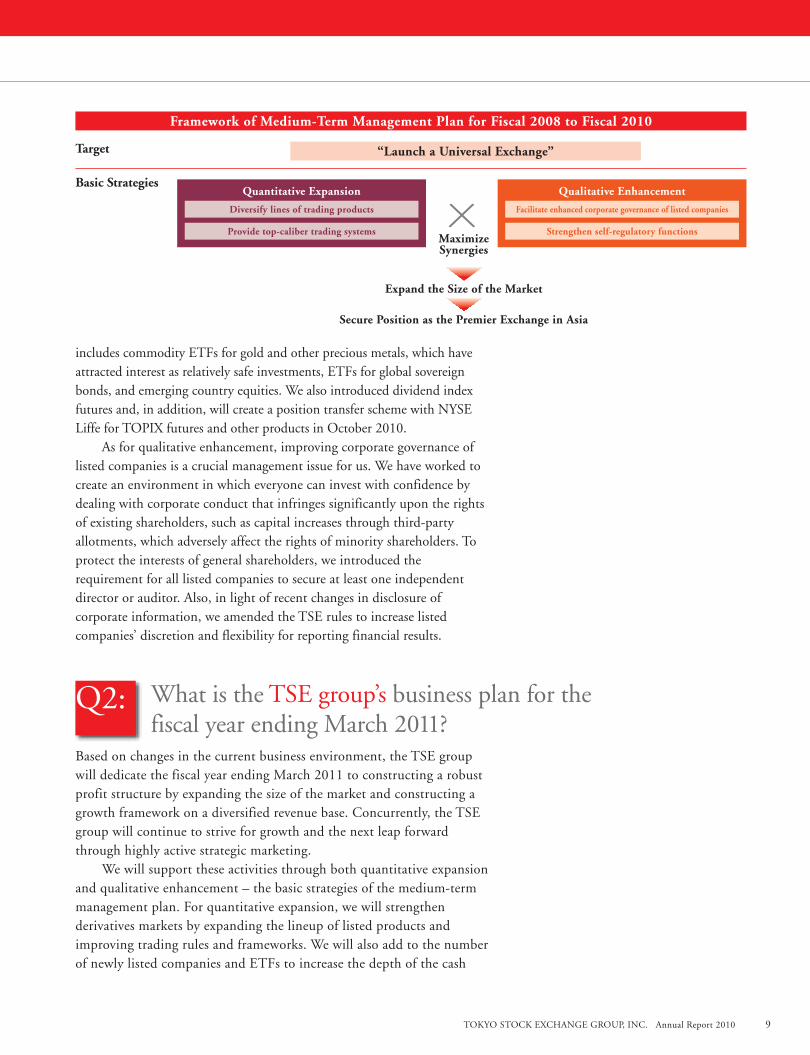
Framework of Medium-Term Management Plan for Fiscal 2008 to Fiscal 2010
“Launch a Universal Exchange”
Quantitative Expansion Qualitative Enhancement
Diversify lines of trading products Facilitate enhanced corporate governance of listed companies
Provide top-caliber trading systems Strengthen self-regulatory functionsX
Target
Basic Strategies
Secure Position as the Premier Exchange in Asia
Expand the Size of the Market
MaximizeSynergies
10 TOKYO STOCK EXCHANGE GROUP, INC. Annual Report 2010 TOKYO STOCK EXCHANGE GROUP, INC. Annual Report 2010
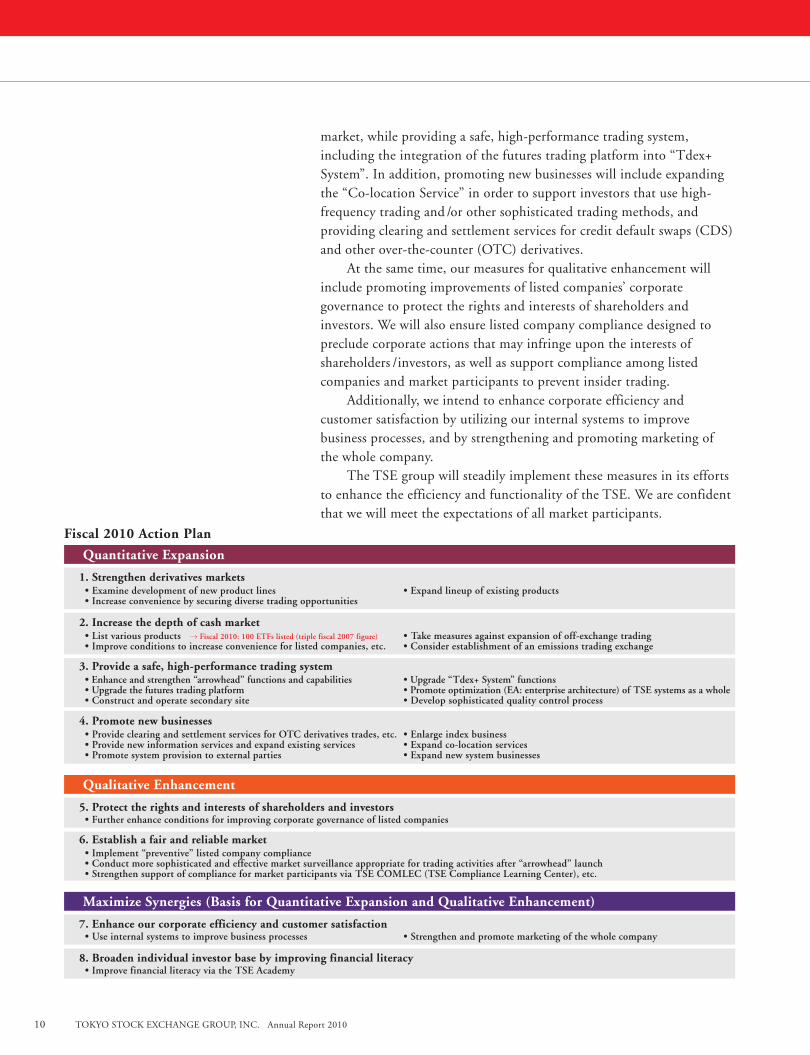
market, while providing a safe, high-performance trading system, including the integration of the futures trading platform into “Tdex+ System”. In addition, promoting new businesses will include expanding the “Co-location Service” in order to support investors that use high-frequency trading and /or other sophisticated trading methods, and providing clearing and settlement services for credit default swaps (CDS) and other over-the-counter (OTC) derivatives. At the same time, our measures for qualitative enhancement will include promoting improvements of listed companies’ corporate governance to protect the rights and interests of shareholders and investors. We will also ensure listed company compliance designed to preclude corporate actions that may infringe upon the interests of shareholders /investors, as well as support compliance among listed companies and market participants to prevent insider trading. Additionally, we intend to enhance corporate efficiency and customer satisfaction by utilizing our internal systems to improve business processes, and by strengthening and promoting marketing of the whole company. The TSE group will steadily implement these measures in its efforts to enhance the efficiency and functionality of the TSE. We are confident that we will meet the expectations of all market participants.
An Interview with President & CEO Atsushi Saito
Quantitative Expansion
Qualitative Enhancement
Maximize Synergies (Basis for Quantitative Expansion and Qualitative Enhancement)
1. Strengthen derivatives markets •Examinedevelopmentofnewproductlines •Expandlineupofexistingproducts •Increaseconveniencebysecuringdiversetradingopportunities
5. Protect the rights and interests of shareholders and investors •Furtherenhanceconditionsforimprovingcorporategovernanceoflistedcompanies
7. Enhance our corporate efficiency and customer satisfaction •Useinternalsystemstoimprovebusinessprocesses •Strengthenandpromotemarketingofthewholecompany
2. Increase the depth of cash market •Listvariousproducts → Fiscal 2010: 100 ETFs listed (triple fiscal 2007 figure) •Takemeasuresagainstexpansionofoff-exchangetrading •Improveconditionstoincreaseconvenienceforlistedcompanies,etc. •Considerestablishmentofanemissionstradingexchange
6. Establish a fair and reliable market •Implement“preventive”listedcompanycompliance •Conductmoresophisticatedandeffectivemarketsurveillanceappropriatefortradingactivitiesafter“arrowhead”launch •StrengthensupportofcomplianceformarketparticipantsviaTSECOMLEC(TSEComplianceLearningCenter),etc.
8. Broaden individual investor base by improving financial literacy •ImprovefinancialliteracyviatheTSEAcademy
3. Provide a safe, high-performance trading system •Enhanceandstrengthen“arrowhead”functionsandcapabilities •Upgrade“Tdex+System”functions •Upgradethefuturestradingplatform •Promoteoptimization(EA:enterprisearchitecture)ofTSEsystemsasawhole •Constructandoperatesecondarysite •Developsophisticatedqualitycontrolprocess
4. Promote new businesses •ProvideclearingandsettlementservicesforOTCderivativestrades,etc. •Enlargeindexbusiness •Providenewinformationservicesandexpandexistingservices •Expandco-locationservices •Promotesystemprovisiontoexternalparties •Expandnewsystembusinesses
Fiscal 2010 Action Plan
TOKYO STOCK EXCHANGE GROUP, INC. Annual Report 2010 11TOKYO STOCK EXCHANGE GROUP, INC. Annual Report 2010
While the recovery of the global economy will require more time, the TSE group will properly meet all market users’ needs as it steadily increases convenience and improves its ability to attract investment in its markets. We intend to actively contribute to economic growth in Japan and the region as the premier exchange in Asia by allocating global risk capital to growing companies.
As is well known, the financial crisis triggered by the bankruptcy of Lehman Brothers immediately swept through global markets. Advances in financial engineering have realized sophisticated financial products such as derivatives, but the recent subprime loan problem, which involved complex financial instruments traded in the OTC market, magnified the crisis. The resulting credit crunch quickly spread through the world’s financial markets, leading to a renewed focus on counterparty risk. In contrast to this, exchanges continuously provide market functions, while reducing counterparty risk by accurately identifying market risks through clearing institutions, thus fulfilling a legitimate and worthwhile social function. They have proven their ability to allocate risk efficiently via the market throughout their history, and no one can dispute exchanges’ exceptionally important role in the capital market. However, the concern is that the financial crisis provides momentum to the introduction of excessive regulation in the EU and US, which could interfere with market efficiency. Certainly, the crisis exposed issues such as unethical and negligent conduct among some financial institutions, in which corporate governance is superseded in the pursuit of profit, and also tolerance of laissez faire free markets through a lack of rules and regulations. However, this is not an acceptable justification for the introduction of excessive regulation that contravenes the original adjustment mechanisms of markets. The TSE group believes that it is responsible for continuously making every effort to increase market transparency and efficiency so that it can best exercise appropriate market functions under any circumstances and provide a free market open to everyone. Especially during times of global economic instability, exchanges must provide an important infrastructure that supports the capital markets and fulfill their social responsibility in a stable and sustainable manner. With countries in the EU and the US struggling under recession, a new age is beginning in which Asian countries such as China and India are the engines of economic growth in the world. As an institution that promotes the public good and supports the capital markets of Japan, Asia’s most advanced core market, the TSE group will devote itself to becoming the bridge linking the region to financial markets all over the world.
An Interview with President & CEO Atsushi Saito
What has the TSE group learned from the experience of the global financial crisis, and where is it heading in the future?
Q3:
TOKYO STOCK EXCHANGE GROUP, INC. Annual Report 2010TOKYO STOCK EXCHANGE GROUP, INC. Annual Report 201012
Cash Equities Market Financial technology has become more advanced over the
past several years. Online trading has become prevalent
among individual investors, while high-frequency trading,
algorithmic trading and other new trading techniques have
come into wide use among securities companies and
institutional investors. These changes in the market
environment have increased the need among market users
for high-speed order placement, execution processing and
information distribution, as well as requiring the TSE to
respond to sudden increases in order volume. Moving to
resolve these issues, the TSE launched “arrowhead”, a next-
generation equities trading system, in January 2010.
While upgrading market infrastructure, the TSE has
also focused on expanding the number of ETFs to provide
investors with a diverse range of investment opportunities,
which is one of the core elements of its medium-term
management plan.
ETFs allow diversified investment in various products
at low cost using a relatively small amount of funds. In
order to enable the creation of a variety of products, the
TSE needed to encourage related government authorities to
prepare a statutory framework and was also required to
revise its listing rules and systems. Therefore, over the past
several years the TSE has resolved these issues one by one in
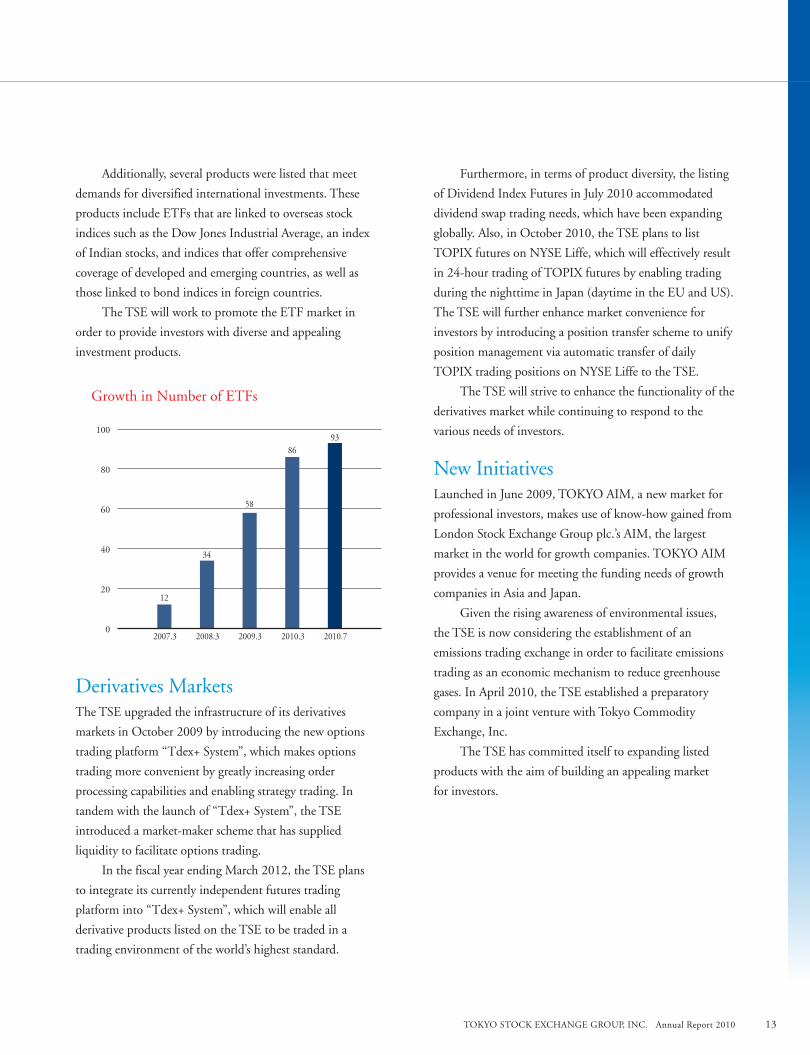
preparing a foundation for the expansion of ETFs. As a
result, against the backdrop of rising interest in
commodities investment, the number of listed commodity
ETFs has increased substantially, bringing the total number
of listed issues from 58 as of March 31, 2009 to 93 as of
July 31, 2010.
As a result of this development, investment in
commodities such as precious metals, energy, and
agricultural products, which have been a focus in recent
years, can be conducted conveniently through ETFs.
Moreover, in July 2010 four unique ETFs were listed that
are physically backed by precious metals and give investors
the option to redeem ETF units for physical delivery of
precious metals from the custodian in Japan.
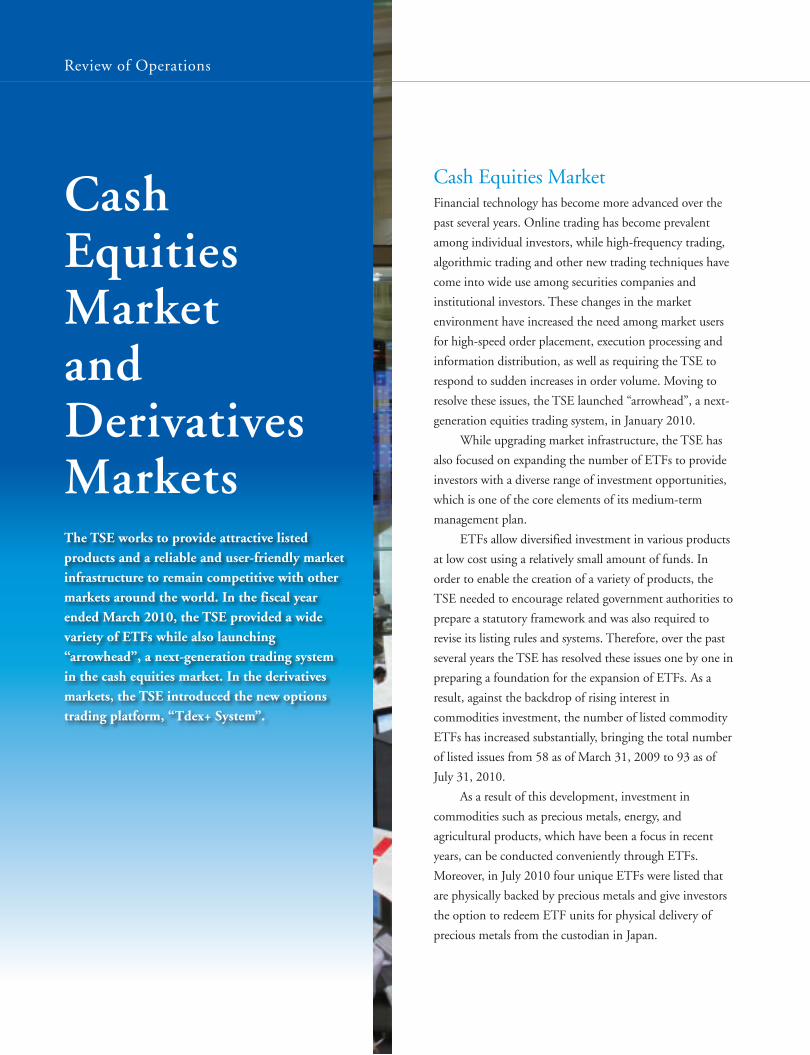
The TSE works to provide attractive listed products and a reliable and user-friendly market infrastructure to remain competitive with other markets around the world. In the fiscal year ended March 2010, the TSE provided a wide variety of ETFs while also launching “arrowhead”, a next-generation trading system in the cash equities market. In the derivatives markets, the TSE introduced the new options trading platform, “Tdex+ System”.
Review of Operations
CashEquitiesMarketandDerivativesMarkets
13TOKYO STOCK EXCHANGE GROUP, INC. Annual Report 2010
Additionally, several products were listed that meet
demands for diversified international investments. These
products include ETFs that are linked to overseas stock
indices such as the Dow Jones Industrial Average, an index
of Indian stocks, and indices that offer comprehensive
coverage of developed and emerging countries, as well as
those linked to bond indices in foreign countries.
The TSE will work to promote the ETF market in
order to provide investors with diverse and appealing
investment products.
Derivatives Markets The TSE upgraded the infrastructure of its derivatives
markets in October 2009 by introducing the new options
trading platform “Tdex+ System”, which makes options
trading more convenient by greatly increasing order
processing capabilities and enabling strategy trading. In
tandem with the launch of “Tdex+ System”, the TSE
introduced a market-maker scheme that has supplied
liquidity to facilitate options trading.
In the fiscal year ending March 2012, the TSE plans
to integrate its currently independent futures trading
platform into “Tdex+ System”, which will enable all
derivative products listed on the TSE to be traded in a
trading environment of the world’s highest standard.
Furthermore, in terms of product diversity, the listing
of Dividend Index Futures in July 2010 accommodated
dividend swap trading needs, which have been expanding
globally. Also, in October 2010, the TSE plans to list
TOPIX futures on NYSE Liffe, which will effectively result
in 24-hour trading of TOPIX futures by enabling trading
during the nighttime in Japan (daytime in the EU and US).
The TSE will further enhance market convenience for
investors by introducing a position transfer scheme to unify
position management via automatic transfer of daily
TOPIX trading positions on NYSE Liffe to the TSE.
The TSE will strive to enhance the functionality of the
derivatives market while continuing to respond to the
various needs of investors.
New Initiatives Launched in June 2009, TOKYO AIM, a new market for
professional investors, makes use of know-how gained from
London Stock Exchange Group plc.’s AIM, the largest
market in the world for growth companies. TOKYO AIM
provides a venue for meeting the funding needs of growth
companies in Asia and Japan.
Given the rising awareness of environmental issues,
the TSE is now considering the establishment of an
emissions trading exchange in order to facilitate emissions
trading as an economic mechanism to reduce greenhouse
gases. In April 2010, the TSE established a preparatory
company in a joint venture with Tokyo Commodity
Exchange, Inc.
The TSE has committed itself to expanding listed
products with the aim of building an appealing market
for investors.None148 companies (6.4%)
2007.3 2008.3 2009.3 2010.3
100
80
60
40
20
0
Growth in Number of ETFs
2010.7
12
34
58
8693
Number of Independent Directors/Auditors Secured(As of June 30, 2010)
1 Director/Auditor1,104 companies (48.0%)
12 Directors/Auditors1 company (0.5%)
8 Directors/Auditors7 companies (0.3%)
7 Directors/Auditors11 companies (0.5%)
9 Directors/Auditors1 company (0.5%)
2 Directors/Auditors527 companies (22.9%)
3 Directors/Auditors282 companies (12.3%)
4 Directors/Auditors112 companies (4.9%)
5 Directors/Auditors74 companies (3.2%)
6 Directors/Auditors34 companies (1.5%)
Total Number ofCompanies That HaveSecured IndependentDirectors/Auditors
2,153 (93.6%)
Review of Operations
TOKYO STOCK EXCHANGE GROUP, INC. Annual Report 2010TOKYO STOCK EXCHANGE GROUP, INC. Annual Report 201014
arrowhead: Equities and Convertible Bonds Auction Trading
In January 2010, the TSE launched the next-generation
trading system “arrowhead”. The drastic revision of the
previous system design has remarkably improved speed,
reliability and scalability. Trading rules were also
substantially revised based on global trading practices from
the perspective of smooth price discovery and improved
market liquidity. Thus the TSE is optimizing its trading
environment both in terms of system infrastructure and
trading rules.
Specifically, the introduction of “arrowhead” enables
an order response time of approximately 2 milliseconds and
an information distribution time of approximately 2.5
milliseconds. High-speed trading and market information
at the millisecond level enables real-time response to market
trends during trading, and is expected to facilitate enhanced
liquidity and creation of new business models through the
participation of investors using sophisticated trading
methods such as high-frequency trading.
The TSE’s measures to make trading smoother have
included revising daily price limits and relaxing matching
As financial technology continues to become more advanced, employing exchange systems of superior quality to provide a more user-oriented trading environment is an essential element for success in the increasingly intense international competition among securities markets. In response to this changing environment, during the fiscal year ended March 2010, the TSE significantly strengthened its IT infrastructure by launching two systems which meet the world’s highest standards: the next-generation equities trading system “arrowhead” and the new options trading platform, “Tdex+ System”. The TSE is now reviewing the integration of its futures trading platform into “Tdex+ System” in order to provide high-caliber trading systems for all products in the near future.
Review of Operations
ITInfrastructure
Speed:Order response time of approx. 2 milliseconds, information distribution time of approx. 2.5 milliseconds (during continuous auction)
Reliability:Highly reliable in processing trading information such as incoming orders, executions, and the current orderbookonsynchronized3-nodedataservers
Scalability: Achieves scalability by ensuring twice the maximum processing capacity of actual conditions on a continuous basis
15TOKYO STOCK EXCHANGE GROUP, INC. Annual Report 2010
conditions when the opening price is decided. Also,
“arrowhead” enables finer-tuned trading by reducing
tick sizes based on the characteristics of stocks, which
has made equity trading on the TSE market
significantly more functional and efficient.
The introduction of “arrowhead” has transformed
the TSE trading environment into one of the world’s
most advanced markets. The TSE will take advantage of
the strong international competitiveness resulting from
the introduction of the new trading system to respond
to the expectations of all investors as the premier market
in Asia.
Tdex+ System: Options Trading
The TSE replaced its system for options trading in October
2009 when it launched the new “Tdex+ System”. Based on
the LIFFE CONNECT® trading system used by NYSE
Liffe, one of largest derivatives exchanges in Europe, the
TSE constructed “Tdex+ System” as an options trading
platform with a processing capability of the highest caliber
(order response time of about 6 milliseconds).
In conjunction with the start of this new system’s
operations, the TSE introduced a new market-maker
scheme and aligned its trading rules with international
standards to secure liquidity for the TSE options market
and enhance convenience for investors around the world.
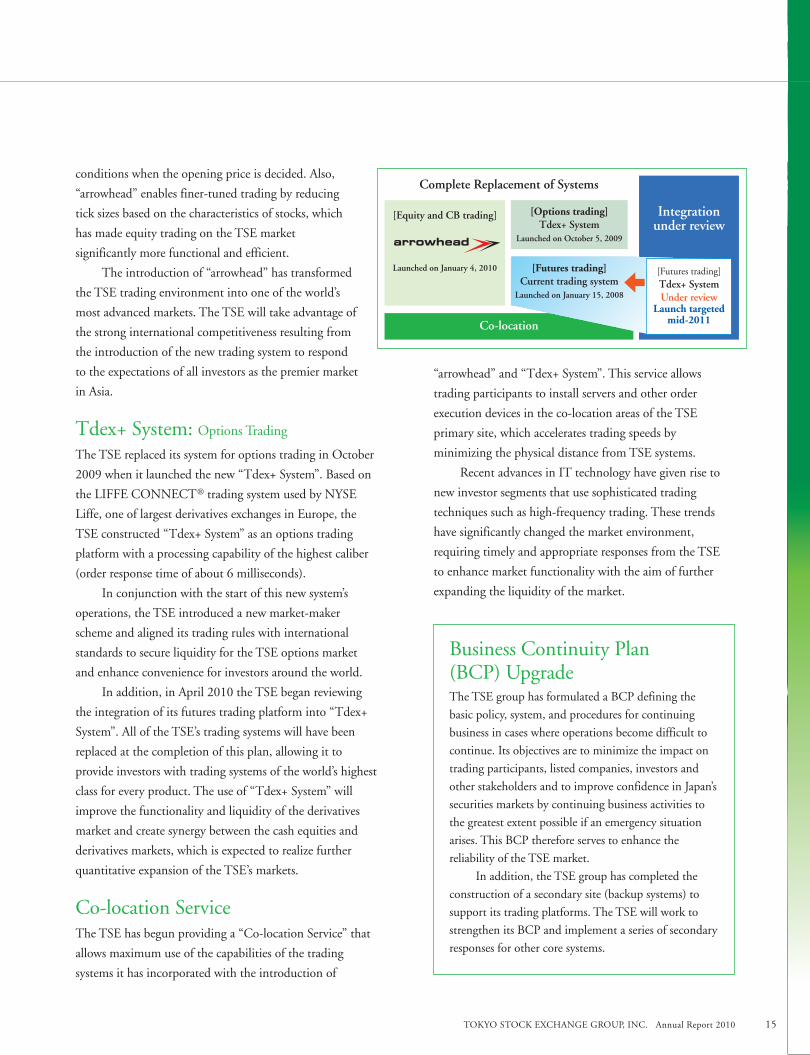
In addition, in April 2010 the TSE began reviewing
the integration of its futures trading platform into “Tdex+
System”. All of the TSE’s trading systems will have been
replaced at the completion of this plan, allowing it to
provide investors with trading systems of the world’s highest
class for every product. The use of “Tdex+ System” will
improve the functionality and liquidity of the derivatives
market and create synergy between the cash equities and
derivatives markets, which is expected to realize further
quantitative expansion of the TSE’s markets.
Co-location Service The TSE has begun providing a “Co-location Service” that
allows maximum use of the capabilities of the trading
systems it has incorporated with the introduction of
“arrowhead” and “Tdex+ System”. This service allows
trading participants to install servers and other order
execution devices in the co-location areas of the TSE
primary site, which accelerates trading speeds by
minimizing the physical distance from TSE systems.
Recent advances in IT technology have given rise to
new investor segments that use sophisticated trading
techniques such as high-frequency trading. These trends
have significantly changed the market environment,
requiring timely and appropriate responses from the TSE
to enhance market functionality with the aim of further
expanding the liquidity of the market.
Business Continuity Plan(BCP) Upgrade The TSE group has formulated a BCP defining the
basic policy, system, and procedures for continuing
business in cases where operations become difficult to
continue. Its objectives are to minimize the impact on
trading participants, listed companies, investors and
other stakeholders and to improve confidence in Japan’s
securities markets by continuing business activities to
the greatest extent possible if an emergency situation
arises. This BCP therefore serves to enhance the
reliability of the TSE market.
In addition, the TSE group has completed the
construction of a secondary site (backup systems) to
support its trading platforms. The TSE will work to
strengthen its BCP and implement a series of secondary
responses for other core systems.
Review of Operations
Complete Replacement of Systems
[Equity and CB trading]
Co-location
[Options trading]Tdex+System
Launched on October 5, 2009
Integrationunder review
Launched on January 4, 2010 [Futures trading]Current trading system
Launched on January 15, 2008
[Futures trading]Tdex+SystemUnderreview
Launch targeted mid-2011
16 TOKYO STOCK EXCHANGE GROUP, INC. Annual Report 2010TOKYO STOCK EXCHANGE GROUP, INC. Annual Report 2010
Improving the TSE’s Listing Rules and SystemsIn summer 2008, prior to implementing concrete steps to
improve the corporate governance of listed companies, the
TSE solicited a wide variety of opinions from and held
hearings with institutional investors and other related
parties in order to identify and resolve corporate
governance issues of listed companies.
Based on the opinions and requests obtained through
this process, the TSE amended its listing rules and systems
twice during 2009. First, in August 2009, the TSE
introduced restrictions on third-party allotments that
infringe upon the rights of existing shareholders. Then,
with shareholder rights and interests in mind, in December
2009 the TSE introduced the obligation of listed
companies to have an independent director or auditor. The
TSE also implemented other measures to further enhance
corporate governance through improved dialogue between
shareholders and listed companies. An overview of these
latest amendments to the TSE’s listing rules and systems
are as follows.
Introduction of Rules forThird-Party AllotmentsUnder the Companies Act in Japan, if so stipulated by a
company’s articles of incorporation, the Board of Directors
may resolve to issue new shares up to a maximum of three
times the number of shares issued and outstanding without
the specific approval of the general meeting of
shareholders. Consequently, from the existing shareholders’
point of view, significant dilution of their equity ownership
could occur. Comparative opinions gathered from
institutional investors also underscore serious issues
because in the markets of the EU and US, the general
meeting of shareholders must approve the issue of new
shares, and existing shareholders have the pre-emptive
rights of first refusal in the event of such allotments. Most
important, third-party allotments in which the Board of
Directors decides the recipients of the new shares reduce
the effectiveness of corporate governance because they
allow the management to select controlling shareholders.
The TSE believes that effective corporate governance is an indispensable element of corporate activities, through which listed companies generate sustained increases in corporate value. In particular, the experience of the financial crisis of 2008 created a strong interest among investors in improving the corporate governance of listed companies. The TSE makes an effort to maintain an environment in which investors can investwith confidence. In order to fulfill its responsibilities as a venue for high-quality risk capital from Japan and overseas, the TSE is working actively to improve the corporate governance of listed companies.
Review of Operations
Improvingthe CorporateGovernance ofListedCompanies
16
17TOKYO STOCK EXCHANGE GROUP, INC. Annual Report 2010
Therefore, in August 2009 the TSE amended the
regulations regarding third-party allotments by introducing a
restriction on such allotments in order to protect shareholder
rights against unfair infringement. The amendment of the
rules included the following.
First, for third-party allotments that involve the issuance
of new shares equivalent to 25 percent or more of
outstanding shares or a change in control of a listed company,
the listed company is obliged to employ procedures that
increase consent among existing shareholders.
In the event of such third-party allotments, the Board
of Directors must complement its resolutions by obtaining
the opinions of persons who are independent from the
management, such as an independent committee, or
receiving approval from the general meeting of shareholders.
In addition, the status of a third-party allotment that
results in a change in the controlling shareholder must be
monitored for three years after such allotment so that the
recipient of shares that became the new controlling
shareholder cannot coerce the listed company into
disadvantageous transactions. This mechanism was
introduced to constrain and prevent problematic conduct.
Second, the basis for calculating the price of shares
issued as a result of a third-party allotment must be disclosed
appropriately. Moreover, a listed company is obliged to
properly disclose the opinion of an auditor or Board of
Auditors with the authority and responsibility for auditing
legality so that the issue price does not unduly favor the
recipient of such allotment.
In December 2009, the above items were included in
the securities registration statement, etc., which companies
must submit to the Financial Services Agency (FSA) in
accordance with the Financial Instruments and Exchange
Act, with false statements to be deemed legal violations that
are subject to criminal penalty.
Securing IndependentDirectors/AuditorsThe corporate governance principles that the Organization for
Economic Cooperation and Development (OECD) amended
in 2004 call for boards of directors to make objective,
independent decisions about their companies’ operations.
Under the Companies Act of Japan, it is required that listed
companies that employ a Board of Auditors, which make up
the majority of listed companies, appoint at least two outside
auditors (at least half of the Board of Auditors). Furthermore,
the portion of listed companies that employ a committee
system are obliged to elect two or more outside directors for
each committee (more than half the number of members of
each committee). However, some have pointed out that
adequate consideration is not taken for the requirements for
these outside auditors and directors in terms of independence
from the management, compared to the systems used in other
countries. In view of protecting the interests of shareholders,
the presence of directors and auditors with an independent
stance who are not likely to be in conflict with shareholder
interests is an extremely important component of the
minimum corporate governance framework for listed
companies.
Therefore, in December 2009 the TSE moved to amend
its rules to oblige listed companies to secure one or more
independent directors or auditors who are not likely to have a
conflict of interest with shareholders in order to protect
shareholder interests.
The revised regulations were applied successively starting
from the general meetings of shareholders held in June for the
fiscal year ended March 2010. As of June 30, 2010,
approximately 94 percent of listed companies had secured one
or more independent directors or auditors. Listed companies
with a market capitalization of JPY 1 trillion or more secured
an average of 4.6 independent directors or auditors.
Review of Operations
18 TOKYO STOCK EXCHANGE GROUP, INC. Annual Report 2010 TOKYO STOCK EXCHANGE GROUP, INC. Annual Report 2010
In addition to the above, in December 2009 the TSE
amended its regulations to enable more flexible fund raising
by allotting transferable subscription warrants to existing
shareholders, also known as a “rights issue”. Numerous
other developments enhanced the usability of rights issues,
including the Financial Services Agency’s revision of
offering disclosure regulations.
Moreover, to improve corporate governance through
facilitating a dialogue between shareholders and listed
companies, the TSE improved conditions for voting in
the general meeting of shareholders by requiring all listed
companies to provide notice of the general meeting of
shareholders and make it available on the TSE website
(successively implemented from the annual general
meetings of shareholders in June 2010). Also, in October
2009 the TSE requested listed companies to proactively
disclose the results of the exercise of voting rights (tally
of “for” and “against” votes for agenda items). In
addition, the Financial Services Agency requires listed
companies to disclose the results of the exercise of voting
rights of the general shareholders meetings by
Extraordinary Reports, beginning with the regular
meetings convened in June 2010.
The TSE is improving the transparency and fairness of
its markets and, with a view to enhancing its international
competitiveness, continues its efforts to enhance the
corporate governance of listed companies in cooperation
with related parties.
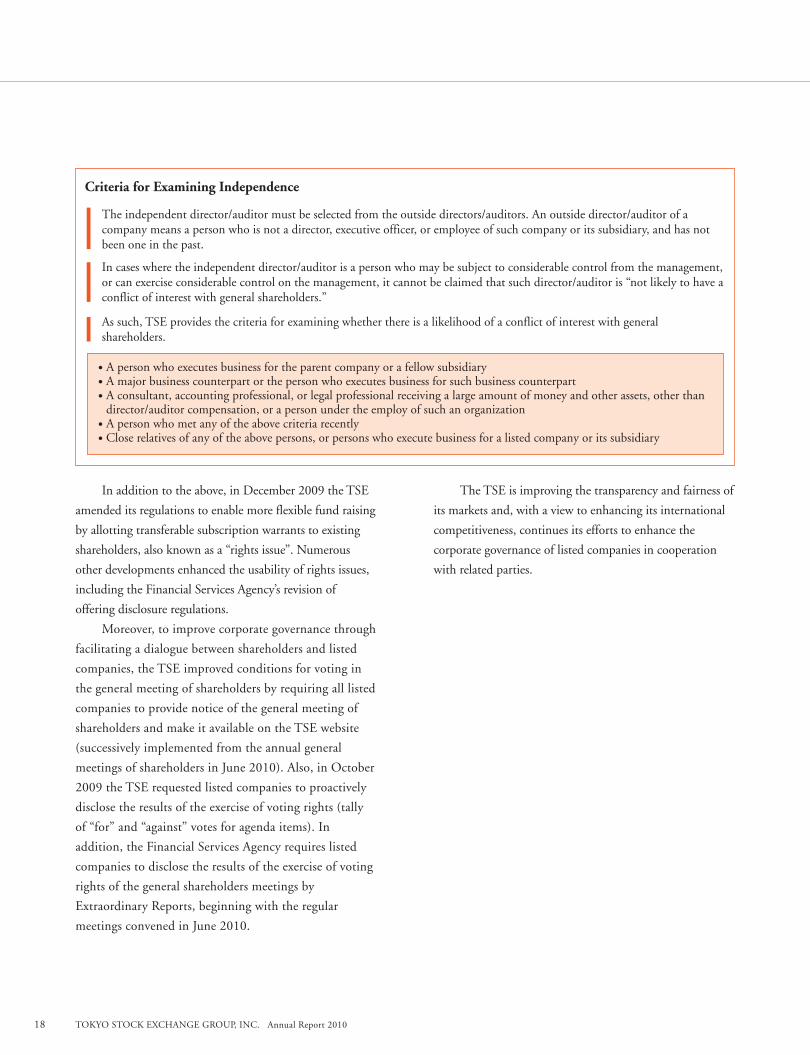
Criteria for Examining Independence
The independent director/auditor must be selected from the outside directors/auditors. An outside director/auditor of a company means a person who is not a director, executive officer, or employee of such company or its subsidiary, and has not been one in the past.
In cases where the independent director/auditor is a person who may be subject to considerable control from the management, or can exercise considerable control on the management, it cannot be claimed that such director/auditor is “not likely to have a conflict of interest with general shareholders.”
As such, TSE provides the criteria for examining whether there is a likelihood of a conflict of interest with general shareholders.
• A person who executes business for the parent company or a fellow subsidiary• A major business counterpart or the person who executes business for such business counterpart • A consultant, accounting professional, or legal professional receiving a large amount of money and other assets, other than
director/auditor compensation, or a person under the employ of such an organization • A person who met any of the above criteria recently• Close relatives of any of the above persons, or persons who execute business for a listed company or its subsidiary
Review of Operations
TOKYO STOCK EXCHANGE GROUP, INC. Annual Report 2010 19TOKYO STOCK EXCHANGE GROUP, INC. Annual Report 2010
Creating a market where investors can invest with confidence is an extremely important aspect for fulfilling market functions. The TSE entrusts Tokyo Stock Exchange Regulation (TSE Regulation) with the responsibility for maintaining the fairness and reliability of the markets, and as such, for ensuring their quality. TSE Regulation fulfills appropriate self-regulatory functions in working to structure the TSE market so that all investors can invest with confidence.
Self-Regulation
Overview of Activities Market surveillance plays a crucial part in market fairness
and reliability. TSE Regulation performs detailed
monitoring of daily transactions and conducts surveillance
for unfair transactions such as market manipulation and
insider trading. If the results of this surveillance indicate
possible violations of laws or the TSE rules by trading
participants or listed companies, TSE Regulation
implements rigorous measures and reports the results of all
investigations to the government authorities. For example,
TSE Regulation performs inspections of all the disclosure
materials of listed companies containing material
information to determine whether any insider trading has
occurred. Where the market surveillance system of TSE
Regulation identifies stocks whose price or trading volume
seems abnormal, TSE Regulation also surveys such stocks
for manipulation and analyzes specific transactions. TSE
Regulation has enhanced the functions of its surveillance
system in conjunction with the introduction of “arrowhead”
to create a system for conducting even more efficient and
effective surveillance activities. When conducting these
activities, TSE
Regulation
coordinates closely
with not only the
TSE but also
securities companies,
listed companies and
government
authorities.
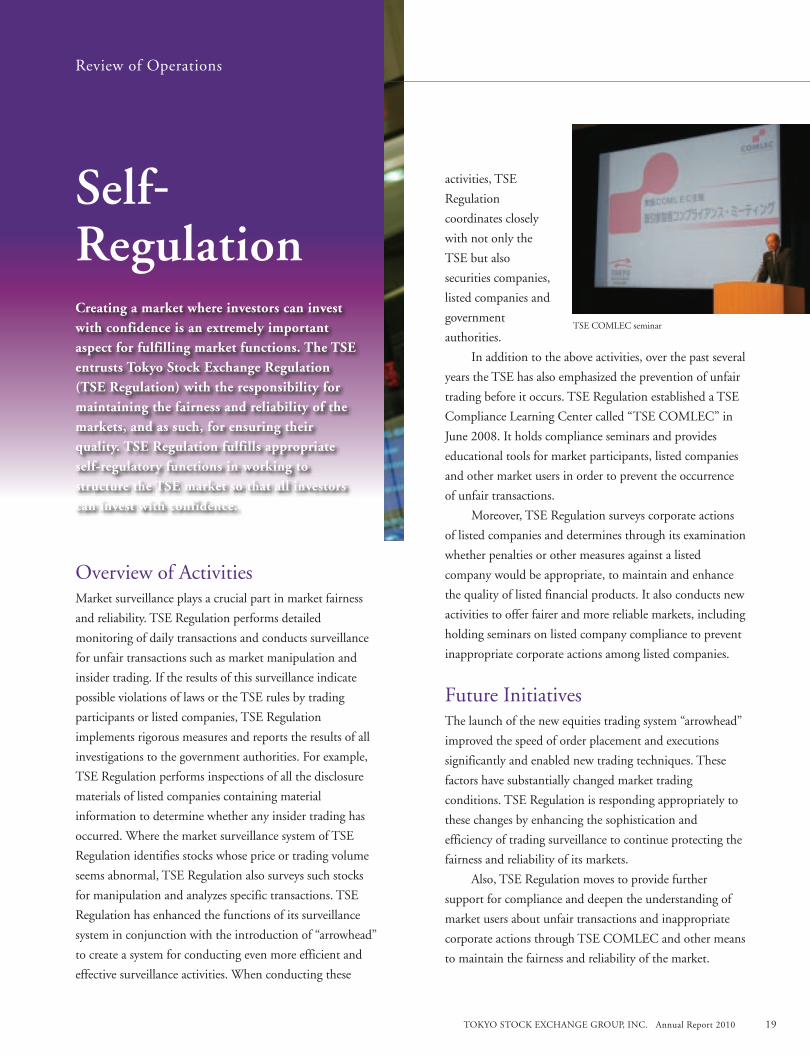
In addition to the above activities, over the past several
years the TSE has also emphasized the prevention of unfair
trading before it occurs. TSE Regulation established a TSE
Compliance Learning Center called “TSE COMLEC” in
June 2008. It holds compliance seminars and provides
educational tools for market participants, listed companies
and other market users in order to prevent the occurrence
of unfair transactions.
Moreover, TSE Regulation surveys corporate actions
of listed companies and determines through its examination
whether penalties or other measures against a listed
company would be appropriate, to maintain and enhance
the quality of listed financial products. It also conducts new
activities to offer fairer and more reliable markets, including
holding seminars on listed company compliance to prevent
inappropriate corporate actions among listed companies.
Future Initiatives The launch of the new equities trading system “arrowhead”
improved the speed of order placement and executions
significantly and enabled new trading techniques. These
factors have substantially changed market trading
conditions. TSE Regulation is responding appropriately to
these changes by enhancing the sophistication and
efficiency of trading surveillance to continue protecting the
fairness and reliability of its markets.
Also, TSE Regulation moves to provide further
support for compliance and deepen the understanding of
market users about unfair transactions and inappropriate
corporate actions through TSE COMLEC and other means
to maintain the fairness and reliability of the market.
Review of Operations
TSE COMLEC seminar
Review of Operations
20 TOKYO STOCK EXCHANGE GROUP, INC. Annual Report 2010 TOKYO STOCK EXCHANGE GROUP, INC. Annual Report 2010
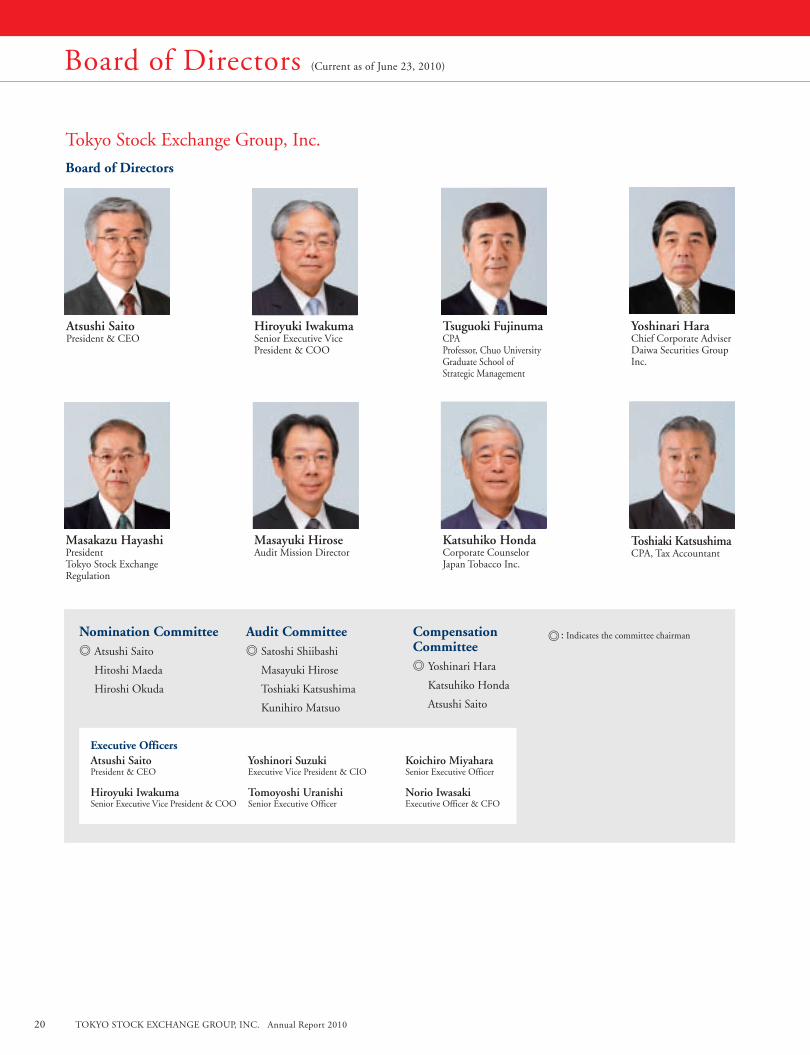
Yoshinari HaraChief Corporate AdviserDaiwa Securities Group Inc.
Toshiaki KatsushimaCPA, Tax Accountant
Atsushi SaitoPresident & CEO
MasakazuHayashiPresident Tokyo Stock Exchange Regulation
Hiroyuki IwakumaSenior Executive Vice President & COO
Masayuki HiroseAudit Mission Director
Tsuguoki FujinumaCPAProfessor, Chuo University Graduate School of Strategic Management
Katsuhiko HondaCorporate CounselorJapan Tobacco Inc.
Tokyo Stock Exchange Group, Inc.
Board of Directors
Board of Directors (Current as of June 23, 2010)
Nomination Committee◎ Atsushi Saito
Hitoshi Maeda
Hiroshi Okuda
Audit Committee◎ Satoshi Shiibashi
Masayuki Hirose
Toshiaki Katsushima
Kunihiro Matsuo
Compensation Committee◎ Yoshinari Hara
Katsuhiko Honda
Atsushi Saito
Executive OfficersAtsushi SaitoPresident & CEO
Hiroyuki IwakumaSenior Executive Vice President & COO
YoshinoriSuzukiExecutive Vice President & CIO
TomoyoshiUranishiSenior Executive Officer
Koichiro MiyaharaSenior Executive Officer
Norio IwasakiExecutive Officer & CFO
◎ : Indicates the committee chairman
TOKYO STOCK EXCHANGE GROUP, INC. Annual Report 2010 21TOKYO STOCK EXCHANGE GROUP, INC. Annual Report 2010
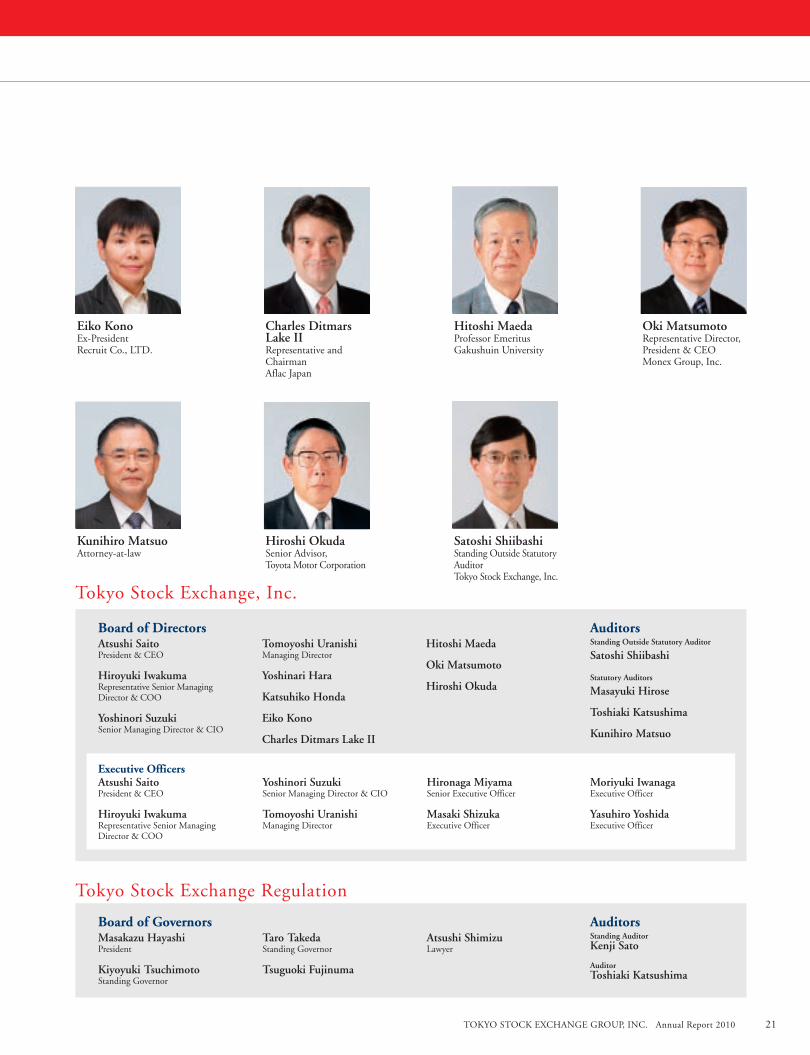
Oki MatsumotoRepresentative Director, President & CEO Monex Group, Inc.
Eiko KonoEx-President Recruit Co., LTD.
Kunihiro MatsuoAttorney-at-law
CharlesDitmarsLake IIRepresentative and Chairman Aflac Japan
Hiroshi OkudaSenior Advisor, Toyota Motor Corporation
Hitoshi MaedaProfessor Emeritus Gakushuin University
Satoshi ShiibashiStanding Outside Statutory AuditorTokyo Stock Exchange, Inc.
Board of Governors AuditorsMasakazuHayashiPresident
Kiyoyuki TsuchimotoStanding Governor
Taro TakedaStanding Governor
Tsuguoki Fujinuma
AtsushiShimizuLawyer
Standing AuditorKenji Sato
AuditorToshiaki Katsushima
Board of Directors AuditorsAtsushi SaitoPresident & CEO
Hiroyuki IwakumaRepresentative Senior ManagingDirector & COO
YoshinoriSuzukiSenior Managing Director & CIO
TomoyoshiUranishiManaging Director
Yoshinari Hara
Katsuhiko Honda
Eiko Kono
CharlesDitmarsLakeII
Hitoshi Maeda
Oki Matsumoto
Hiroshi Okuda
Standing Outside Statutory Auditor
Satoshi Shiibashi
Statutory Auditors
Masayuki Hirose
Toshiaki Katsushima
Kunihiro Matsuo
Tokyo Stock Exchange Regulation
Tokyo Stock Exchange, Inc.
Executive OfficersAtsushi SaitoPresident & CEO
Hiroyuki IwakumaRepresentative Senior Managing Director & COO
YoshinoriSuzukiSenior Managing Director & CIO
TomoyoshiUranishiManaging Director
Hironaga MiyamaSenior Executive Officer
MasakiShizukaExecutive Officer
Moriyuki IwanagaExecutive Officer
Yasuhiro YoshidaExecutive Officer
22 TOKYO STOCK EXCHANGE GROUP, INC. Annual Report 2010 TOKYO STOCK EXCHANGE GROUP, INC. Annual Report 2010
Integrated Operation ofMarkets by Three Companies In November 2007, the Tokyo Stock Exchange and its
subsidiaries adopted a structure whereby Tokyo Stock
Exchange Group, Inc. (the “TSE Group”) serves as the holding
company for Tokyo Stock Exchange, Inc. (the “TSE”), which
operates the markets, and Tokyo Stock Exchange Regulation
(“TSE Regulation”), which conducts the self-regulatory
activities of listing examination, listed company supervision,
participant inspection and market surveillance.
Self-regulatory activities are an essential function of a
stock exchange. The TSE ensures the independence of its self-
regulatory activities by delegating them to TSE Regulation,
which also gives the TSE group (Tokyo Stock Exchange
Group, Inc., Tokyo Stock Exchange, Inc., Tokyo Stock
Exchange Regulation and subsidiaries), as a whole, flexibility
and freedom in executing its business strategy.
Within this structure, the three companies of the TSE
group constantly work together in the operation of the
securities market, guided by a common corporate philosophy
of striving to create a sound market with a high level of
reliability and convenience.
A Stronger Management StructureThrough fulfilling its mission of becoming a vital element of
public infrastructure as the central securities market of Japan,
the TSE group strives to secure stable income while maintaining
a balance between its public nature and profitability.
Basic Policy onCorporate GovernanceThe TSE group provides markets with a high level of liquidity
and reliability based on the following policies.
• Increase management transparency by clarifying the authority and responsibilities of each corporate body, and exercising accountability.
• Establish a structure to reflect the opinions of a wide variety of stakeholders, including investors, in the management and operation of the market.
• Fulfill appropriate self-regulatory functions by ensuring impartial decision-making independent from the influence of particular stakeholders.
Corporate Governance StructureThe TSE Group, the holding company, employs a committee
system, separating management surveillance and supervision
of business execution using the following structure in order to
enhance these functions and increase management
transparency.
Board of Directors
The Board of Directors is responsible for overseeing
management and consists of 16 or fewer members. It makes
decisions on the basic policy and important issues concerning
management, and also oversees the business activities of
executive officers in accordance with those decisions.
A majority of the directors are appointed from outside
the company in order to increase the transparency and
accountability of management, and enhance supervision of
the adequacy of business execution.
Board of Executive Officers
The Board of Executive Officers is composed of all six
executive officers. It discusses important issues relevant to
business execution from among those that are to be discussed
in meetings of the Board of Directors as well as those the
Board of Directors has delegated by its resolutions to the
president and chief executive officer.
Nomination Committee
The Nomination Committee comprises three directors,
including two outside directors. It decides on proposals
regarding the election and dismissal of directors to be
submitted at the General Meeting of Shareholders.
Audit Committee
The Audit Committee comprises four directors, including
three outside directors. It conducts efficient audits and the
like by monitoring and verifying the structure and operation
of the internal control system in close collaboration with
accounting auditors, the internal audit division, auditors of
subsidiary companies and others.
Compensation Committee
The Compensation Committee comprises three directors,
including two outside directors. It determines the
compensation and other remuneration for individual
directors and executive officers.
Corporate Governance
TOKYO STOCK EXCHANGE GROUP, INC. Annual Report 2010 23TOKYO STOCK EXCHANGE GROUP, INC. Annual Report 2010
President’s Advisory Committee
The TSE Group established the President’s Advisory
Committee as a forum to exchange a wide range of opinions
about the TSE group and the securities market in general.
Members of this committee include academics and
representatives of listed companies.
State of Corporate Governance at SubsidiariesTokyo Stock Exchange, Inc. (Market operator)
The TSE currently employs an auditor system. The
Statutory Auditors Board is composed of four individuals,
including one standing statutory auditor and three
outside auditors. The TSE has enhanced its auditor
structure in ways such as requiring the Board to meet at
least once a month in principle. In addition, the TSE has
assigned the Auditors Office as support staff for the
Statutory Auditors Board.
The statutory auditors attend significant meetings,
including those of the Board of Directors and Committee
of Executive Officers, and conduct audits focused on the
legitimacy of operations. They also strive to increase
effectiveness of accounting and operational audits in
cooperation with accounting auditors, the Auditors Office,
and the statutory auditors of the TSE’s subsidiaries.
Tokyo Stock Exchange Regulation
(Self-regulatory organization)
TSE Regulation was established to perform the self-
regulatory activities delegated by the TSE. It is a non-profit
membership organization as set forth in the Financial
Instruments and Exchange Act, with its membership
composed of equity contributors. Decisions on important
self-regulatory activities are made by the Board of
Governors. Measures to enhance the independence of the
Board of Governors from the stock exchange include
selecting governors so that the majority has no interests in
the stock exchange, listed companies or similar institutions,
and valuing opinions of these highly independent outside
governors in resolutions.
Group-wide Conference
TOKYO STOCK EXCHANGE REGULATIONTOKYO STOCK EXCHANGE, INC.
President & CEO
Directors
Market StructureM k S
Advisory Committees
President’s Advisory
Committee
Advisory Committees
Discipline
Auditors
Governors
Board of Governors
President’s Advisory Committee
Compensation Committee
Nomination Committee
Audit Committee
TOKYO STOCK EXCHANGE GROUP, INC.
Executive OfficersExecutive Officers
President & CEO
General Meeting of Shareholders
Board of Directors
General Meeting of Shareholders
President & CEO
Board of Directors
General Meetingof Members
Directors
Governors
PresidentAuditorsA di
Statutory Auditors Board
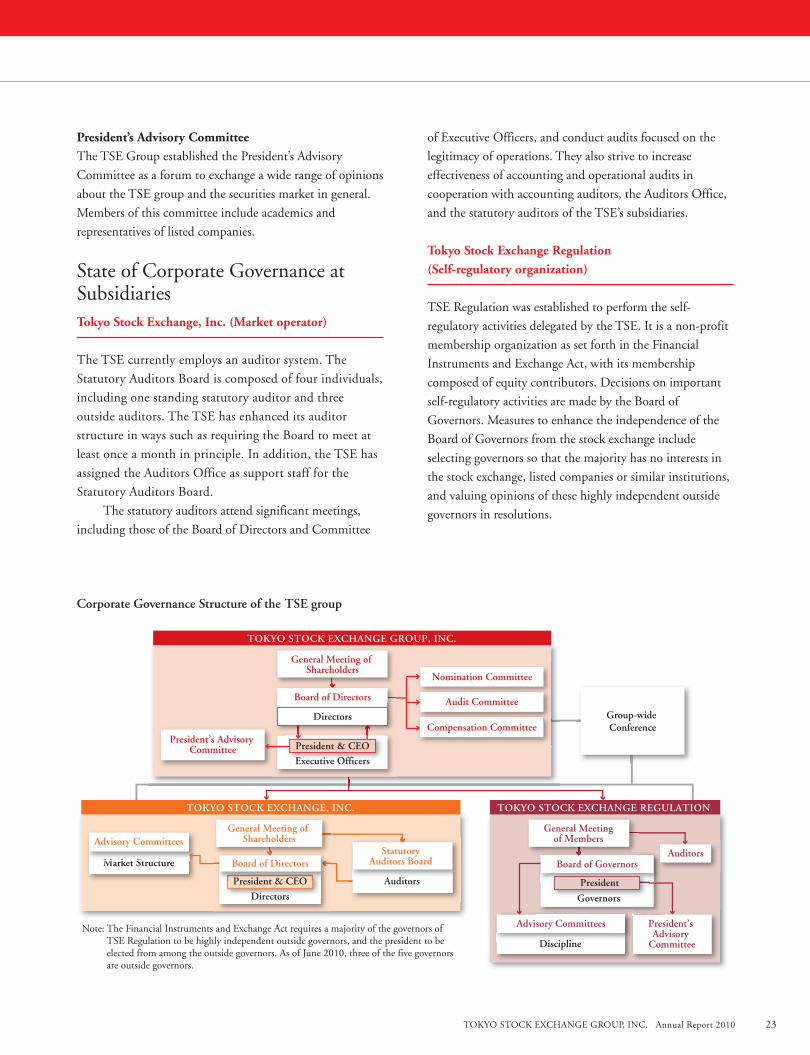
Note: The Financial Instruments and Exchange Act requires a majority of the governors of TSE Regulation to be highly independent outside governors, and the president to be elected from among the outside governors. As of June 2010, three of the five governors are outside governors.
Corporate Governance Structure of the TSE group
24 TOKYO STOCK EXCHANGE GROUP, INC. Annual Report 2010 TOKYO STOCK EXCHANGE GROUP, INC. Annual Report 2010
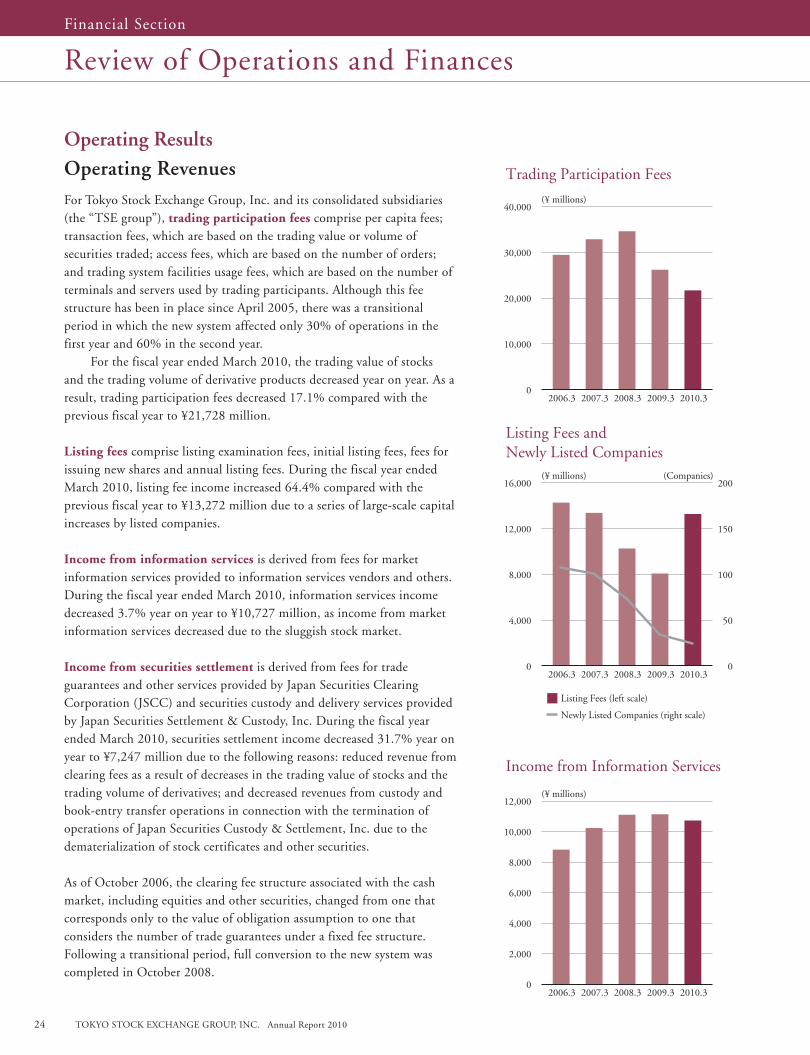
Operating ResultsOperating RevenuesFor Tokyo Stock Exchange Group, Inc. and its consolidated subsidiaries (the “TSE group”), trading participation fees comprise per capita fees; transaction fees, which are based on the trading value or volume of securities traded; access fees, which are based on the number of orders;and trading system facilities usage fees, which are based on the number of terminals and servers used by trading participants. Although this fee structure has been in place since April 2005, there was a transitional period in which the new system affected only 30% of operations in the first year and 60% in the second year. For the fiscal year ended March 2010, the trading value of stocksand the trading volume of derivative products decreased year on year. As a result, trading participation fees decreased 17.1% compared with the previous fiscal year to ¥21,728 million.
Listing fees comprise listing examination fees, initial listing fees, fees for issuing new shares and annual listing fees. During the fiscal year ended March 2010, listing fee income increased 64.4% compared with the previous fiscal year to ¥13,272 million due to a series of large-scale capital increases by listed companies.
Income from information services is derived from fees for market information services provided to information services vendors and others. During the fiscal year ended March 2010, information services income decreased 3.7% year on year to ¥10,727 million, as income from market information services decreased due to the sluggish stock market.
Income from securities settlement is derived from fees for trade guarantees and other services provided by Japan Securities Clearing Corporation (JSCC) and securities custody and delivery services provided by Japan Securities Settlement & Custody, Inc. During the fiscal year ended March 2010, securities settlement income decreased 31.7% year on year to ¥7,247 million due to the following reasons: reduced revenue from clearing fees as a result of decreases in the trading value of stocks and the trading volume of derivatives; and decreased revenues from custody and book-entry transfer operations in connection with the termination of operations of Japan Securities Custody & Settlement, Inc. due to the dematerialization of stock certificates and other securities.
As of October 2006, the clearing fee structure associated with the cash market, including equities and other securities, changed from one that corresponds only to the value of obligation assumption to one that considers the number of trade guarantees under a fixed fee structure. Following a transitional period, full conversion to the new system was completed in October 2008.
(Companies)
2006.3 2007.3 2008.3 2009.3
14,000
12,000
10,000
8,000
4,000
2,000
6,000
0
(¥ millions)
Income from Securities Settlement
2006.3 2007.3 2008.3 2009.3
40,000
30,000
20,000
10,000
0
(¥ millions)
Trading Participation Fees
2006.3
8,000
7,000
6,000
5,000
4,000
3,000
2,000
1,000
0
(¥ mils.)
Income from Systems Development and Operations
2006.3 2007.3 2008.3 2009.3
16,000
12,000
8,000
4,000
0
200
150
100
50
0
(¥ millions)
Listing Fees and Newly Listed Companies
Listing Fees (left scale)
Newly Listed Companies (right scale)
2006.3 2007.3 2008.3 2009.3
12,000
10,000
8,000
6,000
2,000
4,000
0
(¥ millions)
Income from Information Services
2006.3 2007.3 2008.3 2009.3
12,000
9,000
6,000
3,000
0
(¥ millions)
Other Operating Income
2006.3 2007.3 2008.3 2009.3
35,000
30,000
25,000
20,000
10,000
5,000
15,000
0
(¥ millions)
Operating Activities
2006.3 2007.3 2008.3 2009.3
0
-10,000
-20,000
-30,000
-40,000
-50,000
-60,000
(¥ millions)
Investing Activities
2006.3 2007.3 2008.3 2009.3
2010.32010.3
2010.3
2010.3
2010.3
2010.3
2010.3
2010.3
20,000
15,000
10,000
-5,000
5,000
-10,000
(¥ millions)
Financing Activities
0
Review of Operations and FinancesFinancial Section
TOKYO STOCK EXCHANGE GROUP, INC. Annual Report 2010 25TOKYO STOCK EXCHANGE GROUP, INC. Annual Report 2010
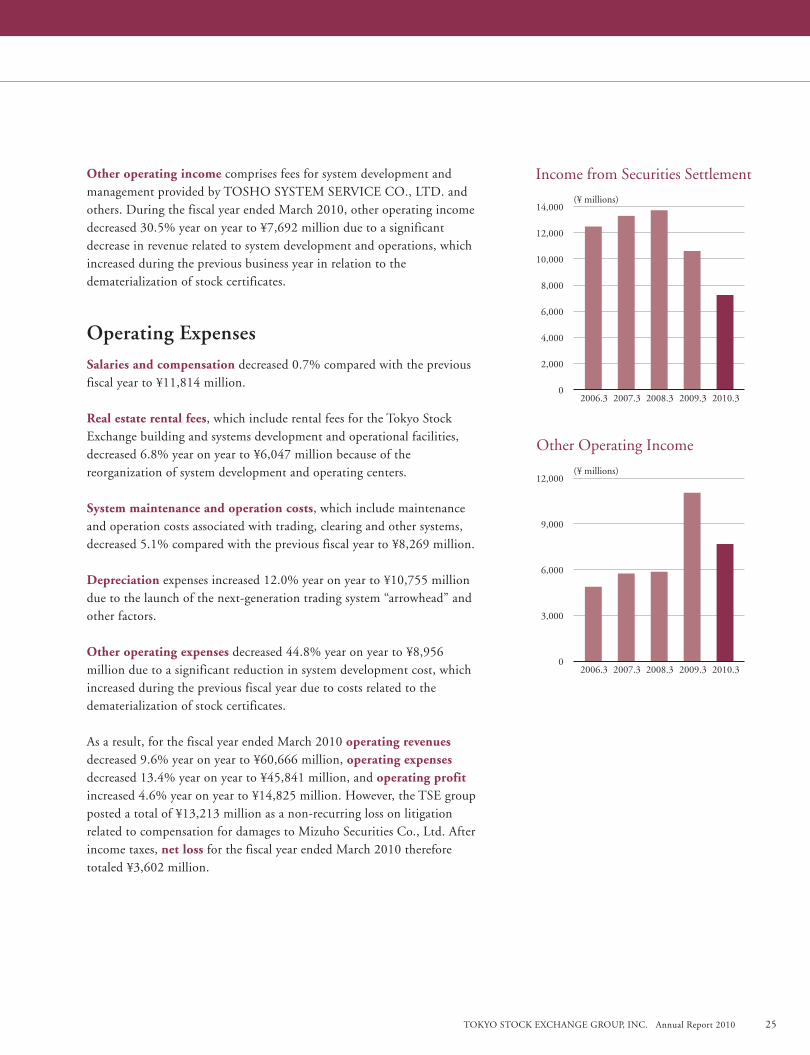
Other operating income comprises fees for system development and management provided by TOSHO SYSTEM SERVICE CO., LTD. and others. During the fiscal year ended March 2010, other operating income decreased 30.5% year on year to ¥7,692 million due to a significant decrease in revenue related to system development and operations, which increased during the previous business year in relation to the dematerialization of stock certificates.
Operating ExpensesSalaries and compensation decreased 0.7% compared with the previous fiscal year to ¥11,814 million.
Real estate rental fees, which include rental fees for the Tokyo Stock Exchange building and systems development and operational facilities, decreased 6.8% year on year to ¥6,047 million because of the reorganization of system development and operating centers.
System maintenance and operation costs, which include maintenance and operation costs associated with trading, clearing and other systems, decreased 5.1% compared with the previous fiscal year to ¥8,269 million.
Depreciation expenses increased 12.0% year on year to ¥10,755 million due to the launch of the next-generation trading system “arrowhead” and other factors.
Other operating expenses decreased 44.8% year on year to ¥8,956 million due to a significant reduction in system development cost, which increased during the previous fiscal year due to costs related to the dematerialization of stock certificates.
As a result, for the fiscal year ended March 2010 operating revenues decreased 9.6% year on year to ¥60,666 million, operating expenses decreased 13.4% year on year to ¥45,841 million, and operating profit increased 4.6% year on year to ¥14,825 million. However, the TSE group posted a total of ¥13,213 million as a non-recurring loss on litigation related to compensation for damages to Mizuho Securities Co., Ltd. After income taxes, net loss for the fiscal year ended March 2010 therefore totaled ¥3,602 million.
(Companies)
2006.3 2007.3 2008.3 2009.3
14,000
12,000
10,000
8,000
4,000
2,000
6,000
0
(¥ millions)
Income from Securities Settlement
2006.3 2007.3 2008.3 2009.3
40,000
30,000
20,000
10,000
0
(¥ millions)
Trading Participation Fees
2006.3
8,000
7,000
6,000
5,000
4,000
3,000
2,000
1,000
0
(¥ mils.)
Income from Systems Development and Operations
2006.3 2007.3 2008.3 2009.3
16,000
12,000
8,000
4,000
0
200
150
100
50
0
(¥ millions)
Listing Fees and Newly Listed Companies
Listing Fees (left scale)
Newly Listed Companies (right scale)
2006.3 2007.3 2008.3 2009.3
12,000
10,000
8,000
6,000
2,000
4,000
0
(¥ millions)
Income from Information Services
2006.3 2007.3 2008.3 2009.3
12,000
9,000
6,000
3,000
0
(¥ millions)
Other Operating Income
2006.3 2007.3 2008.3 2009.3
35,000
30,000
25,000
20,000
10,000
5,000
15,000
0
(¥ millions)
Operating Activities
2006.3 2007.3 2008.3 2009.3
0
-10,000
-20,000
-30,000
-40,000
-50,000
-60,000
(¥ millions)
Investing Activities
2006.3 2007.3 2008.3 2009.3
2010.32010.3
2010.3
2010.3
2010.3
2010.3
2010.3
2010.3
20,000
15,000
10,000
-5,000
5,000
-10,000
(¥ millions)
Financing Activities
0
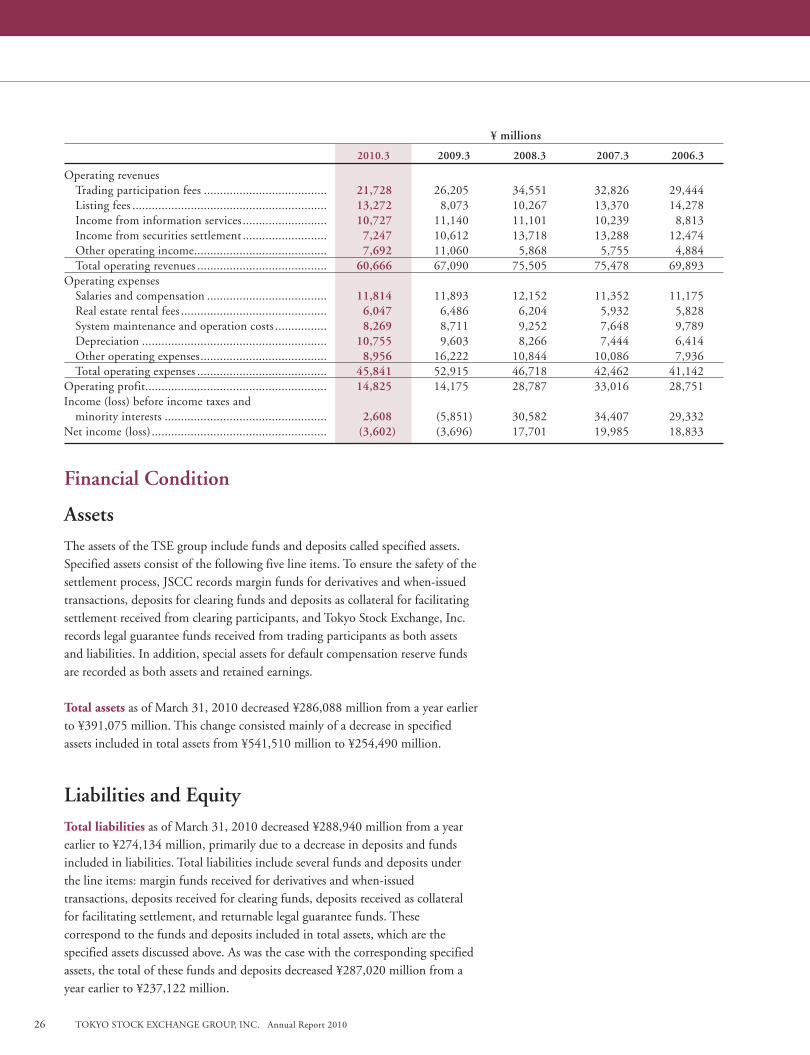
26 TOKYO STOCK EXCHANGE GROUP, INC. Annual Report 2010 TOKYO STOCK EXCHANGE GROUP, INC. Annual Report 2010
Financial Condition
AssetsThe assets of the TSE group include funds and deposits called specified assets. Specified assets consist of the following five line items. To ensure the safety of the settlement process, JSCC records margin funds for derivatives and when-issued transactions, deposits for clearing funds and deposits as collateral for facilitating settlement received from clearing participants, and Tokyo Stock Exchange, Inc. records legal guarantee funds received from trading participants as both assets and liabilities. In addition, special assets for default compensation reserve funds are recorded as both assets and retained earnings.
Total assets as of March 31, 2010 decreased ¥286,088 million from a year earlier to ¥391,075 million. This change consisted mainly of a decrease in specified assets included in total assets from ¥541,510 million to ¥254,490 million.
Liabilities and EquityTotal liabilities as of March 31, 2010 decreased ¥288,940 million from a year earlier to ¥274,134 million, primarily due to a decrease in deposits and funds included in liabilities. Total liabilities include several funds and deposits under the line items: margin funds received for derivatives and when-issued transactions, deposits received for clearing funds, deposits received as collateral for facilitating settlement, and returnable legal guarantee funds. These correspond to the funds and deposits included in total assets, which are the specified assets discussed above. As was the case with the corresponding specified assets, the total of these funds and deposits decreased ¥287,020 million from a year earlier to ¥237,122 million.
. . . . . . . . . . . . . . . . . . . . . . . . . . . . . . . . ¥ millions
. . . . . . . . . . . . . . . . . . . . . . . . . . . . . . . . . . . 2010 .3 2009 .3 2008 .3 2007 .3 2006 .3
Operating revenues Trading participation fees ...................................... 21,728 26,205 34,551 32,826 29,444 Listing fees ............................................................ 13,272 8,073 10,267 13,370 14,278 Income from information services .......................... 10,727 11,140 11,101 10,239 8,813 Income from securities settlement .......................... 7,247 10,612 13,718 13,288 12,474 Other operating income......................................... 7,692 11,060 5,868 5,755 4,884 Total operating revenues ........................................ 60,666 67,090 75,505 75,478 69,893Operating expenses Salaries and compensation ..................................... 11,814 11,893 12,152 11,352 11,175 Real estate rental fees ............................................. 6,047 6,486 6,204 5,932 5,828 System maintenance and operation costs ................ 8,269 8,711 9,252 7,648 9,789 Depreciation ......................................................... 10,755 9,603 8,266 7,444 6,414 Other operating expenses ....................................... 8,956 16,222 10,844 10,086 7,936 Total operating expenses ........................................ 45,841 52,915 46,718 42,462 41,142Operating profit........................................................ 14,825 14,175 28,787 33,016 28,751Income (loss) before income taxes and minority interests .................................................. 2,608 (5,851) 30,582 34,407 29,332Net income (loss) ...................................................... (3,602) (3,696) 17,701 19,985 18,833
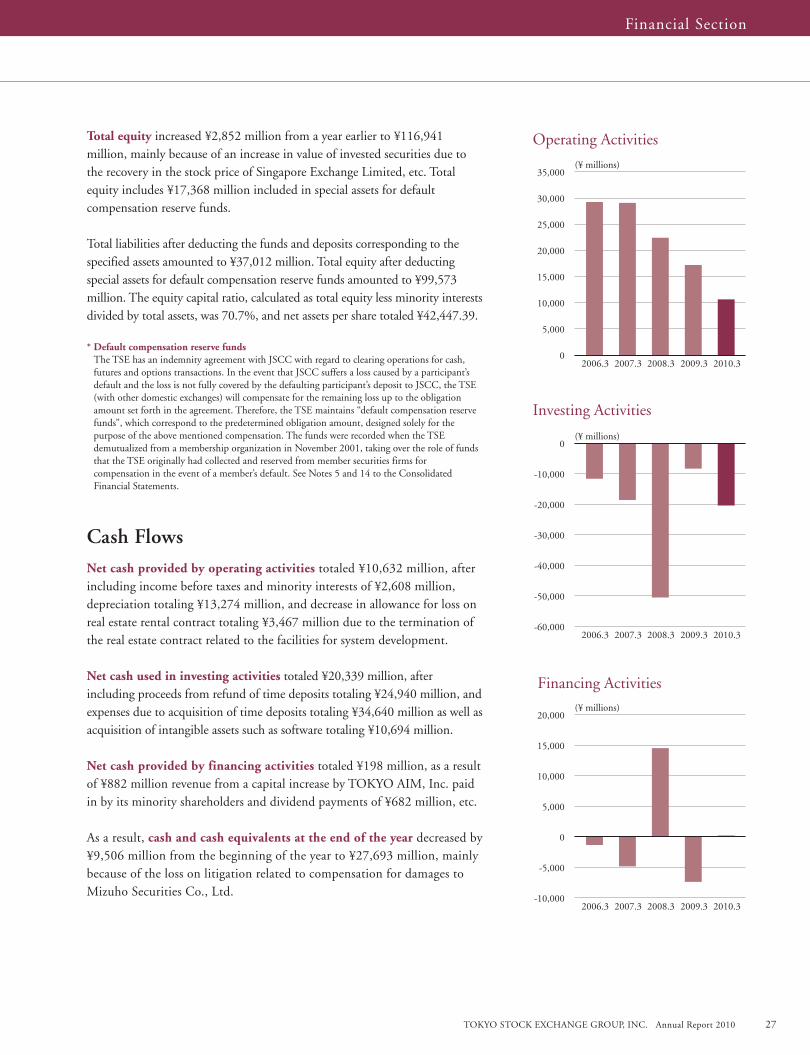
TOKYO STOCK EXCHANGE GROUP, INC. Annual Report 2010 27TOKYO STOCK EXCHANGE GROUP, INC. Annual Report 2010
Total equity increased ¥2,852 million from a year earlier to ¥116,941 million, mainly because of an increase in value of invested securities due to the recovery in the stock price of Singapore Exchange Limited, etc. Total equity includes ¥17,368 million included in special assets for default compensation reserve funds.
Total liabilities after deducting the funds and deposits corresponding to the specified assets amounted to ¥37,012 million. Total equity after deducting special assets for default compensation reserve funds amounted to ¥99,573 million. The equity capital ratio, calculated as total equity less minority interests divided by total assets, was 70.7%, and net assets per share totaled ¥42,447.39.
* Default compensation reserve funds The TSE has an indemnity agreement with JSCC with regard to clearing operations for cash, futures and options transactions. In the event that JSCC suffers a loss caused by a participant’s default and the loss is not fully covered by the defaulting participant’s deposit to JSCC, the TSE (with other domestic exchanges) will compensate for the remaining loss up to the obligation amount set forth in the agreement. Therefore, the TSE maintains “default compensation reserve funds”, which correspond to the predetermined obligation amount, designed solely for the purpose of the above mentioned compensation. The funds were recorded when the TSE demutualized from a membership organization in November 2001, taking over the role of funds that the TSE originally had collected and reserved from member securities firms for compensation in the event of a member’s default. See Notes 5 and 14 to the Consolidated Financial Statements.
Cash FlowsNet cash provided by operating activities totaled ¥10,632 million, after including income before taxes and minority interests of ¥2,608 million, depreciation totaling ¥13,274 million, and decrease in allowance for loss on real estate rental contract totaling ¥3,467 million due to the termination of the real estate contract related to the facilities for system development.
Net cash used in investing activities totaled ¥20,339 million, after including proceeds from refund of time deposits totaling ¥24,940 million, and expenses due to acquisition of time deposits totaling ¥34,640 million as well as acquisition of intangible assets such as software totaling ¥10,694 million.
Net cash provided by financing activities totaled ¥198 million, as a result of ¥882 million revenue from a capital increase by TOKYO AIM, Inc. paid in by its minority shareholders and dividend payments of ¥682 million, etc.
As a result, cash and cash equivalents at the end of the year decreased by ¥9,506 million from the beginning of the year to ¥27,693 million, mainly because of the loss on litigation related to compensation for damages to Mizuho Securities Co., Ltd.
(Companies)
2006.3 2007.3 2008.3 2009.3
14,000
12,000
10,000
8,000
4,000
2,000
6,000
0
(¥ millions)
Income from Securities Settlement
2006.3 2007.3 2008.3 2009.3
40,000
30,000
20,000
10,000
0
(¥ millions)
Trading Participation Fees
2006.3
8,000
7,000
6,000
5,000
4,000
3,000
2,000
1,000
0
(¥ mils.)
Income from Systems Development and Operations
2006.3 2007.3 2008.3 2009.3
16,000
12,000
8,000
4,000
0
200
150
100
50
0
(¥ millions)
Listing Fees and Newly Listed Companies
Listing Fees (left scale)
Newly Listed Companies (right scale)
2006.3 2007.3 2008.3 2009.3
12,000
10,000
8,000
6,000
2,000
4,000
0
(¥ millions)
Income from Information Services
2006.3 2007.3 2008.3 2009.3
12,000
9,000
6,000
3,000
0
(¥ millions)
Other Operating Income
2006.3 2007.3 2008.3 2009.3
35,000
30,000
25,000
20,000
10,000
5,000
15,000
0
(¥ millions)
Operating Activities
2006.3 2007.3 2008.3 2009.3
0
-10,000
-20,000
-30,000
-40,000
-50,000
-60,000
(¥ millions)
Investing Activities
2006.3 2007.3 2008.3 2009.3
2010.32010.3
2010.3
2010.3
2010.3
2010.3
2010.3
2010.3
20,000
15,000
10,000
-5,000
5,000
-10,000
(¥ millions)
Financing Activities
0
Financial Section
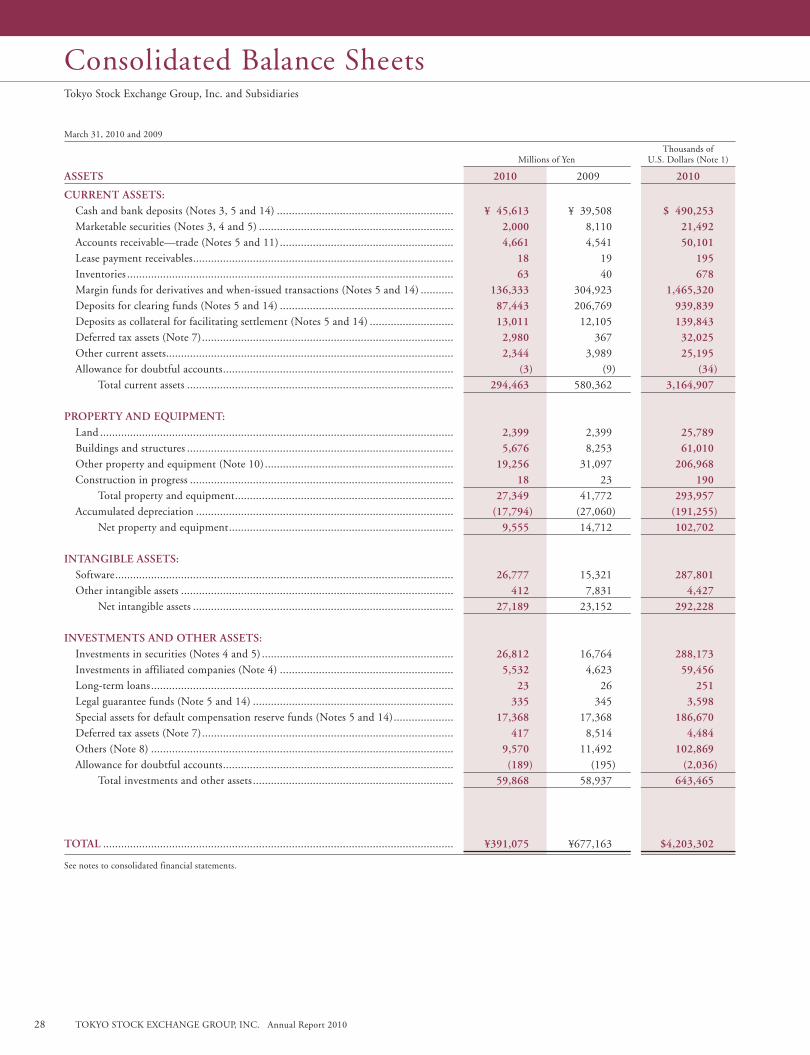
Consolidated Balance SheetsTokyo Stock Exchange Group, Inc. and Subsidiaries
March 31, 2010 and 2009
Thousands of Millions of Yen U.S. Dollars (Note 1)
ASSETS 2010 2009 2010
CURRENT ASSETS: Cash and bank deposits (Notes 3, 5 and 14) ...........................................................
Marketable securities (Notes 3, 4 and 5) .................................................................
Accounts receivable—trade (Notes 5 and 11) ..........................................................
Lease payment receivables .......................................................................................
Inventories .............................................................................................................
Margin funds for derivatives and when-issued transactions (Notes 5 and 14) ...........
Deposits for clearing funds (Notes 5 and 14) ..........................................................
Deposits as collateral for facilitating settlement (Notes 5 and 14) ............................
Deferred tax assets (Note 7) ....................................................................................
Other current assets ................................................................................................
Allowance for doubtful accounts ............................................................................. Total current assets .........................................................................................
PROPERTY AND EQUIPMENT: Land ...................................................................................................................... Buildings and structures ......................................................................................... Other property and equipment (Note 10) ............................................................... Construction in progress ........................................................................................ Total property and equipment ......................................................................... Accumulated depreciation ...................................................................................... Net property and equipment ...........................................................................
INTANGIBLE ASSETS: Software ................................................................................................................. Other intangible assets ........................................................................................... Net intangible assets .......................................................................................
INVESTMENTS AND OTHER ASSETS: Investments in securities (Notes 4 and 5) ................................................................ Investments in affiliated companies (Note 4) .......................................................... Long-term loans ..................................................................................................... Legal guarantee funds (Note 5 and 14) ...................................................................
Special assets for default compensation reserve funds (Notes 5 and 14) ....................
Deferred tax assets (Note 7) .................................................................................... Others (Note 8) ..................................................................................................... Allowance for doubtful accounts .............................................................................
Total investments and other assets ...................................................................
TOTAL .....................................................................................................................
See notes to consolidated financial statements.
¥ 45,613 2,000 4,661 18 63 136,333 87,443 13,011 2,980 2,344 (3) 294,463
2,399 5,676 19,256 18 27,349 (17,794) 9,555
26,777 412 27,189
26,812 5,532 23 335 17,368 417 9,570 (189) 59,868
¥391,075
$ 490,253 21,492 50,101 195 678 1,465,320 939,839 139,843 32,025 25,195 (34) 3,164,907 25,789 61,010 206,968 190 293,957 (191,255) 102,702 287,801 4,427 292,228 288,173 59,456 251 3,598 186,670 4,484 102,869 (2,036) 643,465
$4,203,302
¥ 39,508
8,110
4,541
19
40
304,923
206,769
12,105
367
3,989
(9) 580,362
2,399 8,253 31,097 23 41,772 (27,060) 14,712
15,321 7,831 23,152
16,764 4,623
26 345 17,368
8,514
11,492 (195) 58,937
¥677,163
28 TOKYO STOCK EXCHANGE GROUP, INC. Annual Report 2010 TOKYO STOCK EXCHANGE GROUP, INC. Annual Report 2010
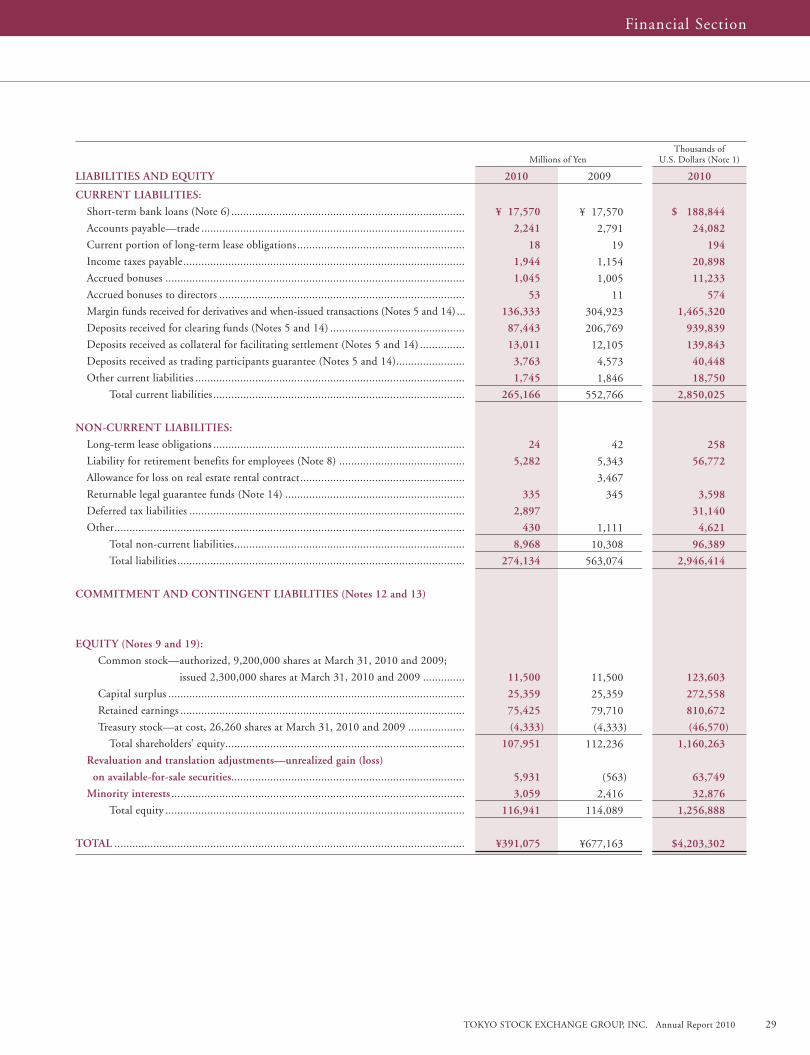
Thousands of Millions of Yen U.S. Dollars (Note 1)
LIABILITIES AND EQUITY 2010 2009 2010
CURRENT LIABILITIES:
Short-term bank loans (Note 6) ..............................................................................
Accounts payable—trade ........................................................................................
Current portion of long-term lease obligations ........................................................
Income taxes payable ..............................................................................................
Accrued bonuses ....................................................................................................
Accrued bonuses to directors ..................................................................................
Margin funds received for derivatives and when-issued transactions (Notes 5 and 14) ...
Deposits received for clearing funds (Notes 5 and 14) .............................................
Deposits received as collateral for facilitating settlement (Notes 5 and 14) ...............
Deposits received as trading participants guarantee (Notes 5 and 14).......................
Other current liabilities ..........................................................................................
Total current liabilities ....................................................................................
NON-CURRENT LIABILITIES:
Long-term lease obligations ....................................................................................
Liability for retirement benefits for employees (Note 8) ..........................................
Allowance for loss on real estate rental contract .......................................................
Returnable legal guarantee funds (Note 14) ............................................................
Deferred tax liabilities ............................................................................................
Other .....................................................................................................................
Total non-current liabilities .............................................................................
Total liabilities ................................................................................................
COMMITMENT AND CONTINGENT LIABILITIES (Notes 12 and 13)
EQUITY (Notes 9 and 19):
Common stock— authorized, 9,200,000 shares at March 31, 2010 and 2009;
issued 2,300,000 shares at March 31, 2010 and 2009 ..............
Capital surplus ...................................................................................................
Retained earnings ...............................................................................................
Treasury stock—at cost, 26,260 shares at March 31, 2010 and 2009 ...................
Total shareholders’ equity ................................................................................
Revaluation and translation adjustments—unrealized gain (loss)
on available-for-sale securities..............................................................................
Minority interests ..................................................................................................
Total equity ....................................................................................................
TOTAL .....................................................................................................................
¥ 17,570
2,241
18
1,944
1,045
53
136,333
87,443
13,011
3,763
1,745
265,166
24
5,282
335
2,897
430
8,968
274,134
11,500
25,359
75,425
(4,333)
107,951
5,931
3,059
116,941
¥391,075
$ 188,844
24,082
194
20,898
11,233
574
1,465,320
939,839
139,843
40,448
18,750
2,850,025
258
56,772
3,598
31,140
4,621
96,389
2,946,414
123,603
272,558
810,672
(46,570)
1,160,263
63,749
32,876
1,256,888
$4,203,302
¥ 17,570
2,791
19
1,154
1,005
11
304,923
206,769
12,105
4,573
1,846
552,766
42
5,343
3,467
345
1,111
10,308
563,074
11,500
25,359
79,710
(4,333)
112,236
(563)
2,416
114,089
¥677,163
Financial Section
TOKYO STOCK EXCHANGE GROUP, INC. Annual Report 2010 29TOKYO STOCK EXCHANGE GROUP, INC. Annual Report 2010
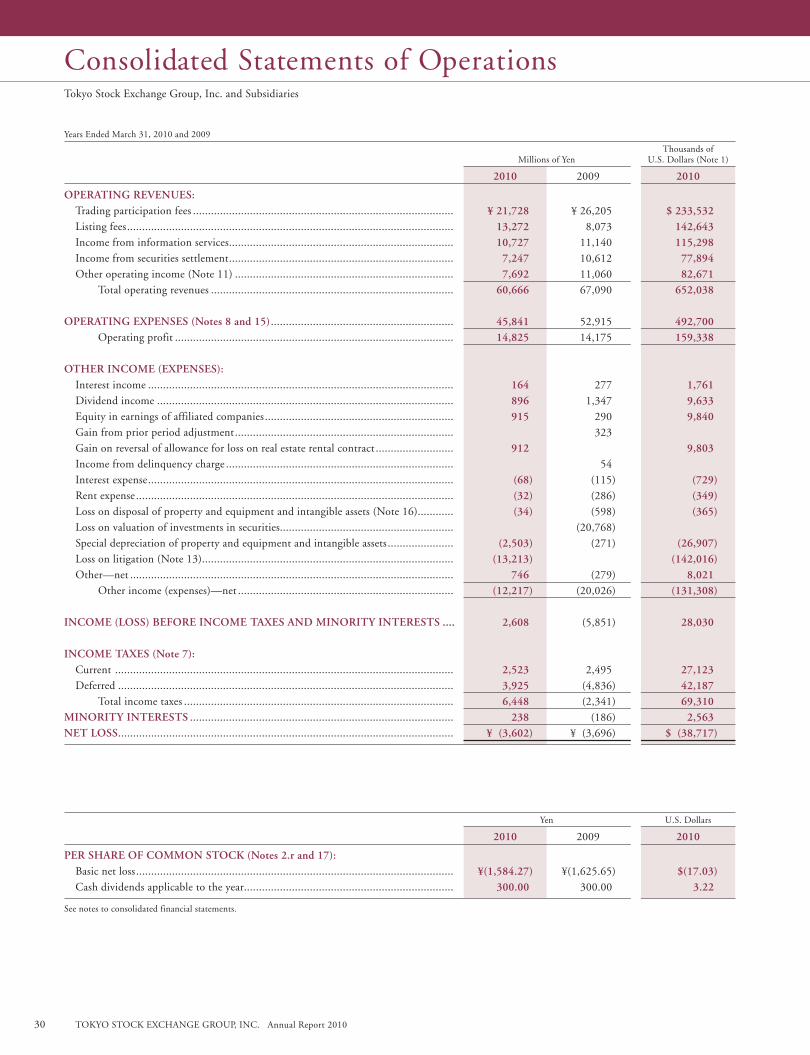
Tokyo Stock Exchange Group, Inc. and Subsidiaries
Years Ended March 31, 2010 and 2009
Thousands of Millions of Yen U.S. Dollars (Note 1)
2010 2009 2010
OPERATING REVENUES: Trading participation fees .......................................................................................
Listing fees .............................................................................................................
Income from information services ...........................................................................
Income from securities settlement ...........................................................................
Other operating income (Note 11) .........................................................................
Total operating revenues .................................................................................
OPERATING EXPENSES (Notes 8 and 15) ............................................................. Operating profit .............................................................................................
OTHER INCOME (EXPENSES): Interest income ...................................................................................................... Dividend income ................................................................................................... Equity in earnings of affiliated companies ............................................................... Gain from prior period adjustment ......................................................................... Gain on reversal of allowance for loss on real estate rental contract .......................... Income from delinquency charge ............................................................................ Interest expense ...................................................................................................... Rent expense .......................................................................................................... Loss on disposal of property and equipment and intangible assets (Note 16)............ Loss on valuation of investments in securities.......................................................... Special depreciation of property and equipment and intangible assets ...................... Loss on litigation (Note 13).................................................................................... Other—net ............................................................................................................ Other income (expenses)—net ........................................................................
INCOME (LOSS) BEFORE INCOME TAXES AND MINORITY INTERESTS . . . .
INCOME TAXES (Note 7): Current ................................................................................................................. Deferred ................................................................................................................
Total income taxes ..........................................................................................MINORITY INTERESTS ........................................................................................NET LOSS ................................................................................................................
¥ 21,728 13,272 10,727 7,247 7,692 60,666
45,841 14,825
164 896 915 912 (68) (32) (34) (2,503) (13,213) 746 (12,217)
2,608
2,523 3,925 6,448 238 ¥ (3,602)
$ 233,532 142,643 115,298 77,894 82,671 652,038 492,700 159,338 1,761 9,633 9,840 9,803 (729) (349) (365) (26,907) (142,016) 8,021 (131,308) 28,030
27,123 42,187 69,310 2,563 $ (38,717)
¥ 26,205
8,073
11,140
10,612
11,060
67,090
52,915
14,175
277 1,347 290 323
54 (115) (286) (598) (20,768) (271)
(279) (20,026) (5,851)
2,495
(4,836) (2,341) (186)
¥ (3,696)
Yen U.S. Dollars
2010 2009 2010
PER SHARE OF COMMON STOCK (Notes 2 .r and 17): Basic net loss .......................................................................................................... Cash dividends applicable to the year......................................................................
See notes to consolidated financial statements.
¥(1,584 .27) 300 .00
$(17 .03) 3 .22
¥(1,625.65)
300.00
Consolidated Statements of Operations
30 TOKYO STOCK EXCHANGE GROUP, INC. Annual Report 2010 TOKYO STOCK EXCHANGE GROUP, INC. Annual Report 2010
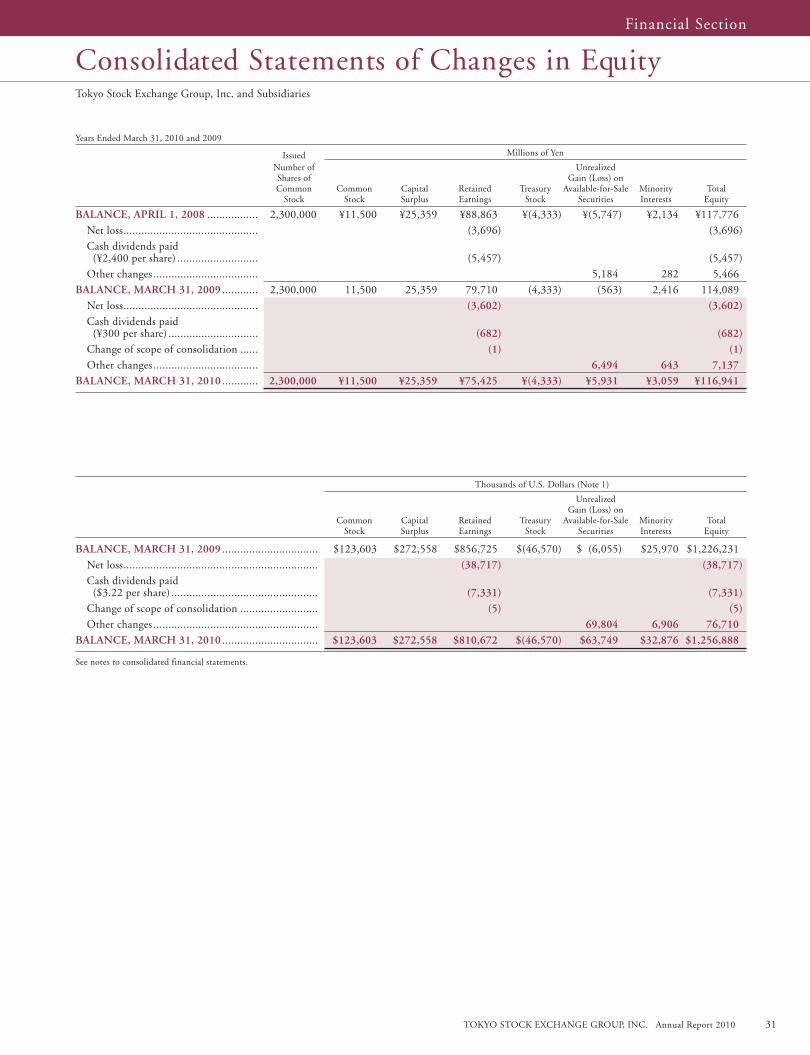
Years Ended March 31, 2010 and 2009
Issued Millions of Yen
Number of Unrealized Shares of Gain (Loss) on Common Common Capital Retained Treasury Available-for-Sale Minority Total Stock Stock Surplus Earnings Stock Securities Interests Equity
BALANCE, APRIL 1, 2008 ................. 2,300,000 ¥11,500 ¥25,359 ¥88,863 ¥(4,333) ¥(5,747) ¥2,134 ¥117,776
Net loss ............................................. (3,696) (3,696)
Cash dividends paid (¥2,400 per share) ........................... (5,457) (5,457)
Other changes ................................... 5,184 282 5,466
BALANCE, MARCH 31, 2009 ............ 2,300,000 11,500 25,359 79,710 (4,333) (563) 2,416 114,089
Net loss ............................................. (3,602) (3,602) Cash dividends paid (¥300 per share) .............................. (682) (682) Change of scope of consolidation ...... (1) (1) Other changes ................................... 6,494 643 7,137 BALANCE, MARCH 31, 2010 ............ 2,300,000 ¥11,500 ¥25,359 ¥75,425 ¥(4,333) ¥5,931 ¥3,059 ¥116,941
Thousands of U.S. Dollars (Note 1)
Unrealized Gain (Loss) on Common Capital Retained Treasury Available-for-Sale Minority Total Stock Surplus Earnings Stock Securities Interests Equity
BALANCE, MARCH 31, 2009 ................................ $123,603 $272,558 $856,725 $(46,570) $ (6,055) $25,970 $1,226,231 Net loss ................................................................. (38,717) (38,717) Cash dividends paid ($3.22 per share) ................................................. (7,331) (7,331) Change of scope of consolidation .......................... (5) (5) Other changes ....................................................... 69,804 6,906 76,710 BALANCE, MARCH 31, 2010 ................................ $123,603 $272,558 $810,672 $(46,570) $63,749 $32,876 $1,256,888
See notes to consolidated financial statements.
Tokyo Stock Exchange Group, Inc. and Subsidiaries
Consolidated Statements of Changes in EquityFinancial Section
TOKYO STOCK EXCHANGE GROUP, INC. Annual Report 2010 31TOKYO STOCK EXCHANGE GROUP, INC. Annual Report 2010
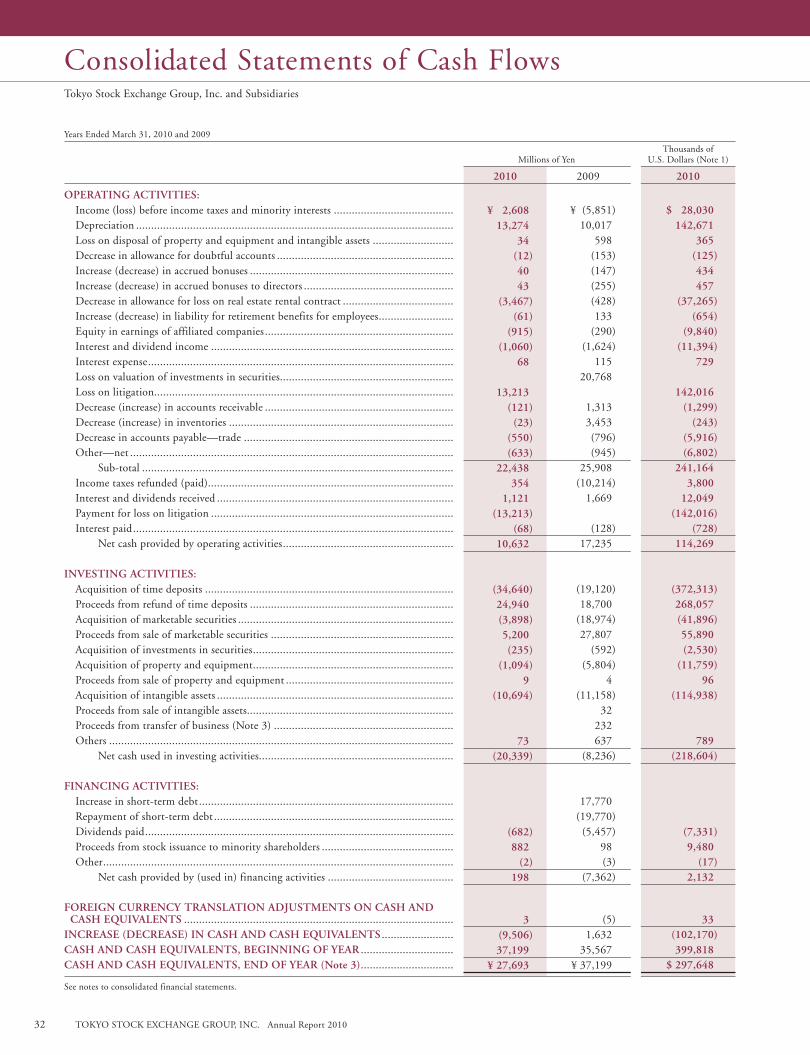
Years Ended March 31, 2010 and 2009
Thousands of Millions of Yen U.S. Dollars (Note 1)
2010 2009 2010
OPERATING ACTIVITIES: Income (loss) before income taxes and minority interests ........................................ Depreciation .......................................................................................................... Loss on disposal of property and equipment and intangible assets ........................... Decrease in allowance for doubtful accounts ........................................................... Increase (decrease) in accrued bonuses .................................................................... Increase (decrease) in accrued bonuses to directors .................................................. Decrease in allowance for loss on real estate rental contract ..................................... Increase (decrease) in liability for retirement benefits for employees ......................... Equity in earnings of affiliated companies ............................................................... Interest and dividend income ................................................................................. Interest expense ...................................................................................................... Loss on valuation of investments in securities.......................................................... Loss on litigation.................................................................................................... Decrease (increase) in accounts receivable ............................................................... Decrease (increase) in inventories ........................................................................... Decrease in accounts payable—trade ...................................................................... Other—net ............................................................................................................ Sub-total ........................................................................................................ Income taxes refunded (paid) .................................................................................. Interest and dividends received ............................................................................... Payment for loss on litigation ................................................................................. Interest paid ........................................................................................................... Net cash provided by operating activities .........................................................
INVESTING ACTIVITIES: Acquisition of time deposits ................................................................................... Proceeds from refund of time deposits .................................................................... Acquisition of marketable securities ........................................................................ Proceeds from sale of marketable securities ............................................................. Acquisition of investments in securities ................................................................... Acquisition of property and equipment ................................................................... Proceeds from sale of property and equipment ........................................................ Acquisition of intangible assets ............................................................................... Proceeds from sale of intangible assets..................................................................... Proceeds from transfer of business (Note 3) ............................................................ Others ................................................................................................................... Net cash used in investing activities.................................................................
FINANCING ACTIVITIES: Increase in short-term debt ..................................................................................... Repayment of short-term debt ................................................................................ Dividends paid ....................................................................................................... Proceeds from stock issuance to minority shareholders ............................................ Other ..................................................................................................................... Net cash provided by (used in) financing activities ..........................................
FOREIGN CURRENCY TRANSLATION ADJUSTMENTS ON CASH AND CASH EQUIVALENTS ..........................................................................................INCREASE (DECREASE) IN CASH AND CASH EQUIVALENTS ........................CASH AND CASH EQUIVALENTS, BEGINNING OF YEAR ...............................CASH AND CASH EQUIVALENTS, END OF YEAR (Note 3) ...............................
See notes to consolidated financial statements.
¥ 2,608 13,274 34 (12) 40 43 (3,467) (61) (915) (1,060) 68
13,213 (121) (23) (550) (633) 22,438 354 1,121 (13,213) (68) 10,632
(34,640) 24,940 (3,898) 5,200 (235) (1,094) 9 (10,694) 73 (20,339)
(682) 882 (2) 198
3 (9,506) 37,199 ¥ 27,693
$ 28,030 142,671 365 (125) 434 457 (37,265) (654) (9,840) (11,394) 729
142,016 (1,299) (243) (5,916) (6,802) 241,164 3,800 12,049 (142,016) (728) 114,269
(372,313) 268,057 (41,896) 55,890 (2,530) (11,759) 96 (114,938)
789 (218,604)
(7,331) 9,480 (17) 2,132
33 (102,170) 399,818 $ 297,648
¥ (5,851) 10,017 598 (153) (147) (255) (428) 133 (290) (1,624) 115 20,768
1,313 3,453 (796) (945) 25,908 (10,214) 1,669 (128) 17,235
(19,120) 18,700 (18,974) 27,807 (592) (5,804) 4 (11,158) 32 232 637 (8,236)
17,770 (19,770) (5,457) 98 (3) (7,362)
(5) 1,632 35,567 ¥ 37,199
Tokyo Stock Exchange Group, Inc. and Subsidiaries
Consolidated Statements of Cash Flows
32 TOKYO STOCK EXCHANGE GROUP, INC. Annual Report 2010 TOKYO STOCK EXCHANGE GROUP, INC. Annual Report 2010
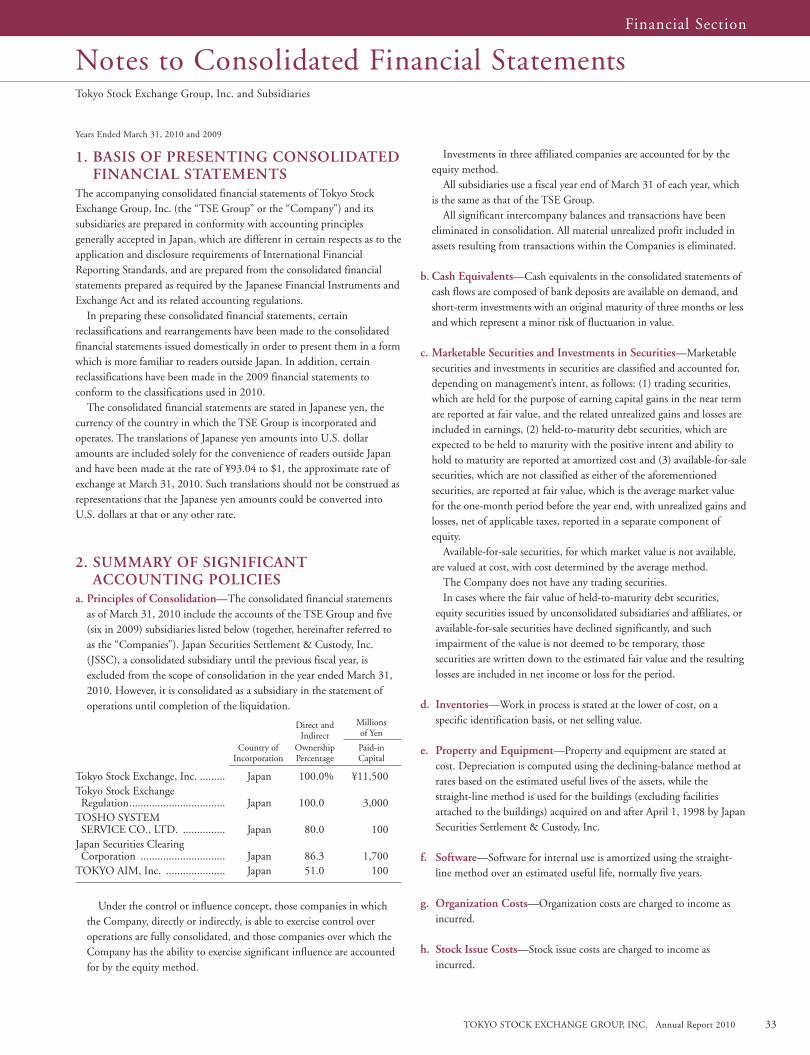
Years Ended March 31, 2010 and 2009
1 . BASIS OF PRESENTING CONSOLIDATED FINANCIAL STATEMENTS
The accompanying consolidated financial statements of Tokyo Stock Exchange Group, Inc. (the “TSE Group” or the “Company”) and its subsidiaries are prepared in conformity with accounting principles generally accepted in Japan, which are different in certain respects as to the application and disclosure requirements of International Financial Reporting Standards, and are prepared from the consolidated financial statements prepared as required by the Japanese Financial Instruments and Exchange Act and its related accounting regulations. In preparing these consolidated financial statements, certain reclassifications and rearrangements have been made to the consolidated financial statements issued domestically in order to present them in a form which is more familiar to readers outside Japan. In addition, certain reclassifications have been made in the 2009 financial statements to conform to the classifications used in 2010. The consolidated financial statements are stated in Japanese yen, the currency of the country in which the TSE Group is incorporated and operates. The translations of Japanese yen amounts into U.S. dollar amounts are included solely for the convenience of readers outside Japan and have been made at the rate of ¥93.04 to $1, the approximate rate of exchange at March 31, 2010. Such translations should not be construed as representations that the Japanese yen amounts could be converted into U.S. dollars at that or any other rate.
2 . SUMMARY OF SIGNIFICANT ACCOUNTING POLICIES
a . Principles of Consolidation—The consolidated financial statements as of March 31, 2010 include the accounts of the TSE Group and five (six in 2009) subsidiaries listed below (together, hereinafter referred to as the “Companies”). Japan Securities Settlement & Custody, Inc. (JSSC), a consolidated subsidiary until the previous fiscal year, is excluded from the scope of consolidation in the year ended March 31, 2010. However, it is consolidated as a subsidiary in the statement of operations until completion of the liquidation.
Direct and Millions Indirect of Yen
Country of Ownership Paid-in Incorporation Percentage Capital
Tokyo Stock Exchange, Inc. ......... Japan 100.0% ¥11,500Tokyo Stock Exchange Regulation .................................. Japan 100.0 3,000TOSHO SYSTEM SERVICE CO., LTD. ............... Japan 80.0 100Japan Securities Clearing Corporation .............................. Japan 86.3 1,700TOKYO AIM, Inc. ..................... Japan 51.0 100
Under the control or influence concept, those companies in which the Company, directly or indirectly, is able to exercise control over operations are fully consolidated, and those companies over which the Company has the ability to exercise significant influence are accounted for by the equity method.
Investments in three affiliated companies are accounted for by the equity method. All subsidiaries use a fiscal year end of March 31 of each year, which is the same as that of the TSE Group. All significant intercompany balances and transactions have been eliminated in consolidation. All material unrealized profit included in assets resulting from transactions within the Companies is eliminated.
b . Cash Equivalents—Cash equivalents in the consolidated statements of cash flows are composed of bank deposits are available on demand, and short-term investments with an original maturity of three months or less and which represent a minor risk of fluctuation in value.
c . Marketable Securities and Investments in Securities—Marketable securities and investments in securities are classified and accounted for, depending on management’s intent, as follows: (1) trading securities, which are held for the purpose of earning capital gains in the near term are reported at fair value, and the related unrealized gains and losses are included in earnings, (2) held-to-maturity debt securities, which are expected to be held to maturity with the positive intent and ability to hold to maturity are reported at amortized cost and (3) available-for-sale securities, which are not classified as either of the aforementioned securities, are reported at fair value, which is the average market value for the one-month period before the year end, with unrealized gains and losses, net of applicable taxes, reported in a separate component of equity.
Available-for-sale securities, for which market value is not available, are valued at cost, with cost determined by the average method.
The Company does not have any trading securities. In cases where the fair value of held-to-maturity debt securities, equity securities issued by unconsolidated subsidiaries and affiliates, or available-for-sale securities have declined significantly, and such impairment of the value is not deemed to be temporary, those securities are written down to the estimated fair value and the resulting losses are included in net income or loss for the period.
d . Inventories—Work in process is stated at the lower of cost, on a specific identification basis, or net selling value.
e . Property and Equipment—Property and equipment are stated at cost. Depreciation is computed using the declining-balance method at rates based on the estimated useful lives of the assets, while the straight-line method is used for the buildings (excluding facilities attached to the buildings) acquired on and after April 1, 1998 by Japan Securities Settlement & Custody, Inc.
f . Software—Software for internal use is amortized using the straight-line method over an estimated useful life, normally five years.
g . Organization Costs—Organization costs are charged to income as incurred.
h . Stock Issue Costs—Stock issue costs are charged to income as incurred.
Tokyo Stock Exchange Group, Inc. and Subsidiaries
Notes to Consolidated Financial StatementsFinancial Section
TOKYO STOCK EXCHANGE GROUP, INC. Annual Report 2010 33TOKYO STOCK EXCHANGE GROUP, INC. Annual Report 2010
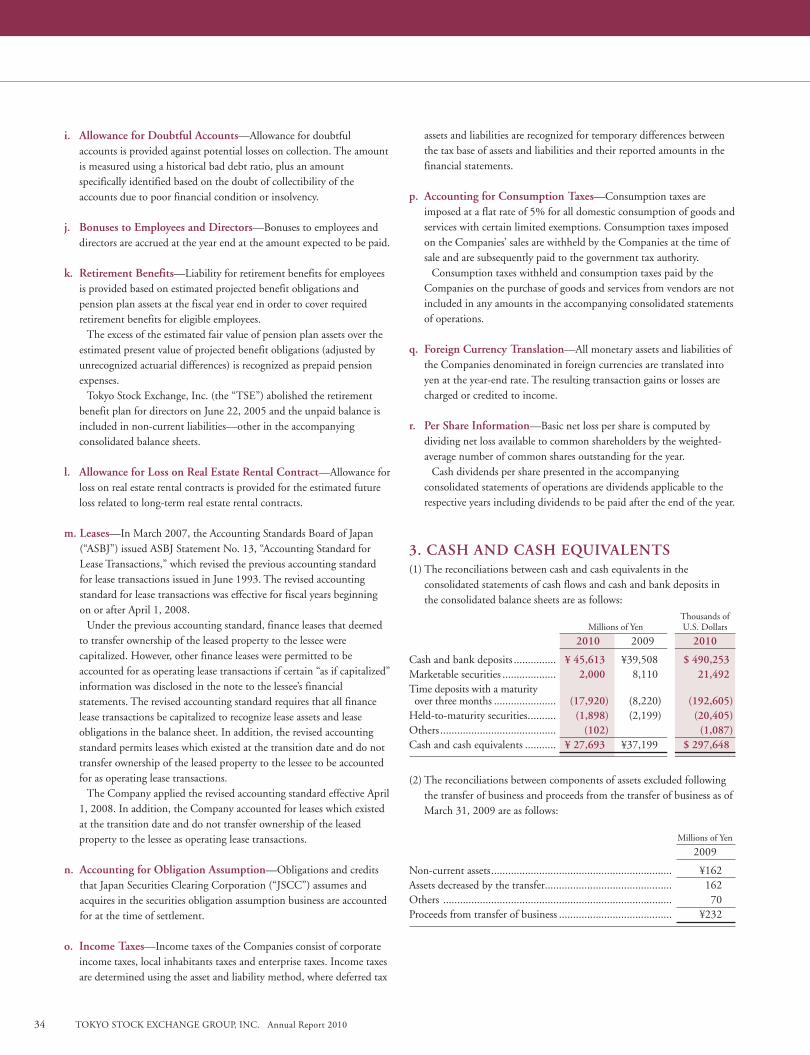
i . Allowance for Doubtful Accounts—Allowance for doubtful accounts is provided against potential losses on collection. The amount is measured using a historical bad debt ratio, plus an amount specifically identified based on the doubt of collectibility of the accounts due to poor financial condition or insolvency.
j . Bonuses to Employees and Directors—Bonuses to employees and directors are accrued at the year end at the amount expected to be paid.
k . Retirement Benefits—Liability for retirement benefits for employees is provided based on estimated projected benefit obligations and pension plan assets at the fiscal year end in order to cover required retirement benefits for eligible employees.
The excess of the estimated fair value of pension plan assets over the estimated present value of projected benefit obligations (adjusted by unrecognized actuarial differences) is recognized as prepaid pension expenses.
Tokyo Stock Exchange, Inc. (the “TSE”) abolished the retirement benefit plan for directors on June 22, 2005 and the unpaid balance is included in non-current liabilities—other in the accompanying consolidated balance sheets.
l . Allowance for Loss on Real Estate Rental Contract—Allowance for
loss on real estate rental contracts is provided for the estimated future loss related to long-term real estate rental contracts.
m . Leases—In March 2007, the Accounting Standards Board of Japan (“ASBJ”) issued ASBJ Statement No. 13, “Accounting Standard for Lease Transactions,” which revised the previous accounting standard for lease transactions issued in June 1993. The revised accounting standard for lease transactions was effective for fiscal years beginning on or after April 1, 2008.
Under the previous accounting standard, finance leases that deemed to transfer ownership of the leased property to the lessee were capitalized. However, other finance leases were permitted to be accounted for as operating lease transactions if certain “as if capitalized” information was disclosed in the note to the lessee’s financial statements. The revised accounting standard requires that all finance lease transactions be capitalized to recognize lease assets and lease obligations in the balance sheet. In addition, the revised accounting standard permits leases which existed at the transition date and do not transfer ownership of the leased property to the lessee to be accounted for as operating lease transactions.
The Company applied the revised accounting standard effective April 1, 2008. In addition, the Company accounted for leases which existed at the transition date and do not transfer ownership of the leased property to the lessee as operating lease transactions.
n . Accounting for Obligation Assumption—Obligations and credits
that Japan Securities Clearing Corporation (“JSCC”) assumes and acquires in the securities obligation assumption business are accounted for at the time of settlement.
o . Income Taxes—Income taxes of the Companies consist of corporate income taxes, local inhabitants taxes and enterprise taxes. Income taxes are determined using the asset and liability method, where deferred tax
assets and liabilities are recognized for temporary differences between the tax base of assets and liabilities and their reported amounts in the financial statements.
p . Accounting for Consumption Taxes—Consumption taxes are imposed at a flat rate of 5% for all domestic consumption of goods and services with certain limited exemptions. Consumption taxes imposed on the Companies’ sales are withheld by the Companies at the time of sale and are subsequently paid to the government tax authority.
Consumption taxes withheld and consumption taxes paid by the Companies on the purchase of goods and services from vendors are not included in any amounts in the accompanying consolidated statements of operations.
q . Foreign Currency Translation—All monetary assets and liabilities of the Companies denominated in foreign currencies are translated into yen at the year-end rate. The resulting transaction gains or losses are charged or credited to income.
r . Per Share Information—Basic net loss per share is computed by dividing net loss available to common shareholders by the weighted-average number of common shares outstanding for the year.
Cash dividends per share presented in the accompanying consolidated statements of operations are dividends applicable to the respective years including dividends to be paid after the end of the year.
3 . CASH AND CASH EQUIVALENTS(1) The reconciliations between cash and cash equivalents in the
consolidated statements of cash flows and cash and bank deposits in the consolidated balance sheets are as follows:
Thousands of Millions of Yen U.S. Dollars
2010 2009 2010
Cash and bank deposits ............... ¥ 45,613 ¥39,508 $ 490,253Marketable securities ................... 2,000 8,110 21,492Time deposits with a maturity over three months ...................... (17,920) (8,220) (192,605)Held-to-maturity securities. ......... (1,898) (2,199) (20,405)Others ......................................... (102) (1,087)Cash and cash equivalents ........... ¥ 27,693 ¥37,199 $ 297,648
(2) The reconciliations between components of assets excluded following the transfer of business and proceeds from the transfer of business as of March 31, 2009 are as follows:
Millions of Yen
2009
Non-current assets ................................................................ ¥162Assets decreased by the transfer............................................. 162Others ................................................................................. 70Proceeds from transfer of business ........................................ ¥232
34 TOKYO STOCK EXCHANGE GROUP, INC. Annual Report 2010 TOKYO STOCK EXCHANGE GROUP, INC. Annual Report 2010
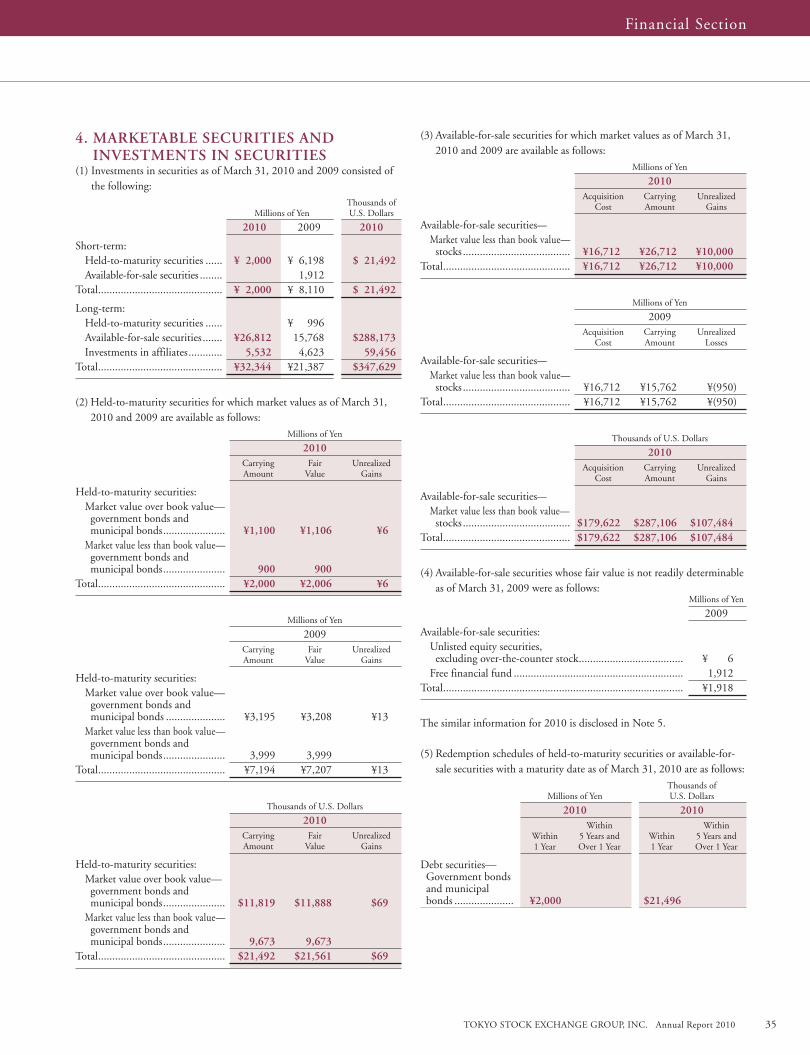
4 . MARKETABLE SECURITIES AND INVESTMENTS IN SECURITIES
(1) Investments in securities as of March 31, 2010 and 2009 consisted of the following:
Thousands of Millions of Yen U.S. Dollars
2010 2009 2010
Short-term: Held-to-maturity securities ...... ¥ 2,000 ¥ 6,198 $ 21,492 Available-for-sale securities ........ 1,912 Total ............................................ ¥ 2,000 ¥ 8,110 $ 21,492
Long-term: Held-to-maturity securities ...... ¥ 996 Available-for-sale securities ....... ¥26,812 15,768 $288,173 Investments in affiliates ............ 5,532 4,623 59,456Total ............................................ ¥32,344 ¥21,387 $347,629
(2) Held-to-maturity securities for which market values as of March 31, 2010 and 2009 are available as follows:
Millions of Yen
2010 Carrying Fair Unrealized Amount Value Gains
Held-to-maturity securities: Market value over book value— government bonds and municipal bonds ...................... ¥1,100 ¥1,106 ¥6 Market value less than book value— government bonds and municipal bonds ...................... 900 900Total ............................................. ¥2,000 ¥2,006 ¥6
Millions of Yen
2009 Carrying Fair Unrealized Amount Value Gains
Held-to-maturity securities: Market value over book value— government bonds and municipal bonds ..................... ¥3,195 ¥3,208 ¥13 Market value less than book value— government bonds and municipal bonds ...................... 3,999 3,999Total ............................................. ¥7,194 ¥7,207 ¥13
Thousands of U.S. Dollars
2010 Carrying Fair Unrealized Amount Value Gains
Held-to-maturity securities: Market value over book value— government bonds and municipal bonds ...................... $11,819 $11,888 $69 Market value less than book value— government bonds and municipal bonds ...................... 9,673 9,673 Total ............................................. $21,492 $21,561 $69
(3) Available-for-sale securities for which market values as of March 31, 2010 and 2009 are available as follows:
Millions of Yen
2010 Acquisition Carrying Unrealized Cost Amount Gains
Available-for-sale securities— Market value less than book value— stocks ...................................... ¥16,712 ¥26,712 ¥10,000Total ............................................. ¥16,712 ¥26,712 ¥10,000
Millions of Yen
2009 Acquisition Carrying Unrealized Cost Amount Losses
Available-for-sale securities— Market value less than book value— stocks ...................................... ¥16,712 ¥15,762 ¥(950)Total ............................................. ¥16,712 ¥15,762 ¥(950)
Thousands of U.S. Dollars
2010 Acquisition Carrying Unrealized Cost Amount Gains
Available-for-sale securities— Market value less than book value— stocks ...................................... $179,622 $287,106 $107,484Total ............................................. $179,622 $287,106 $107,484
(4) Available-for-sale securities whose fair value is not readily determinable as of March 31, 2009 were as follows:
Millions of Yen
2009
Available-for-sale securities: Unlisted equity securities, excluding over-the-counter stock ..................................... ¥ 6 Free financial fund ............................................................ 1,912Total ..................................................................................... ¥1,918
The similar information for 2010 is disclosed in Note 5.
(5) Redemption schedules of held-to-maturity securities or available-for-sale securities with a maturity date as of March 31, 2010 are as follows:
Thousands of Millions of Yen U.S. Dollars
2010 2010 Within Within Within 5 Years and Within 5 Years and 1 Year Over 1 Year 1 Year Over 1 Year
Debt securities— Government bonds and municipal bonds ..................... ¥2,000 $21,496
Financial Section
TOKYO STOCK EXCHANGE GROUP, INC. Annual Report 2010 35TOKYO STOCK EXCHANGE GROUP, INC. Annual Report 2010
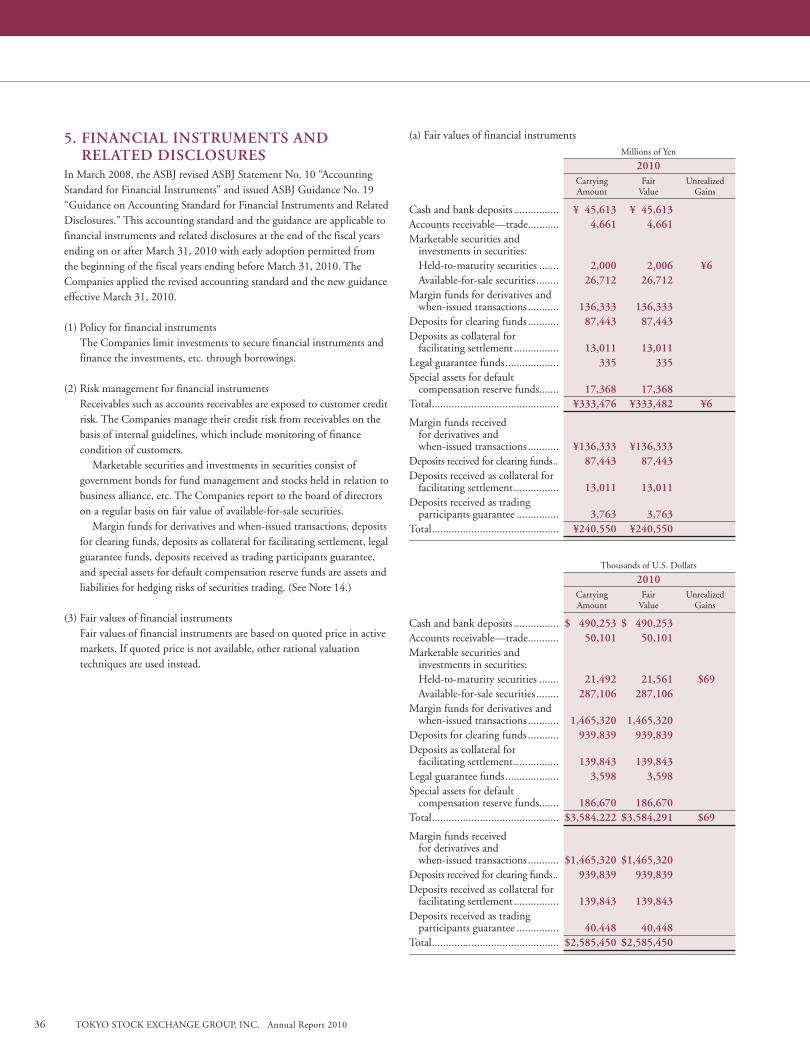
5 . FINANCIAL INSTRUMENTS AND RELATED DISCLOSURES
In March 2008, the ASBJ revised ASBJ Statement No. 10 “Accounting Standard for Financial Instruments” and issued ASBJ Guidance No. 19 “Guidance on Accounting Standard for Financial Instruments and Related Disclosures.” This accounting standard and the guidance are applicable to financial instruments and related disclosures at the end of the fiscal years ending on or after March 31, 2010 with early adoption permitted from the beginning of the fiscal years ending before March 31, 2010. The Companies applied the revised accounting standard and the new guidance effective March 31, 2010.
(1) Policy for financial instruments The Companies limit investments to secure financial instruments and finance the investments, etc. through borrowings.
(2) Risk management for financial instruments Receivables such as accounts receivables are exposed to customer credit risk. The Companies manage their credit risk from receivables on the basis of internal guidelines, which include monitoring of finance condition of customers. Marketable securities and investments in securities consist of government bonds for fund management and stocks held in relation to business alliance, etc. The Companies report to the board of directors on a regular basis on fair value of available-for-sale securities. Margin funds for derivatives and when-issued transactions, deposits for clearing funds, deposits as collateral for facilitating settlement, legal guarantee funds, deposits received as trading participants guarantee, and special assets for default compensation reserve funds are assets and liabilities for hedging risks of securities trading. (See Note 14.)
(3) Fair values of financial instruments Fair values of financial instruments are based on quoted price in active markets. If quoted price is not available, other rational valuation techniques are used instead.
(a) Fair values of financial instruments
Millions of Yen
2010 Carrying Fair Unrealized Amount Value Gains
Cash and bank deposits ................ ¥ 45,613 ¥ 45,613 Accounts receivable—trade........... 4,661 4,661 Marketable securities and investments in securities: Held-to-maturity securities ....... 2,000 2,006 ¥6 Available-for-sale securities ........ 26,712 26,712 Margin funds for derivatives and when-issued transactions ........... 136,333 136,333 Deposits for clearing funds ........... 87,443 87,443 Deposits as collateral for facilitating settlement ................ 13,011 13,011 Legal guarantee funds ................... 335 335 Special assets for default compensation reserve funds....... 17,368 17,368 Total ............................................. ¥333,476 ¥333,482 ¥6
Margin funds received for derivatives and when-issued transactions ........... ¥136,333 ¥136,333 Deposits received for clearing funds .. 87,443 87,443 Deposits received as collateral for facilitating settlement ................ 13,011 13,011 Deposits received as trading participants guarantee ............... 3,763 3,763 Total ............................................. ¥240,550 ¥240,550
Thousands of U.S. Dollars
2010 Carrying Fair Unrealized Amount Value Gains
Cash and bank deposits ................ $ 490,253 $ 490,253 Accounts receivable—trade........... 50,101 50,101 Marketable securities and investments in securities: Held-to-maturity securities ....... 21,492 21,561 $69 Available-for-sale securities ........ 287,106 287,106 Margin funds for derivatives and when-issued transactions ........... 1,465,320 1,465,320 Deposits for clearing funds ........... 939,839 939,839 Deposits as collateral for facilitating settlement ................ 139,843 139,843 Legal guarantee funds ................... 3,598 3,598 Special assets for default compensation reserve funds....... 186,670 186,670 Total ............................................. $3,584,222 $3,584,291 $69
Margin funds received for derivatives and when-issued transactions ........... $1,465,320 $1,465,320 Deposits received for clearing funds .. 939,839 939,839 Deposits received as collateral for facilitating settlement ................ 139,843 139,843 Deposits received as trading participants guarantee ............... 40,448 40,448 Total ............................................. $2,585,450 $2,585,450
36 TOKYO STOCK EXCHANGE GROUP, INC. Annual Report 2010 TOKYO STOCK EXCHANGE GROUP, INC. Annual Report 2010
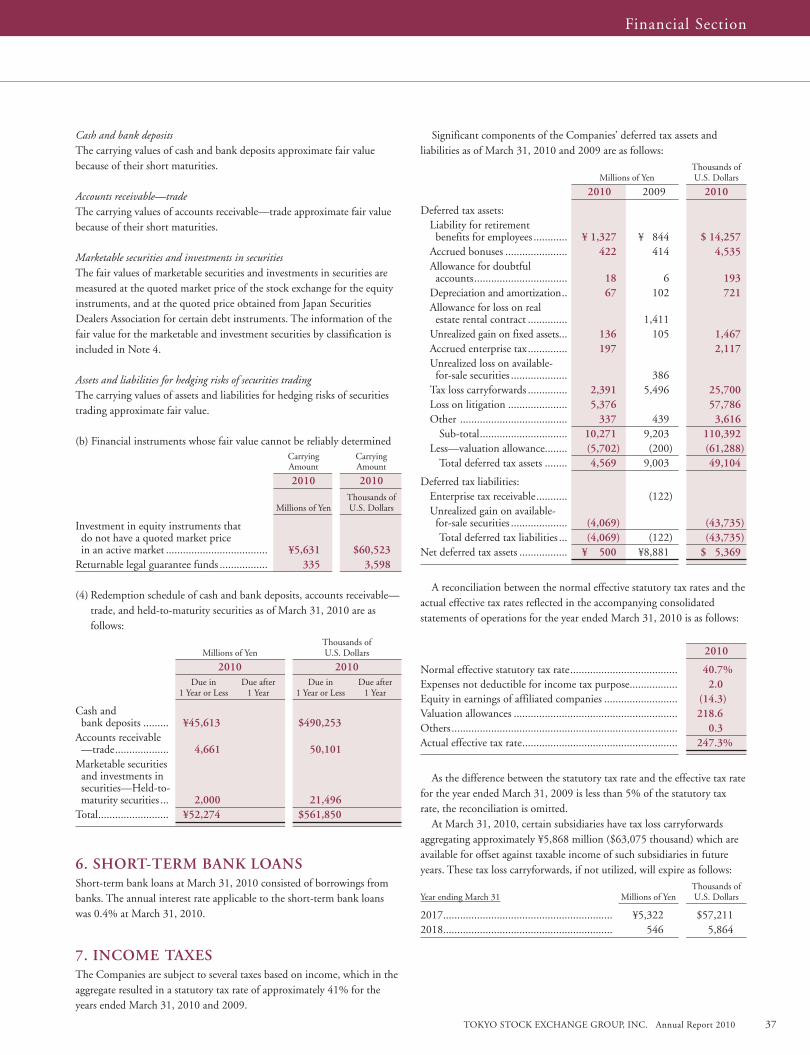
Cash and bank depositsThe carrying values of cash and bank deposits approximate fair value because of their short maturities.
Accounts receivable—tradeThe carrying values of accounts receivable—trade approximate fair value because of their short maturities.
Marketable securities and investments in securitiesThe fair values of marketable securities and investments in securities are measured at the quoted market price of the stock exchange for the equity instruments, and at the quoted price obtained from Japan Securities Dealers Association for certain debt instruments. The information of the fair value for the marketable and investment securities by classification is included in Note 4.
Assets and liabilities for hedging risks of securities tradingThe carrying values of assets and liabilities for hedging risks of securities trading approximate fair value.
(b) Financial instruments whose fair value cannot be reliably determined Carrying Carrying Amount Amount
2010 2010 Thousands of Millions of Yen U.S. Dollars
Investment in equity instruments that do not have a quoted market price in an active market .................................... ¥5,631 $60,523Returnable legal guarantee funds ................. 335 3,598 (4) Redemption schedule of cash and bank deposits, accounts receivable—
trade, and held-to-maturity securities as of March 31, 2010 are as follows:
Thousands of Millions of Yen U.S. Dollars
2010 2010 Due in Due after Due in Due after 1 Year or Less 1 Year 1 Year or Less 1 Year
Cash and bank deposits ......... ¥45,613 $490,253Accounts receivable —trade ................... 4,661 50,101Marketable securities and investments in securities—Held-to- maturity securities ... 2,000 21,496Total ......................... ¥52,274 $561,850
6 . SHORT-TERM BANK LOANSShort-term bank loans at March 31, 2010 consisted of borrowings from banks. The annual interest rate applicable to the short-term bank loans was 0.4% at March 31, 2010.
7 . INCOME TAXESThe Companies are subject to several taxes based on income, which in the aggregate resulted in a statutory tax rate of approximately 41% for the years ended March 31, 2010 and 2009.
Significant components of the Companies’ deferred tax assets and liabilities as of March 31, 2010 and 2009 are as follows:
Thousands of Millions of Yen U.S. Dollars
2010 2009 2010
Deferred tax assets: Liability for retirement benefits for employees ............ ¥ 1,327 ¥ 844 $ 14,257 Accrued bonuses ...................... 422 414 4,535 Allowance for doubtful accounts ................................. 18 6 193 Depreciation and amortization .. 67 102 721 Allowance for loss on real estate rental contract .............. 1,411 Unrealized gain on fixed assets... 136 105 1,467 Accrued enterprise tax .............. 197 2,117 Unrealized loss on available- for-sale securities .................... 386 Tax loss carryforwards .............. 2,391 5,496 25,700 Loss on litigation ..................... 5,376 57,786 Other ...................................... 337 439 3,616 Sub-total ............................... 10,271 9,203 110,392 Less—valuation allowance........ (5,702) (200) (61,288) Total deferred tax assets ........ 4,569 9,003 49,104
Deferred tax liabilities: Enterprise tax receivable ........... (122) Unrealized gain on available- for-sale securities .................... (4,069) (43,735) Total deferred tax liabilities ... (4,069) (122) (43,735)Net deferred tax assets ................. ¥ 500 ¥8,881 $ 5,369
A reconciliation between the normal effective statutory tax rates and the actual effective tax rates reflected in the accompanying consolidated statements of operations for the year ended March 31, 2010 is as follows:
2010
Normal effective statutory tax rate ...................................... 40 .7%Expenses not deductible for income tax purpose ................. 2 .0Equity in earnings of affiliated companies .......................... (14 .3) Valuation allowances .......................................................... 218 .6Others ................................................................................ 0 .3Actual effective tax rate ....................................................... 247 .3%
As the difference between the statutory tax rate and the effective tax rate for the year ended March 31, 2009 is less than 5% of the statutory tax rate, the reconciliation is omitted. At March 31, 2010, certain subsidiaries have tax loss carryforwards aggregating approximately ¥5,868 million ($63,075 thousand) which are available for offset against taxable income of such subsidiaries in future years. These tax loss carryforwards, if not utilized, will expire as follows:
Thousands ofYear ending March 31 Millions of Yen U.S. Dollars
2017............................................................ ¥5,322 $57,2112018............................................................ 546 5,864
Financial Section
TOKYO STOCK EXCHANGE GROUP, INC. Annual Report 2010 37TOKYO STOCK EXCHANGE GROUP, INC. Annual Report 2010
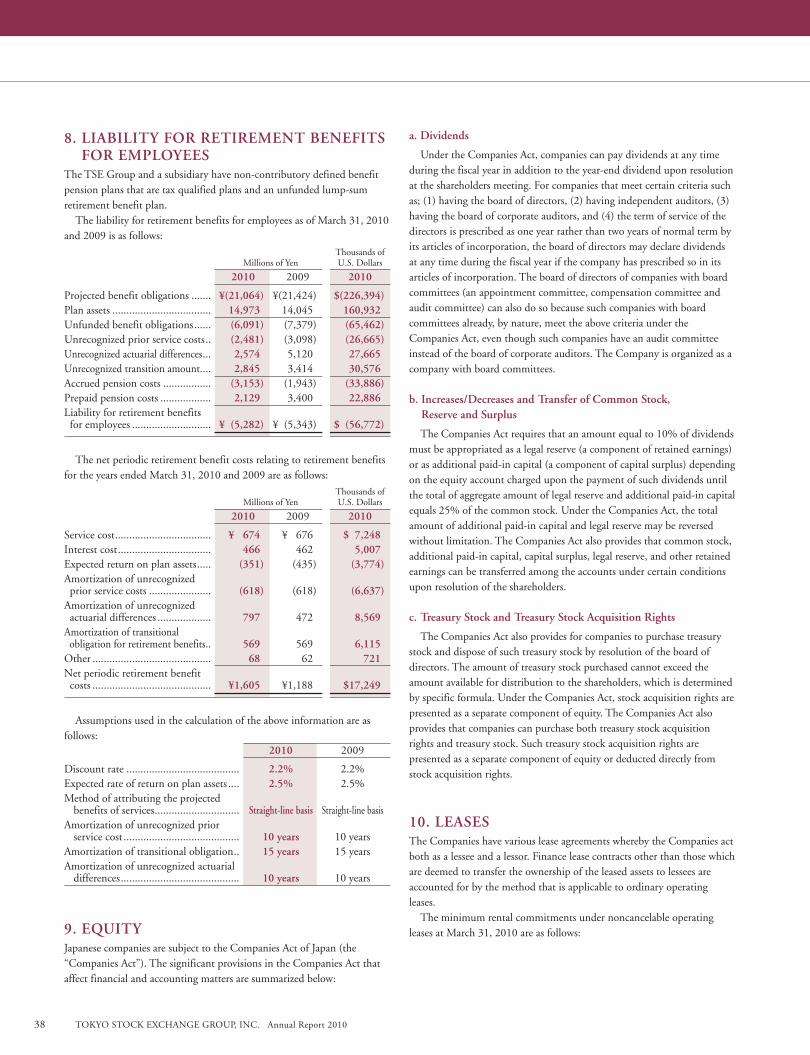
8 . LIABILITY FOR RETIREMENT BENEFITS FOR EMPLOYEES
The TSE Group and a subsidiary have non-contributory defined benefit pension plans that are tax qualified plans and an unfunded lump-sum retirement benefit plan. The liability for retirement benefits for employees as of March 31, 2010 and 2009 is as follows:
Thousands of Millions of Yen U.S. Dollars
2010 2009 2010
Projected benefit obligations ....... ¥(21,064) ¥(21,424) $(226,394)Plan assets ................................... 14,973 14,045 160,932Unfunded benefit obligations ...... (6,091) (7,379) (65,462)Unrecognized prior service costs .. (2,481) (3,098) (26,665)Unrecognized actuarial differences ... 2,574 5,120 27,665Unrecognized transition amount.... 2,845 3,414 30,576Accrued pension costs ................. (3,153) (1,943) (33,886)Prepaid pension costs .................. 2,129 3,400 22,886Liability for retirement benefits for employees ............................ ¥ (5,282) ¥ (5,343) $ (56,772)
The net periodic retirement benefit costs relating to retirement benefits for the years ended March 31, 2010 and 2009 are as follows:
Thousands of Millions of Yen U.S. Dollars
2010 2009 2010
Service cost .................................. ¥ 674 ¥ 676 $ 7,248Interest cost ................................. 466 462 5,007Expected return on plan assets ..... (351) (435) (3,774)Amortization of unrecognized prior service costs ...................... (618) (618) (6,637)Amortization of unrecognized actuarial differences ................... 797 472 8,569Amortization of transitional obligation for retirement benefits.. 569 569 6,115Other .......................................... 68 62 721Net periodic retirement benefit costs .......................................... ¥1,605 ¥1,188 $17,249
Assumptions used in the calculation of the above information are as follows: 2010 2009
Discount rate ........................................ 2 .2% 2.2%Expected rate of return on plan assets .... 2 .5% 2.5%Method of attributing the projected benefits of services .............................. Straight-line basis Straight-line basisAmortization of unrecognized prior service cost ......................................... 10 years 10 yearsAmortization of transitional obligation .. 15 years 15 yearsAmortization of unrecognized actuarial differences .......................................... 10 years 10 years
9 . EQUITYJapanese companies are subject to the Companies Act of Japan (the “Companies Act”). The significant provisions in the Companies Act that affect financial and accounting matters are summarized below:
a . Dividends
Under the Companies Act, companies can pay dividends at any time during the fiscal year in addition to the year-end dividend upon resolution at the shareholders meeting. For companies that meet certain criteria such as; (1) having the board of directors, (2) having independent auditors, (3) having the board of corporate auditors, and (4) the term of service of the directors is prescribed as one year rather than two years of normal term by its articles of incorporation, the board of directors may declare dividends at any time during the fiscal year if the company has prescribed so in its articles of incorporation. The board of directors of companies with board committees (an appointment committee, compensation committee and audit committee) can also do so because such companies with board committees already, by nature, meet the above criteria under the Companies Act, even though such companies have an audit committee instead of the board of corporate auditors. The Company is organized as a company with board committees.
b . Increases/Decreases and Transfer of Common Stock, Reserve and Surplus
The Companies Act requires that an amount equal to 10% of dividends must be appropriated as a legal reserve (a component of retained earnings) or as additional paid-in capital (a component of capital surplus) depending on the equity account charged upon the payment of such dividends until the total of aggregate amount of legal reserve and additional paid-in capital equals 25% of the common stock. Under the Companies Act, the total amount of additional paid-in capital and legal reserve may be reversed without limitation. The Companies Act also provides that common stock, additional paid-in capital, capital surplus, legal reserve, and other retained earnings can be transferred among the accounts under certain conditions upon resolution of the shareholders.
c . Treasury Stock and Treasury Stock Acquisition Rights
The Companies Act also provides for companies to purchase treasury stock and dispose of such treasury stock by resolution of the board of directors. The amount of treasury stock purchased cannot exceed the amount available for distribution to the shareholders, which is determined by specific formula. Under the Companies Act, stock acquisition rights are presented as a separate component of equity. The Companies Act also provides that companies can purchase both treasury stock acquisition rights and treasury stock. Such treasury stock acquisition rights are presented as a separate component of equity or deducted directly from stock acquisition rights.
10 . LEASESThe Companies have various lease agreements whereby the Companies act both as a lessee and a lessor. Finance lease contracts other than those which are deemed to transfer the ownership of the leased assets to lessees are accounted for by the method that is applicable to ordinary operating leases. The minimum rental commitments under noncancelable operating leases at March 31, 2010 are as follows:
38 TOKYO STOCK EXCHANGE GROUP, INC. Annual Report 2010 TOKYO STOCK EXCHANGE GROUP, INC. Annual Report 2010
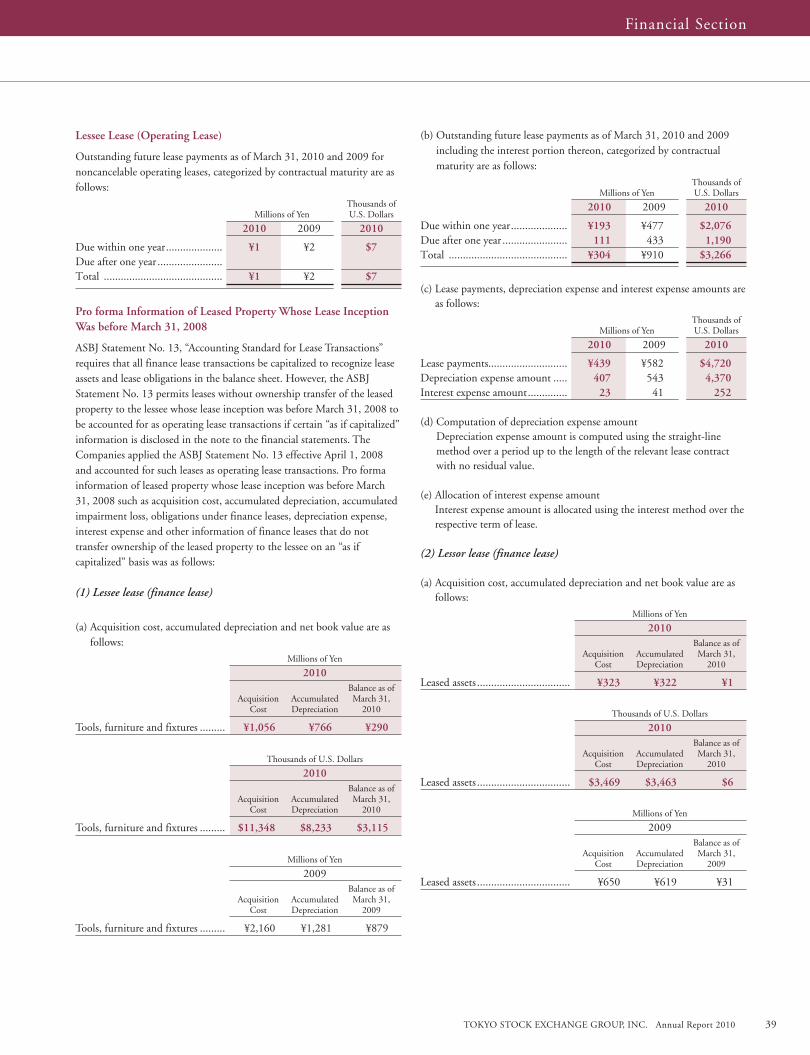
Lessee Lease (Operating Lease)
Outstanding future lease payments as of March 31, 2010 and 2009 for noncancelable operating leases, categorized by contractual maturity are as follows:
Thousands of Millions of Yen U.S. Dollars
2010 2009 2010
Due within one year .................... ¥1 ¥2 $7Due after one year .......................Total .......................................... ¥1 ¥2 $7
Pro forma Information of Leased Property Whose Lease Inception Was before March 31, 2008
ASBJ Statement No. 13, “Accounting Standard for Lease Transactions” requires that all finance lease transactions be capitalized to recognize lease assets and lease obligations in the balance sheet. However, the ASBJ Statement No. 13 permits leases without ownership transfer of the leased property to the lessee whose lease inception was before March 31, 2008 to be accounted for as operating lease transactions if certain “as if capitalized” information is disclosed in the note to the financial statements. The Companies applied the ASBJ Statement No. 13 effective April 1, 2008 and accounted for such leases as operating lease transactions. Pro forma information of leased property whose lease inception was before March 31, 2008 such as acquisition cost, accumulated depreciation, accumulated impairment loss, obligations under finance leases, depreciation expense, interest expense and other information of finance leases that do not transfer ownership of the leased property to the lessee on an “as if capitalized” basis was as follows:
(1) Lessee lease (finance lease)
(a) Acquisition cost, accumulated depreciation and net book value are as follows:
Millions of Yen
2010 Balance as of Acquisition Accumulated March 31, Cost Depreciation 2010
Tools, furniture and fixtures ......... ¥1,056 ¥766 ¥290
Thousands of U.S. Dollars
2010 Balance as of Acquisition Accumulated March 31, Cost Depreciation 2010
Tools, furniture and fixtures ......... $11,348 $8,233 $3,115
Millions of Yen
2009 Balance as of Acquisition Accumulated March 31, Cost Depreciation 2009
Tools, furniture and fixtures ......... ¥2,160 ¥1,281 ¥879
(b) Outstanding future lease payments as of March 31, 2010 and 2009 including the interest portion thereon, categorized by contractual maturity are as follows:
Thousands of Millions of Yen U.S. Dollars
2010 2009 2010
Due within one year .................... ¥193 ¥477 $2,076Due after one year ....................... 111 433 1,190Total .......................................... ¥304 ¥910 $3,266
(c) Lease payments, depreciation expense and interest expense amounts are as follows:
Thousands of Millions of Yen U.S. Dollars
2010 2009 2010
Lease payments............................ ¥439 ¥582 $4,720Depreciation expense amount ..... 407 543 4,370Interest expense amount .............. 23 41 252
(d) Computation of depreciation expense amount Depreciation expense amount is computed using the straight-line method over a period up to the length of the relevant lease contract with no residual value.
(e) Allocation of interest expense amount Interest expense amount is allocated using the interest method over the respective term of lease.
(2) Lessor lease (finance lease)
(a) Acquisition cost, accumulated depreciation and net book value are as follows:
Millions of Yen
2010 Balance as of Acquisition Accumulated March 31, Cost Depreciation 2010
Leased assets ................................. ¥323 ¥322 ¥1
Thousands of U.S. Dollars
2010 Balance as of Acquisition Accumulated March 31, Cost Depreciation 2010
Leased assets ................................. $3,469 $3,463 $6
Millions of Yen
2009 Balance as of Acquisition Accumulated March 31, Cost Depreciation 2009
Leased assets ................................. ¥650 ¥619 ¥31
Financial Section
TOKYO STOCK EXCHANGE GROUP, INC. Annual Report 2010 39TOKYO STOCK EXCHANGE GROUP, INC. Annual Report 2010
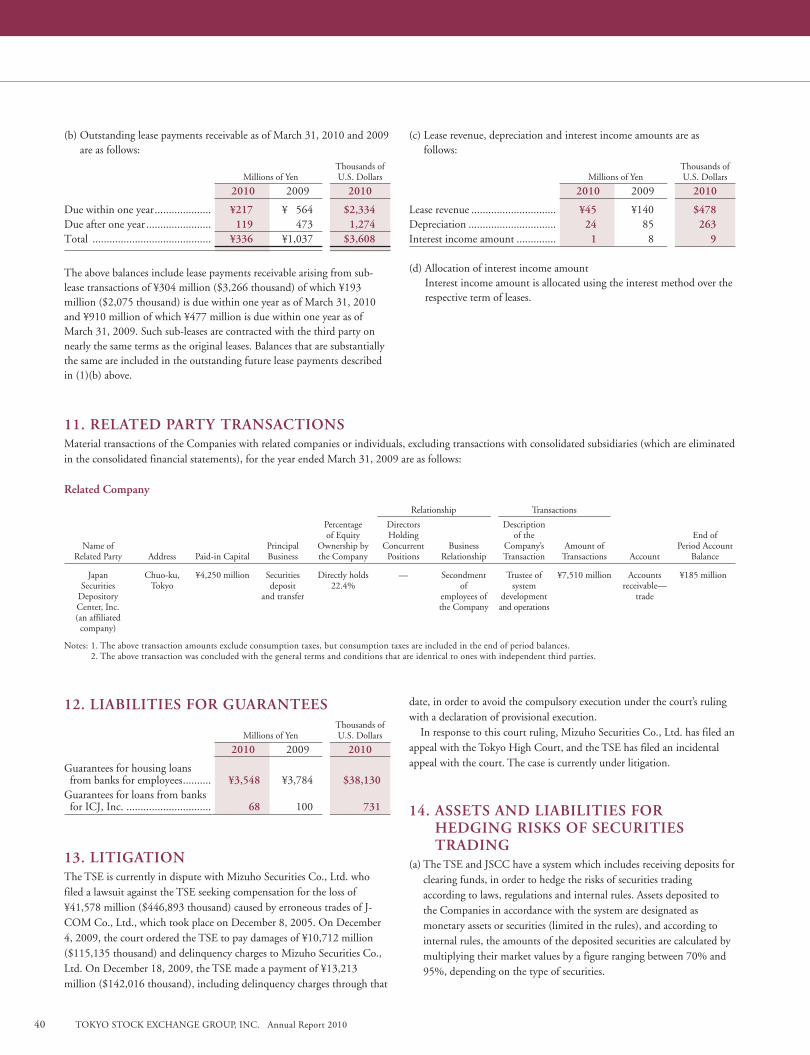
11 . RELATED PARTY TRANSACTIONSMaterial transactions of the Companies with related companies or individuals, excluding transactions with consolidated subsidiaries (which are eliminated in the consolidated financial statements), for the year ended March 31, 2009 are as follows:
Related Company
Relationship Transactions
Percentage Directors Description of Equity Holding of the End of Name of Principal Ownership by Concurrent Business Company’s Amount of Period Account Related Party Address Paid-in Capital Business the Company Positions Relationship Transaction Transactions Account Balance
Japan Chuo-ku, ¥4,250 million Securities Directly holds — Secondment Trustee of ¥7,510 million Accounts ¥185 million Securities Tokyo deposit 22.4% of system receivable— Depository and transfer employees of development trade Center, Inc. the Company and operations (an affiliated company)
Notes: 1. The above transaction amounts exclude consumption taxes, but consumption taxes are included in the end of period balances. 2. The above transaction was concluded with the general terms and conditions that are identical to ones with independent third parties.
12 . LIABILITIES FOR GUARANTEES Thousands of Millions of Yen U.S. Dollars
2010 2009 2010
Guarantees for housing loans from banks for employees .......... ¥3,548 ¥3,784 $38,130Guarantees for loans from banks for ICJ, Inc. .............................. 68 100 731
13 . LITIGATIONThe TSE is currently in dispute with Mizuho Securities Co., Ltd. who filed a lawsuit against the TSE seeking compensation for the loss of ¥41,578 million ($446,893 thousand) caused by erroneous trades of J- COM Co., Ltd., which took place on December 8, 2005. On December 4, 2009, the court ordered the TSE to pay damages of ¥10,712 million ($115,135 thousand) and delinquency charges to Mizuho Securities Co., Ltd. On December 18, 2009, the TSE made a payment of ¥13,213 million ($142,016 thousand), including delinquency charges through that
date, in order to avoid the compulsory execution under the court’s ruling with a declaration of provisional execution. In response to this court ruling, Mizuho Securities Co., Ltd. has filed an appeal with the Tokyo High Court, and the TSE has filed an incidental appeal with the court. The case is currently under litigation.
14 . ASSETS AND LIABILITIES FOR HEDGING RISKS OF SECURITIES TRADING
(a) The TSE and JSCC have a system which includes receiving deposits for clearing funds, in order to hedge the risks of securities trading according to laws, regulations and internal rules. Assets deposited to the Companies in accordance with the system are designated as monetary assets or securities (limited in the rules), and according to internal rules, the amounts of the deposited securities are calculated by multiplying their market values by a figure ranging between 70% and 95%, depending on the type of securities.
(b) Outstanding lease payments receivable as of March 31, 2010 and 2009 are as follows:
Thousands of Millions of Yen U.S. Dollars
2010 2009 2010
Due within one year .................... ¥217 ¥ 564 $2,334Due after one year ....................... 119 473 1,274Total .......................................... ¥336 ¥1,037 $3,608
The above balances include lease payments receivable arising from sub- lease transactions of ¥304 million ($3,266 thousand) of which ¥193 million ($2,075 thousand) is due within one year as of March 31, 2010 and ¥910 million of which ¥477 million is due within one year as of March 31, 2009. Such sub-leases are contracted with the third party on nearly the same terms as the original leases. Balances that are substantially the same are included in the outstanding future lease payments described in (1)(b) above.
(c) Lease revenue, depreciation and interest income amounts are as follows:
Thousands of Millions of Yen U.S. Dollars
2010 2009 2010
Lease revenue .............................. ¥45 ¥140 $478Depreciation ............................... 24 85 263Interest income amount .............. 1 8 9
(d) Allocation of interest income amount Interest income amount is allocated using the interest method over the respective term of leases.
40 TOKYO STOCK EXCHANGE GROUP, INC. Annual Report 2010 TOKYO STOCK EXCHANGE GROUP, INC. Annual Report 2010
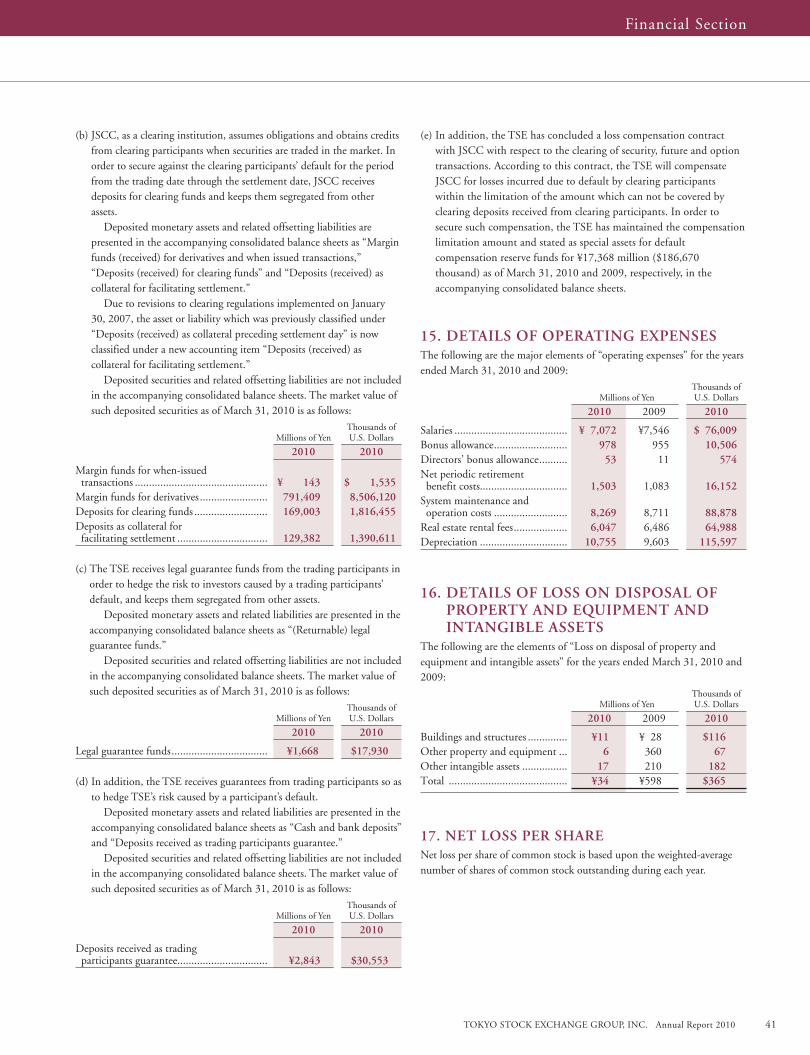
(b) JSCC, as a clearing institution, assumes obligations and obtains credits from clearing participants when securities are traded in the market. In order to secure against the clearing participants’ default for the period from the trading date through the settlement date, JSCC receives deposits for clearing funds and keeps them segregated from other assets. Deposited monetary assets and related offsetting liabilities are presented in the accompanying consolidated balance sheets as “Margin funds (received) for derivatives and when issued transactions,” “Deposits (received) for clearing funds” and “Deposits (received) as collateral for facilitating settlement.” Due to revisions to clearing regulations implemented on January 30, 2007, the asset or liability which was previously classified under “Deposits (received) as collateral preceding settlement day” is now classified under a new accounting item “Deposits (received) as collateral for facilitating settlement.” Deposited securities and related offsetting liabilities are not included in the accompanying consolidated balance sheets. The market value of such deposited securities as of March 31, 2010 is as follows:
Thousands of Millions of Yen U.S. Dollars
2010 2010
Margin funds for when-issued transactions ............................................... ¥ 143 $ 1,535Margin funds for derivatives ........................ 791,409 8,506,120Deposits for clearing funds .......................... 169,003 1,816,455Deposits as collateral for facilitating settlement ................................ 129,382 1,390,611
(c) The TSE receives legal guarantee funds from the trading participants in order to hedge the risk to investors caused by a trading participants’ default, and keeps them segregated from other assets. Deposited monetary assets and related liabilities are presented in the accompanying consolidated balance sheets as “(Returnable) legal guarantee funds.” Deposited securities and related offsetting liabilities are not included in the accompanying consolidated balance sheets. The market value of such deposited securities as of March 31, 2010 is as follows:
Thousands of Millions of Yen U.S. Dollars
2010 2010
Legal guarantee funds .................................. ¥1,668 $17,930
(d) In addition, the TSE receives guarantees from trading participants so as to hedge TSE’s risk caused by a participant’s default. Deposited monetary assets and related liabilities are presented in the accompanying consolidated balance sheets as “Cash and bank deposits” and “Deposits received as trading participants guarantee.” Deposited securities and related offsetting liabilities are not included in the accompanying consolidated balance sheets. The market value of such deposited securities as of March 31, 2010 is as follows:
Thousands of Millions of Yen U.S. Dollars
2010 2010
Deposits received as trading participants guarantee................................ ¥2,843 $30,553
(e) In addition, the TSE has concluded a loss compensation contract with JSCC with respect to the clearing of security, future and option transactions. According to this contract, the TSE will compensate JSCC for losses incurred due to default by clearing participants within the limitation of the amount which can not be covered by clearing deposits received from clearing participants. In order to secure such compensation, the TSE has maintained the compensation limitation amount and stated as special assets for default compensation reserve funds for ¥17,368 million ($186,670 thousand) as of March 31, 2010 and 2009, respectively, in the accompanying consolidated balance sheets.
15 . DETAILS OF OPERATING EXPENSESThe following are the major elements of “operating expenses” for the years ended March 31, 2010 and 2009:
Thousands of Millions of Yen U.S. Dollars
2010 2009 2010
Salaries ........................................ ¥ 7,072 ¥7,546 $ 76,009Bonus allowance .......................... 978 955 10,506Directors’ bonus allowance .......... 53 11 574Net periodic retirement benefit costs............................... 1,503 1,083 16,152System maintenance and operation costs .......................... 8,269 8,711 88,878Real estate rental fees ................... 6,047 6,486 64,988Depreciation ............................... 10,755 9,603 115,597
16 . DETAILS OF LOSS ON DISPOSAL OF PROPERTY AND EQUIPMENT AND INTANGIBLE ASSETS
The following are the elements of “Loss on disposal of property and equipment and intangible assets” for the years ended March 31, 2010 and 2009:
Thousands of Millions of Yen U.S. Dollars
2010 2009 2010
Buildings and structures .............. ¥11 ¥ 28 $116Other property and equipment ... 6 360 67Other intangible assets ................ 17 210 182Total .......................................... ¥34 ¥598 $365
17 . NET LOSS PER SHARENet loss per share of common stock is based upon the weighted-average number of shares of common stock outstanding during each year.
Financial Section
TOKYO STOCK EXCHANGE GROUP, INC. Annual Report 2010 41TOKYO STOCK EXCHANGE GROUP, INC. Annual Report 2010
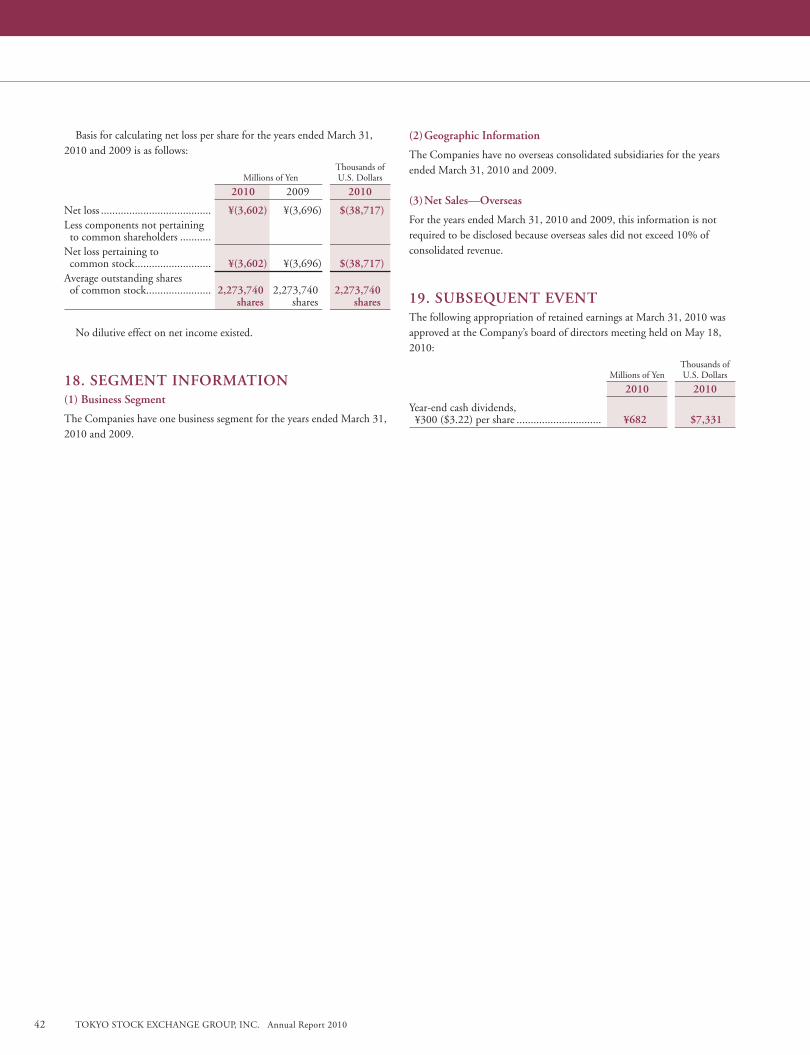
Basis for calculating net loss per share for the years ended March 31, 2010 and 2009 is as follows:
Thousands of Millions of Yen U.S. Dollars
2010 2009 2010
Net loss ....................................... ¥(3,602) ¥(3,696) $(38,717)Less components not pertaining to common shareholders ...........Net loss pertaining to common stock ........................... ¥(3,602) ¥(3,696) $(38,717)Average outstanding shares of common stock ....................... 2,273,740 2,273,740 2,273,740 shares shares shares
No dilutive effect on net income existed.
18 . SEGMENT INFORMATION(1) Business Segment
The Companies have one business segment for the years ended March 31, 2010 and 2009.
(2) Geographic Information
The Companies have no overseas consolidated subsidiaries for the years ended March 31, 2010 and 2009.
(3) Net Sales—Overseas
For the years ended March 31, 2010 and 2009, this information is not required to be disclosed because overseas sales did not exceed 10% of consolidated revenue.
19 . SUBSEQUENT EVENTThe following appropriation of retained earnings at March 31, 2010 was approved at the Company’s board of directors meeting held on May 18, 2010:
Thousands of Millions of Yen U.S. Dollars
2010 2010
Year-end cash dividends, ¥300 ($3.22) per share .............................. ¥682 $7,331
42 TOKYO STOCK EXCHANGE GROUP, INC. Annual Report 2010 TOKYO STOCK EXCHANGE GROUP, INC. Annual Report 2010
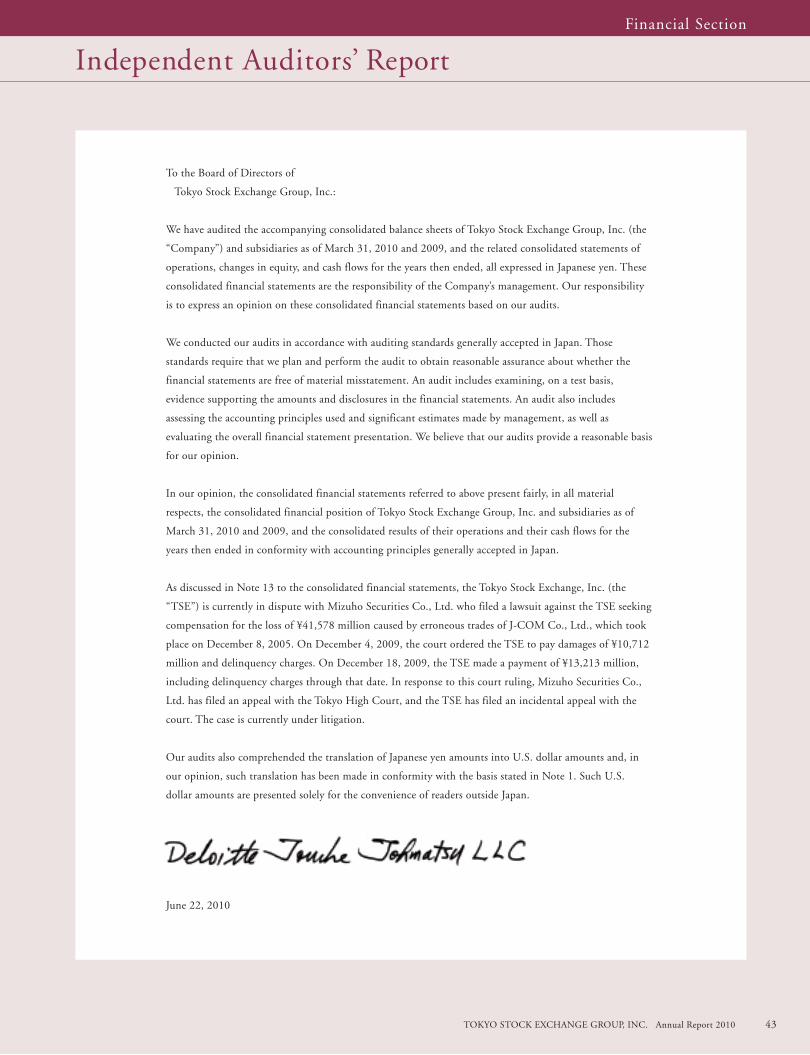
Independent Auditors’ Report
To the Board of Directors of
Tokyo Stock Exchange Group, Inc.:
We have audited the accompanying consolidated balance sheets of Tokyo Stock Exchange Group, Inc. (the
“Company”) and subsidiaries as of March 31, 2010 and 2009, and the related consolidated statements of
operations, changes in equity, and cash flows for the years then ended, all expressed in Japanese yen. These
consolidated financial statements are the responsibility of the Company’s management. Our responsibility
is to express an opinion on these consolidated financial statements based on our audits.
We conducted our audits in accordance with auditing standards generally accepted in Japan. Those
standards require that we plan and perform the audit to obtain reasonable assurance about whether the
financial statements are free of material misstatement. An audit includes examining, on a test basis,
evidence supporting the amounts and disclosures in the financial statements. An audit also includes
assessing the accounting principles used and significant estimates made by management, as well as
evaluating the overall financial statement presentation. We believe that our audits provide a reasonable basis
for our opinion.
In our opinion, the consolidated financial statements referred to above present fairly, in all material
respects, the consolidated financial position of Tokyo Stock Exchange Group, Inc. and subsidiaries as of
March 31, 2010 and 2009, and the consolidated results of their operations and their cash flows for the
years then ended in conformity with accounting principles generally accepted in Japan.
As discussed in Note 13 to the consolidated financial statements, the Tokyo Stock Exchange, Inc. (the
“TSE”) is currently in dispute with Mizuho Securities Co., Ltd. who filed a lawsuit against the TSE seeking
compensation for the loss of ¥41,578 million caused by erroneous trades of J-COM Co., Ltd., which took
place on December 8, 2005. On December 4, 2009, the court ordered the TSE to pay damages of ¥10,712
million and delinquency charges. On December 18, 2009, the TSE made a payment of ¥13,213 million,
including delinquency charges through that date. In response to this court ruling, Mizuho Securities Co.,
Ltd. has filed an appeal with the Tokyo High Court, and the TSE has filed an incidental appeal with the
court. The case is currently under litigation.
Our audits also comprehended the translation of Japanese yen amounts into U.S. dollar amounts and, in
our opinion, such translation has been made in conformity with the basis stated in Note 1. Such U.S.
dollar amounts are presented solely for the convenience of readers outside Japan.
June 22, 2010
Financial Section
TOKYO STOCK EXCHANGE GROUP, INC. Annual Report 2010 43TOKYO STOCK EXCHANGE GROUP, INC. Annual Report 2010
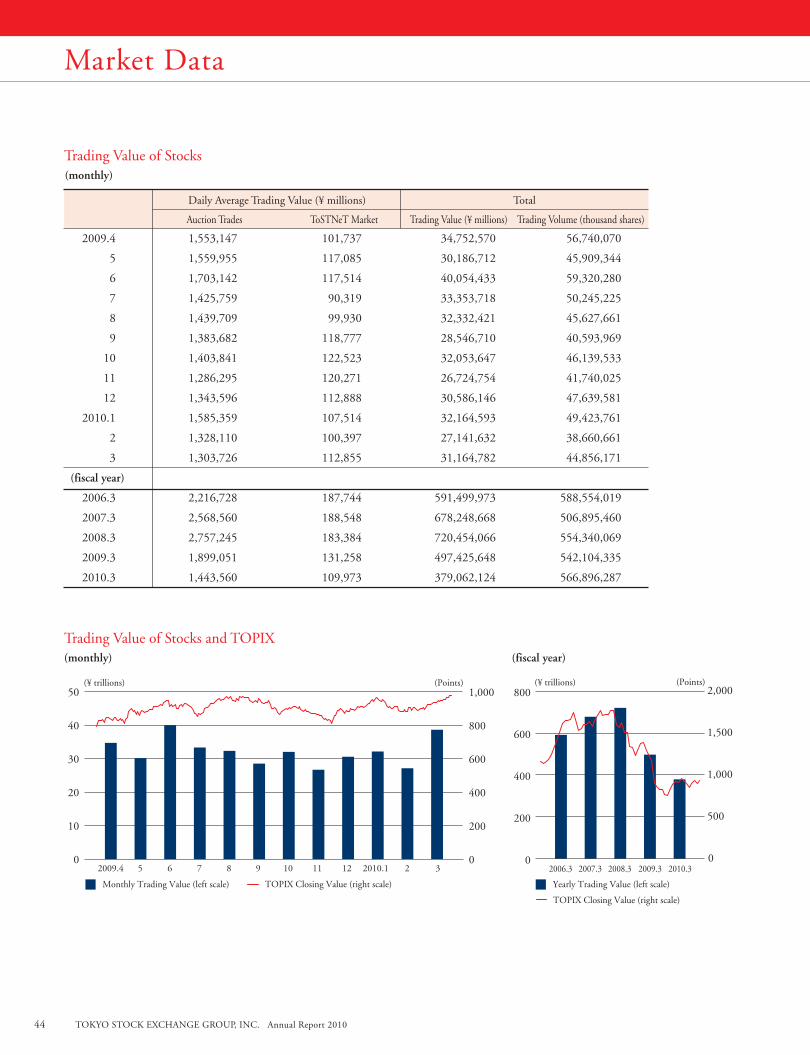
44 TOKYO STOCK EXCHANGE GROUP, INC. Annual Report 2010 TOKYO STOCK EXCHANGE GROUP, INC. Annual Report 2010
Trading Value of Stocks (monthly)
Daily Average Trading Value (¥ millions) Total
Auction Trades ToSTNeT Market Trading Value (¥ millions) Trading Volume (thousand shares)
2009.4 1,553,147 101,737 34,752,570 56,740,070
5 1,559,955 117,085 30,186,712 45,909,344
6 1,703,142 117,514 40,054,433 59,320,280
7 1,425,759 90,319 33,353,718 50,245,225
8 1,439,709 99,930 32,332,421 45,627,661
9 1,383,682 118,777 28,546,710 40,593,969
10 1,403,841 122,523 32,053,647 46,139,533
11 1,286,295 120,271 26,724,754 41,740,025
12 1,343,596 112,888 30,586,146 47,639,581
2010.1 1,585,359 107,514 32,164,593 49,423,761
2 1,328,110 100,397 27,141,632 38,660,661
3 1,303,726 112,855 31,164,782 44,856,171
(fiscal year)
2006.3 2,216,728 187,744 591,499,973 588,554,019
2007.3 2,568,560 188,548 678,248,668 506,895,460
2008.3 2,757,245 183,384 720,454,066 554,340,069
2009.3 1,899,051 131,258 497,425,648 542,104,335
2010.3 1,443,560 109,973 379,062,124 566,896,287
Market Data
Trading Value of Stocks and TOPIX(monthly) (fiscal year)
0
150
100
50
200
250
300
2009.32008.32007.32006.3
0
5,000
10,000
15,000
2008.32007.32006.3
2009.32008.32007.32006.3 2009.32008.32007.32006.3 2009.32008.32007.32006.3
Monthly Trading Value (left scale) TOPIX Closing Value (right scale)
(¥ trillions) (Points)
322010.1121110987652009.4
Yearly Trading Value (left scale)
TOPIX Closing Value (right scale)
(¥ trillions) (Points)
Monthly Trading Value (left scale)
Stock Price Index Futures(monthly)
TOPIX Futures Price (right scale)
(¥ trils.) (Points)
0
10
20
30
40
0
400
800
1,200
1,600
Yearly Trading Value (left scale)
(fiscal year)
TOPIX Futures Price (right scale)
(¥ trils.) (Points)
0
900
600
300
1,200
1,500
1,800
Japanese Government Bond Futures(monthly)
Monthly Trading Volume (left scale) 10 Year JGB Futures Price (right scale)
(thous. contracts) (¥)
120
130
140
150
0
500
1,000
1,500
(fiscal year)
Yearly Trading Volume (left scale)
10 Year JGB Futures Price (right scale)
(thous. contracts) (¥)
120
130
140
150
322009.1121110987652008.4
ETF’s Yearly Trading Value
(¥ bils.)
0
2,000
1,000
3,000
4,000
2009.3
REIT’s Yearly Trading Value
(¥ bils.)
0
4,000
2,000
6,000
8,000
Number of Newly Listed Companies, Number of Listed Companies
(Companies) (Companies)
0
50
100
150
0
1,000
2,000
3,000
Number of Newly Listed Companies (left scale)
Number of Listed Companies at the End of Fiscal Year (right scale)
2010.3
2010.3 2010.3 2010.3
2010.3322010.1121110987652009.4
0
150
100
50
200
250
300
2009.32008.32007.32006.32005.3
0
5,000
10,000
15,000
2008.32007.32006.32005.3
2009.32008.32007.32006.32005.3
Yearly Trading Value (left scale)
(fiscal year)
TOPIX Futures Price (right scale)
(¥ trils.) (Points)
0
900
600
300
1,200
1,500
1,800
(fiscal year)
Yearly Trading Volume (left scale)
10 Year JGB Futures Price (right scale)
(thous. contracts) (¥)
120
130
140
150
2009.3
Number of Newly Listed Companies, Number of Listed Companies
(Companies) (Companies)
0
50
100
150
0
1,000
2,000
3,000
Number of Newly Listed Companies (left scale)
0
10
20
30
40
50
0
200
400
600
800
Monthly Trading Volume (left scale) 10 Year JGB Futures Price (right scale)
(thousand contracts) (¥)
322010.1121110987652009.4
Yearly Trading Volume (left scale)
10 Year JGB Futures Price (right scale)
(thousand contracts) (¥)
0
30
60
90
0
50
100
150
120
130
140
150
Monthly Trading Value (left scale) TOPIX Futures Price (right scale)
(¥ trillions) (Points)
322010.1121110987652009.4
Yearly Trading Value (left scale)
TOPIX Futures Price (right scale)
0
5
10
15
20
2009.32008.32007.32006.3 2010.3
(¥ trillions) (Points)
0
50
100
150
200
250
300
0
300
600
900
1,200
1,500
1,800
2009.32008.32007.32006.3 2010.3
2009.32008.32007.32006.3 2010.3
(¥ billions)
0
1,000
2,000
3,000
4,000
2009.32008.32007.32006.3 2010.3
(¥ billions)
0
2,000
4,000
6,000
8,000
2009.32008.32007.32006.3 2010.3
Number of Newly Listed Companies (left scale)
Number of Listed Companies at the End of Fiscal Year (right scale)
(Companies) (Companies)
0
50
100
150
0
1,000
2,000
3,000
2009.32008.32007.32006.3 2010.3
0
250
500
750
1,000
120
130
140
150
0
500
1,000
1,500
2,000
Yearly Trading Value (left scale)
TOPIX Closing Value (right scale)
(¥ trillions) (Points)
0
200
400
600
800
2009.32008.32007.32006.3 2010.30
500
1,000
1,500
2,000
0
200
400
600
800
1,000
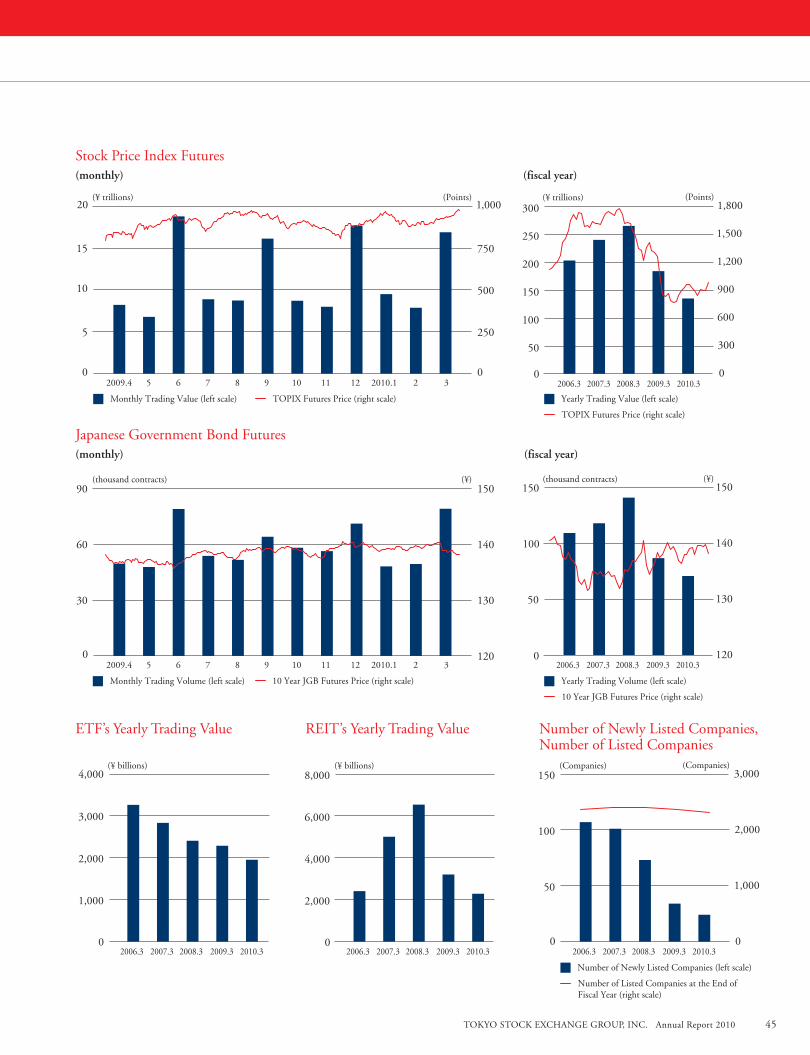
TOKYO STOCK EXCHANGE GROUP, INC. Annual Report 2010 45TOKYO STOCK EXCHANGE GROUP, INC. Annual Report 2010
Stock Price Index Futures(monthly)
Japanese Government Bond Futures(monthly) (fiscal year)
ETF’s Yearly Trading Value REIT’s Yearly Trading Value Number of Newly Listed Companies,Number of Listed Companies
(fiscal year)
0
150
100
50
200
250
300
2009.32008.32007.32006.3
0
5,000
10,000
15,000
2008.32007.32006.3
2009.32008.32007.32006.3 2009.32008.32007.32006.3 2009.32008.32007.32006.3
Monthly Trading Value (left scale) TOPIX Closing Value (right scale)
(¥ trillions) (Points)
322010.1121110987652009.4
Yearly Trading Value (left scale)
TOPIX Closing Value (right scale)
(¥ trillions) (Points)
Monthly Trading Value (left scale)
Stock Price Index Futures(monthly)
TOPIX Futures Price (right scale)
(¥ trils.) (Points)
0
10
20
30
40
0
400
800
1,200
1,600
Yearly Trading Value (left scale)
(fiscal year)
TOPIX Futures Price (right scale)
(¥ trils.) (Points)
0
900
600
300
1,200
1,500
1,800
Japanese Government Bond Futures(monthly)
Monthly Trading Volume (left scale) 10 Year JGB Futures Price (right scale)
(thous. contracts) (¥)
120
130
140
150
0
500
1,000
1,500
(fiscal year)
Yearly Trading Volume (left scale)
10 Year JGB Futures Price (right scale)
(thous. contracts) (¥)
120
130
140
150
322009.1121110987652008.4
ETF’s Yearly Trading Value
(¥ bils.)
0
2,000
1,000
3,000
4,000
2009.3
REIT’s Yearly Trading Value
(¥ bils.)
0
4,000
2,000
6,000
8,000
Number of Newly Listed Companies, Number of Listed Companies
(Companies) (Companies)
0
50
100
150
0
1,000
2,000
3,000
Number of Newly Listed Companies (left scale)
Number of Listed Companies at the End of Fiscal Year (right scale)
2010.3
2010.3 2010.3 2010.3
2010.3322010.1121110987652009.4
0
150
100
50
200
250
300
2009.32008.32007.32006.32005.3
0
5,000
10,000
15,000
2008.32007.32006.32005.3
2009.32008.32007.32006.32005.3
Yearly Trading Value (left scale)
(fiscal year)
TOPIX Futures Price (right scale)
(¥ trils.) (Points)
0
900
600
300
1,200
1,500
1,800
(fiscal year)
Yearly Trading Volume (left scale)
10 Year JGB Futures Price (right scale)
(thous. contracts) (¥)
120
130
140
150
2009.3
Number of Newly Listed Companies, Number of Listed Companies
(Companies) (Companies)
0
50
100
150
0
1,000
2,000
3,000
Number of Newly Listed Companies (left scale)
0
10
20
30
40
50
0
200
400
600
800
Monthly Trading Volume (left scale) 10 Year JGB Futures Price (right scale)
(thousand contracts) (¥)
322010.1121110987652009.4
Yearly Trading Volume (left scale)
10 Year JGB Futures Price (right scale)
(thousand contracts) (¥)
0
30
60
90
0
50
100
150
120
130
140
150
Monthly Trading Value (left scale) TOPIX Futures Price (right scale)
(¥ trillions) (Points)
322010.1121110987652009.4
Yearly Trading Value (left scale)
TOPIX Futures Price (right scale)
0
5
10
15
20
2009.32008.32007.32006.3 2010.3
(¥ trillions) (Points)
0
50
100
150
200
250
300
0
300
600
900
1,200
1,500
1,800
2009.32008.32007.32006.3 2010.3
2009.32008.32007.32006.3 2010.3
(¥ billions)
0
1,000
2,000
3,000
4,000
2009.32008.32007.32006.3 2010.3
(¥ billions)
0
2,000
4,000
6,000
8,000
2009.32008.32007.32006.3 2010.3
Number of Newly Listed Companies (left scale)
Number of Listed Companies at the End of Fiscal Year (right scale)
(Companies) (Companies)
0
50
100
150
0
1,000
2,000
3,000
2009.32008.32007.32006.3 2010.3
0
250
500
750
1,000
120
130
140
150
0
500
1,000
1,500
2,000
Yearly Trading Value (left scale)
TOPIX Closing Value (right scale)
(¥ trillions) (Points)
0
200
400
600
800
2009.32008.32007.32006.3 2010.30
500
1,000
1,500
2,000
0
200
400
600
800
1,000
0
150
100
50
200
250
300
2009.32008.32007.32006.3
0
5,000
10,000
15,000
2008.32007.32006.3
2009.32008.32007.32006.3 2009.32008.32007.32006.3 2009.32008.32007.32006.3
Monthly Trading Value (left scale) TOPIX Closing Value (right scale)
(¥ trillions) (Points)
322010.1121110987652009.4
Yearly Trading Value (left scale)
TOPIX Closing Value (right scale)
(¥ trillions) (Points)
Monthly Trading Value (left scale)
Stock Price Index Futures(monthly)
TOPIX Futures Price (right scale)
(¥ trils.) (Points)
0
10
20
30
40
0
400
800
1,200
1,600
Yearly Trading Value (left scale)
(fiscal year)
TOPIX Futures Price (right scale)
(¥ trils.) (Points)
0
900
600
300
1,200
1,500
1,800
Japanese Government Bond Futures(monthly)
Monthly Trading Volume (left scale) 10 Year JGB Futures Price (right scale)
(thous. contracts) (¥)
120
130
140
150
0
500
1,000
1,500
(fiscal year)
Yearly Trading Volume (left scale)
10 Year JGB Futures Price (right scale)
(thous. contracts) (¥)
120
130
140
150
322009.1121110987652008.4
ETF’s Yearly Trading Value
(¥ bils.)
0
2,000
1,000
3,000
4,000
2009.3
REIT’s Yearly Trading Value
(¥ bils.)
0
4,000
2,000
6,000
8,000
Number of Newly Listed Companies, Number of Listed Companies
(Companies) (Companies)
0
50
100
150
0
1,000
2,000
3,000
Number of Newly Listed Companies (left scale)
Number of Listed Companies at the End of Fiscal Year (right scale)
2010.3
2010.3 2010.3 2010.3
2010.3322010.1121110987652009.4
0
150
100
50
200
250
300
2009.32008.32007.32006.32005.3
0
5,000
10,000
15,000
2008.32007.32006.32005.3
2009.32008.32007.32006.32005.3
Yearly Trading Value (left scale)
(fiscal year)
TOPIX Futures Price (right scale)
(¥ trils.) (Points)
0
900
600
300
1,200
1,500
1,800
(fiscal year)
Yearly Trading Volume (left scale)
10 Year JGB Futures Price (right scale)
(thous. contracts) (¥)
120
130
140
150
2009.3
Number of Newly Listed Companies, Number of Listed Companies
(Companies) (Companies)
0
50
100
150
0
1,000
2,000
3,000
Number of Newly Listed Companies (left scale)
0
10
20
30
40
50
0
200
400
600
800
Monthly Trading Volume (left scale) 10 Year JGB Futures Price (right scale)
(thousand contracts) (¥)
322010.1121110987652009.4
Yearly Trading Volume (left scale)
10 Year JGB Futures Price (right scale)
(thousand contracts) (¥)
0
30
60
90
0
50
100
150
120
130
140
150
Monthly Trading Value (left scale) TOPIX Futures Price (right scale)
(¥ trillions) (Points)
322010.1121110987652009.4
Yearly Trading Value (left scale)
TOPIX Futures Price (right scale)
0
5
10
15
20
2009.32008.32007.32006.3 2010.3
(¥ trillions) (Points)
0
50
100
150
200
250
300
0
300
600
900
1,200
1,500
1,800
2009.32008.32007.32006.3 2010.3
2009.32008.32007.32006.3 2010.3
(¥ billions)
0
1,000
2,000
3,000
4,000
2009.32008.32007.32006.3 2010.3
(¥ billions)
0
2,000
4,000
6,000
8,000
2009.32008.32007.32006.3 2010.3
Number of Newly Listed Companies (left scale)
Number of Listed Companies at the End of Fiscal Year (right scale)
(Companies) (Companies)
0
50
100
150
0
1,000
2,000
3,000
2009.32008.32007.32006.3 2010.3
0
250
500
750
1,000
120
130
140
150
0
500
1,000
1,500
2,000
Yearly Trading Value (left scale)
TOPIX Closing Value (right scale)
(¥ trillions) (Points)
0
200
400
600
800
2009.32008.32007.32006.3 2010.30
500
1,000
1,500
2,000
0
200
400
600
800
1,000
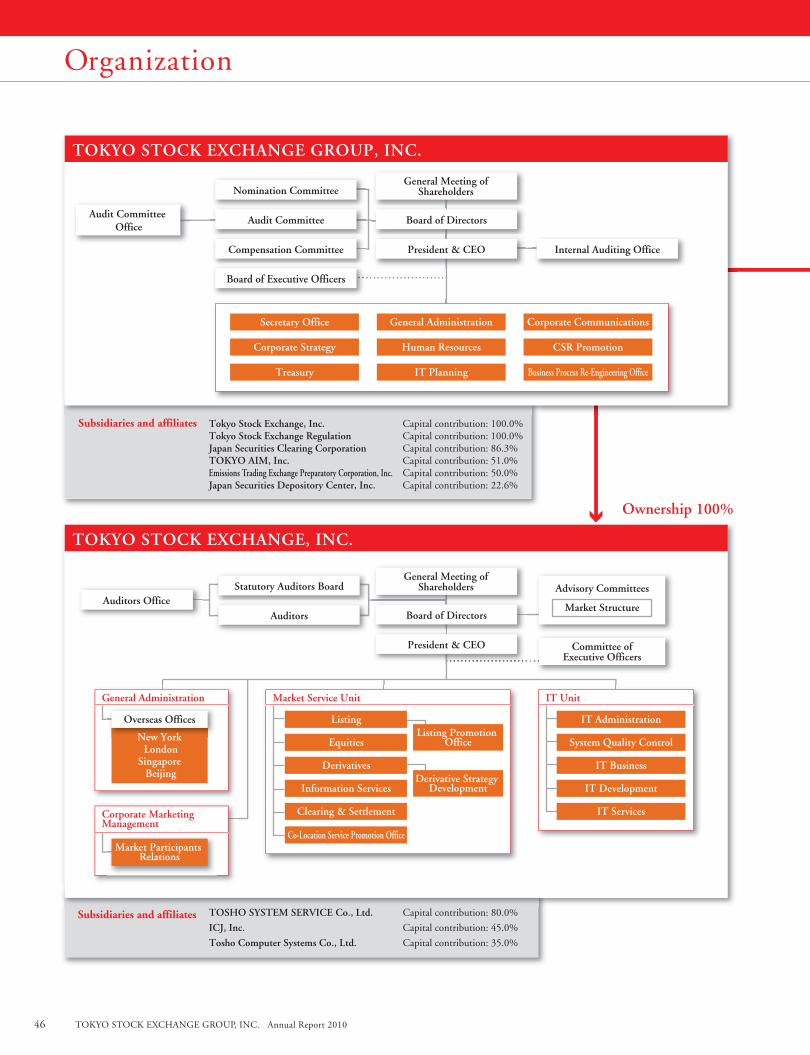
46 TOKYO STOCK EXCHANGE GROUP, INC. Annual Report 2010 TOKYO STOCK EXCHANGE GROUP, INC. Annual Report 2010
Subsidiaries and affiliates Tokyo Stock Exchange, Inc. Capital contribution: 100.0%Tokyo Stock Exchange Regulation Capital contribution: 100.0%Japan Securities Clearing Corporation Capital contribution: 86.3%TOKYO AIM, Inc. Capital contribution: 51.0%Emissions Trading Exchange Preparatory Corporation, Inc. Capital contribution: 50.0%Japan Securities Depository Center, Inc. Capital contribution: 22.6%
TOKYO STOCK EXCHANGE REGULATION
Listing Regulation Unit
Compliance Unit
Market Surveillance &Compliance
TOKYO STOCK EXCHANGE GROUP, INC.
Subsidiaries and affiliates
TOKYO STOCK EXCHANGE, INC.
Capital contribution: 80.0%
Capital contribution: 45.0%
Capital contribution: 35.0%
TOSHO SYSTEM SERVICE Co., Ltd.
ICJ, Inc.
Tosho Computer Systems Co., Ltd.
IT Unit
IT Services
Market Service Unit
Information Services
Equities
ListingListing Promotion
Office
DerivativesDerivative Strategy
Development
Clearing & Settlement
Co-Location Service Promotion Office
General Administration
New York London
Singapore Beijing
Ownership 100% Ownership 100%
DisclaimerThis annual report is prepared solely for the purpose of providing information regarding the Tokyo Stock Exchange Group, Inc., and as such, it is not intended as any offer or sale of securities or other similar action whether inside or outside Japan. Our securities have not been and will not be registered under the United States Securities Act of 1933, as amended (the “Securities Act”), and may not be offered or sold in the United States absent registration or an applicable exemption from registration requirements. This annual report contains forward-looking statements. These statements are based on our assumptions and beliefs in light of the information currently available to us and are subject to risks and uncertainties. Should one or more of these risks or uncertainties materialize, or should underlying assumptions prove incorrect, our actual results may vary materially from those we currently anticipate. Given these risks and uncertainties, you are cautioned not to place undue reliance on forward-looking statements, which speak only as of the date of these materials. We disclaim any obligation to update any of the forward-looking statements contained in these materials to reflect future actual events or developments.
NNew YYo kkrk
Overseas Offices
Corporate Marketing Management
Market Participants Relations
Secretary Office
Corporate Strategy
Treasury
General Administration
Human Resources
IT Planning Business Process Re-Engineering Office
Corporate Communications
CSR Promotion
IT Administration
System Quality Control
IT Development
IT Business
Listed Company Compliance
Listing Examination
Participants Examination &Inspection
Nomination Committee
Audit Committee
Compensation Committee
Board of Executive Officers
General Meeting ofShareholders
Board of Directors
President & CEO Internal Auditing Office
Audit Committee Office
Statutory Auditors Board
Auditors
General Meeting ofShareholders
Committee ofExecutive Officers
Board of DirectorsAuditors Office
President & CEO
Advisory Committees
Market Structure
General Meeting of Members President
Auditors
Advisory Committees
Discipline
Board of Governors
General Administration
Auditors Office
46
Organization
TOKYO STOCK EXCHANGE GROUP, INC. Annual Report 2010
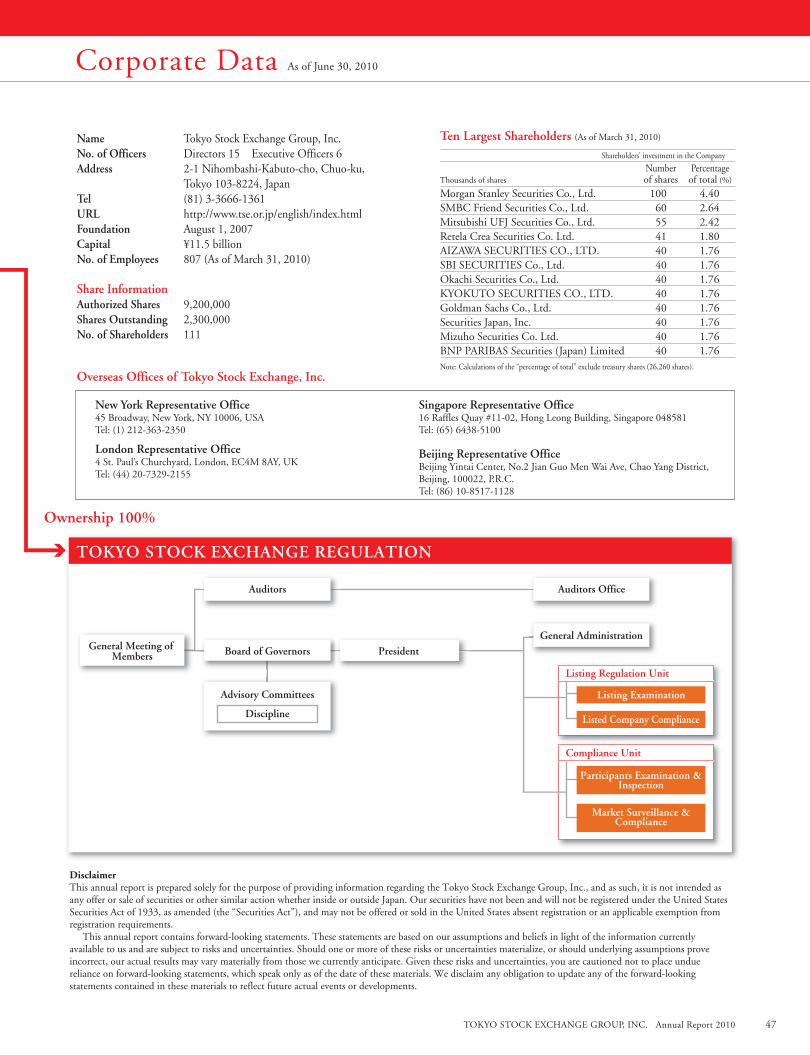
TOKYO STOCK EXCHANGE GROUP, INC. Annual Report 2010 47TOKYO STOCK EXCHANGE GROUP, INC. Annual Report 2010
Subsidiaries and affiliates Tokyo Stock Exchange, Inc. Capital contribution: 100.0%Tokyo Stock Exchange Regulation Capital contribution: 100.0%Japan Securities Clearing Corporation Capital contribution: 86.3%TOKYO AIM, Inc. Capital contribution: 51.0%Emissions Trading Exchange Preparatory Corporation, Inc. Capital contribution: 50.0%Japan Securities Depository Center, Inc. Capital contribution: 22.6%
TOKYO STOCK EXCHANGE REGULATION
Listing Regulation Unit
Compliance Unit
Market Surveillance &Compliance
TOKYO STOCK EXCHANGE GROUP, INC.
Subsidiaries and affiliates
TOKYO STOCK EXCHANGE, INC.
Capital contribution: 80.0%
Capital contribution: 45.0%
Capital contribution: 35.0%
TOSHO SYSTEM SERVICE Co., Ltd.
ICJ, Inc.
Tosho Computer Systems Co., Ltd.
IT Unit
IT Services
Market Service Unit
Information Services
Equities
ListingListing Promotion
Office
DerivativesDerivative Strategy
Development
Clearing & Settlement
Co-Location Service Promotion Office
General Administration
New York London
Singapore Beijing
Ownership 100% Ownership 100%
DisclaimerThis annual report is prepared solely for the purpose of providing information regarding the Tokyo Stock Exchange Group, Inc., and as such, it is not intended as any offer or sale of securities or other similar action whether inside or outside Japan. Our securities have not been and will not be registered under the United States Securities Act of 1933, as amended (the “Securities Act”), and may not be offered or sold in the United States absent registration or an applicable exemption from registration requirements. This annual report contains forward-looking statements. These statements are based on our assumptions and beliefs in light of the information currently available to us and are subject to risks and uncertainties. Should one or more of these risks or uncertainties materialize, or should underlying assumptions prove incorrect, our actual results may vary materially from those we currently anticipate. Given these risks and uncertainties, you are cautioned not to place undue reliance on forward-looking statements, which speak only as of the date of these materials. We disclaim any obligation to update any of the forward-looking statements contained in these materials to reflect future actual events or developments.
NNew YYo kkrk
Overseas Offices
Corporate Marketing Management
Market Participants Relations
Secretary Office
Corporate Strategy
Treasury
General Administration
Human Resources
IT Planning Business Process Re-Engineering Office
Corporate Communications
CSR Promotion
IT Administration
System Quality Control
IT Development
IT Business
Listed Company Compliance
Listing Examination
Participants Examination &Inspection
Nomination Committee
Audit Committee
Compensation Committee
Board of Executive Officers
General Meeting ofShareholders
Board of Directors
President & CEO Internal Auditing Office
Audit Committee Office
Statutory Auditors Board
Auditors
General Meeting ofShareholders
Committee ofExecutive Officers
Board of DirectorsAuditors Office
President & CEO
Advisory Committees
Market Structure
General Meeting of Members President
Auditors
Advisory Committees
Discipline
Board of Governors
General Administration
Auditors Office
47
Name Tokyo Stock Exchange Group, Inc.No. of Officers Directors 15 Executive Officers 6Address 2-1 Nihombashi-Kabuto-cho, Chuo-ku, Tokyo 103-8224, JapanTel (81) 3-3666-1361URL http://www.tse.or.jp/english/index.htmlFoundation August 1, 2007Capital ¥11.5 billionNo. of Employees 807 (As of March 31, 2010)
Share Information AuthorizedShares 9,200,000Shares Outstanding 2,300,000No. of Shareholders 111
Ten Largest Shareholders (As of March 31, 2010)
Shareholders’ investment in the Company
Number Percentage Thousands of shares of shares of total (%)
Morgan Stanley Securities Co., Ltd. 100 4.40SMBC Friend Securities Co., Ltd. 60 2.64Mitsubishi UFJ Securities Co., Ltd. 55 2.42Retela Crea Securities Co. Ltd. 41 1.80AIZAWA SECURITIES CO., LTD. 40 1.76SBI SECURITIES Co., Ltd. 40 1.76Okachi Securities Co., Ltd. 40 1.76KYOKUTO SECURITIES CO., LTD. 40 1.76Goldman Sachs Co., Ltd. 40 1.76Securities Japan, Inc. 40 1.76Mizuho Securities Co. Ltd. 40 1.76BNP PARIBAS Securities (Japan) Limited 40 1.76Note: Calculations of the “percentage of total” exclude treasury shares (26,260 shares).
Overseas Offices of Tokyo Stock Exchange, Inc.
New York Representative Office45 Broadway, New York, NY 10006, USA Tel: (1) 212-363-2350
London Representative Office4 St. Paul’s Churchyard, London, EC4M 8AY, UK Tel: (44) 20-7329-2155
Singapore Representative Office16 Raffles Quay #11-02, Hong Leong Building, Singapore 048581 Tel: (65) 6438-5100
Beijing Representative OfficeBeijing Yintai Center, No.2 Jian Guo Men Wai Ave, Chao Yang District, Beijing, 100022, P.R.C. Tel: (86) 10-8517-1128
Corporate Data As of June 30, 2010
TOKYO STOCK EXCHANGE GROUP, INC. Annual Report 2010
2-1 Nihombashi-Kabuto-cho, Chuo-ku, Tokyo 103-8224, JapanTel: (81)3-3666-1361http://www.tse.or.jp/english/index.html