Embed Size (px)
Citation preview
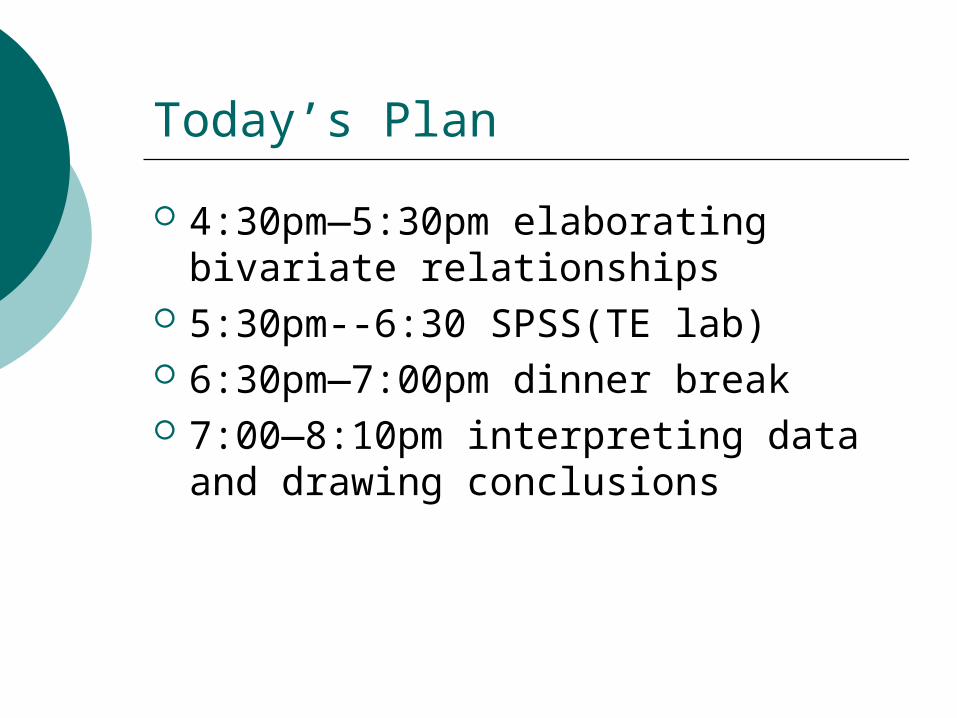
Today’s Plan
4:30pm—5:30pm elaborating bivariate relationships
5:30pm--6:30 SPSS(TE lab) 6:30pm—7:00pm dinner break 7:00—8:10pm interpreting data and
drawing conclusions
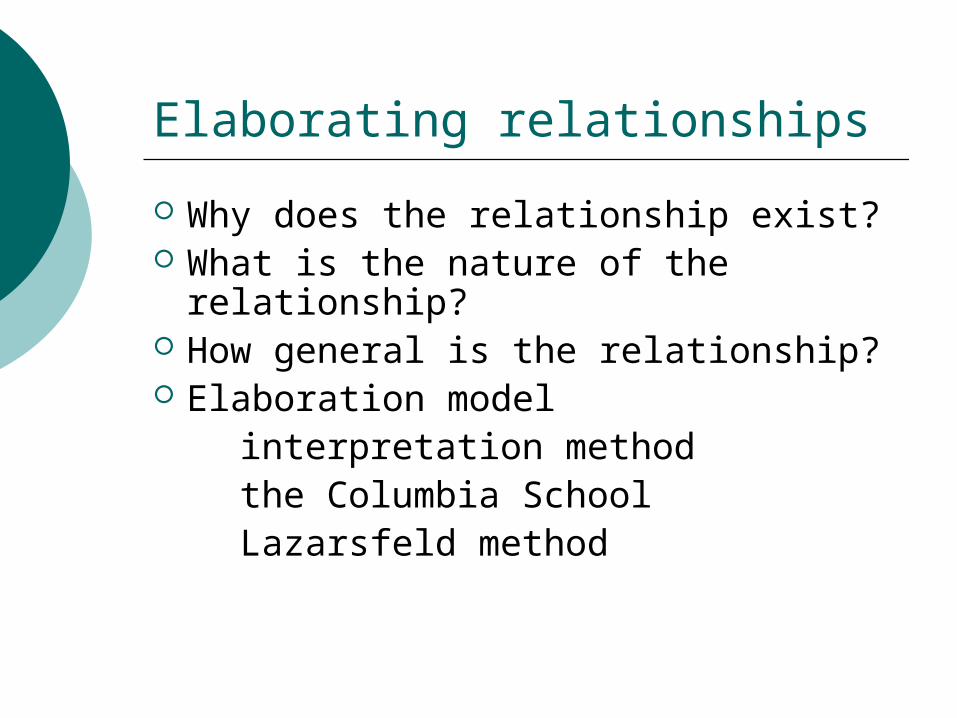
Elaborating relationships
Why does the relationship exist? What is the nature of the
relationship? How general is the relationship? Elaboration model interpretation method the Columbia School Lazarsfeld method
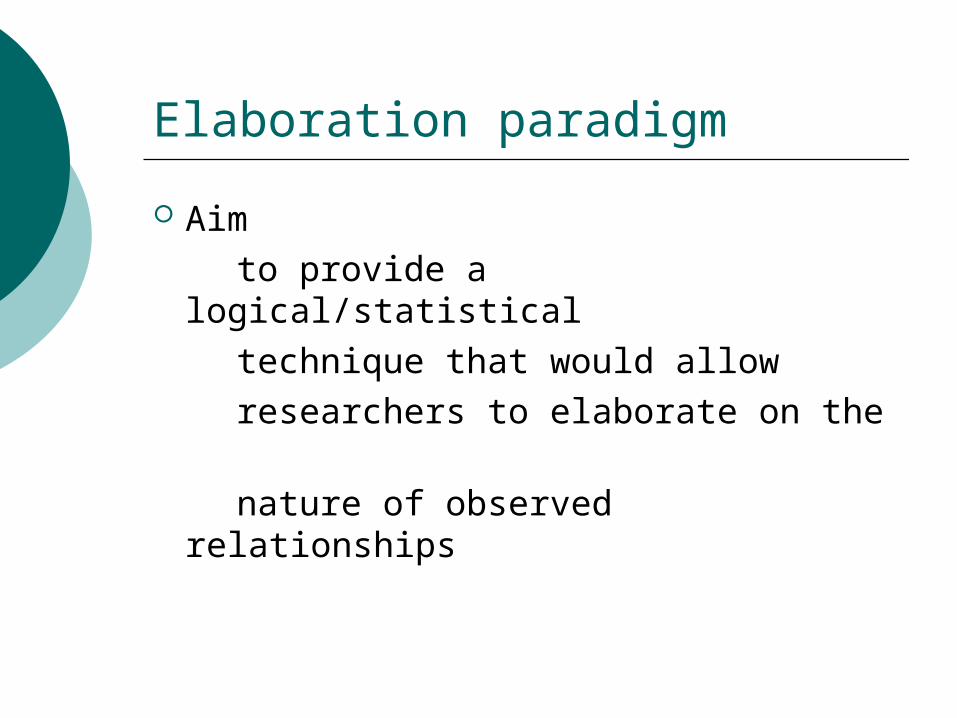
Elaboration paradigm
Aim to provide a logical/statistical technique that would allow researchers to elaborate on the nature of observed relationships
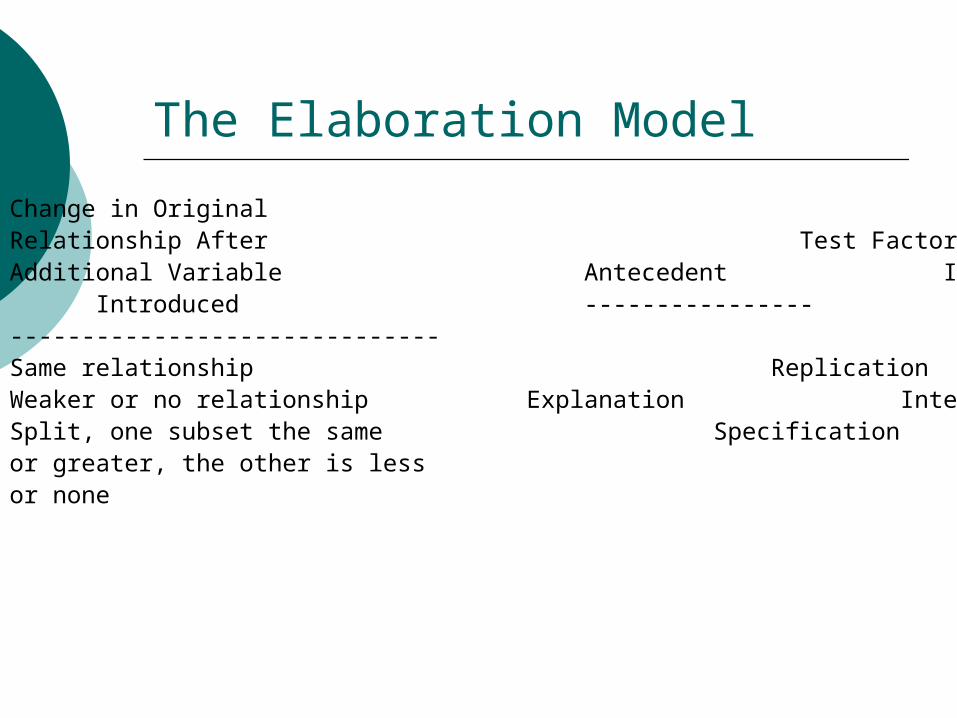
The Elaboration Model
Change in Original Relationship After Test FactorAdditional Variable Antecedent Intervening Introduced ---------------- ------------------------------------------------ Same relationship ReplicationWeaker or no relationship Explanation Interpretation Split, one subset the same Specification or greater, the other is less or none
How to choose a test factor?
We choose a test factor that we have reason to believe is related to both the independent and dependent variables.
How do we add a test factor?
Mechanically, we accomplish this by first dividing our sample into subsets on the basis of the values of the test variable. The relationship between the original two variables is then recomputed for each of the subsets. The table produced in this manner is called the partial table. The relationships found in the partial table are called partial relationships.
Replication
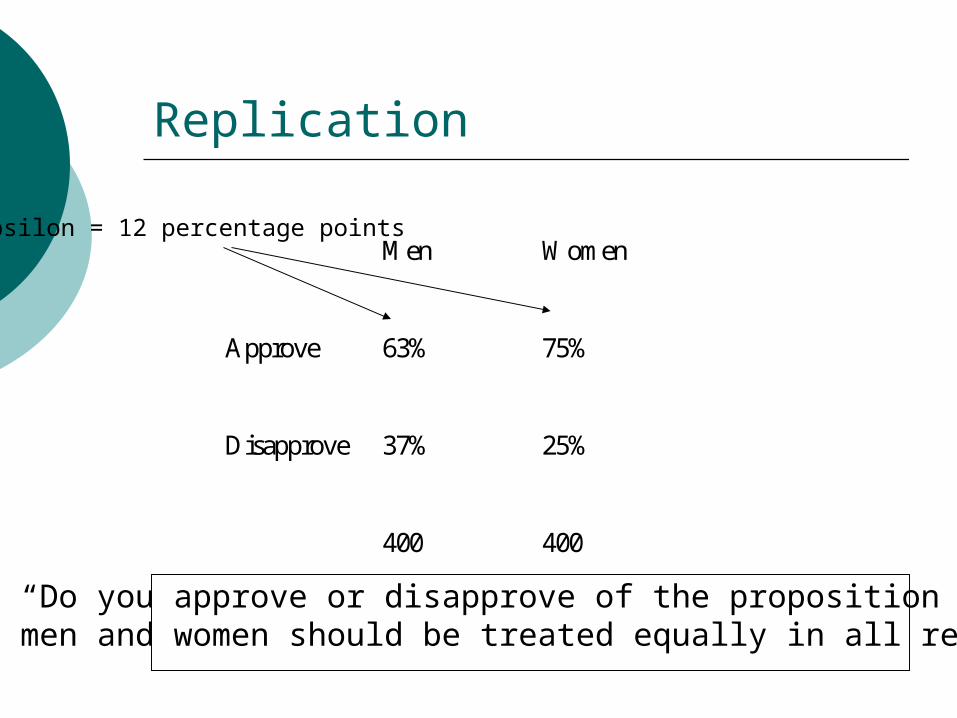
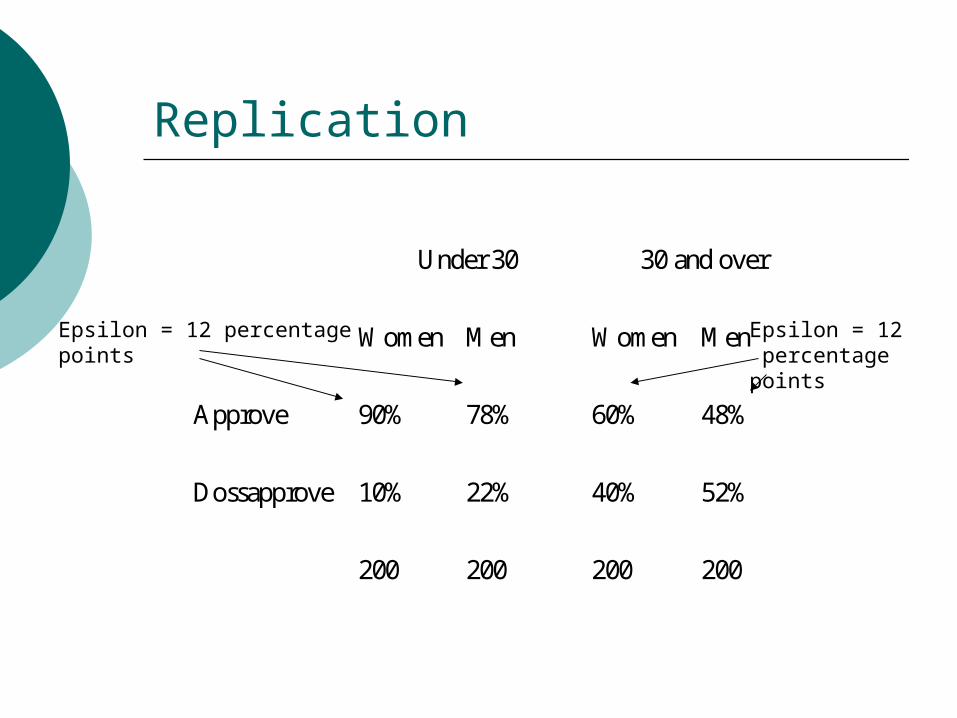
Replication occurs whenever the partial relationships are essentially the same as the original relationship.
Replication
Men Women
Approve 63% 75%
Disapprove 37% 25%
400 400
“Do you approve or disapprove of the proposition thatmen and women should be treated equally in all regards”
Epsilon = 12 percentage points
Replication
Under 30 30 and over
Women Men Women Men
Approve 90% 78% 60% 48%
Dossapprove 10% 22% 40% 52%
200 200 200 200
Epsilon = 12 percentage points
Epsilon = 12 percentage points
Specification
Sometimes the elaboration model produces partial relationship that differ significantly from each other. For example, one partial relationship is the same as or stronger than the original two-variable relationship and the second partial relationship is less than the original and may be reduced to zero.
Specification (Glock)
Social class level
Low High
0 1 2 3 4
Meaninvolvement
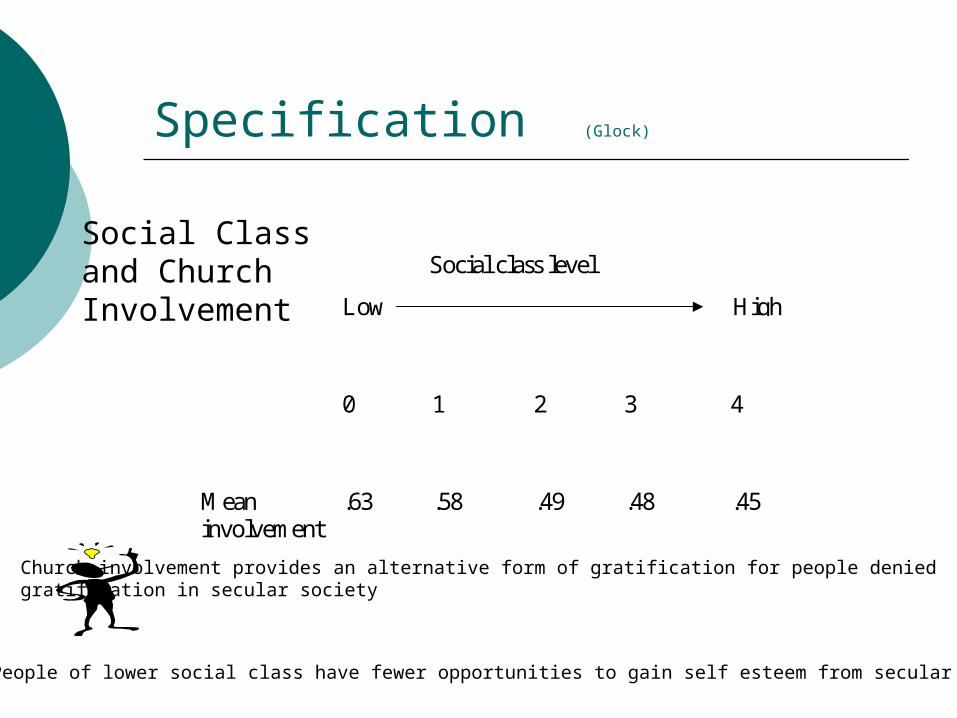
.63 .58 .49 .48 .45
Social Class and Church Involvement
Church involvement provides an alternative form of gratification for people deniedgratification in secular society
People of lower social class have fewer opportunities to gain self esteem from secular society
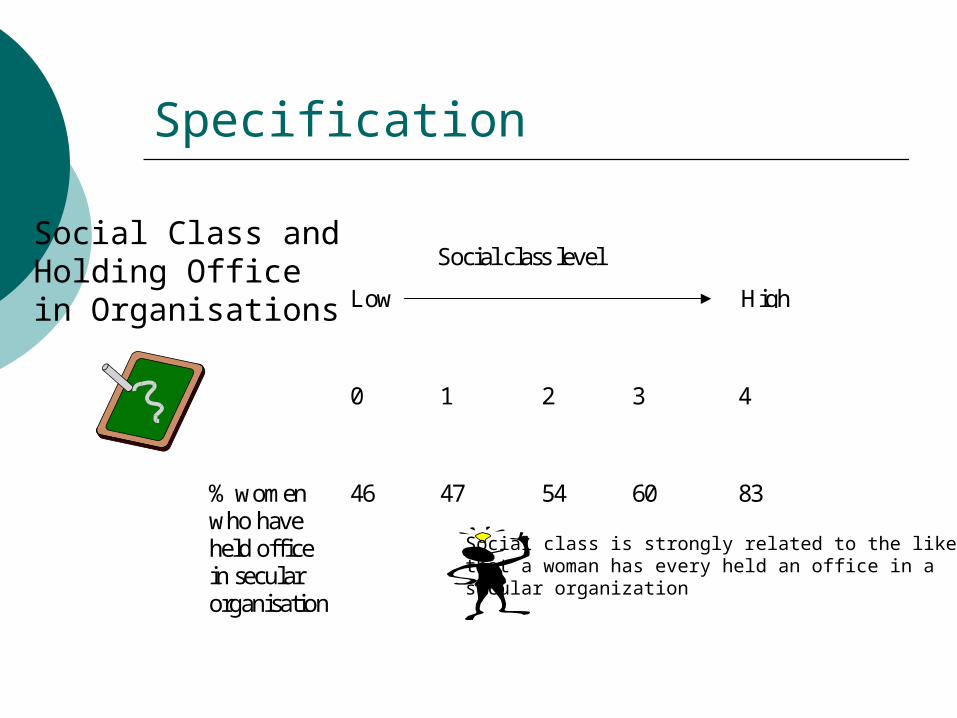
Specification
Social class level
Low High
0 1 2 3 4
% womenwho haveheld officein secularorganisation
46 47 54 60 83
Social Class and Holding Office in Organisations
Social class is strongly related to the likelihoodthat a woman has every held an office in asecular organization
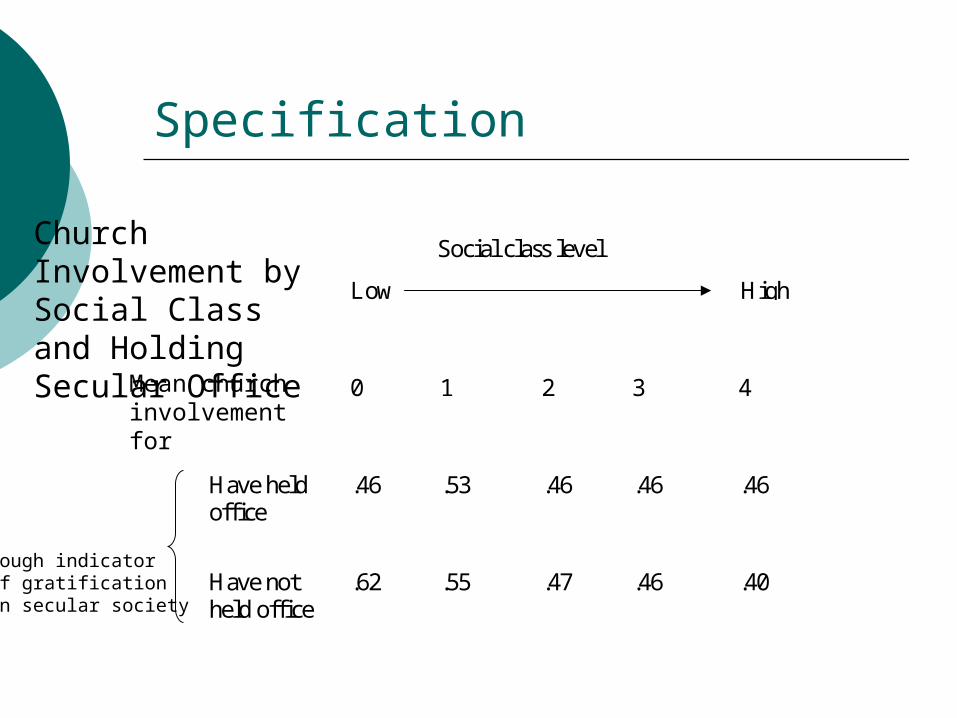
Specification
Social class level
Low High
0 1 2 3 4
Have heldoffice
.46 .53 .46 .46 .46
Have notheld office
.62 .55 .47 .46 .40
Church Involvement by Social Class and Holding Secular Office
Mean churchinvolvement for
Rough indicatorof gratificationin secular society
Explanation
Explanation is the term that used to describe a spurious relationship. The relationship disappears when the test factor is included. The test factor must be antecedent to both variables.
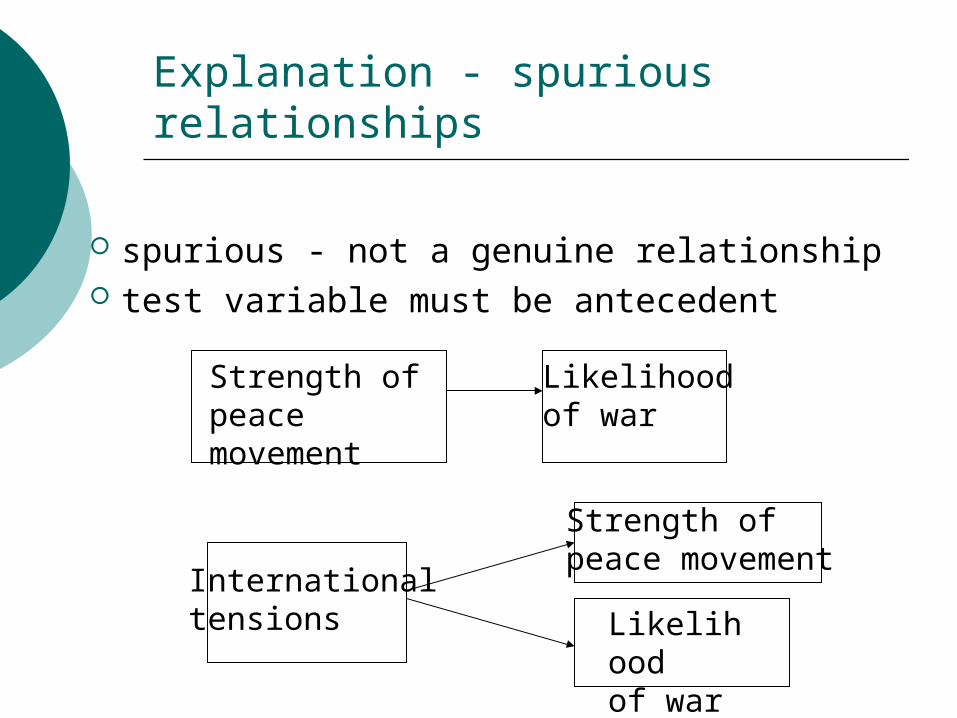
Explanation - spurious relationships
spurious - not a genuine relationship test variable must be antecedent
Strength of peace movement
Strength of peace movement
Likelihoodof war
Likelihoodof war
Internationaltensions
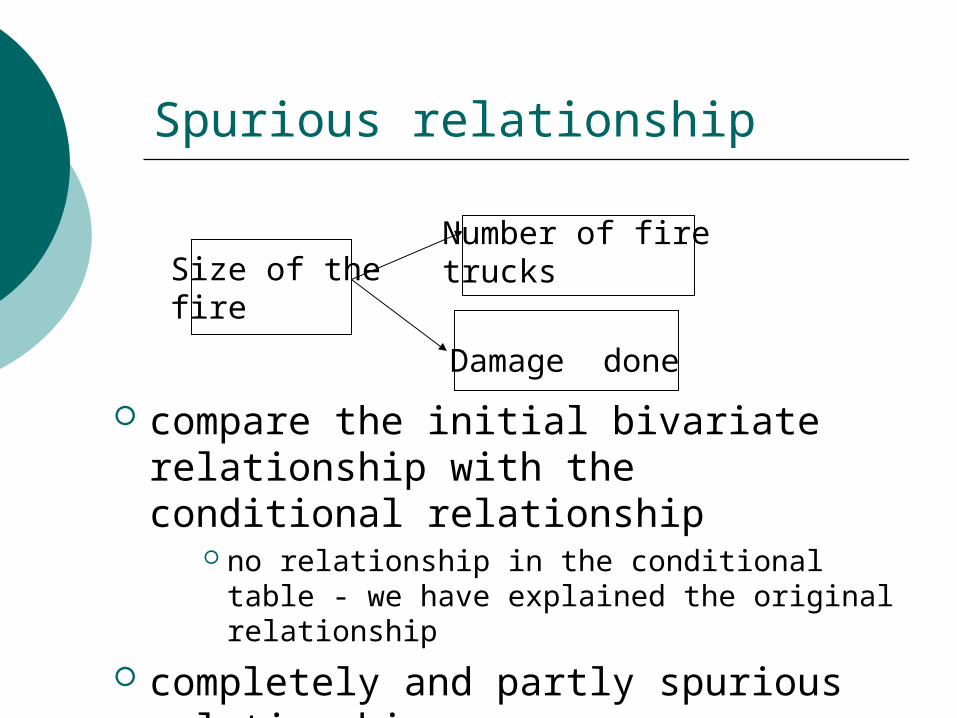
Spurious relationship
compare the initial bivariate relationship with the conditional relationship
no relationship in the conditional table - we have explained the original relationship
completely and partly spurious relationships
Number of firetrucks
Damage done
Size of thefire
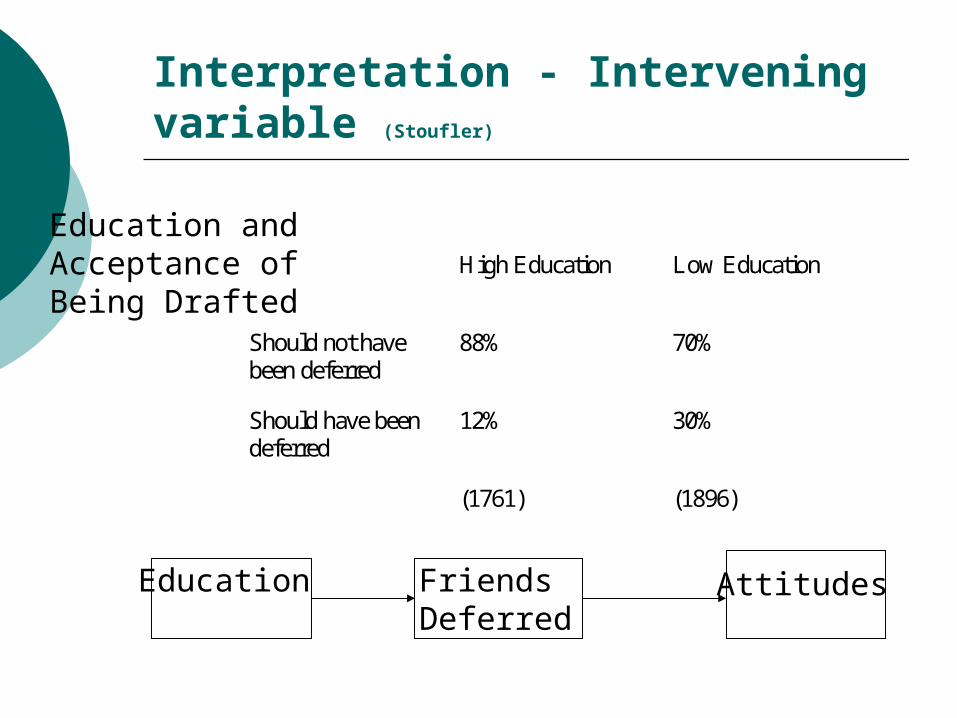
Interpretation - Intervening variable (Stoufler)
High Education Low Education
Should not havebeen deferred
88% 70%
Should have beendeferred
12% 30%
(1761) (1896)
Education and Acceptance of Being Drafted
Education FriendsDeferred
Attitudes
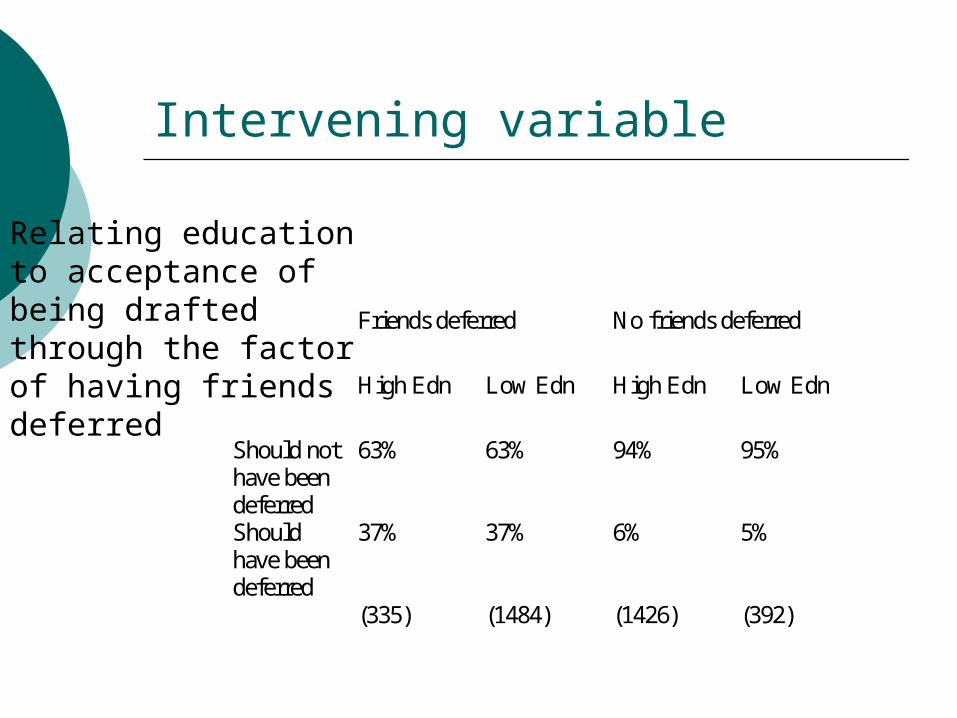
Intervening variable
Friends deferred No friends deferred
High Edn Low Edn High Edn Low Edn
Should nothave beendeferred
63% 63% 94% 95%
Shouldhave beendeferred
37% 37% 6% 5%
(335) (1484) (1426) (392)
Relating education to acceptance of being drafted through the factor of having friends deferred
Interpretation
Interpretation is similar to explanation, except for the time placement of the test variable. The test variable is antecedent to only the dependent variable.
Drawing conclusion (Bouma)
What did you ask? What did you find? What do you conclude? To whom do your conclusions
apply?
Reporting your research
the objectives or hypotheses the major concept(s) and conceptual
definition(s) the major variables and operational
definitions the measurement instrument, for
example the self-administered; questionnaire or content analysis sheets
Reporting your research
a description of the research design, for example a quantitative “case study”, an experiment.
a definition of the population (group of interest) and a short discussion of the sampling methods you would use in a larger scale study. The method for selecting participants for the pilot study
Reporting your research
a description of the data collection methods
the presentation of the results a discussion and interpretation of the
results, i.e. what they mean to you, and any limitations or concerns, for example ethical, validity, reliability.
Conclusions