Embed Size (px)
Citation preview

Chapter 16
Elaborating Bivariate Tables

Chapter Outline
Introduction Controlling for a Third Variable Interpreting Partial Tables Partial Gamma (Gp )

Introduction Social science research projects are
multivariate, virtually by definition. One way to conduct multivariate
analysis is to observe the effect of 3rd variables, one at a time, on a bivariate relationship.
The elaboration technique extends the analysis of bivariate tables presented in Chapters 12-14.

Elaboration
To “elaborate”, we observe how a control variable (Z) affects the relationship between X and Y.
To control for a third variable, the bivariate relationship is reconstructed for each value of the control variable.
Problem 16.1 will be used to illustrate these procedures.
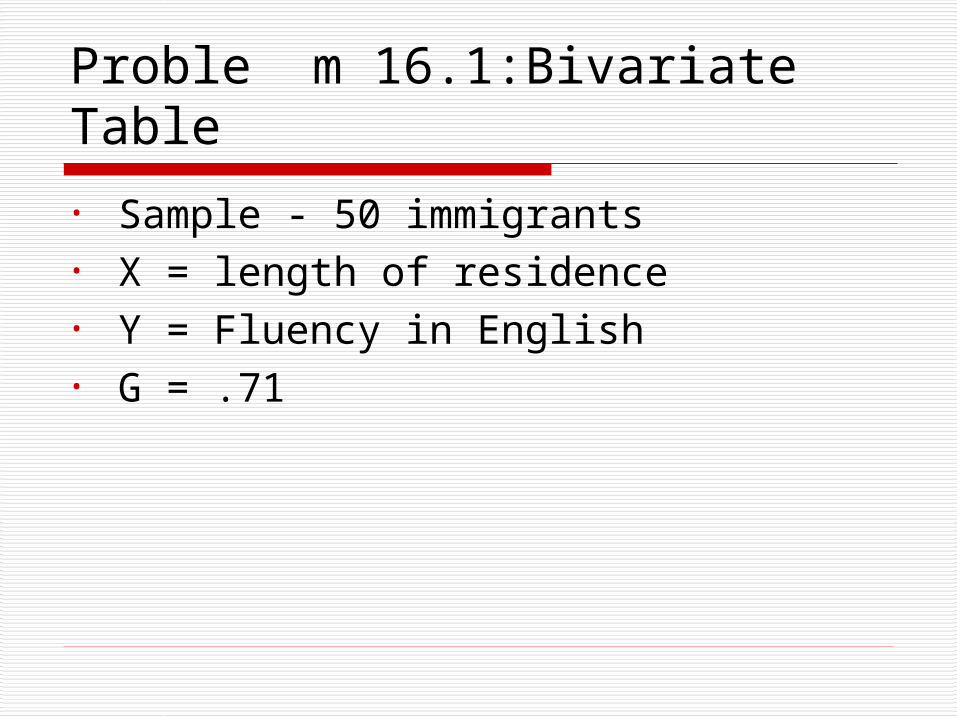
Proble m 16.1:Bivariate Table
• Sample - 50 immigrants• X = length of residence• Y = Fluency in English• G = .71
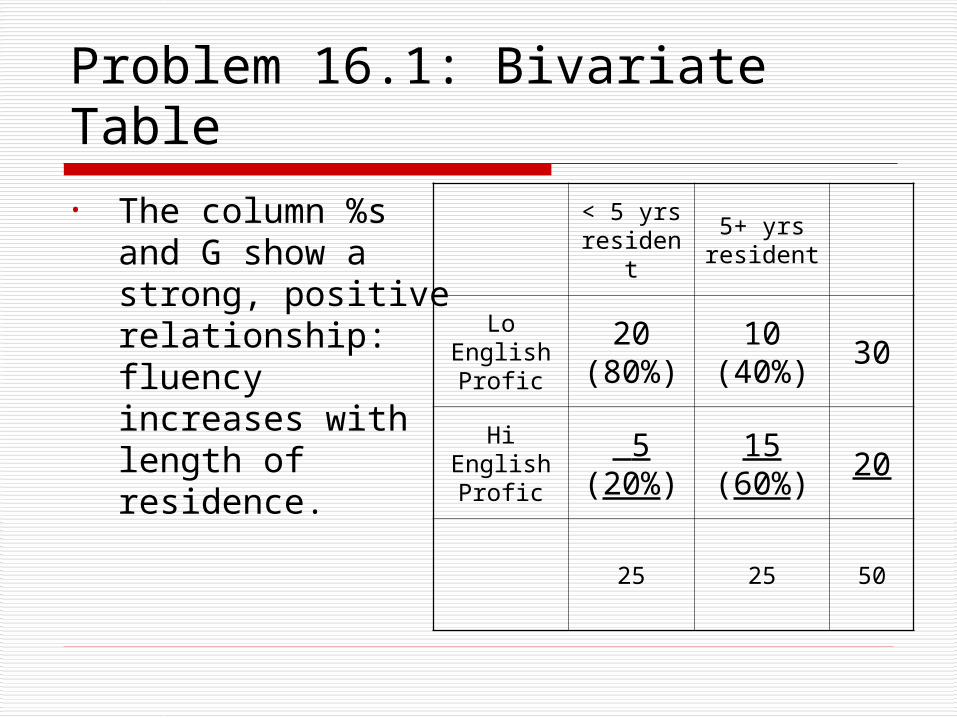
Problem 16.1: Bivariate Table
< 5 yrs resident
5+ yrs resident
Lo EnglishProfic
20 (80%)
10 (40%)
30
Hi English Profic
5 (20%)
15 (60%)
20
25 25 50
• The column %s and G show a strong, positive relationship: fluency increases with length of residence.
Problem 16.1 Will the relationship between fluency (Y)
and length of residence (X) be affected by gender (Z)?
To investigate, the bivariate relationship is reconstructed for each value of Z.
One partial table shows the relationship between X and Y for men (Z1)and the other shows the relationship for women (Z2).
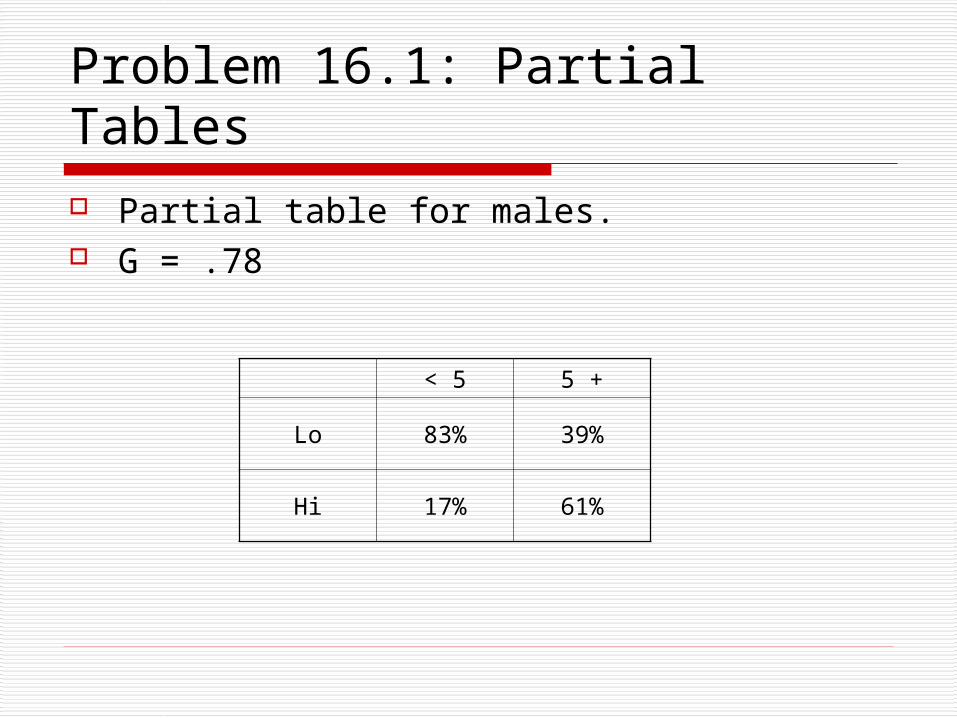
Problem 16.1: Partial Tables Partial table for males. G = .78
< 5 5 +
Lo 83% 39%
Hi 17% 61%
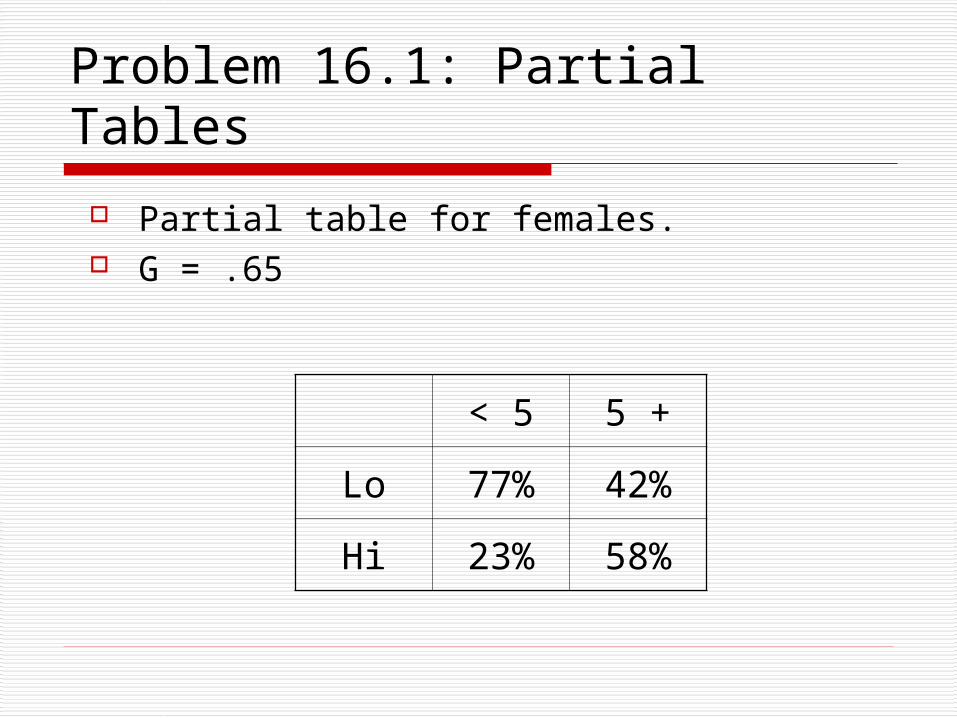
Problem 16.1: Partial Tables
Partial table for females. G = .65
< 5 5 +
Lo 77% 42%
Hi 23% 58%
Problem 16.1: A Direct Relationship
The percentage patterns and G’s for all three tables are essentially the same.
Sex (Z) has little effect on the relationship between fluency (Y) and length of residence (X).
Problem 16.1:A Direct Relationship
For both sexes, Y increases with X in about the same way.
There seems to be a direct relationship between X and Y.

Direct Relationships In a direct relationship, the control variable has little
effect on the relationship between X and Y. The column %s and gammas in the partial tables
are about the same as the bivariate table. This outcome supports the argument that X causes
Y.
X Y
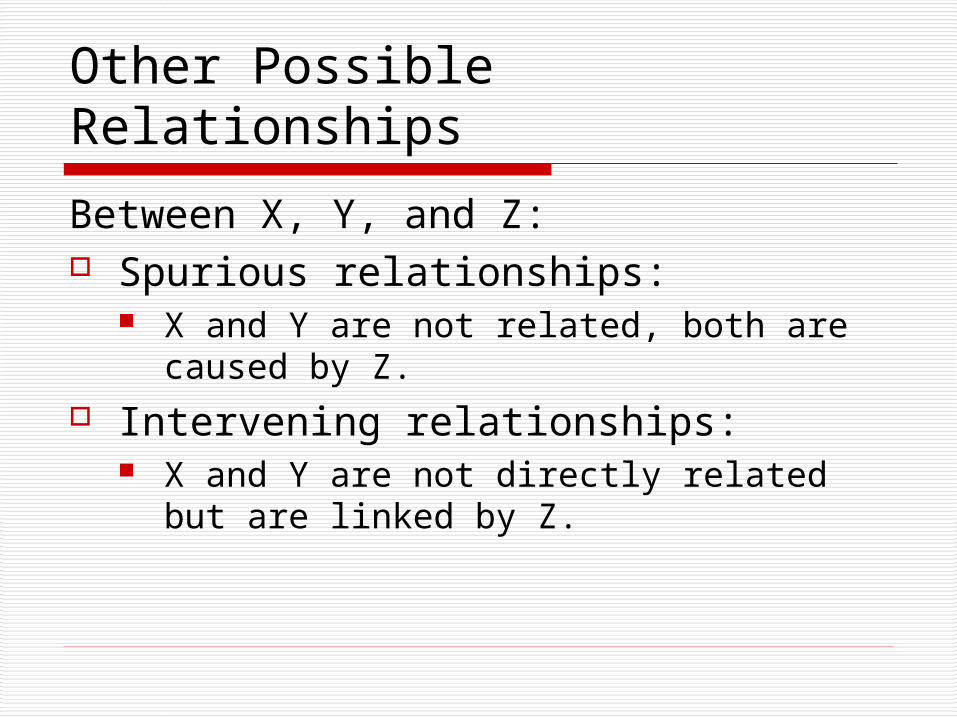
Other Possible Relationships
Between X, Y, and Z: Spurious relationships:
X and Y are not related, both are caused by Z.
Intervening relationships: X and Y are not directly related but are
linked by Z.
Other Possible Relationships
Between X, Y, and Z: Interaction
The relationship between X and Y changes for each value of Z.
We will extend problem 16.1 beyond the text to illustrate these outcomes.
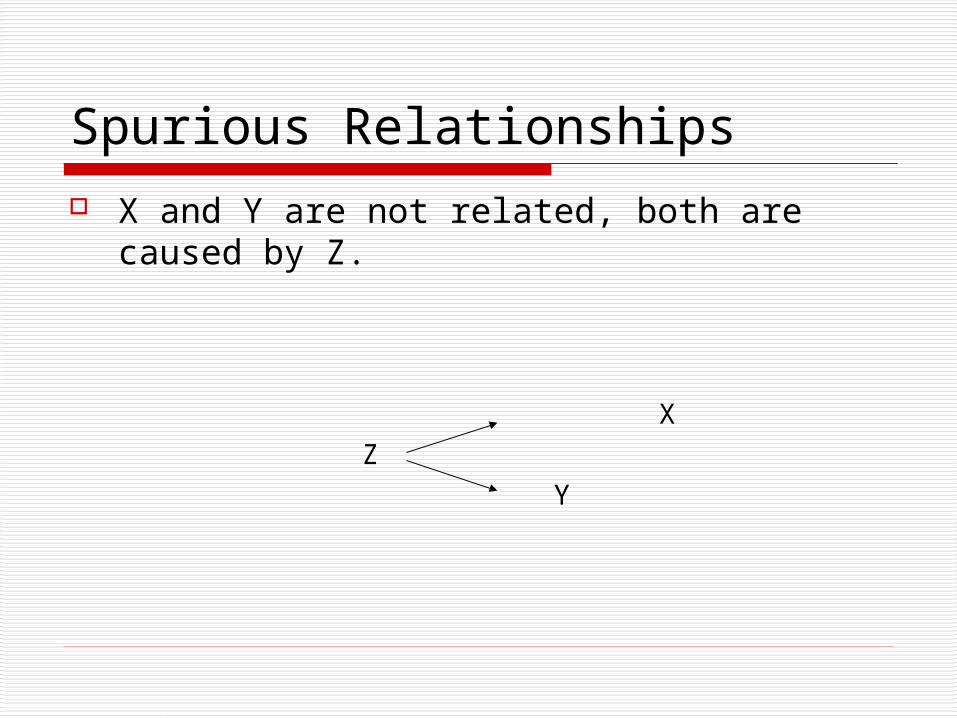
Spurious Relationships X and Y are not related, both are caused
by Z.
XZ
Y
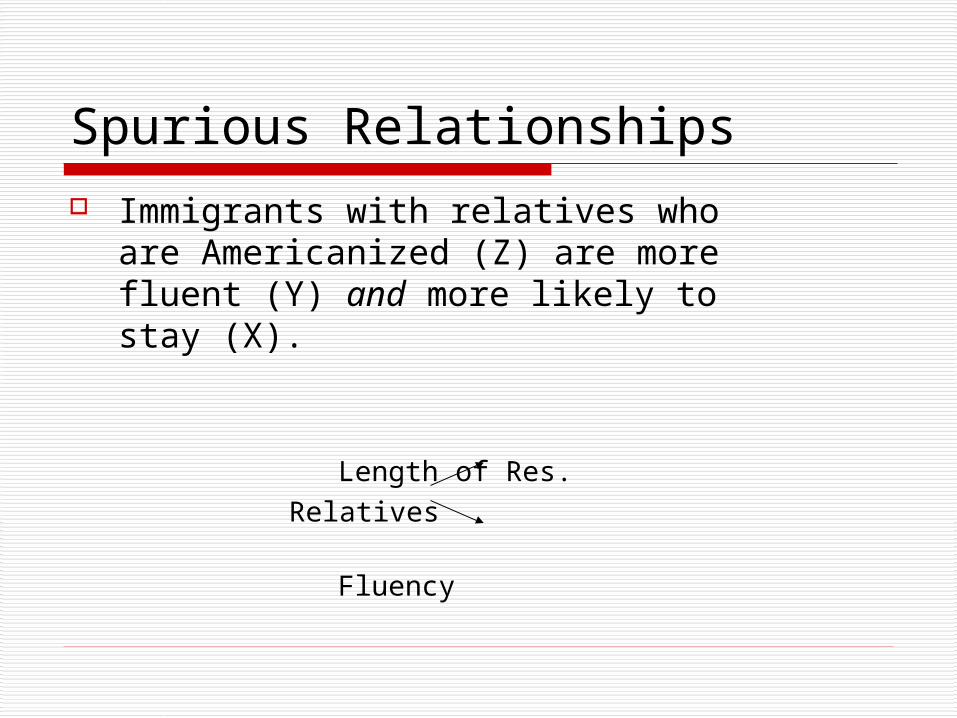
Spurious Relationships Immigrants with relatives who are
Americanized (Z) are more fluent (Y) and more likely to stay (X).
Length of Res.
Relatives Fluency
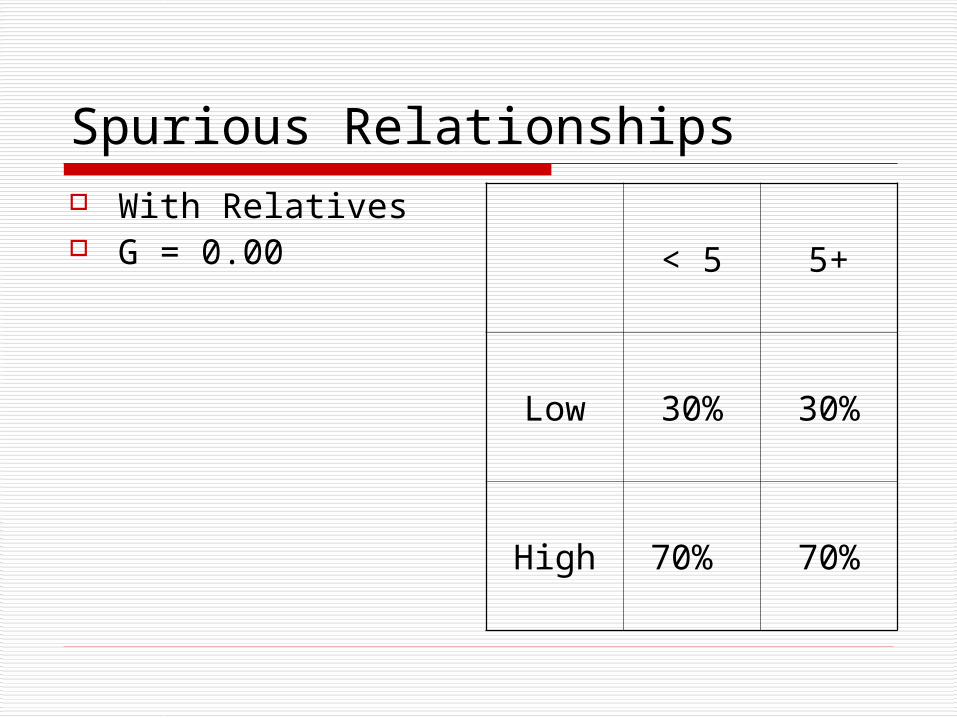
Spurious Relationships With Relatives G = 0.00 < 5 5+
Low 30% 30%
High 70% 70%
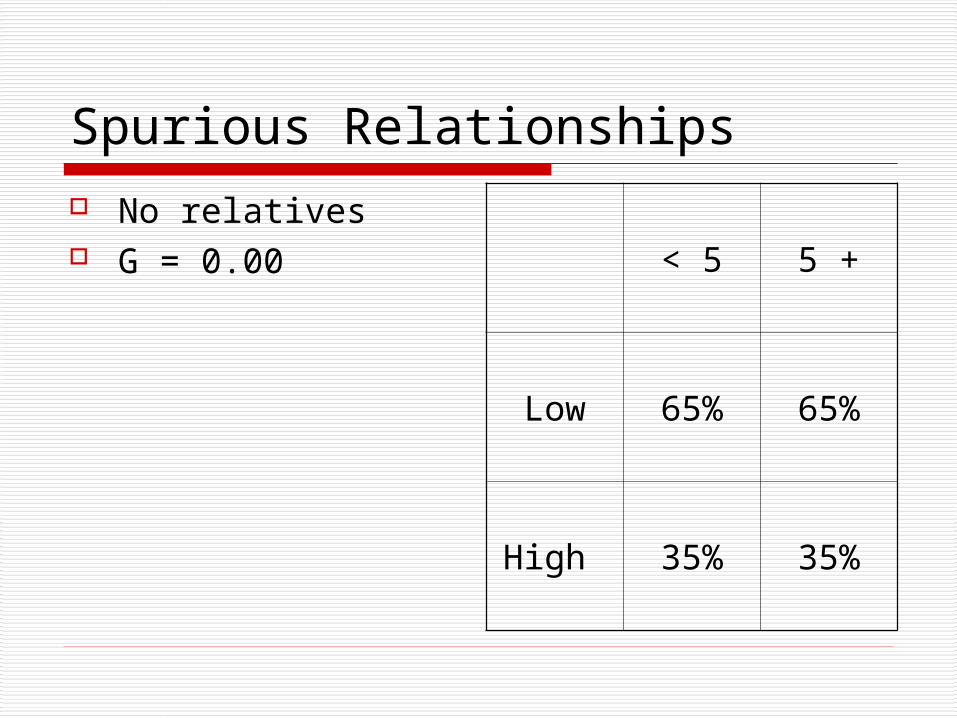
Spurious Relationships No relatives G = 0.00 < 5 5 +
Low 65% 65%
High 35% 35%
Spurious Relationships
In a spurious relationship, the gammas in the partial tables are dramatically lower than the gamma in the bivariate table, perhaps even falling to zero.
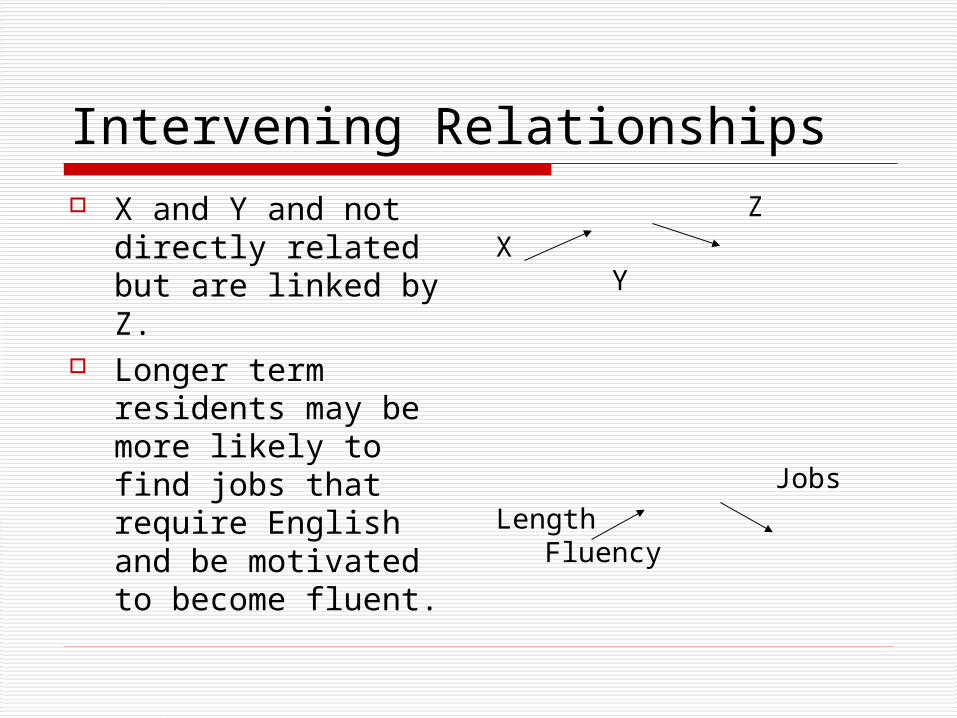
Intervening Relationships X and Y and not
directly related but are linked by Z.
Longer term residents may be more likely to find jobs that require English and be motivated to become fluent.
ZX Y
JobsLength Fluency
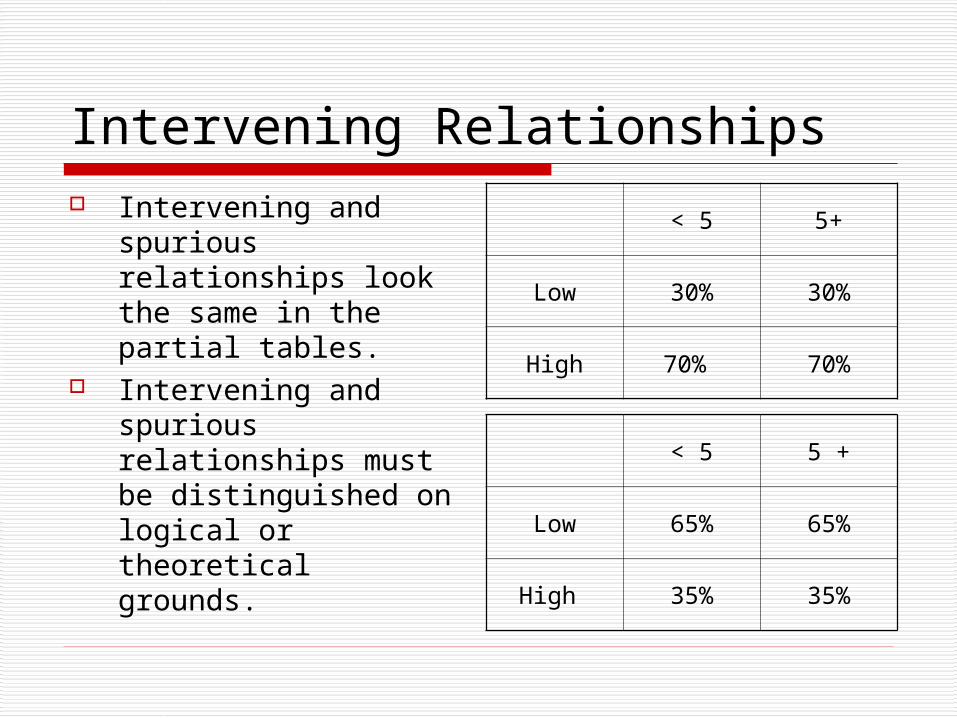
Intervening Relationships Intervening and
spurious relationships look the same in the partial tables.
Intervening and spurious relationships must be distinguished on logical or theoretical grounds.
< 5 5+
Low 30% 30%
High 70% 70%
< 5 5 +
Low 65% 65%
High 35% 35%
Interaction
Interaction occurs when the relationship between X and Y changes across the categories of Z.
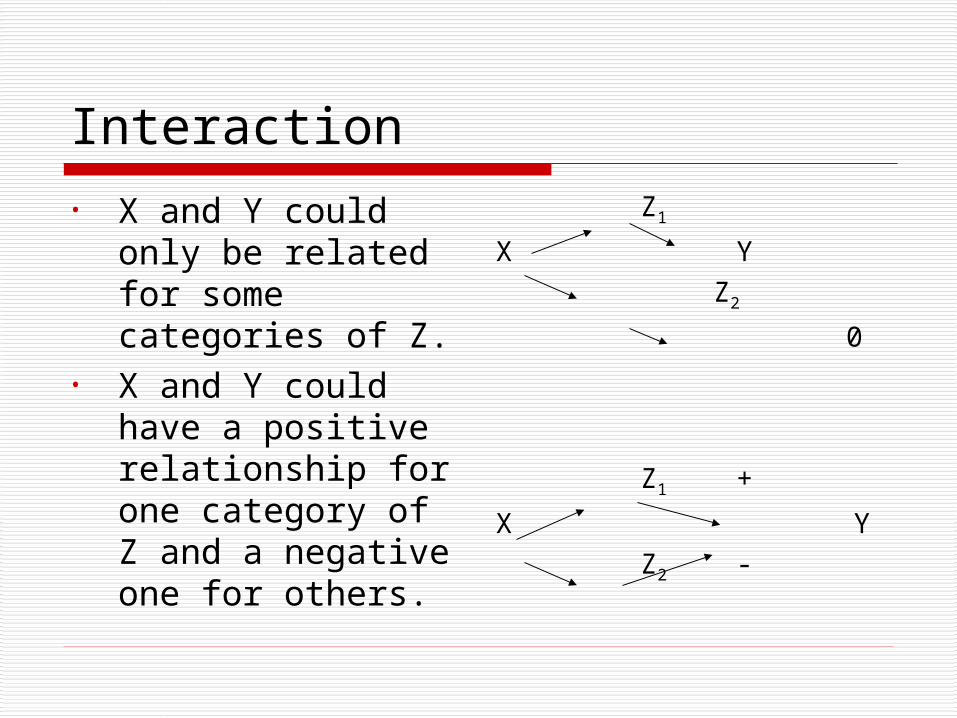
Interaction• X and Y could only
be related for some categories of Z.
• X and Y could have a positive relationship for one category of Z and a negative one for others.
Z1
X Y Z2
0
Z1 +
X YZ2 -
Interaction
Perhaps the relationship between fluency and residence is affected by the level of education residents bring with them.

Interaction Well educated
immigrants are more fluent regardless of residence.
Less educated immigrants’ fluency depends on length of residence.
< 5 5+
Low 20% 20%
High 80% 80%
< 5 5 +
Low 60% 30%
High 40% 70%

Summary: Table 16.5Partials
compared with
bivariatePattern Implication Next Step
Theory that
X Y is
Same Direct Disregard ZSelect
another ZSupported
Weaker SpuriousIncorporate
Z
Focus on relationship between Z
and Y
Not supported

Summary: Table 16.5Partials
compared with
bivariatePattern Implication Next Step
Theory that
X Y is
Weaker InterveningIncorporate
Z
Focus on relationship between X,
Y, and Z
Explained in more detail
Mixed InteractionIncorporate
Z
Analyze categories of
Z
Partially supported