Embed Size (px)
Citation preview
•a•
•b•
Reliable technology
Today, Hes Cable’s reliable technology is
used in more than 120 countries worldwide.
We weave the world's infrastructure!

Reliable technology
Today, Hes Cable’s reliable technology is
used in more than 120 countries worldwide.
We weave the world's infrastructure!

•2•
C O N T E N T SThe Journal of the Istanbul Chamber of Industry
August 2013 48th Year No. 569
Authorized byErdal Bahçıvan
Chairman of the Board of Directorson behalf of the Istanbul Chamber of Industry
EDITORIAL BOARDSultan Tepe
M. Serol AcarkanMehmet AğrikliAli Sami AydınAynur Ayhan
Ömer İltan BilginMehmet Ata Ceylan
Celal ÇiçekMustafa GülerCemal Keleş
Arzu Aslan KesimerErol Kiresepi
Mehmet Selçuk SadırSabahattin Şen
Baha TelliMehmet Umur
Ahmet Samet Yapar
DIRECTOR OF PUBLICATIONSMelek Us
ADDRESS FOR ADVERTISINGMeşrutiyet Caddesi 62
Tepebaşı-IstanbulPhone: 0212 252 29 00 Ext 131 and 132
Fax: 0 212 249 18 93Email: [email protected]
ENGLISH TEXT Virginia Taylor-Saçlıoğlu
PUBLISHINGMas Matbaacılık A.Ş.
Hamidiye Mahallesi, Soğuksu Caddesi No:3 Kağıthane – IstanbulPhone: +90 212 294 10 00Email: [email protected]
Certificate No: 12055
Date of publicationNovember, 2013
A special issue of the monthly Journal of the Istanbul Chamber of Industry
4
6
9121314151719212224273233343538
Turkish Industry as Mirrored in the ISO 500
ERDAL BAHÇIVAN, Chairman of the Board of Directors
The Department of Research, the Istanbul Chamber of Industry
Turkey’s Top 500 Industrial Enterprises
7 The Top Companies by Production-Based Sales
7 The Top Companies by Value Added Generated
8 The Top Profit-Makers
8 Top Exporters
The Economic Aggregates
The Dominance of the Top 50 Companies
The Export Performance
The Foreign-Invested Enterprises
ISO Members in the Top 500 Industrial Enterprises
ISO Members in the Private Sector
The Public Companies’ Share
Financial Structure
The Structure of Borrowing
The Financial Ratios
The Profitability Ratios
The Functional Distribution of Net Value Added as Factor Incomes
Non-Operating Revenues
Employment, Distribution of Gross Value Added and Relative Output Ratios
Labor Productivity (Net Value Added/Number of Wage Employees)
The Results of the ISO 500 Survey
EDITORIAL
ASSESSMENT
•3•
445056
626263
6494
105106107108
Selected Aggregates
Distribution of Factor Incomes
Aggregates Per Employee and Some Ratios
CAPITAL DISTRIBUTION, DEFINITIONS AND KEY TO INDUSTRIAL CODES
Capital Distribution in the Top 500 Industrial Enterprises
Some Terms and Definitions
Economic Activity Codes
THE RANKING
Turkey’s Top 500 Industrial Enterprises in 2012
Sectoral Ranking
The Top 50 Companies by Profit
The Top 50 Companies by Exports
The Top 50 Companies by Number of Wage Employees
Alphabetical Ranking
SECTORAL DATA

•4•
EDITORIAL
Erdal Bahçıvan, Chairman Istanbul Chamber of Industry
Turkish Industry as Mirrored in the ISO 500
Turkey’s oldest and most influential chamber of industry, the
Istanbul Chamber of Industry has been compiling and publishing
the ISO 500, a survey of Turkey’s Top 500 Industrial Enterprises, for
the last 45 years, providing a comprehensive snapshot of industry
in our country.
As in previous years, this year as well only the industrial sector
is assessed in the survey. As well as production carried out in
Turkey, exports, value added, employment and productivity have
again been examined and compared with figures for Turkey as
a whole. The ISO 500 therefore comprises the whole of Turkey
geographically and all its industrial activity, thereby giving the
survey a unique place in the country.
I believe that the 2012 results the survey of Turkey’s Top 500
Industrial Enterprises need to be assessed in the light of current
economic conditions in the country and the impact on the Turkish
economy of developments in the world economy.
We are currently in a period when many familiar notions, including
the economic paradigm, are being shaken to the core. Apple and
Microsoft have upset notions of, and approaches to, traditional
industrial production, and the global economic balances have also
begun shifting toward the Asia-Pacific region.
It has been five years since the global crisis erupted. But it would
still be difficult to say that stability has been restored in the world
economy. Risks and uncertainties continue in the economies of the
developed countries especially.
The rate of growth in world production in 2012 slowed slightly on
2011, falling from 3.9% to 3.1%, and this decline has, with few
exceptions, spread around the world.
Growth in the volume of world trade has suffered a far sharper
decline than growth in production as growth in the volume of
goods and services slipped from 6% in 2011 to around 2.5% in
2012.
While this was the picture in the world economy, Turkey only
managed to grow at the slow rate of 2.2% in 2012. The sharp
downturn in the Turkish economy in 2012 resulted in a reduction
in the current account deficit to 47.8 billion dollars, in other words,
around 6.1 percent of GDP. At the same time, however, a high
current account deficit and low rate of savings continue to be
serious problems.
A brief look at the 2012 results of the survey of Turkey’s Top 500
Industrial Enterprises reveals the following:
The figures for 2012 show that the industrial sector continues to
lose strength. Accounting for 26.8% of GDP in 1998, the industrial
sector could claim only a 19.3% share in 2012.
As industry’s attractiveness fades, the interest of foreign capital
in the sector is also waning. The number of foreign-invested
enterprises in the ISO survey is falling rather than rising, down from
153 in 2009 to only 138 in 2012.
•5•
EDITORIAL
The number of public companies in the survey on the other hand is
up from 91 in 2009 to 13 in 2012 and unchanged on the previous
year.
The ISO 500’s share in Turkey’s exports is down from 46.9% in
2011 to 41.8% in 2012. A 21.6% portion of that is due to ISO-
member companies, whose exports totaled 32.9 billion dollars for
the year.
Some 1.4% of the 63.7 billion dollars’ worth of exports realized by
the Top 500 Industrial Enterprises in 2012 were due to the 13 public
companies, and the remaining 98.6% to the private companies.
As of the end of 2012, the total assets of the Top 500 Industrial
Enterprises came to 359,483 million Turkish Liras, representing
growth of 8.0% at current prices on the previous year when growth
in assets was 14.1%.
The indicators show that financial structure in the Top 500
Industrial Enterprises overall improved during the year. Although
financial structure deteriorated in the public firms, in the private
firms an improvement is observed.
Among the Top 500 Industrial Enterprises, 437 posted profits in
2012 and 63 posted losses. As the number of profitable firms rose
by 15 percent from 380 to 437, the number of unprofitable firms
declined by 47.5 percent from 120 to 63. In 2011, 76 percent of
the Top 500 firms posted a profit and 24 percent a loss. In 2012,
these percentages were 87.4% and 12.6% respectively.
Growth in employment fell from 4.3% the previous year to 3.7% in
2012, a drop that stems from the public companies. The Top 500
Industrial Enterprises employed 596,000 persons in 2012 as the
number of wage workers in the private companies rose by 4.7%
and that in the public companies fell by 3.1%.
The Top 500 Industrial Enterprises realized 423.6 billion Turkish
Liras’ worth of sales in 2012, generated 62.4 billion Turkish Liras’
worth of value added, employed 596,000 workers and made 63.7
billion dollars’ worth of exports, generating 22.8% of the country’s
industrial value added and accounting for 43.4% of industrial
exports.
In the light of these figures, we can make the following overall
assessment:
Our companies need to be more cautious when it comes to cheap
borrowing from abroad.
Turkey is compelled to pay more attention to its production-
consumption balance. Economic policies aimed at producing
more, creating more jobs and paying off loans rather than going
deeper into debt need to be implemented as soon as possible.
Companies also need to develop their own targets and strategies
for meeting those goals.
Generating value added has become a priority target all over the
world. Products high in value added are becoming more prominent
every year in both production and sales. The 2012 results show
that industry in Turkey has not yet transitioned adequately toward
such products.
The European Union spun into a debt crisis as stagnation was
experienced around the world in 2012. The 487 private companies
in Turkey’s Top 500 Industrial Enterprises had a successful year in
this economic climate.
The Republic of Turkey is getting ready to celebrate the centenary
of its founding in 2023 with successes in a number of areas, most
notably the economy. The country aims to enter the ranks of the
world’s top ten economies, raising annual GDP to 2 trillion dollars
and boosting per capita national income above 20,000 dollars, as
well as making 500 million dollars’ worth of exports, 20 percent of
which are advanced, high-tech products.
I believe we can accomplish those goals through productivity,
quality, products high in value added, economies of scale and
organizational skills compatible with the demands of the age.
In keeping with that conviction, I would like to share with you that
we are going to further enrich our traditional survey of Turkey’s
Top 500 Industrial Enterprises with more performance criteria
in the future, as well as enhancing its brand value through more
effective promotion. I would like to congratulate all the enterprises
who participated in our survey on their success. I would also like
to acknowledge a debt of gratitude to our Department of Research,
who compile the survey with great care and meticulousness, and to
our esteemed academics, who add an intellectual dimension with
their commentaries.
•6•
Turkey’s Top 500 Industrial Enterprises
The 2012 results of the ISO’s survey of Turkey’s Top 500
Industrial Enterprises, compiled this year for the 45th time,
were published in a special August 2013 issue of the Chamber’s
journal. Marking the 61st anniversary of its founding this
year, the Istanbul Chamber of Industry has been compiling
and publishing its survey of the country’s top 500 industrial
enterprises for 45 years. Compiled first for 100, then for 300
companies, and finally expanded in 1980 to comprise 500
companies, the survey is followed with keen interest both at
home and abroad for its contribution to filling the financial
data gap in Turkey.
The industrial operations of the companies are the criterion
of size in the survey, which has been ranking companies in
Turkey’s industrial sector for 45 years on the basis of their
production-based sales. In other words, the enterprises in
the survey are ranked not by their total turnover but by their
production-based sales. For the purposes of the survey,
industrial operations include the mining and quarrying,
manufacturing, and energy sectors.
The basic purpose of the ISO 500 survey is to identify the
biggest companies engaged in industry in Turkey. The survey
therefore includes both private and public firms that are both
domiciled in Turkey and engaged in industrial production.
In addition to being ranked by size based on their sales
revenues (net), the companies listed in the ISO 500 survey are
also ranked by their gross value added at producer prices, their
equity capital, their total assets, their pre-tax profit and loss
for the period, their exports and their average number of wage
workers for the year. They are also ranked separately within
their sector, public or private.
In addition to this ranking, the data collected in the survey
are also given separately for the ISO 500, the ISO 500 private
companies, the ISO public companies, and the ISO 500 ISO-
member companies. All these data are presented in twelve
separate columns broken down into public and private sector
companies and profitable and unprofitable companies.
The financial ratios given in the survey also provide a variety
of assessments regarding financial structure, profitability ratios,
economic profit, asset turnover rates, functional distribution of
net value added as factor incomes, non-operating revenues,
employment and distribution of gross value added, as well as
labor productivity.
The United Nations International Standard Industrial
Classification (ISIC, Series M, No. 4, Rev. 2) is used to ensure
continuity in comparisons with previous years in the ISO
The Department of Research, the Istanbul Chamber of Industry
ASSESSMENT
•7•
ASSESSMENT
500, which is a cumulative survey. The NACE codes used for
classifying economic activity in the European Union, which
were adopted by the Association of Chambers and Stock
Exchanges of Turkey in 2012, were also obtained for the
enterprises surveyed and have been included in our survey in an
effort to align the two classification systems in the assessments.
Our ISO 500 survey is based mainly on the companies’ own
statements, which are checked against the closing balance
sheets and income tables they submit to the Finance Ministry.
The companies surveyed are ranked by their production-based
sales. If a given company’s name and/or data does not appear
in some of the rankings, this is because the company, despite
participating in the survey, either did not provide all its data, or
did not want to share that data with the public.
Even though it is not shared with the public, data for such
companies is nevertheless used in all ISO 500 assessments for
the sake of completeness.
In the main table giving data for the companies, not only are
they ranked by their production-based sales but their place in
the previous year’s ranking is also given. Companies for which
no such number is given either requested that their data be
withheld, or are newcomers to the survey in 2012. They could,
for example, be companies that rose during the year from the
Second 500 to the Top 500.
In addition to showing an enterprise’s rank by production-
based sales as well as other data regarding it, in the case of
private companies the main table also indicates the chamber
with which that company is affiliated. In the case of public
companies, the term “public” appears instead. The next column
shows the company’s ranking within its sector, whether public
or private.
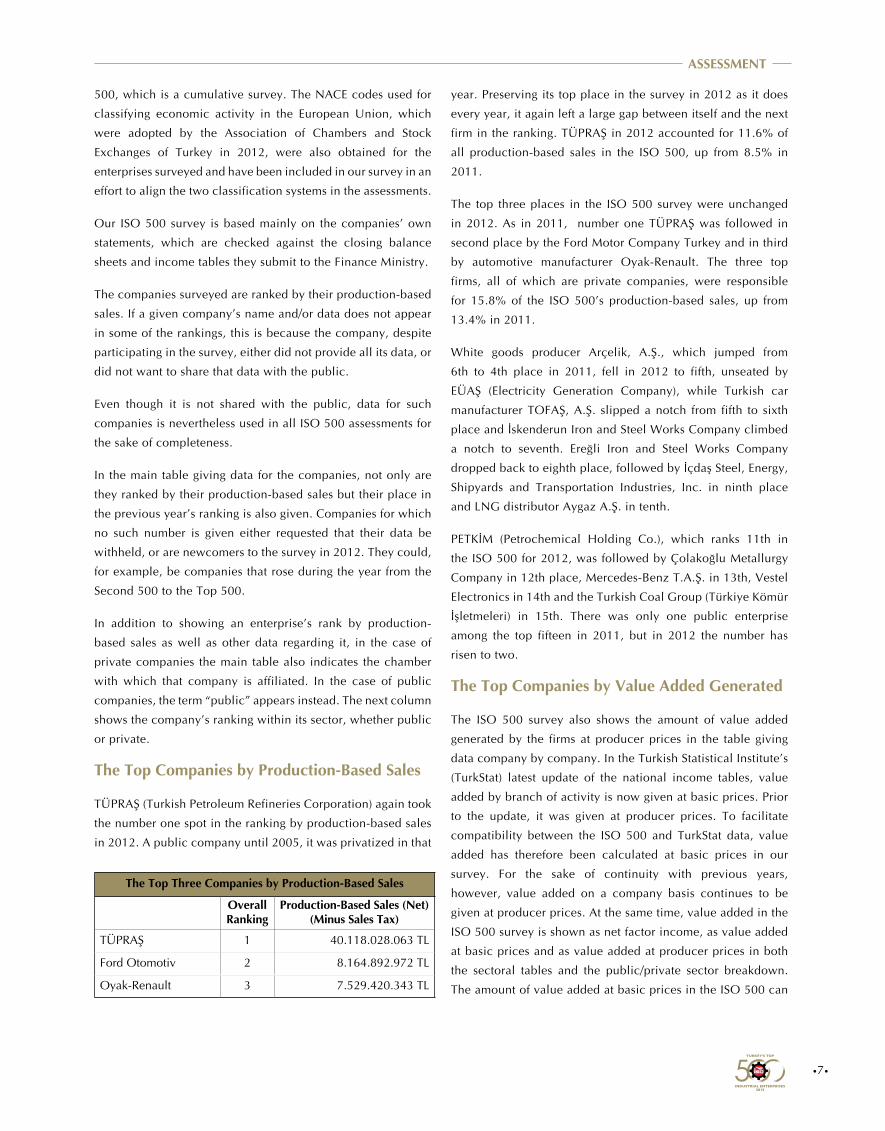
The Top Companies by Production-Based Sales
TÜPRAŞ (Turkish Petroleum Refineries Corporation) again took
the number one spot in the ranking by production-based sales
in 2012. A public company until 2005, it was privatized in that
year. Preserving its top place in the survey in 2012 as it does
every year, it again left a large gap between itself and the next
firm in the ranking. TÜPRAŞ in 2012 accounted for 11.6% of
all production-based sales in the ISO 500, up from 8.5% in
2011.
The top three places in the ISO 500 survey were unchanged
in 2012. As in 2011, number one TÜPRAŞ was followed in
second place by the Ford Motor Company Turkey and in third
by automotive manufacturer Oyak-Renault. The three top
firms, all of which are private companies, were responsible
for 15.8% of the ISO 500’s production-based sales, up from
13.4% in 2011.
White goods producer Arçelik, A.Ş., which jumped from
6th to 4th place in 2011, fell in 2012 to fifth, unseated by
EÜAŞ (Electricity Generation Company), while Turkish car
manufacturer TOFAŞ, A.Ş. slipped a notch from fifth to sixth
place and İskenderun Iron and Steel Works Company climbed
a notch to seventh. Ereğli Iron and Steel Works Company
dropped back to eighth place, followed by İçdaş Steel, Energy,
Shipyards and Transportation Industries, Inc. in ninth place
and LNG distributor Aygaz A.Ş. in tenth.
PETKİM (Petrochemical Holding Co.), which ranks 11th in
the ISO 500 for 2012, was followed by Çolakoğlu Metallurgy
Company in 12th place, Mercedes-Benz T.A.Ş. in 13th, Vestel
Electronics in 14th and the Turkish Coal Group (Türkiye Kömür
İşletmeleri) in 15th. There was only one public enterprise
among the top fifteen in 2011, but in 2012 the number has
risen to two.
The Top Companies by Value Added Generated
The ISO 500 survey also shows the amount of value added
generated by the firms at producer prices in the table giving
data company by company. In the Turkish Statistical Institute’s
(TurkStat) latest update of the national income tables, value
added by branch of activity is now given at basic prices. Prior
to the update, it was given at producer prices. To facilitate
compatibility between the ISO 500 and TurkStat data, value
added has therefore been calculated at basic prices in our
survey. For the sake of continuity with previous years,
however, value added on a company basis continues to be
given at producer prices. At the same time, value added in the
ISO 500 survey is shown as net factor income, as value added
at basic prices and as value added at producer prices in both
the sectoral tables and the public/private sector breakdown.
The amount of value added at basic prices in the ISO 500 can
The Top Three Companies by Production-Based Sales
Overall Ranking
Production-Based Sales (Net) (Minus Sales Tax)
TÜPRAŞ 1 40.118.028.063 TL
Ford Otomotiv 2 8.164.892.972 TL
Oyak-Renault 3 7.529.420.343 TL
•8•
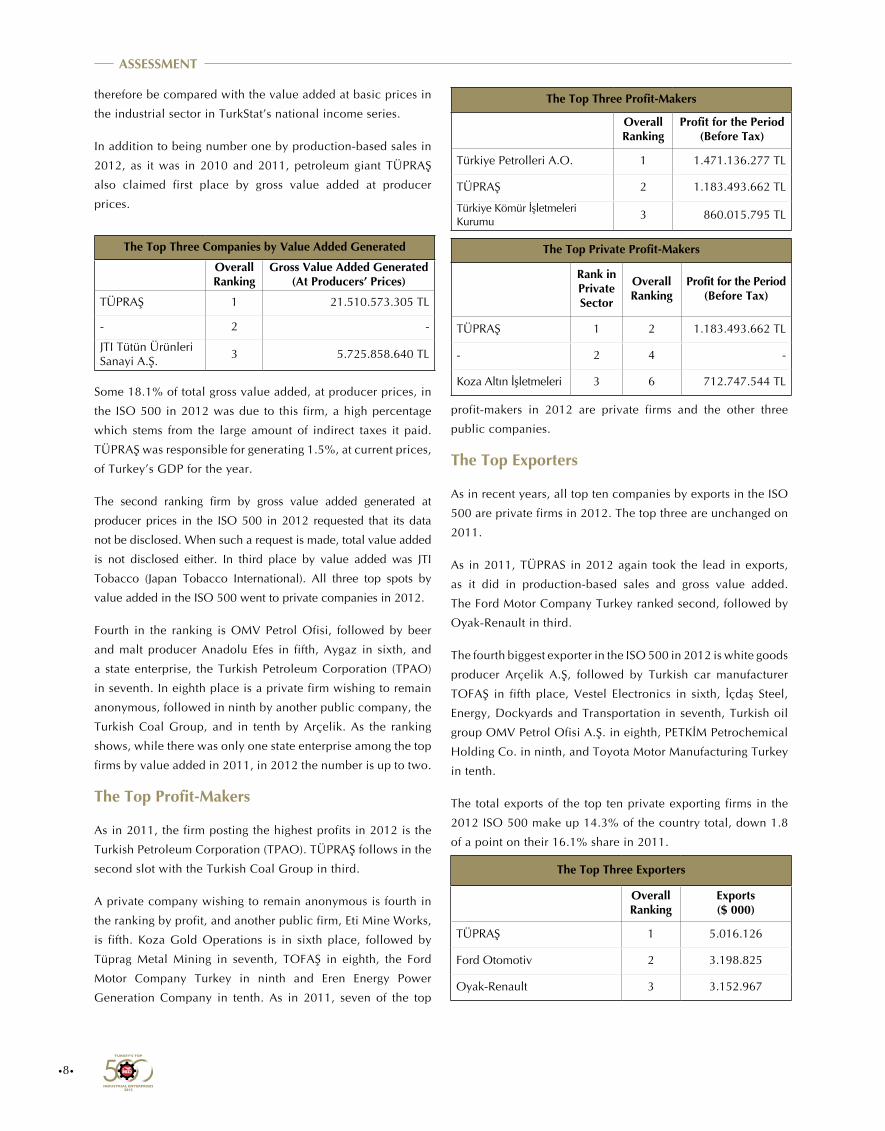
The Top Three Companies by Value Added Generated
Overall Ranking
Gross Value Added Generated(At Producers’ Prices)
TÜPRAŞ 1 21.510.573.305 TL
- 2 -
JTI Tütün Ürünleri Sanayi A.Ş.
3 5.725.858.640 TL
The Top Three Profit-Makers
Overall Ranking
Profit for the Period (Before Tax)
Türkiye Petrolleri A.O. 1 1.471.136.277 TL
TÜPRAŞ 2 1.183.493.662 TL
Türkiye Kömür İşletmeleri Kurumu 3 860.015.795 TL
The Top Private Profit-Makers
Rank in PrivateSector
Overall Ranking
Profit for the Period (Before Tax)
TÜPRAŞ 1 2 1.183.493.662 TL
- 2 4 -
Koza Altın İşletmeleri 3 6 712.747.544 TL
The Top Three Exporters
Overall Ranking
Exports ($ 000)
TÜPRAŞ 1 5.016.126
Ford Otomotiv 2 3.198.825
Oyak-Renault 3 3.152.967
therefore be compared with the value added at basic prices in
the industrial sector in TurkStat’s national income series.
In addition to being number one by production-based sales in
2012, as it was in 2010 and 2011, petroleum giant TÜPRAŞ
also claimed first place by gross value added at producer
prices.
Some 18.1% of total gross value added, at producer prices, in
the ISO 500 in 2012 was due to this firm, a high percentage
which stems from the large amount of indirect taxes it paid.
TÜPRAŞ was responsible for generating 1.5%, at current prices,
of Turkey’s GDP for the year.
The second ranking firm by gross value added generated at
producer prices in the ISO 500 in 2012 requested that its data
not be disclosed. When such a request is made, total value added
is not disclosed either. In third place by value added was JTI
Tobacco (Japan Tobacco International). All three top spots by
value added in the ISO 500 went to private companies in 2012.
Fourth in the ranking is OMV Petrol Ofisi, followed by beer
and malt producer Anadolu Efes in fifth, Aygaz in sixth, and
a state enterprise, the Turkish Petroleum Corporation (TPAO)
in seventh. In eighth place is a private firm wishing to remain
anonymous, followed in ninth by another public company, the
Turkish Coal Group, and in tenth by Arçelik. As the ranking
shows, while there was only one state enterprise among the top
firms by value added in 2011, in 2012 the number is up to two.
The Top Profit-Makers
As in 2011, the firm posting the highest profits in 2012 is the
Turkish Petroleum Corporation (TPAO). TÜPRAŞ follows in the
second slot with the Turkish Coal Group in third.
A private company wishing to remain anonymous is fourth in
the ranking by profit, and another public firm, Eti Mine Works,
is fifth. Koza Gold Operations is in sixth place, followed by
Tüprag Metal Mining in seventh, TOFAŞ in eighth, the Ford
Motor Company Turkey in ninth and Eren Energy Power
Generation Company in tenth. As in 2011, seven of the top
profit-makers in 2012 are private firms and the other three
public companies.
The Top Exporters
As in recent years, all top ten companies by exports in the ISO
500 are private firms in 2012. The top three are unchanged on
2011.
As in 2011, TÜPRAS in 2012 again took the lead in exports,
as it did in production-based sales and gross value added.
The Ford Motor Company Turkey ranked second, followed by
Oyak-Renault in third.
The fourth biggest exporter in the ISO 500 in 2012 is white goods
producer Arçelik A.Ş, followed by Turkish car manufacturer
TOFAŞ in fifth place, Vestel Electronics in sixth, İçdaş Steel,
Energy, Dockyards and Transportation in seventh, Turkish oil
group OMV Petrol Ofisi A.Ş. in eighth, PETKİM Petrochemical
Holding Co. in ninth, and Toyota Motor Manufacturing Turkey
in tenth.
The total exports of the top ten private exporting firms in the
2012 ISO 500 make up 14.3% of the country total, down 1.8
of a point on their 16.1% share in 2011.
ASSESSMENT
•9•
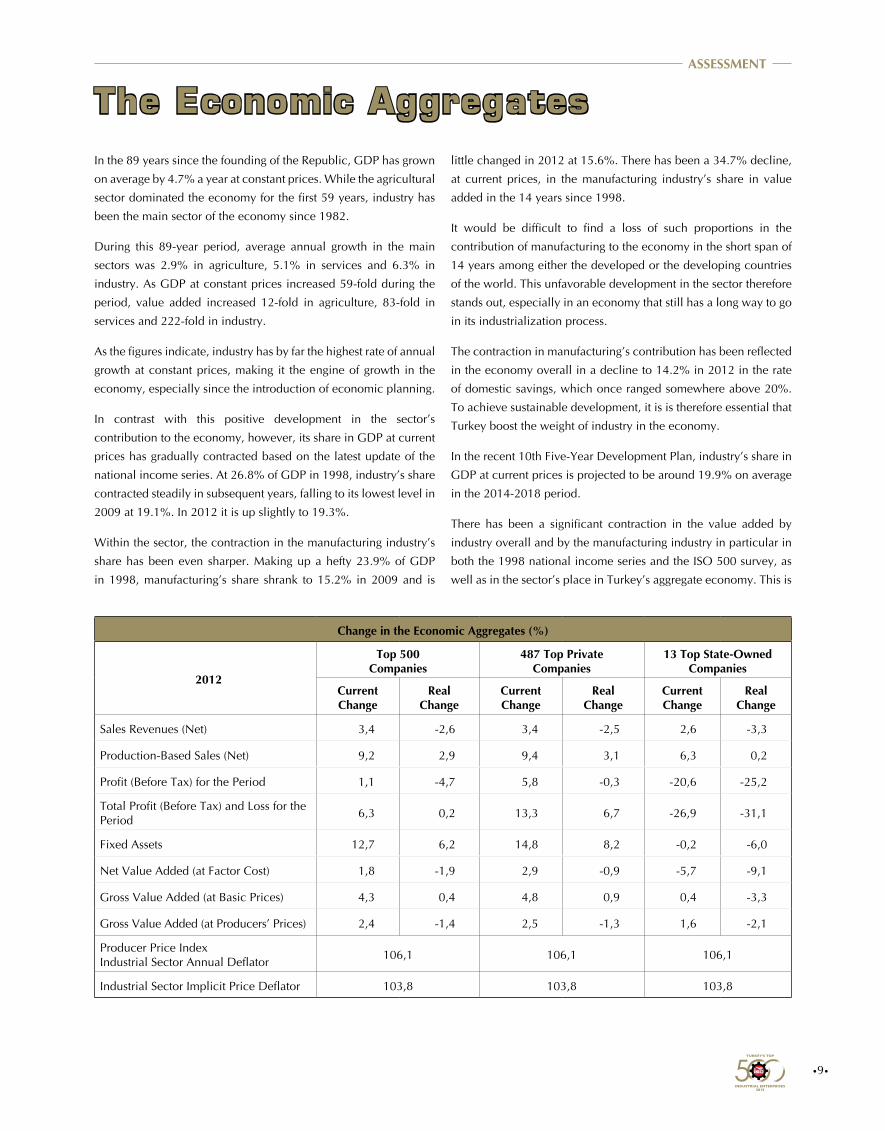
The Economic Aggregates
Change in the Economic Aggregates (%)
2012
Top 500Companies
487 Top Private Companies
13 Top State-Owned Companies
CurrentChange
RealChange
CurrentChange
RealChange
CurrentChange
RealChange
Sales Revenues (Net) 3,4 -2,6 3,4 -2,5 2,6 -3,3
Production-Based Sales (Net) 9,2 2,9 9,4 3,1 6,3 0,2
Profit (Before Tax) for the Period 1,1 -4,7 5,8 -0,3 -20,6 -25,2
Total Profit (Before Tax) and Loss for the Period
6,3 0,2 13,3 6,7 -26,9 -31,1
Fixed Assets 12,7 6,2 14,8 8,2 -0,2 -6,0
Net Value Added (at Factor Cost) 1,8 -1,9 2,9 -0,9 -5,7 -9,1
Gross Value Added (at Basic Prices) 4,3 0,4 4,8 0,9 0,4 -3,3
Gross Value Added (at Producers’ Prices) 2,4 -1,4 2,5 -1,3 1,6 -2,1
Producer Price IndexIndustrial Sector Annual Deflator
106,1 106,1 106,1
Industrial Sector Implicit Price Deflator 103,8 103,8 103,8
little changed in 2012 at 15.6%. There has been a 34.7% decline,
at current prices, in the manufacturing industry’s share in value
added in the 14 years since 1998.
It would be difficult to find a loss of such proportions in the
contribution of manufacturing to the economy in the short span of
14 years among either the developed or the developing countries
of the world. This unfavorable development in the sector therefore
stands out, especially in an economy that still has a long way to go
in its industrialization process.
The contraction in manufacturing’s contribution has been reflected
in the economy overall in a decline to 14.2% in 2012 in the rate
of domestic savings, which once ranged somewhere above 20%.
To achieve sustainable development, it is is therefore essential that
Turkey boost the weight of industry in the economy.
In the recent 10th Five-Year Development Plan, industry’s share in
GDP at current prices is projected to be around 19.9% on average
in the 2014-2018 period.
There has been a significant contraction in the value added by
industry overall and by the manufacturing industry in particular in
both the 1998 national income series and the ISO 500 survey, as
well as in the sector’s place in Turkey’s aggregate economy. This is
In the 89 years since the founding of the Republic, GDP has grown
on average by 4.7% a year at constant prices. While the agricultural
sector dominated the economy for the first 59 years, industry has
been the main sector of the economy since 1982.
During this 89-year period, average annual growth in the main
sectors was 2.9% in agriculture, 5.1% in services and 6.3% in
industry. As GDP at constant prices increased 59-fold during the
period, value added increased 12-fold in agriculture, 83-fold in
services and 222-fold in industry.
As the figures indicate, industry has by far the highest rate of annual
growth at constant prices, making it the engine of growth in the
economy, especially since the introduction of economic planning.
In contrast with this positive development in the sector’s
contribution to the economy, however, its share in GDP at current
prices has gradually contracted based on the latest update of the
national income series. At 26.8% of GDP in 1998, industry’s share
contracted steadily in subsequent years, falling to its lowest level in
2009 at 19.1%. In 2012 it is up slightly to 19.3%.
Within the sector, the contraction in the manufacturing industry’s
share has been even sharper. Making up a hefty 23.9% of GDP
in 1998, manufacturing’s share shrank to 15.2% in 2009 and is
ASSESSMENT
•10•
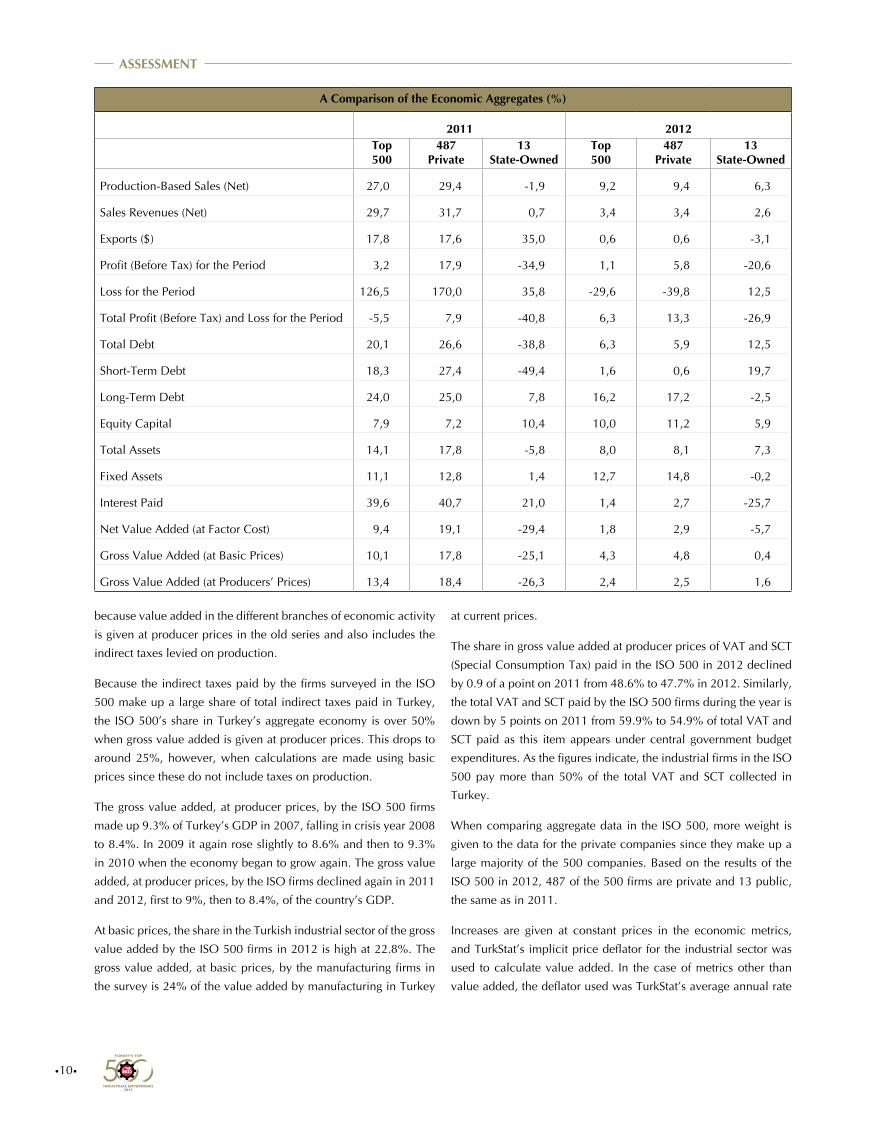
A Comparison of the Economic Aggregates (%)
2011 2012
Top 500
487 Private
13 State-Owned
Top 500
487 Private
13 State-Owned
Production-Based Sales (Net) 27,0 29,4 -1,9 9,2 9,4 6,3
Sales Revenues (Net) 29,7 31,7 0,7 3,4 3,4 2,6
Exports ($) 17,8 17,6 35,0 0,6 0,6 -3,1
Profit (Before Tax) for the Period 3,2 17,9 -34,9 1,1 5,8 -20,6
Loss for the Period 126,5 170,0 35,8 -29,6 -39,8 12,5
Total Profit (Before Tax) and Loss for the Period -5,5 7,9 -40,8 6,3 13,3 -26,9
Total Debt 20,1 26,6 -38,8 6,3 5,9 12,5
Short-Term Debt 18,3 27,4 -49,4 1,6 0,6 19,7
Long-Term Debt 24,0 25,0 7,8 16,2 17,2 -2,5
Equity Capital 7,9 7,2 10,4 10,0 11,2 5,9
Total Assets 14,1 17,8 -5,8 8,0 8,1 7,3
Fixed Assets 11,1 12,8 1,4 12,7 14,8 -0,2
Interest Paid 39,6 40,7 21,0 1,4 2,7 -25,7
Net Value Added (at Factor Cost) 9,4 19,1 -29,4 1,8 2,9 -5,7
Gross Value Added (at Basic Prices) 10,1 17,8 -25,1 4,3 4,8 0,4
Gross Value Added (at Producers’ Prices) 13,4 18,4 -26,3 2,4 2,5 1,6
because value added in the different branches of economic activity
is given at producer prices in the old series and also includes the
indirect taxes levied on production.
Because the indirect taxes paid by the firms surveyed in the ISO
500 make up a large share of total indirect taxes paid in Turkey,
the ISO 500’s share in Turkey’s aggregate economy is over 50%
when gross value added is given at producer prices. This drops to
around 25%, however, when calculations are made using basic
prices since these do not include taxes on production.
The gross value added, at producer prices, by the ISO 500 firms
made up 9.3% of Turkey’s GDP in 2007, falling in crisis year 2008
to 8.4%. In 2009 it again rose slightly to 8.6% and then to 9.3%
in 2010 when the economy began to grow again. The gross value
added, at producer prices, by the ISO firms declined again in 2011
and 2012, first to 9%, then to 8.4%, of the country’s GDP.
At basic prices, the share in the Turkish industrial sector of the gross
value added by the ISO 500 firms in 2012 is high at 22.8%. The
gross value added, at basic prices, by the manufacturing firms in
the survey is 24% of the value added by manufacturing in Turkey
at current prices.
The share in gross value added at producer prices of VAT and SCT
(Special Consumption Tax) paid in the ISO 500 in 2012 declined
by 0.9 of a point on 2011 from 48.6% to 47.7% in 2012. Similarly,
the total VAT and SCT paid by the ISO 500 firms during the year is
down by 5 points on 2011 from 59.9% to 54.9% of total VAT and
SCT paid as this item appears under central government budget
expenditures. As the figures indicate, the industrial firms in the ISO
500 pay more than 50% of the total VAT and SCT collected in
Turkey.
When comparing aggregate data in the ISO 500, more weight is
given to the data for the private companies since they make up a
large majority of the 500 companies. Based on the results of the
ISO 500 in 2012, 487 of the 500 firms are private and 13 public,
the same as in 2011.
Increases are given at constant prices in the economic metrics,
and TurkStat’s implicit price deflator for the industrial sector was
used to calculate value added. In the case of metrics other than
value added, the deflator used was TurkStat’s average annual rate
ASSESSMENT

•11•
of change based on 12-month changes in the Producer Price Index
for the industrial sector.
The production-based sales of the ISO 500 firms rose by 9.2% at
current prices and 2.9% at constant prices in 2012. These rates
were 9.4% and 3.1% respectively in the private companies and
6.3% and 0.2% respectively in the public firms. Sales turnover in
the ISO 500 firms, which rose by 3.4% at current prices, fell by
2.6% at constant prices.
The exports of both the ISO 500 firms and the private sector
firms are up by 0.6% on a dollar basis in 2012 whereas exports
in the public sector firms declined at the rate of 3.1%. Turkey’s
total exports in 2012 grew by 13% on a dollar basis while export
growth in the ISO 500 remained limited at 0.6%. It should not be
overlooked however that a 9-point portion of the 13% growth in
exports in 2012 stemmed entirely from exports of precious and
semi-precious stones.
Pre-tax profit for the period in the ISO 500 firms in 2012 is up by
1.1% at current prices. This growth is higher in the private firms at
5.8%.
Profit for the period in the public firms on the other hand fell on
the previous year by 20.6%. As pre-tax profit for the period in the
ISO 500 overall declined at the rate of 4.7% at constant prices,
these declines were 0.3% for the private firms and 25.2% for the
public firms.
Current growth in pre-tax profit and loss for the period is higher at
6.3% for the ISO 500 and 13.3% for the private companies among
them, whereas in the public firms there is a decline of 26.9% in
profit and loss for the period.
While this decline in the public firms is 31.1% at constant prices,
in the ISO 500 as a whole as well as in the private firms total profit
and loss for the period is up by 0.2% and 6.7% respectively. This
positive development in the private companies is not mirrored in
the public firms.
The total debts of the ISO 500 firms in 2012 are up by 6.3% on
2011 at current prices. In the private firms the increase is 5.9%. In
the ISO 500 overall, short-term debt grew at the low rate of 1.6% in
2012 while growth in long-term debt was higher at 16.2%.
The same trend is observed in the private companies, whose short-
term debts are up by 0.6% and long-term debts by 17.2% in 2012.
As these findings indicate, growth in long-term debt was higher
than that in short-term debt for the year.
Equity capital (shareholders’ equity) in the ISO 500 overall and
in the private companies rose by 10% and 11.2% respectively in
2012 while growth in total assets was 8% and 8.1%.
Growth in fixed assets, a component of total assets, in the ISO
500 is 12.7% at current prices and 6.2% at constant prices. In the
private firms these growth rates are 14.8% and 8.2% respectively.
As interest payments by the ISO 500 enterprises overall rose by
1.4% at current prices in 2012, in the private firms the increase
was higher at 2.7%.
Interest payments by the public companies on the other hand fell
by 25.7% on 2011. Rates of growth in interest payments remained
rather limited in any case due to lower taxes following a slowdown
in production.
Net value added in the ISO 500 overall was up by 1.8% at current
prices in 2012 but down at constant prices by 1.9%. Up by 2.9%
at current prices in the private companies, at constant prices it fell
by 0.9%.
Value added in the Turkish industrial sector in 2012 showed growth
of 2% at basic prices in 2012. For the private companies in the ISO
500 growth in gross value added was 4.8% at current prices and
0.9% at constant prices. This figure indicates that growth in the
value added by the private firms in the ISO 500 was lower than in
the other companies.
While the value added at producer prices by the ISO 500 private
firms is up by 2.5% at current prices in 2012, at constant prices it
declined by 1.3%.
In the public companies, too, gross value added at producer prices
in 2012 rose at the rate of 1.6% at current prices but fell by 2.1%
at constant prices.
Overall there is no significant difference between growth figures
for Turkey and those for the ISO 500. Basically, growth in the
industrial sector was very sluggish for the year due to developments
in domestic and foreign demand.
ASSESSMENT
•12•
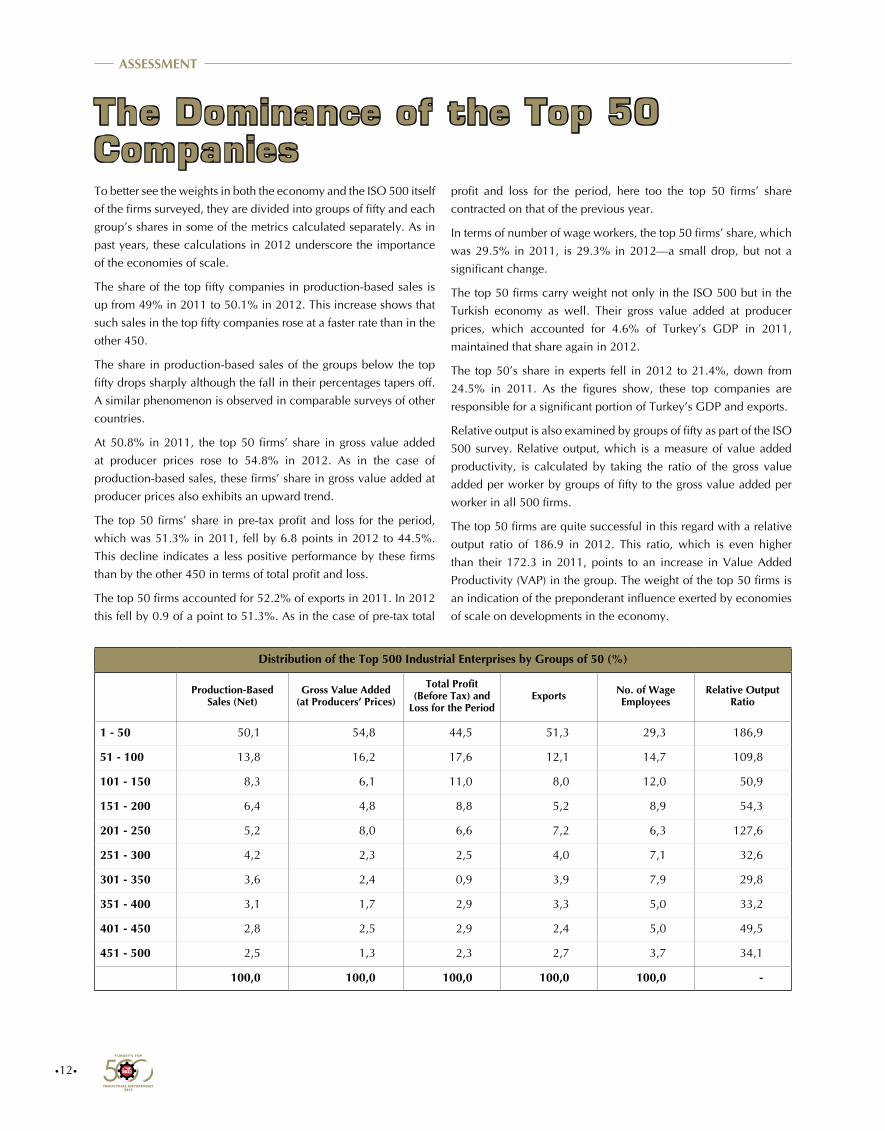
The Dominance of the Top 50Companies
Distribution of the Top 500 Industrial Enterprises by Groups of 50 (%)
Production-Based Sales (Net)
Gross Value Added (at Producers’ Prices)
Total Profit (Before Tax) and
Loss for the PeriodExports No. of Wage
EmployeesRelative Output
Ratio
1 - 50 50,1 54,8 44,5 51,3 29,3 186,9
51 - 100 13,8 16,2 17,6 12,1 14,7 109,8
101 - 150 8,3 6,1 11,0 8,0 12,0 50,9
151 - 200 6,4 4,8 8,8 5,2 8,9 54,3
201 - 250 5,2 8,0 6,6 7,2 6,3 127,6
251 - 300 4,2 2,3 2,5 4,0 7,1 32,6
301 - 350 3,6 2,4 0,9 3,9 7,9 29,8
351 - 400 3,1 1,7 2,9 3,3 5,0 33,2
401 - 450 2,8 2,5 2,9 2,4 5,0 49,5
451 - 500 2,5 1,3 2,3 2,7 3,7 34,1
100,0 100,0 100,0 100,0 100,0 -
To better see the weights in both the economy and the ISO 500 itself
of the firms surveyed, they are divided into groups of fifty and each
group’s shares in some of the metrics calculated separately. As in
past years, these calculations in 2012 underscore the importance
of the economies of scale.
The share of the top fifty companies in production-based sales is
up from 49% in 2011 to 50.1% in 2012. This increase shows that
such sales in the top fifty companies rose at a faster rate than in the
other 450.
The share in production-based sales of the groups below the top
fifty drops sharply although the fall in their percentages tapers off.
A similar phenomenon is observed in comparable surveys of other
countries.
At 50.8% in 2011, the top 50 firms’ share in gross value added
at producer prices rose to 54.8% in 2012. As in the case of
production-based sales, these firms’ share in gross value added at
producer prices also exhibits an upward trend.
The top 50 firms’ share in pre-tax profit and loss for the period,
which was 51.3% in 2011, fell by 6.8 points in 2012 to 44.5%.
This decline indicates a less positive performance by these firms
than by the other 450 in terms of total profit and loss.
The top 50 firms accounted for 52.2% of exports in 2011. In 2012
this fell by 0.9 of a point to 51.3%. As in the case of pre-tax total
profit and loss for the period, here too the top 50 firms’ share
contracted on that of the previous year.
In terms of number of wage workers, the top 50 firms’ share, which
was 29.5% in 2011, is 29.3% in 2012—a small drop, but not a
significant change.
The top 50 firms carry weight not only in the ISO 500 but in the
Turkish economy as well. Their gross value added at producer
prices, which accounted for 4.6% of Turkey’s GDP in 2011,
maintained that share again in 2012.
The top 50’s share in experts fell in 2012 to 21.4%, down from
24.5% in 2011. As the figures show, these top companies are
responsible for a significant portion of Turkey’s GDP and exports.
Relative output is also examined by groups of fifty as part of the ISO
500 survey. Relative output, which is a measure of value added
productivity, is calculated by taking the ratio of the gross value
added per worker by groups of fifty to the gross value added per
worker in all 500 firms.
The top 50 firms are quite successful in this regard with a relative
output ratio of 186.9 in 2012. This ratio, which is even higher
than their 172.3 in 2011, points to an increase in Value Added
Productivity (VAP) in the group. The weight of the top 50 firms is
an indication of the preponderant influence exerted by economies
of scale on developments in the economy.
ASSESSMENT
•13•
The Export Performance
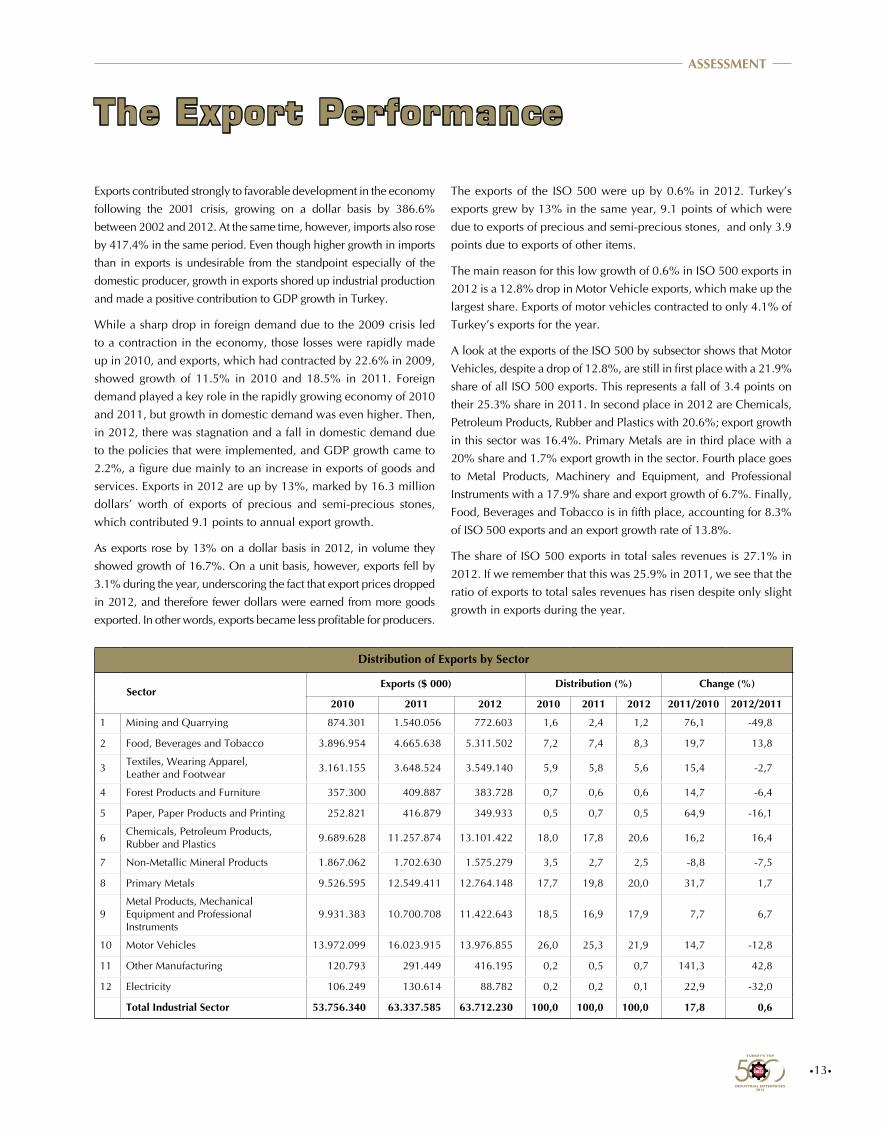
Distribution of Exports by Sector
SectorExports ($ 000) Distribution (%) Change (%)
2010 2011 2012 2010 2011 2012 2011/2010 2012/2011
1 Mining and Quarrying 874.301 1.540.056 772.603 1,6 2,4 1,2 76,1 -49,8
2 Food, Beverages and Tobacco 3.896.954 4.665.638 5.311.502 7,2 7,4 8,3 19,7 13,8
3Textiles, Wearing Apparel, Leather and Footwear
3.161.155 3.648.524 3.549.140 5,9 5,8 5,6 15,4 -2,7
4 Forest Products and Furniture 357.300 409.887 383.728 0,7 0,6 0,6 14,7 -6,4
5 Paper, Paper Products and Printing 252.821 416.879 349.933 0,5 0,7 0,5 64,9 -16,1
6Chemicals, Petroleum Products, Rubber and Plastics
9.689.628 11.257.874 13.101.422 18,0 17,8 20,6 16,2 16,4
7 Non-Metallic Mineral Products 1.867.062 1.702.630 1.575.279 3,5 2,7 2,5 -8,8 -7,5
8 Primary Metals 9.526.595 12.549.411 12.764.148 17,7 19,8 20,0 31,7 1,7
9Metal Products, Mechanical Equipment and Professional Instruments
9.931.383 10.700.708 11.422.643 18,5 16,9 17,9 7,7 6,7
10 Motor Vehicles 13.972.099 16.023.915 13.976.855 26,0 25,3 21,9 14,7 -12,8
11 Other Manufacturing 120.793 291.449 416.195 0,2 0,5 0,7 141,3 42,8
12 Electricity 106.249 130.614 88.782 0,2 0,2 0,1 22,9 -32,0
Total Industrial Sector 53.756.340 63.337.585 63.712.230 100,0 100,0 100,0 17,8 0,6
Exports contributed strongly to favorable development in the economy
following the 2001 crisis, growing on a dollar basis by 386.6%
between 2002 and 2012. At the same time, however, imports also rose
by 417.4% in the same period. Even though higher growth in imports
than in exports is undesirable from the standpoint especially of the
domestic producer, growth in exports shored up industrial production
and made a positive contribution to GDP growth in Turkey.
While a sharp drop in foreign demand due to the 2009 crisis led
to a contraction in the economy, those losses were rapidly made
up in 2010, and exports, which had contracted by 22.6% in 2009,
showed growth of 11.5% in 2010 and 18.5% in 2011. Foreign
demand played a key role in the rapidly growing economy of 2010
and 2011, but growth in domestic demand was even higher. Then,
in 2012, there was stagnation and a fall in domestic demand due
to the policies that were implemented, and GDP growth came to
2.2%, a figure due mainly to an increase in exports of goods and
services. Exports in 2012 are up by 13%, marked by 16.3 million
dollars’ worth of exports of precious and semi-precious stones,
which contributed 9.1 points to annual export growth.
As exports rose by 13% on a dollar basis in 2012, in volume they
showed growth of 16.7%. On a unit basis, however, exports fell by
3.1% during the year, underscoring the fact that export prices dropped
in 2012, and therefore fewer dollars were earned from more goods
exported. In other words, exports became less profitable for producers.
The exports of the ISO 500 were up by 0.6% in 2012. Turkey’s
exports grew by 13% in the same year, 9.1 points of which were
due to exports of precious and semi-precious stones, and only 3.9
points due to exports of other items.
The main reason for this low growth of 0.6% in ISO 500 exports in
2012 is a 12.8% drop in Motor Vehicle exports, which make up the
largest share. Exports of motor vehicles contracted to only 4.1% of
Turkey’s exports for the year.
A look at the exports of the ISO 500 by subsector shows that Motor
Vehicles, despite a drop of 12.8%, are still in first place with a 21.9%
share of all ISO 500 exports. This represents a fall of 3.4 points on
their 25.3% share in 2011. In second place in 2012 are Chemicals,
Petroleum Products, Rubber and Plastics with 20.6%; export growth
in this sector was 16.4%. Primary Metals are in third place with a
20% share and 1.7% export growth in the sector. Fourth place goes
to Metal Products, Machinery and Equipment, and Professional
Instruments with a 17.9% share and export growth of 6.7%. Finally,
Food, Beverages and Tobacco is in fifth place, accounting for 8.3%
of ISO 500 exports and an export growth rate of 13.8%.
The share of ISO 500 exports in total sales revenues is 27.1% in
2012. If we remember that this was 25.9% in 2011, we see that the
ratio of exports to total sales revenues has risen despite only slight
growth in exports during the year.
ASSESSMENT
•14•
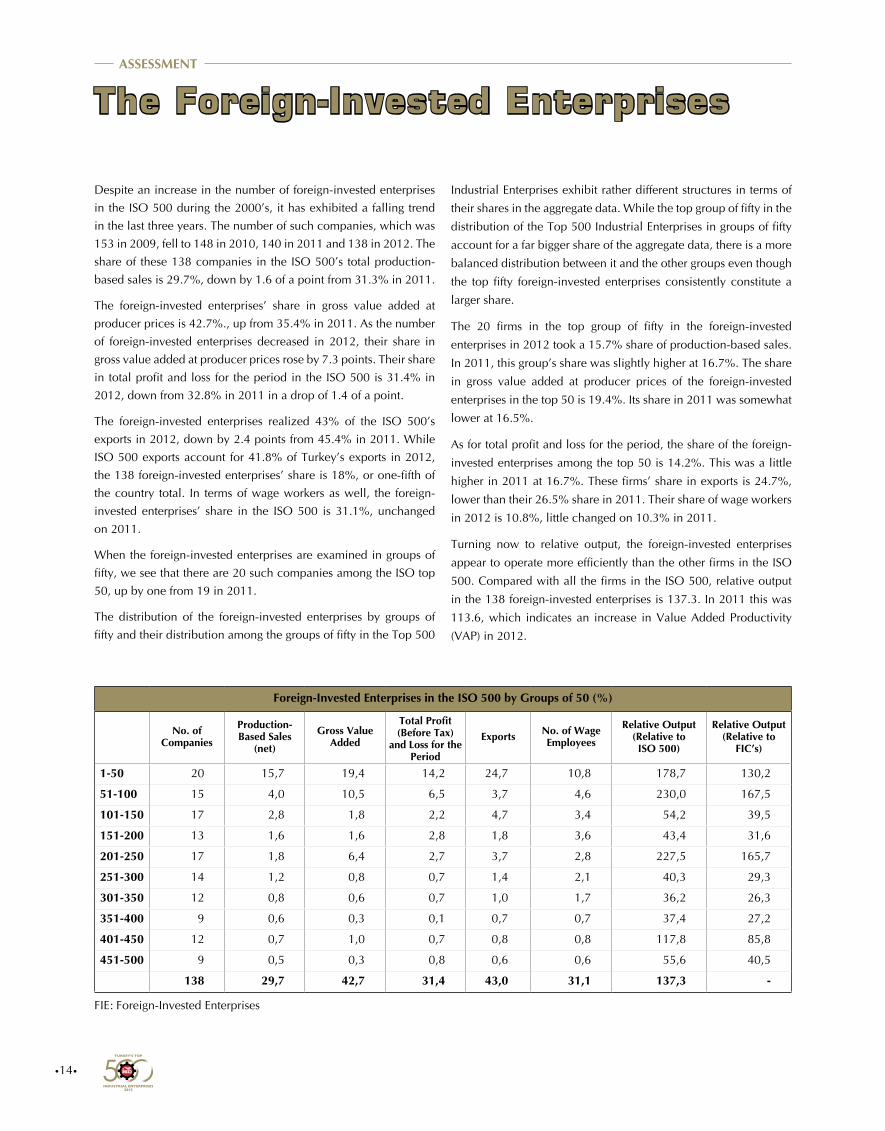
The Foreign-Invested Enterprises
Foreign-Invested Enterprises in the ISO 500 by Groups of 50 (%)
No. of Companies
Production-Based Sales
(net)
Gross Value Added
Total Profit (Before Tax)
and Loss for the Period
Exports No. of Wage Employees
Relative Output (Relative to ISO 500)
Relative Output (Relative to
FIC’s)
1-50 20 15,7 19,4 14,2 24,7 10,8 178,7 130,2
51-100 15 4,0 10,5 6,5 3,7 4,6 230,0 167,5
101-150 17 2,8 1,8 2,2 4,7 3,4 54,2 39,5
151-200 13 1,6 1,6 2,8 1,8 3,6 43,4 31,6
201-250 17 1,8 6,4 2,7 3,7 2,8 227,5 165,7
251-300 14 1,2 0,8 0,7 1,4 2,1 40,3 29,3
301-350 12 0,8 0,6 0,7 1,0 1,7 36,2 26,3
351-400 9 0,6 0,3 0,1 0,7 0,7 37,4 27,2
401-450 12 0,7 1,0 0,7 0,8 0,8 117,8 85,8
451-500 9 0,5 0,3 0,8 0,6 0,6 55,6 40,5
138 29,7 42,7 31,4 43,0 31,1 137,3 -
Despite an increase in the number of foreign-invested enterprises
in the ISO 500 during the 2000’s, it has exhibited a falling trend
in the last three years. The number of such companies, which was
153 in 2009, fell to 148 in 2010, 140 in 2011 and 138 in 2012. The
share of these 138 companies in the ISO 500’s total production-
based sales is 29.7%, down by 1.6 of a point from 31.3% in 2011.
The foreign-invested enterprises’ share in gross value added at
producer prices is 42.7%., up from 35.4% in 2011. As the number
of foreign-invested enterprises decreased in 2012, their share in
gross value added at producer prices rose by 7.3 points. Their share
in total profit and loss for the period in the ISO 500 is 31.4% in
2012, down from 32.8% in 2011 in a drop of 1.4 of a point.
The foreign-invested enterprises realized 43% of the ISO 500’s
exports in 2012, down by 2.4 points from 45.4% in 2011. While
ISO 500 exports account for 41.8% of Turkey’s exports in 2012,
the 138 foreign-invested enterprises’ share is 18%, or one-fifth of
the country total. In terms of wage workers as well, the foreign-
invested enterprises’ share in the ISO 500 is 31.1%, unchanged
on 2011.
When the foreign-invested enterprises are examined in groups of
fifty, we see that there are 20 such companies among the ISO top
50, up by one from 19 in 2011.
The distribution of the foreign-invested enterprises by groups of
fifty and their distribution among the groups of fifty in the Top 500
Industrial Enterprises exhibit rather different structures in terms of
their shares in the aggregate data. While the top group of fifty in the
distribution of the Top 500 Industrial Enterprises in groups of fifty
account for a far bigger share of the aggregate data, there is a more
balanced distribution between it and the other groups even though
the top fifty foreign-invested enterprises consistently constitute a
larger share.
The 20 firms in the top group of fifty in the foreign-invested
enterprises in 2012 took a 15.7% share of production-based sales.
In 2011, this group’s share was slightly higher at 16.7%. The share
in gross value added at producer prices of the foreign-invested
enterprises in the top 50 is 19.4%. Its share in 2011 was somewhat
lower at 16.5%.
As for total profit and loss for the period, the share of the foreign-
invested enterprises among the top 50 is 14.2%. This was a little
higher in 2011 at 16.7%. These firms’ share in exports is 24.7%,
lower than their 26.5% share in 2011. Their share of wage workers
in 2012 is 10.8%, little changed on 10.3% in 2011.
Turning now to relative output, the foreign-invested enterprises
appear to operate more efficiently than the other firms in the ISO
500. Compared with all the firms in the ISO 500, relative output
in the 138 foreign-invested enterprises is 137.3. In 2011 this was
113.6, which indicates an increase in Value Added Productivity
(VAP) in 2012.
FIE: Foreign-Invested Enterprises
ASSESSMENT
•15•
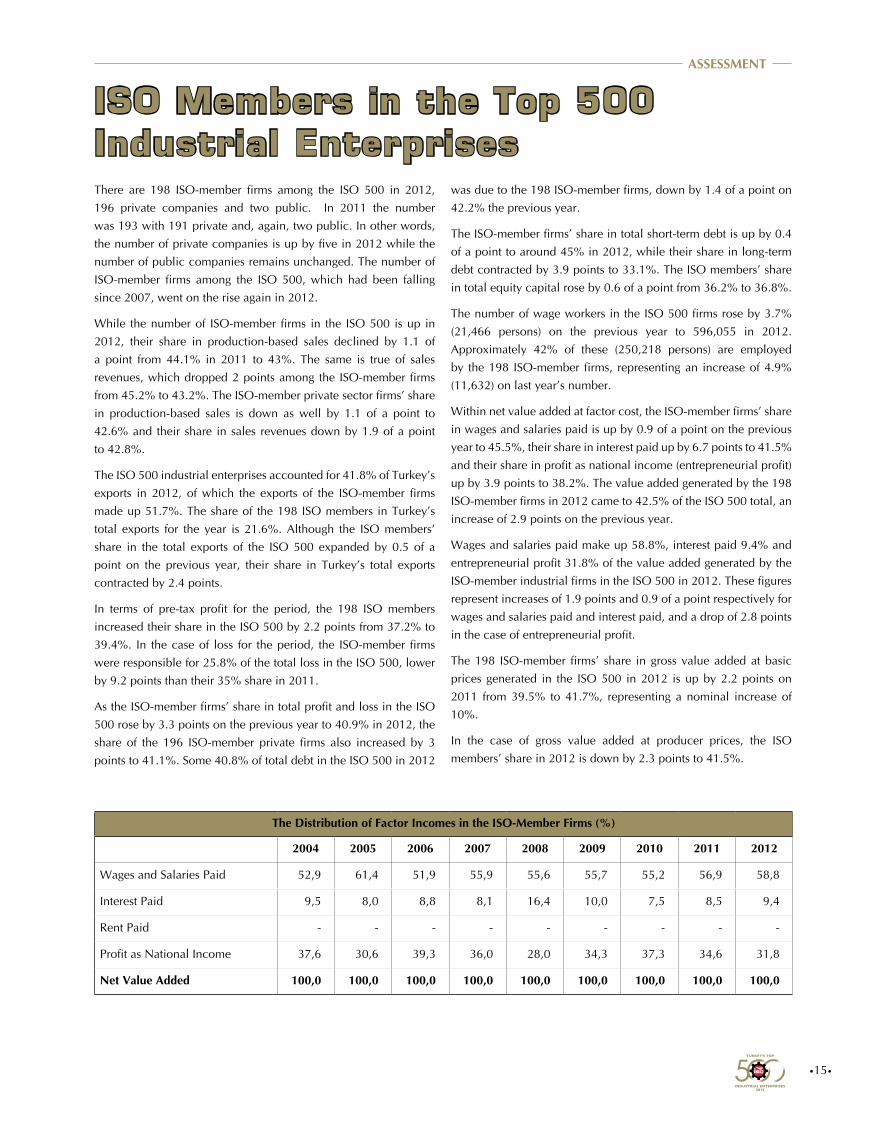
ISO Members in the Top 500 Industrial EnterprisesThere are 198 ISO-member firms among the ISO 500 in 2012,
196 private companies and two public. In 2011 the number
was 193 with 191 private and, again, two public. In other words,
the number of private companies is up by five in 2012 while the
number of public companies remains unchanged. The number of
ISO-member firms among the ISO 500, which had been falling
since 2007, went on the rise again in 2012.
While the number of ISO-member firms in the ISO 500 is up in
2012, their share in production-based sales declined by 1.1 of
a point from 44.1% in 2011 to 43%. The same is true of sales
revenues, which dropped 2 points among the ISO-member firms
from 45.2% to 43.2%. The ISO-member private sector firms’ share
in production-based sales is down as well by 1.1 of a point to
42.6% and their share in sales revenues down by 1.9 of a point
to 42.8%.
The ISO 500 industrial enterprises accounted for 41.8% of Turkey’s
exports in 2012, of which the exports of the ISO-member firms
made up 51.7%. The share of the 198 ISO members in Turkey’s
total exports for the year is 21.6%. Although the ISO members’
share in the total exports of the ISO 500 expanded by 0.5 of a
point on the previous year, their share in Turkey’s total exports
contracted by 2.4 points.
In terms of pre-tax profit for the period, the 198 ISO members
increased their share in the ISO 500 by 2.2 points from 37.2% to
39.4%. In the case of loss for the period, the ISO-member firms
were responsible for 25.8% of the total loss in the ISO 500, lower
by 9.2 points than their 35% share in 2011.
As the ISO-member firms’ share in total profit and loss in the ISO
500 rose by 3.3 points on the previous year to 40.9% in 2012, the
share of the 196 ISO-member private firms also increased by 3
points to 41.1%. Some 40.8% of total debt in the ISO 500 in 2012
was due to the 198 ISO-member firms, down by 1.4 of a point on
42.2% the previous year.
The ISO-member firms’ share in total short-term debt is up by 0.4
of a point to around 45% in 2012, while their share in long-term
debt contracted by 3.9 points to 33.1%. The ISO members’ share
in total equity capital rose by 0.6 of a point from 36.2% to 36.8%.
The number of wage workers in the ISO 500 firms rose by 3.7%
(21,466 persons) on the previous year to 596,055 in 2012.
Approximately 42% of these (250,218 persons) are employed
by the 198 ISO-member firms, representing an increase of 4.9%
(11,632) on last year’s number.
Within net value added at factor cost, the ISO-member firms’ share
in wages and salaries paid is up by 0.9 of a point on the previous
year to 45.5%, their share in interest paid up by 6.7 points to 41.5%
and their share in profit as national income (entrepreneurial profit)
up by 3.9 points to 38.2%. The value added generated by the 198
ISO-member firms in 2012 came to 42.5% of the ISO 500 total, an
increase of 2.9 points on the previous year.
Wages and salaries paid make up 58.8%, interest paid 9.4% and
entrepreneurial profit 31.8% of the value added generated by the
ISO-member industrial firms in the ISO 500 in 2012. These figures
represent increases of 1.9 points and 0.9 of a point respectively for
wages and salaries paid and interest paid, and a drop of 2.8 points
in the case of entrepreneurial profit.
The 198 ISO-member firms’ share in gross value added at basic
prices generated in the ISO 500 in 2012 is up by 2.2 points on
2011 from 39.5% to 41.7%, representing a nominal increase of
10%.
In the case of gross value added at producer prices, the ISO
members’ share in 2012 is down by 2.3 points to 41.5%.
ASSESSMENT
The Distribution of Factor Incomes in the ISO-Member Firms (%)
2004 2005 2006 2007 2008 2009 2010 2011 2012
Wages and Salaries Paid 52,9 61,4 51,9 55,9 55,6 55,7 55,2 56,9 58,8
Interest Paid 9,5 8,0 8,8 8,1 16,4 10,0 7,5 8,5 9,4
Rent Paid - - - - - - - - -
Profit as National Income 37,6 30,6 39,3 36,0 28,0 34,3 37,3 34,6 31,8
Net Value Added 100,0 100,0 100,0 100,0 100,0 100,0 100,0 100,0 100,0
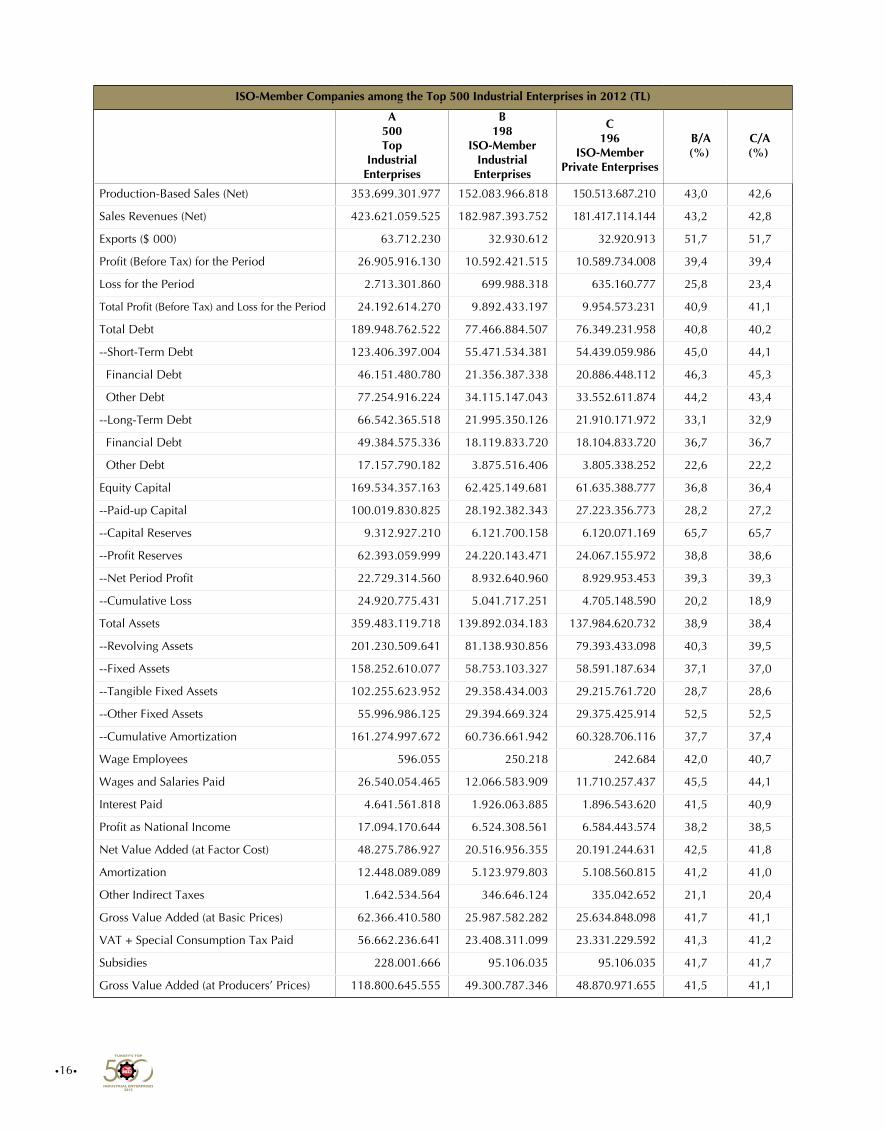
•16•
ISO-Member Companies among the Top 500 Industrial Enterprises in 2012 (TL)
A500Top
IndustrialEnterprises
B198
ISO-MemberIndustrial
Enterprises
C 196
ISO-Member Private Enterprises
«B/A (%)
C/A (%)»
Production-Based Sales (Net) 353.699.301.977 152.083.966.818 150.513.687.210 43,0 42,6
Sales Revenues (Net) 423.621.059.525 182.987.393.752 181.417.114.144 43,2 42,8
Exports ($ 000) 63.712.230 32.930.612 32.920.913 51,7 51,7
Profit (Before Tax) for the Period 26.905.916.130 10.592.421.515 10.589.734.008 39,4 39,4
Loss for the Period 2.713.301.860 699.988.318 635.160.777 25,8 23,4
Total Profit (Before Tax) and Loss for the Period 24.192.614.270 9.892.433.197 9.954.573.231 40,9 41,1
Total Debt 189.948.762.522 77.466.884.507 76.349.231.958 40,8 40,2
--Short-Term Debt 123.406.397.004 55.471.534.381 54.439.059.986 45,0 44,1
Financial Debt 46.151.480.780 21.356.387.338 20.886.448.112 46,3 45,3
Other Debt 77.254.916.224 34.115.147.043 33.552.611.874 44,2 43,4
--Long-Term Debt 66.542.365.518 21.995.350.126 21.910.171.972 33,1 32,9
Financial Debt 49.384.575.336 18.119.833.720 18.104.833.720 36,7 36,7
Other Debt 17.157.790.182 3.875.516.406 3.805.338.252 22,6 22,2
Equity Capital 169.534.357.163 62.425.149.681 61.635.388.777 36,8 36,4
--Paid-up Capital 100.019.830.825 28.192.382.343 27.223.356.773 28,2 27,2
--Capital Reserves 9.312.927.210 6.121.700.158 6.120.071.169 65,7 65,7
--Profit Reserves 62.393.059.999 24.220.143.471 24.067.155.972 38,8 38,6
--Net Period Profit 22.729.314.560 8.932.640.960 8.929.953.453 39,3 39,3
--Cumulative Loss 24.920.775.431 5.041.717.251 4.705.148.590 20,2 18,9
Total Assets 359.483.119.718 139.892.034.183 137.984.620.732 38,9 38,4
--Revolving Assets 201.230.509.641 81.138.930.856 79.393.433.098 40,3 39,5
--Fixed Assets 158.252.610.077 58.753.103.327 58.591.187.634 37,1 37,0
--Tangible Fixed Assets 102.255.623.952 29.358.434.003 29.215.761.720 28,7 28,6
--Other Fixed Assets 55.996.986.125 29.394.669.324 29.375.425.914 52,5 52,5
--Cumulative Amortization 161.274.997.672 60.736.661.942 60.328.706.116 37,7 37,4
Wage Employees 596.055 250.218 242.684 42,0 40,7
Wages and Salaries Paid 26.540.054.465 12.066.583.909 11.710.257.437 45,5 44,1
Interest Paid 4.641.561.818 1.926.063.885 1.896.543.620 41,5 40,9
Profit as National Income 17.094.170.644 6.524.308.561 6.584.443.574 38,2 38,5
Net Value Added (at Factor Cost) 48.275.786.927 20.516.956.355 20.191.244.631 42,5 41,8
Amortization 12.448.089.089 5.123.979.803 5.108.560.815 41,2 41,0
Other Indirect Taxes 1.642.534.564 346.646.124 335.042.652 21,1 20,4
Gross Value Added (at Basic Prices) 62.366.410.580 25.987.582.282 25.634.848.098 41,7 41,1
VAT + Special Consumption Tax Paid 56.662.236.641 23.408.311.099 23.331.229.592 41,3 41,2
Subsidies 228.001.666 95.106.035 95.106.035 41,7 41,7
Gross Value Added (at Producers’ Prices) 118.800.645.555 49.300.787.346 48.870.971.655 41,5 41,1
•17•
ISO Members in the Private SectorThe number of private sector firms in the ISO 500 in 2012 is
unchanged on 2011 at 487. Among these 487 firms, 196 (40.2%)
are ISO-member private companies. This represents an increase of
five on the previous year.
The ISO-member private firms among the private firms in the ISO
500 accounted for 45.2% of production-based sales, 45.1% of sales
revenues and 52.4% of exports in 2012. These shares represent
increases of 1.2 and 2 points in the case of production-based sales
and sales revenues and a decline of 0.5 of a point in exports.
Despite making up 40.2% numerically of the ISO 500 private firms
in 2012, the ISO-member private firms’ shares in production-based
sales, sales revenues and exports are all higher, underscoring their
sheer economic weight in the ISO 500.
In the case of pre-tax profit for the period, the ISO-member private
firms’ share is 45.7%, their share in loss for the period 34%. These
firms’ share in total pre-tax profit and loss for the period is up by
0.7 of a point on 2011 to 46.7%.
The share of the ISO-member private firms’ debts in the total
debt of the ISO 500 in 2012 is down by 1.6 of a point on 2011
at 42.5%; their share in short-term debt rose to 46.9% while their
share in long-term debt fell to 34.4%. Their share in equity capital
is unchanged on the previous year at 46%.
The ISO-member private firms in the ISO 500 employed 242,684
persons in 2012, representing a 45.9% share of total employment
(528,544 persons) in the ISO 500. This is an increase of 5.2% on
2011 in the numbers but only a 0.2-point increase in the share.
The net value added generated in 2012 in the ISO-member private
industrial firms rose by 2.7 points on 2011 to 47.5% of total net
value added in the ISO 500 private companies. The value added
generated by the 487 ISO 500 private firms in 2012 showed an
increase on the previous year of 2.9% at current prices.
Among the ISO 500 private firms, the ISO-member private
companies’ share in wages and salaries paid, a component of net
value added, was 51.3% in 2012. Their share in interest paid was
42.3%, and their share in entrepreneurial profit 43.4%.
In the case of gross value added at basic prices, their share was
around 46.6%, but lower at 44.4% at producer prices.
Despite an increase of five in the number of ISO-member private
firms in 2012, these firms’ gross value added at basic prices was
lower by 3.2%. This stems from the fact that the amount of VAT
and SCT paid by the ISO-member private industrial firms in 2012
was down from 27.2 billion to 23.3 billion Turkish Liras.
ASSESSMENT
•18•
ASSESSMENT
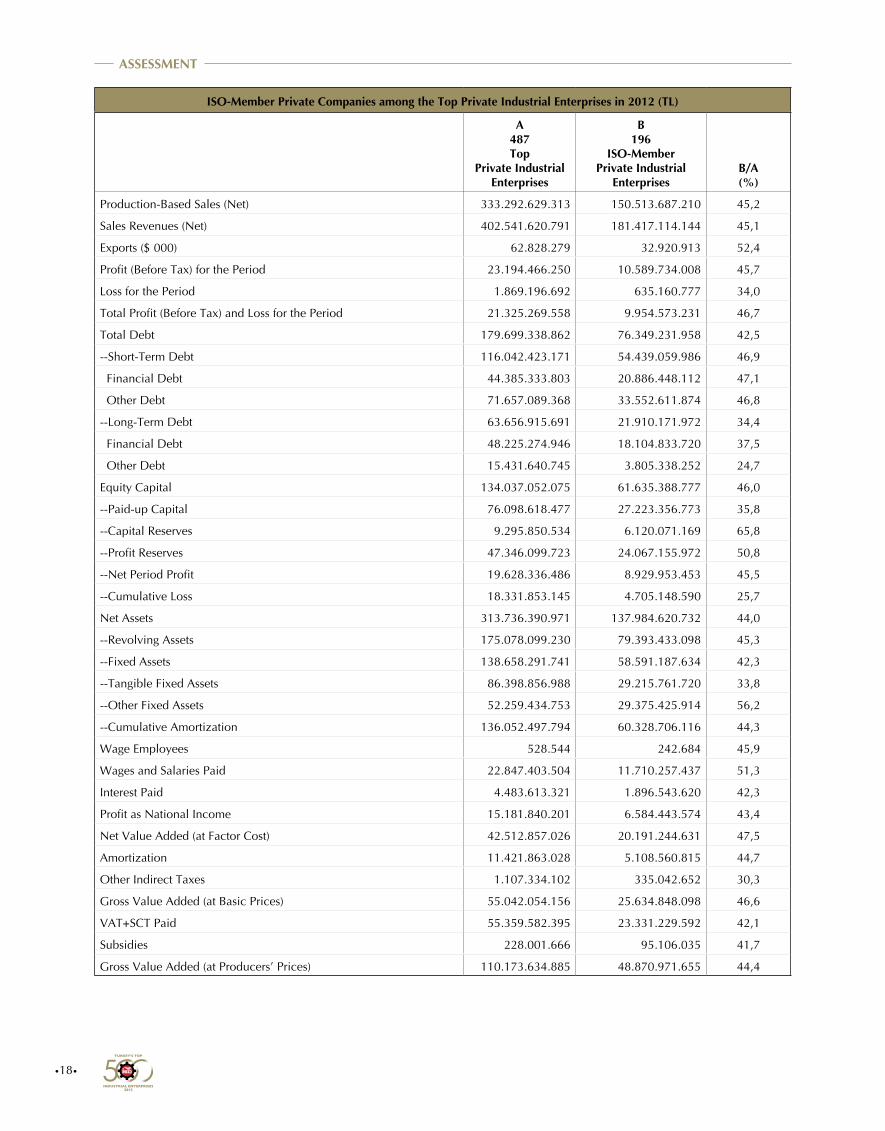
ISO-Member Private Companies among the Top Private Industrial Enterprises in 2012 (TL)
A487Top
Private IndustrialEnterprises
B196
ISO-Member Private Industrial
Enterprises
B/A(%)
Production-Based Sales (Net) 333.292.629.313 150.513.687.210 45,2
Sales Revenues (Net) 402.541.620.791 181.417.114.144 45,1
Exports ($ 000) 62.828.279 32.920.913 52,4
Profit (Before Tax) for the Period 23.194.466.250 10.589.734.008 45,7
Loss for the Period 1.869.196.692 635.160.777 34,0
Total Profit (Before Tax) and Loss for the Period 21.325.269.558 9.954.573.231 46,7
Total Debt 179.699.338.862 76.349.231.958 42,5
--Short-Term Debt 116.042.423.171 54.439.059.986 46,9
Financial Debt 44.385.333.803 20.886.448.112 47,1
Other Debt 71.657.089.368 33.552.611.874 46,8
--Long-Term Debt 63.656.915.691 21.910.171.972 34,4
Financial Debt 48.225.274.946 18.104.833.720 37,5
Other Debt 15.431.640.745 3.805.338.252 24,7
Equity Capital 134.037.052.075 61.635.388.777 46,0
--Paid-up Capital 76.098.618.477 27.223.356.773 35,8
--Capital Reserves 9.295.850.534 6.120.071.169 65,8
--Profit Reserves 47.346.099.723 24.067.155.972 50,8
--Net Period Profit 19.628.336.486 8.929.953.453 45,5
--Cumulative Loss 18.331.853.145 4.705.148.590 25,7
Net Assets 313.736.390.971 137.984.620.732 44,0
--Revolving Assets 175.078.099.230 79.393.433.098 45,3
--Fixed Assets 138.658.291.741 58.591.187.634 42,3
--Tangible Fixed Assets 86.398.856.988 29.215.761.720 33,8
--Other Fixed Assets 52.259.434.753 29.375.425.914 56,2
--Cumulative Amortization 136.052.497.794 60.328.706.116 44,3
Wage Employees 528.544 242.684 45,9
Wages and Salaries Paid 22.847.403.504 11.710.257.437 51,3
Interest Paid 4.483.613.321 1.896.543.620 42,3
Profit as National Income 15.181.840.201 6.584.443.574 43,4
Net Value Added (at Factor Cost) 42.512.857.026 20.191.244.631 47,5
Amortization 11.421.863.028 5.108.560.815 44,7
Other Indirect Taxes 1.107.334.102 335.042.652 30,3
Gross Value Added (at Basic Prices) 55.042.054.156 25.634.848.098 46,6
VAT+SCT Paid 55.359.582.395 23.331.229.592 42,1
Subsidies 228.001.666 95.106.035 41,7
Gross Value Added (at Producers’ Prices) 110.173.634.885 48.870.971.655 44,4
•19•
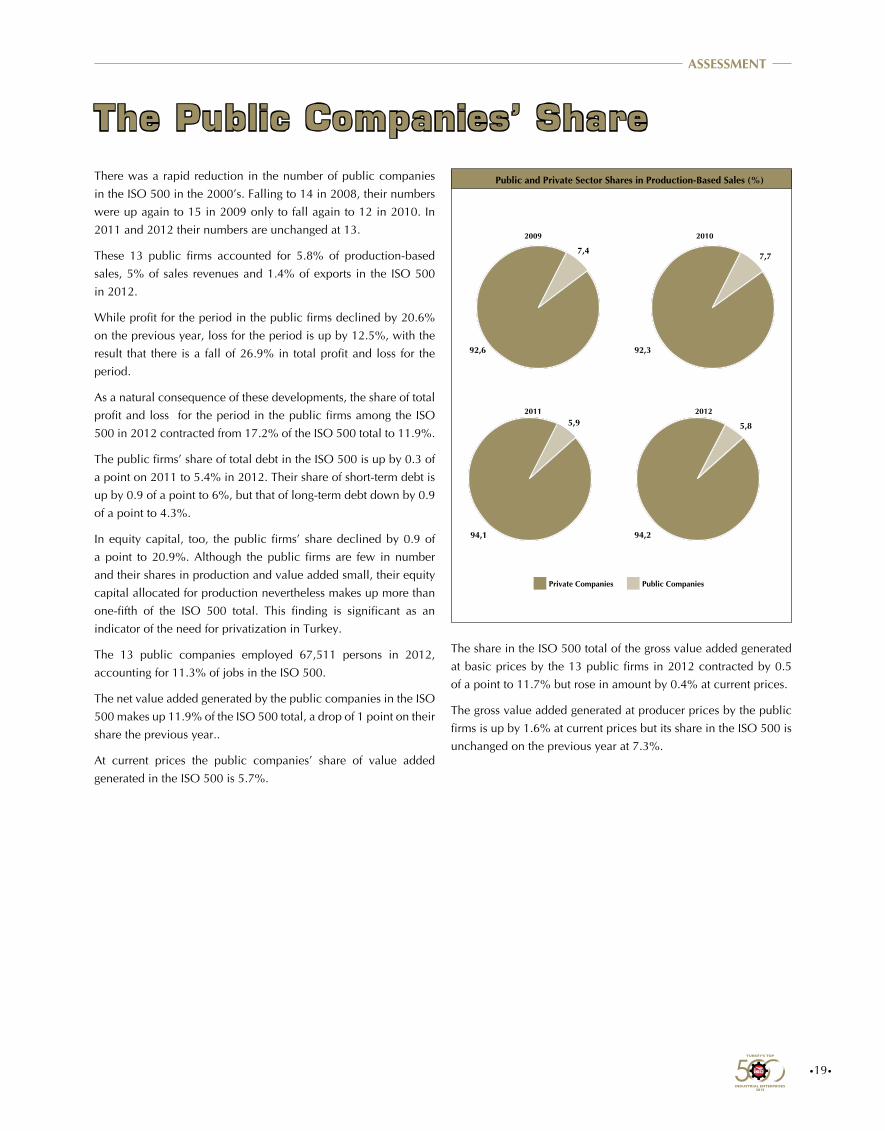
The Public Companies’ ShareThere was a rapid reduction in the number of public companies
in the ISO 500 in the 2000’s. Falling to 14 in 2008, their numbers
were up again to 15 in 2009 only to fall again to 12 in 2010. In
2011 and 2012 their numbers are unchanged at 13.
These 13 public firms accounted for 5.8% of production-based
sales, 5% of sales revenues and 1.4% of exports in the ISO 500
in 2012.
While profit for the period in the public firms declined by 20.6%
on the previous year, loss for the period is up by 12.5%, with the
result that there is a fall of 26.9% in total profit and loss for the
period.
As a natural consequence of these developments, the share of total
profit and loss for the period in the public firms among the ISO
500 in 2012 contracted from 17.2% of the ISO 500 total to 11.9%.
The public firms’ share of total debt in the ISO 500 is up by 0.3 of
a point on 2011 to 5.4% in 2012. Their share of short-term debt is
up by 0.9 of a point to 6%, but that of long-term debt down by 0.9
of a point to 4.3%.
In equity capital, too, the public firms’ share declined by 0.9 of
a point to 20.9%. Although the public firms are few in number
and their shares in production and value added small, their equity
capital allocated for production nevertheless makes up more than
one-fifth of the ISO 500 total. This finding is significant as an
indicator of the need for privatization in Turkey.
The 13 public companies employed 67,511 persons in 2012,
accounting for 11.3% of jobs in the ISO 500.
The net value added generated by the public companies in the ISO
500 makes up 11.9% of the ISO 500 total, a drop of 1 point on their
share the previous year..
At current prices the public companies’ share of value added
generated in the ISO 500 is 5.7%.
ASSESSMENT
Public and Private Sector Shares in Production-Based Sales (%)
Private Companies Public Companies
2009 2010
2011 2012
The share in the ISO 500 total of the gross value added generated
at basic prices by the 13 public firms in 2012 contracted by 0.5
of a point to 11.7% but rose in amount by 0.4% at current prices.
The gross value added generated at producer prices by the public
firms is up by 1.6% at current prices but its share in the ISO 500 is
unchanged on the previous year at 7.3%.
•20•
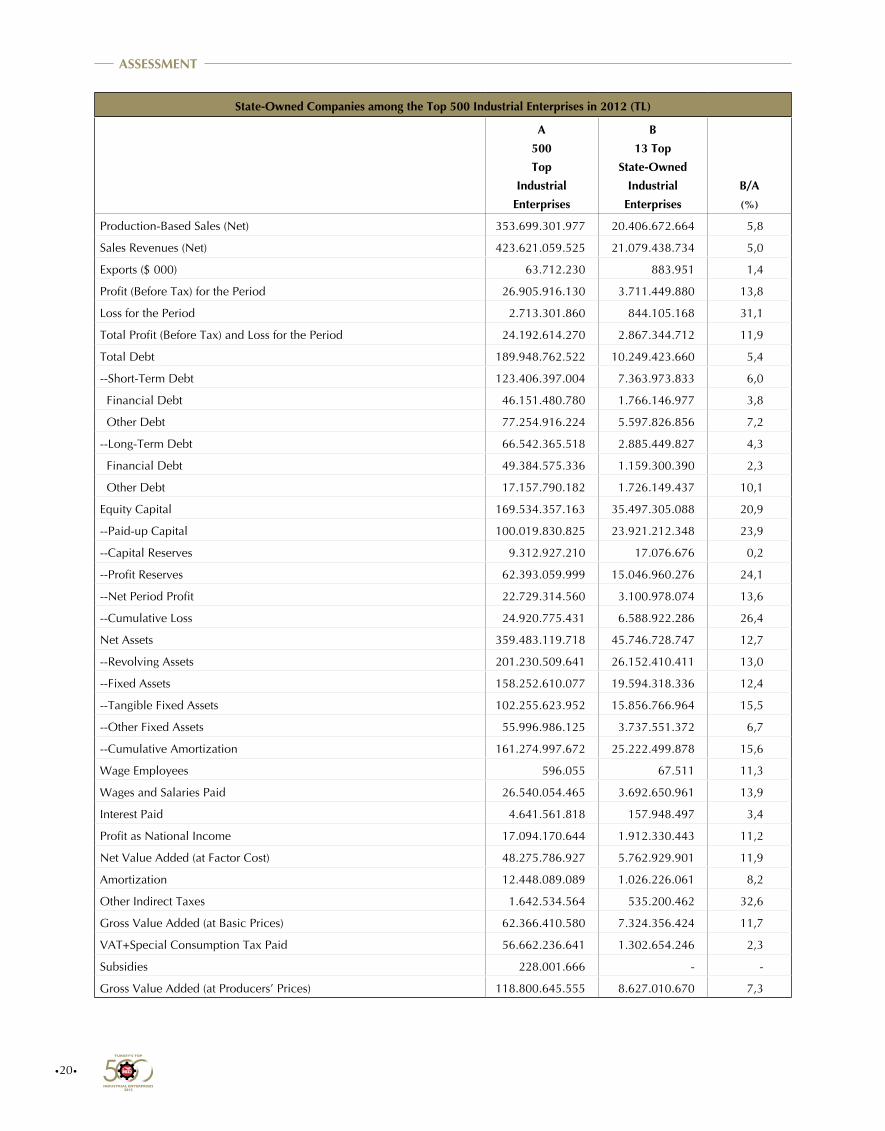
State-Owned Companies among the Top 500 Industrial Enterprises in 2012 (TL)
A
500
Top
Industrial
Enterprises
B
13 Top
State-Owned
Industrial
Enterprises
B/A
(%)
Production-Based Sales (Net) 353.699.301.977 20.406.672.664 5,8
Sales Revenues (Net) 423.621.059.525 21.079.438.734 5,0
Exports ($ 000) 63.712.230 883.951 1,4
Profit (Before Tax) for the Period 26.905.916.130 3.711.449.880 13,8
Loss for the Period 2.713.301.860 844.105.168 31,1
Total Profit (Before Tax) and Loss for the Period 24.192.614.270 2.867.344.712 11,9
Total Debt 189.948.762.522 10.249.423.660 5,4
--Short-Term Debt 123.406.397.004 7.363.973.833 6,0
Financial Debt 46.151.480.780 1.766.146.977 3,8
Other Debt 77.254.916.224 5.597.826.856 7,2
--Long-Term Debt 66.542.365.518 2.885.449.827 4,3
Financial Debt 49.384.575.336 1.159.300.390 2,3
Other Debt 17.157.790.182 1.726.149.437 10,1
Equity Capital 169.534.357.163 35.497.305.088 20,9
--Paid-up Capital 100.019.830.825 23.921.212.348 23,9
--Capital Reserves 9.312.927.210 17.076.676 0,2
--Profit Reserves 62.393.059.999 15.046.960.276 24,1
--Net Period Profit 22.729.314.560 3.100.978.074 13,6
--Cumulative Loss 24.920.775.431 6.588.922.286 26,4
Net Assets 359.483.119.718 45.746.728.747 12,7
--Revolving Assets 201.230.509.641 26.152.410.411 13,0
--Fixed Assets 158.252.610.077 19.594.318.336 12,4
--Tangible Fixed Assets 102.255.623.952 15.856.766.964 15,5
--Other Fixed Assets 55.996.986.125 3.737.551.372 6,7
--Cumulative Amortization 161.274.997.672 25.222.499.878 15,6
Wage Employees 596.055 67.511 11,3
Wages and Salaries Paid 26.540.054.465 3.692.650.961 13,9
Interest Paid 4.641.561.818 157.948.497 3,4
Profit as National Income 17.094.170.644 1.912.330.443 11,2
Net Value Added (at Factor Cost) 48.275.786.927 5.762.929.901 11,9
Amortization 12.448.089.089 1.026.226.061 8,2
Other Indirect Taxes 1.642.534.564 535.200.462 32,6
Gross Value Added (at Basic Prices) 62.366.410.580 7.324.356.424 11,7
VAT+Special Consumption Tax Paid 56.662.236.641 1.302.654.246 2,3
Subsidies 228.001.666 - -
Gross Value Added (at Producers’ Prices) 118.800.645.555 8.627.010.670 7,3
ASSESSMENT
•21•
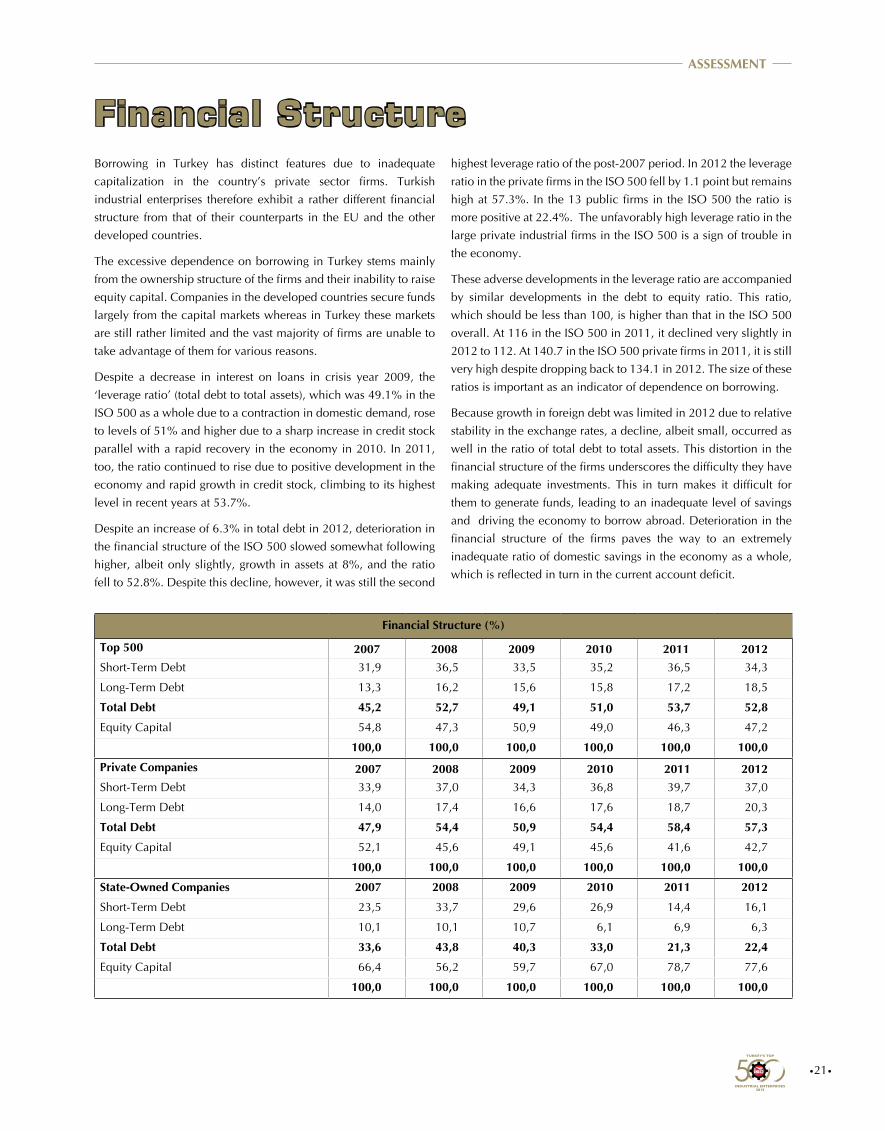
Financial Structure
Financial Structure (%)
Top 500 2007 2008 2009 2010 2011 2012Short-Term Debt 31,9 36,5 33,5 35,2 36,5 34,3
Long-Term Debt 13,3 16,2 15,6 15,8 17,2 18,5
Total Debt 45,2 52,7 49,1 51,0 53,7 52,8
Equity Capital 54,8 47,3 50,9 49,0 46,3 47,2
100,0 100,0 100,0 100,0 100,0 100,0
Private Companies 2007 2008 2009 2010 2011 2012Short-Term Debt 33,9 37,0 34,3 36,8 39,7 37,0
Long-Term Debt 14,0 17,4 16,6 17,6 18,7 20,3
Total Debt 47,9 54,4 50,9 54,4 58,4 57,3
Equity Capital 52,1 45,6 49,1 45,6 41,6 42,7
100,0 100,0 100,0 100,0 100,0 100,0
State-Owned Companies 2007 2008 2009 2010 2011 2012
Short-Term Debt 23,5 33,7 29,6 26,9 14,4 16,1
Long-Term Debt 10,1 10,1 10,7 6,1 6,9 6,3
Total Debt 33,6 43,8 40,3 33,0 21,3 22,4
Equity Capital 66,4 56,2 59,7 67,0 78,7 77,6
100,0 100,0 100,0 100,0 100,0 100,0
Borrowing in Turkey has distinct features due to inadequate
capitalization in the country’s private sector firms. Turkish
industrial enterprises therefore exhibit a rather different financial
structure from that of their counterparts in the EU and the other
developed countries.
The excessive dependence on borrowing in Turkey stems mainly
from the ownership structure of the firms and their inability to raise
equity capital. Companies in the developed countries secure funds
largely from the capital markets whereas in Turkey these markets
are still rather limited and the vast majority of firms are unable to
take advantage of them for various reasons.
Despite a decrease in interest on loans in crisis year 2009, the
‘leverage ratio’ (total debt to total assets), which was 49.1% in the
ISO 500 as a whole due to a contraction in domestic demand, rose
to levels of 51% and higher due to a sharp increase in credit stock
parallel with a rapid recovery in the economy in 2010. In 2011,
too, the ratio continued to rise due to positive development in the
economy and rapid growth in credit stock, climbing to its highest
level in recent years at 53.7%.
Despite an increase of 6.3% in total debt in 2012, deterioration in
the financial structure of the ISO 500 slowed somewhat following
higher, albeit only slightly, growth in assets at 8%, and the ratio
fell to 52.8%. Despite this decline, however, it was still the second
highest leverage ratio of the post-2007 period. In 2012 the leverage
ratio in the private firms in the ISO 500 fell by 1.1 point but remains
high at 57.3%. In the 13 public firms in the ISO 500 the ratio is
more positive at 22.4%. The unfavorably high leverage ratio in the
large private industrial firms in the ISO 500 is a sign of trouble in
the economy.
These adverse developments in the leverage ratio are accompanied
by similar developments in the debt to equity ratio. This ratio,
which should be less than 100, is higher than that in the ISO 500
overall. At 116 in the ISO 500 in 2011, it declined very slightly in
2012 to 112. At 140.7 in the ISO 500 private firms in 2011, it is still
very high despite dropping back to 134.1 in 2012. The size of these
ratios is important as an indicator of dependence on borrowing.
Because growth in foreign debt was limited in 2012 due to relative
stability in the exchange rates, a decline, albeit small, occurred as
well in the ratio of total debt to total assets. This distortion in the
financial structure of the firms underscores the difficulty they have
making adequate investments. This in turn makes it difficult for
them to generate funds, leading to an inadequate level of savings
and driving the economy to borrow abroad. Deterioration in the
financial structure of the firms paves the way to an extremely
inadequate ratio of domestic savings in the economy as a whole,
which is reflected in turn in the current account deficit.
ASSESSMENT
•22•
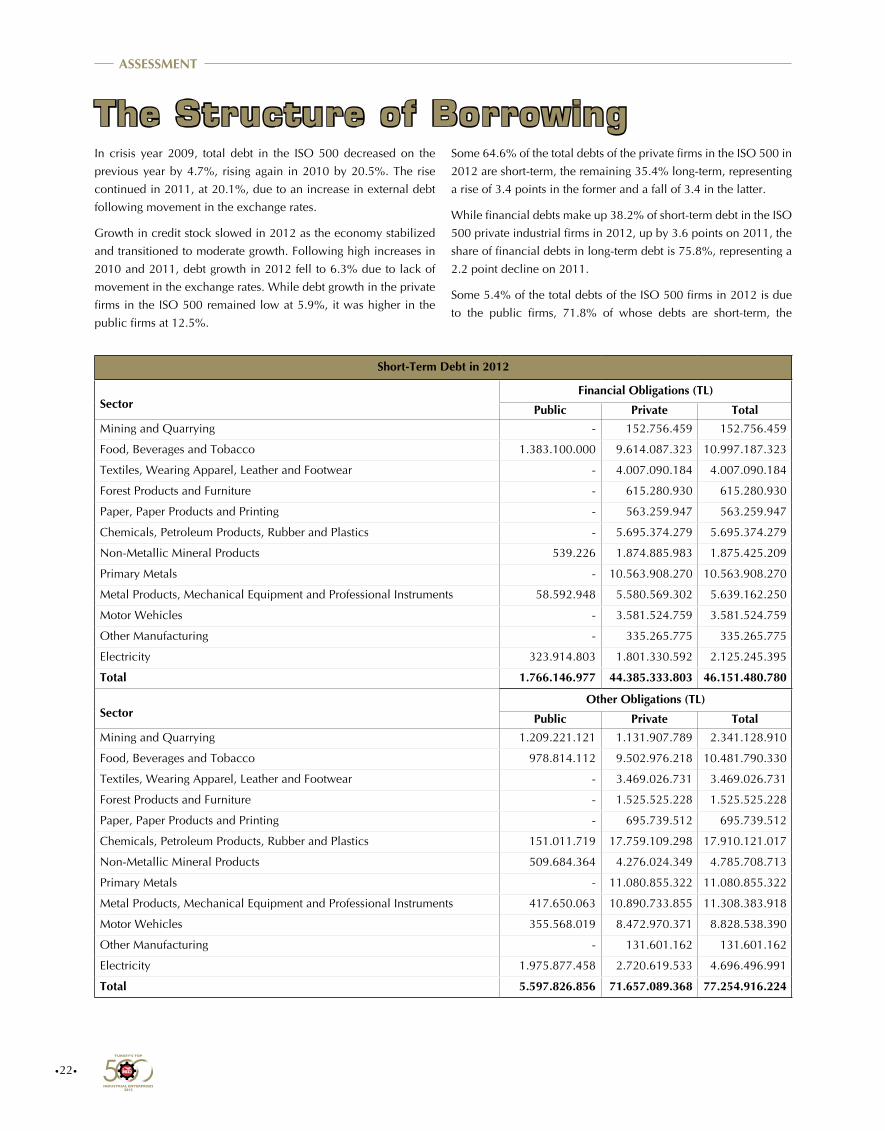
The Structure of Borrowing
Short-Term Debt in 2012
Sector
Financial Obligations (TL)
Public Private Total
Mining and Quarrying - 152.756.459 152.756.459
Food, Beverages and Tobacco 1.383.100.000 9.614.087.323 10.997.187.323
Textiles, Wearing Apparel, Leather and Footwear - 4.007.090.184 4.007.090.184
Forest Products and Furniture - 615.280.930 615.280.930
Paper, Paper Products and Printing - 563.259.947 563.259.947
Chemicals, Petroleum Products, Rubber and Plastics - 5.695.374.279 5.695.374.279
Non-Metallic Mineral Products 539.226 1.874.885.983 1.875.425.209
Primary Metals - 10.563.908.270 10.563.908.270
Metal Products, Mechanical Equipment and Professional Instruments 58.592.948 5.580.569.302 5.639.162.250
Motor Wehicles - 3.581.524.759 3.581.524.759
Other Manufacturing - 335.265.775 335.265.775
Electricity 323.914.803 1.801.330.592 2.125.245.395
Total 1.766.146.977 44.385.333.803 46.151.480.780
Sector
Other Obligations (TL)
Public Private Total
Mining and Quarrying 1.209.221.121 1.131.907.789 2.341.128.910
Food, Beverages and Tobacco 978.814.112 9.502.976.218 10.481.790.330
Textiles, Wearing Apparel, Leather and Footwear - 3.469.026.731 3.469.026.731
Forest Products and Furniture - 1.525.525.228 1.525.525.228
Paper, Paper Products and Printing - 695.739.512 695.739.512
Chemicals, Petroleum Products, Rubber and Plastics 151.011.719 17.759.109.298 17.910.121.017
Non-Metallic Mineral Products 509.684.364 4.276.024.349 4.785.708.713
Primary Metals - 11.080.855.322 11.080.855.322
Metal Products, Mechanical Equipment and Professional Instruments 417.650.063 10.890.733.855 11.308.383.918
Motor Wehicles 355.568.019 8.472.970.371 8.828.538.390
Other Manufacturing - 131.601.162 131.601.162
Electricity 1.975.877.458 2.720.619.533 4.696.496.991
Total 5.597.826.856 71.657.089.368 77.254.916.224
In crisis year 2009, total debt in the ISO 500 decreased on the
previous year by 4.7%, rising again in 2010 by 20.5%. The rise
continued in 2011, at 20.1%, due to an increase in external debt
following movement in the exchange rates.
Growth in credit stock slowed in 2012 as the economy stabilized
and transitioned to moderate growth. Following high increases in
2010 and 2011, debt growth in 2012 fell to 6.3% due to lack of
movement in the exchange rates. While debt growth in the private
firms in the ISO 500 remained low at 5.9%, it was higher in the
public firms at 12.5%.
Some 64.6% of the total debts of the private firms in the ISO 500 in
2012 are short-term, the remaining 35.4% long-term, representing
a rise of 3.4 points in the former and a fall of 3.4 in the latter.
While financial debts make up 38.2% of short-term debt in the ISO
500 private industrial firms in 2012, up by 3.6 points on 2011, the
share of financial debts in long-term debt is 75.8%, representing a
2.2 point decline on 2011.
Some 5.4% of the total debts of the ISO 500 firms in 2012 is due
to the public firms, 71.8% of whose debts are short-term, the
ASSESSMENT
•23•
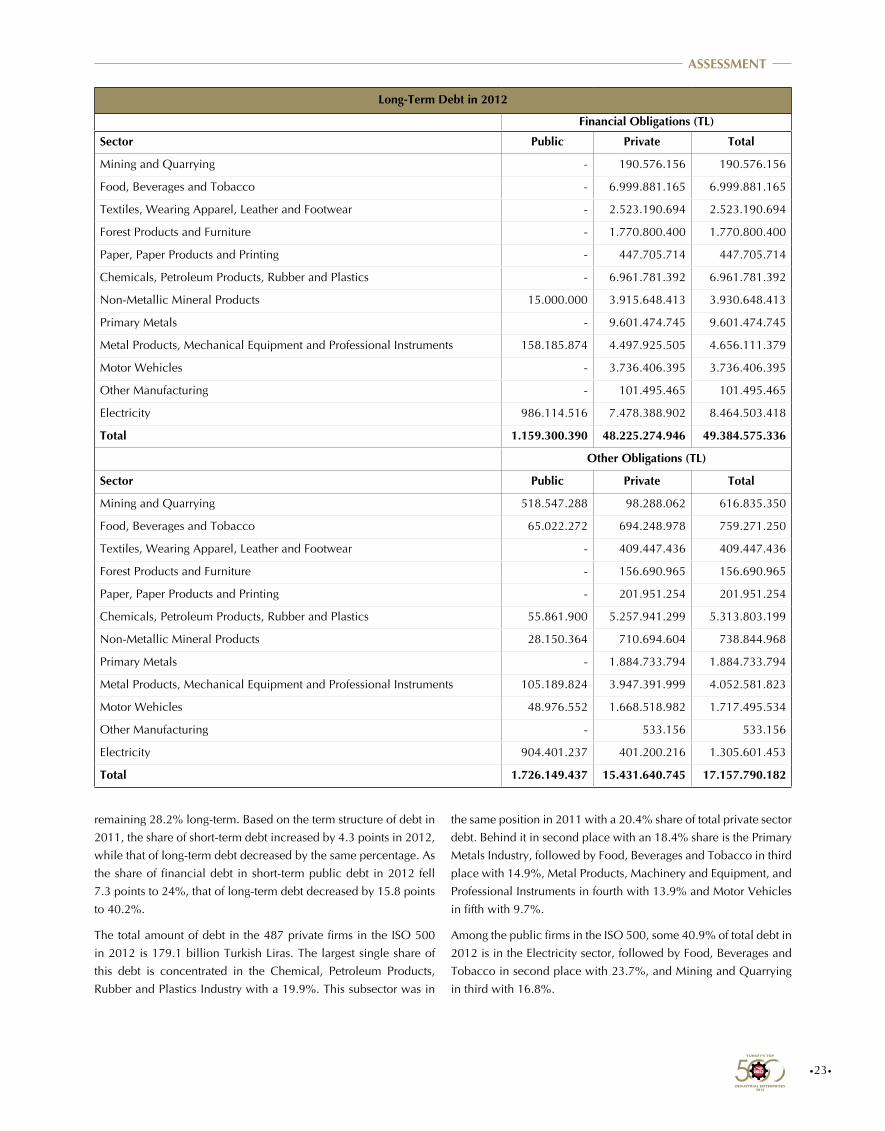
Long-Term Debt in 2012
Financial Obligations (TL)
Sector Public Private Total
Mining and Quarrying - 190.576.156 190.576.156
Food, Beverages and Tobacco - 6.999.881.165 6.999.881.165
Textiles, Wearing Apparel, Leather and Footwear - 2.523.190.694 2.523.190.694
Forest Products and Furniture - 1.770.800.400 1.770.800.400
Paper, Paper Products and Printing - 447.705.714 447.705.714
Chemicals, Petroleum Products, Rubber and Plastics - 6.961.781.392 6.961.781.392
Non-Metallic Mineral Products 15.000.000 3.915.648.413 3.930.648.413
Primary Metals - 9.601.474.745 9.601.474.745
Metal Products, Mechanical Equipment and Professional Instruments 158.185.874 4.497.925.505 4.656.111.379
Motor Wehicles - 3.736.406.395 3.736.406.395
Other Manufacturing - 101.495.465 101.495.465
Electricity 986.114.516 7.478.388.902 8.464.503.418
Total 1.159.300.390 48.225.274.946 49.384.575.336
Other Obligations (TL)
Sector Public Private Total
Mining and Quarrying 518.547.288 98.288.062 616.835.350
Food, Beverages and Tobacco 65.022.272 694.248.978 759.271.250
Textiles, Wearing Apparel, Leather and Footwear - 409.447.436 409.447.436
Forest Products and Furniture - 156.690.965 156.690.965
Paper, Paper Products and Printing - 201.951.254 201.951.254
Chemicals, Petroleum Products, Rubber and Plastics 55.861.900 5.257.941.299 5.313.803.199
Non-Metallic Mineral Products 28.150.364 710.694.604 738.844.968
Primary Metals - 1.884.733.794 1.884.733.794
Metal Products, Mechanical Equipment and Professional Instruments 105.189.824 3.947.391.999 4.052.581.823
Motor Wehicles 48.976.552 1.668.518.982 1.717.495.534
Other Manufacturing - 533.156 533.156
Electricity 904.401.237 401.200.216 1.305.601.453
Total 1.726.149.437 15.431.640.745 17.157.790.182
remaining 28.2% long-term. Based on the term structure of debt in
2011, the share of short-term debt increased by 4.3 points in 2012,
while that of long-term debt decreased by the same percentage. As
the share of financial debt in short-term public debt in 2012 fell
7.3 points to 24%, that of long-term debt decreased by 15.8 points
to 40.2%.
The total amount of debt in the 487 private firms in the ISO 500
in 2012 is 179.1 billion Turkish Liras. The largest single share of
this debt is concentrated in the Chemical, Petroleum Products,
Rubber and Plastics Industry with a 19.9%. This subsector was in
the same position in 2011 with a 20.4% share of total private sector
debt. Behind it in second place with an 18.4% share is the Primary
Metals Industry, followed by Food, Beverages and Tobacco in third
place with 14.9%, Metal Products, Machinery and Equipment, and
Professional Instruments in fourth with 13.9% and Motor Vehicles
in fifth with 9.7%.
Among the public firms in the ISO 500, some 40.9% of total debt in
2012 is in the Electricity sector, followed by Food, Beverages and
Tobacco in second place with 23.7%, and Mining and Quarrying
in third with 16.8%.
ASSESSMENT
•24•
The Financial Ratios
Current Ratio (Revolving Assets / Short-Term Debt)
The current ratio shows firms’ ability to repay debt with funds
generated by converting assets into money. When the difference
between current assets and short-term debt is positive, in other
words when firms have net operating capital, this is a sign of
positive development in their liquidity position.
The current ratio in the ISO 500, which was 163.4% in pre-crisis
year 2007, dipped to its lowest level ever in 2008 at 148.6%, rising
again to 160.8% in crisis year 2009. It was almost unchanged
in 2010 at 160.9% but fell again in 2011 to 158.4% due to a
deterioration in financial structure. In 2012 it developed positively
once again, climbing to 163.1%.
In the private firms in the ISO 500 the current ratio is up from
146.9% to 150.9% in 2012, but down from 373.8% to 355.1% in
the public firms and from 147.9% to 146.3% in the ISO members.
As a result, despite a slowdown in the economy, the current ratio,
which shows debt repayment ability in the ISO 500, has improved
in 2012 on the previous year.
Total Debts / Total Assets
At 52.6% in the ISO 500 in 2008, the debt to assets ratio fell to
49.1% in 2009, rising again in 2010 and 2011 to 51% and 53.7%
respectively. The rise in 2011 to 53.7% in this ratio, which has a
tendency to increase in crisis years, is therefore noteworthy. In a
slight improvement, the ratio dropped back to 52.8% in 2012.
At 54.4% in the large private companies in the ISO 500 in 2010,
this ratio rose to 58.5% in 2011, falling again to 57.3% in 2012. In
the ISO-member private firms the improvement was much better
as the ratio retreated by 2.1 points from 57.5% in 2011 to 55.4%
in 2012.
Total Debt / Capital Equity
Known as the borrowing ratio, the ratio of total debt to total equity
is an important indicator of improvement in financial structure.
Soaring to 111.2% in crisis year 2008, it fell to 96.5% in 2009
due to a reduction in the demand for credit under the increasingly
severe impact of the crisis. As the economy showed a relative
improvement in 2010 and 2011, it rose again, first to 104.3%, then
to 116%. In 2012 it dropped by 4 points to 112%. At 134.1% in
the ISO 500 private firms in 2012, the total debt to total equity ratio
was lower among the ISO-member private firms at 124.1%.
Inadequate equity capital is a structural problem in Turkey’s
industrial enterprises. This problem stems largely from the
ownership structure of the firms and the nature of the capital
markets in Turkey. Although the debt to equity ratio is quite high
in Turkey’s real sector, in the U.S. and the EU countries the ratios
are much lower.
Short-Term Debt / Total Assets
The ratio of short-term debt to total assets, which peaked in 2008
at 36.5%, fell to 33.5% in 2009 due to a relative reduction in debt
and a relative increase in equity capital. When growth in total debt
and short-term debt outstripped growth in equity capital in 2010
and 2011, the short-term debt to total assets ratio again started to
climb, first to 35.2%, then to 36.5%. In 2012 it has fallen again to
34.3% parallel with lower growth in borrowing.
As this ratio dropped from 39.7% in 2011 to 37% in 2012 in the
ISO private firms, in the ISO-member firms the decline was from
41.3% to 39.7%.
Tangible Fixed Assets / Equity Capital
It is a fundamental principle that firms use their equity capital to
fund their tangible fixed assets. A ratio of 100 or lower and falling
therefore indicates an adequate level of equity in a firm.
Developing favorably in the ISO 500 in 2009 at 61.3%, this ratio
fell to 59.2% in 2010 but returned again to its previous level of
61.2% in 2011. In 2012 it declined by 0.9 of a point to 60.3%,
indicating an improvement, albeit small.
At 64.5% in the ISO 500 private firms in 2012, it fell from 49.7%
to 47% in the ISO-member firms in the survey.
Equity Capital / Total Assets
The equity to assets ratio, which was 50.9% in 2009, fell to 46.3%
in both 2010 and 2011, but rose slightly in 2012 to 47.2%. Up
from 41.5% to 42.7% in the ISO 500 private firms, it rose from
42.5% to 44.6% in the ISO-member industrial enterprises. These
developments are positive, albeit only slightly.
Short-Term Debt / Total Debt
In the term structure of financing, it is desirable that the share of
short-term debt be smaller than that of long-term debt among a
firm’s total financial obligations. This does not however seem to be
the case in the ISO 500.
ASSESSMENT
•25•
The ratio of short-term debt to total debt, which was high at 68.2% in
the ISO 500 overall in 2009, increased slightly in 2010 to 69%. Starting
to fall in 2011, it declined to 65% in 2012. Although this falling trend
is a positive development, the fact that short-term debt still constitutes
such a large share of total debt is not a desirable situation.
As this ratio fell by 3.4 points to 64.6% in the ISO 500 private firms
in 2012, it is down by only 0.3% to 71.6% in the ISO-member
industrial enterprises in the survey.
Sectoral Financial Ratios
The highest current ratio in the ISO 500 in 2012 was in Wood,
Furniture and Fixtures at 568%. Professional, Scientific and
Medical Instruments and Supplies came in second with 348.9%,
while Pottery, China and Earthenware had the lowest, and most
favorable, current ratio at 94.6%.
The lowest ratio of total debts to total assets was in the Wood,
Furniture and Fixtures at 21.7% followed by Glass and Glass
Products in second place with 30.9% and Printing and Publishing in
third with 33%. The highest, and most unfavorable, ratio of total debt
to total assets was in Non-metallic Mineral Products with 79.4%.
The Wood, Furniture and Fixtures Industry again stands out as the
subsector with the lowest ratio of total debt to equity capital at 27.8%.
It is followed by Glass and Glass Products with a ratio of 44.7% and
Printing and Publishing with 49.1%. Pottery, China and Earthenware
has the highest, and least favorable, such ratio at 386.4%.
The lowest ratios of short-term debt to total assets are in the Wood,
Furniture and Fixtures at 10%, Beverages at 12.1% and Printing
and Publishing at 18%. The highest such ratio is in the Tobacco
industry at 57.1%.
The subsectors with the lowest (most favorable) ratios of tangible
fixed assets to equity capital, in other words, Return On Equity,
are Professional, Scientific and Medical Instruments and Supplies
(10.3%), Beverages (14.7%) and and Wood, Furniture and Fixtures
(24.1%). The single most unfavorable ratio is in Pottery, China and
Earthenware at 149.6%.
The subsectors with the best ratios of equity capital to total assets in
the ISO 500 in 2012 are Wood, Furniture and Fixtures with 78.3%,
Glass and Glass Products with 69.1% and Printing and Publishing
with 67%. The lowest and least favorable ratio is in Pottery, China
and Earthenware with 20.6%.
The smallest (most positive) ratios of short-term debt to total debt
are in Beverages with 34.1%, Professional, Scientific and Medical
Instruments and Supplies with 41.5% and Wood, Furniture and
Fixtures with 45.9%. The highest (least positive) such ratio is in
Footwear at 100%.
Based on various financial ratios, the subsectors Wood, Furniture
and Fixtures, Glass and Glass Products, and Professional, Scientific
and Medical Instruments and Supplies stand out as being in the
best position in 2012.
ASSESSMENT
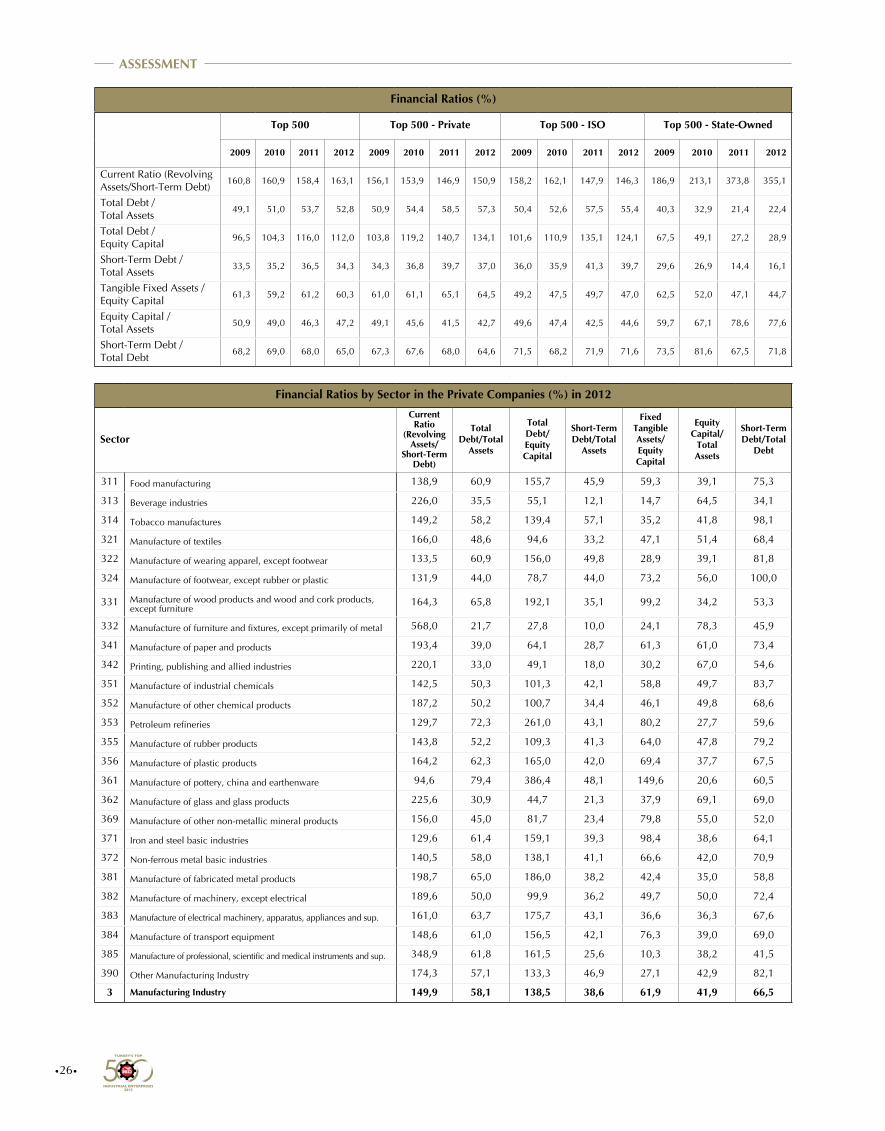
•26•
Financial Ratios (%)
Top 500 Top 500 - Private Top 500 - ISO Top 500 - State-Owned
2009 2010 2011 2012 2009 2010 2011 2012 2009 2010 2011 2012 2009 2010 2011 2012
Current Ratio (Revolving Assets/Short-Term Debt)
160,8 160,9 158,4 163,1 156,1 153,9 146,9 150,9 158,2 162,1 147,9 146,3 186,9 213,1 373,8 355,1
Total Debt /Total Assets
49,1 51,0 53,7 52,8 50,9 54,4 58,5 57,3 50,4 52,6 57,5 55,4 40,3 32,9 21,4 22,4
Total Debt /Equity Capital
96,5 104,3 116,0 112,0 103,8 119,2 140,7 134,1 101,6 110,9 135,1 124,1 67,5 49,1 27,2 28,9
Short-Term Debt /Total Assets
33,5 35,2 36,5 34,3 34,3 36,8 39,7 37,0 36,0 35,9 41,3 39,7 29,6 26,9 14,4 16,1
Tangible Fixed Assets /Equity Capital
61,3 59,2 61,2 60,3 61,0 61,1 65,1 64,5 49,2 47,5 49,7 47,0 62,5 52,0 47,1 44,7
Equity Capital /Total Assets
50,9 49,0 46,3 47,2 49,1 45,6 41,5 42,7 49,6 47,4 42,5 44,6 59,7 67,1 78,6 77,6
Short-Term Debt /Total Debt
68,2 69,0 68,0 65,0 67,3 67,6 68,0 64,6 71,5 68,2 71,9 71,6 73,5 81,6 67,5 71,8
Financial Ratios by Sector in the Private Companies (%) in 2012
Sector
Current Ratio
(Revolving Assets/
Short-Term Debt)
Total Debt/Total
Assets
TotalDebt/Equity Capital
Short-Term Debt/Total
Assets
Fixed Tangible Assets/Equity Capital
Equity Capital/
Total Assets
Short-Term Debt/Total
Debt
311 Food manufacturing 138,9 60,9 155,7 45,9 59,3 39,1 75,3
313 Beverage industries 226,0 35,5 55,1 12,1 14,7 64,5 34,1
314 Tobacco manufactures 149,2 58,2 139,4 57,1 35,2 41,8 98,1
321 Manufacture of textiles 166,0 48,6 94,6 33,2 47,1 51,4 68,4
322 Manufacture of wearing apparel, except footwear 133,5 60,9 156,0 49,8 28,9 39,1 81,8
324 Manufacture of footwear, except rubber or plastic 131,9 44,0 78,7 44,0 73,2 56,0 100,0
331 Manufacture of wood products and wood and cork products, except furniture
164,3 65,8 192,1 35,1 99,2 34,2 53,3
332 Manufacture of furniture and fixtures, except primarily of metal 568,0 21,7 27,8 10,0 24,1 78,3 45,9
341 Manufacture of paper and products 193,4 39,0 64,1 28,7 61,3 61,0 73,4
342 Printing, publishing and allied industries 220,1 33,0 49,1 18,0 30,2 67,0 54,6
351 Manufacture of industrial chemicals 142,5 50,3 101,3 42,1 58,8 49,7 83,7
352 Manufacture of other chemical products 187,2 50,2 100,7 34,4 46,1 49,8 68,6
353 Petroleum refineries 129,7 72,3 261,0 43,1 80,2 27,7 59,6
355 Manufacture of rubber products 143,8 52,2 109,3 41,3 64,0 47,8 79,2
356 Manufacture of plastic products 164,2 62,3 165,0 42,0 69,4 37,7 67,5
361 Manufacture of pottery, china and earthenware 94,6 79,4 386,4 48,1 149,6 20,6 60,5
362 Manufacture of glass and glass products 225,6 30,9 44,7 21,3 37,9 69,1 69,0
369 Manufacture of other non-metallic mineral products 156,0 45,0 81,7 23,4 79,8 55,0 52,0
371 Iron and steel basic industries 129,6 61,4 159,1 39,3 98,4 38,6 64,1
372 Non-ferrous metal basic industries 140,5 58,0 138,1 41,1 66,6 42,0 70,9
381 Manufacture of fabricated metal products 198,7 65,0 186,0 38,2 42,4 35,0 58,8
382 Manufacture of machinery, except electrical 189,6 50,0 99,9 36,2 49,7 50,0 72,4
383 Manufacture of electrical machinery, apparatus, appliances and sup. 161,0 63,7 175,7 43,1 36,6 36,3 67,6
384 Manufacture of transport equipment 148,6 61,0 156,5 42,1 76,3 39,0 69,0
385 Manufacture of professional, scientific and medical instruments and sup. 348,9 61,8 161,5 25,6 10,3 38,2 41,5
390 Other Manufacturing Industry 174,3 57,1 133,3 46,9 27,1 42,9 82,1
3 Manufacturing Industry 149,9 58,1 138,5 38,6 61,9 41,9 66,5
ASSESSMENT

•27•
The Profitability Ratios (Returns)
Return on Sales (Total Profit (Before Tax) and Loss for the Period / Sales Revenues) (%)
2004 (*) 2005 2006 2007 2008 2009 2010 2011 2012
Top 500 6,7 4,6 5,9 7,2 3,9 5,8 7,6 5,6 5,7
Private Companies 6,1 4,7 5,9 7,2 3,6 5,2 5,9 4,8 5,3
State-Owned Companies 10,6 4,3 4,7 6,9 8,2 14,7 32,5 19,1 13,6
(*) Based on inflation-adjusted figures.
Among the 437 profitable firms in the ISO 500 in 2012, 430 are
private companies and 7 public companies. Unprofitable firms
in the same year numbered 63, 57 of them private, the other 6
public firms. Profitable firms in 2011 numbered 380 (372 private
and 8 public), unprofitable firms 120 (115 private and 5 public).
As the figures show, despite a slowdown in economic activity in
2012, the number of profitable firms is up and there is a significant
reduction in the number of unprofitable firms.
Due to a sharp reduction in the weight of the public enterprises in
the ISO 500 as the private companies increasing came to represent
the economy, the assessments based on profitability ratios and
turnover rates have been made with the private firms in mind.
Return on Sales (ROS)
The downward trend observed in return on sales in the ISO 500
in the 1990’s reached its lowest level in 2001. In line with more
positive developments in the economy after that year, return on
sales exhibited a rising trend without ever regaining is pre-1900’s
level. At 7.2% in the private firms in 2007, return on sales declined
to 3.6% in 2008 under the impact of the global crisis. Rising to
5.2% in the private firms in 2009, it climbed to 5.9% in 2010.
Due to a slowdown in the last quarter of 2011 especially, when
movement in the exchange rates restricted growth in total profit
and loss for the period, return on sales in the private firms dropped
to 4.8%. Although growth in production-based sales was lower in
2012 than in 2011, following a relative appreciation in the Turkish
Lira at year’s end and a fall in financing costs compared with
2011, return on sales in the private firms rose again to 5.3% due
to a 13.3% rise in total profit and loss for the period and a 3.4%
increase in sales revenues.
A look at rates of return by subsector in the private firms in 2012
shows the Tobacco Processing industry in first place with 31.1%.
This subsector was also first in 2011 with 28.2%. It is followed by
the Printing and Publishing industry in second place with 19.8%
and the Beverages industry in third with 15.8%. The lowest rate of
return on sales is in Other Manufacturing with 0.9%.
Return on Assets (ROA)
As with return on sales, there is a relative increase in return on
assets in the private firms in 2012, which came to 6.8%, somewhat
higher than its 6.5% in 2011. Despite this relative increase,
however, return on assets remains significantly low.
A look at return on assets by subsector in 2012 reveals Tobacco
Processing again in first place with 24.4%. It is followed by Wood,
Furniture and Fixtures in second place with 16.4%, and Machinery
(except Electrical) in third with 14.2%. The lowest rate of return on
assets is in the Iron and Steel industry with 1.3%.
Return on Equity (ROE)
Return on equity in the private firms in 2012 was 15.9%. At 15.6%
in 2011, it remains well below its 2002 level of 23.3% despite a
slight increase in 2012,.
A look at rates of return by subsector in the private firms in 2012
shows that Tobacco Processing is once again in top place with
58.4%.
This sector is followed by Manufacture of Machinery (except
Electrical) in second with 28.4% and Manufacture of Metal
Products in third with 27.7%. The lowest rate of return on equity is
in Iron and Steel with 3.3%.
Economic Profit
Economic Profit is the ratio of the value added firms generate to
their total assets. This ratio shows how much net value a firm has
added to the economy in return for its equity and external loans.
Economic profit is also known as asset productivity.
ASSESSMENT

•28•
Return on Assets (Total Profit (Before Tax) and Loss for the Period / Total Assets) (%)
2004 (*) 2005 2006 2007 2008 2009 2010 2011 2012
Top 500 7,8 5,4 7,3 8,7 4,7 6,0 8,3 6,8 6,7
Private Companies 8,0 6,3 8,4 10,1 5,0 6,1 7,1 6,5 6,8
State-Owned Companies 7,1 1,7 2,1 2,7 3,2 5,6 14,6 9,2 6,3
Return on Equity (Total Profit (Before Tax) and Loss for the Period / Equity Capital) (%)
2004 (*) 2005 2006 2007 2008 2009 2010 2011 2012
Top 500 14,3 10,3 13,8 15,9 9,9 11,8 16,9 14,8 14,3
Private Companies 15,2 12,2 16,6 19,4 10,9 12,4 15,5 15,6 15,9
State-Owned Companies 11,6 2,8 3,2 4,0 5,6 9,3 21,8 11,7 8,1
(*) Based on inflation-adjusted figures.
(*) Based on inflation-adjusted figures.
Economic profit was higher in the early 1990’s, showing that net
value added was being generated at a higher rate in return for
money put into the business. At 30% and higher in the private firms
in the decade of the 1990’s, economic profit plunged to its lowest
level in 2001 at 10.7%.
Despite a relative improvement in economic profit following the
2001 crisis, it never again attained its levels of the 1990’s. Rising as
high as 17.3% in the private firms in 2007, it began falling again in
subsequent years to 13.9% in 2008 and 13.6% in 2009.
Up again to levels of 14.1% and 14.2% in the more favorable years
of 2011 and 2012, this ratio slowed slightly to 13.6% in 2012, the
same as in 2009 and its lowest level since 2001.
The manufacturing industry’s share in GDP, which in 1998 was
23.9% at current prices, has declined by 34.7% in the intervening
14 years to 15.6% in 2012. The erosion in economic profit
observed in the ISO 500 private firms is thought to have played a
key role in the decline.
A look at economic profit by subsector in the private firms in 2012
shows that Tobacco Processing has the highest rate with 32%. This
sector was also in first place in 2011 with 32.1%. It is followed
in 2012 by Rubber Products in second place with 31.3%, and
Wood, Furniture and Fixtures in third with 26.1%. Economic profit
is lowest is in the Iron and Steel industry at 4.7%.
The Asset Turnover Ratio
Used as a measure of financial efficiency and productivity of the
business, the asset turnover ratio is derived by taking the ratio of
sales revenues to total assets. Weak competitiveness is the most
pressing problem in Turkey’s real sector.
Economic Profit in the Private Companies (%)
Economic Profit in the State-Owned Companies (%)
(*) Based on inflation-adjusted figures.
(*) Based on inflation-adjusted figures.
ASSESSMENT
2001 2002 2003 2003(*) 2004(*) 2005 2006 2007 2008 2009 2010 2011 2012
20,0
15,0
10,0
5,0
0,0
13,7
2,4
15,4
14,213,6
11,9
9,18,8
6,9
12,0
19,1
14,3
12,6
20,0
15,0
10,0
5,0
0,0
10,7
13,9
15,816,8
15,0
16,9
14,7
17,3
13,913,6
13,6
14,1 14,2
2001 2002 2003 2003(*) 2004(*) 2005 2006 2007 2008 2009 2010 2011 2012

•29•
Economic Profit (Net Value Added/Total Assets) (%)
2004 (*) 2005 2006 2007 2008 2009 2010 2011 2012
Top 500 16,1 14,4 15,6 15,7 12,7 13,3 14,9 14,2 13,4
Private Companies 16,8 15,0 16,9 17,3 13,9 13,6 14,1 14,2 13,6
State-Owned Companies 13,6 11,9 9,1 8,8 6,9 12,0 19,1 14,3 12,6
*Based on inflation-adjusted figures.
Returns by Sector in 2012 (%)
Sector
Top 500 Private Companies State-Owned CompaniesReturn
on Sales
Return on
Assets
Return on
Equity
Return on
Sales
Return on
Assets
Return on
Equity
Return on
Sales
Return on
Assets
Return on
Equity
311 Food manufacturing 3,0 4,2 10,0 3,8 5,7 14,5 -6,4 -5,2 -9,2
313 Beverage industries 15,8 5,3 8,2 15,8 5,3 8,2 - - -
314 Tobacco manufactures 31,1 24,4 58,4 31,1 24,4 58,4 - - -
321 Manufacture of textiles 5,2 4,0 7,8 5,2 4,0 7,8 - - -
322 Manufacture of wearing apparel, except footwear 3,3 3,4 8,8 3,3 3,4 8,8 - - -
324 Manufacture of footwear, except rubber or plastic 5,6 5,3 9,4 5,6 5,3 9,4 - - -
331 Manufacture of wood products and wood and cork products, except furniture
11,0 8,0 23,4 11,0 8,0 23,4 - - -
332 Manufacture of furniture and fixtures, except primarily of metal
14,0 16,4 20,9 14,0 16,4 20,9 - - -
341 Manufacture of paper and products 8,0 9,3 15,3 8,0 9,3 15,3 - - -
342 Printing, publishing and allied industries 19,8 12,1 18,1 19,8 12,1 18,1 - - -
351 Manufacture of industrial chemicals 13,5 16,7 29,0 8,1 11,0 22,1 52,4 40,1 44,9
352 Manufacture of other chemical products 7,8 8,9 17,9 7,8 8,9 17,9 - - -
353 Petroleum refineries 1,9 5,7 20,4 1,9 5,7 20,4 - - -
355 Manufacture of rubber products 7,0 10,3 21,5 7,0 10,3 21,5 - - -
356 Manufacture of plastic products 5,1 5,3 14,0 5,1 5,3 14,0 - - -
361 Manufacture of pottery, china and earthenware 3,4 1,9 9,5 3,4 1,9 9,5 - - -
362 Manufacture of glass and glass products 12,3 9,6 13,9 12,3 9,6 13,9 - - -
369 Manufacture of other non-metallic mineral products 13,0 8,7 16,4 13,5 9,1 16,5 0,9 0,4 3,6
371 Iron and steel basic industries 1,0 1,3 3,3 1,0 1,3 3,3 - - -
372 Non-ferrous metal basic industries 4,4 6,9 16,5 4,4 6,9 16,5 - - -
381 Manufacture of fabricated metal products 10,2 9,5 24,8 9,4 9,7 27,7 17,0 8,9 16,9
382 Manufacture of machinery, except electrical 12,9 14,2 28,4 12,9 14,2 28,4 - - -
383 Manufacture of electrical machinery, apparatus, appliances and sup.
4,4 5,1 14,2 4,4 5,1 14,2 - - -
384 Manufacture of transport equipment 4,8 8,2 21,0 4,9 8,4 21,6 -6,4 -4,4 -13,0
385 Manufacture of professional, scientific and medical instruments and sup.
12,4 6,9 18,1 12,4 6,9 18,1 - - -
390 Other Manufacturing Industry 0,9 2,1 4,9 0,9 2,1 4,9 - - -
3 Manufacturing Industry 4,7 6,3 14,8 4,6 6,3 15,1 8,1 5,9 10,2
One of the main reasons for weak competitiveness stems from
the fact that input/output ratios are higher in Turkey than in
the countries with whom we compete. This problem could be
alleviated if enterprises were able turn over the money they have
bound up in their business more rapidly. The results of the ISO 500
however show that, like their rates of return, the enterprises’ asset
ASSESSMENT
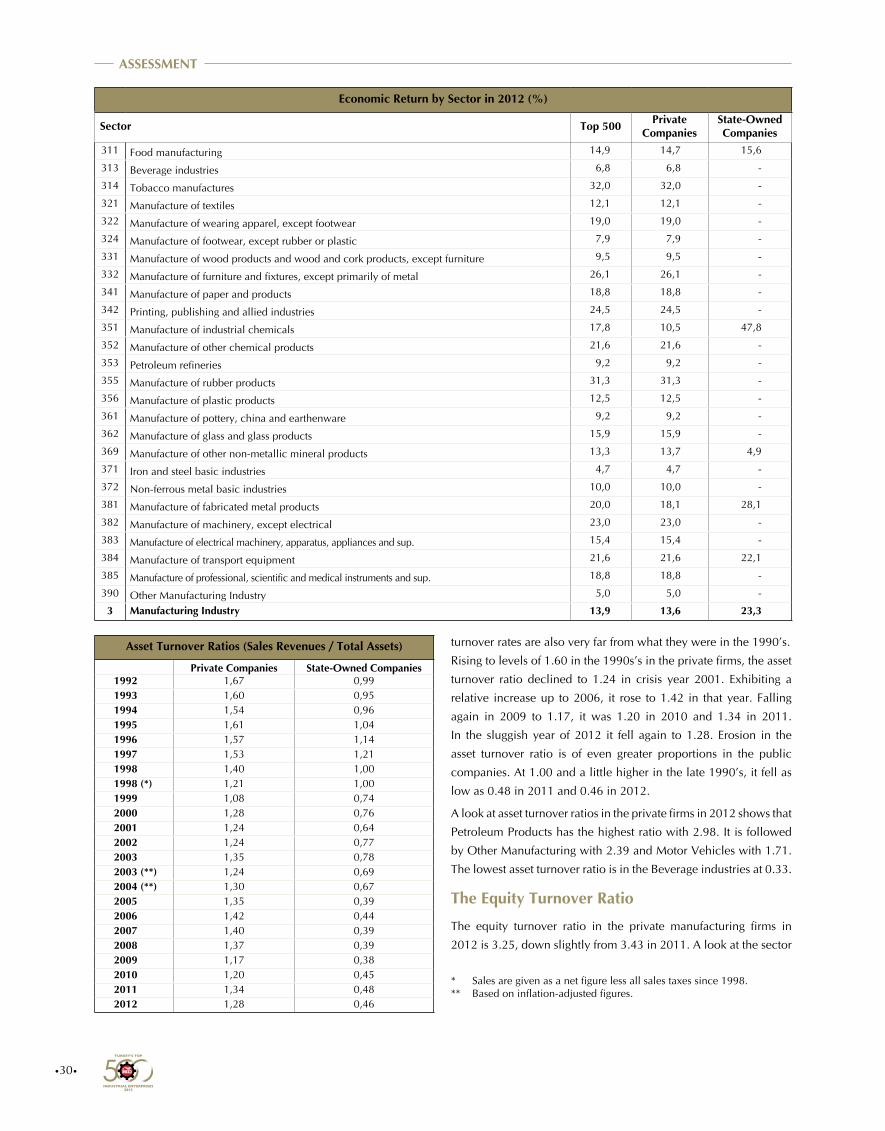
•30•
Asset Turnover Ratios (Sales Revenues / Total Assets)
Private Companies State-Owned Companies1992 1,67 0,991993 1,60 0,951994 1,54 0,961995 1,61 1,041996 1,57 1,141997 1,53 1,211998 1,40 1,001998 (*) 1,21 1,001999 1,08 0,742000 1,28 0,762001 1,24 0,642002 1,24 0,772003 1,35 0,782003 (**) 1,24 0,692004 (**) 1,30 0,672005 1,35 0,392006 1,42 0,442007 1,40 0,392008 1,37 0,392009 1,17 0,382010 1,20 0,452011 1,34 0,482012 1,28 0,46
* Sales are given as a net figure less all sales taxes since 1998.** Based on inflation-adjusted figures.
Economic Return by Sector in 2012 (%)
Sector Top 500 Private Companies
State-Owned Companies
311 Food manufacturing 14,9 14,7 15,6
313 Beverage industries 6,8 6,8 -
314 Tobacco manufactures 32,0 32,0 -
321 Manufacture of textiles 12,1 12,1 -
322 Manufacture of wearing apparel, except footwear 19,0 19,0 -
324 Manufacture of footwear, except rubber or plastic 7,9 7,9 -
331 Manufacture of wood products and wood and cork products, except furniture 9,5 9,5 -
332 Manufacture of furniture and fixtures, except primarily of metal 26,1 26,1 -
341 Manufacture of paper and products 18,8 18,8 -
342 Printing, publishing and allied industries 24,5 24,5 -
351 Manufacture of industrial chemicals 17,8 10,5 47,8
352 Manufacture of other chemical products 21,6 21,6 -
353 Petroleum refineries 9,2 9,2 -
355 Manufacture of rubber products 31,3 31,3 -
356 Manufacture of plastic products 12,5 12,5 -
361 Manufacture of pottery, china and earthenware 9,2 9,2 -
362 Manufacture of glass and glass products 15,9 15,9 -
369 Manufacture of other non-metallic mineral products 13,3 13,7 4,9
371 Iron and steel basic industries 4,7 4,7 -
372 Non-ferrous metal basic industries 10,0 10,0 -
381 Manufacture of fabricated metal products 20,0 18,1 28,1
382 Manufacture of machinery, except electrical 23,0 23,0 -
383 Manufacture of electrical machinery, apparatus, appliances and sup. 15,4 15,4 -
384 Manufacture of transport equipment 21,6 21,6 22,1
385 Manufacture of professional, scientific and medical instruments and sup. 18,8 18,8 -
390 Other Manufacturing Industry 5,0 5,0 -
3 Manufacturing Industry 13,9 13,6 23,3
turnover rates are also very far from what they were in the 1990’s.
Rising to levels of 1.60 in the 1990s’s in the private firms, the asset
turnover ratio declined to 1.24 in crisis year 2001. Exhibiting a
relative increase up to 2006, it rose to 1.42 in that year. Falling
again in 2009 to 1.17, it was 1.20 in 2010 and 1.34 in 2011.
In the sluggish year of 2012 it fell again to 1.28. Erosion in the
asset turnover ratio is of even greater proportions in the public
companies. At 1.00 and a little higher in the late 1990’s, it fell as
low as 0.48 in 2011 and 0.46 in 2012.
A look at asset turnover ratios in the private firms in 2012 shows that
Petroleum Products has the highest ratio with 2.98. It is followed
by Other Manufacturing with 2.39 and Motor Vehicles with 1.71.
The lowest asset turnover ratio is in the Beverage industries at 0.33.
The Equity Turnover Ratio
The equity turnover ratio in the private manufacturing firms in
2012 is 3.25, down slightly from 3.43 in 2011. A look at the sector
ASSESSMENT
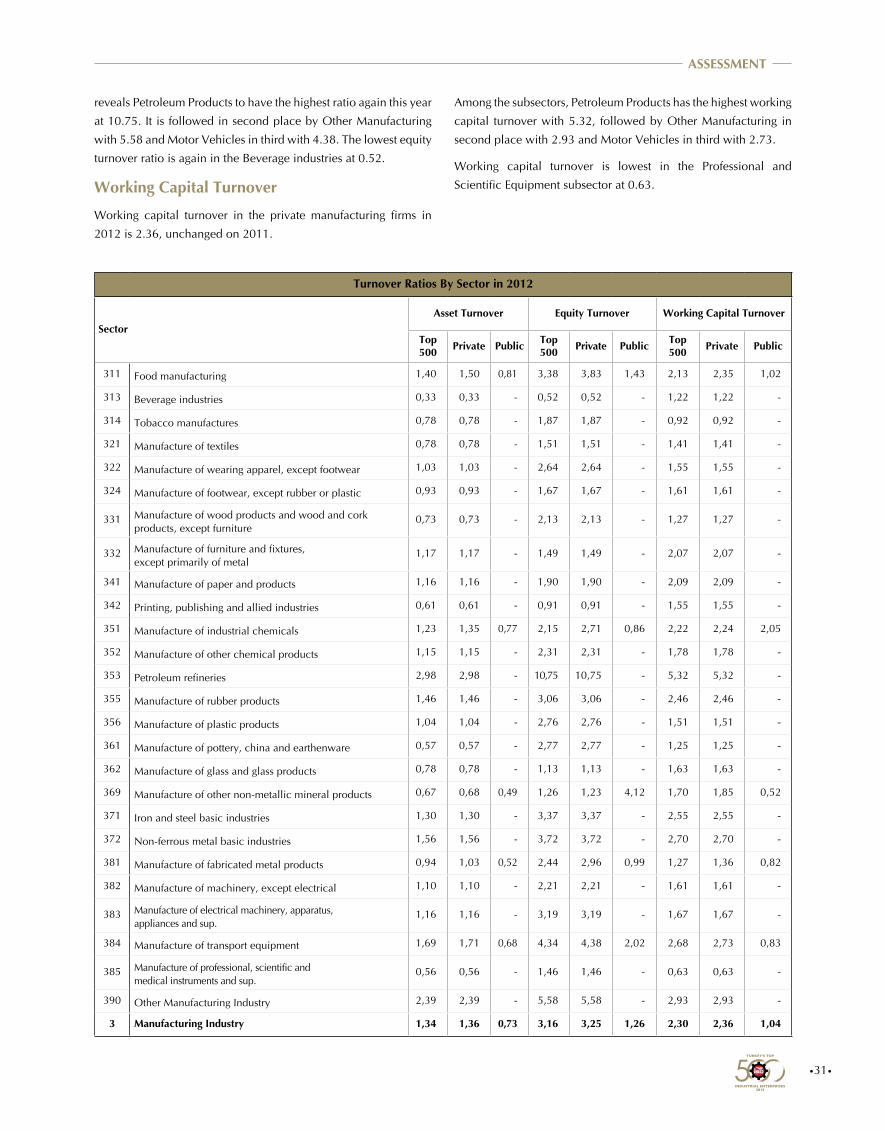
•31•
reveals Petroleum Products to have the highest ratio again this year
at 10.75. It is followed in second place by Other Manufacturing
with 5.58 and Motor Vehicles in third with 4.38. The lowest equity
turnover ratio is again in the Beverage industries at 0.52.
Working Capital Turnover
Working capital turnover in the private manufacturing firms in
2012 is 2.36, unchanged on 2011.
Among the subsectors, Petroleum Products has the highest working
capital turnover with 5.32, followed by Other Manufacturing in
second place with 2.93 and Motor Vehicles in third with 2.73.
Working capital turnover is lowest in the Professional and
Scientific Equipment subsector at 0.63.
Turnover Ratios By Sector in 2012
SectorAsset Turnover Equity Turnover Working Capital Turnover
Top 500 Private Public Top
500 Private Public Top 500 Private Public
311 Food manufacturing 1,40 1,50 0,81 3,38 3,83 1,43 2,13 2,35 1,02
313 Beverage industries 0,33 0,33 - 0,52 0,52 - 1,22 1,22 -
314 Tobacco manufactures 0,78 0,78 - 1,87 1,87 - 0,92 0,92 -
321 Manufacture of textiles 0,78 0,78 - 1,51 1,51 - 1,41 1,41 -
322 Manufacture of wearing apparel, except footwear 1,03 1,03 - 2,64 2,64 - 1,55 1,55 -
324 Manufacture of footwear, except rubber or plastic 0,93 0,93 - 1,67 1,67 - 1,61 1,61 -
331 Manufacture of wood products and wood and cork products, except furniture
0,73 0,73 - 2,13 2,13 - 1,27 1,27 -
332 Manufacture of furniture and fixtures, except primarily of metal
1,17 1,17 - 1,49 1,49 - 2,07 2,07 -
341 Manufacture of paper and products 1,16 1,16 - 1,90 1,90 - 2,09 2,09 -
342 Printing, publishing and allied industries 0,61 0,61 - 0,91 0,91 - 1,55 1,55 -
351 Manufacture of industrial chemicals 1,23 1,35 0,77 2,15 2,71 0,86 2,22 2,24 2,05
352 Manufacture of other chemical products 1,15 1,15 - 2,31 2,31 - 1,78 1,78 -
353 Petroleum refineries 2,98 2,98 - 10,75 10,75 - 5,32 5,32 -
355 Manufacture of rubber products 1,46 1,46 - 3,06 3,06 - 2,46 2,46 -
356 Manufacture of plastic products 1,04 1,04 - 2,76 2,76 - 1,51 1,51 -
361 Manufacture of pottery, china and earthenware 0,57 0,57 - 2,77 2,77 - 1,25 1,25 -
362 Manufacture of glass and glass products 0,78 0,78 - 1,13 1,13 - 1,63 1,63 -
369 Manufacture of other non-metallic mineral products 0,67 0,68 0,49 1,26 1,23 4,12 1,70 1,85 0,52
371 Iron and steel basic industries 1,30 1,30 - 3,37 3,37 - 2,55 2,55 -
372 Non-ferrous metal basic industries 1,56 1,56 - 3,72 3,72 - 2,70 2,70 -
381 Manufacture of fabricated metal products 0,94 1,03 0,52 2,44 2,96 0,99 1,27 1,36 0,82
382 Manufacture of machinery, except electrical 1,10 1,10 - 2,21 2,21 - 1,61 1,61 -
383 Manufacture of electrical machinery, apparatus, appliances and sup.
1,16 1,16 - 3,19 3,19 - 1,67 1,67 -
384 Manufacture of transport equipment 1,69 1,71 0,68 4,34 4,38 2,02 2,68 2,73 0,83
385 Manufacture of professional, scientific and medical instruments and sup.
0,56 0,56 - 1,46 1,46 - 0,63 0,63 -
390 Other Manufacturing Industry 2,39 2,39 - 5,58 5,58 - 2,93 2,93 -
3 Manufacturing Industry 1,34 1,36 0,73 3,16 3,25 1,26 2,30 2,36 1,04
ASSESSMENT
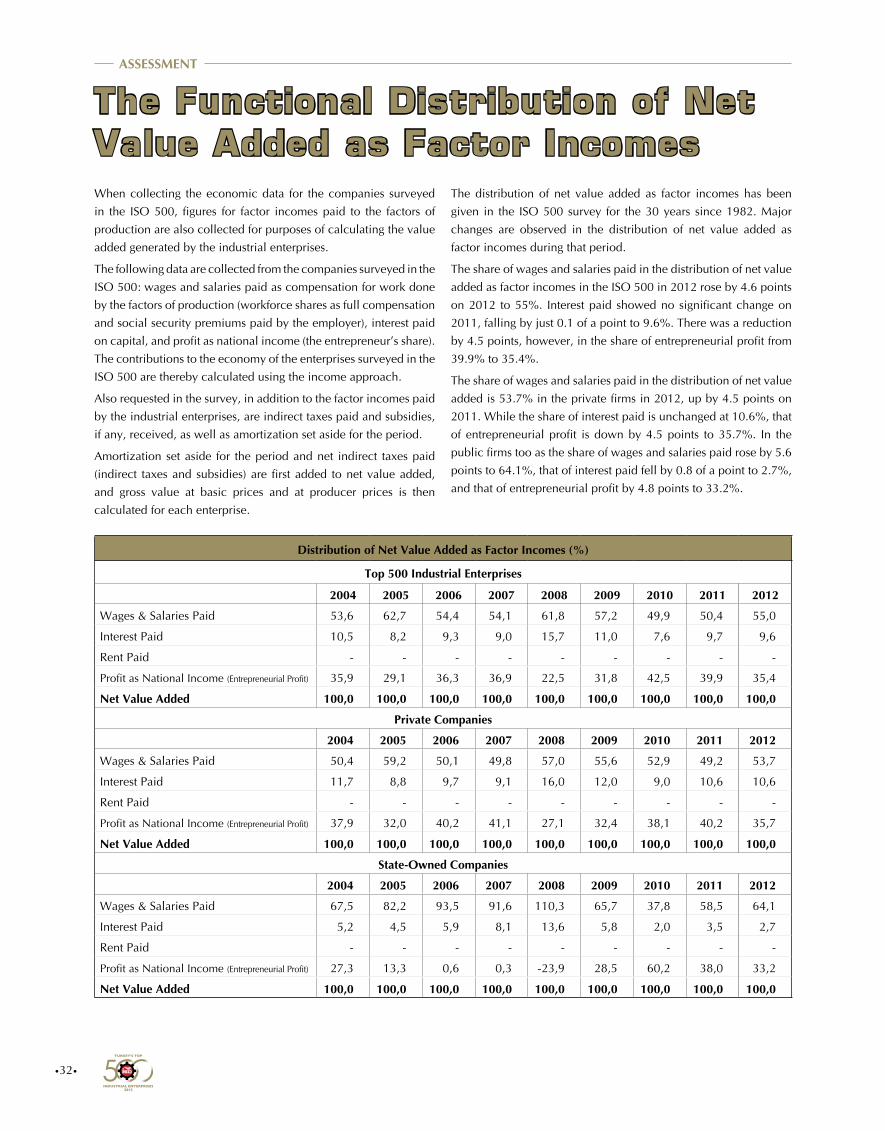
•32•
The Functional Distribution of Net Value Added as Factor IncomesWhen collecting the economic data for the companies surveyed
in the ISO 500, figures for factor incomes paid to the factors of
production are also collected for purposes of calculating the value
added generated by the industrial enterprises.
The following data are collected from the companies surveyed in the
ISO 500: wages and salaries paid as compensation for work done
by the factors of production (workforce shares as full compensation
and social security premiums paid by the employer), interest paid
on capital, and profit as national income (the entrepreneur’s share).
The contributions to the economy of the enterprises surveyed in the
ISO 500 are thereby calculated using the income approach.
Also requested in the survey, in addition to the factor incomes paid
by the industrial enterprises, are indirect taxes paid and subsidies,
if any, received, as well as amortization set aside for the period.
Amortization set aside for the period and net indirect taxes paid
(indirect taxes and subsidies) are first added to net value added,
and gross value at basic prices and at producer prices is then
calculated for each enterprise.
The distribution of net value added as factor incomes has been
given in the ISO 500 survey for the 30 years since 1982. Major
changes are observed in the distribution of net value added as
factor incomes during that period.
The share of wages and salaries paid in the distribution of net value
added as factor incomes in the ISO 500 in 2012 rose by 4.6 points
on 2012 to 55%. Interest paid showed no significant change on
2011, falling by just 0.1 of a point to 9.6%. There was a reduction
by 4.5 points, however, in the share of entrepreneurial profit from
39.9% to 35.4%.
The share of wages and salaries paid in the distribution of net value
added is 53.7% in the private firms in 2012, up by 4.5 points on
2011. While the share of interest paid is unchanged at 10.6%, that
of entrepreneurial profit is down by 4.5 points to 35.7%. In the
public firms too as the share of wages and salaries paid rose by 5.6
points to 64.1%, that of interest paid fell by 0.8 of a point to 2.7%,
and that of entrepreneurial profit by 4.8 points to 33.2%.
Distribution of Net Value Added as Factor Incomes (%)
Top 500 Industrial Enterprises
2004 2005 2006 2007 2008 2009 2010 2011 2012
Wages & Salaries Paid 53,6 62,7 54,4 54,1 61,8 57,2 49,9 50,4 55,0
Interest Paid 10,5 8,2 9,3 9,0 15,7 11,0 7,6 9,7 9,6
Rent Paid - - - - - - - - -
Profit as National Income (Entrepreneurial Profit) 35,9 29,1 36,3 36,9 22,5 31,8 42,5 39,9 35,4
Net Value Added 100,0 100,0 100,0 100,0 100,0 100,0 100,0 100,0 100,0
Private Companies
2004 2005 2006 2007 2008 2009 2010 2011 2012
Wages & Salaries Paid 50,4 59,2 50,1 49,8 57,0 55,6 52,9 49,2 53,7
Interest Paid 11,7 8,8 9,7 9,1 16,0 12,0 9,0 10,6 10,6
Rent Paid - - - - - - - - -
Profit as National Income (Entrepreneurial Profit) 37,9 32,0 40,2 41,1 27,1 32,4 38,1 40,2 35,7
Net Value Added 100,0 100,0 100,0 100,0 100,0 100,0 100,0 100,0 100,0
State-Owned Companies
2004 2005 2006 2007 2008 2009 2010 2011 2012
Wages & Salaries Paid 67,5 82,2 93,5 91,6 110,3 65,7 37,8 58,5 64,1
Interest Paid 5,2 4,5 5,9 8,1 13,6 5,8 2,0 3,5 2,7
Rent Paid - - - - - - - - -
Profit as National Income (Entrepreneurial Profit) 27,3 13,3 0,6 0,3 -23,9 28,5 60,2 38,0 33,2
Net Value Added 100,0 100,0 100,0 100,0 100,0 100,0 100,0 100,0 100,0
ASSESSMENT
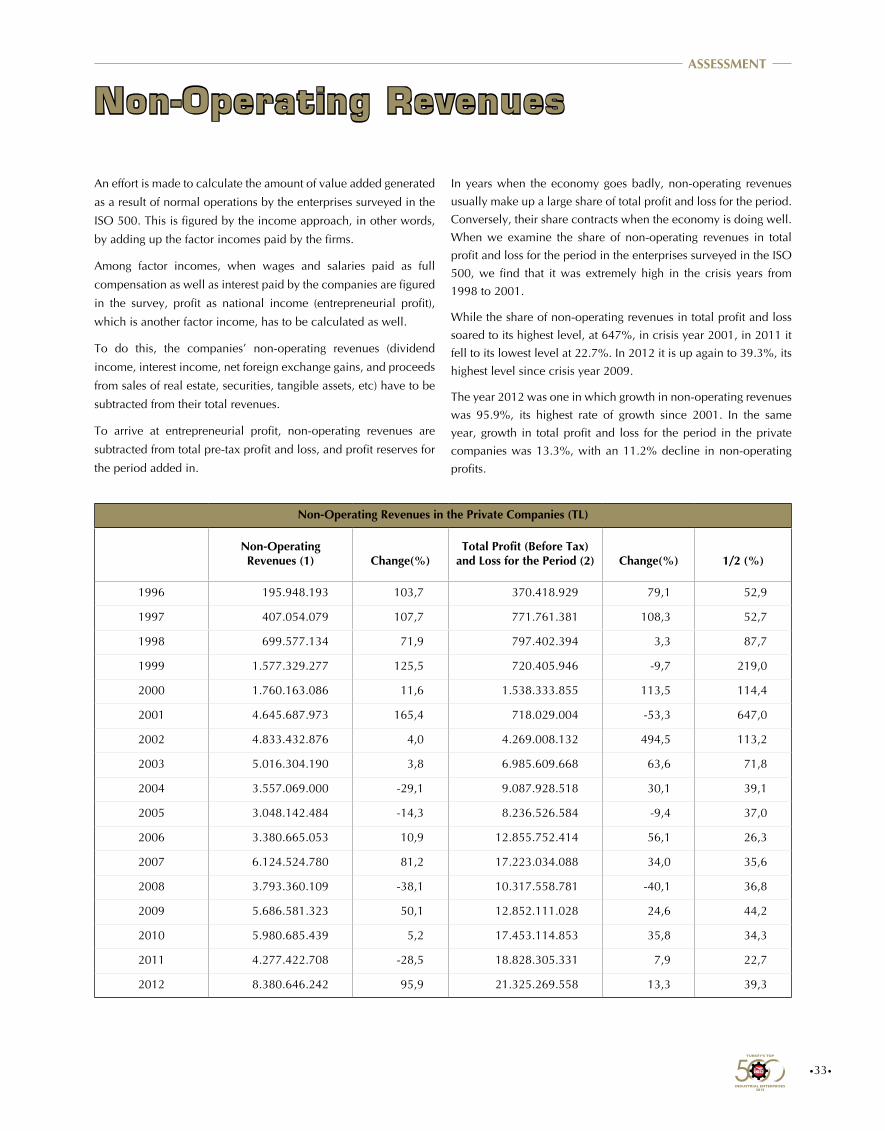
•33•
ASSESSMENT
Non-Operating Revenues
Non-Operating Revenues in the Private Companies (TL)
Non-Operating Revenues (1) Change(%)
Total Profit (Before Tax) and Loss for the Period (2) Change(%) 1/2 (%)
1996 195.948.193 103,7 370.418.929 79,1 52,9
1997 407.054.079 107,7 771.761.381 108,3 52,7
1998 699.577.134 71,9 797.402.394 3,3 87,7
1999 1.577.329.277 125,5 720.405.946 -9,7 219,0
2000 1.760.163.086 11,6 1.538.333.855 113,5 114,4
2001 4.645.687.973 165,4 718.029.004 -53,3 647,0
2002 4.833.432.876 4,0 4.269.008.132 494,5 113,2
2003 5.016.304.190 3,8 6.985.609.668 63,6 71,8
2004 3.557.069.000 -29,1 9.087.928.518 30,1 39,1
2005 3.048.142.484 -14,3 8.236.526.584 -9,4 37,0
2006 3.380.665.053 10,9 12.855.752.414 56,1 26,3
2007 6.124.524.780 81,2 17.223.034.088 34,0 35,6
2008 3.793.360.109 -38,1 10.317.558.781 -40,1 36,8
2009 5.686.581.323 50,1 12.852.111.028 24,6 44,2
2010 5.980.685.439 5,2 17.453.114.853 35,8 34,3
2011 4.277.422.708 -28,5 18.828.305.331 7,9 22,7
2012 8.380.646.242 95,9 21.325.269.558 13,3 39,3
In years when the economy goes badly, non-operating revenues
usually make up a large share of total profit and loss for the period.
Conversely, their share contracts when the economy is doing well.
When we examine the share of non-operating revenues in total
profit and loss for the period in the enterprises surveyed in the ISO
500, we find that it was extremely high in the crisis years from
1998 to 2001.
While the share of non-operating revenues in total profit and loss
soared to its highest level, at 647%, in crisis year 2001, in 2011 it
fell to its lowest level at 22.7%. In 2012 it is up again to 39.3%, its
highest level since crisis year 2009.
The year 2012 was one in which growth in non-operating revenues
was 95.9%, its highest rate of growth since 2001. In the same
year, growth in total profit and loss for the period in the private
companies was 13.3%, with an 11.2% decline in non-operating
profits.
An effort is made to calculate the amount of value added generated
as a result of normal operations by the enterprises surveyed in the
ISO 500. This is figured by the income approach, in other words,
by adding up the factor incomes paid by the firms.
Among factor incomes, when wages and salaries paid as full
compensation as well as interest paid by the companies are figured
in the survey, profit as national income (entrepreneurial profit),
which is another factor income, has to be calculated as well.
To do this, the companies’ non-operating revenues (dividend
income, interest income, net foreign exchange gains, and proceeds
from sales of real estate, securities, tangible assets, etc) have to be
subtracted from their total revenues.
To arrive at entrepreneurial profit, non-operating revenues are
subtracted from total pre-tax profit and loss, and profit reserves for
the period added in.

•34•
Employment, Distribution of Gross Value Added and Relative Output Ratios
Distribution of Employment and Gross Value Added by Sector and Relative Output Ratios in Manufacturing
1982 2001 2011 2012
Distribution of
Employment
Distribution of Gross Value Added
Relative Output
Distribution of
Employment
Distribution of Gross Value Added
Relative Output
Distribution of
Employment
Distribution of Gross Value Added
Relative Output
Distribution of
Employment
Distribution of Gross Value Added
Relative Output
Food, Beverages and Tobacco 19,7 14,0 70,9 24,7 22,4 90,6 20,1 24,3 120,6 21,7 29,3 135,3
Textiles, Wearing Apparel, Leather and Footwear 26,3 15,7 59,8 27,7 10,1 36,3 13,9 3,3 23,5 14,9 3,2 21,7
Forest Product and Furniture 0,5 0,6 108,6 1,6 0,7 41,4 2,4 1,1 45,6 2,3 1,4 60,0
Paper, Paper Products and Printing 3,8 2,7 72,9 2,9 0,1 4,9 1,7 0,8 50,1 1,8 1,3 76,5
Chemicals, Petroleum Products, Rubber and Plastics
11,7 26,0 221,9 11,6 47,2 406,6 12,5 42,0 336,1 11,7 37,6 320,2
Non-Metallic Mineral Products 6,8 7,7 113,0 4,6 4,5 96,5 5,2 3,8 72,7 5,4 3,9 73,2
Primary Metals 14,1 14,6 103,7 8,4 3,8 45,8 11,5 8,1 70,7 10,9 6,9 63,2
Metal Products, Mechanical Equipment and Professional Instruments
12,7 12,0 94,4 10,0 7,2 71,8 15,0 7,6 50,7 16,1 8,7 53,7
Motor Vehicles 4,2 6,3 151,1 8,3 4,0 48,4 17,4 8,9 51,2 15,0 7,6 51,0
Other Manufacturing 0,3 0,5 165,5 0,2 0,1 43,8 0,3 0,0 18,6 0,3 0,1 19,1
Manufacturing Industry 100,0 100,0 - 100,0 100,0 - 100,0 100,0 - 100,0 100,0 -
the distribution of jobs in the manufacturing industry for the last thirty years.
In terms of value added generated at producer prices in the industrial enterprises surveyed in the ISO 500 in 2012, the Chemicals, Petroleum Products, Rubber and Plastics industry is at the top with a 37.6% share. This sector was number one in 2011 as well with 42%, and thirty years ago it also ranked first with a 26% share.
Food, Beverages and Tobacco is in second place by value added distribution in 2012 with a 29.3% share. In 2011, it was also in second place with a share of 24.3%. In 1982, the sector was in fourth place with 14%.
In third place in terms of value added generated in 2012 is the Metal Products, Machinery and Equipment, and Professional Instruments sector with 8.7%. Thirty years ago this sector was in third place with a 12% share. As the figures indicate, despite the important role of ISO 500 in the Turkish manufacturing sector, there has been no significant structural change in the last thirty years.
A look at relative output by subsector shows the Chemicals, Petroleum Products, Rubber and Plastics industry to be in top place in 2012, as always, with 320.2. It is followed by Food, Beverages and Tobacco with 135.3, its place unchanged on last year. In third place in 2012 is the Paper, Paper Products and Printing industry with relative output of 76.5. The lowest ratio of relative output is in Other Manufacturing at 19.1.
The distribution of employment and gross value added is calculated for each sector (two-digit codes) in the ISO 500 survey, as are relative output ratios for the firms operating in the Turkish manufacturing industry. Relative output is figured by first dividing the gross value added produced by the manufacturing firms in each subsector by the number of employees in that subsector to arrive at its gross value added per worker and then taking the ratio of that figure to the gross value added per worker in the manufacturing industry as a whole. Relative output is therefore a measure of Value Added Productivity (VAP) in the subsectors.
The distribution of wage employees among the manufacturing firms in the ISO 500 in 2012 is as follows: the Food, Beverage and Tobacco industry had the largest share of workers with 21.7%. This sector, which was also in first place in 2011 with a 20.1% share, has not only preserved its position but also slightly increased its share. In second place by job distribution in 2012 is the Metal Products, Machinery and Equipment, and Professional Instruments industry with 16.1%, followed by Motor Vehicles in third with a 15% share. Among these sectors, Motor Vehicles was in second place in 2011 with 17.4% and Metal Products, Machinery and Equipment, and Professional Instruments in third with 15%. In other words, these two subsectors switched places in 2012.
Looking back thirty years to 1982, we see that Food, Beverages and Tobacco was again in first place with 19.7% of the country’s wage workers—a sign that there has been no significant change in
N.B. Relative output ratios represent the ratio of value added per employee in the subsectors to value added per employee in the manufacturing industry.
ASSESSMENT
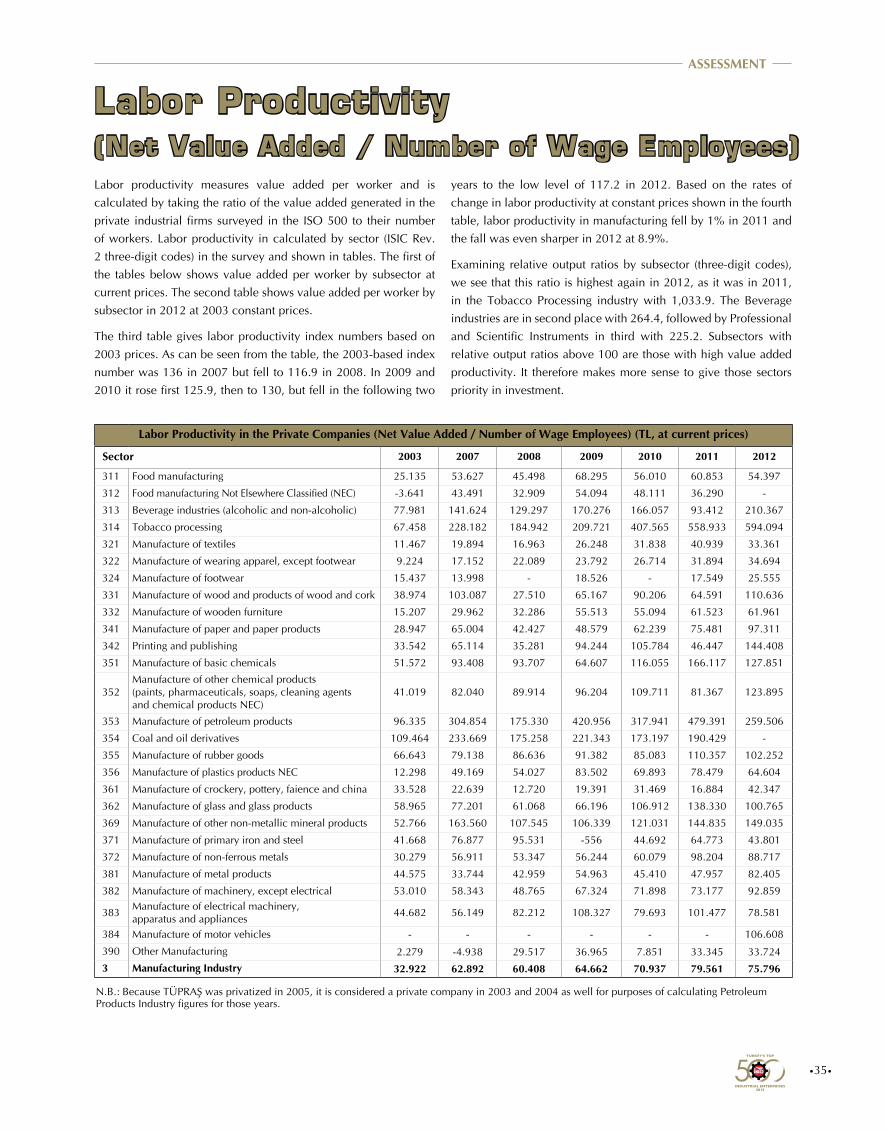
•35•
ASSESSMENT
Labor Productivity (Net Value Added / Number of Wage Employees)
years to the low level of 117.2 in 2012. Based on the rates of
change in labor productivity at constant prices shown in the fourth
table, labor productivity in manufacturing fell by 1% in 2011 and
the fall was even sharper in 2012 at 8.9%.
Examining relative output ratios by subsector (three-digit codes),
we see that this ratio is highest again in 2012, as it was in 2011,
in the Tobacco Processing industry with 1,033.9. The Beverage
industries are in second place with 264.4, followed by Professional
and Scientific Instruments in third with 225.2. Subsectors with
relative output ratios above 100 are those with high value added
productivity. It therefore makes more sense to give those sectors
priority in investment.
Labor productivity measures value added per worker and is
calculated by taking the ratio of the value added generated in the
private industrial firms surveyed in the ISO 500 to their number
of workers. Labor productivity in calculated by sector (ISIC Rev.
2 three-digit codes) in the survey and shown in tables. The first of
the tables below shows value added per worker by subsector at
current prices. The second table shows value added per worker by
subsector in 2012 at 2003 constant prices.
The third table gives labor productivity index numbers based on
2003 prices. As can be seen from the table, the 2003-based index
number was 136 in 2007 but fell to 116.9 in 2008. In 2009 and
2010 it rose first 125.9, then to 130, but fell in the following two
N.B.: Because TÜPRAŞ was privatized in 2005, it is considered a private company in 2003 and 2004 as well for purposes of calculating Petroleum Products Industry figures for those years.
Labor Productivity in the Private Companies (Net Value Added / Number of Wage Employees) (TL, at current prices)
Sector 2003 2007 2008 2009 2010 2011 2012
311 Food manufacturing 25.135 53.627 45.498 68.295 56.010 60.853 54.397
312 Food manufacturing Not Elsewhere Classified (NEC) -3.641 43.491 32.909 54.094 48.111 36.290 -
313 Beverage industries (alcoholic and non-alcoholic) 77.981 141.624 129.297 170.276 166.057 93.412 210.367
314 Tobacco processing 67.458 228.182 184.942 209.721 407.565 558.933 594.094
321 Manufacture of textiles 11.467 19.894 16.963 26.248 31.838 40.939 33.361
322 Manufacture of wearing apparel, except footwear 9.224 17.152 22.089 23.792 26.714 31.894 34.694
324 Manufacture of footwear 15.437 13.998 - 18.526 - 17.549 25.555
331 Manufacture of wood and products of wood and cork 38.974 103.087 27.510 65.167 90.206 64.591 110.636
332 Manufacture of wooden furniture 15.207 29.962 32.286 55.513 55.094 61.523 61.961
341 Manufacture of paper and paper products 28.947 65.004 42.427 48.579 62.239 75.481 97.311
342 Printing and publishing 33.542 65.114 35.281 94.244 105.784 46.447 144.408
351 Manufacture of basic chemicals 51.572 93.408 93.707 64.607 116.055 166.117 127.851
352Manufacture of other chemical products (paints, pharmaceuticals, soaps, cleaning agents and chemical products NEC)
41.019 82.040 89.914 96.204 109.711 81.367 123.895
353 Manufacture of petroleum products 96.335 304.854 175.330 420.956 317.941 479.391 259.506
354 Coal and oil derivatives 109.464 233.669 175.258 221.343 173.197 190.429 -
355 Manufacture of rubber goods 66.643 79.138 86.636 91.382 85.083 110.357 102.252
356 Manufacture of plastics products NEC 12.298 49.169 54.027 83.502 69.893 78.479 64.604
361 Manufacture of crockery, pottery, faience and china 33.528 22.639 12.720 19.391 31.469 16.884 42.347
362 Manufacture of glass and glass products 58.965 77.201 61.068 66.196 106.912 138.330 100.765
369 Manufacture of other non-metallic mineral products 52.766 163.560 107.545 106.339 121.031 144.835 149.035
371 Manufacture of primary iron and steel 41.668 76.877 95.531 -556 44.692 64.773 43.801
372 Manufacture of non-ferrous metals 30.279 56.911 53.347 56.244 60.079 98.204 88.717
381 Manufacture of metal products 44.575 33.744 42.959 54.963 45.410 47.957 82.405
382 Manufacture of machinery, except electrical 53.010 58.343 48.765 67.324 71.898 73.177 92.859
383Manufacture of electrical machinery, apparatus and appliances
44.682 56.149 82.212 108.327 79.693 101.477 78.581
384 Manufacture of motor vehicles - - - - - - 106.608
390 Other Manufacturing 2.279 -4.938 29.517 36.965 7.851 33.345 33.724
3 Manufacturing Industry 32.922 62.892 60.408 64.662 70.937 79.561 75.796
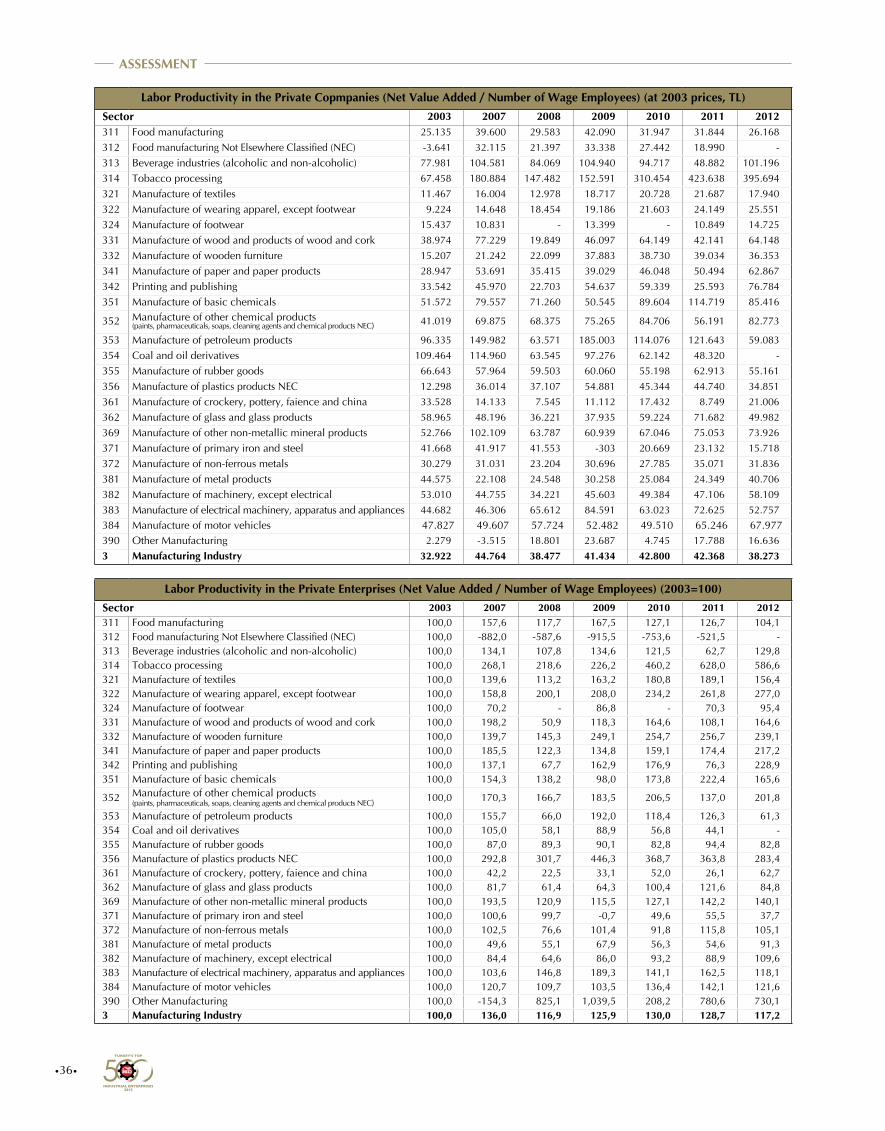
•36•
Labor Productivity in the Private Copmpanies (Net Value Added / Number of Wage Employees) (at 2003 prices, TL)
Sector 2003 2007 2008 2009 2010 2011 2012311 Food manufacturing 25.135 39.600 29.583 42.090 31.947 31.844 26.168
312 Food manufacturing Not Elsewhere Classified (NEC) -3.641 32.115 21.397 33.338 27.442 18.990 -
313 Beverage industries (alcoholic and non-alcoholic) 77.981 104.581 84.069 104.940 94.717 48.882 101.196
314 Tobacco processing 67.458 180.884 147.482 152.591 310.454 423.638 395.694
321 Manufacture of textiles 11.467 16.004 12.978 18.717 20.728 21.687 17.940
322 Manufacture of wearing apparel, except footwear 9.224 14.648 18.454 19.186 21.603 24.149 25.551
324 Manufacture of footwear 15.437 10.831 - 13.399 - 10.849 14.725
331 Manufacture of wood and products of wood and cork 38.974 77.229 19.849 46.097 64.149 42.141 64.148
332 Manufacture of wooden furniture 15.207 21.242 22.099 37.883 38.730 39.034 36.353
341 Manufacture of paper and paper products 28.947 53.691 35.415 39.029 46.048 50.494 62.867
342 Printing and publishing 33.542 45.970 22.703 54.637 59.339 25.593 76.784
351 Manufacture of basic chemicals 51.572 79.557 71.260 50.545 89.604 114.719 85.416
352 Manufacture of other chemical products (paints, pharmaceuticals, soaps, cleaning agents and chemical products NEC) 41.019 69.875 68.375 75.265 84.706 56.191 82.773
353 Manufacture of petroleum products 96.335 149.982 63.571 185.003 114.076 121.643 59.083
354 Coal and oil derivatives 109.464 114.960 63.545 97.276 62.142 48.320 -
355 Manufacture of rubber goods 66.643 57.964 59.503 60.060 55.198 62.913 55.161
356 Manufacture of plastics products NEC 12.298 36.014 37.107 54.881 45.344 44.740 34.851
361 Manufacture of crockery, pottery, faience and china 33.528 14.133 7.545 11.112 17.432 8.749 21.006
362 Manufacture of glass and glass products 58.965 48.196 36.221 37.935 59.224 71.682 49.982
369 Manufacture of other non-metallic mineral products 52.766 102.109 63.787 60.939 67.046 75.053 73.926
371 Manufacture of primary iron and steel 41.668 41.917 41.553 -303 20.669 23.132 15.718
372 Manufacture of non-ferrous metals 30.279 31.031 23.204 30.696 27.785 35.071 31.836
381 Manufacture of metal products 44.575 22.108 24.548 30.258 25.084 24.349 40.706
382 Manufacture of machinery, except electrical 53.010 44.755 34.221 45.603 49.384 47.106 58.109
383 Manufacture of electrical machinery, apparatus and appliances 44.682 46.306 65.612 84.591 63.023 72.625 52.757
384 Manufacture of motor vehicles 47.827 49.607 57.724 52.482 49.510 65.246 67.977390 Other Manufacturing 2.279 -3.515 18.801 23.687 4.745 17.788 16.636
3 Manufacturing Industry 32.922 44.764 38.477 41.434 42.800 42.368 38.273
Labor Productivity in the Private Enterprises (Net Value Added / Number of Wage Employees) (2003=100)
Sector 2003 2007 2008 2009 2010 2011 2012311 Food manufacturing 100,0 157,6 117,7 167,5 127,1 126,7 104,1312 Food manufacturing Not Elsewhere Classified (NEC) 100,0 -882,0 -587,6 -915,5 -753,6 -521,5 -313 Beverage industries (alcoholic and non-alcoholic) 100,0 134,1 107,8 134,6 121,5 62,7 129,8314 Tobacco processing 100,0 268,1 218,6 226,2 460,2 628,0 586,6321 Manufacture of textiles 100,0 139,6 113,2 163,2 180,8 189,1 156,4322 Manufacture of wearing apparel, except footwear 100,0 158,8 200,1 208,0 234,2 261,8 277,0324 Manufacture of footwear 100,0 70,2 - 86,8 - 70,3 95,4331 Manufacture of wood and products of wood and cork 100,0 198,2 50,9 118,3 164,6 108,1 164,6332 Manufacture of wooden furniture 100,0 139,7 145,3 249,1 254,7 256,7 239,1341 Manufacture of paper and paper products 100,0 185,5 122,3 134,8 159,1 174,4 217,2342 Printing and publishing 100,0 137,1 67,7 162,9 176,9 76,3 228,9351 Manufacture of basic chemicals 100,0 154,3 138,2 98,0 173,8 222,4 165,6
352 Manufacture of other chemical products (paints, pharmaceuticals, soaps, cleaning agents and chemical products NEC) 100,0 170,3 166,7 183,5 206,5 137,0 201,8
353 Manufacture of petroleum products 100,0 155,7 66,0 192,0 118,4 126,3 61,3354 Coal and oil derivatives 100,0 105,0 58,1 88,9 56,8 44,1 -355 Manufacture of rubber goods 100,0 87,0 89,3 90,1 82,8 94,4 82,8356 Manufacture of plastics products NEC 100,0 292,8 301,7 446,3 368,7 363,8 283,4361 Manufacture of crockery, pottery, faience and china 100,0 42,2 22,5 33,1 52,0 26,1 62,7362 Manufacture of glass and glass products 100,0 81,7 61,4 64,3 100,4 121,6 84,8369 Manufacture of other non-metallic mineral products 100,0 193,5 120,9 115,5 127,1 142,2 140,1371 Manufacture of primary iron and steel 100,0 100,6 99,7 -0,7 49,6 55,5 37,7372 Manufacture of non-ferrous metals 100,0 102,5 76,6 101,4 91,8 115,8 105,1381 Manufacture of metal products 100,0 49,6 55,1 67,9 56,3 54,6 91,3382 Manufacture of machinery, except electrical 100,0 84,4 64,6 86,0 93,2 88,9 109,6383 Manufacture of electrical machinery, apparatus and appliances 100,0 103,6 146,8 189,3 141,1 162,5 118,1384 Manufacture of motor vehicles 100,0 120,7 109,7 103,5 136,4 142,1 121,6390 Other Manufacturing 100,0 -154,3 825,1 1,039,5 208,2 780,6 730,13 Manufacturing Industry 100,0 136,0 116,9 125,9 130,0 128,7 117,2
ASSESSMENT
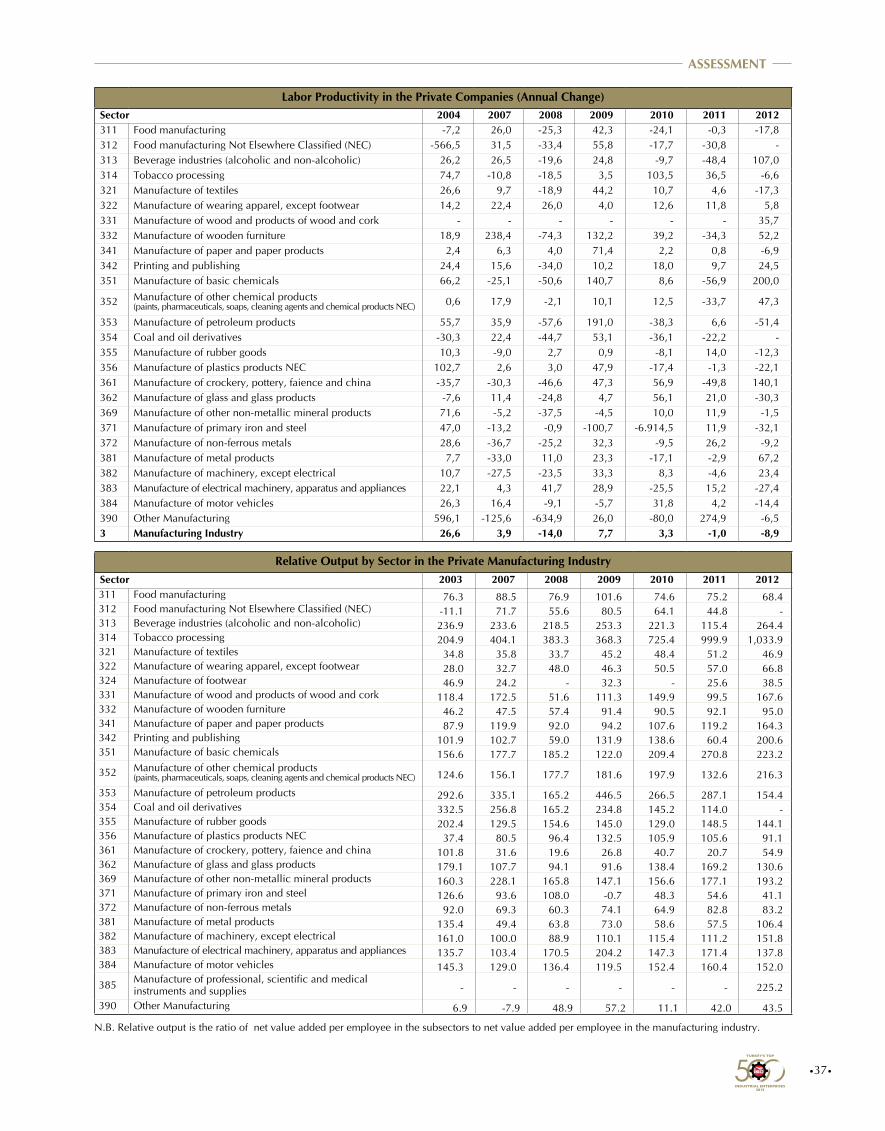
•37•
ASSESSMENT
Relative Output by Sector in the Private Manufacturing IndustrySector 2003 2007 2008 2009 2010 2011 2012311 Food manufacturing 76.3 88.5 76.9 101.6 74.6 75.2 68.4312 Food manufacturing Not Elsewhere Classified (NEC) -11.1 71.7 55.6 80.5 64.1 44.8 -313 Beverage industries (alcoholic and non-alcoholic) 236.9 233.6 218.5 253.3 221.3 115.4 264.4314 Tobacco processing 204.9 404.1 383.3 368.3 725.4 999.9 1,033.9321 Manufacture of textiles 34.8 35.8 33.7 45.2 48.4 51.2 46.9322 Manufacture of wearing apparel, except footwear 28.0 32.7 48.0 46.3 50.5 57.0 66.8324 Manufacture of footwear 46.9 24.2 - 32.3 - 25.6 38.5331 Manufacture of wood and products of wood and cork 118.4 172.5 51.6 111.3 149.9 99.5 167.6332 Manufacture of wooden furniture 46.2 47.5 57.4 91.4 90.5 92.1 95.0341 Manufacture of paper and paper products 87.9 119.9 92.0 94.2 107.6 119.2 164.3342 Printing and publishing 101.9 102.7 59.0 131.9 138.6 60.4 200.6351 Manufacture of basic chemicals 156.6 177.7 185.2 122.0 209.4 270.8 223.2
352 Manufacture of other chemical products (paints, pharmaceuticals, soaps, cleaning agents and chemical products NEC) 124.6 156.1 177.7 181.6 197.9 132.6 216.3
353 Manufacture of petroleum products 292.6 335.1 165.2 446.5 266.5 287.1 154.4354 Coal and oil derivatives 332.5 256.8 165.2 234.8 145.2 114.0 -355 Manufacture of rubber goods 202.4 129.5 154.6 145.0 129.0 148.5 144.1356 Manufacture of plastics products NEC 37.4 80.5 96.4 132.5 105.9 105.6 91.1361 Manufacture of crockery, pottery, faience and china 101.8 31.6 19.6 26.8 40.7 20.7 54.9362 Manufacture of glass and glass products 179.1 107.7 94.1 91.6 138.4 169.2 130.6369 Manufacture of other non-metallic mineral products 160.3 228.1 165.8 147.1 156.6 177.1 193.2371 Manufacture of primary iron and steel 126.6 93.6 108.0 -0.7 48.3 54.6 41.1372 Manufacture of non-ferrous metals 92.0 69.3 60.3 74.1 64.9 82.8 83.2381 Manufacture of metal products 135.4 49.4 63.8 73.0 58.6 57.5 106.4382 Manufacture of machinery, except electrical 161.0 100.0 88.9 110.1 115.4 111.2 151.8383 Manufacture of electrical machinery, apparatus and appliances 135.7 103.4 170.5 204.2 147.3 171.4 137.8384 Manufacture of motor vehicles 145.3 129.0 136.4 119.5 152.4 160.4 152.0
385 Manufacture of professional, scientific and medical instruments and supplies - - - - - - 225.2
390 Other Manufacturing 6.9 -7.9 48.9 57.2 11.1 42.0 43.5
N.B. Relative output is the ratio of net value added per employee in the subsectors to net value added per employee in the manufacturing industry.
Labor Productivity in the Private Companies (Annual Change) Sector 2004 2007 2008 2009 2010 2011 2012311 Food manufacturing -7,2 26,0 -25,3 42,3 -24,1 -0,3 -17,8312 Food manufacturing Not Elsewhere Classified (NEC) -566,5 31,5 -33,4 55,8 -17,7 -30,8 -313 Beverage industries (alcoholic and non-alcoholic) 26,2 26,5 -19,6 24,8 -9,7 -48,4 107,0314 Tobacco processing 74,7 -10,8 -18,5 3,5 103,5 36,5 -6,6321 Manufacture of textiles 26,6 9,7 -18,9 44,2 10,7 4,6 -17,3322 Manufacture of wearing apparel, except footwear 14,2 22,4 26,0 4,0 12,6 11,8 5,8331 Manufacture of wood and products of wood and cork - - - - - - 35,7332 Manufacture of wooden furniture 18,9 238,4 -74,3 132,2 39,2 -34,3 52,2341 Manufacture of paper and paper products 2,4 6,3 4,0 71,4 2,2 0,8 -6,9342 Printing and publishing 24,4 15,6 -34,0 10,2 18,0 9,7 24,5351 Manufacture of basic chemicals 66,2 -25,1 -50,6 140,7 8,6 -56,9 200,0
352 Manufacture of other chemical products (paints, pharmaceuticals, soaps, cleaning agents and chemical products NEC) 0,6 17,9 -2,1 10,1 12,5 -33,7 47,3
353 Manufacture of petroleum products 55,7 35,9 -57,6 191,0 -38,3 6,6 -51,4354 Coal and oil derivatives -30,3 22,4 -44,7 53,1 -36,1 -22,2 -355 Manufacture of rubber goods 10,3 -9,0 2,7 0,9 -8,1 14,0 -12,3356 Manufacture of plastics products NEC 102,7 2,6 3,0 47,9 -17,4 -1,3 -22,1361 Manufacture of crockery, pottery, faience and china -35,7 -30,3 -46,6 47,3 56,9 -49,8 140,1362 Manufacture of glass and glass products -7,6 11,4 -24,8 4,7 56,1 21,0 -30,3369 Manufacture of other non-metallic mineral products 71,6 -5,2 -37,5 -4,5 10,0 11,9 -1,5371 Manufacture of primary iron and steel 47,0 -13,2 -0,9 -100,7 -6.914,5 11,9 -32,1372 Manufacture of non-ferrous metals 28,6 -36,7 -25,2 32,3 -9,5 26,2 -9,2381 Manufacture of metal products 7,7 -33,0 11,0 23,3 -17,1 -2,9 67,2382 Manufacture of machinery, except electrical 10,7 -27,5 -23,5 33,3 8,3 -4,6 23,4383 Manufacture of electrical machinery, apparatus and appliances 22,1 4,3 41,7 28,9 -25,5 15,2 -27,4384 Manufacture of motor vehicles 26,3 16,4 -9,1 -5,7 31,8 4,2 -14,4390 Other Manufacturing 596,1 -125,6 -634,9 26,0 -80,0 274,9 -6,53 Manufacturing Industry 26,6 3,9 -14,0 7,7 3,3 -1,0 -8,9

•38•
The Results of the ISO 500 SurveyISO 500 firms. In the case of the state enterprises, the designation “public” appears here.
The Top Companies by Production-Based SalesTÜPRAŞ (Turkish Petroleum Refineries Corporation), a state-run enterprise until 2005, has continued to lead the ranking by production-based sales since that year as a private company and did so again in 2012, leaving as always a large gap between itself and the next firm in the ranking. The share of TÜPRAŞ’s production-based sales in ISO 500 total rose to 11.6% in 2012, up from 8.5% in 2011.
There is no change in the top three positions in 2012. As in 2011, TÜPRAŞ is followed by the Ford Motor Company Turkey in second place and Oyak-Renault in third. These top three private firms were responsible for 15.8% of the ISO 500’s production-based sales.
The Top Companies by Value Added Generated As in production-based sales, TÜPRAŞ Turkish Petroleum Refineries Corporation also took first place in gross value added generated at producer prices in 2012, as it did in 2010 and 2011. This enterprise generated 18.1% of the gross value added at producer prices in the ISO 500, a percentage that is high due to the very high proportion of indirect taxes it pays. Some 1.5% of Turkey’s GDP in 2012, at current prices, was generated by TÜPRAŞ.
The firm in second place by gross value added at producer prices in the ISO 500 asked that its data be withheld. Its total value added is therefore not given either. The firm in third place is JTI (Japan Tobacco International). All three top firms by value added are private companies.
The Top Profit-MakersAs in 2011, the most profitable industrial enterprise in the ISO 500 in 2012 is again the Turkish Petroleum Corporation (TPAO). It is followed in second place by TÜPRAŞ and in third by a state-owned firm, the Turkish Coal Group.
The Top ExportersAs in recent years, the top ten exporters in 2012 are all private sector companies. The ranking in 2012 is unchanged on 2011. TÜPRAŞ is number one in exports, as it is in production-based sales and gross value added. It is followed in second by the Ford Motor Company Turkey and by Oyak-Renault (automotive manufacturer) in third.
The Economic AggregatesIn the 89 years since the founding of the Republic, GDP has grown on average by 4.7% a year. Agriculture was the main sector of the economy for the first 59 years until 1982 when industry displaced it. During that 89-year period, as agriculture expanded by an annual average 2.9%, annual average growth was 5.1% in services and 6.3% in industry. As these figures show, the highest rate of average annual growth at constant prices was in the industrial
The results of the survey of Turkey’s Top 500 Industrial Enterprises, compiled this year for the 45th time by the Istanbul Chamber of Industry, were published in Turkish in a special August 2013 issue of the Chamber’s journal. The Chamber, which is celebrating its 61st anniversary this year, has been compiling and publishing its survey of the country’s top industrial enterprises for the last 45 years.
Originally compiled for the top 100 companies, it was later expanded to include 300 and then, in 1980, 500 companies. The survey is followed closely by a large circle both in Turkey and abroad for its contribution to overcoming the lack of financial data in the country.
The ISO 500 survey of Turkey’s top industrial enterprises has been compiled for 45 years based on the criterion of production-based sales derived from industrial operations. In other words, the firms surveyed are ranked not by their total turnover but by their industrial operations, which, for the purpose of the survey, include the mining and quarrying, manufacturing and energy sectors.
The fundamental purpose of the ISO 500 survey is to identify the top firms among those engaged in industry in Turkey. Both public and private firms domiciled in Turkey and operating in the sector are therefore included in the scope of the survey.
In addition to the ranking already mentioned, the data collected in the survey are also given separately for the ISO 500 as a whole, for the ISO 500 private enterprises, for the ISO 500 public enterprises and for the ISO 500 ISO-member firms. All these data are provided cumulatively for each of the twelve major subsectors, broken down into public sector companies, private sector companies, and profitable and unprofitable companies.
Also given in the survey are financial ratios, financial structure, rates of return, economic profit, asset turnover ratios, functional distribution of net value added as factor incomes, non-operating revenues, distribution of employment and gross value added, and labor productivity.
A cumulative survey, the ISO 500 uses the United Nations International Standard Industrial Classification (ISIC, Series M, No. 4, Rev. 2) to facilitate comparisons with previous years. Parallel with the adoption in 2012 of the European Union NACE code by the Association of Chambers and Stock Exchanges of Turkey (TOBB), we also obtained NACE codes for the industrial enterprises surveyed and have included them here. An effort was thereby made to harmonize the ISIC and NACE codes in the assessments.
The main table containing data for the enterprises shows each firm’s rank by production-based sales in 2012 as well as its rank in last year’s survey. Firms for whom no rank in 2011 is shown either asked that their data be withheld or are newcomers to the survey in 2012. They may, for example, be firms that moved up from the Second 500 to the Top 500.
The chamber with which the private sector firms are affiliated is also indicated in the main table showing rank and other data for the
ASSESSMENT
•39•
ASSESSMENT
sector, making it the engine of the economy in the last fifty years, especially since the introduction of economic planning.
Despite this positive development in terms of industry’s contributions to the economy, its weight in GDP at current prices has steadily dwindled according to the latest update of the national income series. Industry’s share in GDP, which was 26.8% in 1998, has contracted continuously in subsequent years, down to its lowest level ever in 2009 at 19.1% and 19.3% in 2012.
This contraction in the share of industry in GDP was even sharper in the manufacturing industry, whose share dipped from a favorable 23.9% in 1009 to 15.2% in 2009. It is little changed in 2012 at 15.6%. This represents a loss of 34.7% in manufacturing’s share in value added over the last 14 years.
While some rather significant ground has been covered in the economy, in industrialization especially, this development in the sector is conspicuous nonetheless and is reflected in the economy overall in a drop in domestic savings from levels from 20% and higher to 14.2% in 2012.
Under the recently formulated 10th Five-Year Development Plan, the industrial sector’s share in GDP at current prices is projected to be 19.9% on average in the 2014-2018 period.
The gross value added generated at producer prices by the ISO 500 enterprises made up 9.3% of Turkey’s GDP in 2007. In crisis year 2008 it fell to 8.4%. Rising again slightly in 2009 to 8.6%, it climbed to 9.3% in 2010 as the economy went into recovery.
In 2011 and 2012, gross value added at producer prices in the ISO 500 again declined to first a 9% share and then an 8.4% share of Turkey’s GDP.
The share of the ISO 500 enterprises in gross value added at basic prices in Turkey’s industrial sector is at the high level of 22.8% in 2012, while value added at basic prices by firms in the manufacturing branch makes up 24% of the value added at current prices in the Turkish manufacturing industry.
The share of VAT and SCT paid within gross value added at producer prices in the ISO 500 in 2012 fell by 0.9 of a point on 2011 from 48.6% to 47.7%. Similarly, total VAT and SCT paid by the ISO 500 enterprises in 2012 fell by 5 points on 2011 from 59.9% to 54.9% in 2012 as a share of the total VAT and SCT shown in central government budget revenues. As the figures show, the ISO 500 industrial enterprises pay more than 50% of the VAT and SCT collected in Turkey.
When comparing aggregate data in the ISO 500, more weight is given to the data for the private firms since they make up the bulk of the enterprises surveyed. Based on the ISO 500 results for 2012, 487 of the 500 firms are private and only 13 public.
While increases are shown at constant prices in the survey, the Turkish Statistical Institute’s (TurkStat) implicit price deflator for the industrial sector was used in the case of value added generated. In the case of metrics other than value added, the deflator used is TurkStat’s annual average rate of change based on 12-month changes in the PPI for industry.
While production-based sales in the ISO 500 in 2012 showed growth of 9.2% at current prices and 2.9% at constant prices, these percentages were 9.4% and 3.1% for the private companies and 6.3% and 0.2% for the public companies. Sales revenues were up by 3.4% at current prices but down by 2.6% at constant prices in the ISO 500 overall.
While exports in the ISO 500 companies overall and in the private firms rose by 0.6% on a dollar basis in 2012, in the public firms exports fell by 3.1%.
Turkey’s total exports in 2012 rose by 13% on a dollar basis, but export growth in the ISO 500 was limited at 0.6%. It should also not be overlooked that 9 points of that 13% growth is due to exports of precious and semi-precious stones.
While current growth in total pre-tax profit and loss for the period is 6.3% for the ISO 500 and somewhat higher at 13.3% for the private firms in the survey, in the public firms there is a decline of 26.9%. At constant prices this drop was 31.1% while growth in total pre-tax profit and loss for the period at constant prices was 0.2% in the ISO 500 and 6.7% in the private companies.
The total debts of the ISO 500 enterprises are up by 6.3% at current prices in 2012 while in the private sector firms this increase is 5.9%.
Equity capital in the ISO 500 in 2012 is up by 10% overall and by 11.2% in the private firms, while total assets are up by 8% and 8.1% respectively.
There is an increase of 1.4% at current prices in interest paid in the ISO 500 enterprises overall in 2012. In the private companies it is higher at 2.7%.
As net value added in the ISO 500 overall rose by 1.8% at current prices in 2012, at constant prices it declined by 1.9%. In the private firms the rise was 2.9% at current prices with a drop of 0.9% at constant prices.
While value added in Turkey’s industrial sector is up by 2% in 2012 at basic prices, growth in gross value added at basic prices is up by 4.8% and 0.9% respectively at current prices and constant prices in the ISO 500 private enterprises. This finding shows that growth in the value added generated by the private companies was less than that in the other firms.
While the amount of gross value added at producer prices generated by the ISO 500 private firms is up by 2.5% at current prices in 2012, at constant prices it is down by 1.3%.
Overall, there is no significant difference between growth rates in Turkey and those in the ISO 500.
The Dominance of the Top 50 Companies
To better see the weight in the ISO 500 and in the national economy of Turkey’s Top 500 Industrial Enterprises, they are divided into groups of fifty by size and their shares in the aggregate data calculated within those groups. In 2012 as in previous years, these calculations underscore the importance of economies of scale.
•40•
The share of the top 50 firms in the ISO 500 in production-based sales is up from 49% in 2011 to 50.1% in 2012. This rise shows that production-based sales in these top 50 firms rose faster than in the other 450.
Although the share in production-based sales of each group drops sharply after that of the top group, contractions in the groups’ ratios become progressively less marked. This is also observed in similar surveys in countries other than Turkey.
The top 50 firms’ share in gross value added at producer prices rose from 50.8% in 2011 to 54.8% in 2012, in other words, following an upward trend like their share in production-based sales. Their share in pre-tax profit and loss for the period, which was 51.3% in 2011, slipped by 6.8 points in 2012 to 44.5%.
The top 50 firms’ share in exports was 52.2% in 2011, falling by 0.9 of a point to 51.3% in 2012 and lower, like their share in pre-tax profit and loss. Their share in number of wage workers is down as well, from 29.5% in 2011 to 29.3% in 2012.
In addition to their weight in the ISO 500, the top fifty firms also exert considerable influence in the Turkish economy in general. The gross value added they generated at producer prices made up 4.6% of Turkey’s GDP in 2011 and is unchanged in 2012. Their share in the country’s exports on the other hand contracted from 24.5% in 2011 to 21.4% in 2012.
The Export Performance
The contribution of exports to the positive development in the economy following the 2001 crisis is considerable as exports rose by 386.6% between 2002 and 2012. Despite this increase in exports, however, growth in imports for the same period was 417.4%.While foreign demand played a key role in the rapid growth in the economy in 2010 and 2011, growth in domestic demand was even higher. In 2012 on the other hand, domestic demand was subdued, indeed even dried up, parallel with the economic policies being implemented, and GDP growth came to 2.2%.
Growth in exports of goods and services was important in the 2.2% growth achieved in 2012. While exports rose by 13%, 16.3 million dollars’ worth of this was due to exports of precious and semi-precious stones, which contributed 9.1 points to export growth for the year.
A look at exports by sector in 2012 shows that the Motor Vehicle industry, despite a fall of 12.8%, was again the leading sector in ISO 500 exports with a 21.9% share. This represents a fall of 3.4 points on its 25.3% share in 2011.
In second place in 2012 is the Chemicals, Petroleum Products, Rubber and Plastics industry with a 20.6% share and 16.4% export growth for the year. The Primary Metal industry is in third place with a share of 20% and export growth of 1.7% in 2012.
The Foreign-invested Enterprises
Despite an increase in the number of foreign-invested enterprises in the ISO 500 during the decade of the 2000’s, their numbers have exhibited a downtrend in the last three years. These firms, which numbered 153 in 2009, dropped to 148 in 2010, 140 in 2011, and 138 in 2012.
The share in total production-based sales of the 138 foreign-invested enterprises in the ISO 500 is 29.7% in 2012, down by 1.6 points from 31.3% in 2011.
Their share in gross value added at producer prices is 42.7%. In 2011 it was lower at 35.4%. As the number of foreign-invested enterprises declined in 2012, their share in gross value added at producer prices rose by 7.3 points.
In total profit and loss for the period the foreign-invested enterprises’ share is 31.4% in 2012, representing a 1.4 point drop on its 32.8% in 2011.
The foreign-invested enterprises realized 43% of the ISO 500’s exports in 2012, down by 2.4 points on 45.4% in 2011. While the ISO 500’s exports made up 41.8% of Turkey’s total exports in 2012, the 138 foreign-invested enterprises’ share in the country total was 18%. As the data indicates, these 138 companies are responsible for one-fifth of Turkey’s exports.
In terms of wage workers, the foreign-invested enterprises’ share is 31.1% in 2012, unchanged on 2011.
ISO Members in the Top 500 Industrial EnterprisesISO members among the Top 500 in 2012 numbered 198, 196 of them private companies, the other two public. In the previous years their numbers were 193, 191 private and 2 public.
As the number of ISO-member private companies in the survey rose by five, that of the public companies was unchanged. On the decline between 2007 and 2011, the number of ISO members in the ISO 500 went on the rise again in 2012.
While the number of ISO-member firms in the ISO 500 increased in 2012, their share in total production-based sales is down by 1.1 point on 2011 to 43%. The same is true of sales revenues, the ISO-member firms’ share in which dipped by 2 points from 45.2% in 2011 to 43.2% in 2012.
While 41.8% of Turkey’s total exports in 2012 were made by the ISO 500 industrial enterprises, the ISO members’ share in total ISO 500 exports is 51.7%. The exports of the 198 ISO-member firms in the ISO 500 accounted for 21.6% of the Turkey total in 2012.
In terms of pre-tax profit for the period, the 198 ISO-member firms’ share rose by 2.2 points from 37.2% in 2011 to 39.3% in 2012.
These firms’ share in the ISO 500’s total profit and loss rose by 3.3 points to 40.9 in 2012 while the share of the 196 ISO-member private firms rose by 3 points to 41.1%.
Some 40.8% of the total debts of the ISO 500 enterprises in 2012 is down to the 198 ISO-member firms.
The number of wage workers employed by the ISO 500 enterprises is up by 3.7% from 21,466 in 2011 to 596,055 in 2012. Approximately 42% (250,218) of them are employed by the 198 ISO-member firms, representing an additional 4.9% employment (11,632) on the previous year.
Within net value added at factor cost, while the ISO members’ share in wages and salaries paid is up by 0.9 on the previous year to 45.5%
ASSESSMENT
•41•
ASSESSMENT
and their share in interest paid up by 6.7 points to 41.5%, their share in profit as national income (entrepreneurial profit) is up as well by 3.9 points to 38.2%. The net value added generated by the 198 ISO-member firms in 2012 made up some 42.5% of the ISO 500 total.
In terms of gross value added at producer prices, the ISO members’ share fell by 2.3 points to 41.5% in 2012.
ISO Members in the Private Sector
The number of private sector industrial enterprises in the ISO 500 is unchanged in 2012 at 487. Of these 487 firms, 196 (40.2%) are ISO-member private companies. This represents an increase of five on their numbers in 2011.
The ISO-member private companies accounted for 45.2% of the ISO 500’s production-based sales, 45.1% of sales revenues and 52.4% of exports in 2012.
The same companies were responsible for 45.7% of pre-tax profit and 34% of loss for the period in the ISO 500. The ISO-member private industrial firms’ share in total pre-tax profit and loss for the period is up by 0.7 of a point on 2011 to 46.7%.
As the ISO-member private firms’ share in the total debts of the ISO 500 declined by 1.6 points on 2011 to 42.5% in 2012, their share in short term debts climbed to 46.9% and their share in long-term debt fell to 34.4%. The same firms’ share in equity capital is 46%, not significantly different from the previous year.
The ISO-member private firms employed 242,684 persons in 2012, or 45.9% of the ISO 500 total (528,544).
The net value added generated by the ISO-member private firms rose by 2.7 points on 2011 to 47.5% of the ISO 500 total in 2012.
Within net value added, wages and salaries paid in 2012 came to 51.3% of the ISO 500 total, interest paid to 42.3% and profit as national income (entrepreneurial profit) to 43.4%.
In terms of gross value added, the ISO-member private firms’ share is 46.6% at basic prices, but lower at 44.4% at producer prices.
The Public Companies’ Share
The number of public companies in the ISO 500 fell to 14 in 2088 but rose again to 15 in crisis year 2009. Dropping back to 12 in 2010, it was unchanged at 13 in 2011 and 2012.
The 13 public firms accounted for 5.8% of total production based sales, 5% of total sales revenues and 1.4% of total exports in the ISO 500 in 2012. The last two figures are unchanged on the previous year. These firms’ share in total profit and loss for the period in the ISO 500 is down from 17.2% to 11.9%.
The debts of the public sector firms rose by 0.3 of a point on 2011 to 5.4% of ISO 500 total debt in 2012, to 6% of short-term debt (up by 0.9 of a point), and to 4.3% of long-term debt (down by 0.9 of a point).
The 13 public companies’ share in gross value added generated declined by 0.5 of a point at basic prices on 2011 to 11.7% of the ISO 500 total in 2012. At current prices it rose by 0.4%. As these firms’ gross value added at producer prices rose by 1.6% on 2011
at current prices, its share in the ISO 500 remained unchanged on the previous year at 7.3%.
Financial Structure
The excessive dependence on borrowing in Turkey stems mainly from the firms’ structures of ownership and their inability to raise sufficient capital. While firms in the developed countries secure funds largely from the capital markets, in Turkey these markets are still quite limited and the vast majority of companies are therefore not in a position to take advantage of them for various reasons.
Despite a fall in interest on loans in crisis year 2009, the leverage ratio (total debt to total assets) in the ISO 500 overall, which was 49.1% due to a contraction in the demand for credit, rose to levels of around 51% following a sharp increase in credit stock parallel with the rapid recovery in the economy in 2010. In 2011 as well, impacted by positive development in the economy and a rapid increase in credit stock, the leverage ratio continued to rise, reaching its highest level in recent years at 53.7%.
Then, in 2012, despite a 6.3% increase in total debt, deterioration in financial structure slowed in the ISO 500, albeit only slightly, due to a small increase of 8% in assets, and the leverage ratio fell to 52.8%. Despite this drop, however, it remains the second highest in recent history.
The Structure of Borrowing
The total debts of the ISO 500 decreased by 4.7% on the previous year in crisis year 2009, but increased again in 2010 by 20.5%. This growth continued in 2011 at 20.1%, when foreign debt swelled due to movement in the exchange rates.
As growth in credit stock slowed in 2012 due to stagnation followed by moderate growth in the economy, debt growth fell to 6.3% following high rises in 2010 and 2011 when lack of movement in the exchange rates meant little or no change in the volume of foreign debt. While debt growth was lower in the private companies in the ISO 500 at 5.9%, in the public companies it was higher at 12.5%.
Some 64.6% of the total debts of the ISO 500 private firms in 2012 was short-term debt, the remaining 35.4% long-term. The total debts of the 487 private firms in the ISO 500 came to 179.7 billion Turkish liras, the largest portion of it concentrated in the Chemicals, Petroleum Products, Rubber and Plastics industry with 19.9%.
The second largest portion of debt in the ISO 500 is due to the Primary Metals industry with 18.4% and the third to Food, Beverages and Tobacco with 14.9%. These are followed by Metal Products, Machinery and Tools, and Professional Instruments in fourth with 13.9% and Motor Vehicles in fifth with 9.7%.
The Financial Ratios
Current Ratio (Revolving Assets / Short-term Debt)
The current ratio shows firms’ ability to convert their assets into money and repay their debts with the funds generated. The current ratio was 163.4% in the ISO 500 overall in pre-crisis year 2007, falling to 148.6% in 2008, its lowest level since 2004.
•42•
Rising again to 160.8% in crisis year 2009, the current ratio was almost unchanged in 2010 at 160.9%, but fell to 158.4% in 2011 due to a deterioration in financial structure. In 2012 it again developed more positively, rising to 163.1%.
Total Debt / Total Assets
The ratio of total debt to total assets in the ISO 500 was 52.6% in 2008, falling to 49.1% in 2009 but rising again first to 51% in 2010 and then to 53.7% in 2011. This ratio, which has a tendency to rise in years of crisis, was conspicuously high in 2011 at 53.7%. With a slight improvement in 2012, it fell to 52.8%. At 54.4% in the ISO 500 private firms in 2010, it rose to 58.5% in 2011 but dropped to 57.3% in 2012.
Total Debt / Equity Capital
The debt to equity ratio, aka the borrowing ratio, is an important indicator of improvement in financial structure. It rose as high as 111.2% in 2008 but fell again in 2009 to 96.5% due to a decline in the demand for credit as the crisis made itself felt in the economy.
Developing positively again in 2010 and 2011, the ratio rose first to 104.3%, then 116%. In 2012 it was around 134.1% in the ISO 500 private companies, but lower at 124.1% in the ISO-member private firms.
Inadequate equity is a structural problem in Turkey’s industrial enterprises, stemming largely from the capital markets and the ownership structure of the firms.
Short-Term Debt / Total Assets
The ratio of short-term debt to total assets rose to its highest level in 2008 at 36.5% but fell to 33.5% in 2009 die to a relative decrease in debt and a relative increase in equity.
When total debt and short-term debt both rose faster than equity capital in 2010 and 2011, the ratio of short-term debt to total assets again went on the rise, climbing first to 35.2%, then 36.5%. In 2012 it fell again to 34.3%, parallel with a slowdown in growth in borrowing.
Tangible Fixed Assets / Equity Capital
It is a fundamental principle that firms use equity capital to fund their tangible fixed assets. A ratio of tangible fixed assets to equity smaller than 100 and falling is therefore an indicator of adequate equity in a firm.
This ratio, which looked quite good at 61.3% in the ISO 500 overall in 2009, fell even lower to 59.2% in 2010 but returned again to its 2009 level at 61.2% in 2011. In 2010 it was down by 0.9 of a point to 60.3%, signaling a small but positive improvement.
Equity Capital / Total Assets
The ratio of total equity to total assets, which was 50.9% in 2009, fell in 2010 and 2011 to 46.3% but is slightly up in 2010 at 47.2%.
Short-term Debt / Total Debt
Although it is desirable from the standpoint of financial structure
that the share of short-term debt in total debt be smaller than that of long-term debt, this is not true in general for the ISO 500.
At the high level of 68.2% in the ISO 500 overall in 2009, the ratio of short-term debt to total debt rose slightly in 2010 to 69%. Beginning to fall in 2011, it declined to 65% in 2012. Although this falling trend is a welcome development, even a ratio of this size is far from desirable.
Sectoral Financial Ratios
The sectors with the best financial ratios in 2012 are Wood, Furniture and Fixtures, Glass and Glass Products, and Professional and Scientific Equipment.
The Profitability Ratios (Returns)
Profitable firms in the ISO 500 number 437 in 2012, 430 of which are private and the other 7 public. The number of unprofitable firms in the same year is 63, 57 of them private and 6 public.
In 2011, on the other hand, there were 380 profitable firms (372 private and 8 public) and 120 unprofitable (115 private and 5 public). As the figures show, despite a slowdown in economic activity in 2012, the number of profitable firms rose while the number of unprofitable firms fell significantly.
Return on Sales (ROS)
The downward trend observed in return on sales in the ISO 500 in the 1990’s reached its lowest level in 2001. In line with positive development in the economy in subsequent years, return on sales again exhibited a relative rising trend, although it never regained its level of the 1990’s.
At 7.2% in the private firms in 2007, return on sales fell to 3.6% in 2008 under the impact of the global crisis. Rising to 5.2% in 2009, in 2010 it climbed further to 5.9%. Due to a slowdown especially in the fourth quarter of 2011 when movement in the exchange rates limited growth in total profit and loss for the period, return on sales dropped to 4.8% in the private companies.
Although growth in production-based sales was lower in 2012 than in 2011, return on sales in the private firms again rose to 5.3% in 2012 due to a 3.4% rise in sales turnover and a 13.3% rise in total profit and loss for the period following a fall on 2011 in financial expenditures and a relative appreciation in the Turkish Lira at year’s end.
Return on Assets (ROA)
Like return on sales, return on assets also showed a relative increase in the private firms in 2012, coming to 6.8%.
Return on Equity (ROE)
Return on equity is 15.9% in the private firms in 2012. At 15.6% in 2011, despite this slight rise in 2012 it remains at an extremely low level compared with its 23.3% in 2002.
Economic Profit
The ratio of the net value added generated by a firm to its total assets is called economic profit. Economic profit shows the contribution a
ASSESSMENT
•43•
ASSESSMENT
firm makes to the economy in the form of net value added in return for its equity capital and external loans.
Rising to 14.1% and 14.2% during the economically good years of 2010 and 2011, this ratio fell to 13.6% in 2012 in line with a relative slowdown in the economy. In 2009 it was was at its lowest since 2001.
Manufacturing’s share in GDP at current prices, which was 23.9% in 1998, has contracted by 34.7% over the last 14 years to 15.6% in 2012. The erosion in economic profit observed in the ISO 500 private firms is thought to have played a key role in the decline.
Asset Turnover Ratio
Used as a measure of financial efficiency and productivity of the business, the asset turnover ratio is derived by taking the ratio of sales turnover to total assets. Around 1.60 in the private firms in the 1990’s, the asset turnover ratio fell to 1.24 in crisis year 2001. Increasing relatively up to 2006, it rose to 1.42 in that year, only to fall again to 1.17 in 2009. In 2010 it was 1.20 and in 2011 1.34. In 2012, a sluggish year for the economy, it fell again to 1.28.
Equity Turnover Ratio
The equity turnover ratio in the private manufacturing firms is 3.25 in 2012, down slightly from 3.43 in 2011.
Working Capital Turnover Ratio
The working capital turnover ratio is 2.36 in the private manufacturing firms in 2012, unchanged on 2011.
The Functional Distribution of Net Value Added as Factor Incomes
The functional distribution of factor incomes has been given in the ISO 500 survey for the last thirty years since 1982. It has exhibited no significant change during that period.
In 2012 the share of wages and salaries in the distribution of net value added rose by 4.6 points on 2011 to 55%.
Interest paid on the other hand was little changed on 2011, falling by only 0.1 of a point to 9.6%. Entrepreneurial profit however was down by 4.5 points from 39.9% in 2011 to 35.4% in 2012.
In the private industrial firms, wages and salaries made up 53.7% of factor incomes, an increase of 4.5 points on 2011. While the share of interest paid was unchanged, that of entrepreneurial profit declined by 4.5 points to 35.7%.
Non-Operating Revenues
An effort is made in the ISO 500 survey to calculate the value added generated by the firms as a result of their production activities. This is figured by the net value added approach, in other words by adding up the factor incomes paid by the companies.
While figures for wages and salaries paid as full compensation as well as for interest paid are obtained directly from the firms surveyed, entrepreneurial profit, which is another component of factor income, has to be calculated.
For this purpose, non-operating revenues (items such as dividend income, interest income, foreign exchange gains, property or asset sales, etc) are subtracted from the firms’ revenues.
In crisis year 2001, non-operating revenues made up a hefty 647% of total profit and loss for the period in the private firms. In 2011 this fell to its lowest level ever at 22.7%. In 2012, however, it is up again to 39.3%, its highest since the crisis year 2009.
With a 95.9% increase, non-operating revenues in 2012 showed their highest growth since 2001. Increasing by 13.3% as a share of total profit and loss for the period in the private sector in the same year, they decreased by 11.2% as a share of profit earned from production activities.
Employment, Distribution of Gross Value Added, and Relative Output RatiosFood, Beverages and Tobacco claimed the lion’s share of wage workers among ISO 500 firms operating in Turkey’s manufacturing industry in 2012 with 21.7%. This represents a slight gain on the same sector’s top place share of 20.1% in 2011.
In second place by employment distribution is the Metal Products, Machinery and Equipment, and Professional Instruments industry with 16.1%, followed by Motor Vehicles in third with 15%.
A look back to 1982 shows that this year’s first place Food, Beverage and Tobacco industry was in second place by employment distribution with a 19.7% share. This indicates that there has been no significant change in the distribution of employment in Turkish manufacturing in the last thirty years.
With a 37.6% share, the Chemicals, Petroleum Products, Rubber and Plastics industry is in first place in 2012 by value added generated at producer prices among ISO 500 manufacturing firms operating in Turkey. This sector was number one in 2011 as well with 42%.
It was also in first place thirty years ago when its share was 26%. In second place in 2012 is Food, Beverages and Tobacco with a 29.3% share.
This sector also placed second in 2011 with 24.3%. In 1982, on the other hand, it was in fourth place with 14%.
As the percentages make clear, despite its overwhelming weight in the Turkish manufacturing industry, there has been little positive structural change in the ISO 500 in the last thirty years.
Labor Productivity (Net Value Added / Number of Wage Employees)Labor productivity is derived by taking the ratio of net value added generated to the number of employees to arrive at net value added per employee.
In the survey, labor productivity is calculated for each sector by 3-digit code (ISIC Rev. 2). Based on these calculations, labor productivity in manufacturing appears to have dropped sharply by 8.9% in 2012 following a fall of 1% in 2011.
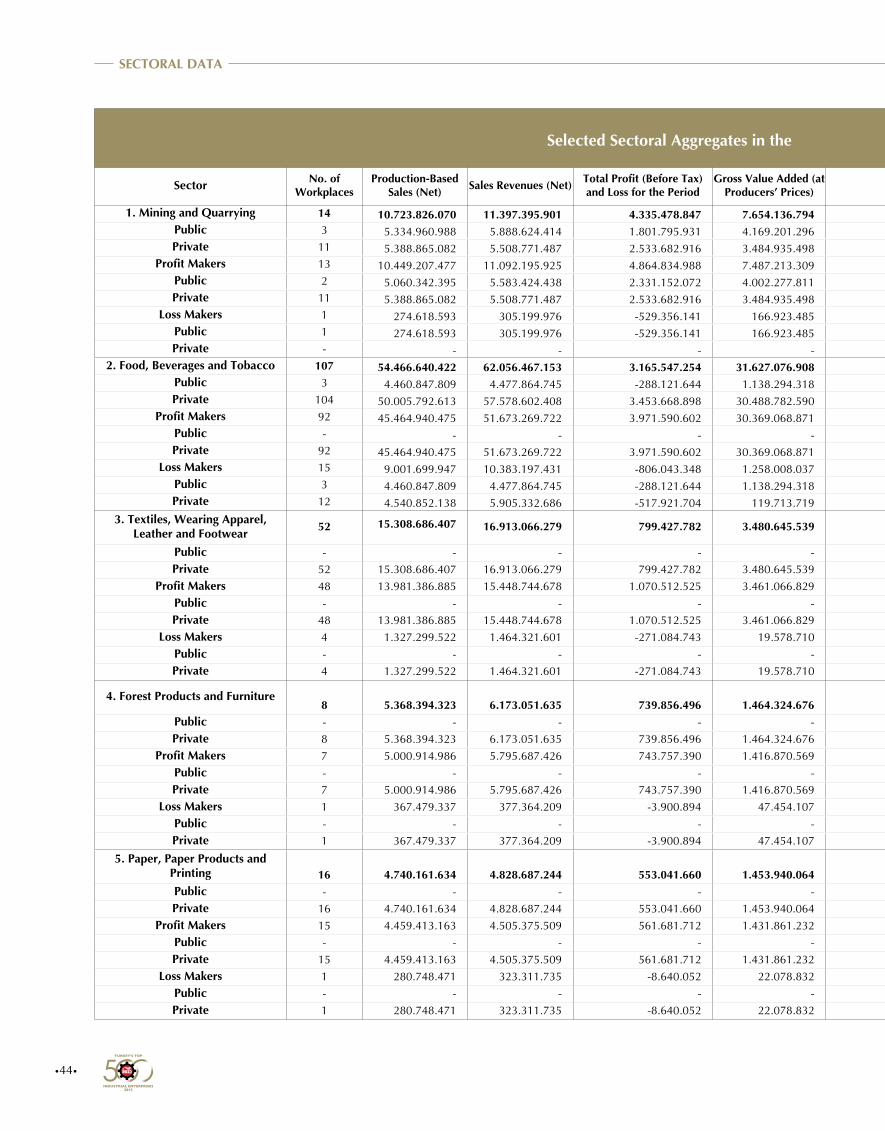
•44•
Sector No. of Workplaces
Production-Based Sales (Net) Sales Revenues (Net) Total Profit (Before Tax)
and Loss for the PeriodGross Value Added (at
Producers’ Prices) Total Debt Equity Capital Total Assets Tangible Fixed Assets Revolving Assets Average No. of Wage Employees
1. Mining and Quarrying 14 10.723.826.070 11.397.395.901 4.335.478.847 7.654.136.794 3.301.296.875 16.153.148.248 19.454.445.125 3.963.006.678 11.206.685.510 35.586Public 3 5.334.960.988 5.888.624.414 1.801.795.931 4.169.201.296 1.727.768.409 9.753.286.452 11.481.054.861 1.993.128.918 7.291.958.889 24.070Private 11 5.388.865.082 5.508.771.487 2.533.682.916 3.484.935.498 1.573.528.466 6.399.861.796 7.973.390.264 1.969.877.760 3.914.726.621 11.516
Profit Makers 13 10.449.207.477 11.092.195.925 4.864.834.988 7.487.213.309 3.149.403.401 15.766.128.228 18.915.531.633 3.680.978.141 11.000.220.831 23.638Public 2 5.060.342.395 5.583.424.438 2.331.152.072 4.002.277.811 1.575.874.935 9.366.266.432 10.942.141.369 1.711.100.381 7.085.494.210 12.122Private 11 5.388.865.082 5.508.771.487 2.533.682.916 3.484.935.498 1.573.528.466 6.399.861.796 7.973.390.264 1.969.877.760 3.914.726.621 11.516
Loss Makers 1 274.618.593 305.199.976 -529.356.141 166.923.485 151.893.474 387.020.020 538.913.492 282.028.537 206.464.679 11.948Public 1 274.618.593 305.199.976 -529.356.141 166.923.485 151.893.474 387.020.020 538.913.492 282.028.537 206.464.679 11.948Private - - - - - - - - - - -
2. Food, Beverages and Tobacco 107 54.466.640.422 62.056.467.153 3.165.547.254 31.627.076.908 29.238.130.068 25.060.484.710 54.298.614.801 10.349.305.900 32.313.092.293 117.889Public 3 4.460.847.809 4.477.864.745 -288.121.644 1.138.294.318 2.426.936.384 3.127.946.970 5.554.883.354 878.704.682 4.384.176.166 20.353Private 104 50.005.792.613 57.578.602.408 3.453.668.898 30.488.782.590 26.811.193.684 21.932.537.740 48.743.731.447 9.470.601.218 27.928.916.127 97.536
Profit Makers 92 45.464.940.475 51.673.269.722 3.971.590.602 30.369.068.871 23.500.526.531 20.165.509.416 43.666.035.970 8.573.645.682 25.257.540.619 86.842Public - - - - - - - - - - -Private 92 45.464.940.475 51.673.269.722 3.971.590.602 30.369.068.871 23.500.526.531 20.165.509.416 43.666.035.970 8.573.645.682 25.257.540.619 86.842
Loss Makers 15 9.001.699.947 10.383.197.431 -806.043.348 1.258.008.037 5.737.603.537 4.894.975.294 10.632.578.831 1.775.660.218 7.055.551.674 31.047Public 3 4.460.847.809 4.477.864.745 -288.121.644 1.138.294.318 2.426.936.384 3.127.946.970 5.554.883.354 878.704.682 4.384.176.166 20.353Private 12 4.540.852.138 5.905.332.686 -517.921.704 119.713.719 3.310.667.153 1.767.028.324 5.077.695.477 896.955.536 2.671.375.508 10.694
3. Textiles, Wearing Apparel, Leather and Footwear
52 15.308.686.407 16.913.066.279 799.427.782 3.480.645.539 10.408.755.045 10.033.374.247 20.442.129.271 4.490.960.316 11.731.981.515 81.072
Public - - - - - - - - - - -Private 52 15.308.686.407 16.913.066.279 799.427.782 3.480.645.539 10.408.755.045 10.033.374.247 20.442.129.271 4.490.960.316 11.731.981.515 81.072
Profit Makers 48 13.981.386.885 15.448.744.678 1.070.512.525 3.461.066.829 8.570.870.307 9.832.127.192 18.402.997.480 4.295.635.637 10.669.162.906 73.120Public - - - - - - - - - - -Private 48 13.981.386.885 15.448.744.678 1.070.512.525 3.461.066.829 8.570.870.307 9.832.127.192 18.402.997.480 4.295.635.637 10.669.162.906 73.120
Loss Makers 4 1.327.299.522 1.464.321.601 -271.084.743 19.578.710 1.837.884.738 201.247.055 2.039.131.791 195.324.679 1.062.818.609 7.952Public - - - - - - - - - - -Private 4 1.327.299.522 1.464.321.601 -271.084.743 19.578.710 1.837.884.738 201.247.055 2.039.131.791 195.324.679 1.062.818.609 7.952
4. Forest Products and Furniture8 5.368.394.323 6.173.051.635 739.856.496 1.464.324.676 4.068.297.523 3.311.482.435 7.379.779.957 2.237.499.849 4.234.548.365 12.314
Public - - - - - - - - - - -Private 8 5.368.394.323 6.173.051.635 739.856.496 1.464.324.676 4.068.297.523 3.311.482.435 7.379.779.957 2.237.499.849 4.234.548.365 12.314
Profit Makers 7 5.000.914.986 5.795.687.426 743.757.390 1.416.870.569 3.581.174.234 3.046.507.917 6.627.682.149 1.765.069.521 3.995.562.311 11.635Public - - - - - - - - - - -Private 7 5.000.914.986 5.795.687.426 743.757.390 1.416.870.569 3.581.174.234 3.046.507.917 6.627.682.149 1.765.069.521 3.995.562.311 11.635
Loss Makers 1 367.479.337 377.364.209 -3.900.894 47.454.107 487.123.289 264.974.518 752.097.808 472.430.328 238.986.054 679Public - - - - - - - - - - -Private 1 367.479.337 377.364.209 -3.900.894 47.454.107 487.123.289 264.974.518 752.097.808 472.430.328 238.986.054 679
5. Paper, Paper Products and Printing 16 4.740.161.634 4.828.687.244 553.041.660 1.453.940.064 1.908.656.427 3.339.053.322 5.247.709.747 1.566.539.280 2.545.178.408 9.590Public - - - - - - - - - - -Private 16 4.740.161.634 4.828.687.244 553.041.660 1.453.940.064 1.908.656.427 3.339.053.322 5.247.709.747 1.566.539.280 2.545.178.408 9.590
Profit Makers 15 4.459.413.163 4.505.375.509 561.681.712 1.431.861.232 1.834.486.172 3.253.238.418 5.087.724.589 1.535.620.513 2.424.055.294 9.071Public - - - - - - - - - - -Private 15 4.459.413.163 4.505.375.509 561.681.712 1.431.861.232 1.834.486.172 3.253.238.418 5.087.724.589 1.535.620.513 2.424.055.294 9.071
Loss Makers 1 280.748.471 323.311.735 -8.640.052 22.078.832 74.170.255 85.814.904 159.985.158 30.918.767 121.123.114 519Public - - - - - - - - - - -Private 1 280.748.471 323.311.735 -8.640.052 22.078.832 74.170.255 85.814.904 159.985.158 30.918.767 121.123.114 519
SECTORAL DATA
Selected Sectoral Aggregates in the
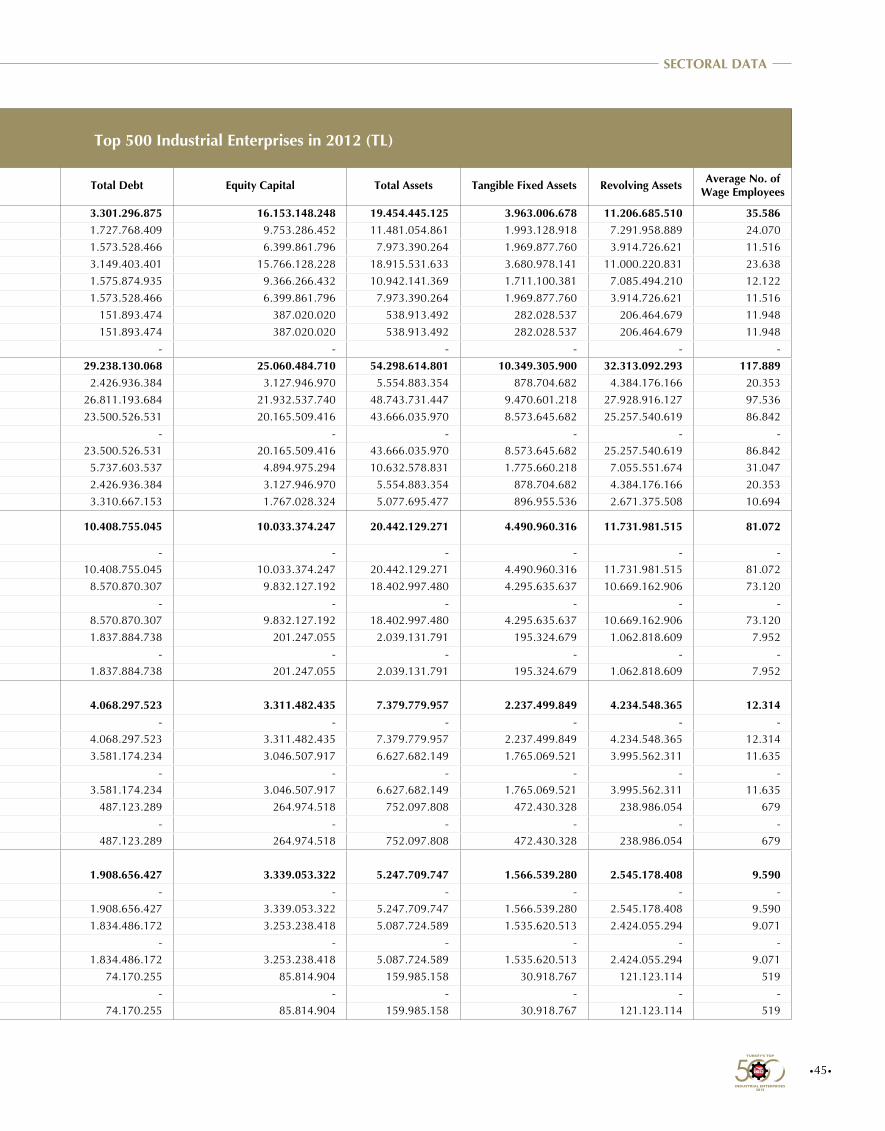
•45•
Sector No. of Workplaces
Production-Based Sales (Net) Sales Revenues (Net) Total Profit (Before Tax)
and Loss for the PeriodGross Value Added (at
Producers’ Prices) Total Debt Equity Capital Total Assets Tangible Fixed Assets Revolving Assets Average No. of Wage Employees
1. Mining and Quarrying 14 10.723.826.070 11.397.395.901 4.335.478.847 7.654.136.794 3.301.296.875 16.153.148.248 19.454.445.125 3.963.006.678 11.206.685.510 35.586Public 3 5.334.960.988 5.888.624.414 1.801.795.931 4.169.201.296 1.727.768.409 9.753.286.452 11.481.054.861 1.993.128.918 7.291.958.889 24.070Private 11 5.388.865.082 5.508.771.487 2.533.682.916 3.484.935.498 1.573.528.466 6.399.861.796 7.973.390.264 1.969.877.760 3.914.726.621 11.516
Profit Makers 13 10.449.207.477 11.092.195.925 4.864.834.988 7.487.213.309 3.149.403.401 15.766.128.228 18.915.531.633 3.680.978.141 11.000.220.831 23.638Public 2 5.060.342.395 5.583.424.438 2.331.152.072 4.002.277.811 1.575.874.935 9.366.266.432 10.942.141.369 1.711.100.381 7.085.494.210 12.122Private 11 5.388.865.082 5.508.771.487 2.533.682.916 3.484.935.498 1.573.528.466 6.399.861.796 7.973.390.264 1.969.877.760 3.914.726.621 11.516
Loss Makers 1 274.618.593 305.199.976 -529.356.141 166.923.485 151.893.474 387.020.020 538.913.492 282.028.537 206.464.679 11.948Public 1 274.618.593 305.199.976 -529.356.141 166.923.485 151.893.474 387.020.020 538.913.492 282.028.537 206.464.679 11.948Private - - - - - - - - - - -
2. Food, Beverages and Tobacco 107 54.466.640.422 62.056.467.153 3.165.547.254 31.627.076.908 29.238.130.068 25.060.484.710 54.298.614.801 10.349.305.900 32.313.092.293 117.889Public 3 4.460.847.809 4.477.864.745 -288.121.644 1.138.294.318 2.426.936.384 3.127.946.970 5.554.883.354 878.704.682 4.384.176.166 20.353Private 104 50.005.792.613 57.578.602.408 3.453.668.898 30.488.782.590 26.811.193.684 21.932.537.740 48.743.731.447 9.470.601.218 27.928.916.127 97.536
Profit Makers 92 45.464.940.475 51.673.269.722 3.971.590.602 30.369.068.871 23.500.526.531 20.165.509.416 43.666.035.970 8.573.645.682 25.257.540.619 86.842Public - - - - - - - - - - -Private 92 45.464.940.475 51.673.269.722 3.971.590.602 30.369.068.871 23.500.526.531 20.165.509.416 43.666.035.970 8.573.645.682 25.257.540.619 86.842
Loss Makers 15 9.001.699.947 10.383.197.431 -806.043.348 1.258.008.037 5.737.603.537 4.894.975.294 10.632.578.831 1.775.660.218 7.055.551.674 31.047Public 3 4.460.847.809 4.477.864.745 -288.121.644 1.138.294.318 2.426.936.384 3.127.946.970 5.554.883.354 878.704.682 4.384.176.166 20.353Private 12 4.540.852.138 5.905.332.686 -517.921.704 119.713.719 3.310.667.153 1.767.028.324 5.077.695.477 896.955.536 2.671.375.508 10.694
3. Textiles, Wearing Apparel, Leather and Footwear
52 15.308.686.407 16.913.066.279 799.427.782 3.480.645.539 10.408.755.045 10.033.374.247 20.442.129.271 4.490.960.316 11.731.981.515 81.072
Public - - - - - - - - - - -Private 52 15.308.686.407 16.913.066.279 799.427.782 3.480.645.539 10.408.755.045 10.033.374.247 20.442.129.271 4.490.960.316 11.731.981.515 81.072
Profit Makers 48 13.981.386.885 15.448.744.678 1.070.512.525 3.461.066.829 8.570.870.307 9.832.127.192 18.402.997.480 4.295.635.637 10.669.162.906 73.120Public - - - - - - - - - - -Private 48 13.981.386.885 15.448.744.678 1.070.512.525 3.461.066.829 8.570.870.307 9.832.127.192 18.402.997.480 4.295.635.637 10.669.162.906 73.120
Loss Makers 4 1.327.299.522 1.464.321.601 -271.084.743 19.578.710 1.837.884.738 201.247.055 2.039.131.791 195.324.679 1.062.818.609 7.952Public - - - - - - - - - - -Private 4 1.327.299.522 1.464.321.601 -271.084.743 19.578.710 1.837.884.738 201.247.055 2.039.131.791 195.324.679 1.062.818.609 7.952
4. Forest Products and Furniture8 5.368.394.323 6.173.051.635 739.856.496 1.464.324.676 4.068.297.523 3.311.482.435 7.379.779.957 2.237.499.849 4.234.548.365 12.314
Public - - - - - - - - - - -Private 8 5.368.394.323 6.173.051.635 739.856.496 1.464.324.676 4.068.297.523 3.311.482.435 7.379.779.957 2.237.499.849 4.234.548.365 12.314
Profit Makers 7 5.000.914.986 5.795.687.426 743.757.390 1.416.870.569 3.581.174.234 3.046.507.917 6.627.682.149 1.765.069.521 3.995.562.311 11.635Public - - - - - - - - - - -Private 7 5.000.914.986 5.795.687.426 743.757.390 1.416.870.569 3.581.174.234 3.046.507.917 6.627.682.149 1.765.069.521 3.995.562.311 11.635
Loss Makers 1 367.479.337 377.364.209 -3.900.894 47.454.107 487.123.289 264.974.518 752.097.808 472.430.328 238.986.054 679Public - - - - - - - - - - -Private 1 367.479.337 377.364.209 -3.900.894 47.454.107 487.123.289 264.974.518 752.097.808 472.430.328 238.986.054 679
5. Paper, Paper Products and Printing 16 4.740.161.634 4.828.687.244 553.041.660 1.453.940.064 1.908.656.427 3.339.053.322 5.247.709.747 1.566.539.280 2.545.178.408 9.590Public - - - - - - - - - - -Private 16 4.740.161.634 4.828.687.244 553.041.660 1.453.940.064 1.908.656.427 3.339.053.322 5.247.709.747 1.566.539.280 2.545.178.408 9.590
Profit Makers 15 4.459.413.163 4.505.375.509 561.681.712 1.431.861.232 1.834.486.172 3.253.238.418 5.087.724.589 1.535.620.513 2.424.055.294 9.071Public - - - - - - - - - - -Private 15 4.459.413.163 4.505.375.509 561.681.712 1.431.861.232 1.834.486.172 3.253.238.418 5.087.724.589 1.535.620.513 2.424.055.294 9.071
Loss Makers 1 280.748.471 323.311.735 -8.640.052 22.078.832 74.170.255 85.814.904 159.985.158 30.918.767 121.123.114 519Public - - - - - - - - - - -Private 1 280.748.471 323.311.735 -8.640.052 22.078.832 74.170.255 85.814.904 159.985.158 30.918.767 121.123.114 519
SECTORAL DATA
Top 500 Industrial Enterprises in 2012 (TL)
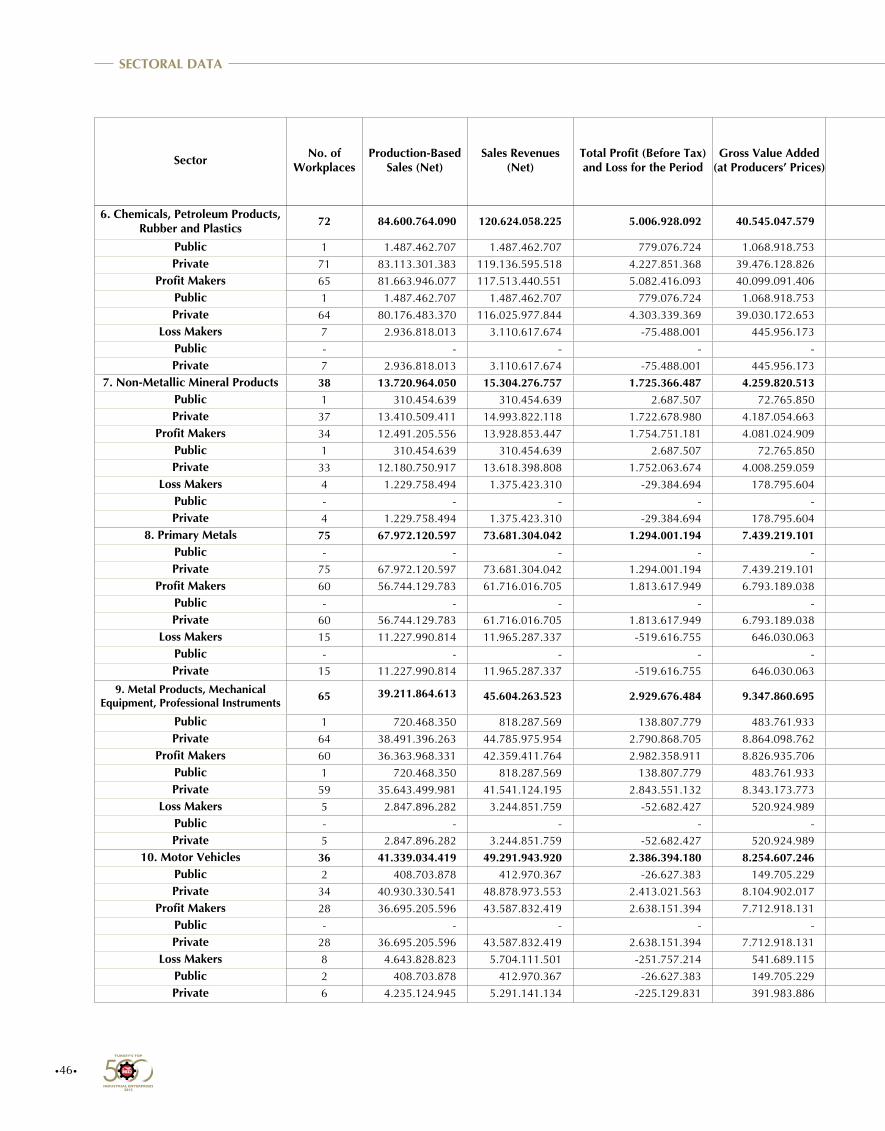
•46•
6. Chemicals, Petroleum Products, Rubber and Plastics
72 84.600.764.090 120.624.058.225 5.006.928.092 40.545.047.579 35.881.079.887 23.387.460.541 59.268.540.442 14.801.468.085 34.982.964.528 63.873
Public 1 1.487.462.707 1.487.462.707 779.076.724 1.068.918.753 206.873.619 1.735.237.771 1.942.111.390 866.798.736 726.806.349 3.754Private 71 83.113.301.383 119.136.595.518 4.227.851.368 39.476.128.826 35.674.206.268 21.652.222.770 57.326.429.052 13.934.669.349 34.256.158.179 60.119
Profit Makers 65 81.663.946.077 117.513.440.551 5.082.416.093 40.099.091.406 34.500.799.520 22.326.270.810 56.827.070.342 14.317.918.256 33.219.467.485 59.318Public 1 1.487.462.707 1.487.462.707 779.076.724 1.068.918.753 206.873.619 1.735.237.771 1.942.111.390 866.798.736 726.806.349 3.754Private 64 80.176.483.370 116.025.977.844 4.303.339.369 39.030.172.653 34.293.925.901 20.591.033.039 54.884.958.952 13.451.119.520 32.492.661.136 55.564
Loss Makers 7 2.936.818.013 3.110.617.674 -75.488.001 445.956.173 1.380.280.367 1.061.189.731 2.441.470.100 483.549.829 1.763.497.043 4.555Public - - - - - - - - - - -Private 7 2.936.818.013 3.110.617.674 -75.488.001 445.956.173 1.380.280.367 1.061.189.731 2.441.470.100 483.549.829 1.763.497.043 4.555
7. Non-Metallic Mineral Products 38 13.720.964.050 15.304.276.757 1.725.366.487 4.259.820.513 11.330.627.303 11.416.891.316 22.747.518.623 8.301.545.085 9.617.609.469 29.341Public 1 310.454.639 310.454.639 2.687.507 72.765.850 553.373.954 75.353.003 628.726.955 16.972.107 600.498.031 378Private 37 13.410.509.411 14.993.822.118 1.722.678.980 4.187.054.663 10.777.253.349 11.341.538.313 22.118.791.668 8.284.572.978 9.017.111.438 28.963
Profit Makers 34 12.491.205.556 13.928.853.447 1.754.751.181 4.081.024.909 9.081.907.685 10.989.904.988 20.071.812.678 7.357.088.386 8.743.849.851 26.288Public 1 310.454.639 310.454.639 2.687.507 72.765.850 553.373.954 75.353.003 628.726.955 16.972.107 600.498.031 378Private 33 12.180.750.917 13.618.398.808 1.752.063.674 4.008.259.059 8.528.533.731 10.914.551.985 19.443.085.723 7.340.116.279 8.143.351.820 25.910
Loss Makers 4 1.229.758.494 1.375.423.310 -29.384.694 178.795.604 2.248.719.618 426.986.328 2.675.705.945 944.456.699 873.759.618 3.053Public - - - - - - - - - - -Private 4 1.229.758.494 1.375.423.310 -29.384.694 178.795.604 2.248.719.618 426.986.328 2.675.705.945 944.456.699 873.759.618 3.053
8. Primary Metals 75 67.972.120.597 73.681.304.042 1.294.001.194 7.439.219.101 33.130.972.131 21.418.600.463 54.549.572.601 19.647.387.092 28.534.392.817 59.384Public - - - - - - - - - - -Private 75 67.972.120.597 73.681.304.042 1.294.001.194 7.439.219.101 33.130.972.131 21.418.600.463 54.549.572.601 19.647.387.092 28.534.392.817 59.384
Profit Makers 60 56.744.129.783 61.716.016.705 1.813.617.949 6.793.189.038 25.870.896.209 19.523.218.979 45.394.115.187 15.686.938.818 24.166.595.616 49.052Public - - - - - - - - - - -Private 60 56.744.129.783 61.716.016.705 1.813.617.949 6.793.189.038 25.870.896.209 19.523.218.979 45.394.115.187 15.686.938.818 24.166.595.616 49.052
Loss Makers 15 11.227.990.814 11.965.287.337 -519.616.755 646.030.063 7.260.075.922 1.895.381.484 9.155.457.414 3.960.448.274 4.367.797.201 10.332Public - - - - - - - - - - -Private 15 11.227.990.814 11.965.287.337 -519.616.755 646.030.063 7.260.075.922 1.895.381.484 9.155.457.414 3.960.448.274 4.367.797.201 10.332
9. Metal Products, Mechanical Equipment, Professional Instruments 65 39.211.864.613 45.604.263.523 2.929.676.484 9.347.860.695 25.656.239.370 15.893.316.970 41.549.556.344 6.350.873.424 29.280.259.446 87.826
Public 1 720.468.350 818.287.569 138.807.779 483.761.933 739.618.709 822.966.665 1.562.585.373 465.479.851 1.000.284.018 5.574Private 64 38.491.396.263 44.785.975.954 2.790.868.705 8.864.098.762 24.916.620.661 15.070.350.305 39.986.970.971 5.885.393.573 28.279.975.428 82.252
Profit Makers 60 36.363.968.331 42.359.411.764 2.982.358.911 8.826.935.706 24.055.752.779 15.202.143.910 39.257.896.695 5.923.410.235 27.557.541.089 80.508Public 1 720.468.350 818.287.569 138.807.779 483.761.933 739.618.709 822.966.665 1.562.585.373 465.479.851 1.000.284.018 5.574Private 59 35.643.499.981 41.541.124.195 2.843.551.132 8.343.173.773 23.316.134.070 14.379.177.245 37.695.311.322 5.457.930.384 26.557.257.071 74.934
Loss Makers 5 2.847.896.282 3.244.851.759 -52.682.427 520.924.989 1.600.486.591 691.173.060 2.291.659.649 427.463.189 1.722.718.357 7.318Public - - - - - - - - - - -Private 5 2.847.896.282 3.244.851.759 -52.682.427 520.924.989 1.600.486.591 691.173.060 2.291.659.649 427.463.189 1.722.718.357 7.318
10. Motor Vehicles 36 41.339.034.419 49.291.943.920 2.386.394.180 8.254.607.246 17.863.965.078 11.361.473.175 29.225.438.254 8.608.103.599 18.416.425.085 81.649Public 2 408.703.878 412.970.367 -26.627.383 149.705.229 404.544.571 204.062.601 608.607.173 99.278.313 497.422.542 2.560Private 34 40.930.330.541 48.878.973.553 2.413.021.563 8.104.902.017 17.459.420.507 11.157.410.574 28.616.831.081 8.508.825.286 17.919.002.543 79.089
Profit Makers 28 36.695.205.596 43.587.832.419 2.638.151.394 7.712.918.131 14.956.924.133 9.755.830.688 24.712.754.821 7.406.296.099 15.330.296.118 69.090Public - - - - - - - - - - -Private 28 36.695.205.596 43.587.832.419 2.638.151.394 7.712.918.131 14.956.924.133 9.755.830.688 24.712.754.821 7.406.296.099 15.330.296.118 69.090
Loss Makers 8 4.643.828.823 5.704.111.501 -251.757.214 541.689.115 2.907.040.945 1.605.642.487 4.512.683.433 1.201.807.500 3.086.128.967 12.559Public 2 408.703.878 412.970.367 -26.627.383 149.705.229 404.544.571 204.062.601 608.607.173 99.278.313 497.422.542 2.560Private 6 4.235.124.945 5.291.141.134 -225.129.831 391.983.886 2.502.496.374 1.401.579.886 3.904.076.260 1.102.529.187 2.588.706.425 9.999
Sector No. of Workplaces
Production-Based Sales (Net)
Sales Revenues (Net)
Total Profit (Before Tax) and Loss for the Period
Gross Value Added (at Producers’ Prices) Total Debt Equity Capital Total Assets Tangible Fixed Assets Revolving Assets Average No. of
Wage Employees
SECTORAL DATA
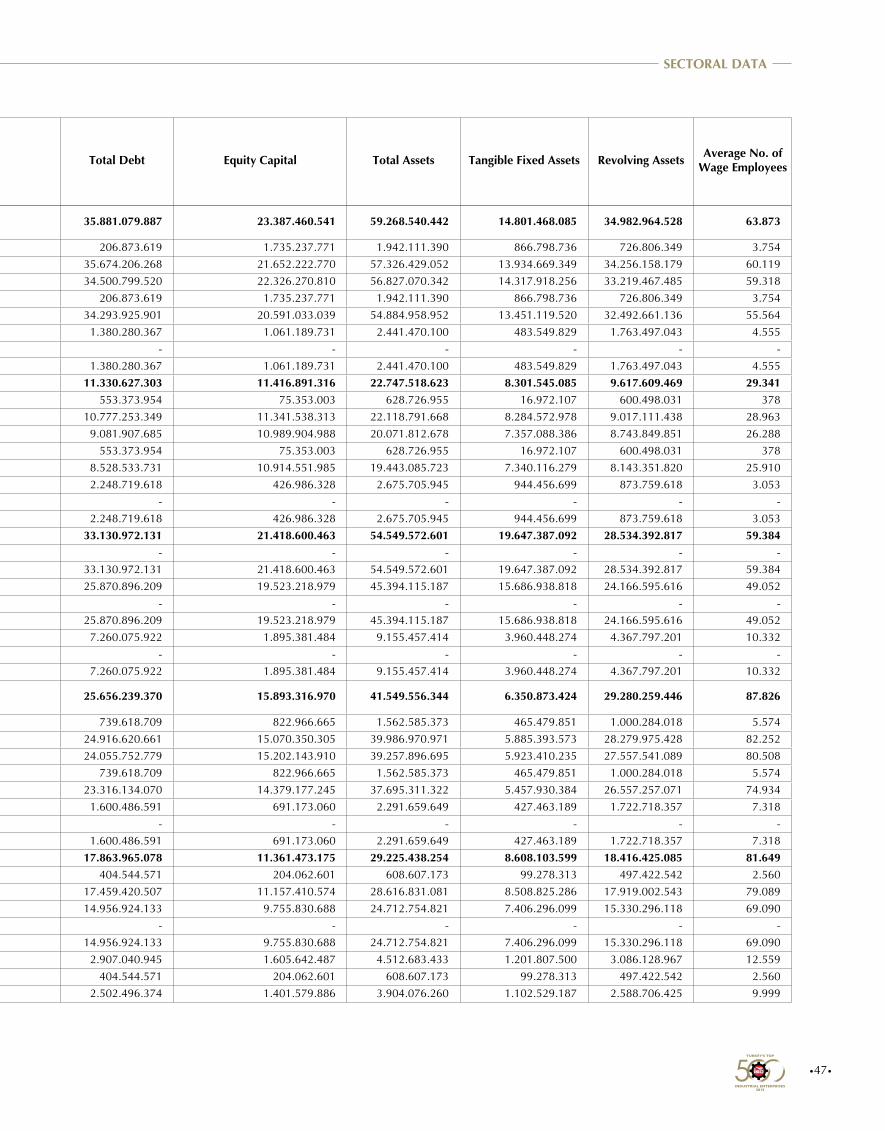
•47•
6. Chemicals, Petroleum Products, Rubber and Plastics
72 84.600.764.090 120.624.058.225 5.006.928.092 40.545.047.579 35.881.079.887 23.387.460.541 59.268.540.442 14.801.468.085 34.982.964.528 63.873
Public 1 1.487.462.707 1.487.462.707 779.076.724 1.068.918.753 206.873.619 1.735.237.771 1.942.111.390 866.798.736 726.806.349 3.754Private 71 83.113.301.383 119.136.595.518 4.227.851.368 39.476.128.826 35.674.206.268 21.652.222.770 57.326.429.052 13.934.669.349 34.256.158.179 60.119
Profit Makers 65 81.663.946.077 117.513.440.551 5.082.416.093 40.099.091.406 34.500.799.520 22.326.270.810 56.827.070.342 14.317.918.256 33.219.467.485 59.318Public 1 1.487.462.707 1.487.462.707 779.076.724 1.068.918.753 206.873.619 1.735.237.771 1.942.111.390 866.798.736 726.806.349 3.754Private 64 80.176.483.370 116.025.977.844 4.303.339.369 39.030.172.653 34.293.925.901 20.591.033.039 54.884.958.952 13.451.119.520 32.492.661.136 55.564
Loss Makers 7 2.936.818.013 3.110.617.674 -75.488.001 445.956.173 1.380.280.367 1.061.189.731 2.441.470.100 483.549.829 1.763.497.043 4.555Public - - - - - - - - - - -Private 7 2.936.818.013 3.110.617.674 -75.488.001 445.956.173 1.380.280.367 1.061.189.731 2.441.470.100 483.549.829 1.763.497.043 4.555
7. Non-Metallic Mineral Products 38 13.720.964.050 15.304.276.757 1.725.366.487 4.259.820.513 11.330.627.303 11.416.891.316 22.747.518.623 8.301.545.085 9.617.609.469 29.341Public 1 310.454.639 310.454.639 2.687.507 72.765.850 553.373.954 75.353.003 628.726.955 16.972.107 600.498.031 378Private 37 13.410.509.411 14.993.822.118 1.722.678.980 4.187.054.663 10.777.253.349 11.341.538.313 22.118.791.668 8.284.572.978 9.017.111.438 28.963
Profit Makers 34 12.491.205.556 13.928.853.447 1.754.751.181 4.081.024.909 9.081.907.685 10.989.904.988 20.071.812.678 7.357.088.386 8.743.849.851 26.288Public 1 310.454.639 310.454.639 2.687.507 72.765.850 553.373.954 75.353.003 628.726.955 16.972.107 600.498.031 378Private 33 12.180.750.917 13.618.398.808 1.752.063.674 4.008.259.059 8.528.533.731 10.914.551.985 19.443.085.723 7.340.116.279 8.143.351.820 25.910
Loss Makers 4 1.229.758.494 1.375.423.310 -29.384.694 178.795.604 2.248.719.618 426.986.328 2.675.705.945 944.456.699 873.759.618 3.053Public - - - - - - - - - - -Private 4 1.229.758.494 1.375.423.310 -29.384.694 178.795.604 2.248.719.618 426.986.328 2.675.705.945 944.456.699 873.759.618 3.053
8. Primary Metals 75 67.972.120.597 73.681.304.042 1.294.001.194 7.439.219.101 33.130.972.131 21.418.600.463 54.549.572.601 19.647.387.092 28.534.392.817 59.384Public - - - - - - - - - - -Private 75 67.972.120.597 73.681.304.042 1.294.001.194 7.439.219.101 33.130.972.131 21.418.600.463 54.549.572.601 19.647.387.092 28.534.392.817 59.384
Profit Makers 60 56.744.129.783 61.716.016.705 1.813.617.949 6.793.189.038 25.870.896.209 19.523.218.979 45.394.115.187 15.686.938.818 24.166.595.616 49.052Public - - - - - - - - - - -Private 60 56.744.129.783 61.716.016.705 1.813.617.949 6.793.189.038 25.870.896.209 19.523.218.979 45.394.115.187 15.686.938.818 24.166.595.616 49.052
Loss Makers 15 11.227.990.814 11.965.287.337 -519.616.755 646.030.063 7.260.075.922 1.895.381.484 9.155.457.414 3.960.448.274 4.367.797.201 10.332Public - - - - - - - - - - -Private 15 11.227.990.814 11.965.287.337 -519.616.755 646.030.063 7.260.075.922 1.895.381.484 9.155.457.414 3.960.448.274 4.367.797.201 10.332
9. Metal Products, Mechanical Equipment, Professional Instruments 65 39.211.864.613 45.604.263.523 2.929.676.484 9.347.860.695 25.656.239.370 15.893.316.970 41.549.556.344 6.350.873.424 29.280.259.446 87.826
Public 1 720.468.350 818.287.569 138.807.779 483.761.933 739.618.709 822.966.665 1.562.585.373 465.479.851 1.000.284.018 5.574Private 64 38.491.396.263 44.785.975.954 2.790.868.705 8.864.098.762 24.916.620.661 15.070.350.305 39.986.970.971 5.885.393.573 28.279.975.428 82.252
Profit Makers 60 36.363.968.331 42.359.411.764 2.982.358.911 8.826.935.706 24.055.752.779 15.202.143.910 39.257.896.695 5.923.410.235 27.557.541.089 80.508Public 1 720.468.350 818.287.569 138.807.779 483.761.933 739.618.709 822.966.665 1.562.585.373 465.479.851 1.000.284.018 5.574Private 59 35.643.499.981 41.541.124.195 2.843.551.132 8.343.173.773 23.316.134.070 14.379.177.245 37.695.311.322 5.457.930.384 26.557.257.071 74.934
Loss Makers 5 2.847.896.282 3.244.851.759 -52.682.427 520.924.989 1.600.486.591 691.173.060 2.291.659.649 427.463.189 1.722.718.357 7.318Public - - - - - - - - - - -Private 5 2.847.896.282 3.244.851.759 -52.682.427 520.924.989 1.600.486.591 691.173.060 2.291.659.649 427.463.189 1.722.718.357 7.318
10. Motor Vehicles 36 41.339.034.419 49.291.943.920 2.386.394.180 8.254.607.246 17.863.965.078 11.361.473.175 29.225.438.254 8.608.103.599 18.416.425.085 81.649Public 2 408.703.878 412.970.367 -26.627.383 149.705.229 404.544.571 204.062.601 608.607.173 99.278.313 497.422.542 2.560Private 34 40.930.330.541 48.878.973.553 2.413.021.563 8.104.902.017 17.459.420.507 11.157.410.574 28.616.831.081 8.508.825.286 17.919.002.543 79.089
Profit Makers 28 36.695.205.596 43.587.832.419 2.638.151.394 7.712.918.131 14.956.924.133 9.755.830.688 24.712.754.821 7.406.296.099 15.330.296.118 69.090Public - - - - - - - - - - -Private 28 36.695.205.596 43.587.832.419 2.638.151.394 7.712.918.131 14.956.924.133 9.755.830.688 24.712.754.821 7.406.296.099 15.330.296.118 69.090
Loss Makers 8 4.643.828.823 5.704.111.501 -251.757.214 541.689.115 2.907.040.945 1.605.642.487 4.512.683.433 1.201.807.500 3.086.128.967 12.559Public 2 408.703.878 412.970.367 -26.627.383 149.705.229 404.544.571 204.062.601 608.607.173 99.278.313 497.422.542 2.560Private 6 4.235.124.945 5.291.141.134 -225.129.831 391.983.886 2.502.496.374 1.401.579.886 3.904.076.260 1.102.529.187 2.588.706.425 9.999
Sector No. of Workplaces
Production-Based Sales (Net)
Sales Revenues (Net)
Total Profit (Before Tax) and Loss for the Period
Gross Value Added (at Producers’ Prices) Total Debt Equity Capital Total Assets Tangible Fixed Assets Revolving Assets Average No. of
Wage Employees
SECTORAL DATA
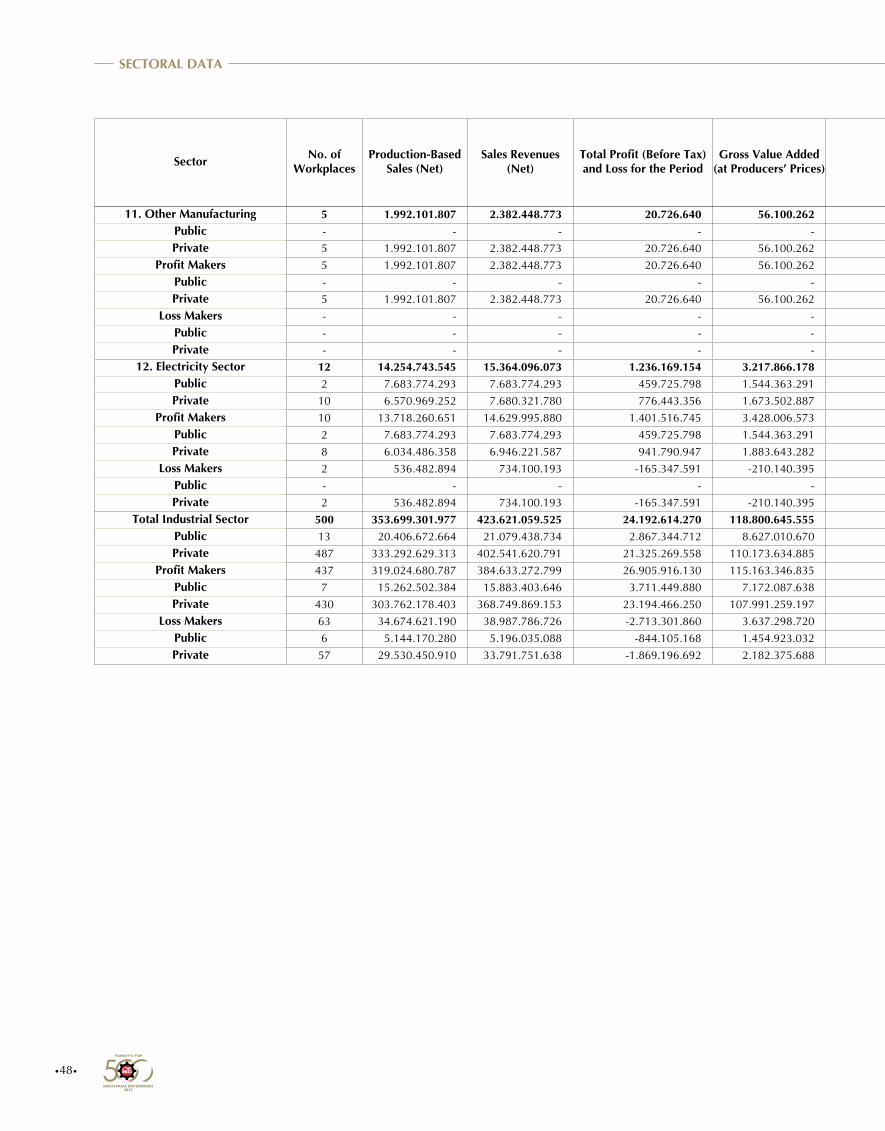
•48•
11. Other Manufacturing 5 1.992.101.807 2.382.448.773 20.726.640 56.100.262 568.895.558 426.910.827 995.806.384 115.837.177 813.737.141 1.478Public - - - - - - - - - - -Private 5 1.992.101.807 2.382.448.773 20.726.640 56.100.262 568.895.558 426.910.827 995.806.384 115.837.177 813.737.141 1.478
Profit Makers 5 1.992.101.807 2.382.448.773 20.726.640 56.100.262 568.895.558 426.910.827 995.806.384 115.837.177 813.737.141 1.478Public - - - - - - - - - - -Private 5 1.992.101.807 2.382.448.773 20.726.640 56.100.262 568.895.558 426.910.827 995.806.384 115.837.177 813.737.141 1.478
Loss Makers - - - - - - - - - - -Public - - - - - - - - - - -Private - - - - - - - - - - -
12. Electricity Sector 12 14.254.743.545 15.364.096.073 1.236.169.154 3.217.866.178 16.591.847.257 27.732.160.909 44.324.008.169 21.823.097.467 17.553.635.064 16.053Public 2 7.683.774.293 7.683.774.293 459.725.798 1.544.363.291 4.190.308.014 19.778.451.626 23.968.759.641 11.536.404.357 11.651.264.416 10.822Private 10 6.570.969.252 7.680.321.780 776.443.356 1.673.502.887 12.401.539.243 7.953.709.283 20.355.248.528 10.286.693.110 5.902.370.648 5.231
Profit Makers 10 13.718.260.651 14.629.995.880 1.401.516.745 3.428.006.573 13.473.014.779 26.707.330.118 40.180.344.900 21.555.161.041 14.852.831.117 15.788Public 2 7.683.774.293 7.683.774.293 459.725.798 1.544.363.291 4.190.308.014 19.778.451.626 23.968.759.641 11.536.404.357 11.651.264.416 10.822Private 8 6.034.486.358 6.946.221.587 941.790.947 1.883.643.282 9.282.706.765 6.928.878.492 16.211.585.259 10.018.756.684 3.201.566.701 4.966
Loss Makers 2 536.482.894 734.100.193 -165.347.591 -210.140.395 3.118.832.478 1.024.830.791 4.143.663.269 267.936.426 2.700.803.947 265Public - - - - - - - - - - -Private 2 536.482.894 734.100.193 -165.347.591 -210.140.395 3.118.832.478 1.024.830.791 4.143.663.269 267.936.426 2.700.803.947 265
Total Industrial Sector 500 353.699.301.977 423.621.059.525 24.192.614.270 118.800.645.555 189.948.762.522 169.534.357.163 359.483.119.718 102.255.623.952 201.230.509.641 596.055Public 13 20.406.672.664 21.079.438.734 2.867.344.712 8.627.010.670 10.249.423.660 35.497.305.088 45.746.728.747 15.856.766.964 26.152.410.411 67.511Private 487 333.292.629.313 402.541.620.791 21.325.269.558 110.173.634.885 179.699.338.862 134.037.052.075 313.736.390.971 86.398.856.988 175.078.099.230 528.544
Profit Makers 437 319.024.680.787 384.633.272.799 26.905.916.130 115.163.346.835 163.144.651.308 156.995.121.491 320.139.772.828 92.213.599.506 178.030.860.378 505.828Public 7 15.262.502.384 15.883.403.646 3.711.449.880 7.172.087.638 7.266.049.231 31.778.275.497 39.044.324.728 14.596.755.432 21.064.347.024 32.650Private 430 303.762.178.403 368.749.869.153 23.194.466.250 107.991.259.197 155.878.602.077 125.216.845.994 281.095.448.100 77.616.844.074 156.966.513.354 473.178
Loss Makers 63 34.674.621.190 38.987.786.726 -2.713.301.860 3.637.298.720 26.804.111.214 12.539.235.672 39.343.346.890 10.042.024.446 23.199.649.263 90.227Public 6 5.144.170.280 5.196.035.088 -844.105.168 1.454.923.032 2.983.374.429 3.719.029.591 6.702.404.019 1.260.011.532 5.088.063.387 34.861Private 57 29.530.450.910 33.791.751.638 -1.869.196.692 2.182.375.688 23.820.736.785 8.820.206.081 32.640.942.871 8.782.012.914 18.111.585.876 55.366
Sector No. of Workplaces
Production-Based Sales (Net)
Sales Revenues (Net)
Total Profit (Before Tax) and Loss for the Period
Gross Value Added (at Producers’ Prices) Total Debt Equity Capital Total Assets Tangible Fixed Assets Revolving Assets Average No. of
Wage Employees
SECTORAL DATA
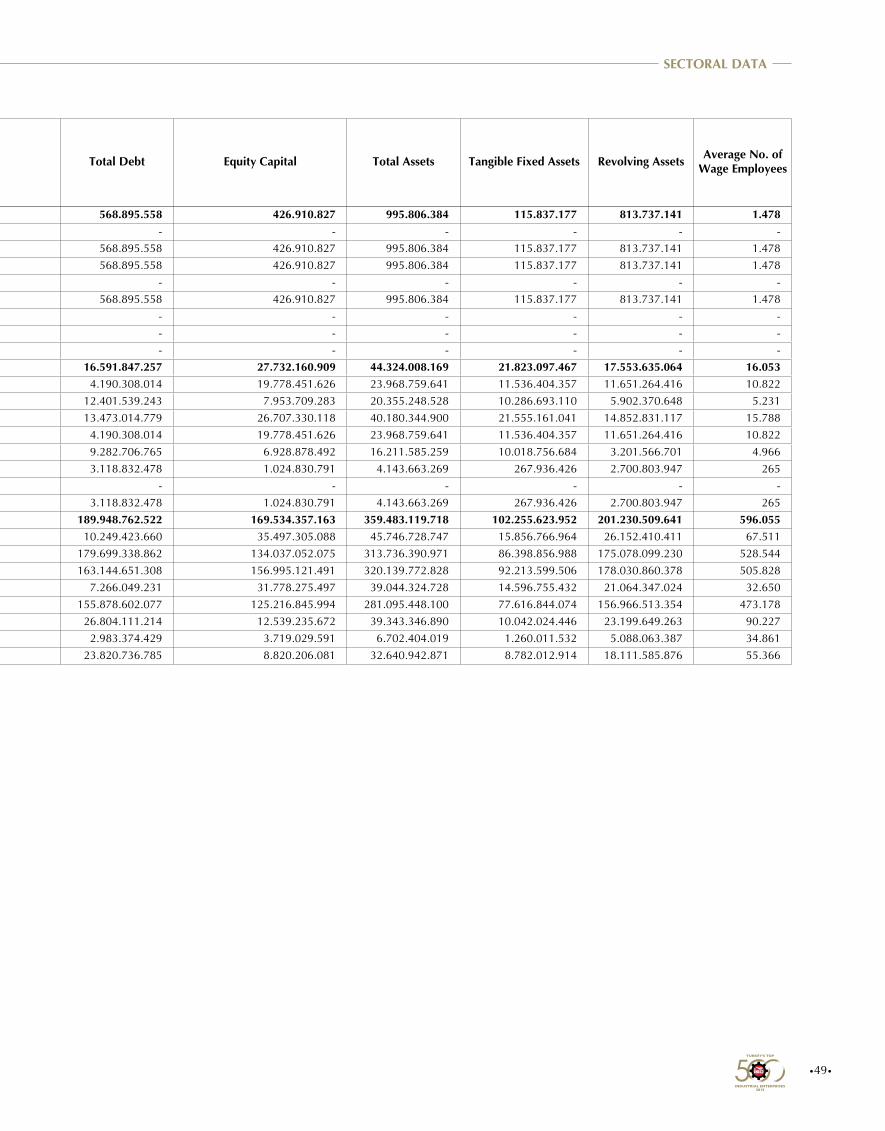
•49•
11. Other Manufacturing 5 1.992.101.807 2.382.448.773 20.726.640 56.100.262 568.895.558 426.910.827 995.806.384 115.837.177 813.737.141 1.478Public - - - - - - - - - - -Private 5 1.992.101.807 2.382.448.773 20.726.640 56.100.262 568.895.558 426.910.827 995.806.384 115.837.177 813.737.141 1.478
Profit Makers 5 1.992.101.807 2.382.448.773 20.726.640 56.100.262 568.895.558 426.910.827 995.806.384 115.837.177 813.737.141 1.478Public - - - - - - - - - - -Private 5 1.992.101.807 2.382.448.773 20.726.640 56.100.262 568.895.558 426.910.827 995.806.384 115.837.177 813.737.141 1.478
Loss Makers - - - - - - - - - - -Public - - - - - - - - - - -Private - - - - - - - - - - -
12. Electricity Sector 12 14.254.743.545 15.364.096.073 1.236.169.154 3.217.866.178 16.591.847.257 27.732.160.909 44.324.008.169 21.823.097.467 17.553.635.064 16.053Public 2 7.683.774.293 7.683.774.293 459.725.798 1.544.363.291 4.190.308.014 19.778.451.626 23.968.759.641 11.536.404.357 11.651.264.416 10.822Private 10 6.570.969.252 7.680.321.780 776.443.356 1.673.502.887 12.401.539.243 7.953.709.283 20.355.248.528 10.286.693.110 5.902.370.648 5.231
Profit Makers 10 13.718.260.651 14.629.995.880 1.401.516.745 3.428.006.573 13.473.014.779 26.707.330.118 40.180.344.900 21.555.161.041 14.852.831.117 15.788Public 2 7.683.774.293 7.683.774.293 459.725.798 1.544.363.291 4.190.308.014 19.778.451.626 23.968.759.641 11.536.404.357 11.651.264.416 10.822Private 8 6.034.486.358 6.946.221.587 941.790.947 1.883.643.282 9.282.706.765 6.928.878.492 16.211.585.259 10.018.756.684 3.201.566.701 4.966
Loss Makers 2 536.482.894 734.100.193 -165.347.591 -210.140.395 3.118.832.478 1.024.830.791 4.143.663.269 267.936.426 2.700.803.947 265Public - - - - - - - - - - -Private 2 536.482.894 734.100.193 -165.347.591 -210.140.395 3.118.832.478 1.024.830.791 4.143.663.269 267.936.426 2.700.803.947 265
Total Industrial Sector 500 353.699.301.977 423.621.059.525 24.192.614.270 118.800.645.555 189.948.762.522 169.534.357.163 359.483.119.718 102.255.623.952 201.230.509.641 596.055Public 13 20.406.672.664 21.079.438.734 2.867.344.712 8.627.010.670 10.249.423.660 35.497.305.088 45.746.728.747 15.856.766.964 26.152.410.411 67.511Private 487 333.292.629.313 402.541.620.791 21.325.269.558 110.173.634.885 179.699.338.862 134.037.052.075 313.736.390.971 86.398.856.988 175.078.099.230 528.544
Profit Makers 437 319.024.680.787 384.633.272.799 26.905.916.130 115.163.346.835 163.144.651.308 156.995.121.491 320.139.772.828 92.213.599.506 178.030.860.378 505.828Public 7 15.262.502.384 15.883.403.646 3.711.449.880 7.172.087.638 7.266.049.231 31.778.275.497 39.044.324.728 14.596.755.432 21.064.347.024 32.650Private 430 303.762.178.403 368.749.869.153 23.194.466.250 107.991.259.197 155.878.602.077 125.216.845.994 281.095.448.100 77.616.844.074 156.966.513.354 473.178
Loss Makers 63 34.674.621.190 38.987.786.726 -2.713.301.860 3.637.298.720 26.804.111.214 12.539.235.672 39.343.346.890 10.042.024.446 23.199.649.263 90.227Public 6 5.144.170.280 5.196.035.088 -844.105.168 1.454.923.032 2.983.374.429 3.719.029.591 6.702.404.019 1.260.011.532 5.088.063.387 34.861Private 57 29.530.450.910 33.791.751.638 -1.869.196.692 2.182.375.688 23.820.736.785 8.820.206.081 32.640.942.871 8.782.012.914 18.111.585.876 55.366
Sector No. of Workplaces
Production-Based Sales (Net)
Sales Revenues (Net)
Total Profit (Before Tax) and Loss for the Period
Gross Value Added (at Producers’ Prices) Total Debt Equity Capital Total Assets Tangible Fixed Assets Revolving Assets Average No. of
Wage Employees
SECTORAL DATA
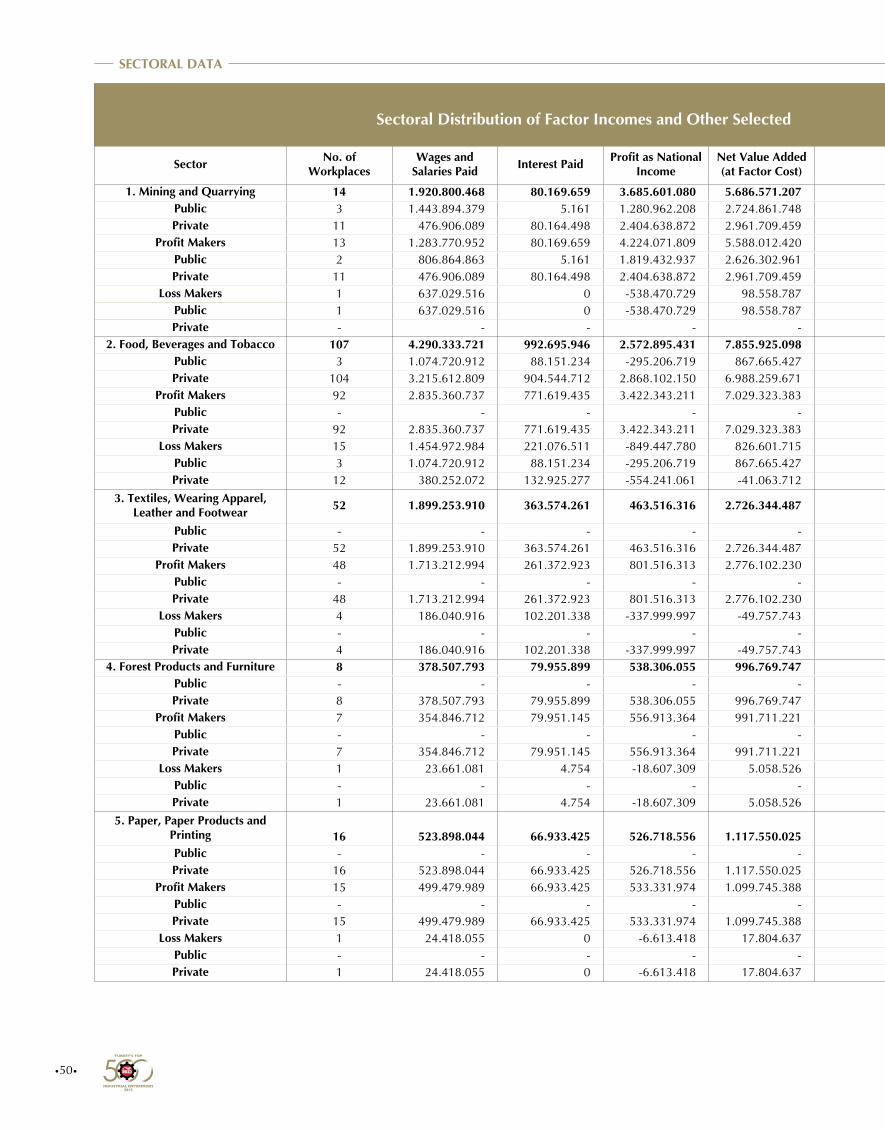
•50•
Sector No. of Workplaces
Wages and Salaries Paid Interest Paid Profit as National
IncomeNet Value Added (at Factor Cost) Amortization Other Indirect
TaxesGross Value Added
(at Basic Prices) VAT + SCT Paid Subsidies Gross Value Added (at Producers› Prices)
1. Mining and Quarrying 14 1.920.800.468 80.169.659 3.685.601.080 5.686.571.207 527.804.390 514.466.925 6.728.842.522 925.349.499 55.227 7.654.136.794Public 3 1.443.894.379 5.161 1.280.962.208 2.724.861.748 162.757.154 474.236.752 3.361.855.654 807.345.642 0 4.169.201.296Private 11 476.906.089 80.164.498 2.404.638.872 2.961.709.459 365.047.236 40.230.173 3.366.986.868 118.003.857 55.227 3.484.935.498
Profit Makers 13 1.283.770.952 80.169.659 4.224.071.809 5.588.012.420 489.341.658 512.219.280 6.589.573.358 897.695.178 55.227 7.487.213.309Public 2 806.864.863 5.161 1.819.432.937 2.626.302.961 124.294.422 471.989.107 3.222.586.490 779.691.321 0 4.002.277.811Private 11 476.906.089 80.164.498 2.404.638.872 2.961.709.459 365.047.236 40.230.173 3.366.986.868 118.003.857 55.227 3.484.935.498
Loss Makers 1 637.029.516 0 -538.470.729 98.558.787 38.462.732 2.247.645 139.269.164 27.654.321 0 166.923.485Public 1 637.029.516 0 -538.470.729 98.558.787 38.462.732 2.247.645 139.269.164 27.654.321 0 166.923.485Private - - - - - - - - - - -
2. Food, Beverages and Tobacco 107 4.290.333.721 992.695.946 2.572.895.431 7.855.925.098 1.355.119.610 154.229.275 9.365.273.983 22.322.911.719 61.108.794 31.627.076.908Public 3 1.074.720.912 88.151.234 -295.206.719 867.665.427 62.001.549 18.052.996 947.719.972 190.574.346 0 1.138.294.318Private 104 3.215.612.809 904.544.712 2.868.102.150 6.988.259.671 1.293.118.061 136.176.279 8.417.554.011 22.132.337.373 61.108.794 30.488.782.590
Profit Makers 92 2.835.360.737 771.619.435 3.422.343.211 7.029.323.383 1.163.373.662 125.513.996 8.318.211.041 22.103.998.193 53.140.363 30.369.068.871Public - - - - - - - - - - -Private 92 2.835.360.737 771.619.435 3.422.343.211 7.029.323.383 1.163.373.662 125.513.996 8.318.211.041 22.103.998.193 53.140.363 30.369.068.871
Loss Makers 15 1.454.972.984 221.076.511 -849.447.780 826.601.715 191.745.948 28.715.279 1.047.062.942 218.913.526 7.968.431 1.258.008.037Public 3 1.074.720.912 88.151.234 -295.206.719 867.665.427 62.001.549 18.052.996 947.719.972 190.574.346 0 1.138.294.318Private 12 380.252.072 132.925.277 -554.241.061 -41.063.712 129.744.399 10.662.283 99.342.970 28.339.180 7.968.431 119.713.719
3. Textiles, Wearing Apparel, Leather and Footwear 52 1.899.253.910 363.574.261 463.516.316 2.726.344.487 656.284.533 54.862.351 3.437.491.371 66.794.562 23.640.394 3.480.645.539
Public - - - - - - - - - - -Private 52 1.899.253.910 363.574.261 463.516.316 2.726.344.487 656.284.533 54.862.351 3.437.491.371 66.794.562 23.640.394 3.480.645.539
Profit Makers 48 1.713.212.994 261.372.923 801.516.313 2.776.102.230 597.919.523 51.087.747 3.425.109.500 59.350.056 23.392.727 3.461.066.829Public - - - - - - - - - - -Private 48 1.713.212.994 261.372.923 801.516.313 2.776.102.230 597.919.523 51.087.747 3.425.109.500 59.350.056 23.392.727 3.461.066.829
Loss Makers 4 186.040.916 102.201.338 -337.999.997 -49.757.743 58.365.010 3.774.604 12.381.871 7.444.506 247.667 19.578.710Public - - - - - - - - - - -Private 4 186.040.916 102.201.338 -337.999.997 -49.757.743 58.365.010 3.774.604 12.381.871 7.444.506 247.667 19.578.710
4. Forest Products and Furniture 8 378.507.793 79.955.899 538.306.055 996.769.747 343.966.269 5.355.147 1.346.091.163 124.584.082 6.350.569 1.464.324.676Public - - - - - - - - - - -Private 8 378.507.793 79.955.899 538.306.055 996.769.747 343.966.269 5.355.147 1.346.091.163 124.584.082 6.350.569 1.464.324.676
Profit Makers 7 354.846.712 79.951.145 556.913.364 991.711.221 313.303.187 5.330.081 1.310.344.489 112.876.649 6.350.569 1.416.870.569Public - - - - - - - - - - -Private 7 354.846.712 79.951.145 556.913.364 991.711.221 313.303.187 5.330.081 1.310.344.489 112.876.649 6.350.569 1.416.870.569
Loss Makers 1 23.661.081 4.754 -18.607.309 5.058.526 30.663.082 25.066 35.746.674 11.707.433 0 47.454.107Public - - - - - - - - - - -Private 1 23.661.081 4.754 -18.607.309 5.058.526 30.663.082 25.066 35.746.674 11.707.433 0 47.454.107
5. Paper, Paper Products and Printing 16 523.898.044 66.933.425 526.718.556 1.117.550.025 191.837.761 7.515.237 1.316.903.023 137.037.041 0 1.453.940.064Public - - - - - - - - - - -Private 16 523.898.044 66.933.425 526.718.556 1.117.550.025 191.837.761 7.515.237 1.316.903.023 137.037.041 0 1.453.940.064
Profit Makers 15 499.479.989 66.933.425 533.331.974 1.099.745.388 187.703.376 7.500.660 1.294.949.424 136.911.808 0 1.431.861.232Public - - - - - - - - - - -Private 15 499.479.989 66.933.425 533.331.974 1.099.745.388 187.703.376 7.500.660 1.294.949.424 136.911.808 0 1.431.861.232
Loss Makers 1 24.418.055 0 -6.613.418 17.804.637 4.134.385 14.577 21.953.599 125.233 0 22.078.832Public - - - - - - - - - - -Private 1 24.418.055 0 -6.613.418 17.804.637 4.134.385 14.577 21.953.599 125.233 0 22.078.832
SECTORAL DATA
Sectoral Distribution of Factor Incomes and Other Selected
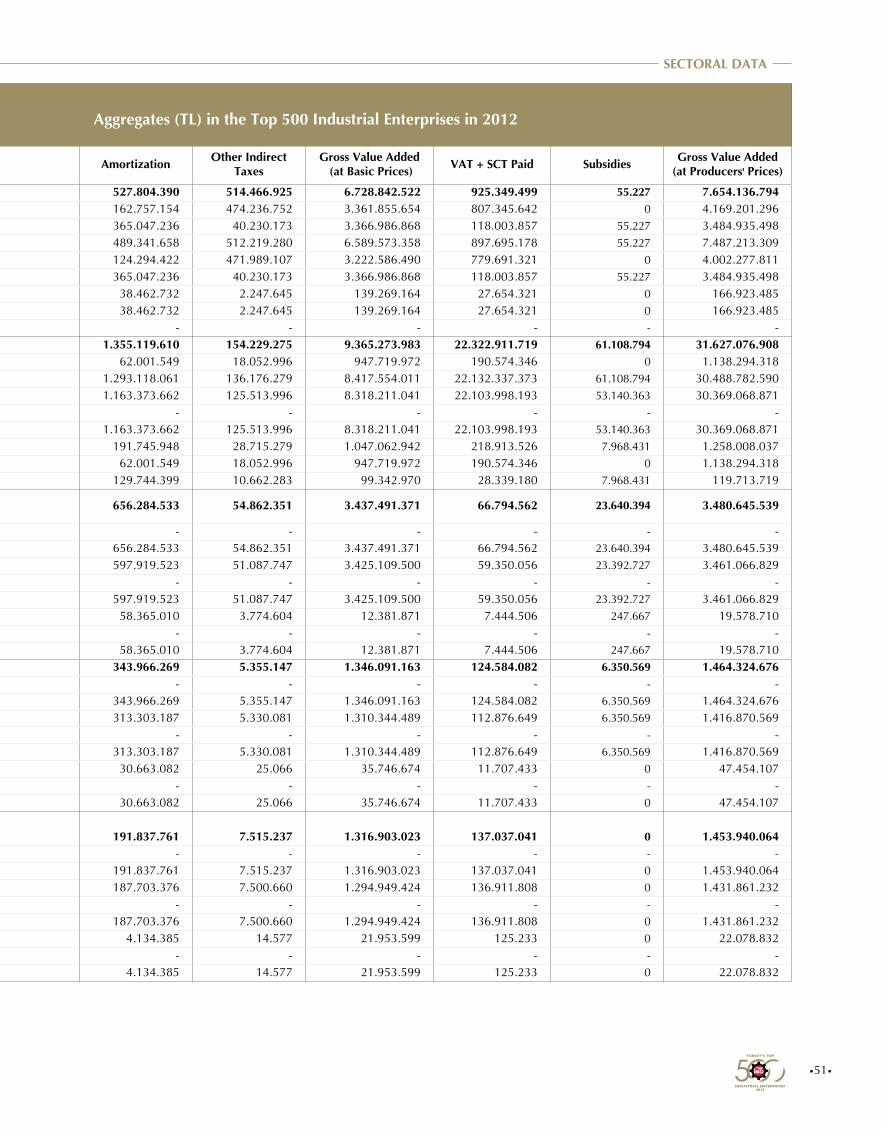
•51•
Sector No. of Workplaces
Wages and Salaries Paid Interest Paid Profit as National
IncomeNet Value Added (at Factor Cost) Amortization Other Indirect
TaxesGross Value Added
(at Basic Prices) VAT + SCT Paid Subsidies Gross Value Added (at Producers› Prices)
1. Mining and Quarrying 14 1.920.800.468 80.169.659 3.685.601.080 5.686.571.207 527.804.390 514.466.925 6.728.842.522 925.349.499 55.227 7.654.136.794Public 3 1.443.894.379 5.161 1.280.962.208 2.724.861.748 162.757.154 474.236.752 3.361.855.654 807.345.642 0 4.169.201.296Private 11 476.906.089 80.164.498 2.404.638.872 2.961.709.459 365.047.236 40.230.173 3.366.986.868 118.003.857 55.227 3.484.935.498
Profit Makers 13 1.283.770.952 80.169.659 4.224.071.809 5.588.012.420 489.341.658 512.219.280 6.589.573.358 897.695.178 55.227 7.487.213.309Public 2 806.864.863 5.161 1.819.432.937 2.626.302.961 124.294.422 471.989.107 3.222.586.490 779.691.321 0 4.002.277.811Private 11 476.906.089 80.164.498 2.404.638.872 2.961.709.459 365.047.236 40.230.173 3.366.986.868 118.003.857 55.227 3.484.935.498
Loss Makers 1 637.029.516 0 -538.470.729 98.558.787 38.462.732 2.247.645 139.269.164 27.654.321 0 166.923.485Public 1 637.029.516 0 -538.470.729 98.558.787 38.462.732 2.247.645 139.269.164 27.654.321 0 166.923.485Private - - - - - - - - - - -
2. Food, Beverages and Tobacco 107 4.290.333.721 992.695.946 2.572.895.431 7.855.925.098 1.355.119.610 154.229.275 9.365.273.983 22.322.911.719 61.108.794 31.627.076.908Public 3 1.074.720.912 88.151.234 -295.206.719 867.665.427 62.001.549 18.052.996 947.719.972 190.574.346 0 1.138.294.318Private 104 3.215.612.809 904.544.712 2.868.102.150 6.988.259.671 1.293.118.061 136.176.279 8.417.554.011 22.132.337.373 61.108.794 30.488.782.590
Profit Makers 92 2.835.360.737 771.619.435 3.422.343.211 7.029.323.383 1.163.373.662 125.513.996 8.318.211.041 22.103.998.193 53.140.363 30.369.068.871Public - - - - - - - - - - -Private 92 2.835.360.737 771.619.435 3.422.343.211 7.029.323.383 1.163.373.662 125.513.996 8.318.211.041 22.103.998.193 53.140.363 30.369.068.871
Loss Makers 15 1.454.972.984 221.076.511 -849.447.780 826.601.715 191.745.948 28.715.279 1.047.062.942 218.913.526 7.968.431 1.258.008.037Public 3 1.074.720.912 88.151.234 -295.206.719 867.665.427 62.001.549 18.052.996 947.719.972 190.574.346 0 1.138.294.318Private 12 380.252.072 132.925.277 -554.241.061 -41.063.712 129.744.399 10.662.283 99.342.970 28.339.180 7.968.431 119.713.719
3. Textiles, Wearing Apparel, Leather and Footwear 52 1.899.253.910 363.574.261 463.516.316 2.726.344.487 656.284.533 54.862.351 3.437.491.371 66.794.562 23.640.394 3.480.645.539
Public - - - - - - - - - - -Private 52 1.899.253.910 363.574.261 463.516.316 2.726.344.487 656.284.533 54.862.351 3.437.491.371 66.794.562 23.640.394 3.480.645.539
Profit Makers 48 1.713.212.994 261.372.923 801.516.313 2.776.102.230 597.919.523 51.087.747 3.425.109.500 59.350.056 23.392.727 3.461.066.829Public - - - - - - - - - - -Private 48 1.713.212.994 261.372.923 801.516.313 2.776.102.230 597.919.523 51.087.747 3.425.109.500 59.350.056 23.392.727 3.461.066.829
Loss Makers 4 186.040.916 102.201.338 -337.999.997 -49.757.743 58.365.010 3.774.604 12.381.871 7.444.506 247.667 19.578.710Public - - - - - - - - - - -Private 4 186.040.916 102.201.338 -337.999.997 -49.757.743 58.365.010 3.774.604 12.381.871 7.444.506 247.667 19.578.710
4. Forest Products and Furniture 8 378.507.793 79.955.899 538.306.055 996.769.747 343.966.269 5.355.147 1.346.091.163 124.584.082 6.350.569 1.464.324.676Public - - - - - - - - - - -Private 8 378.507.793 79.955.899 538.306.055 996.769.747 343.966.269 5.355.147 1.346.091.163 124.584.082 6.350.569 1.464.324.676
Profit Makers 7 354.846.712 79.951.145 556.913.364 991.711.221 313.303.187 5.330.081 1.310.344.489 112.876.649 6.350.569 1.416.870.569Public - - - - - - - - - - -Private 7 354.846.712 79.951.145 556.913.364 991.711.221 313.303.187 5.330.081 1.310.344.489 112.876.649 6.350.569 1.416.870.569
Loss Makers 1 23.661.081 4.754 -18.607.309 5.058.526 30.663.082 25.066 35.746.674 11.707.433 0 47.454.107Public - - - - - - - - - - -Private 1 23.661.081 4.754 -18.607.309 5.058.526 30.663.082 25.066 35.746.674 11.707.433 0 47.454.107
5. Paper, Paper Products and Printing 16 523.898.044 66.933.425 526.718.556 1.117.550.025 191.837.761 7.515.237 1.316.903.023 137.037.041 0 1.453.940.064Public - - - - - - - - - - -Private 16 523.898.044 66.933.425 526.718.556 1.117.550.025 191.837.761 7.515.237 1.316.903.023 137.037.041 0 1.453.940.064
Profit Makers 15 499.479.989 66.933.425 533.331.974 1.099.745.388 187.703.376 7.500.660 1.294.949.424 136.911.808 0 1.431.861.232Public - - - - - - - - - - -Private 15 499.479.989 66.933.425 533.331.974 1.099.745.388 187.703.376 7.500.660 1.294.949.424 136.911.808 0 1.431.861.232
Loss Makers 1 24.418.055 0 -6.613.418 17.804.637 4.134.385 14.577 21.953.599 125.233 0 22.078.832Public - - - - - - - - - - -Private 1 24.418.055 0 -6.613.418 17.804.637 4.134.385 14.577 21.953.599 125.233 0 22.078.832
SECTORAL DATA
Aggregates (TL) in the Top 500 Industrial Enterprises in 2012
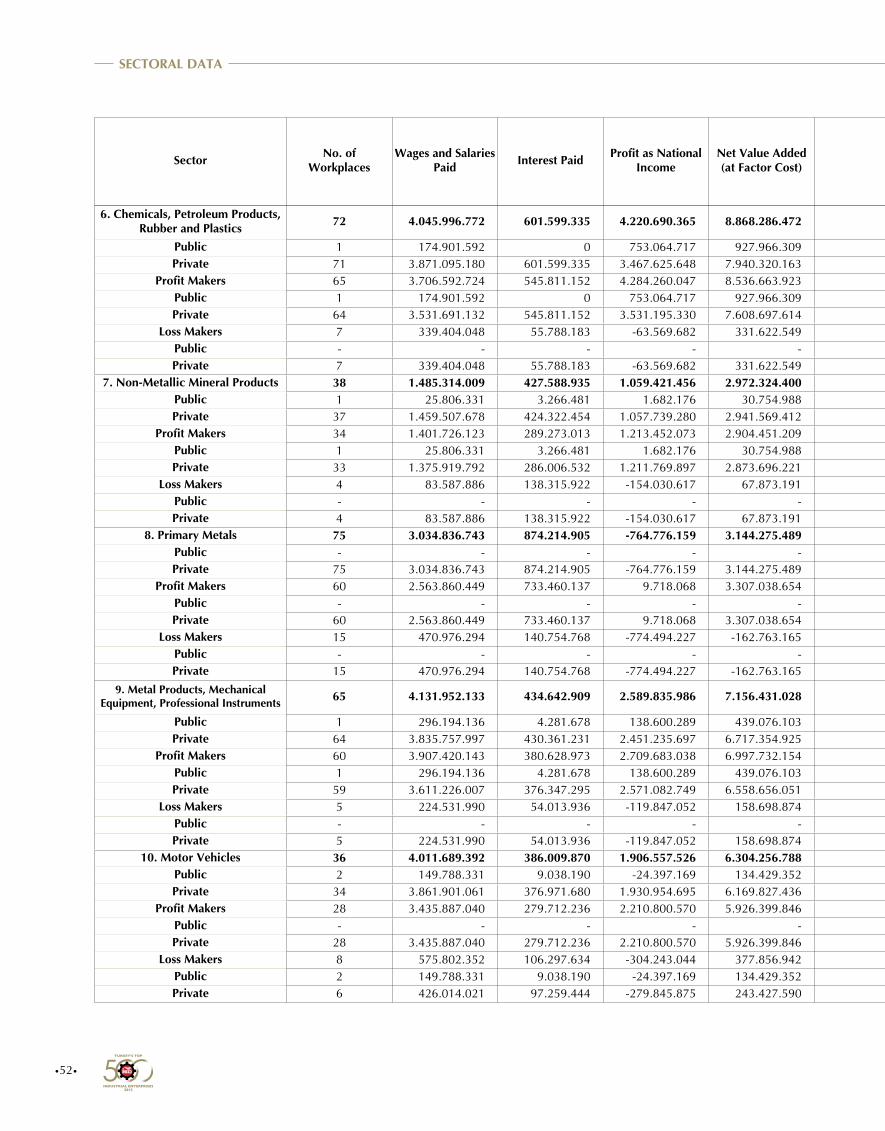
•52•
Sector No. of Workplaces
Wages and Salaries Paid Interest Paid Profit as National
IncomeNet Value Added (at Factor Cost) Amortization Other Indirect
TaxesGross Value Added
(at Basic Prices) VAT + SCT Paid Subsidies Gross Value Added (at Producers› Prices)
6. Chemicals, Petroleum Products, Rubber and Plastics 72 4.045.996.772 601.599.335 4.220.690.365 8.868.286.472 1.986.023.334 337.362.140 11.191.671.946 29.366.265.528 12.889.895 40.545.047.579
Public 1 174.901.592 0 753.064.717 927.966.309 126.485.002 14.467.442 1.068.918.753 0 0 1.068.918.753Private 71 3.871.095.180 601.599.335 3.467.625.648 7.940.320.163 1.859.538.332 322.894.698 10.122.753.193 29.366.265.528 12.889.895 39.476.128.826
Profit Makers 65 3.706.592.724 545.811.152 4.284.260.047 8.536.663.923 1.882.747.518 327.712.902 10.747.124.343 29.362.701.426 10.734.363 40.099.091.406Public 1 174.901.592 0 753.064.717 927.966.309 126.485.002 14.467.442 1.068.918.753 0 0 1.068.918.753Private 64 3.531.691.132 545.811.152 3.531.195.330 7.608.697.614 1.756.262.516 313.245.460 9.678.205.590 29.362.701.426 10.734.363 39.030.172.653
Loss Makers 7 339.404.048 55.788.183 -63.569.682 331.622.549 103.275.816 9.649.238 444.547.603 3.564.102 2.155.532 445.956.173Public - - - - - - - - - - -Private 7 339.404.048 55.788.183 -63.569.682 331.622.549 103.275.816 9.649.238 444.547.603 3.564.102 2.155.532 445.956.173
7. Non-Metallic Mineral Products 38 1.485.314.009 427.588.935 1.059.421.456 2.972.324.400 911.741.566 90.110.597 3.974.176.563 314.736.961 29.093.011 4.259.820.513Public 1 25.806.331 3.266.481 1.682.176 30.754.988 4.801.868 4.985.719 40.542.575 32.223.275 0 72.765.850Private 37 1.459.507.678 424.322.454 1.057.739.280 2.941.569.412 906.939.698 85.124.878 3.933.633.988 282.513.686 29.093.011 4.187.054.663
Profit Makers 34 1.401.726.123 289.273.013 1.213.452.073 2.904.451.209 831.619.800 81.698.462 3.817.769.471 292.348.449 29.093.011 4.081.024.909Public 1 25.806.331 3.266.481 1.682.176 30.754.988 4.801.868 4.985.719 40.542.575 32.223.275 0 72.765.850Private 33 1.375.919.792 286.006.532 1.211.769.897 2.873.696.221 826.817.932 76.712.743 3.777.226.896 260.125.174 29.093.011 4.008.259.059
Loss Makers 4 83.587.886 138.315.922 -154.030.617 67.873.191 80.121.766 8.412.135 156.407.092 22.388.512 0 178.795.604Public - - - - - - - - - - -Private 4 83.587.886 138.315.922 -154.030.617 67.873.191 80.121.766 8.412.135 156.407.092 22.388.512 0 178.795.604
8. Primary Metals 75 3.034.836.743 874.214.905 -764.776.159 3.144.275.489 2.188.749.486 86.745.802 5.419.770.777 2.020.727.594 1.279.270 7.439.219.101Public - - - - - - - - - - -Private 75 3.034.836.743 874.214.905 -764.776.159 3.144.275.489 2.188.749.486 86.745.802 5.419.770.777 2.020.727.594 1.279.270 7.439.219.101
Profit Makers 60 2.563.860.449 733.460.137 9.718.068 3.307.038.654 1.865.128.480 73.964.812 5.246.131.946 1.548.063.257 1.006.165 6.793.189.038Public - - - - - - - - - - -Private 60 2.563.860.449 733.460.137 9.718.068 3.307.038.654 1.865.128.480 73.964.812 5.246.131.946 1.548.063.257 1.006.165 6.793.189.038
Loss Makers 15 470.976.294 140.754.768 -774.494.227 -162.763.165 323.621.006 12.780.990 173.638.831 472.664.337 273.105 646.030.063Public - - - - - - - - - - -Private 15 470.976.294 140.754.768 -774.494.227 -162.763.165 323.621.006 12.780.990 173.638.831 472.664.337 273.105 646.030.063
9. Metal Products, Mechanical Equipment, Professional Instruments 65 4.131.952.133 434.642.909 2.589.835.986 7.156.431.028 1.180.544.804 252.672.092 8.589.647.924 806.713.369 48.500.598 9.347.860.695
Public 1 296.194.136 4.281.678 138.600.289 439.076.103 26.508.057 7.500.961 473.085.121 10.676.812 0 483.761.933Private 64 3.835.757.997 430.361.231 2.451.235.697 6.717.354.925 1.154.036.747 245.171.131 8.116.562.803 796.036.557 48.500.598 8.864.098.762
Profit Makers 60 3.907.420.143 380.628.973 2.709.683.038 6.997.732.154 1.091.144.937 251.700.220 8.340.577.311 533.408.889 47.050.494 8.826.935.706Public 1 296.194.136 4.281.678 138.600.289 439.076.103 26.508.057 7.500.961 473.085.121 10.676.812 0 483.761.933Private 59 3.611.226.007 376.347.295 2.571.082.749 6.558.656.051 1.064.636.880 244.199.259 7.867.492.190 522.732.077 47.050.494 8.343.173.773
Loss Makers 5 224.531.990 54.013.936 -119.847.052 158.698.874 89.399.867 971.872 249.070.613 273.304.480 1.450.104 520.924.989Public - - - - - - - - - - -Private 5 224.531.990 54.013.936 -119.847.052 158.698.874 89.399.867 971.872 249.070.613 273.304.480 1.450.104 520.924.989
10. Motor Vehicles 36 4.011.689.392 386.009.870 1.906.557.526 6.304.256.788 1.733.993.999 69.845.656 8.108.096.443 191.385.662 44.874.859 8.254.607.246Public 2 149.788.331 9.038.190 -24.397.169 134.429.352 11.680.298 3.272.895 149.382.545 322.684 0 149.705.229Private 34 3.861.901.061 376.971.680 1.930.954.695 6.169.827.436 1.722.313.701 66.572.761 7.958.713.898 191.062.978 44.874.859 8.104.902.017
Profit Makers 28 3.435.887.040 279.712.236 2.210.800.570 5.926.399.846 1.593.422.137 51.320.530 7.571.142.513 183.047.147 41.271.529 7.712.918.131Public - - - - - - - - - - -Private 28 3.435.887.040 279.712.236 2.210.800.570 5.926.399.846 1.593.422.137 51.320.530 7.571.142.513 183.047.147 41.271.529 7.712.918.131
Loss Makers 8 575.802.352 106.297.634 -304.243.044 377.856.942 140.571.862 18.525.126 536.953.930 8.338.515 3.603.330 541.689.115Public 2 149.788.331 9.038.190 -24.397.169 134.429.352 11.680.298 3.272.895 149.382.545 322.684 0 149.705.229Private 6 426.014.021 97.259.444 -279.845.875 243.427.590 128.891.564 15.252.231 387.571.385 8.015.831 3.603.330 391.983.886
SECTORAL DATA
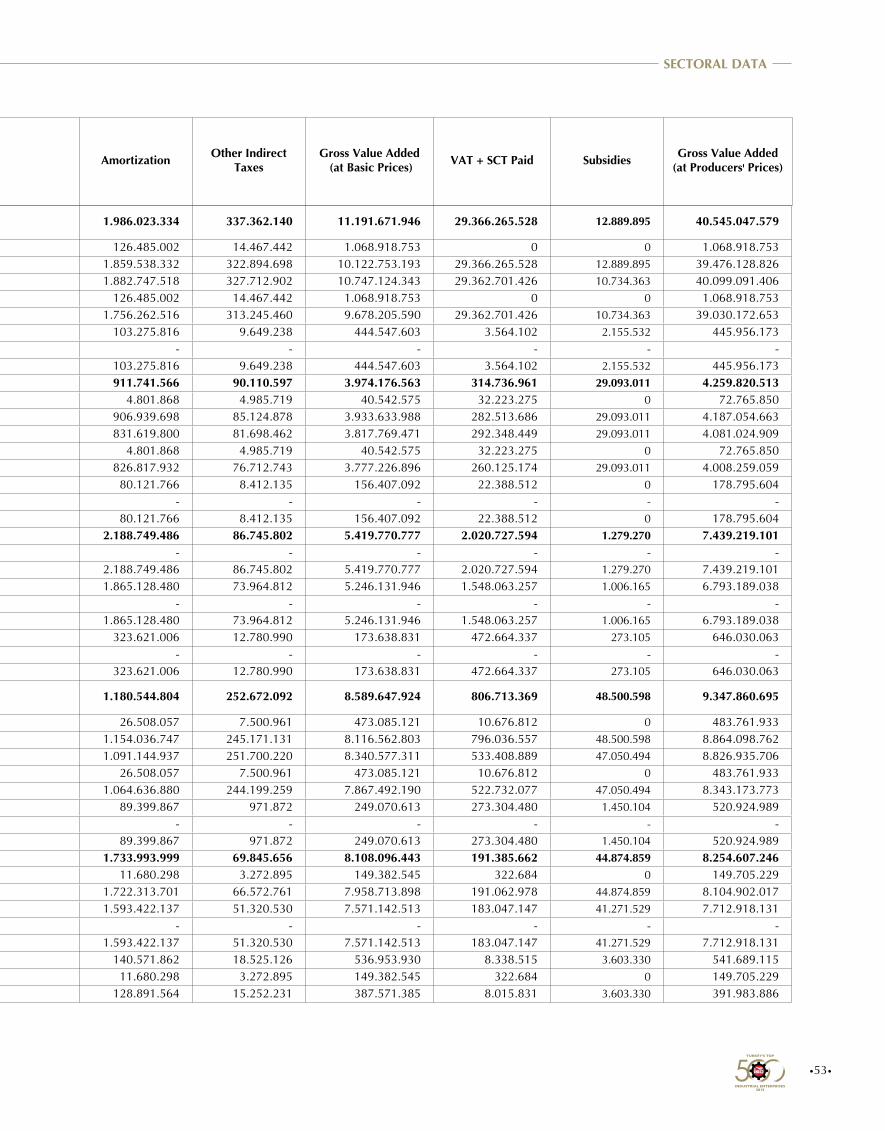
•53•
Sector No. of Workplaces
Wages and Salaries Paid Interest Paid Profit as National
IncomeNet Value Added (at Factor Cost) Amortization Other Indirect
TaxesGross Value Added
(at Basic Prices) VAT + SCT Paid Subsidies Gross Value Added (at Producers› Prices)
6. Chemicals, Petroleum Products, Rubber and Plastics 72 4.045.996.772 601.599.335 4.220.690.365 8.868.286.472 1.986.023.334 337.362.140 11.191.671.946 29.366.265.528 12.889.895 40.545.047.579
Public 1 174.901.592 0 753.064.717 927.966.309 126.485.002 14.467.442 1.068.918.753 0 0 1.068.918.753Private 71 3.871.095.180 601.599.335 3.467.625.648 7.940.320.163 1.859.538.332 322.894.698 10.122.753.193 29.366.265.528 12.889.895 39.476.128.826
Profit Makers 65 3.706.592.724 545.811.152 4.284.260.047 8.536.663.923 1.882.747.518 327.712.902 10.747.124.343 29.362.701.426 10.734.363 40.099.091.406Public 1 174.901.592 0 753.064.717 927.966.309 126.485.002 14.467.442 1.068.918.753 0 0 1.068.918.753Private 64 3.531.691.132 545.811.152 3.531.195.330 7.608.697.614 1.756.262.516 313.245.460 9.678.205.590 29.362.701.426 10.734.363 39.030.172.653
Loss Makers 7 339.404.048 55.788.183 -63.569.682 331.622.549 103.275.816 9.649.238 444.547.603 3.564.102 2.155.532 445.956.173Public - - - - - - - - - - -Private 7 339.404.048 55.788.183 -63.569.682 331.622.549 103.275.816 9.649.238 444.547.603 3.564.102 2.155.532 445.956.173
7. Non-Metallic Mineral Products 38 1.485.314.009 427.588.935 1.059.421.456 2.972.324.400 911.741.566 90.110.597 3.974.176.563 314.736.961 29.093.011 4.259.820.513Public 1 25.806.331 3.266.481 1.682.176 30.754.988 4.801.868 4.985.719 40.542.575 32.223.275 0 72.765.850Private 37 1.459.507.678 424.322.454 1.057.739.280 2.941.569.412 906.939.698 85.124.878 3.933.633.988 282.513.686 29.093.011 4.187.054.663
Profit Makers 34 1.401.726.123 289.273.013 1.213.452.073 2.904.451.209 831.619.800 81.698.462 3.817.769.471 292.348.449 29.093.011 4.081.024.909Public 1 25.806.331 3.266.481 1.682.176 30.754.988 4.801.868 4.985.719 40.542.575 32.223.275 0 72.765.850Private 33 1.375.919.792 286.006.532 1.211.769.897 2.873.696.221 826.817.932 76.712.743 3.777.226.896 260.125.174 29.093.011 4.008.259.059
Loss Makers 4 83.587.886 138.315.922 -154.030.617 67.873.191 80.121.766 8.412.135 156.407.092 22.388.512 0 178.795.604Public - - - - - - - - - - -Private 4 83.587.886 138.315.922 -154.030.617 67.873.191 80.121.766 8.412.135 156.407.092 22.388.512 0 178.795.604
8. Primary Metals 75 3.034.836.743 874.214.905 -764.776.159 3.144.275.489 2.188.749.486 86.745.802 5.419.770.777 2.020.727.594 1.279.270 7.439.219.101Public - - - - - - - - - - -Private 75 3.034.836.743 874.214.905 -764.776.159 3.144.275.489 2.188.749.486 86.745.802 5.419.770.777 2.020.727.594 1.279.270 7.439.219.101
Profit Makers 60 2.563.860.449 733.460.137 9.718.068 3.307.038.654 1.865.128.480 73.964.812 5.246.131.946 1.548.063.257 1.006.165 6.793.189.038Public - - - - - - - - - - -Private 60 2.563.860.449 733.460.137 9.718.068 3.307.038.654 1.865.128.480 73.964.812 5.246.131.946 1.548.063.257 1.006.165 6.793.189.038
Loss Makers 15 470.976.294 140.754.768 -774.494.227 -162.763.165 323.621.006 12.780.990 173.638.831 472.664.337 273.105 646.030.063Public - - - - - - - - - - -Private 15 470.976.294 140.754.768 -774.494.227 -162.763.165 323.621.006 12.780.990 173.638.831 472.664.337 273.105 646.030.063
9. Metal Products, Mechanical Equipment, Professional Instruments 65 4.131.952.133 434.642.909 2.589.835.986 7.156.431.028 1.180.544.804 252.672.092 8.589.647.924 806.713.369 48.500.598 9.347.860.695
Public 1 296.194.136 4.281.678 138.600.289 439.076.103 26.508.057 7.500.961 473.085.121 10.676.812 0 483.761.933Private 64 3.835.757.997 430.361.231 2.451.235.697 6.717.354.925 1.154.036.747 245.171.131 8.116.562.803 796.036.557 48.500.598 8.864.098.762
Profit Makers 60 3.907.420.143 380.628.973 2.709.683.038 6.997.732.154 1.091.144.937 251.700.220 8.340.577.311 533.408.889 47.050.494 8.826.935.706Public 1 296.194.136 4.281.678 138.600.289 439.076.103 26.508.057 7.500.961 473.085.121 10.676.812 0 483.761.933Private 59 3.611.226.007 376.347.295 2.571.082.749 6.558.656.051 1.064.636.880 244.199.259 7.867.492.190 522.732.077 47.050.494 8.343.173.773
Loss Makers 5 224.531.990 54.013.936 -119.847.052 158.698.874 89.399.867 971.872 249.070.613 273.304.480 1.450.104 520.924.989Public - - - - - - - - - - -Private 5 224.531.990 54.013.936 -119.847.052 158.698.874 89.399.867 971.872 249.070.613 273.304.480 1.450.104 520.924.989
10. Motor Vehicles 36 4.011.689.392 386.009.870 1.906.557.526 6.304.256.788 1.733.993.999 69.845.656 8.108.096.443 191.385.662 44.874.859 8.254.607.246Public 2 149.788.331 9.038.190 -24.397.169 134.429.352 11.680.298 3.272.895 149.382.545 322.684 0 149.705.229Private 34 3.861.901.061 376.971.680 1.930.954.695 6.169.827.436 1.722.313.701 66.572.761 7.958.713.898 191.062.978 44.874.859 8.104.902.017
Profit Makers 28 3.435.887.040 279.712.236 2.210.800.570 5.926.399.846 1.593.422.137 51.320.530 7.571.142.513 183.047.147 41.271.529 7.712.918.131Public - - - - - - - - - - -Private 28 3.435.887.040 279.712.236 2.210.800.570 5.926.399.846 1.593.422.137 51.320.530 7.571.142.513 183.047.147 41.271.529 7.712.918.131
Loss Makers 8 575.802.352 106.297.634 -304.243.044 377.856.942 140.571.862 18.525.126 536.953.930 8.338.515 3.603.330 541.689.115Public 2 149.788.331 9.038.190 -24.397.169 134.429.352 11.680.298 3.272.895 149.382.545 322.684 0 149.705.229Private 6 426.014.021 97.259.444 -279.845.875 243.427.590 128.891.564 15.252.231 387.571.385 8.015.831 3.603.330 391.983.886
SECTORAL DATA
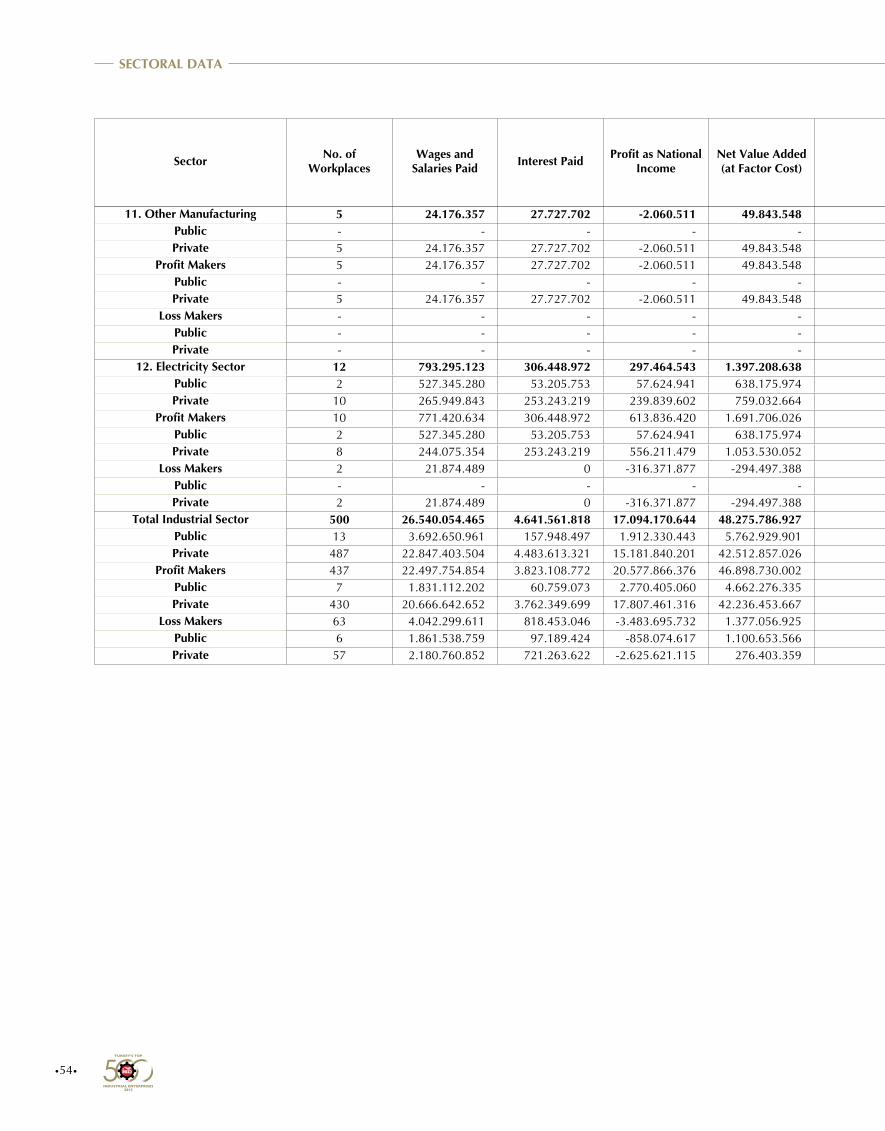
•54•
11. Other Manufacturing 5 24.176.357 27.727.702 -2.060.511 49.843.548 5.735.412 271.892 55.850.852 458.459 209.049 56.100.262Public - - - - - - - - - - -Private 5 24.176.357 27.727.702 -2.060.511 49.843.548 5.735.412 271.892 55.850.852 458.459 209.049 56.100.262
Profit Makers 5 24.176.357 27.727.702 -2.060.511 49.843.548 5.735.412 271.892 55.850.852 458.459 209.049 56.100.262Public - - - - - - - - - - -Private 5 24.176.357 27.727.702 -2.060.511 49.843.548 5.735.412 271.892 55.850.852 458.459 209.049 56.100.262
Loss Makers - - - - - - - - - - -Public - - - - - - - - - - -Private - - - - - - - - - - -
12. Electricity Sector 12 793.295.123 306.448.972 297.464.543 1.397.208.638 1.366.287.925 69.097.450 2.832.594.013 385.272.165 0 3.217.866.178Public 2 527.345.280 53.205.753 57.624.941 638.175.974 631.992.133 12.683.697 1.282.851.804 261.511.487 0 1.544.363.291Private 10 265.949.843 253.243.219 239.839.602 759.032.664 734.295.792 56.413.753 1.549.742.209 123.760.678 0 1.673.502.887
Profit Makers 10 771.420.634 306.448.972 613.836.420 1.691.706.026 1.299.854.495 54.039.340 3.045.599.861 382.406.712 0 3.428.006.573Public 2 527.345.280 53.205.753 57.624.941 638.175.974 631.992.133 12.683.697 1.282.851.804 261.511.487 0 1.544.363.291Private 8 244.075.354 253.243.219 556.211.479 1.053.530.052 667.862.362 41.355.643 1.762.748.057 120.895.225 0 1.883.643.282
Loss Makers 2 21.874.489 0 -316.371.877 -294.497.388 66.433.430 15.058.110 -213.005.848 2.865.453 0 -210.140.395Public - - - - - - - - - - -Private 2 21.874.489 0 -316.371.877 -294.497.388 66.433.430 15.058.110 -213.005.848 2.865.453 0 -210.140.395
Total Industrial Sector 500 26.540.054.465 4.641.561.818 17.094.170.644 48.275.786.927 12.448.089.089 1.642.534.564 62.366.410.580 56.662.236.641 228.001.666 118.800.645.555Public 13 3.692.650.961 157.948.497 1.912.330.443 5.762.929.901 1.026.226.061 535.200.462 7.324.356.424 1.302.654.246 0 8.627.010.670Private 487 22.847.403.504 4.483.613.321 15.181.840.201 42.512.857.026 11.421.863.028 1.107.334.102 55.042.054.156 55.359.582.395 228.001.666 110.173.634.885
Profit Makers 437 22.497.754.854 3.823.108.772 20.577.866.376 46.898.730.002 11.321.294.185 1.542.359.922 59.762.384.109 55.613.266.223 212.303.497 115.163.346.835Public 7 1.831.112.202 60.759.073 2.770.405.060 4.662.276.335 914.081.482 511.626.926 6.087.984.743 1.084.102.895 0 7.172.087.638Private 430 20.666.642.652 3.762.349.699 17.807.461.316 42.236.453.667 10.407.212.703 1.030.732.996 53.674.399.366 54.529.163.328 212.303.497 107.991.259.197
Loss Makers 63 4.042.299.611 818.453.046 -3.483.695.732 1.377.056.925 1.126.794.904 100.174.642 2.604.026.471 1.048.970.418 15.698.169 3.637.298.720Public 6 1.861.538.759 97.189.424 -858.074.617 1.100.653.566 112.144.579 23.573.536 1.236.371.681 218.551.351 0 1.454.923.032Private 57 2.180.760.852 721.263.622 -2.625.621.115 276.403.359 1.014.650.325 76.601.106 1.367.654.790 830.419.067 15.698.169 2.182.375.688
Sector No. of Workplaces
Wages and Salaries Paid Interest Paid Profit as National
IncomeNet Value Added (at Factor Cost) Amortization Other Indirect
TaxesGross Value Added
(at Basic Prices) VAT + SCT Paid Subsidies Gross Value Added (at Producers› Prices)
SECTORAL DATA
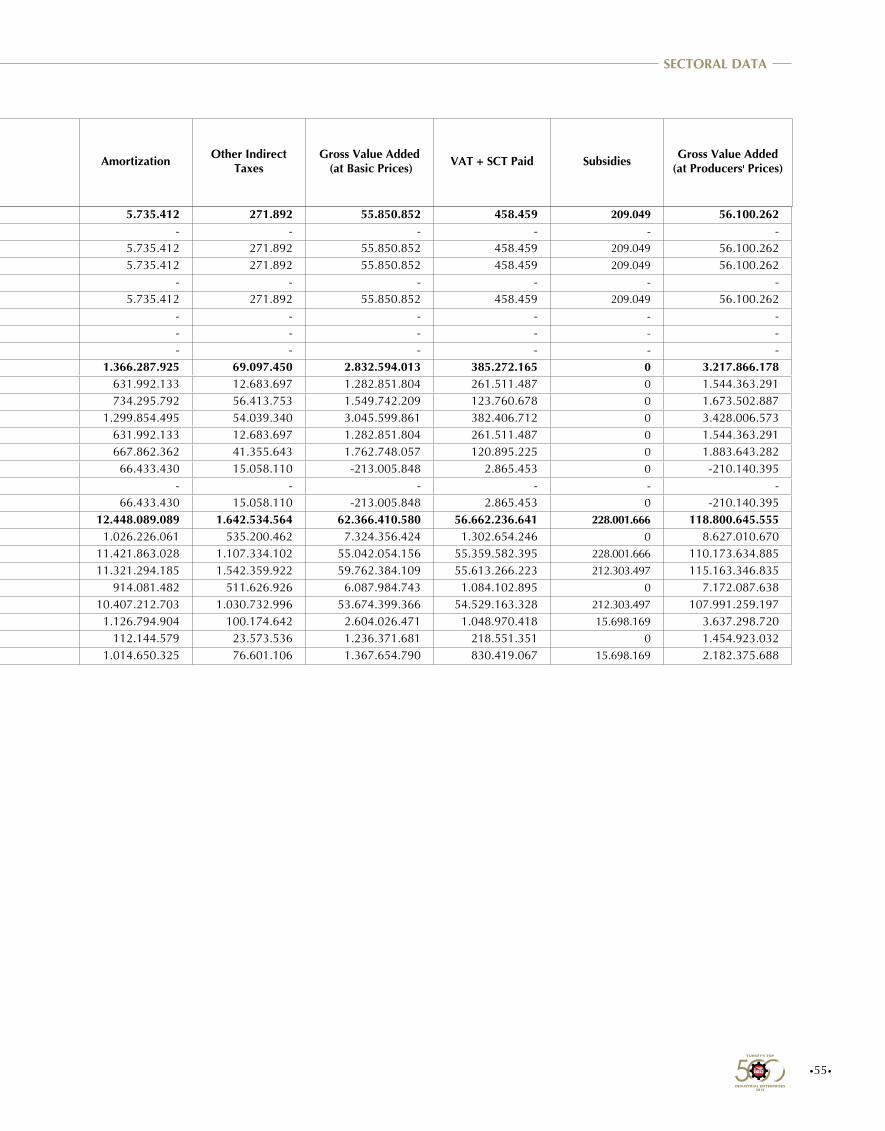
•55•
11. Other Manufacturing 5 24.176.357 27.727.702 -2.060.511 49.843.548 5.735.412 271.892 55.850.852 458.459 209.049 56.100.262Public - - - - - - - - - - -Private 5 24.176.357 27.727.702 -2.060.511 49.843.548 5.735.412 271.892 55.850.852 458.459 209.049 56.100.262
Profit Makers 5 24.176.357 27.727.702 -2.060.511 49.843.548 5.735.412 271.892 55.850.852 458.459 209.049 56.100.262Public - - - - - - - - - - -Private 5 24.176.357 27.727.702 -2.060.511 49.843.548 5.735.412 271.892 55.850.852 458.459 209.049 56.100.262
Loss Makers - - - - - - - - - - -Public - - - - - - - - - - -Private - - - - - - - - - - -
12. Electricity Sector 12 793.295.123 306.448.972 297.464.543 1.397.208.638 1.366.287.925 69.097.450 2.832.594.013 385.272.165 0 3.217.866.178Public 2 527.345.280 53.205.753 57.624.941 638.175.974 631.992.133 12.683.697 1.282.851.804 261.511.487 0 1.544.363.291Private 10 265.949.843 253.243.219 239.839.602 759.032.664 734.295.792 56.413.753 1.549.742.209 123.760.678 0 1.673.502.887
Profit Makers 10 771.420.634 306.448.972 613.836.420 1.691.706.026 1.299.854.495 54.039.340 3.045.599.861 382.406.712 0 3.428.006.573Public 2 527.345.280 53.205.753 57.624.941 638.175.974 631.992.133 12.683.697 1.282.851.804 261.511.487 0 1.544.363.291Private 8 244.075.354 253.243.219 556.211.479 1.053.530.052 667.862.362 41.355.643 1.762.748.057 120.895.225 0 1.883.643.282
Loss Makers 2 21.874.489 0 -316.371.877 -294.497.388 66.433.430 15.058.110 -213.005.848 2.865.453 0 -210.140.395Public - - - - - - - - - - -Private 2 21.874.489 0 -316.371.877 -294.497.388 66.433.430 15.058.110 -213.005.848 2.865.453 0 -210.140.395
Total Industrial Sector 500 26.540.054.465 4.641.561.818 17.094.170.644 48.275.786.927 12.448.089.089 1.642.534.564 62.366.410.580 56.662.236.641 228.001.666 118.800.645.555Public 13 3.692.650.961 157.948.497 1.912.330.443 5.762.929.901 1.026.226.061 535.200.462 7.324.356.424 1.302.654.246 0 8.627.010.670Private 487 22.847.403.504 4.483.613.321 15.181.840.201 42.512.857.026 11.421.863.028 1.107.334.102 55.042.054.156 55.359.582.395 228.001.666 110.173.634.885
Profit Makers 437 22.497.754.854 3.823.108.772 20.577.866.376 46.898.730.002 11.321.294.185 1.542.359.922 59.762.384.109 55.613.266.223 212.303.497 115.163.346.835Public 7 1.831.112.202 60.759.073 2.770.405.060 4.662.276.335 914.081.482 511.626.926 6.087.984.743 1.084.102.895 0 7.172.087.638Private 430 20.666.642.652 3.762.349.699 17.807.461.316 42.236.453.667 10.407.212.703 1.030.732.996 53.674.399.366 54.529.163.328 212.303.497 107.991.259.197
Loss Makers 63 4.042.299.611 818.453.046 -3.483.695.732 1.377.056.925 1.126.794.904 100.174.642 2.604.026.471 1.048.970.418 15.698.169 3.637.298.720Public 6 1.861.538.759 97.189.424 -858.074.617 1.100.653.566 112.144.579 23.573.536 1.236.371.681 218.551.351 0 1.454.923.032Private 57 2.180.760.852 721.263.622 -2.625.621.115 276.403.359 1.014.650.325 76.601.106 1.367.654.790 830.419.067 15.698.169 2.182.375.688
Sector No. of Workplaces
Wages and Salaries Paid Interest Paid Profit as National
IncomeNet Value Added (at Factor Cost) Amortization Other Indirect
TaxesGross Value Added
(at Basic Prices) VAT + SCT Paid Subsidies Gross Value Added (at Producers› Prices)
SECTORAL DATA

•56•
Sector No. of Workplaces
Total Profit (Before Tax)
and Loss for the Period/Sales
Revenues (Net) (%)
Total Profit (Before Tax)
and Loss for the Period/Equity Capital (%)
Production-Based Sales(Net)/Sales
Revenue (Net) (%)
Sales Revenues (Net)/Equity Capital (%)
Average No. of Wage
Employees
Total Profit (Before Tax) and
Loss for the Period/Average No.
Wage of Employees
Gross Value Added (at Producers’
Prices)/Average No. Wage of Employees
Net Value Added (at Factor Cost)/
Average No. of Wage Employees
Equity Capital/Average No. of
Wage Employees
Total Assets/ Average No. of
Wage Employees
Sales Revenues (Net)/Average No. of Wage Employees
Production-Based Sales (Net)/
Average No. of Wage Employees
1. Mining and Quarrying 14 38,0 26,8 94,1 70,6 35.586 121.831 215.088 159.798 453.919 546.688 320.278 301.350Public 3 30,6 18,5 90,6 60,4 24.070 74.856 173.212 113.206 405.205 476.986 244.646 221.644Private 11 46,0 39,6 97,8 86,1 11.516 220.014 302.617 257.182 555.737 692.375 478.358 467.946
Profit Makers 13 43,9 30,9 94,2 70,4 23.638 205.806 316.745 236.400 666.982 800.217 469.253 442.051Public 2 41,8 24,9 90,6 59,6 12.122 192.308 330.166 216.656 772.667 902.668 460.603 417.451Private 11 46,0 39,6 97,8 86,1 11.516 220.014 302.617 257.182 555.737 692.375 478.358 467.946
Loss Makers 1 -173,4 -136,8 90,0 78,9 11.948 -44.305 13.971 8.249 32.392 45.105 25.544 22.984Public 1 -173,4 -136,8 90,0 78,9 11.948 -44.305 13.971 8.249 32.392 45.105 25.544 22.984Private - - - - - - - - - - - - -
2. Food, Beverages and Tobacco 107 5,1 12,6 87,8 247,6 117.889 26.852 268.278 66.638 212.577 460.591 526.397 462.016Public 3 -6,4 -9,2 99,6 143,2 20.353 -14.156 55.928 42.631 153.685 272.927 220.010 219.174Private 104 6,0 15,7 86,8 262,5 97.536 35.409 312.590 71.648 224.866 499.751 590.332 512.691
Profit Makers 92 7,7 19,7 88,0 256,2 86.842 45.734 349.705 80.944 232.209 502.822 595.026 523.536Public - - - - - - - - - - - - -Private 92 7,7 19,7 88,0 256,2 86.842 45.734 349.705 80.944 232.209 502.822 595.026 523.536
Loss Makers 15 -7,8 -16,5 86,7 212,1 31.047 -25.962 40.519 26.624 157.663 342.467 334.435 289.938Public 3 -6,4 -9,2 99,6 143,2 20.353 -14.156 55.928 42.631 153.685 272.927 220.010 219.174Private 12 -8,8 -29,3 76,9 334,2 10.694 -48.431 11.194 -3.840 165.235 474.817 552.210 424.617
3. Textiles, Wearing Apparel, Leather and Footwear 52 4,7 8,0 90,5 168,6 81.072 9.861 42.933 33.629 123.759 252.148 208.618 188.828
Public - - - - - - - - - - - - -Private 52 4,7 8,0 90,5 168,6 81.072 9.861 42.933 33.629 123.759 252.148 208.618 188.828
Profit Makers 48 6,9 10,9 90,5 157,1 73.120 14.640 47.334 37.966 134.466 251.682 211.279 191.212Public - - - - - - - - - - - - -Private 48 6,9 10,9 90,5 157,1 73.120 14.640 47.334 37.966 134.466 251.682 211.279 191.212
Loss Makers 4 -18,5 -134,7 90,6 727,6 7.952 -34.090 2.462 -6.257 25.308 256.430 184.145 166.914Public - - - - - - - - - - - - -Private 4 -18,5 -134,7 90,6 727,6 7.952 -34.090 2.462 -6.257 25.308 256.430 184.145 166.914
4. Forest Products and Furniture 8 12,0 22,3 87,0 186,4 12.314 60.083 118.915 80.946 268.920 599.300 501.304 435.959Public - - - - - - - - - - - - -Private 8 12,0 22,3 87,0 186,4 12.314 60.083 118.915 80.946 268.920 599.300 501.304 435.959
Profit Makers 7 12,8 24,4 86,3 190,2 11.635 63.924 121.777 85.235 261.840 569.633 498.125 429.817Public - - - - - - - - - - - - -Private 7 12,8 24,4 86,3 190,2 11.635 63.924 121.777 85.235 261.840 569.633 498.125 429.817
Loss Makers 1 -1,0 -1,5 97,4 142,4 679 -5.745 69.888 7.450 390.242 1.107.655 555.765 541.207Public - - - - - - - - - - - - -Private 1 -1,0 -1,5 97,4 142,4 679 -5.745 69.888 7.450 390.242 1.107.655 555.765 541.207
5. Paper, Paper Products and Printing 16 11,5 16,6 98,2 144,6 9.590 57.669 151.610 116.533 348.181 547.206 503.513 494.282Public - - - - - - - - - - - - -Private 16 11,5 16,6 98,2 144,6 9.590 57.669 151.610 116.533 348.181 547.206 503.513 494.282
Profit Makers 15 12,5 17,3 99,0 138,5 9.071 61.921 157.850 121.238 358.642 560.878 496.679 491.612Public - - - - - - - - - - - - -Private 15 12,5 17,3 99,0 138,5 9.071 61.921 157.850 121.238 358.642 560.878 496.679 491.612
Loss Makers 1 -2,7 -10,1 86,8 376,8 519 -16.647 42.541 34.306 165.347 308.257 622.951 540.941
Selected Sectoral Ratios (%) and Aggregates
SECTORAL DATA
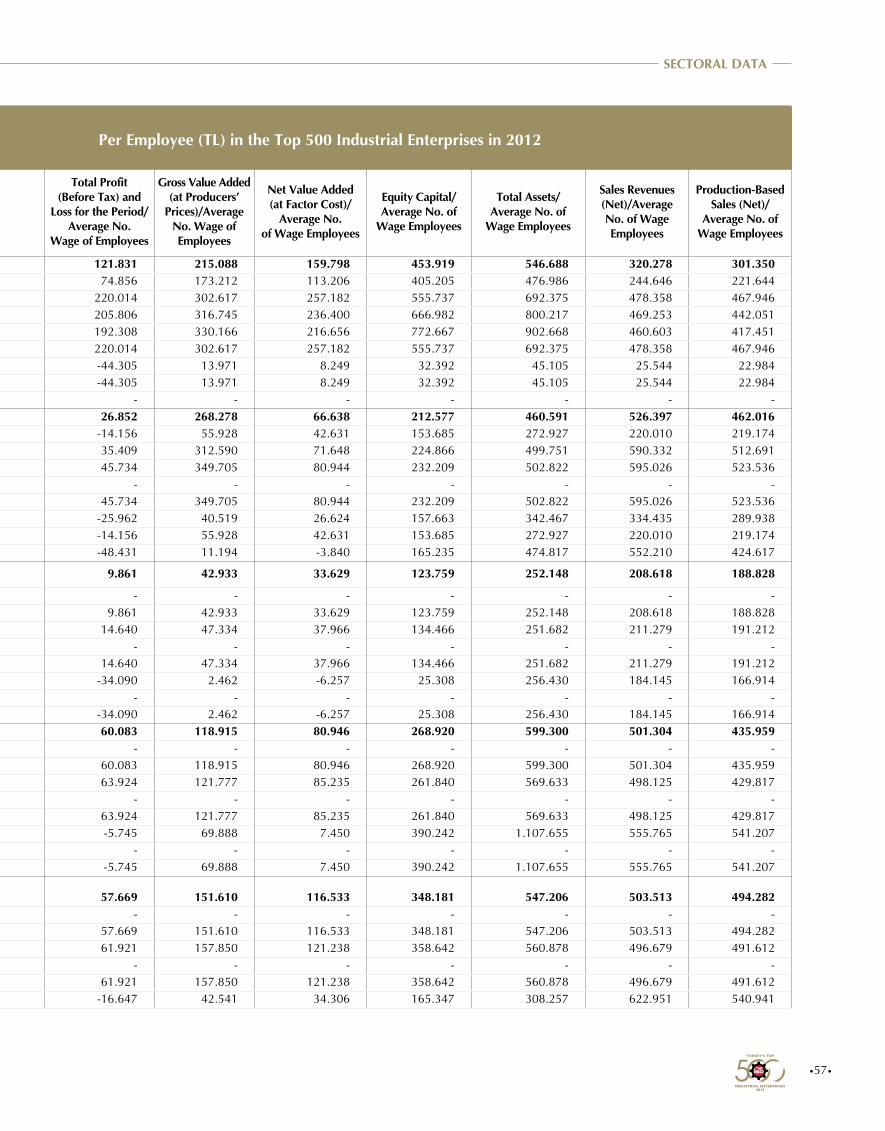
•57•
Sector No. of Workplaces
Total Profit (Before Tax)
and Loss for the Period/Sales
Revenues (Net) (%)
Total Profit (Before Tax)
and Loss for the Period/Equity Capital (%)
Production-Based Sales(Net)/Sales
Revenue (Net) (%)
Sales Revenues (Net)/Equity Capital (%)
Average No. of Wage
Employees
Total Profit (Before Tax) and
Loss for the Period/Average No.
Wage of Employees
Gross Value Added (at Producers’
Prices)/Average No. Wage of Employees
Net Value Added (at Factor Cost)/
Average No. of Wage Employees
Equity Capital/Average No. of
Wage Employees
Total Assets/ Average No. of
Wage Employees
Sales Revenues (Net)/Average No. of Wage Employees
Production-Based Sales (Net)/
Average No. of Wage Employees
1. Mining and Quarrying 14 38,0 26,8 94,1 70,6 35.586 121.831 215.088 159.798 453.919 546.688 320.278 301.350Public 3 30,6 18,5 90,6 60,4 24.070 74.856 173.212 113.206 405.205 476.986 244.646 221.644Private 11 46,0 39,6 97,8 86,1 11.516 220.014 302.617 257.182 555.737 692.375 478.358 467.946
Profit Makers 13 43,9 30,9 94,2 70,4 23.638 205.806 316.745 236.400 666.982 800.217 469.253 442.051Public 2 41,8 24,9 90,6 59,6 12.122 192.308 330.166 216.656 772.667 902.668 460.603 417.451Private 11 46,0 39,6 97,8 86,1 11.516 220.014 302.617 257.182 555.737 692.375 478.358 467.946
Loss Makers 1 -173,4 -136,8 90,0 78,9 11.948 -44.305 13.971 8.249 32.392 45.105 25.544 22.984Public 1 -173,4 -136,8 90,0 78,9 11.948 -44.305 13.971 8.249 32.392 45.105 25.544 22.984Private - - - - - - - - - - - - -
2. Food, Beverages and Tobacco 107 5,1 12,6 87,8 247,6 117.889 26.852 268.278 66.638 212.577 460.591 526.397 462.016Public 3 -6,4 -9,2 99,6 143,2 20.353 -14.156 55.928 42.631 153.685 272.927 220.010 219.174Private 104 6,0 15,7 86,8 262,5 97.536 35.409 312.590 71.648 224.866 499.751 590.332 512.691
Profit Makers 92 7,7 19,7 88,0 256,2 86.842 45.734 349.705 80.944 232.209 502.822 595.026 523.536Public - - - - - - - - - - - - -Private 92 7,7 19,7 88,0 256,2 86.842 45.734 349.705 80.944 232.209 502.822 595.026 523.536
Loss Makers 15 -7,8 -16,5 86,7 212,1 31.047 -25.962 40.519 26.624 157.663 342.467 334.435 289.938Public 3 -6,4 -9,2 99,6 143,2 20.353 -14.156 55.928 42.631 153.685 272.927 220.010 219.174Private 12 -8,8 -29,3 76,9 334,2 10.694 -48.431 11.194 -3.840 165.235 474.817 552.210 424.617
3. Textiles, Wearing Apparel, Leather and Footwear 52 4,7 8,0 90,5 168,6 81.072 9.861 42.933 33.629 123.759 252.148 208.618 188.828
Public - - - - - - - - - - - - -Private 52 4,7 8,0 90,5 168,6 81.072 9.861 42.933 33.629 123.759 252.148 208.618 188.828
Profit Makers 48 6,9 10,9 90,5 157,1 73.120 14.640 47.334 37.966 134.466 251.682 211.279 191.212Public - - - - - - - - - - - - -Private 48 6,9 10,9 90,5 157,1 73.120 14.640 47.334 37.966 134.466 251.682 211.279 191.212
Loss Makers 4 -18,5 -134,7 90,6 727,6 7.952 -34.090 2.462 -6.257 25.308 256.430 184.145 166.914Public - - - - - - - - - - - - -Private 4 -18,5 -134,7 90,6 727,6 7.952 -34.090 2.462 -6.257 25.308 256.430 184.145 166.914
4. Forest Products and Furniture 8 12,0 22,3 87,0 186,4 12.314 60.083 118.915 80.946 268.920 599.300 501.304 435.959Public - - - - - - - - - - - - -Private 8 12,0 22,3 87,0 186,4 12.314 60.083 118.915 80.946 268.920 599.300 501.304 435.959
Profit Makers 7 12,8 24,4 86,3 190,2 11.635 63.924 121.777 85.235 261.840 569.633 498.125 429.817Public - - - - - - - - - - - - -Private 7 12,8 24,4 86,3 190,2 11.635 63.924 121.777 85.235 261.840 569.633 498.125 429.817
Loss Makers 1 -1,0 -1,5 97,4 142,4 679 -5.745 69.888 7.450 390.242 1.107.655 555.765 541.207Public - - - - - - - - - - - - -Private 1 -1,0 -1,5 97,4 142,4 679 -5.745 69.888 7.450 390.242 1.107.655 555.765 541.207
5. Paper, Paper Products and Printing 16 11,5 16,6 98,2 144,6 9.590 57.669 151.610 116.533 348.181 547.206 503.513 494.282Public - - - - - - - - - - - - -Private 16 11,5 16,6 98,2 144,6 9.590 57.669 151.610 116.533 348.181 547.206 503.513 494.282
Profit Makers 15 12,5 17,3 99,0 138,5 9.071 61.921 157.850 121.238 358.642 560.878 496.679 491.612Public - - - - - - - - - - - - -Private 15 12,5 17,3 99,0 138,5 9.071 61.921 157.850 121.238 358.642 560.878 496.679 491.612
Loss Makers 1 -2,7 -10,1 86,8 376,8 519 -16.647 42.541 34.306 165.347 308.257 622.951 540.941
Per Employee (TL) in the Top 500 Industrial Enterprises in 2012
SECTORAL DATA
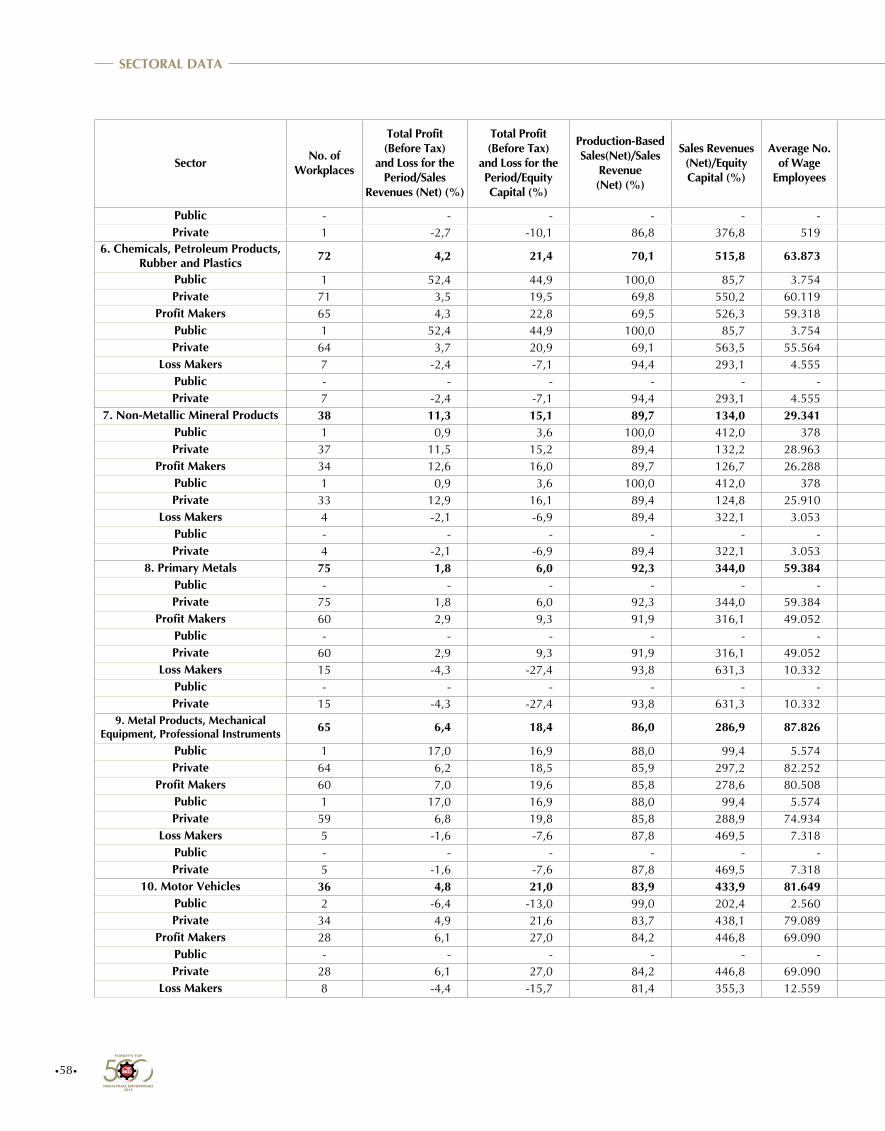
•58•
Sector No. of Workplaces
Total Profit (Before Tax)
and Loss for the Period/Sales
Revenues (Net) (%)
Total Profit (Before Tax)
and Loss for the Period/Equity Capital (%)
Production-Based Sales(Net)/Sales
Revenue (Net) (%)
Sales Revenues (Net)/Equity Capital (%)
Average No. of Wage
Employees
Total Profit (Before Tax) and
Loss for the Period/Average No.
Wage of Employees
Gross Value Added (at Producers’
Prices)/Average No. Wage of Employees
Net Value Added (at Factor Cost)/
Average No. of Wage Employees
Equity Capital/Average No. of
Wage Employees
Total Assets/ Average No. of
Wage Employees
Sales Revenues (Net)/Average No. of Wage Employees
Production-Based Sales (Net)/
Average No. of Wage Employees
Public - - - - - - - - - - - - -Private 1 -2,7 -10,1 86,8 376,8 519 -16.647 42.541 34.306 165.347 308.257 622.951 540.941
6. Chemicals, Petroleum Products, Rubber and Plastics 72 4,2 21,4 70,1 515,8 63.873 78.389 634.776 138.842 366.156 927.912 1.888.498 1.324.515
Public 1 52,4 44,9 100,0 85,7 3.754 207.532 284.741 247.194 462.237 517.345 396.234 396.234Private 71 3,5 19,5 69,8 550,2 60.119 70.325 656.633 132.077 360.156 953.549 1.981.680 1.382.480
Profit Makers 65 4,3 22,8 69,5 526,3 59.318 85.681 676.002 143.914 376.383 958.007 1.981.076 1.376.714Public 1 52,4 44,9 100,0 85,7 3.754 207.532 284.741 247.194 462.237 517.345 396.234 396.234Private 64 3,7 20,9 69,1 563,5 55.564 77.448 702.436 136.936 370.582 987.779 2.088.150 1.442.957
Loss Makers 7 -2,4 -7,1 94,4 293,1 4.555 -16.573 97.905 72.804 232.972 535.998 682.902 644.746Public - - - - - - - - - - - - -Private 7 -2,4 -7,1 94,4 293,1 4.555 -16.573 97.905 72.804 232.972 535.998 682.902 644.746
7. Non-Metallic Mineral Products 38 11,3 15,1 89,7 134,0 29.341 58.804 145.183 101.303 389.111 775.281 521.600 467.638Public 1 0,9 3,6 100,0 412,0 378 7.110 192.502 81.362 199.347 1.663.299 821.309 821.309Private 37 11,5 15,2 89,4 132,2 28.963 59.479 144.566 101.563 391.587 763.691 517.689 463.022
Profit Makers 34 12,6 16,0 89,7 126,7 26.288 66.751 155.243 110.486 418.058 763.535 529.856 475.168Public 1 0,9 3,6 100,0 412,0 378 7.110 192.502 81.362 199.347 1.663.299 821.309 821.309Private 33 12,9 16,1 89,4 124,8 25.910 67.621 154.699 110.911 421.249 750.409 525.604 470.118
Loss Makers 4 -2,1 -6,9 89,4 322,1 3.053 -9.625 58.564 22.232 139.858 876.419 450.515 402.803Public - - - - - - - - - - - - -Private 4 -2,1 -6,9 89,4 322,1 3.053 -9.625 58.564 22.232 139.858 876.419 450.515 402.803
8. Primary Metals 75 1,8 6,0 92,3 344,0 59.384 21.790 125.273 52.948 360.680 918.590 1.240.760 1.144.620Public - - - - - - - - - - - - -Private 75 1,8 6,0 92,3 344,0 59.384 21.790 125.273 52.948 360.680 918.590 1.240.760 1.144.620
Profit Makers 60 2,9 9,3 91,9 316,1 49.052 36.973 138.490 67.419 398.011 925.428 1.258.175 1.156.816Public - - - - - - - - - - - - -Private 60 2,9 9,3 91,9 316,1 49.052 36.973 138.490 67.419 398.011 925.428 1.258.175 1.156.816
Loss Makers 15 -4,3 -27,4 93,8 631,3 10.332 -50.292 62.527 -15.753 183.448 886.126 1.158.080 1.086.720Public - - - - - - - - - - - - -Private 15 -4,3 -27,4 93,8 631,3 10.332 -50.292 62.527 -15.753 183.448 886.126 1.158.080 1.086.720
9. Metal Products, Mechanical Equipment, Professional Instruments 65 6,4 18,4 86,0 286,9 87.826 33.358 106.436 81.484 180.964 473.089 519.257 446.472
Public 1 17,0 16,9 88,0 99,4 5.574 24.903 86.789 78.772 147.644 280.335 146.804 129.255Private 64 6,2 18,5 85,9 297,2 82.252 33.931 107.768 81.668 183.222 486.152 544.497 467.969
Profit Makers 60 7,0 19,6 85,8 278,6 80.508 37.044 109.640 86.920 188.828 487.627 526.152 451.681Public 1 17,0 16,9 88,0 99,4 5.574 24.903 86.789 78.772 147.644 280.335 146.804 129.255Private 59 6,8 19,8 85,8 288,9 74.934 37.947 111.340 87.526 191.891 503.047 554.370 475.665
Loss Makers 5 -1,6 -7,6 87,8 469,5 7.318 -7.199 71.184 21.686 94.448 313.154 443.407 389.163Public - - - - - - - - - - - - -Private 5 -1,6 -7,6 87,8 469,5 7.318 -7.199 71.184 21.686 94.448 313.154 443.407 389.163
10. Motor Vehicles 36 4,8 21,0 83,9 433,9 81.649 29.227 101.099 77.212 139.150 357.940 603.705 506.302Public 2 -6,4 -13,0 99,0 202,4 2.560 -10.401 58.479 52.511 79.712 237.737 161.317 159.650Private 34 4,9 21,6 83,7 438,1 79.089 30.510 102.478 78.011 141.074 361.831 618.025 517.522
Profit Makers 28 6,1 27,0 84,2 446,8 69.090 38.184 111.636 85.778 141.205 357.689 630.885 531.122Public - - - - - - - - - - - - -Private 28 6,1 27,0 84,2 446,8 69.090 38.184 111.636 85.778 141.205 357.689 630.885 531.122
Loss Makers 8 -4,4 -15,7 81,4 355,3 12.559 -20.046 43.132 30.087 127.848 359.319 454.185 369.761
SECTORAL DATA

•59•
Sector No. of Workplaces
Total Profit (Before Tax)
and Loss for the Period/Sales
Revenues (Net) (%)
Total Profit (Before Tax)
and Loss for the Period/Equity Capital (%)
Production-Based Sales(Net)/Sales
Revenue (Net) (%)
Sales Revenues (Net)/Equity Capital (%)
Average No. of Wage
Employees
Total Profit (Before Tax) and
Loss for the Period/Average No.
Wage of Employees
Gross Value Added (at Producers’
Prices)/Average No. Wage of Employees
Net Value Added (at Factor Cost)/
Average No. of Wage Employees
Equity Capital/Average No. of
Wage Employees
Total Assets/ Average No. of
Wage Employees
Sales Revenues (Net)/Average No. of Wage Employees
Production-Based Sales (Net)/
Average No. of Wage Employees
Public - - - - - - - - - - - - -Private 1 -2,7 -10,1 86,8 376,8 519 -16.647 42.541 34.306 165.347 308.257 622.951 540.941
6. Chemicals, Petroleum Products, Rubber and Plastics 72 4,2 21,4 70,1 515,8 63.873 78.389 634.776 138.842 366.156 927.912 1.888.498 1.324.515
Public 1 52,4 44,9 100,0 85,7 3.754 207.532 284.741 247.194 462.237 517.345 396.234 396.234Private 71 3,5 19,5 69,8 550,2 60.119 70.325 656.633 132.077 360.156 953.549 1.981.680 1.382.480
Profit Makers 65 4,3 22,8 69,5 526,3 59.318 85.681 676.002 143.914 376.383 958.007 1.981.076 1.376.714Public 1 52,4 44,9 100,0 85,7 3.754 207.532 284.741 247.194 462.237 517.345 396.234 396.234Private 64 3,7 20,9 69,1 563,5 55.564 77.448 702.436 136.936 370.582 987.779 2.088.150 1.442.957
Loss Makers 7 -2,4 -7,1 94,4 293,1 4.555 -16.573 97.905 72.804 232.972 535.998 682.902 644.746Public - - - - - - - - - - - - -Private 7 -2,4 -7,1 94,4 293,1 4.555 -16.573 97.905 72.804 232.972 535.998 682.902 644.746
7. Non-Metallic Mineral Products 38 11,3 15,1 89,7 134,0 29.341 58.804 145.183 101.303 389.111 775.281 521.600 467.638Public 1 0,9 3,6 100,0 412,0 378 7.110 192.502 81.362 199.347 1.663.299 821.309 821.309Private 37 11,5 15,2 89,4 132,2 28.963 59.479 144.566 101.563 391.587 763.691 517.689 463.022
Profit Makers 34 12,6 16,0 89,7 126,7 26.288 66.751 155.243 110.486 418.058 763.535 529.856 475.168Public 1 0,9 3,6 100,0 412,0 378 7.110 192.502 81.362 199.347 1.663.299 821.309 821.309Private 33 12,9 16,1 89,4 124,8 25.910 67.621 154.699 110.911 421.249 750.409 525.604 470.118
Loss Makers 4 -2,1 -6,9 89,4 322,1 3.053 -9.625 58.564 22.232 139.858 876.419 450.515 402.803Public - - - - - - - - - - - - -Private 4 -2,1 -6,9 89,4 322,1 3.053 -9.625 58.564 22.232 139.858 876.419 450.515 402.803
8. Primary Metals 75 1,8 6,0 92,3 344,0 59.384 21.790 125.273 52.948 360.680 918.590 1.240.760 1.144.620Public - - - - - - - - - - - - -Private 75 1,8 6,0 92,3 344,0 59.384 21.790 125.273 52.948 360.680 918.590 1.240.760 1.144.620
Profit Makers 60 2,9 9,3 91,9 316,1 49.052 36.973 138.490 67.419 398.011 925.428 1.258.175 1.156.816Public - - - - - - - - - - - - -Private 60 2,9 9,3 91,9 316,1 49.052 36.973 138.490 67.419 398.011 925.428 1.258.175 1.156.816
Loss Makers 15 -4,3 -27,4 93,8 631,3 10.332 -50.292 62.527 -15.753 183.448 886.126 1.158.080 1.086.720Public - - - - - - - - - - - - -Private 15 -4,3 -27,4 93,8 631,3 10.332 -50.292 62.527 -15.753 183.448 886.126 1.158.080 1.086.720
9. Metal Products, Mechanical Equipment, Professional Instruments 65 6,4 18,4 86,0 286,9 87.826 33.358 106.436 81.484 180.964 473.089 519.257 446.472
Public 1 17,0 16,9 88,0 99,4 5.574 24.903 86.789 78.772 147.644 280.335 146.804 129.255Private 64 6,2 18,5 85,9 297,2 82.252 33.931 107.768 81.668 183.222 486.152 544.497 467.969
Profit Makers 60 7,0 19,6 85,8 278,6 80.508 37.044 109.640 86.920 188.828 487.627 526.152 451.681Public 1 17,0 16,9 88,0 99,4 5.574 24.903 86.789 78.772 147.644 280.335 146.804 129.255Private 59 6,8 19,8 85,8 288,9 74.934 37.947 111.340 87.526 191.891 503.047 554.370 475.665
Loss Makers 5 -1,6 -7,6 87,8 469,5 7.318 -7.199 71.184 21.686 94.448 313.154 443.407 389.163Public - - - - - - - - - - - - -Private 5 -1,6 -7,6 87,8 469,5 7.318 -7.199 71.184 21.686 94.448 313.154 443.407 389.163
10. Motor Vehicles 36 4,8 21,0 83,9 433,9 81.649 29.227 101.099 77.212 139.150 357.940 603.705 506.302Public 2 -6,4 -13,0 99,0 202,4 2.560 -10.401 58.479 52.511 79.712 237.737 161.317 159.650Private 34 4,9 21,6 83,7 438,1 79.089 30.510 102.478 78.011 141.074 361.831 618.025 517.522
Profit Makers 28 6,1 27,0 84,2 446,8 69.090 38.184 111.636 85.778 141.205 357.689 630.885 531.122Public - - - - - - - - - - - - -Private 28 6,1 27,0 84,2 446,8 69.090 38.184 111.636 85.778 141.205 357.689 630.885 531.122
Loss Makers 8 -4,4 -15,7 81,4 355,3 12.559 -20.046 43.132 30.087 127.848 359.319 454.185 369.761
SECTORAL DATA
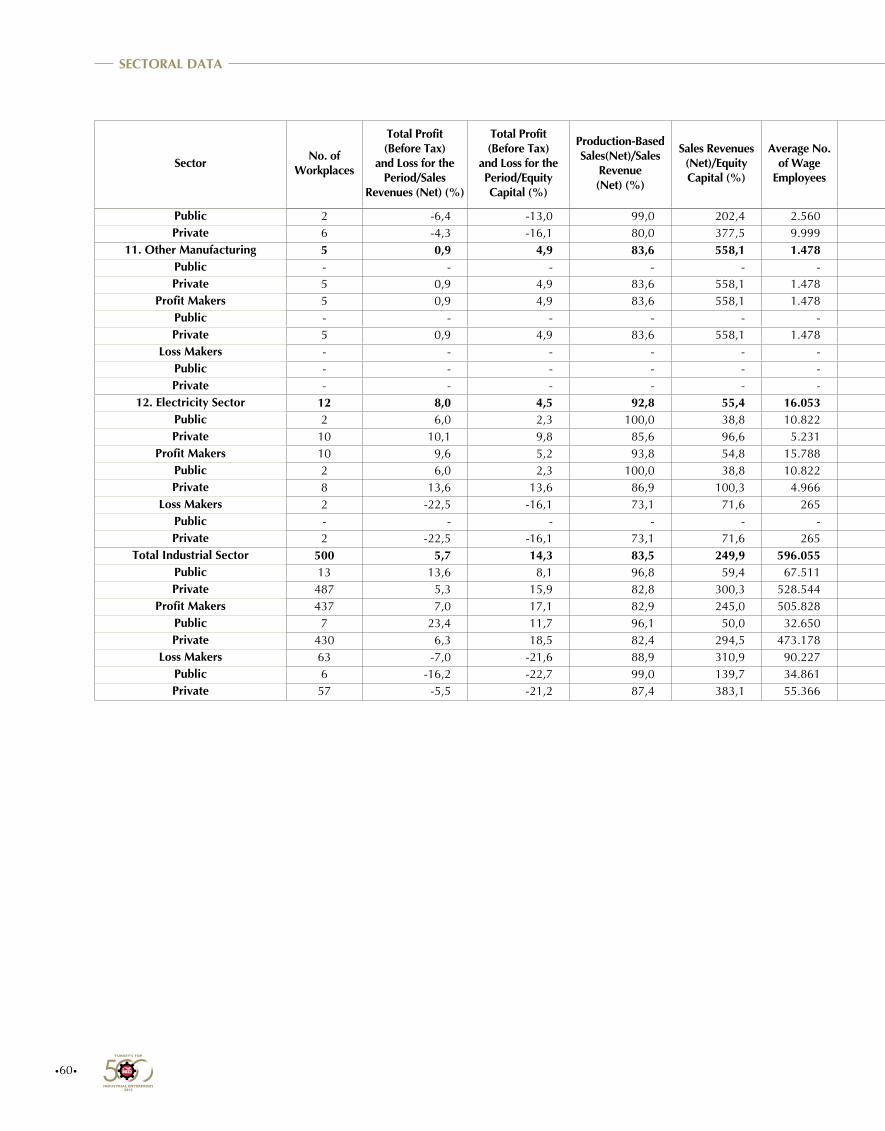
•60•
Sector No. of Workplaces
Total Profit (Before Tax)
and Loss for the Period/Sales
Revenues (Net) (%)
Total Profit (Before Tax)
and Loss for the Period/Equity Capital (%)
Production-Based Sales(Net)/Sales
Revenue (Net) (%)
Sales Revenues (Net)/Equity Capital (%)
Average No. of Wage
Employees
Total Profit (Before Tax) and
Loss for the Period/Average No.
Wage of Employees
Gross Value Added (at Producers’
Prices)/Average No. Wage of Employees
Net Value Added (at Factor Cost)/
Average No. of Wage Employees
Equity Capital/Average No. of
Wage Employees
Total Assets/ Average No. of
Wage Employees
Sales Revenues (Net)/Average No. of Wage Employees
Production-Based Sales (Net)/
Average No. of Wage Employees
Public 2 -6,4 -13,0 99,0 202,4 2.560 -10.401 58.479 52.511 79.712 237.737 161.317 159.650Private 6 -4,3 -16,1 80,0 377,5 9.999 -22.515 39.202 24.345 140.172 390.447 529.167 423.555
11. Other Manufacturing 5 0,9 4,9 83,6 558,1 1.478 14.023 37.957 33.724 288.844 673.753 1.611.941 1.347.836Public - - - - - - - - - - - - -Private 5 0,9 4,9 83,6 558,1 1.478 14.023 37.957 33.724 288.844 673.753 1.611.941 1.347.836
Profit Makers 5 0,9 4,9 83,6 558,1 1.478 14.023 37.957 33.724 288.844 673.753 1.611.941 1.347.836Public - - - - - - - - - - - - -Private 5 0,9 4,9 83,6 558,1 1.478 14.023 37.957 33.724 288.844 673.753 1.611.941 1.347.836
Loss Makers - - - - - - - - - - - - -Public - - - - - - - - - - - - -Private - - - - - - - - - - - - -
12. Electricity Sector 12 8,0 4,5 92,8 55,4 16.053 77.005 200.453 87.037 1.727.538 2.761.104 957.086 887.980Public 2 6,0 2,3 100,0 38,8 10.822 42.481 142.706 58.970 1.827.615 2.214.818 710.014 710.014Private 10 10,1 9,8 85,6 96,6 5.231 148.431 319.920 145.103 1.520.495 3.891.273 1.468.232 1.256.159
Profit Makers 10 9,6 5,2 93,8 54,8 15.788 88.771 217.127 107.151 1.691.622 2.544.993 926.653 868.904Public 2 6,0 2,3 100,0 38,8 10.822 42.481 142.706 58.970 1.827.615 2.214.818 710.014 710.014Private 8 13,6 13,6 86,9 100,3 4.966 189.648 379.308 212.149 1.395.263 3.264.516 1.398.756 1.215.160
Loss Makers 2 -22,5 -16,1 73,1 71,6 265 -623.953 -792.983 -1.111.311 3.867.286 15.636.465 2.770.189 2.024.464Public - - - - - - - - - - - - -Private 2 -22,5 -16,1 73,1 71,6 265 -623.953 -792.983 -1.111.311 3.867.286 15.636.465 2.770.189 2.024.464
Total Industrial Sector 500 5,7 14,3 83,5 249,9 596.055 40.588 199.312 80.992 284.427 603.104 710.708 593.400Public 13 13,6 8,1 96,8 59,4 67.511 42.472 127.787 85.363 525.800 677.619 312.237 302.272Private 487 5,3 15,9 82,8 300,3 528.544 40.347 208.447 80.434 253.597 593.586 761.605 630.586
Profit Makers 437 7,0 17,1 82,9 245,0 505.828 53.192 227.673 92.717 310.373 632.902 760.403 630.698Public 7 23,4 11,7 96,1 50,0 32.650 113.674 219.666 142.796 973.301 1.195.845 486.475 467.458Private 430 6,3 18,5 82,4 294,5 473.178 49.018 228.225 89.261 264.629 594.059 779.305 641.962
Loss Makers 63 -7,0 -21,6 88,9 310,9 90.227 -30.072 40.313 15.262 138.974 436.048 432.108 384.304Public 6 -16,2 -22,7 99,0 139,7 34.861 -24.213 41.735 31.573 106.682 192.261 149.050 147.562Private 57 -5,5 -21,2 87,4 383,1 55.366 -33.761 39.417 4.992 159.307 589.549 610.334 533.368
SECTORAL DATA

•61•
Sector No. of Workplaces
Total Profit (Before Tax)
and Loss for the Period/Sales
Revenues (Net) (%)
Total Profit (Before Tax)
and Loss for the Period/Equity Capital (%)
Production-Based Sales(Net)/Sales
Revenue (Net) (%)
Sales Revenues (Net)/Equity Capital (%)
Average No. of Wage
Employees
Total Profit (Before Tax) and
Loss for the Period/Average No.
Wage of Employees
Gross Value Added (at Producers’
Prices)/Average No. Wage of Employees
Net Value Added (at Factor Cost)/
Average No. of Wage Employees
Equity Capital/Average No. of
Wage Employees
Total Assets/ Average No. of
Wage Employees
Sales Revenues (Net)/Average No. of Wage Employees
Production-Based Sales (Net)/
Average No. of Wage Employees
Public 2 -6,4 -13,0 99,0 202,4 2.560 -10.401 58.479 52.511 79.712 237.737 161.317 159.650Private 6 -4,3 -16,1 80,0 377,5 9.999 -22.515 39.202 24.345 140.172 390.447 529.167 423.555
11. Other Manufacturing 5 0,9 4,9 83,6 558,1 1.478 14.023 37.957 33.724 288.844 673.753 1.611.941 1.347.836Public - - - - - - - - - - - - -Private 5 0,9 4,9 83,6 558,1 1.478 14.023 37.957 33.724 288.844 673.753 1.611.941 1.347.836
Profit Makers 5 0,9 4,9 83,6 558,1 1.478 14.023 37.957 33.724 288.844 673.753 1.611.941 1.347.836Public - - - - - - - - - - - - -Private 5 0,9 4,9 83,6 558,1 1.478 14.023 37.957 33.724 288.844 673.753 1.611.941 1.347.836
Loss Makers - - - - - - - - - - - - -Public - - - - - - - - - - - - -Private - - - - - - - - - - - - -
12. Electricity Sector 12 8,0 4,5 92,8 55,4 16.053 77.005 200.453 87.037 1.727.538 2.761.104 957.086 887.980Public 2 6,0 2,3 100,0 38,8 10.822 42.481 142.706 58.970 1.827.615 2.214.818 710.014 710.014Private 10 10,1 9,8 85,6 96,6 5.231 148.431 319.920 145.103 1.520.495 3.891.273 1.468.232 1.256.159
Profit Makers 10 9,6 5,2 93,8 54,8 15.788 88.771 217.127 107.151 1.691.622 2.544.993 926.653 868.904Public 2 6,0 2,3 100,0 38,8 10.822 42.481 142.706 58.970 1.827.615 2.214.818 710.014 710.014Private 8 13,6 13,6 86,9 100,3 4.966 189.648 379.308 212.149 1.395.263 3.264.516 1.398.756 1.215.160
Loss Makers 2 -22,5 -16,1 73,1 71,6 265 -623.953 -792.983 -1.111.311 3.867.286 15.636.465 2.770.189 2.024.464Public - - - - - - - - - - - - -Private 2 -22,5 -16,1 73,1 71,6 265 -623.953 -792.983 -1.111.311 3.867.286 15.636.465 2.770.189 2.024.464
Total Industrial Sector 500 5,7 14,3 83,5 249,9 596.055 40.588 199.312 80.992 284.427 603.104 710.708 593.400Public 13 13,6 8,1 96,8 59,4 67.511 42.472 127.787 85.363 525.800 677.619 312.237 302.272Private 487 5,3 15,9 82,8 300,3 528.544 40.347 208.447 80.434 253.597 593.586 761.605 630.586
Profit Makers 437 7,0 17,1 82,9 245,0 505.828 53.192 227.673 92.717 310.373 632.902 760.403 630.698Public 7 23,4 11,7 96,1 50,0 32.650 113.674 219.666 142.796 973.301 1.195.845 486.475 467.458Private 430 6,3 18,5 82,4 294,5 473.178 49.018 228.225 89.261 264.629 594.059 779.305 641.962
Loss Makers 63 -7,0 -21,6 88,9 310,9 90.227 -30.072 40.313 15.262 138.974 436.048 432.108 384.304Public 6 -16,2 -22,7 99,0 139,7 34.861 -24.213 41.735 31.573 106.682 192.261 149.050 147.562Private 57 -5,5 -21,2 87,4 383,1 55.366 -33.761 39.417 4.992 159.307 589.549 610.334 533.368
SECTORAL DATA
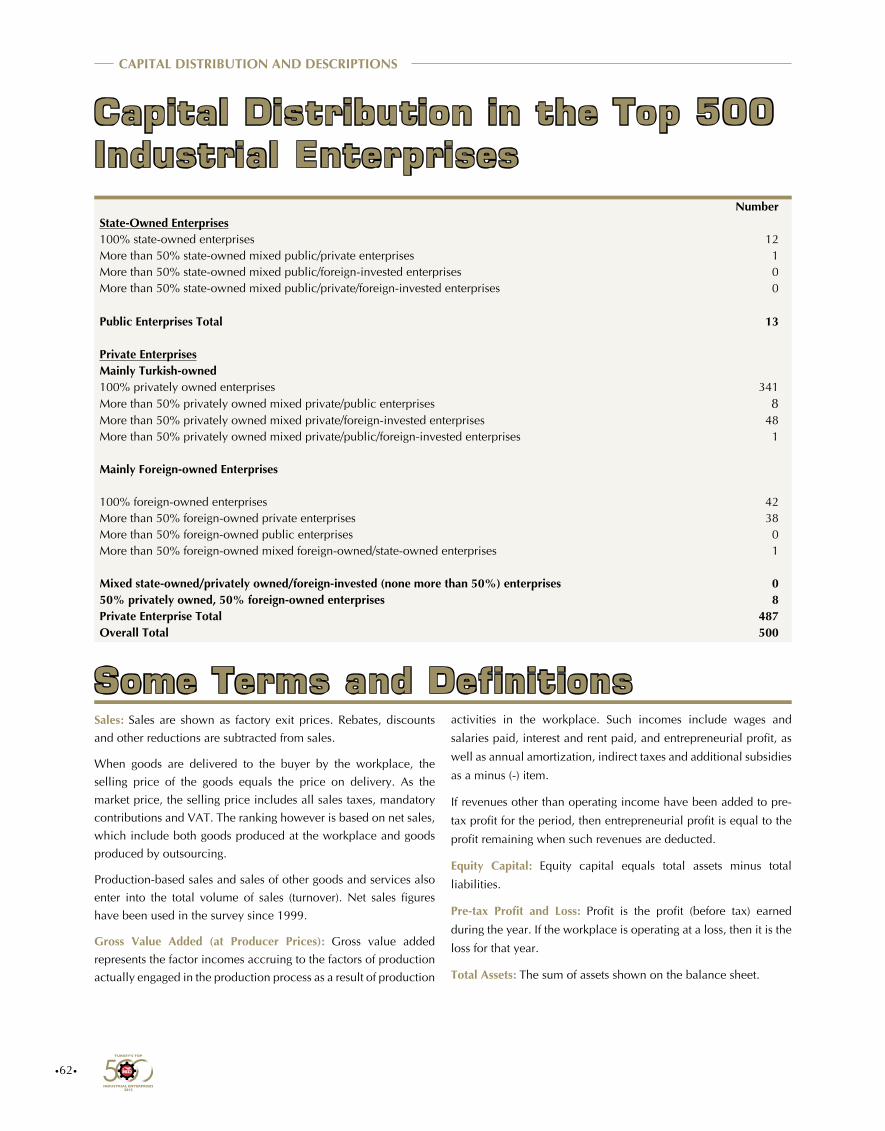
•62•
NumberState-Owned Enterprises100% state-owned enterprises 12More than 50% state-owned mixed public/private enterprises 1More than 50% state-owned mixed public/foreign-invested enterprises 0More than 50% state-owned mixed public/private/foreign-invested enterprises 0
Public Enterprises Total 13
Private EnterprisesMainly Turkish-owned100% privately owned enterprises 341More than 50% privately owned mixed private/public enterprises 8More than 50% privately owned mixed private/foreign-invested enterprises 48More than 50% privately owned mixed private/public/foreign-invested enterprises 1
Mainly Foreign-owned Enterprises
100% foreign-owned enterprises 42More than 50% foreign-owned private enterprises 38More than 50% foreign-owned public enterprises 0More than 50% foreign-owned mixed foreign-owned/state-owned enterprises 1
Mixed state-owned/privately owned/foreign-invested (none more than 50%) enterprises 050% privately owned, 50% foreign-owned enterprises 8Private Enterprise Total 487Overall Total 500
CAPITAL DISTRIBUTION AND DESCRIPTIONS
Capital Distribution in the Top 500 Industrial Enterprises
Some Terms and DefinitionsSales: Sales are shown as factory exit prices. Rebates, discounts
and other reductions are subtracted from sales.
When goods are delivered to the buyer by the workplace, the
selling price of the goods equals the price on delivery. As the
market price, the selling price includes all sales taxes, mandatory
contributions and VAT. The ranking however is based on net sales,
which include both goods produced at the workplace and goods
produced by outsourcing.
Production-based sales and sales of other goods and services also
enter into the total volume of sales (turnover). Net sales figures
have been used in the survey since 1999.
Gross Value Added (at Producer Prices): Gross value added
represents the factor incomes accruing to the factors of production
actually engaged in the production process as a result of production
activities in the workplace. Such incomes include wages and
salaries paid, interest and rent paid, and entrepreneurial profit, as
well as annual amortization, indirect taxes and additional subsidies
as a minus (-) item.
If revenues other than operating income have been added to pre-
tax profit for the period, then entrepreneurial profit is equal to the
profit remaining when such revenues are deducted.
Equity Capital: Equity capital equals total assets minus total
liabilities.
Pre-tax Profit and Loss: Profit is the profit (before tax) earned
during the year. If the workplace is operating at a loss, then it is the
loss for that year.
Total Assets: The sum of assets shown on the balance sheet.
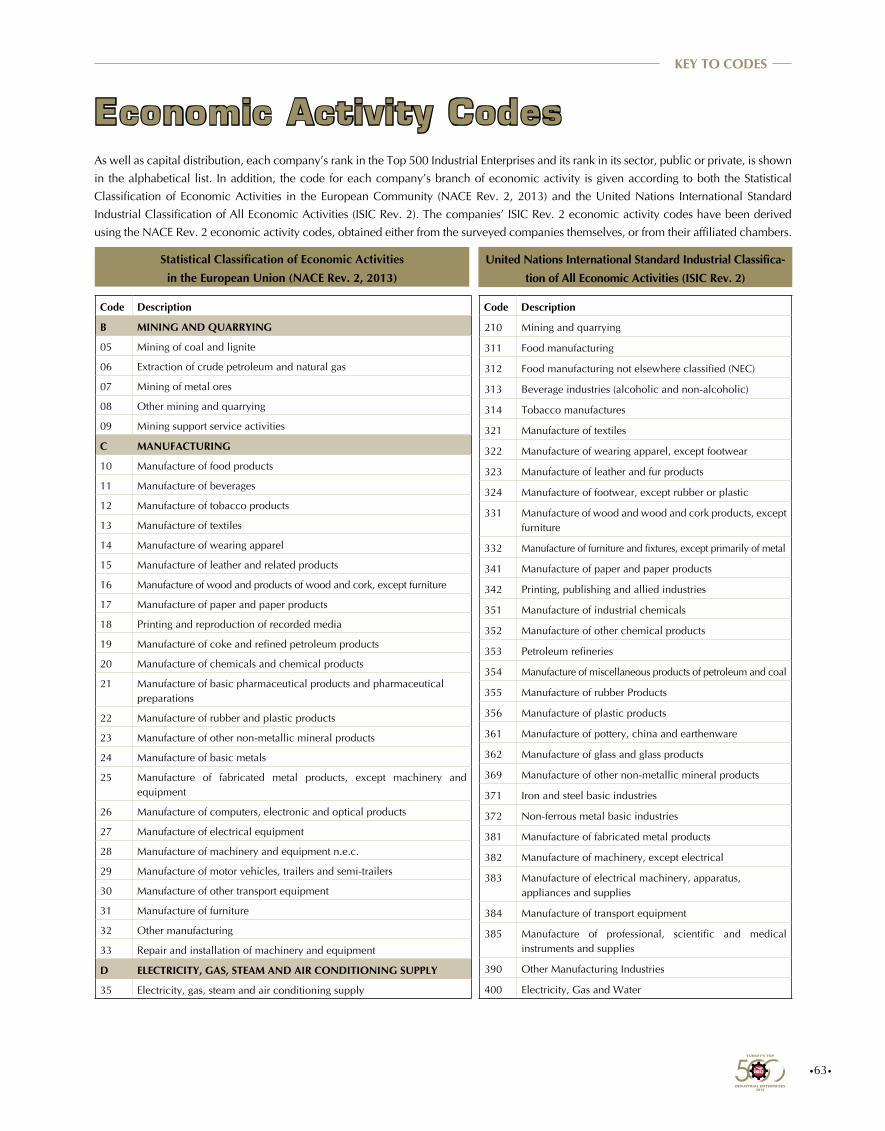
•63•
KEY TO CODES
Economic Activity CodesAs well as capital distribution, each company’s rank in the Top 500 Industrial Enterprises and its rank in its sector, public or private, is shown
in the alphabetical list. In addition, the code for each company’s branch of economic activity is given according to both the Statistical
Classification of Economic Activities in the European Community (NACE Rev. 2, 2013) and the United Nations International Standard
Industrial Classification of All Economic Activities (ISIC Rev. 2). The companies’ ISIC Rev. 2 economic activity codes have been derived
using the NACE Rev. 2 economic activity codes, obtained either from the surveyed companies themselves, or from their affiliated chambers.
United Nations International Standard Industrial Classifica-
tion of All Economic Activities (ISIC Rev. 2)
Statistical Classification of Economic Activities
in the European Union (NACE Rev. 2, 2013)
Code Description
B MINING AND QUARRYING
05 Mining of coal and lignite
06 Extraction of crude petroleum and natural gas
07 Mining of metal ores
08 Other mining and quarrying
09 Mining support service activities
C MANUFACTURING
10 Manufacture of food products
11 Manufacture of beverages
12 Manufacture of tobacco products
13 Manufacture of textiles
14 Manufacture of wearing apparel
15 Manufacture of leather and related products
16 Manufacture of wood and products of wood and cork, except furniture
17 Manufacture of paper and paper products
18 Printing and reproduction of recorded media
19 Manufacture of coke and refined petroleum products
20 Manufacture of chemicals and chemical products
21 Manufacture of basic pharmaceutical products and pharmaceutical preparations
22 Manufacture of rubber and plastic products
23 Manufacture of other non-metallic mineral products
24 Manufacture of basic metals
25 Manufacture of fabricated metal products, except machinery and equipment
26 Manufacture of computers, electronic and optical products
27 Manufacture of electrical equipment
28 Manufacture of machinery and equipment n.e.c.
29 Manufacture of motor vehicles, trailers and semi-trailers
30 Manufacture of other transport equipment
31 Manufacture of furniture
32 Other manufacturing
33 Repair and installation of machinery and equipment
D ELECTRICITY, GAS, STEAM AND AIR CONDITIONING SUPPLY
35 Electricity, gas, steam and air conditioning supply
Code Description
210 Mining and quarrying
311 Food manufacturing
312 Food manufacturing not elsewhere classified (NEC)
313 Beverage industries (alcoholic and non-alcoholic)
314 Tobacco manufactures
321 Manufacture of textiles
322 Manufacture of wearing apparel, except footwear
323 Manufacture of leather and fur products
324 Manufacture of footwear, except rubber or plastic
331 Manufacture of wood and wood and cork products, except furniture
332 Manufacture of furniture and fixtures, except primarily of metal
341 Manufacture of paper and paper products
342 Printing, publishing and allied industries
351 Manufacture of industrial chemicals
352 Manufacture of other chemical products
353 Petroleum refineries
354 Manufacture of miscellaneous products of petroleum and coal
355 Manufacture of rubber Products
356 Manufacture of plastic products
361 Manufacture of pottery, china and earthenware
362 Manufacture of glass and glass products
369 Manufacture of other non-metallic mineral products
371 Iron and steel basic industries
372 Non-ferrous metal basic industries
381 Manufacture of fabricated metal products
382 Manufacture of machinery, except electrical
383 Manufacture of electrical machinery, apparatus, appliances and supplies
384 Manufacture of transport equipment
385 Manufacture of professional, scientific and medical instruments and supplies
390 Other Manufacturing Industries
400 Electricity, Gas and Water
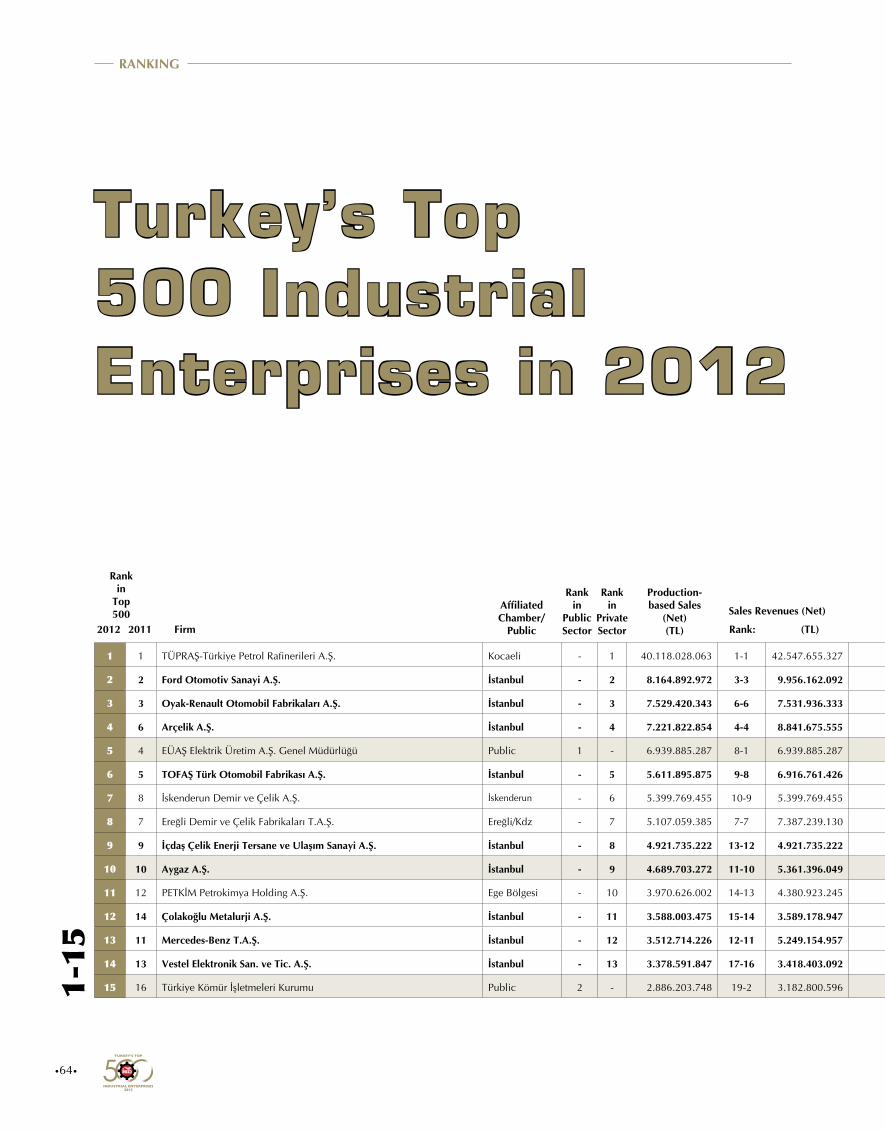
•64•
Turkey’s Top 500 Industrial Enterprises in 2012
1-15
RANKING
Firm2012 2011 Rank: (TL)
Rank in
Top 500
Affiliated Chamber/
Public
Rank in
Public Sector
Rank in
Private Sector
Production-based Sales
(Net) (TL)
Sales Revenues (Net)
1 1 TÜPRAŞ-Türkiye Petrol Rafinerileri A.Ş. Kocaeli - 1 40.118.028.063 1-1 42.547.655.327 1-1 21.510.573.305 6-4 3.155.778.078 2-1 14.400.825.682 2-1 1.183.493.662 1-1 5.016.126 23-16 4.358 1
2 2 Ford Otomotiv Sanayi A.Ş. İstanbul - 2 8.164.892.972 3-3 9.956.162.092 11-9 1.418.446.383 22-17 1.284.800.416 11-9 3.995.539.180 9-6 502.155.243 2-2 3.198.825 5-2 9.693 2
3 3 Oyak-Renault Otomobil Fabrikaları A.Ş. İstanbul - 3 7.529.420.343 6-6 7.531.936.333 --- - --- - --- - --- - 3-3 3.152.967 12-7 6.268 3
4 6 Arçelik A.Ş. İstanbul - 4 7.221.822.854 4-4 8.841.675.555 10-8 1.529.164.385 9-5 2.177.849.523 7-5 7.101.545.999 28-24 209.606.787 4-4 2.218.803 1-1 15.832 4
5 4 EÜAŞ Elektrik Üretim A.Ş. Genel Müdürlüğü Public 1 - 6.939.885.287 8-1 6.939.885.287 12-3 1.368.757.440 1-1 18.598.776.485 1-1 22.715.522.366 12-4 423.448.443 --- - 4-3 9.972 5
6 5 TOFAŞ Türk Otomobil Fabrikası A.Ş. İstanbul - 5 5.611.895.875 9-8 6.916.761.426 14-11 1.182.957.950 25-20 1.212.332.068 10-8 4.010.131.558 8-5 535.643.853 5-5 2.064.754 7-4 7.523 6
7 8 İskenderun Demir ve Çelik A.Ş. İskenderun - 6 5.399.769.455 10-9 5.399.769.455 13-10 1.348.274.029 10-6 1.934.486.677 9-7 5.684.710.067 184-178 29.646.729 25-24 490.286 16-11 5.773 7
8 7 Ereğli Demir ve Çelik Fabrikaları T.A.Ş. Ereğli/Kdz - 7 5.107.059.385 7-7 7.387.239.130 20-16 835.934.991 3-1 5.481.985.152 3-2 8.137.418.864 39-35 146.783.470 57-56 201.850 11-6 6.698 8
9 9 İçdaş Çelik Enerji Tersane ve Ulaşım Sanayi A.Ş. İstanbul - 8 4.921.735.222 13-12 4.921.735.222 36-30 478.704.801 41-35 824.296.281 26-22 2.243.586.330 52-47 117.817.766 7-7 1.261.441 30-22 3.601 9
10 10 Aygaz A.Ş. İstanbul - 9 4.689.703.272 11-10 5.361.396.049 6-6 2.735.762.164 12-7 1.694.913.033 29-25 2.169.969.148 34-30 170.058.084 32-31 390.402 171-160 1.045 10
11 12 PETKİM Petrokimya Holding A.Ş. Ege Bölgesi - 10 3.970.626.002 14-13 4.380.923.245 69-62 219.807.086 24-19 1.256.014.325 23-19 2.379.515.648 402-395 2.042.887 9-9 1.041.520 51-43 2.451 11
12 14 Çolakoğlu Metalurji A.Ş. İstanbul - 11 3.588.003.475 15-14 3.589.178.947 --- - 15-10 1.416.679.714 16-13 3.321.861.904 --- - 15-14 747.226 139-130 1.248 12
13 11 Mercedes-Benz T.A.Ş. İstanbul - 12 3.512.714.226 12-11 5.249.154.957 --- - --- - --- - --- - 19-18 564.167 17-12 5.731 13
14 13 Vestel Elektronik San. ve Tic. A.Ş. İstanbul - 13 3.378.591.847 17-16 3.418.403.092 65-58 230.506.476 14-9 1.528.496.070 14-11 3.669.521.556 49-44 121.715.107 6-6 1.663.699 20-14 5.222 14
15 16 Türkiye Kömür İşletmeleri Kurumu Public 2 - 2.886.203.748 19-2 3.182.800.596 9-2 1.575.032.872 7-3 2.448.058.711 17-4 3.035.860.078 3-2 860.015.795 --- - 8-4 7.318 15

•65•
RANKING
Ranked by production-based sales, sales revenues, value added, equity capital, total assets, pre-tax profit and loss for the period, exports and aver-age number of wage workers.
1-15
Rank: Rank: Rank: Rank:Rank:(TL) (TL) Rank: (TL) (TL) Number:($ 000)
Gross Value Added (at Producers’ Prices) Equity Capital Total Assets Exports
Profit (Before Tax)/Loss for the Period
Average No. of Wage Employees
Rank in
Top 5002012
1 1 TÜPRAŞ-Türkiye Petrol Rafinerileri A.Ş. Kocaeli - 1 40.118.028.063 1-1 42.547.655.327 1-1 21.510.573.305 6-4 3.155.778.078 2-1 14.400.825.682 2-1 1.183.493.662 1-1 5.016.126 23-16 4.358 1
2 2 Ford Otomotiv Sanayi A.Ş. İstanbul - 2 8.164.892.972 3-3 9.956.162.092 11-9 1.418.446.383 22-17 1.284.800.416 11-9 3.995.539.180 9-6 502.155.243 2-2 3.198.825 5-2 9.693 2
3 3 Oyak-Renault Otomobil Fabrikaları A.Ş. İstanbul - 3 7.529.420.343 6-6 7.531.936.333 --- - --- - --- - --- - 3-3 3.152.967 12-7 6.268 3
4 6 Arçelik A.Ş. İstanbul - 4 7.221.822.854 4-4 8.841.675.555 10-8 1.529.164.385 9-5 2.177.849.523 7-5 7.101.545.999 28-24 209.606.787 4-4 2.218.803 1-1 15.832 4
5 4 EÜAŞ Elektrik Üretim A.Ş. Genel Müdürlüğü Public 1 - 6.939.885.287 8-1 6.939.885.287 12-3 1.368.757.440 1-1 18.598.776.485 1-1 22.715.522.366 12-4 423.448.443 --- - 4-3 9.972 5
6 5 TOFAŞ Türk Otomobil Fabrikası A.Ş. İstanbul - 5 5.611.895.875 9-8 6.916.761.426 14-11 1.182.957.950 25-20 1.212.332.068 10-8 4.010.131.558 8-5 535.643.853 5-5 2.064.754 7-4 7.523 6
7 8 İskenderun Demir ve Çelik A.Ş. İskenderun - 6 5.399.769.455 10-9 5.399.769.455 13-10 1.348.274.029 10-6 1.934.486.677 9-7 5.684.710.067 184-178 29.646.729 25-24 490.286 16-11 5.773 7
8 7 Ereğli Demir ve Çelik Fabrikaları T.A.Ş. Ereğli/Kdz - 7 5.107.059.385 7-7 7.387.239.130 20-16 835.934.991 3-1 5.481.985.152 3-2 8.137.418.864 39-35 146.783.470 57-56 201.850 11-6 6.698 8
9 9 İçdaş Çelik Enerji Tersane ve Ulaşım Sanayi A.Ş. İstanbul - 8 4.921.735.222 13-12 4.921.735.222 36-30 478.704.801 41-35 824.296.281 26-22 2.243.586.330 52-47 117.817.766 7-7 1.261.441 30-22 3.601 9
10 10 Aygaz A.Ş. İstanbul - 9 4.689.703.272 11-10 5.361.396.049 6-6 2.735.762.164 12-7 1.694.913.033 29-25 2.169.969.148 34-30 170.058.084 32-31 390.402 171-160 1.045 10
11 12 PETKİM Petrokimya Holding A.Ş. Ege Bölgesi - 10 3.970.626.002 14-13 4.380.923.245 69-62 219.807.086 24-19 1.256.014.325 23-19 2.379.515.648 402-395 2.042.887 9-9 1.041.520 51-43 2.451 11
12 14 Çolakoğlu Metalurji A.Ş. İstanbul - 11 3.588.003.475 15-14 3.589.178.947 --- - 15-10 1.416.679.714 16-13 3.321.861.904 --- - 15-14 747.226 139-130 1.248 12
13 11 Mercedes-Benz T.A.Ş. İstanbul - 12 3.512.714.226 12-11 5.249.154.957 --- - --- - --- - --- - 19-18 564.167 17-12 5.731 13
14 13 Vestel Elektronik San. ve Tic. A.Ş. İstanbul - 13 3.378.591.847 17-16 3.418.403.092 65-58 230.506.476 14-9 1.528.496.070 14-11 3.669.521.556 49-44 121.715.107 6-6 1.663.699 20-14 5.222 14
15 16 Türkiye Kömür İşletmeleri Kurumu Public 2 - 2.886.203.748 19-2 3.182.800.596 9-2 1.575.032.872 7-3 2.448.058.711 17-4 3.035.860.078 3-2 860.015.795 --- - 8-4 7.318 15
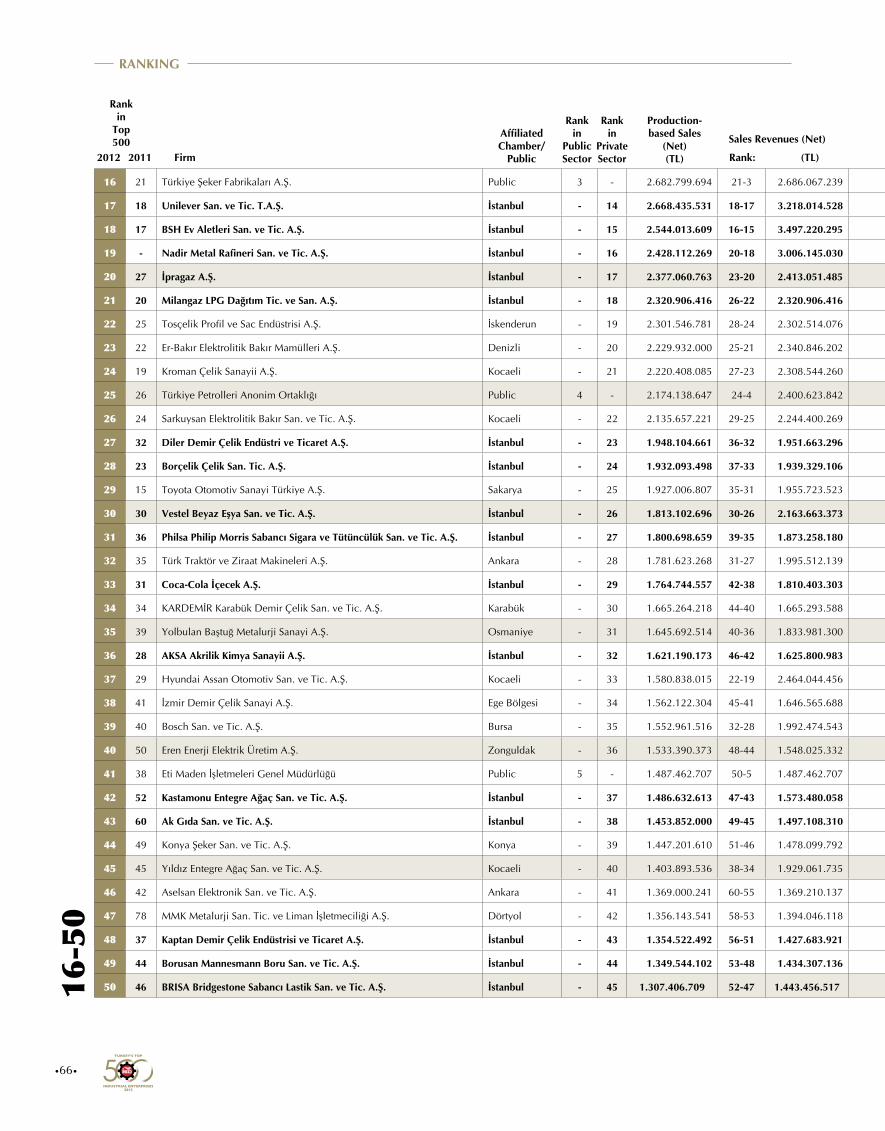
Rank: Rank: Rank: Rank:Rank:(TL) (TL) Rank: (TL) (TL) Number:($ 000)Firm2012 2011 Rank: (TL)
Gross Value Added (at Producers’ Prices) Equity Capital Total Assets Exports
Profit (Before Tax)/Loss for the Period
Average No. of Wage Employees
Rank in
Top 500
Affiliated Chamber/
Public
Rank in
Public Sector
Rank in
Private Sector
Production-based Sales
(Net) (TL)
Sales Revenues (Net)
Rank in
Top 5002012
•66•
16-5
0RANKING
16 21 Türkiye Şeker Fabrikaları A.Ş. Public 3 - 2.682.799.694 21-3 2.686.067.239 24-5 727.120.725 8-4 2.239.979.632 12-3 3.941.680.677 497-12 -198.228.580 362-3 14.360 2-1 12.076 16
17 18 Unilever San. ve Tic. T.A.Ş. İstanbul - 14 2.668.435.531 18-17 3.218.014.528 --- - --- - --- - --- - 209-208 62.169 --- - 17
18 17 BSH Ev Aletleri San. ve Tic. A.Ş. İstanbul - 15 2.544.013.609 16-15 3.497.220.295 27-22 674.084.102 28-22 1.149.030.899 38-33 1.909.799.017 25-21 210.674.549 12-12 841.311 14-9 5.878 18
19 - Nadir Metal Rafineri San. ve Tic. A.Ş. İstanbul - 16 2.428.112.269 20-18 3.006.145.030 429-416 17.923.686 --- - --- - 388-382 2.843.466 62-61 191.867 491-478 100 19
20 27 İpragaz A.Ş. İstanbul - 17 2.377.060.763 23-20 2.413.051.485 17-13 873.407.512 154-145 251.712.983 123-115 653.977.046 138-133 41.812.894 437-432 1.529 227-215 760 20
21 20 Milangaz LPG Dağıtım Tic. ve San. A.Ş. İstanbul - 18 2.320.906.416 26-22 2.320.906.416 16-12 1.048.125.905 260-249 136.537.278 53-47 1.385.725.369 158-153 36.328.454 379-376 11.230 86-78 1.836 21
22 25 Tosçelik Profil ve Sac Endüstrisi A.Ş. İskenderun - 19 2.301.546.781 28-24 2.302.514.076 52-45 297.228.471 --- - --- - 129-124 45.877.281 35-34 367.503 --- - 22
23 22 Er-Bakır Elektrolitik Bakır Mamülleri A.Ş. Denizli - 20 2.229.932.000 25-21 2.340.846.202 192-182 89.551.400 349-338 77.174.617 110-102 751.863.068 121-116 47.369.772 21-20 515.605 242-230 699 23
24 19 Kroman Çelik Sanayii A.Ş. Kocaeli - 21 2.220.408.085 27-23 2.308.544.260 74-67 202.642.500 88-80 393.139.937 72-64 1.060.079.437 480-471 -24.761.955 30-29 405.094 187-176 950 24
25 26 Türkiye Petrolleri Anonim Ortaklığı Public 4 - 2.174.138.647 24-4 2.400.623.842 7-1 2.427.244.939 2-2 6.918.207.721 4-2 7.906.281.291 1-1 1.471.136.277 --- - 21-7 4.804 25
26 24 Sarkuysan Elektrolitik Bakır San. ve Tic. A.Ş. Kocaeli - 22 2.135.657.221 29-25 2.244.400.269 236-225 70.890.354 161-152 239.801.397 100-92 847.041.249 181-175 30.102.672 27-26 470.633 258-246 640 26
27 32 Diler Demir Çelik Endüstri ve Ticaret A.Ş. İstanbul - 23 1.948.104.661 36-32 1.951.663.296 431-418 17.820.167 99-90 364.799.221 61-53 1.236.096.969 486-476 -39.772.033 16-15 728.305 222-210 798 27
28 23 Borçelik Çelik San. Tic. A.Ş. İstanbul - 24 1.932.093.498 37-33 1.939.329.106 101-93 167.218.591 93-84 379.440.193 73-65 1.059.616.122 141-136 41.582.804 63-62 191.258 238-226 703 28
29 15 Toyota Otomotiv Sanayi Türkiye A.Ş. Sakarya - 25 1.927.006.807 35-31 1.955.723.523 --- - --- - --- - --- - 10-10 957.214 55-47 2.382 29
30 30 Vestel Beyaz Eşya San. ve Tic. A.Ş. İstanbul - 26 1.813.102.696 30-26 2.163.663.373 43-37 406.144.849 76-68 447.782.134 56-50 1.341.501.315 482-472 -25.533.666 13-13 822.319 15-10 5.830 30
31 36 Philsa Philip Morris Sabancı Sigara ve Tütüncülük San. ve Tic. A.Ş. İstanbul - 27 1.800.698.659 39-35 1.873.258.180 --- - --- - --- - --- - --- - --- - 31
32 35 Türk Traktör ve Ziraat Makineleri A.Ş. Ankara - 28 1.781.623.268 31-27 1.995.512.139 30-25 617.200.487 54-46 628.966.003 54-48 1.368.710.103 15-11 297.701.096 36-35 349.897 44-36 2.561 32
33 31 Coca-Cola İçecek A.Ş. İstanbul - 29 1.764.744.557 42-38 1.810.403.303 32-27 540.127.658 16-11 1.384.819.652 19-15 2.538.175.516 23-19 224.293.664 350-348 17.105 166-155 1.070 33
34 34 KARDEMİR Karabük Demir Çelik San. ve Tic. A.Ş. Karabük - 30 1.665.264.218 44-40 1.665.293.588 --- - --- - --- - --- - --- - --- - 34
35 39 Yolbulan Baştuğ Metalurji Sanayi A.Ş. Osmaniye - 31 1.645.692.514 40-36 1.833.981.300 140-131 125.450.259 321-310 94.299.077 113-105 734.272.802 307-301 9.834.016 181-180 77.090 270-258 607 35
36 28 AKSA Akrilik Kimya Sanayii A.Ş. İstanbul - 32 1.621.190.173 46-42 1.625.800.983 37-31 460.466.904 34-28 986.061.018 44-39 1.664.001.730 14-10 335.345.461 37-36 322.695 228-216 756 36
37 29 Hyundai Assan Otomotiv San. ve Tic. A.Ş. Kocaeli - 33 1.580.838.015 22-19 2.464.044.456 --- - --- - --- - --- - 157-156 89.458 --- - 37
38 41 İzmir Demir Çelik Sanayi A.Ş. Ege Bölgesi - 34 1.562.122.304 45-41 1.646.565.688 340-327 41.707.166 67-59 512.006.590 84-76 996.766.151 455-447 -4.934.160 18-17 588.661 186-175 952 38
39 40 Bosch San. ve Tic. A.Ş. Bursa - 35 1.552.961.516 32-28 1.992.474.543 --- - --- - 41-36 1.795.561.281 --- - 11-11 848.705 18-13 5.652 39
40 50 Eren Enerji Elektrik Üretim A.Ş. Zonguldak - 36 1.533.390.373 48-44 1.548.025.332 --- - 50-42 682.755.337 33-29 2.043.254.634 --- - --- - 273-261 599 40
41 38 Eti Maden İşletmeleri Genel Müdürlüğü Public 5 - 1.487.462.707 50-5 1.487.462.707 15-4 1.068.918.753 11-5 1.735.237.771 37-5 1.942.111.390 5-3 779.076.724 14-1 795.814 27-8 3.754 41
42 52 Kastamonu Entegre Ağaç San. ve Tic. A.Ş. İstanbul - 37 1.486.632.613 47-43 1.573.480.058 45-39 369.912.106 52-44 656.319.849 20-16 2.476.170.419 26-22 210.243.727 104-103 121.717 69-61 2.060 42
43 60 Ak Gıda San. ve Tic. A.Ş. İstanbul - 38 1.453.852.000 49-45 1.497.108.310 141-132 123.771.491 122-113 302.444.175 99-91 847.290.094 219-213 22.592.127 250-248 45.984 107-99 1.523 43
44 49 Konya Şeker San. ve Tic. A.Ş. Konya - 39 1.447.201.610 51-46 1.478.099.792 42-36 406.279.140 33-27 1.038.207.049 36-32 1.983.574.718 42-38 142.782.148 380-377 11.162 42-34 2.608 44
45 45 Yıldız Entegre Ağaç San. ve Tic. A.Ş. Kocaeli - 40 1.403.893.536 38-34 1.929.061.735 39-33 439.506.801 36-30 933.824.708 28-24 2.178.565.135 21-17 232.538.007 219-217 57.785 92-84 1.733 45
46 42 Aselsan Elektronik San. ve Tic. A.Ş. Ankara - 41 1.369.000.241 60-55 1.369.210.137 22-18 756.093.524 27-21 1.159.809.690 13-10 3.836.745.224 18-14 244.902.216 82-81 154.202 22-15 4.600 46
47 78 MMK Metalurji San. Tic. ve Liman İşletmeciliği A.Ş. Dörtyol - 42 1.356.143.541 58-53 1.394.046.118 --- - --- - --- - --- - 67-66 176.922 95-87 1.700 47
48 37 Kaptan Demir Çelik Endüstrisi ve Ticaret A.Ş. İstanbul - 43 1.354.522.492 56-51 1.427.683.921 308-295 48.659.427 129-120 290.288.392 78-70 1.012.998.773 276-270 13.417.329 20-19 546.843 206-195 860 48
49 44 Borusan Mannesmann Boru San. ve Tic. A.Ş. İstanbul - 44 1.349.544.102 53-48 1.434.307.136 89-82 181.086.619 158-149 245.528.572 77-69 1.018.387.356 80-75 75.846.581 26-25 483.601 131-122 1.303 49
50 46 BRISA Bridgestone Sabancı Lastik San. ve Tic. A.Ş. İstanbul - 45 1.307.406.709 52-47 1.443.456.517 38-32 444.909.044 75-67 471.787.993 62-54 1.208.123.039 54-49 111.460.221 52-51 217.903 90-82 1.745 50
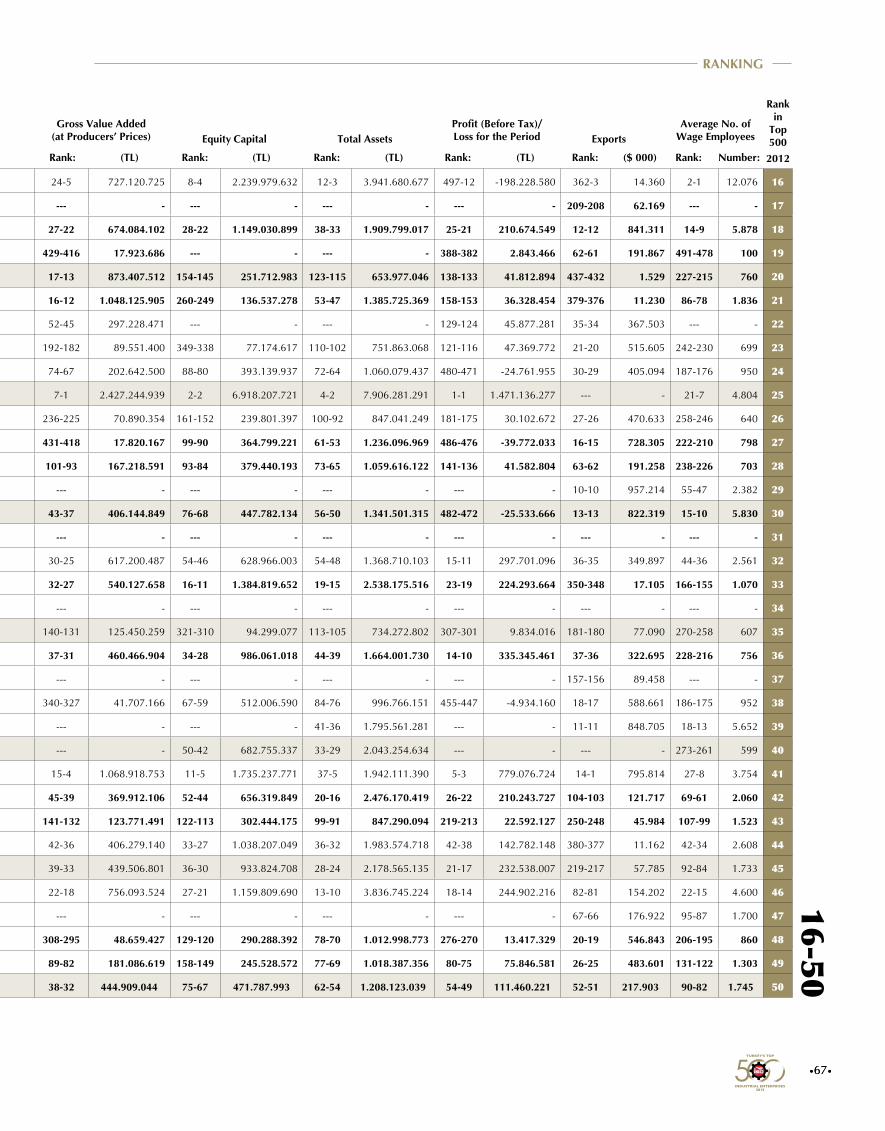
•67•
Rank: Rank: Rank: Rank:Rank:(TL) (TL) Rank: (TL) (TL) Number:($ 000)Firm2012 2011 Rank: (TL)
Gross Value Added (at Producers’ Prices) Equity Capital Total Assets Exports
Profit (Before Tax)/Loss for the Period
Average No. of Wage Employees
Rank in
Top 500
Affiliated Chamber/
Public
Rank in
Public Sector
Rank in
Private Sector
Production-based Sales
(Net) (TL)
Sales Revenues (Net)
Rank in
Top 5002012
•67•
16-50RANKING
16 21 Türkiye Şeker Fabrikaları A.Ş. Public 3 - 2.682.799.694 21-3 2.686.067.239 24-5 727.120.725 8-4 2.239.979.632 12-3 3.941.680.677 497-12 -198.228.580 362-3 14.360 2-1 12.076 16
17 18 Unilever San. ve Tic. T.A.Ş. İstanbul - 14 2.668.435.531 18-17 3.218.014.528 --- - --- - --- - --- - 209-208 62.169 --- - 17
18 17 BSH Ev Aletleri San. ve Tic. A.Ş. İstanbul - 15 2.544.013.609 16-15 3.497.220.295 27-22 674.084.102 28-22 1.149.030.899 38-33 1.909.799.017 25-21 210.674.549 12-12 841.311 14-9 5.878 18
19 - Nadir Metal Rafineri San. ve Tic. A.Ş. İstanbul - 16 2.428.112.269 20-18 3.006.145.030 429-416 17.923.686 --- - --- - 388-382 2.843.466 62-61 191.867 491-478 100 19
20 27 İpragaz A.Ş. İstanbul - 17 2.377.060.763 23-20 2.413.051.485 17-13 873.407.512 154-145 251.712.983 123-115 653.977.046 138-133 41.812.894 437-432 1.529 227-215 760 20
21 20 Milangaz LPG Dağıtım Tic. ve San. A.Ş. İstanbul - 18 2.320.906.416 26-22 2.320.906.416 16-12 1.048.125.905 260-249 136.537.278 53-47 1.385.725.369 158-153 36.328.454 379-376 11.230 86-78 1.836 21
22 25 Tosçelik Profil ve Sac Endüstrisi A.Ş. İskenderun - 19 2.301.546.781 28-24 2.302.514.076 52-45 297.228.471 --- - --- - 129-124 45.877.281 35-34 367.503 --- - 22
23 22 Er-Bakır Elektrolitik Bakır Mamülleri A.Ş. Denizli - 20 2.229.932.000 25-21 2.340.846.202 192-182 89.551.400 349-338 77.174.617 110-102 751.863.068 121-116 47.369.772 21-20 515.605 242-230 699 23
24 19 Kroman Çelik Sanayii A.Ş. Kocaeli - 21 2.220.408.085 27-23 2.308.544.260 74-67 202.642.500 88-80 393.139.937 72-64 1.060.079.437 480-471 -24.761.955 30-29 405.094 187-176 950 24
25 26 Türkiye Petrolleri Anonim Ortaklığı Public 4 - 2.174.138.647 24-4 2.400.623.842 7-1 2.427.244.939 2-2 6.918.207.721 4-2 7.906.281.291 1-1 1.471.136.277 --- - 21-7 4.804 25
26 24 Sarkuysan Elektrolitik Bakır San. ve Tic. A.Ş. Kocaeli - 22 2.135.657.221 29-25 2.244.400.269 236-225 70.890.354 161-152 239.801.397 100-92 847.041.249 181-175 30.102.672 27-26 470.633 258-246 640 26
27 32 Diler Demir Çelik Endüstri ve Ticaret A.Ş. İstanbul - 23 1.948.104.661 36-32 1.951.663.296 431-418 17.820.167 99-90 364.799.221 61-53 1.236.096.969 486-476 -39.772.033 16-15 728.305 222-210 798 27
28 23 Borçelik Çelik San. Tic. A.Ş. İstanbul - 24 1.932.093.498 37-33 1.939.329.106 101-93 167.218.591 93-84 379.440.193 73-65 1.059.616.122 141-136 41.582.804 63-62 191.258 238-226 703 28
29 15 Toyota Otomotiv Sanayi Türkiye A.Ş. Sakarya - 25 1.927.006.807 35-31 1.955.723.523 --- - --- - --- - --- - 10-10 957.214 55-47 2.382 29
30 30 Vestel Beyaz Eşya San. ve Tic. A.Ş. İstanbul - 26 1.813.102.696 30-26 2.163.663.373 43-37 406.144.849 76-68 447.782.134 56-50 1.341.501.315 482-472 -25.533.666 13-13 822.319 15-10 5.830 30
31 36 Philsa Philip Morris Sabancı Sigara ve Tütüncülük San. ve Tic. A.Ş. İstanbul - 27 1.800.698.659 39-35 1.873.258.180 --- - --- - --- - --- - --- - --- - 31
32 35 Türk Traktör ve Ziraat Makineleri A.Ş. Ankara - 28 1.781.623.268 31-27 1.995.512.139 30-25 617.200.487 54-46 628.966.003 54-48 1.368.710.103 15-11 297.701.096 36-35 349.897 44-36 2.561 32
33 31 Coca-Cola İçecek A.Ş. İstanbul - 29 1.764.744.557 42-38 1.810.403.303 32-27 540.127.658 16-11 1.384.819.652 19-15 2.538.175.516 23-19 224.293.664 350-348 17.105 166-155 1.070 33
34 34 KARDEMİR Karabük Demir Çelik San. ve Tic. A.Ş. Karabük - 30 1.665.264.218 44-40 1.665.293.588 --- - --- - --- - --- - --- - --- - 34
35 39 Yolbulan Baştuğ Metalurji Sanayi A.Ş. Osmaniye - 31 1.645.692.514 40-36 1.833.981.300 140-131 125.450.259 321-310 94.299.077 113-105 734.272.802 307-301 9.834.016 181-180 77.090 270-258 607 35
36 28 AKSA Akrilik Kimya Sanayii A.Ş. İstanbul - 32 1.621.190.173 46-42 1.625.800.983 37-31 460.466.904 34-28 986.061.018 44-39 1.664.001.730 14-10 335.345.461 37-36 322.695 228-216 756 36
37 29 Hyundai Assan Otomotiv San. ve Tic. A.Ş. Kocaeli - 33 1.580.838.015 22-19 2.464.044.456 --- - --- - --- - --- - 157-156 89.458 --- - 37
38 41 İzmir Demir Çelik Sanayi A.Ş. Ege Bölgesi - 34 1.562.122.304 45-41 1.646.565.688 340-327 41.707.166 67-59 512.006.590 84-76 996.766.151 455-447 -4.934.160 18-17 588.661 186-175 952 38
39 40 Bosch San. ve Tic. A.Ş. Bursa - 35 1.552.961.516 32-28 1.992.474.543 --- - --- - 41-36 1.795.561.281 --- - 11-11 848.705 18-13 5.652 39
40 50 Eren Enerji Elektrik Üretim A.Ş. Zonguldak - 36 1.533.390.373 48-44 1.548.025.332 --- - 50-42 682.755.337 33-29 2.043.254.634 --- - --- - 273-261 599 40
41 38 Eti Maden İşletmeleri Genel Müdürlüğü Public 5 - 1.487.462.707 50-5 1.487.462.707 15-4 1.068.918.753 11-5 1.735.237.771 37-5 1.942.111.390 5-3 779.076.724 14-1 795.814 27-8 3.754 41
42 52 Kastamonu Entegre Ağaç San. ve Tic. A.Ş. İstanbul - 37 1.486.632.613 47-43 1.573.480.058 45-39 369.912.106 52-44 656.319.849 20-16 2.476.170.419 26-22 210.243.727 104-103 121.717 69-61 2.060 42
43 60 Ak Gıda San. ve Tic. A.Ş. İstanbul - 38 1.453.852.000 49-45 1.497.108.310 141-132 123.771.491 122-113 302.444.175 99-91 847.290.094 219-213 22.592.127 250-248 45.984 107-99 1.523 43
44 49 Konya Şeker San. ve Tic. A.Ş. Konya - 39 1.447.201.610 51-46 1.478.099.792 42-36 406.279.140 33-27 1.038.207.049 36-32 1.983.574.718 42-38 142.782.148 380-377 11.162 42-34 2.608 44
45 45 Yıldız Entegre Ağaç San. ve Tic. A.Ş. Kocaeli - 40 1.403.893.536 38-34 1.929.061.735 39-33 439.506.801 36-30 933.824.708 28-24 2.178.565.135 21-17 232.538.007 219-217 57.785 92-84 1.733 45
46 42 Aselsan Elektronik San. ve Tic. A.Ş. Ankara - 41 1.369.000.241 60-55 1.369.210.137 22-18 756.093.524 27-21 1.159.809.690 13-10 3.836.745.224 18-14 244.902.216 82-81 154.202 22-15 4.600 46
47 78 MMK Metalurji San. Tic. ve Liman İşletmeciliği A.Ş. Dörtyol - 42 1.356.143.541 58-53 1.394.046.118 --- - --- - --- - --- - 67-66 176.922 95-87 1.700 47
48 37 Kaptan Demir Çelik Endüstrisi ve Ticaret A.Ş. İstanbul - 43 1.354.522.492 56-51 1.427.683.921 308-295 48.659.427 129-120 290.288.392 78-70 1.012.998.773 276-270 13.417.329 20-19 546.843 206-195 860 48
49 44 Borusan Mannesmann Boru San. ve Tic. A.Ş. İstanbul - 44 1.349.544.102 53-48 1.434.307.136 89-82 181.086.619 158-149 245.528.572 77-69 1.018.387.356 80-75 75.846.581 26-25 483.601 131-122 1.303 49
50 46 BRISA Bridgestone Sabancı Lastik San. ve Tic. A.Ş. İstanbul - 45 1.307.406.709 52-47 1.443.456.517 38-32 444.909.044 75-67 471.787.993 62-54 1.208.123.039 54-49 111.460.221 52-51 217.903 90-82 1.745 50
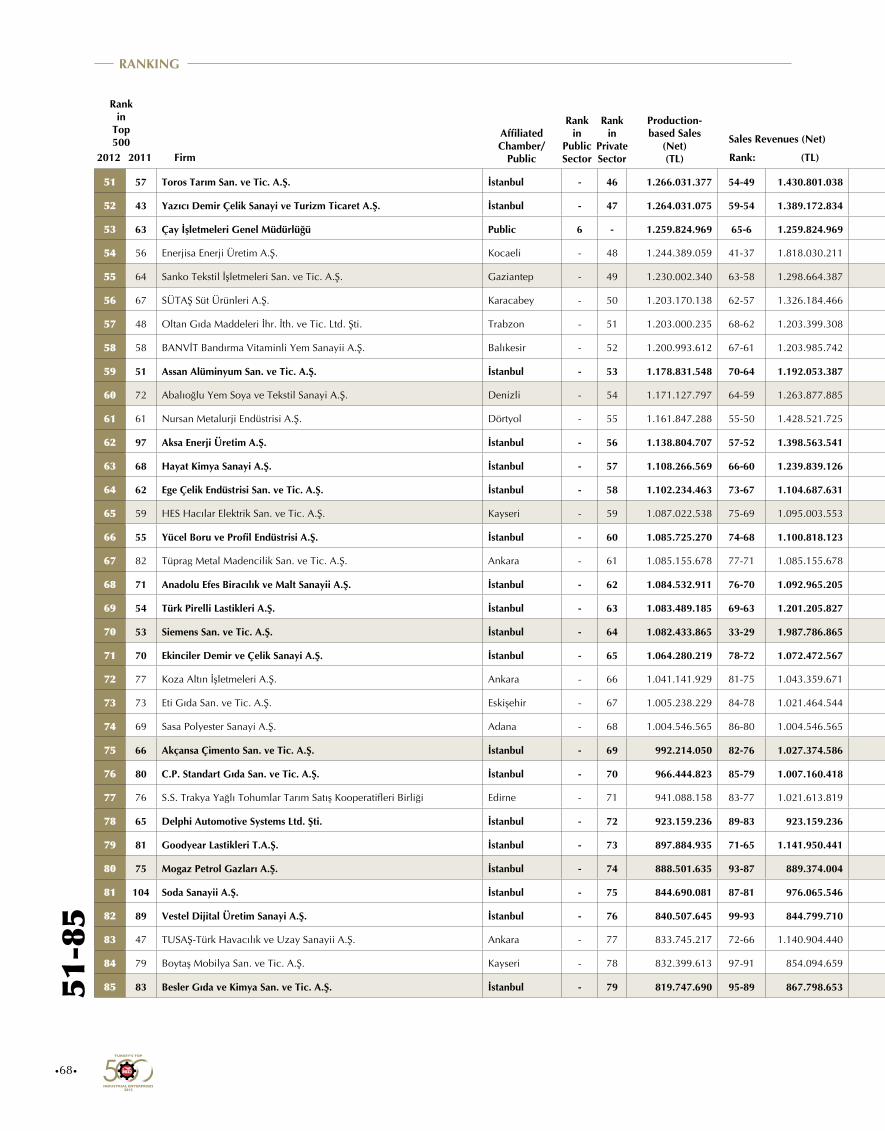
Rank: Rank: Rank: Rank:Rank:(TL) (TL) Rank: (TL) (TL) Number:($ 000)Firm2012 2011 Rank: (TL)
Gross Value Added (at Producers’ Prices) Equity Capital Total Assets Exports
Profit (Before Tax)/Loss for the Period
Average No. of Wage Employees
Rank in
Top 500
Affiliated Chamber/
Public
Rank in
Public Sector
Rank in
Private Sector
Production-based Sales
(Net) (TL)
Sales Revenues (Net)
Rank in
Top 5002012
•68•
51-8
5RANKING
51 57 Toros Tarım San. ve Tic. A.Ş. İstanbul - 46 1.266.031.377 54-49 1.430.801.038 80-73 189.189.237 57-49 605.817.862 87-79 949.596.714 46-41 133.554.338 383-380 10.726 278-266 580 51
52 43 Yazıcı Demir Çelik Sanayi ve Turizm Ticaret A.Ş. İstanbul - 47 1.264.031.075 59-54 1.389.172.834 302-289 50.178.536 63-55 555.824.279 55-49 1.342.079.497 160-154 36.215.284 17-16 629.972 269-257 615 52
53 63 Çay İşletmeleri Genel Müdürlüğü Public 6 - 1.259.824.969 65-6 1.259.824.969 46-7 357.049.841 49-8 714.407.901 57-7 1.278.686.496 492-11 -64.827.541 387-4 9.699 9-5 7.156 53
54 56 Enerjisa Enerji Üretim A.Ş. Kocaeli - 48 1.244.389.059 41-37 1.818.030.211 --- - --- - 5-3 7.496.078.081 --- - --- - --- - 54
55 64 Sanko Tekstil İşletmeleri San. ve Tic. A.Ş. Gaziantep - 49 1.230.002.340 63-58 1.298.664.387 66-59 227.991.291 23-18 1.256.485.771 22-18 2.401.041.841 148-143 39.518.816 39-38 297.031 10-5 6.740 55
56 67 SÜTAŞ Süt Ürünleri A.Ş. Karacabey - 50 1.203.170.138 62-57 1.326.184.466 53-46 295.888.888 178-169 218.760.650 147-138 556.209.358 47-42 128.352.668 385-382 10.296 35-27 3.278 56
57 48 Oltan Gıda Maddeleri İhr. İth. ve Tic. Ltd. Şti. Trabzon - 51 1.203.000.235 68-62 1.203.399.308 430-417 17.820.769 359-347 72.535.555 216-205 383.733.917 308-302 9.829.864 23-22 496.159 383-370 310 57
58 58 BANVİT Bandırma Vitaminli Yem Sanayii A.Ş. Balıkesir - 52 1.200.993.612 67-61 1.203.985.742 87-80 181.280.946 276-265 123.819.508 102-94 811.778.256 321-315 8.640.685 202-201 65.262 33-25 3.393 58
59 51 Assan Alüminyum San. ve Tic. A.Ş. İstanbul - 53 1.178.831.548 70-64 1.192.053.387 82-75 184.348.041 82-74 411.905.025 85-77 952.322.142 75-70 86.195.977 22-21 500.136 183-172 970 59
60 72 Abalıoğlu Yem Soya ve Tekstil Sanayi A.Ş. Denizli - 54 1.171.127.797 64-59 1.263.877.885 --- - --- - --- - --- - --- - --- - 60
61 61 Nursan Metalurji Endüstrisi A.Ş. Dörtyol - 55 1.161.847.288 55-50 1.428.521.725 164-155 104.562.026 165-156 233.168.573 96-88 862.365.497 311-305 9.464.779 38-37 315.190 285-273 544 61
62 97 Aksa Enerji Üretim A.Ş. İstanbul - 56 1.138.804.707 57-52 1.398.563.541 88-81 181.223.512 42-36 824.140.620 35-31 2.024.411.567 140-135 41.593.842 176-175 78.881 401-388 280 62
63 68 Hayat Kimya Sanayi A.Ş. İstanbul - 57 1.108.266.569 66-60 1.239.839.126 --- - --- - --- - --- - 47-46 239.806 78-70 1.945 63
64 62 Ege Çelik Endüstrisi San. ve Tic. A.Ş. İstanbul - 58 1.102.234.463 73-67 1.104.687.631 193-183 89.198.514 233-222 157.536.849 208-198 406.114.659 398-391 2.176.028 119-118 110.463 255-243 649 64
65 59 HES Hacılar Elektrik San. ve Tic. A.Ş. Kayseri - 59 1.087.022.538 75-69 1.095.003.553 188-179 91.966.293 132-123 287.769.810 119-111 667.849.378 152-147 37.954.238 71-70 170.855 180-169 998 65
66 55 Yücel Boru ve Profil Endüstrisi A.Ş. İstanbul - 60 1.085.725.270 74-68 1.100.818.123 167-158 104.154.644 87-79 401.021.061 117-109 688.993.623 154-149 37.326.068 129-128 103.101 235-223 711 66
67 82 Tüprag Metal Madencilik San. ve Tic. A.Ş. Ankara - 61 1.085.155.678 77-71 1.085.155.678 18-14 857.450.554 20-15 1.319.110.310 51-45 1.414.612.270 7-4 681.692.288 189-188 72.149 157-147 1.089 67
68 71 Anadolu Efes Biracılık ve Malt Sanayii A.Ş. İstanbul - 62 1.084.532.911 76-70 1.092.965.205 5-5 3.368.330.190 4-2 5.217.641.158 6-4 7.312.732.796 13-9 354.897.086 262-260 42.100 173-162 1.034 68
69 54 Türk Pirelli Lastikleri A.Ş. İstanbul - 63 1.083.489.185 69-63 1.201.205.827 56-49 268.841.294 143-134 263.514.745 139-130 574.915.196 170-164 33.093.966 33-32 375.122 93-85 1.710 69
70 53 Siemens San. ve Tic. A.Ş. İstanbul - 64 1.082.433.865 33-29 1.987.786.865 31-26 560.059.303 79-71 424.572.358 47-41 1.458.567.701 33-29 185.761.614 24-23 491.822 43-35 2.579 70
71 70 Ekinciler Demir ve Çelik Sanayi A.Ş. İstanbul - 65 1.064.280.219 78-72 1.072.472.567 237-226 70.630.770 --- - --- - 231-225 19.546.004 28-27 427.214 217-205 810 71
72 77 Koza Altın İşletmeleri A.Ş. Ankara - 66 1.041.141.929 81-75 1.043.359.671 21-17 777.254.397 17-12 1.359.430.852 46-40 1.475.586.422 6-3 712.747.544 --- - 141-132 1.240 72
73 73 Eti Gıda San. ve Tic. A.Ş. Eskişehir - 67 1.005.238.229 84-78 1.021.464.544 --- - --- - --- - --- - 211-210 61.001 --- - 73
74 69 Sasa Polyester Sanayi A.Ş. Adana - 68 1.004.546.565 86-80 1.004.546.565 211-201 80.187.996 159-150 242.998.765 122-114 662.844.801 484-474 -30.111.156 65-64 183.719 138-129 1.249 74
75 66 Akçansa Çimento San. ve Tic. A.Ş. İstanbul - 69 992.214.050 82-76 1.027.374.586 48-41 337.296.481 53-45 640.438.841 76-68 1.031.805.805 37-33 156.165.842 108-107 118.454 153-143 1.111 75
76 80 C.P. Standart Gıda San. ve Tic. A.Ş. İstanbul - 70 966.444.823 85-79 1.007.160.418 --- - 306-295 100.744.281 183-173 452.451.698 --- - 364-361 13.831 34-26 3.319 76
77 76 S.S. Trakya Yağlı Tohumlar Tarım Satış Kooperatifleri Birliği Edirne - 71 941.088.158 83-77 1.021.613.819 249-238 64.763.849 128-119 290.382.574 174-164 469.065.221 299-293 10.381.917 --- - 194-183 905 77
78 65 Delphi Automotive Systems Ltd. Şti. İstanbul - 72 923.159.236 89-83 923.159.236 --- - --- - --- - --- - --- - --- - 78
79 81 Goodyear Lastikleri T.A.Ş. İstanbul - 73 897.884.935 71-65 1.141.950.441 61-54 243.678.078 119-110 307.211.834 154-145 542.680.944 82-77 74.155.801 34-33 372.510 128-119 1.314 79
80 75 Mogaz Petrol Gazları A.Ş. İstanbul - 74 888.501.635 93-87 889.374.004 281-269 55.432.661 257-246 137.378.962 354-342 213.298.962 251-245 16.482.720 450-445 237 477-464 142 80
81 104 Soda Sanayii A.Ş. İstanbul - 75 844.690.081 87-81 976.065.546 59-52 262.723.257 37-31 894.856.165 66-58 1.168.011.735 63-58 104.458.392 41-40 274.122 181-170 975 81
82 89 Vestel Dijital Üretim Sanayi A.Ş. İstanbul - 76 840.507.645 99-93 844.799.710 184-175 94.391.876 287-276 113.213.776 418-405 150.841.737 204-198 24.819.836 55-54 206.057 192-181 917 82
83 47 TUSAŞ-Türk Havacılık ve Uzay Sanayii A.Ş. Ankara - 77 833.745.217 72-66 1.140.904.440 29-24 641.593.541 30-24 1.059.307.389 30-26 2.102.928.221 27-23 209.611.535 44-43 250.499 24-17 4.172 83
84 79 Boytaş Mobilya San. ve Tic. A.Ş. Kayseri - 78 832.399.613 97-91 854.094.659 62-55 237.595.608 71-63 489.607.577 129-120 619.709.803 60-55 108.205.042 253-251 44.812 28-20 3.672 84
85 83 Besler Gıda ve Kimya San. ve Tic. A.Ş. İstanbul - 79 819.747.690 95-89 867.798.653 245-234 65.873.348 183-174 212.516.090 95-87 874.676.868 136-131 42.390.309 314-312 26.542 328-316 423 85
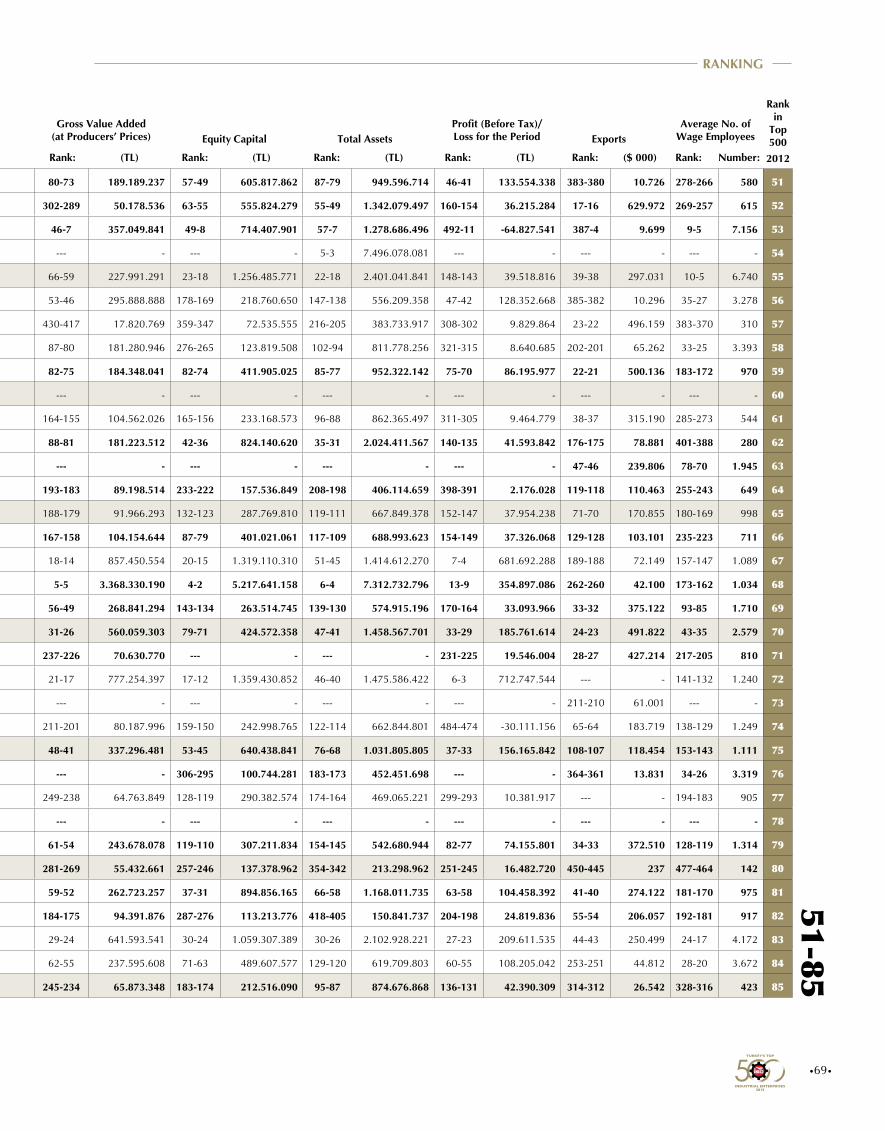
•69•
Rank: Rank: Rank: Rank:Rank:(TL) (TL) Rank: (TL) (TL) Number:($ 000)Firm2012 2011 Rank: (TL)
Gross Value Added (at Producers’ Prices) Equity Capital Total Assets Exports
Profit (Before Tax)/Loss for the Period
Average No. of Wage Employees
Rank in
Top 500
Affiliated Chamber/
Public
Rank in
Public Sector
Rank in
Private Sector
Production-based Sales
(Net) (TL)
Sales Revenues (Net)
Rank in
Top 5002012
51-85RANKING
51 57 Toros Tarım San. ve Tic. A.Ş. İstanbul - 46 1.266.031.377 54-49 1.430.801.038 80-73 189.189.237 57-49 605.817.862 87-79 949.596.714 46-41 133.554.338 383-380 10.726 278-266 580 51
52 43 Yazıcı Demir Çelik Sanayi ve Turizm Ticaret A.Ş. İstanbul - 47 1.264.031.075 59-54 1.389.172.834 302-289 50.178.536 63-55 555.824.279 55-49 1.342.079.497 160-154 36.215.284 17-16 629.972 269-257 615 52
53 63 Çay İşletmeleri Genel Müdürlüğü Public 6 - 1.259.824.969 65-6 1.259.824.969 46-7 357.049.841 49-8 714.407.901 57-7 1.278.686.496 492-11 -64.827.541 387-4 9.699 9-5 7.156 53
54 56 Enerjisa Enerji Üretim A.Ş. Kocaeli - 48 1.244.389.059 41-37 1.818.030.211 --- - --- - 5-3 7.496.078.081 --- - --- - --- - 54
55 64 Sanko Tekstil İşletmeleri San. ve Tic. A.Ş. Gaziantep - 49 1.230.002.340 63-58 1.298.664.387 66-59 227.991.291 23-18 1.256.485.771 22-18 2.401.041.841 148-143 39.518.816 39-38 297.031 10-5 6.740 55
56 67 SÜTAŞ Süt Ürünleri A.Ş. Karacabey - 50 1.203.170.138 62-57 1.326.184.466 53-46 295.888.888 178-169 218.760.650 147-138 556.209.358 47-42 128.352.668 385-382 10.296 35-27 3.278 56
57 48 Oltan Gıda Maddeleri İhr. İth. ve Tic. Ltd. Şti. Trabzon - 51 1.203.000.235 68-62 1.203.399.308 430-417 17.820.769 359-347 72.535.555 216-205 383.733.917 308-302 9.829.864 23-22 496.159 383-370 310 57
58 58 BANVİT Bandırma Vitaminli Yem Sanayii A.Ş. Balıkesir - 52 1.200.993.612 67-61 1.203.985.742 87-80 181.280.946 276-265 123.819.508 102-94 811.778.256 321-315 8.640.685 202-201 65.262 33-25 3.393 58
59 51 Assan Alüminyum San. ve Tic. A.Ş. İstanbul - 53 1.178.831.548 70-64 1.192.053.387 82-75 184.348.041 82-74 411.905.025 85-77 952.322.142 75-70 86.195.977 22-21 500.136 183-172 970 59
60 72 Abalıoğlu Yem Soya ve Tekstil Sanayi A.Ş. Denizli - 54 1.171.127.797 64-59 1.263.877.885 --- - --- - --- - --- - --- - --- - 60
61 61 Nursan Metalurji Endüstrisi A.Ş. Dörtyol - 55 1.161.847.288 55-50 1.428.521.725 164-155 104.562.026 165-156 233.168.573 96-88 862.365.497 311-305 9.464.779 38-37 315.190 285-273 544 61
62 97 Aksa Enerji Üretim A.Ş. İstanbul - 56 1.138.804.707 57-52 1.398.563.541 88-81 181.223.512 42-36 824.140.620 35-31 2.024.411.567 140-135 41.593.842 176-175 78.881 401-388 280 62
63 68 Hayat Kimya Sanayi A.Ş. İstanbul - 57 1.108.266.569 66-60 1.239.839.126 --- - --- - --- - --- - 47-46 239.806 78-70 1.945 63
64 62 Ege Çelik Endüstrisi San. ve Tic. A.Ş. İstanbul - 58 1.102.234.463 73-67 1.104.687.631 193-183 89.198.514 233-222 157.536.849 208-198 406.114.659 398-391 2.176.028 119-118 110.463 255-243 649 64
65 59 HES Hacılar Elektrik San. ve Tic. A.Ş. Kayseri - 59 1.087.022.538 75-69 1.095.003.553 188-179 91.966.293 132-123 287.769.810 119-111 667.849.378 152-147 37.954.238 71-70 170.855 180-169 998 65
66 55 Yücel Boru ve Profil Endüstrisi A.Ş. İstanbul - 60 1.085.725.270 74-68 1.100.818.123 167-158 104.154.644 87-79 401.021.061 117-109 688.993.623 154-149 37.326.068 129-128 103.101 235-223 711 66
67 82 Tüprag Metal Madencilik San. ve Tic. A.Ş. Ankara - 61 1.085.155.678 77-71 1.085.155.678 18-14 857.450.554 20-15 1.319.110.310 51-45 1.414.612.270 7-4 681.692.288 189-188 72.149 157-147 1.089 67
68 71 Anadolu Efes Biracılık ve Malt Sanayii A.Ş. İstanbul - 62 1.084.532.911 76-70 1.092.965.205 5-5 3.368.330.190 4-2 5.217.641.158 6-4 7.312.732.796 13-9 354.897.086 262-260 42.100 173-162 1.034 68
69 54 Türk Pirelli Lastikleri A.Ş. İstanbul - 63 1.083.489.185 69-63 1.201.205.827 56-49 268.841.294 143-134 263.514.745 139-130 574.915.196 170-164 33.093.966 33-32 375.122 93-85 1.710 69
70 53 Siemens San. ve Tic. A.Ş. İstanbul - 64 1.082.433.865 33-29 1.987.786.865 31-26 560.059.303 79-71 424.572.358 47-41 1.458.567.701 33-29 185.761.614 24-23 491.822 43-35 2.579 70
71 70 Ekinciler Demir ve Çelik Sanayi A.Ş. İstanbul - 65 1.064.280.219 78-72 1.072.472.567 237-226 70.630.770 --- - --- - 231-225 19.546.004 28-27 427.214 217-205 810 71
72 77 Koza Altın İşletmeleri A.Ş. Ankara - 66 1.041.141.929 81-75 1.043.359.671 21-17 777.254.397 17-12 1.359.430.852 46-40 1.475.586.422 6-3 712.747.544 --- - 141-132 1.240 72
73 73 Eti Gıda San. ve Tic. A.Ş. Eskişehir - 67 1.005.238.229 84-78 1.021.464.544 --- - --- - --- - --- - 211-210 61.001 --- - 73
74 69 Sasa Polyester Sanayi A.Ş. Adana - 68 1.004.546.565 86-80 1.004.546.565 211-201 80.187.996 159-150 242.998.765 122-114 662.844.801 484-474 -30.111.156 65-64 183.719 138-129 1.249 74
75 66 Akçansa Çimento San. ve Tic. A.Ş. İstanbul - 69 992.214.050 82-76 1.027.374.586 48-41 337.296.481 53-45 640.438.841 76-68 1.031.805.805 37-33 156.165.842 108-107 118.454 153-143 1.111 75
76 80 C.P. Standart Gıda San. ve Tic. A.Ş. İstanbul - 70 966.444.823 85-79 1.007.160.418 --- - 306-295 100.744.281 183-173 452.451.698 --- - 364-361 13.831 34-26 3.319 76
77 76 S.S. Trakya Yağlı Tohumlar Tarım Satış Kooperatifleri Birliği Edirne - 71 941.088.158 83-77 1.021.613.819 249-238 64.763.849 128-119 290.382.574 174-164 469.065.221 299-293 10.381.917 --- - 194-183 905 77
78 65 Delphi Automotive Systems Ltd. Şti. İstanbul - 72 923.159.236 89-83 923.159.236 --- - --- - --- - --- - --- - --- - 78
79 81 Goodyear Lastikleri T.A.Ş. İstanbul - 73 897.884.935 71-65 1.141.950.441 61-54 243.678.078 119-110 307.211.834 154-145 542.680.944 82-77 74.155.801 34-33 372.510 128-119 1.314 79
80 75 Mogaz Petrol Gazları A.Ş. İstanbul - 74 888.501.635 93-87 889.374.004 281-269 55.432.661 257-246 137.378.962 354-342 213.298.962 251-245 16.482.720 450-445 237 477-464 142 80
81 104 Soda Sanayii A.Ş. İstanbul - 75 844.690.081 87-81 976.065.546 59-52 262.723.257 37-31 894.856.165 66-58 1.168.011.735 63-58 104.458.392 41-40 274.122 181-170 975 81
82 89 Vestel Dijital Üretim Sanayi A.Ş. İstanbul - 76 840.507.645 99-93 844.799.710 184-175 94.391.876 287-276 113.213.776 418-405 150.841.737 204-198 24.819.836 55-54 206.057 192-181 917 82
83 47 TUSAŞ-Türk Havacılık ve Uzay Sanayii A.Ş. Ankara - 77 833.745.217 72-66 1.140.904.440 29-24 641.593.541 30-24 1.059.307.389 30-26 2.102.928.221 27-23 209.611.535 44-43 250.499 24-17 4.172 83
84 79 Boytaş Mobilya San. ve Tic. A.Ş. Kayseri - 78 832.399.613 97-91 854.094.659 62-55 237.595.608 71-63 489.607.577 129-120 619.709.803 60-55 108.205.042 253-251 44.812 28-20 3.672 84
85 83 Besler Gıda ve Kimya San. ve Tic. A.Ş. İstanbul - 79 819.747.690 95-89 867.798.653 245-234 65.873.348 183-174 212.516.090 95-87 874.676.868 136-131 42.390.309 314-312 26.542 328-316 423 85
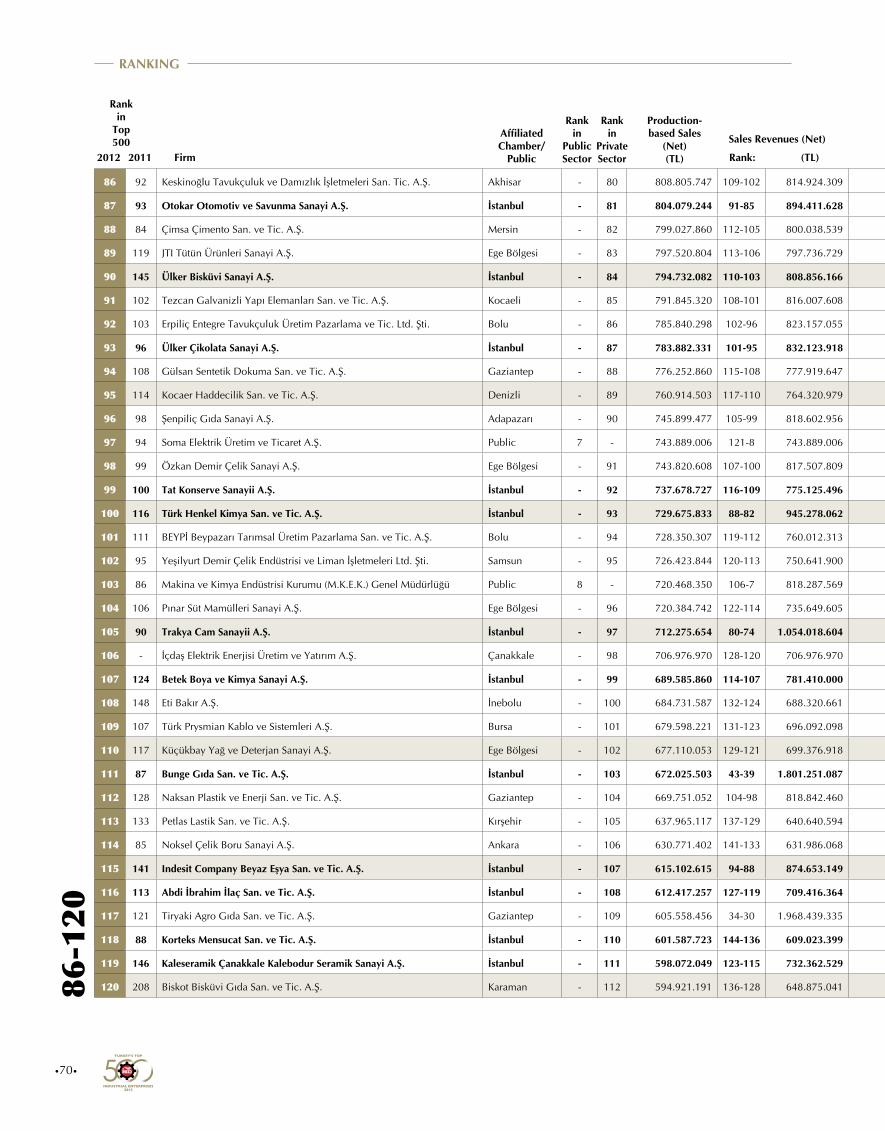
Rank: Rank: Rank: Rank:Rank:(TL) (TL) Rank: (TL) (TL) Number:($ 000)Firm2012 2011 Rank: (TL)
Gross Value Added (at Producers’ Prices) Equity Capital Total Assets Exports
Profit (Before Tax)/Loss for the Period
Average No. of Wage Employees
Rank in
Top 500
Affiliated Chamber/
Public
Rank in
Public Sector
Rank in
Private Sector
Production-based Sales
(Net) (TL)
Sales Revenues (Net)
Rank in
Top 5002012
•70•
86-1
20RANKING
86 92 Keskinoğlu Tavukçuluk ve Damızlık İşletmeleri San. Tic. A.Ş. Akhisar - 80 808.805.747 109-102 814.924.309 --- - --- - --- - --- - 167-166 84.652 38-30 3.150 86
87 93 Otokar Otomotiv ve Savunma Sanayi A.Ş. İstanbul - 81 804.079.244 91-85 894.411.628 57-50 267.517.818 174-165 223.571.437 71-63 1.089.394.225 85-80 71.297.806 85-84 145.786 75-67 2.004 87
88 84 Çimsa Çimento San. ve Tic. A.Ş. Mersin - 82 799.027.860 112-105 800.038.539 54-47 286.857.989 51-43 666.942.915 69-61 1.120.491.900 45-40 134.096.514 117-116 111.133 177-166 1.004 88
89 119 JTI Tütün Ürünleri Sanayi A.Ş. Ege Bölgesi - 83 797.520.804 113-106 797.736.729 3-3 5.725.858.640 124-115 295.996.688 89-81 905.501.920 66-61 101.897.863 98-97 127.809 321-309 432 89
90 145 Ülker Bisküvi Sanayi A.Ş. İstanbul - 84 794.732.082 110-103 808.856.166 500-487 -220.584.193 18-13 1.359.148.138 24-20 2.365.704.626 498-486 -317.113.709 216-215 59.390 73-65 2.041 90
91 102 Tezcan Galvanizli Yapı Elemanları San. ve Tic. A.Ş. Kocaeli - 85 791.845.320 108-101 816.007.608 169-160 101.285.516 173-164 226.051.868 178-168 464.653.471 100-95 57.208.378 208-207 62.275 359-346 345 91
92 103 Erpiliç Entegre Tavukçuluk Üretim Pazarlama ve Tic. Ltd. Şti. Bolu - 86 785.840.298 102-96 823.157.055 199-189 85.352.484 207-198 179.113.477 234-223 340.658.302 197-191 26.331.115 371-368 12.817 57-49 2.358 92
93 96 Ülker Çikolata Sanayi A.Ş. İstanbul - 87 783.882.331 101-95 832.123.918 81-74 187.187.427 135-126 279.469.415 121-113 663.025.672 48-43 125.051.662 255-253 43.638 147-138 1.165 93
94 108 Gülsan Sentetik Dokuma San. ve Tic. A.Ş. Gaziantep - 88 776.252.860 115-108 777.919.647 --- - --- - --- - --- - --- - 61-53 2.255 94
95 114 Kocaer Haddecilik San. ve Tic. A.Ş. Denizli - 89 760.914.503 117-110 764.320.979 300-287 51.410.279 318-307 95.373.757 243-231 330.832.798 252-246 16.307.874 95-94 128.626 267-255 619 95
96 98 Şenpiliç Gıda Sanayi A.Ş. Adapazarı - 90 745.899.477 105-99 818.602.956 --- - --- - --- - --- - --- - 77-69 1.958 96
97 94 Soma Elektrik Üretim ve Ticaret A.Ş. Public 7 - 743.889.006 121-8 743.889.006 93-8 175.605.851 26-6 1.179.675.141 59-8 1.253.237.275 159-6 36.277.355 --- - 209-12 850 97
98 99 Özkan Demir Çelik Sanayi A.Ş. Ege Bölgesi - 91 743.820.608 107-100 817.507.809 177-168 97.753.689 123-114 298.832.100 82-74 1.000.903.766 331-325 8.151.884 43-42 258.241 216-204 817 98
99 100 Tat Konserve Sanayii A.Ş. İstanbul - 92 737.678.727 116-109 775.125.496 150-141 116.031.577 177-168 220.438.326 143-134 564.397.267 237-231 18.911.558 311-309 27.166 144-135 1.188 99
100 116 Türk Henkel Kimya San. ve Tic. A.Ş. İstanbul - 93 729.675.833 88-82 945.278.062 77-70 193.993.857 104-95 350.041.447 170-160 482.361.961 79-74 75.884.005 353-351 16.270 233-221 735 100
101 111 BEYPİ Beypazarı Tarımsal Üretim Pazarlama San. ve Tic. A.Ş. Bolu - 94 728.350.307 119-112 760.012.313 157-148 110.598.475 152-143 252.683.729 203-193 412.884.592 171-165 33.027.466 299-297 29.626 50-42 2.453 101
102 95 Yeşilyurt Demir Çelik Endüstrisi ve Liman İşletmeleri Ltd. Şti. Samsun - 95 726.423.844 120-113 750.641.900 174-165 99.424.252 263-252 134.563.993 286-274 284.197.673 452-445 -3.557.130 232-230 50.750 294-282 518 102
103 86 Makina ve Kimya Endüstrisi Kurumu (M.K.E.K.) Genel Müdürlüğü Public 8 - 720.468.350 106-7 818.287.569 35-6 483.761.933 43-7 822.966.665 45-6 1.562.585.373 43-5 138.807.779 218-2 58.585 19-6 5.574 103
104 106 Pınar Süt Mamülleri Sanayi A.Ş. Ege Bölgesi - 96 720.384.742 122-114 735.649.605 168-159 102.390.616 168-159 231.720.633 210-199 395.629.852 94-89 62.238.924 272-270 38.251 185-174 957 104
105 90 Trakya Cam Sanayii A.Ş. İstanbul - 97 712.275.654 80-74 1.054.018.604 63-56 234.981.238 21-16 1.285.945.730 42-37 1.762.677.486 41-37 146.447.002 139-138 97.477 87-79 1.805 105
106 - İçdaş Elektrik Enerjisi Üretim ve Yatırım A.Ş. Çanakkale - 98 706.976.970 128-120 706.976.970 92-85 176.394.038 74-66 471.938.312 48-42 1.457.342.013 38-34 150.048.106 --- - 247-235 667 106
107 124 Betek Boya ve Kimya Sanayi A.Ş. İstanbul - 99 689.585.860 114-107 781.410.000 129-120 136.153.429 167-158 232.548.022 98-90 847.830.177 122-117 47.287.739 277-275 37.252 161-150 1.077 107
108 148 Eti Bakır A.Ş. İnebolu - 100 684.731.587 132-124 688.320.661 41-35 414.559.116 40-34 824.467.372 91-83 901.178.980 16-12 289.923.990 332-330 22.733 99-91 1.656 108
109 107 Türk Prysmian Kablo ve Sistemleri A.Ş. Bursa - 101 679.598.221 131-123 696.092.098 253-242 63.854.053 280-269 120.710.606 200-190 417.204.279 272-266 13.861.435 84-83 149.327 313-301 446 109
110 117 Küçükbay Yağ ve Deterjan Sanayi A.Ş. Ege Bölgesi - 102 677.110.053 129-121 699.376.918 359-346 38.379.047 341-330 82.009.178 241-229 332.628.898 227-221 20.592.397 131-130 100.394 337-325 410 110
111 87 Bunge Gıda San. ve Tic. A.Ş. İstanbul - 103 672.025.503 43-39 1.801.251.087 --- - --- - --- - --- - --- - 407-394 271 111
112 128 Naksan Plastik ve Enerji San. ve Tic. A.Ş. Gaziantep - 104 669.751.052 104-98 818.842.460 218-208 77.807.439 127-118 292.121.489 125-117 637.418.832 246-240 17.204.474 100-99 124.863 46-38 2.545 112
113 133 Petlas Lastik San. ve Tic. A.Ş. Kırşehir - 105 637.965.117 137-129 640.640.594 --- - 106-97 336.870.049 126-118 634.989.677 --- - 66-65 179.107 80-72 1.906 113
114 85 Noksel Çelik Boru Sanayi A.Ş. Ankara - 106 630.771.402 141-133 631.986.068 314-301 47.219.863 175-166 221.697.533 151-142 549.312.905 249-243 16.520.941 103-102 122.521 268-256 618 114
115 141 Indesit Company Beyaz Eşya San. ve Tic. A.Ş. İstanbul - 107 615.102.615 94-88 874.653.149 122-113 144.424.830 171-162 228.015.426 160-150 526.390.806 278-272 13.225.103 42-41 273.588 158-148 1.088 115
116 113 Abdi İbrahim İlaç San. ve Tic. A.Ş. İstanbul - 108 612.417.257 127-119 709.416.364 79-72 190.724.386 97-88 370.935.842 132-123 596.976.933 449-442 -2.297.822 315-313 25.570 96-88 1.694 116
117 121 Tiryaki Agro Gıda San. ve Tic. A.Ş. Gaziantep - 109 605.558.456 34-30 1.968.439.335 151-142 115.027.795 162-153 239.595.036 70-62 1.107.981.786 330-324 8.163.851 29-28 421.476 215-203 824 117
118 88 Korteks Mensucat San. ve Tic. A.Ş. İstanbul - 110 601.587.723 144-136 609.023.399 127-118 138.179.113 45-38 779.550.275 64-56 1.171.635.731 89-84 66.980.491 271-269 38.340 70-62 2.054 118
119 146 Kaleseramik Çanakkale Kalebodur Seramik Sanayi A.Ş. İstanbul - 111 598.072.049 123-115 732.362.529 75-68 201.894.184 86-78 404.262.315 104-96 776.359.800 259-253 15.677.529 120-119 109.389 36-28 3.238 119
120 208 Biskot Bisküvi Gıda San. ve Tic. A.Ş. Karaman - 112 594.921.191 136-128 648.875.041 139-130 125.667.640 217-207 168.562.259 204-194 411.826.667 139-134 41.722.972 111-110 116.314 29-21 3.668 120
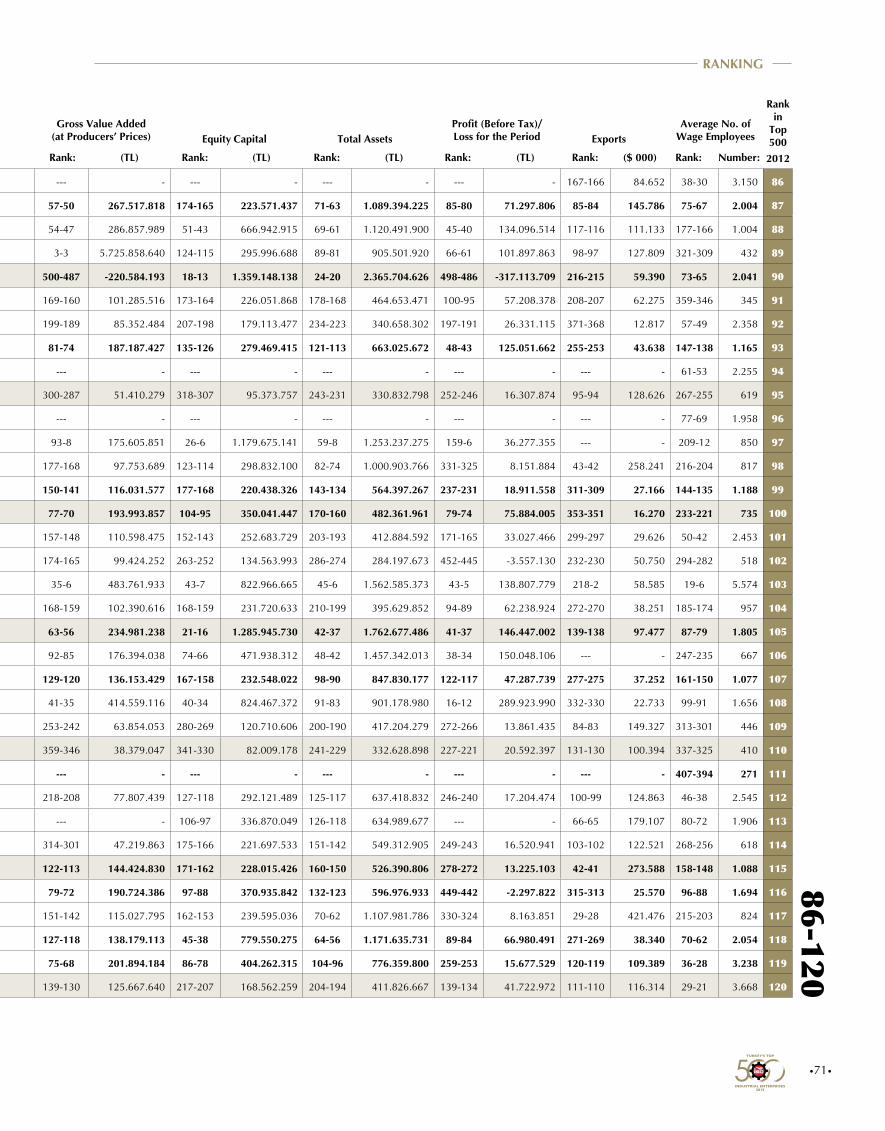
•71•
Rank: Rank: Rank: Rank:Rank:(TL) (TL) Rank: (TL) (TL) Number:($ 000)Firm2012 2011 Rank: (TL)
Gross Value Added (at Producers’ Prices) Equity Capital Total Assets Exports
Profit (Before Tax)/Loss for the Period
Average No. of Wage Employees
Rank in
Top 500
Affiliated Chamber/
Public
Rank in
Public Sector
Rank in
Private Sector
Production-based Sales
(Net) (TL)
Sales Revenues (Net)
Rank in
Top 5002012
86-120RANKING
86 92 Keskinoğlu Tavukçuluk ve Damızlık İşletmeleri San. Tic. A.Ş. Akhisar - 80 808.805.747 109-102 814.924.309 --- - --- - --- - --- - 167-166 84.652 38-30 3.150 86
87 93 Otokar Otomotiv ve Savunma Sanayi A.Ş. İstanbul - 81 804.079.244 91-85 894.411.628 57-50 267.517.818 174-165 223.571.437 71-63 1.089.394.225 85-80 71.297.806 85-84 145.786 75-67 2.004 87
88 84 Çimsa Çimento San. ve Tic. A.Ş. Mersin - 82 799.027.860 112-105 800.038.539 54-47 286.857.989 51-43 666.942.915 69-61 1.120.491.900 45-40 134.096.514 117-116 111.133 177-166 1.004 88
89 119 JTI Tütün Ürünleri Sanayi A.Ş. Ege Bölgesi - 83 797.520.804 113-106 797.736.729 3-3 5.725.858.640 124-115 295.996.688 89-81 905.501.920 66-61 101.897.863 98-97 127.809 321-309 432 89
90 145 Ülker Bisküvi Sanayi A.Ş. İstanbul - 84 794.732.082 110-103 808.856.166 500-487 -220.584.193 18-13 1.359.148.138 24-20 2.365.704.626 498-486 -317.113.709 216-215 59.390 73-65 2.041 90
91 102 Tezcan Galvanizli Yapı Elemanları San. ve Tic. A.Ş. Kocaeli - 85 791.845.320 108-101 816.007.608 169-160 101.285.516 173-164 226.051.868 178-168 464.653.471 100-95 57.208.378 208-207 62.275 359-346 345 91
92 103 Erpiliç Entegre Tavukçuluk Üretim Pazarlama ve Tic. Ltd. Şti. Bolu - 86 785.840.298 102-96 823.157.055 199-189 85.352.484 207-198 179.113.477 234-223 340.658.302 197-191 26.331.115 371-368 12.817 57-49 2.358 92
93 96 Ülker Çikolata Sanayi A.Ş. İstanbul - 87 783.882.331 101-95 832.123.918 81-74 187.187.427 135-126 279.469.415 121-113 663.025.672 48-43 125.051.662 255-253 43.638 147-138 1.165 93
94 108 Gülsan Sentetik Dokuma San. ve Tic. A.Ş. Gaziantep - 88 776.252.860 115-108 777.919.647 --- - --- - --- - --- - --- - 61-53 2.255 94
95 114 Kocaer Haddecilik San. ve Tic. A.Ş. Denizli - 89 760.914.503 117-110 764.320.979 300-287 51.410.279 318-307 95.373.757 243-231 330.832.798 252-246 16.307.874 95-94 128.626 267-255 619 95
96 98 Şenpiliç Gıda Sanayi A.Ş. Adapazarı - 90 745.899.477 105-99 818.602.956 --- - --- - --- - --- - --- - 77-69 1.958 96
97 94 Soma Elektrik Üretim ve Ticaret A.Ş. Public 7 - 743.889.006 121-8 743.889.006 93-8 175.605.851 26-6 1.179.675.141 59-8 1.253.237.275 159-6 36.277.355 --- - 209-12 850 97
98 99 Özkan Demir Çelik Sanayi A.Ş. Ege Bölgesi - 91 743.820.608 107-100 817.507.809 177-168 97.753.689 123-114 298.832.100 82-74 1.000.903.766 331-325 8.151.884 43-42 258.241 216-204 817 98
99 100 Tat Konserve Sanayii A.Ş. İstanbul - 92 737.678.727 116-109 775.125.496 150-141 116.031.577 177-168 220.438.326 143-134 564.397.267 237-231 18.911.558 311-309 27.166 144-135 1.188 99
100 116 Türk Henkel Kimya San. ve Tic. A.Ş. İstanbul - 93 729.675.833 88-82 945.278.062 77-70 193.993.857 104-95 350.041.447 170-160 482.361.961 79-74 75.884.005 353-351 16.270 233-221 735 100
101 111 BEYPİ Beypazarı Tarımsal Üretim Pazarlama San. ve Tic. A.Ş. Bolu - 94 728.350.307 119-112 760.012.313 157-148 110.598.475 152-143 252.683.729 203-193 412.884.592 171-165 33.027.466 299-297 29.626 50-42 2.453 101
102 95 Yeşilyurt Demir Çelik Endüstrisi ve Liman İşletmeleri Ltd. Şti. Samsun - 95 726.423.844 120-113 750.641.900 174-165 99.424.252 263-252 134.563.993 286-274 284.197.673 452-445 -3.557.130 232-230 50.750 294-282 518 102
103 86 Makina ve Kimya Endüstrisi Kurumu (M.K.E.K.) Genel Müdürlüğü Public 8 - 720.468.350 106-7 818.287.569 35-6 483.761.933 43-7 822.966.665 45-6 1.562.585.373 43-5 138.807.779 218-2 58.585 19-6 5.574 103
104 106 Pınar Süt Mamülleri Sanayi A.Ş. Ege Bölgesi - 96 720.384.742 122-114 735.649.605 168-159 102.390.616 168-159 231.720.633 210-199 395.629.852 94-89 62.238.924 272-270 38.251 185-174 957 104
105 90 Trakya Cam Sanayii A.Ş. İstanbul - 97 712.275.654 80-74 1.054.018.604 63-56 234.981.238 21-16 1.285.945.730 42-37 1.762.677.486 41-37 146.447.002 139-138 97.477 87-79 1.805 105
106 - İçdaş Elektrik Enerjisi Üretim ve Yatırım A.Ş. Çanakkale - 98 706.976.970 128-120 706.976.970 92-85 176.394.038 74-66 471.938.312 48-42 1.457.342.013 38-34 150.048.106 --- - 247-235 667 106
107 124 Betek Boya ve Kimya Sanayi A.Ş. İstanbul - 99 689.585.860 114-107 781.410.000 129-120 136.153.429 167-158 232.548.022 98-90 847.830.177 122-117 47.287.739 277-275 37.252 161-150 1.077 107
108 148 Eti Bakır A.Ş. İnebolu - 100 684.731.587 132-124 688.320.661 41-35 414.559.116 40-34 824.467.372 91-83 901.178.980 16-12 289.923.990 332-330 22.733 99-91 1.656 108
109 107 Türk Prysmian Kablo ve Sistemleri A.Ş. Bursa - 101 679.598.221 131-123 696.092.098 253-242 63.854.053 280-269 120.710.606 200-190 417.204.279 272-266 13.861.435 84-83 149.327 313-301 446 109
110 117 Küçükbay Yağ ve Deterjan Sanayi A.Ş. Ege Bölgesi - 102 677.110.053 129-121 699.376.918 359-346 38.379.047 341-330 82.009.178 241-229 332.628.898 227-221 20.592.397 131-130 100.394 337-325 410 110
111 87 Bunge Gıda San. ve Tic. A.Ş. İstanbul - 103 672.025.503 43-39 1.801.251.087 --- - --- - --- - --- - --- - 407-394 271 111
112 128 Naksan Plastik ve Enerji San. ve Tic. A.Ş. Gaziantep - 104 669.751.052 104-98 818.842.460 218-208 77.807.439 127-118 292.121.489 125-117 637.418.832 246-240 17.204.474 100-99 124.863 46-38 2.545 112
113 133 Petlas Lastik San. ve Tic. A.Ş. Kırşehir - 105 637.965.117 137-129 640.640.594 --- - 106-97 336.870.049 126-118 634.989.677 --- - 66-65 179.107 80-72 1.906 113
114 85 Noksel Çelik Boru Sanayi A.Ş. Ankara - 106 630.771.402 141-133 631.986.068 314-301 47.219.863 175-166 221.697.533 151-142 549.312.905 249-243 16.520.941 103-102 122.521 268-256 618 114
115 141 Indesit Company Beyaz Eşya San. ve Tic. A.Ş. İstanbul - 107 615.102.615 94-88 874.653.149 122-113 144.424.830 171-162 228.015.426 160-150 526.390.806 278-272 13.225.103 42-41 273.588 158-148 1.088 115
116 113 Abdi İbrahim İlaç San. ve Tic. A.Ş. İstanbul - 108 612.417.257 127-119 709.416.364 79-72 190.724.386 97-88 370.935.842 132-123 596.976.933 449-442 -2.297.822 315-313 25.570 96-88 1.694 116
117 121 Tiryaki Agro Gıda San. ve Tic. A.Ş. Gaziantep - 109 605.558.456 34-30 1.968.439.335 151-142 115.027.795 162-153 239.595.036 70-62 1.107.981.786 330-324 8.163.851 29-28 421.476 215-203 824 117
118 88 Korteks Mensucat San. ve Tic. A.Ş. İstanbul - 110 601.587.723 144-136 609.023.399 127-118 138.179.113 45-38 779.550.275 64-56 1.171.635.731 89-84 66.980.491 271-269 38.340 70-62 2.054 118
119 146 Kaleseramik Çanakkale Kalebodur Seramik Sanayi A.Ş. İstanbul - 111 598.072.049 123-115 732.362.529 75-68 201.894.184 86-78 404.262.315 104-96 776.359.800 259-253 15.677.529 120-119 109.389 36-28 3.238 119
120 208 Biskot Bisküvi Gıda San. ve Tic. A.Ş. Karaman - 112 594.921.191 136-128 648.875.041 139-130 125.667.640 217-207 168.562.259 204-194 411.826.667 139-134 41.722.972 111-110 116.314 29-21 3.668 120

Rank: Rank: Rank: Rank:Rank:(TL) (TL) Rank: (TL) (TL) Number:($ 000)Firm2012 2011 Rank: (TL)
Gross Value Added (at Producers’ Prices) Equity Capital Total Assets Exports
Profit (Before Tax)/Loss for the Period
Average No. of Wage Employees
Rank in
Top 500
Affiliated Chamber/
Public
Rank in
Public Sector
Rank in
Private Sector
Production-based Sales
(Net) (TL)
Sales Revenues (Net)
Rank in
Top 5002012
•72•
121-
155
RANKING
121 176 Önem Gıda San. ve Tic. A.Ş. İstanbul - 113 576.623.930 124-116 730.139.334 205-195 83.260.018 383-371 60.662.314 114-106 710.025.647 88-83 67.129.173 443-438 1.154 372-359 328 121
122 181 Honda Türkiye A.Ş. Kocaeli - 114 573.862.436 100-94 840.917.467 --- - --- - --- - --- - --- - 218-206 809 122
123 200 HİDROMEK Hidrolik ve Mekanik Makina İmalat San. ve Tic. A.Ş. Ankara - 115 570.217.398 143-135 616.131.182 114-105 154.178.180 89-81 391.274.250 177-167 465.186.192 67-62 101.807.953 138-137 97.603 154-144 1.105 123
124 125 Bosch Termoteknik San. ve Tic. A.Ş. Manisa - 116 570.132.577 151-143 572.916.720 --- - 182-173 213.773.577 232-221 343.525.929 --- - 46-45 244.673 --- - 124
125 129 Bilim İlaç San. ve Tic. A.Ş. İstanbul - 117 570.105.161 149-141 587.716.270 60-53 245.424.997 101-92 356.961.489 153-144 548.433.360 78-73 78.822.104 273-271 37.793 --- - 125
126 126 Sarten Ambalaj San. ve Tic. A.Ş. İstanbul - 118 565.871.451 148-140 592.093.556 154-145 111.764.856 302-291 105.688.865 155-146 541.719.570 146-141 39.738.085 142-141 96.974 76-68 1.978 126
127 112 Componenta Dökümcülük Tic. ve San. A.Ş. Orhangazi - 119 560.485.684 146-138 597.101.501 90-83 180.727.999 270-259 128.220.929 171-161 481.324.536 442-435 -1.466.118 50-49 228.538 49-41 2.465 127
128 122 Paşabahçe Cam San. ve Tic. A.Ş. İstanbul - 120 560.041.270 118-111 761.316.369 67-60 227.624.774 69-61 500.009.964 92-84 897.022.668 230-224 19.666.351 70-69 172.628 67-59 2.113 128
129 142 Altınmarka Gıda San. ve Tic. A.Ş. İstanbul - 121 557.613.396 145-137 598.936.411 201-191 84.223.265 262-251 135.537.813 103-95 800.306.622 115-110 49.255.467 184-183 75.150 361-348 344 129
130 184 Beyteks Tekstil San. ve Tic. A.Ş. Adana - 122 557.523.181 134-126 659.747.564 376-363 32.886.108 343-332 78.779.105 157-147 534.947.937 493-482 -74.893.634 293-291 33.328 40-32 3.085 130
131 - Hürriyet Gazetecilik ve Matbaacılık A.Ş. İstanbul - 123 549.382.559 156-148 550.375.638 40-34 422.671.040 35-29 970.759.021 50-44 1.430.511.977 30-26 196.551.025 --- - 83-75 1.870 131
132 115 Kordsa Global Endüstriyel İplik ve Kord Bezi San. ve Tic. A.Ş. İstanbul - 124 544.517.134 153-145 566.637.824 124-115 142.326.343 39-33 830.517.936 74-66 1.059.355.582 113-108 49.478.733 45-44 247.230 127-118 1.317 132
133 137 Kürüm Demir Sanayi Dış Ticaret A.Ş. İstanbul - 125 541.181.284 92-86 889.818.203 439-426 15.571.761 366-354 69.933.188 279-267 289.661.016 351-345 6.266.073 278-276 36.730 432-419 208 133
134 183 Şölen Çikolata Gıda San. ve Tic. A.Ş. Gaziantep - 126 540.703.914 158-150 547.340.702 --- - --- - --- - --- - 61-60 196.233 --- - 134
135 105 Kayseri Şeker Fabrikası A.Ş. Kayseri - 127 540.102.791 150-142 575.596.260 85-78 182.120.947 137-128 276.581.145 111-103 750.169.501 182-176 30.102.481 454-449 160 54-46 2.383 135
136 120 Namet Gıda San. ve Tic. A.Ş. İstanbul - 128 538.597.605 139-131 638.341.019 --- - 339-328 83.054.198 292-280 278.839.376 --- - 351-349 16.943 231-219 750 136
137 136 Kerim Çelik Mamülleri İmalat ve Ticaret A.Ş. İstanbul - 129 532.857.524 162-154 532.857.524 447-434 13.968.718 462-449 19.047.691 400-387 169.544.785 309-303 9.775.743 451-446 199 427-414 224 137
138 143 Türk Demir Döküm Fabrikaları A.Ş. İstanbul - 130 526.765.793 152-144 569.826.594 239-228 68.899.443 298-287 106.996.291 149-140 555.383.209 285-279 12.131.705 215-214 59.818 164-153 1.071 138
139 232 Gemlik Gübre Sanayii A.Ş. Gemlik - 131 525.087.512 138-130 639.211.726 105-96 166.130.872 65-57 550.098.572 75-67 1.044.262.164 35-31 164.661.027 125-124 105.417 338-326 409 139
140 139 Autoliv Cankor Otomotiv Emniyet Sistemleri San. ve Tic. A.Ş. Kocaeli - 132 523.270.256 167-158 523.270.256 263-252 61.256.750 213-204 175.194.261 320-308 249.940.452 275-269 13.420.787 114-113 112.004 170-159 1.046 140
141 153 Merkez Çelik San. ve Tic. A.Ş. Kayseri - 133 523.062.313 133-125 675.160.157 107-98 163.760.856 73-65 475.328.616 136-127 583.006.456 77-72 79.112.331 248-246 46.146 47-39 2.531 141
142 131 Polimer Kauçuk Sanayi ve Pazarlama A.Ş. İstanbul - 134 518.404.841 159-151 542.653.060 113-104 155.727.251 190-181 205.443.253 289-277 282.067.910 101-96 57.206.008 48-47 235.000 82-74 1.898 142
143 163 Et ve Balık Kurumu Genel Müdürlüğü Public 9 - 518.223.146 164-9 531.972.537 --- - --- - --- - --- - --- - --- - 143
144 195 Bayer Türk Kimya Sanayii Ltd. Şti. İstanbul - 135 517.954.884 111-104 807.781.910 72-65 209.923.467 153-144 252.606.344 140-131 572.777.231 130-125 45.727.256 298-296 30.142 130-121 1.306 144
145 109 Alstom Grid Enerji Endüstrisi A.Ş. Kocaeli - 136 517.472.935 163-155 532.339.005 104-95 166.608.295 156-147 248.126.785 108-100 753.803.395 284-278 12.558.680 51-50 226.590 176-165 1.010 145
146 110 Asil Çelik San. ve Tic. A.Ş. İstanbul - 137 516.415.545 169-160 516.415.545 147-138 118.338.570 108-99 335.286.877 186-176 449.743.018 172-166 32.577.530 163-162 86.830 230-218 751 146
147 140 Modern Karton San. ve Tic. A.Ş. Çorlu - 138 513.213.559 170-161 513.213.559 108-99 161.400.742 61-53 568.154.093 105-97 775.836.235 74-69 88.011.781 276-274 37.447 343-331 396 147
148 - - Konya - 139 - 171-162 - 58-51 - 38-32 - 83-75 - 29-25 - 113-112 - 135-126 - 148
149 101 Man Türkiye A.Ş. Ankara - 140 505.717.339 172-163 506.765.217 165-156 104.536.187 121-112 302.793.192 206-196 406.633.052 150-145 38.966.698 54-53 214.247 94-86 1.703 149
150 177 Bis Enerji Elektrik Üretim A.Ş. Bursa - 141 504.210.621 173-164 504.210.621 272-261 59.143.612 226-215 161.474.383 185-175 451.458.240 405-398 1.985.799 --- - 488-475 102 150
151 91 Karsan Otomotiv San. ve Tic. A.Ş. Bursa - 142 503.377.346 166-157 524.292.805 404-391 24.443.925 228-217 160.067.297 131-122 607.400.769 490-480 -56.460.211 122-121 107.943 167-156 1.070 151
152 135 Sider Dış Ticaret A.Ş. Ege Bölgesi - 143 503.325.554 155-147 550.690.463 --- - --- - --- - --- - --- - 281-269 572 152
153 151 Tosyalı Demir Çelik Sanayi A.Ş. İskenderun - 144 503.118.334 174-165 503.189.461 481-468 6.956.239 --- - --- - 387-381 2.873.406 132-131 100.215 --- - 153
154 165 ASAŞ Alüminyum San. ve Tic. A.Ş. İstanbul - 145 500.543.204 157-149 549.622.708 121-112 144.442.358 130-121 290.273.340 68-60 1.125.406.442 90-85 66.276.049 170-169 82.754 114-105 1.457 154
155 167 Limak Çimento San. ve Tic. A.Ş. Siirt - 146 496.166.768 178-169 499.619.549 118-109 149.508.999 245-234 146.920.940 60-52 1.251.928.998 95-90 61.629.704 287-285 34.985 214-202 828 155
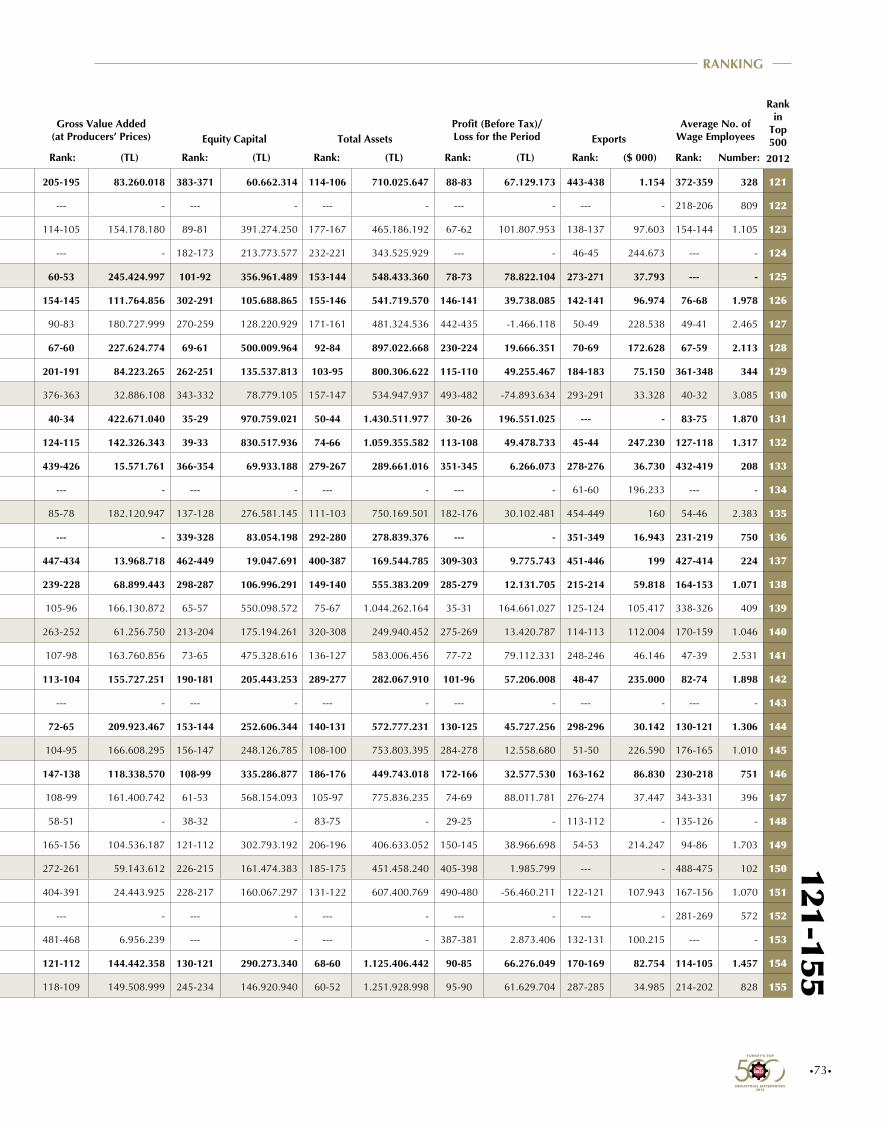
•73•
Rank: Rank: Rank: Rank:Rank:(TL) (TL) Rank: (TL) (TL) Number:($ 000)Firm2012 2011 Rank: (TL)
Gross Value Added (at Producers’ Prices) Equity Capital Total Assets Exports
Profit (Before Tax)/Loss for the Period
Average No. of Wage Employees
Rank in
Top 500
Affiliated Chamber/
Public
Rank in
Public Sector
Rank in
Private Sector
Production-based Sales
(Net) (TL)
Sales Revenues (Net)
Rank in
Top 5002012
121-155RANKING
121 176 Önem Gıda San. ve Tic. A.Ş. İstanbul - 113 576.623.930 124-116 730.139.334 205-195 83.260.018 383-371 60.662.314 114-106 710.025.647 88-83 67.129.173 443-438 1.154 372-359 328 121
122 181 Honda Türkiye A.Ş. Kocaeli - 114 573.862.436 100-94 840.917.467 --- - --- - --- - --- - --- - 218-206 809 122
123 200 HİDROMEK Hidrolik ve Mekanik Makina İmalat San. ve Tic. A.Ş. Ankara - 115 570.217.398 143-135 616.131.182 114-105 154.178.180 89-81 391.274.250 177-167 465.186.192 67-62 101.807.953 138-137 97.603 154-144 1.105 123
124 125 Bosch Termoteknik San. ve Tic. A.Ş. Manisa - 116 570.132.577 151-143 572.916.720 --- - 182-173 213.773.577 232-221 343.525.929 --- - 46-45 244.673 --- - 124
125 129 Bilim İlaç San. ve Tic. A.Ş. İstanbul - 117 570.105.161 149-141 587.716.270 60-53 245.424.997 101-92 356.961.489 153-144 548.433.360 78-73 78.822.104 273-271 37.793 --- - 125
126 126 Sarten Ambalaj San. ve Tic. A.Ş. İstanbul - 118 565.871.451 148-140 592.093.556 154-145 111.764.856 302-291 105.688.865 155-146 541.719.570 146-141 39.738.085 142-141 96.974 76-68 1.978 126
127 112 Componenta Dökümcülük Tic. ve San. A.Ş. Orhangazi - 119 560.485.684 146-138 597.101.501 90-83 180.727.999 270-259 128.220.929 171-161 481.324.536 442-435 -1.466.118 50-49 228.538 49-41 2.465 127
128 122 Paşabahçe Cam San. ve Tic. A.Ş. İstanbul - 120 560.041.270 118-111 761.316.369 67-60 227.624.774 69-61 500.009.964 92-84 897.022.668 230-224 19.666.351 70-69 172.628 67-59 2.113 128
129 142 Altınmarka Gıda San. ve Tic. A.Ş. İstanbul - 121 557.613.396 145-137 598.936.411 201-191 84.223.265 262-251 135.537.813 103-95 800.306.622 115-110 49.255.467 184-183 75.150 361-348 344 129
130 184 Beyteks Tekstil San. ve Tic. A.Ş. Adana - 122 557.523.181 134-126 659.747.564 376-363 32.886.108 343-332 78.779.105 157-147 534.947.937 493-482 -74.893.634 293-291 33.328 40-32 3.085 130
131 - Hürriyet Gazetecilik ve Matbaacılık A.Ş. İstanbul - 123 549.382.559 156-148 550.375.638 40-34 422.671.040 35-29 970.759.021 50-44 1.430.511.977 30-26 196.551.025 --- - 83-75 1.870 131
132 115 Kordsa Global Endüstriyel İplik ve Kord Bezi San. ve Tic. A.Ş. İstanbul - 124 544.517.134 153-145 566.637.824 124-115 142.326.343 39-33 830.517.936 74-66 1.059.355.582 113-108 49.478.733 45-44 247.230 127-118 1.317 132
133 137 Kürüm Demir Sanayi Dış Ticaret A.Ş. İstanbul - 125 541.181.284 92-86 889.818.203 439-426 15.571.761 366-354 69.933.188 279-267 289.661.016 351-345 6.266.073 278-276 36.730 432-419 208 133
134 183 Şölen Çikolata Gıda San. ve Tic. A.Ş. Gaziantep - 126 540.703.914 158-150 547.340.702 --- - --- - --- - --- - 61-60 196.233 --- - 134
135 105 Kayseri Şeker Fabrikası A.Ş. Kayseri - 127 540.102.791 150-142 575.596.260 85-78 182.120.947 137-128 276.581.145 111-103 750.169.501 182-176 30.102.481 454-449 160 54-46 2.383 135
136 120 Namet Gıda San. ve Tic. A.Ş. İstanbul - 128 538.597.605 139-131 638.341.019 --- - 339-328 83.054.198 292-280 278.839.376 --- - 351-349 16.943 231-219 750 136
137 136 Kerim Çelik Mamülleri İmalat ve Ticaret A.Ş. İstanbul - 129 532.857.524 162-154 532.857.524 447-434 13.968.718 462-449 19.047.691 400-387 169.544.785 309-303 9.775.743 451-446 199 427-414 224 137
138 143 Türk Demir Döküm Fabrikaları A.Ş. İstanbul - 130 526.765.793 152-144 569.826.594 239-228 68.899.443 298-287 106.996.291 149-140 555.383.209 285-279 12.131.705 215-214 59.818 164-153 1.071 138
139 232 Gemlik Gübre Sanayii A.Ş. Gemlik - 131 525.087.512 138-130 639.211.726 105-96 166.130.872 65-57 550.098.572 75-67 1.044.262.164 35-31 164.661.027 125-124 105.417 338-326 409 139
140 139 Autoliv Cankor Otomotiv Emniyet Sistemleri San. ve Tic. A.Ş. Kocaeli - 132 523.270.256 167-158 523.270.256 263-252 61.256.750 213-204 175.194.261 320-308 249.940.452 275-269 13.420.787 114-113 112.004 170-159 1.046 140
141 153 Merkez Çelik San. ve Tic. A.Ş. Kayseri - 133 523.062.313 133-125 675.160.157 107-98 163.760.856 73-65 475.328.616 136-127 583.006.456 77-72 79.112.331 248-246 46.146 47-39 2.531 141
142 131 Polimer Kauçuk Sanayi ve Pazarlama A.Ş. İstanbul - 134 518.404.841 159-151 542.653.060 113-104 155.727.251 190-181 205.443.253 289-277 282.067.910 101-96 57.206.008 48-47 235.000 82-74 1.898 142
143 163 Et ve Balık Kurumu Genel Müdürlüğü Public 9 - 518.223.146 164-9 531.972.537 --- - --- - --- - --- - --- - --- - 143
144 195 Bayer Türk Kimya Sanayii Ltd. Şti. İstanbul - 135 517.954.884 111-104 807.781.910 72-65 209.923.467 153-144 252.606.344 140-131 572.777.231 130-125 45.727.256 298-296 30.142 130-121 1.306 144
145 109 Alstom Grid Enerji Endüstrisi A.Ş. Kocaeli - 136 517.472.935 163-155 532.339.005 104-95 166.608.295 156-147 248.126.785 108-100 753.803.395 284-278 12.558.680 51-50 226.590 176-165 1.010 145
146 110 Asil Çelik San. ve Tic. A.Ş. İstanbul - 137 516.415.545 169-160 516.415.545 147-138 118.338.570 108-99 335.286.877 186-176 449.743.018 172-166 32.577.530 163-162 86.830 230-218 751 146
147 140 Modern Karton San. ve Tic. A.Ş. Çorlu - 138 513.213.559 170-161 513.213.559 108-99 161.400.742 61-53 568.154.093 105-97 775.836.235 74-69 88.011.781 276-274 37.447 343-331 396 147
148 - - Konya - 139 - 171-162 - 58-51 - 38-32 - 83-75 - 29-25 - 113-112 - 135-126 - 148
149 101 Man Türkiye A.Ş. Ankara - 140 505.717.339 172-163 506.765.217 165-156 104.536.187 121-112 302.793.192 206-196 406.633.052 150-145 38.966.698 54-53 214.247 94-86 1.703 149
150 177 Bis Enerji Elektrik Üretim A.Ş. Bursa - 141 504.210.621 173-164 504.210.621 272-261 59.143.612 226-215 161.474.383 185-175 451.458.240 405-398 1.985.799 --- - 488-475 102 150
151 91 Karsan Otomotiv San. ve Tic. A.Ş. Bursa - 142 503.377.346 166-157 524.292.805 404-391 24.443.925 228-217 160.067.297 131-122 607.400.769 490-480 -56.460.211 122-121 107.943 167-156 1.070 151
152 135 Sider Dış Ticaret A.Ş. Ege Bölgesi - 143 503.325.554 155-147 550.690.463 --- - --- - --- - --- - --- - 281-269 572 152
153 151 Tosyalı Demir Çelik Sanayi A.Ş. İskenderun - 144 503.118.334 174-165 503.189.461 481-468 6.956.239 --- - --- - 387-381 2.873.406 132-131 100.215 --- - 153
154 165 ASAŞ Alüminyum San. ve Tic. A.Ş. İstanbul - 145 500.543.204 157-149 549.622.708 121-112 144.442.358 130-121 290.273.340 68-60 1.125.406.442 90-85 66.276.049 170-169 82.754 114-105 1.457 154
155 167 Limak Çimento San. ve Tic. A.Ş. Siirt - 146 496.166.768 178-169 499.619.549 118-109 149.508.999 245-234 146.920.940 60-52 1.251.928.998 95-90 61.629.704 287-285 34.985 214-202 828 155
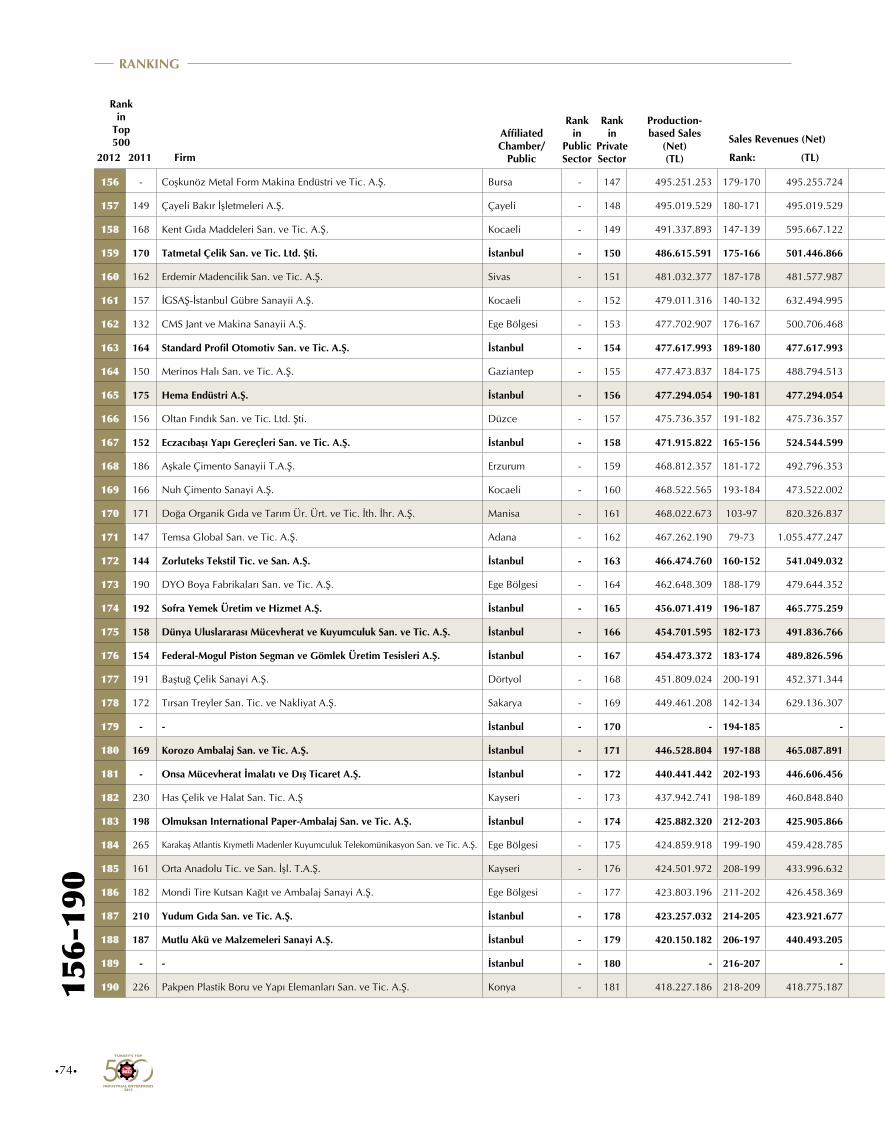
Rank: Rank: Rank: Rank:Rank:(TL) (TL) Rank: (TL) (TL) Number:($ 000)Firm2012 2011 Rank: (TL)
Gross Value Added (at Producers’ Prices) Equity Capital Total Assets Exports
Profit (Before Tax)/Loss for the Period
Average No. of Wage Employees
Rank in
Top 500
Affiliated Chamber/
Public
Rank in
Public Sector
Rank in
Private Sector
Production-based Sales
(Net) (TL)
Sales Revenues (Net)
Rank in
Top 5002012
•74•
156-
190
RANKING
156 - Coşkunöz Metal Form Makina Endüstri ve Tic. A.Ş. Bursa - 147 495.251.253 179-170 495.255.724 180-171 95.881.568 331-320 89.379.660 261-249 310.173.440 213-207 24.080.497 246-244 46.921 81-73 1.900 156
157 149 Çayeli Bakır İşletmeleri A.Ş. Çayeli - 148 495.019.529 180-171 495.019.529 44-38 401.244.024 46-39 765.558.111 94-86 879.938.278 17-13 254.205.619 40-39 290.404 290-278 532 157
158 168 Kent Gıda Maddeleri San. ve Tic. A.Ş. Kocaeli - 149 491.337.893 147-139 595.667.122 128-119 137.330.316 72-64 475.405.306 116-108 689.131.374 173-167 32.513.739 148-147 94.474 105-97 1.564 158
159 170 Tatmetal Çelik San. ve Tic. Ltd. Şti. İstanbul - 150 486.615.591 175-166 501.446.866 290-277 53.622.024 281-270 120.177.132 233-222 341.509.205 268-262 14.397.943 --- - 386-373 308 159
160 162 Erdemir Madencilik San. ve Tic. A.Ş. Sivas - 151 481.032.377 187-178 481.577.987 51-44 303.404.864 92-83 382.597.554 193-183 441.299.546 20-16 239.520.899 --- - 406-393 273 160
161 157 İGSAŞ-İstanbul Gübre Sanayii A.Ş. Kocaeli - 152 479.011.316 140-132 632.494.995 --- - --- - --- - --- - --- - --- - 161
162 132 CMS Jant ve Makina Sanayii A.Ş. Ege Bölgesi - 153 477.702.907 176-167 500.706.468 153-144 113.808.076 324-313 92.658.043 262-250 304.822.701 193-187 27.236.723 53-52 216.613 116-107 1.437 162
163 164 Standard Profil Otomotiv San. ve Tic. A.Ş. İstanbul - 154 477.617.993 189-180 477.617.993 96-88 170.639.648 230-219 158.905.233 187-177 449.632.720 247-241 17.034.709 72-71 170.439 52-44 2.410 163
164 150 Merinos Halı San. ve Tic. A.Ş. Gaziantep - 155 477.473.837 184-175 488.794.513 117-108 149.820.714 166-157 233.076.771 141-132 572.007.638 108-103 51.332.325 141-140 97.144 60-52 2.272 164
165 175 Hema Endüstri A.Ş. İstanbul - 156 477.294.054 190-181 477.294.054 115-106 153.797.056 139-130 269.913.238 86-78 951.374.019 225-219 21.423.002 93-92 131.245 71-63 2.054 165
166 156 Oltan Fındık San. ve Tic. Ltd. Şti. Düzce - 157 475.736.357 191-182 475.736.357 488-475 4.473.655 476-463 13.817.371 496-483 59.758.321 394-387 2.555.493 --- - 395-382 297 166
167 152 Eczacıbaşı Yapı Gereçleri San. ve Tic. A.Ş. İstanbul - 158 471.915.822 165-156 524.544.599 --- - 328-317 91.449.233 134-125 592.642.082 --- - 92-91 132.117 112-103 1.471 167
168 186 Aşkale Çimento Sanayii T.A.Ş. Erzurum - 159 468.812.357 181-172 492.796.353 116-107 152.124.486 113-104 318.511.452 97-89 856.995.268 96-91 60.820.698 408-403 5.290 155-145 1.102 168
169 166 Nuh Çimento Sanayi A.Ş. Kocaeli - 160 468.522.565 193-184 473.522.002 94-86 172.637.264 47-40 755.723.763 79-71 1.012.056.679 83-78 73.081.844 242-240 47.932 296-284 501 169
170 171 Doğa Organik Gıda ve Tarım Ür. Ürt. ve Tic. İth. İhr. A.Ş. Manisa - 161 468.022.673 103-97 820.326.837 381-368 31.261.409 442-429 32.929.892 270-258 297.271.123 384-378 3.078.416 435-430 1.631 438-425 201 170
171 147 Temsa Global San. ve Tic. A.Ş. Adana - 162 467.262.190 79-73 1.055.477.247 --- - --- - 90-82 902.651.204 --- - 76-75 162.159 103-95 1.622 171
172 144 Zorluteks Tekstil Tic. ve San. A.Ş. İstanbul - 163 466.474.760 160-152 541.049.032 213-203 79.318.504 58-50 582.015.156 88-80 914.023.332 199-193 26.087.578 77-76 160.338 89-81 1.767 172
173 190 DYO Boya Fabrikaları San. ve Tic. A.Ş. Ege Bölgesi - 164 462.648.309 188-179 479.644.352 146-137 119.060.476 --- - --- - 216-210 23.414.984 376-373 11.834 --- - 173
174 192 Sofra Yemek Üretim ve Hizmet A.Ş. İstanbul - 165 456.071.419 196-187 465.775.259 112-103 156.289.080 164-155 236.800.318 256-244 314.872.724 195-189 26.785.702 --- - 6-3 8.317 174
175 158 Dünya Uluslararası Mücevherat ve Kuyumculuk San. ve Tic. A.Ş. İstanbul - 166 454.701.595 182-173 491.836.766 491-478 1.470.937 467-454 16.567.405 435-422 138.451.925 421-414 1.178.718 433-428 2.520 --- - 175
176 154 Federal-Mogul Piston Segman ve Gömlek Üretim Tesisleri A.Ş. İstanbul - 167 454.473.372 183-174 489.826.596 83-76 183.802.651 148-139 256.929.404 275-263 293.152.094 58-53 109.661.517 68-67 175.836 118-109 1.420 176
177 191 Baştuğ Çelik Sanayi A.Ş. Dörtyol - 168 451.809.024 200-191 452.371.344 461-448 10.968.637 --- - --- - 420-413 1.222.208 297-295 30.456 475-462 147 177
178 172 Tırsan Treyler San. Tic. ve Nakliyat A.Ş. Sakarya - 169 449.461.208 142-134 629.136.307 182-173 95.070.733 253-242 143.118.459 150-141 551.592.538 210-204 24.140.839 193-192 67.987 352-339 363 178
179 - - İstanbul - 170 - 194-185 - 155-146 - 186-177 - 165-155 - 137-132 - 115-114 - 98-90 - 179
180 169 Korozo Ambalaj San. ve Tic. A.Ş. İstanbul - 171 446.528.804 197-188 465.087.891 208-198 81.000.852 231-220 157.813.644 252-240 323.124.255 214-208 23.800.281 86-85 142.380 244-232 689 180
181 - Onsa Mücevherat İmalatı ve Dış Ticaret A.Ş. İstanbul - 172 440.441.442 202-193 446.606.456 435-422 15.874.142 408-396 49.232.537 366-353 201.657.345 413-406 1.531.203 183-182 75.378 451-438 175 181
182 230 Has Çelik ve Halat San. Tic. A.Ş Kayseri - 173 437.942.741 198-189 460.848.840 278-266 56.599.121 310-299 98.060.642 375-362 196.519.972 209-203 24.155.090 112-111 115.344 250-238 658 182
183 198 Olmuksan International Paper-Ambalaj San. ve Tic. A.Ş. İstanbul - 174 425.882.320 212-203 425.905.866 181-172 95.171.904 185-176 212.321.732 285-273 284.558.880 192-186 27.538.941 373-370 12.658 184-173 970 183
184 265 Karakaş Atlantis Kıymetli Madenler Kuyumculuk Telekomünikasyon San. ve Tic. A.Ş. Ege Bölgesi - 175 424.859.918 199-190 459.428.785 451-438 12.955.409 308-297 98.823.458 422-409 150.427.290 355-349 6.020.297 321-319 24.276 473-460 150 184
185 161 Orta Anadolu Tic. ve San. İşl. T.A.Ş. Kayseri - 176 424.501.972 208-199 433.996.632 144-135 121.660.275 120-111 307.029.035 168-158 487.849.939 127-122 46.253.649 136-135 98.000 123-114 1.335 185
186 182 Mondi Tire Kutsan Kağıt ve Ambalaj Sanayi A.Ş. Ege Bölgesi - 177 423.803.196 211-202 426.458.369 --- - --- - --- - --- - --- - --- - 186
187 210 Yudum Gıda San. ve Tic. A.Ş. İstanbul - 178 423.257.032 214-205 423.921.677 384-371 30.420.521 --- - --- - 283-277 12.684.966 391-387 8.386 483-470 129 187
188 187 Mutlu Akü ve Malzemeleri Sanayi A.Ş. İstanbul - 179 420.150.182 206-197 440.493.205 136-127 127.372.050 215-205 170.818.680 295-283 276.137.371 133-128 43.841.846 195-194 67.073 232-220 739 188
189 - - İstanbul - 180 - 216-207 - 110-101 - 116-107 - 222-211 - 194-188 - 265-263 - 119-110 - 189
190 226 Pakpen Plastik Boru ve Yapı Elemanları San. ve Tic. A.Ş. Konya - 181 418.227.186 218-209 418.775.187 171-162 100.899.207 325-314 92.636.864 180-170 461.898.916 155-150 37.325.554 280-278 36.619 253-241 650 190
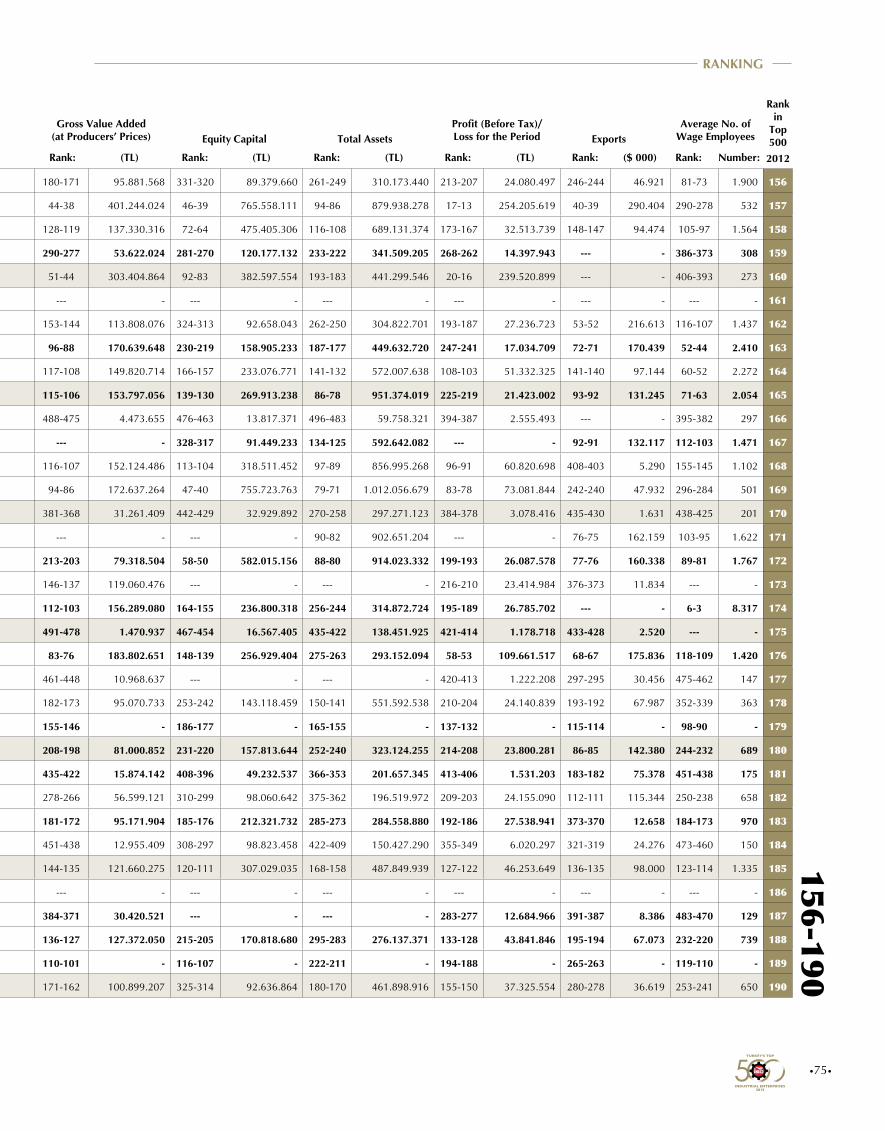
•75•
Rank: Rank: Rank: Rank:Rank:(TL) (TL) Rank: (TL) (TL) Number:($ 000)Firm2012 2011 Rank: (TL)
Gross Value Added (at Producers’ Prices) Equity Capital Total Assets Exports
Profit (Before Tax)/Loss for the Period
Average No. of Wage Employees
Rank in
Top 500
Affiliated Chamber/
Public
Rank in
Public Sector
Rank in
Private Sector
Production-based Sales
(Net) (TL)
Sales Revenues (Net)
Rank in
Top 5002012
156-190RANKING
156 - Coşkunöz Metal Form Makina Endüstri ve Tic. A.Ş. Bursa - 147 495.251.253 179-170 495.255.724 180-171 95.881.568 331-320 89.379.660 261-249 310.173.440 213-207 24.080.497 246-244 46.921 81-73 1.900 156
157 149 Çayeli Bakır İşletmeleri A.Ş. Çayeli - 148 495.019.529 180-171 495.019.529 44-38 401.244.024 46-39 765.558.111 94-86 879.938.278 17-13 254.205.619 40-39 290.404 290-278 532 157
158 168 Kent Gıda Maddeleri San. ve Tic. A.Ş. Kocaeli - 149 491.337.893 147-139 595.667.122 128-119 137.330.316 72-64 475.405.306 116-108 689.131.374 173-167 32.513.739 148-147 94.474 105-97 1.564 158
159 170 Tatmetal Çelik San. ve Tic. Ltd. Şti. İstanbul - 150 486.615.591 175-166 501.446.866 290-277 53.622.024 281-270 120.177.132 233-222 341.509.205 268-262 14.397.943 --- - 386-373 308 159
160 162 Erdemir Madencilik San. ve Tic. A.Ş. Sivas - 151 481.032.377 187-178 481.577.987 51-44 303.404.864 92-83 382.597.554 193-183 441.299.546 20-16 239.520.899 --- - 406-393 273 160
161 157 İGSAŞ-İstanbul Gübre Sanayii A.Ş. Kocaeli - 152 479.011.316 140-132 632.494.995 --- - --- - --- - --- - --- - --- - 161
162 132 CMS Jant ve Makina Sanayii A.Ş. Ege Bölgesi - 153 477.702.907 176-167 500.706.468 153-144 113.808.076 324-313 92.658.043 262-250 304.822.701 193-187 27.236.723 53-52 216.613 116-107 1.437 162
163 164 Standard Profil Otomotiv San. ve Tic. A.Ş. İstanbul - 154 477.617.993 189-180 477.617.993 96-88 170.639.648 230-219 158.905.233 187-177 449.632.720 247-241 17.034.709 72-71 170.439 52-44 2.410 163
164 150 Merinos Halı San. ve Tic. A.Ş. Gaziantep - 155 477.473.837 184-175 488.794.513 117-108 149.820.714 166-157 233.076.771 141-132 572.007.638 108-103 51.332.325 141-140 97.144 60-52 2.272 164
165 175 Hema Endüstri A.Ş. İstanbul - 156 477.294.054 190-181 477.294.054 115-106 153.797.056 139-130 269.913.238 86-78 951.374.019 225-219 21.423.002 93-92 131.245 71-63 2.054 165
166 156 Oltan Fındık San. ve Tic. Ltd. Şti. Düzce - 157 475.736.357 191-182 475.736.357 488-475 4.473.655 476-463 13.817.371 496-483 59.758.321 394-387 2.555.493 --- - 395-382 297 166
167 152 Eczacıbaşı Yapı Gereçleri San. ve Tic. A.Ş. İstanbul - 158 471.915.822 165-156 524.544.599 --- - 328-317 91.449.233 134-125 592.642.082 --- - 92-91 132.117 112-103 1.471 167
168 186 Aşkale Çimento Sanayii T.A.Ş. Erzurum - 159 468.812.357 181-172 492.796.353 116-107 152.124.486 113-104 318.511.452 97-89 856.995.268 96-91 60.820.698 408-403 5.290 155-145 1.102 168
169 166 Nuh Çimento Sanayi A.Ş. Kocaeli - 160 468.522.565 193-184 473.522.002 94-86 172.637.264 47-40 755.723.763 79-71 1.012.056.679 83-78 73.081.844 242-240 47.932 296-284 501 169
170 171 Doğa Organik Gıda ve Tarım Ür. Ürt. ve Tic. İth. İhr. A.Ş. Manisa - 161 468.022.673 103-97 820.326.837 381-368 31.261.409 442-429 32.929.892 270-258 297.271.123 384-378 3.078.416 435-430 1.631 438-425 201 170
171 147 Temsa Global San. ve Tic. A.Ş. Adana - 162 467.262.190 79-73 1.055.477.247 --- - --- - 90-82 902.651.204 --- - 76-75 162.159 103-95 1.622 171
172 144 Zorluteks Tekstil Tic. ve San. A.Ş. İstanbul - 163 466.474.760 160-152 541.049.032 213-203 79.318.504 58-50 582.015.156 88-80 914.023.332 199-193 26.087.578 77-76 160.338 89-81 1.767 172
173 190 DYO Boya Fabrikaları San. ve Tic. A.Ş. Ege Bölgesi - 164 462.648.309 188-179 479.644.352 146-137 119.060.476 --- - --- - 216-210 23.414.984 376-373 11.834 --- - 173
174 192 Sofra Yemek Üretim ve Hizmet A.Ş. İstanbul - 165 456.071.419 196-187 465.775.259 112-103 156.289.080 164-155 236.800.318 256-244 314.872.724 195-189 26.785.702 --- - 6-3 8.317 174
175 158 Dünya Uluslararası Mücevherat ve Kuyumculuk San. ve Tic. A.Ş. İstanbul - 166 454.701.595 182-173 491.836.766 491-478 1.470.937 467-454 16.567.405 435-422 138.451.925 421-414 1.178.718 433-428 2.520 --- - 175
176 154 Federal-Mogul Piston Segman ve Gömlek Üretim Tesisleri A.Ş. İstanbul - 167 454.473.372 183-174 489.826.596 83-76 183.802.651 148-139 256.929.404 275-263 293.152.094 58-53 109.661.517 68-67 175.836 118-109 1.420 176
177 191 Baştuğ Çelik Sanayi A.Ş. Dörtyol - 168 451.809.024 200-191 452.371.344 461-448 10.968.637 --- - --- - 420-413 1.222.208 297-295 30.456 475-462 147 177
178 172 Tırsan Treyler San. Tic. ve Nakliyat A.Ş. Sakarya - 169 449.461.208 142-134 629.136.307 182-173 95.070.733 253-242 143.118.459 150-141 551.592.538 210-204 24.140.839 193-192 67.987 352-339 363 178
179 - - İstanbul - 170 - 194-185 - 155-146 - 186-177 - 165-155 - 137-132 - 115-114 - 98-90 - 179
180 169 Korozo Ambalaj San. ve Tic. A.Ş. İstanbul - 171 446.528.804 197-188 465.087.891 208-198 81.000.852 231-220 157.813.644 252-240 323.124.255 214-208 23.800.281 86-85 142.380 244-232 689 180
181 - Onsa Mücevherat İmalatı ve Dış Ticaret A.Ş. İstanbul - 172 440.441.442 202-193 446.606.456 435-422 15.874.142 408-396 49.232.537 366-353 201.657.345 413-406 1.531.203 183-182 75.378 451-438 175 181
182 230 Has Çelik ve Halat San. Tic. A.Ş Kayseri - 173 437.942.741 198-189 460.848.840 278-266 56.599.121 310-299 98.060.642 375-362 196.519.972 209-203 24.155.090 112-111 115.344 250-238 658 182
183 198 Olmuksan International Paper-Ambalaj San. ve Tic. A.Ş. İstanbul - 174 425.882.320 212-203 425.905.866 181-172 95.171.904 185-176 212.321.732 285-273 284.558.880 192-186 27.538.941 373-370 12.658 184-173 970 183
184 265 Karakaş Atlantis Kıymetli Madenler Kuyumculuk Telekomünikasyon San. ve Tic. A.Ş. Ege Bölgesi - 175 424.859.918 199-190 459.428.785 451-438 12.955.409 308-297 98.823.458 422-409 150.427.290 355-349 6.020.297 321-319 24.276 473-460 150 184
185 161 Orta Anadolu Tic. ve San. İşl. T.A.Ş. Kayseri - 176 424.501.972 208-199 433.996.632 144-135 121.660.275 120-111 307.029.035 168-158 487.849.939 127-122 46.253.649 136-135 98.000 123-114 1.335 185
186 182 Mondi Tire Kutsan Kağıt ve Ambalaj Sanayi A.Ş. Ege Bölgesi - 177 423.803.196 211-202 426.458.369 --- - --- - --- - --- - --- - --- - 186
187 210 Yudum Gıda San. ve Tic. A.Ş. İstanbul - 178 423.257.032 214-205 423.921.677 384-371 30.420.521 --- - --- - 283-277 12.684.966 391-387 8.386 483-470 129 187
188 187 Mutlu Akü ve Malzemeleri Sanayi A.Ş. İstanbul - 179 420.150.182 206-197 440.493.205 136-127 127.372.050 215-205 170.818.680 295-283 276.137.371 133-128 43.841.846 195-194 67.073 232-220 739 188
189 - - İstanbul - 180 - 216-207 - 110-101 - 116-107 - 222-211 - 194-188 - 265-263 - 119-110 - 189
190 226 Pakpen Plastik Boru ve Yapı Elemanları San. ve Tic. A.Ş. Konya - 181 418.227.186 218-209 418.775.187 171-162 100.899.207 325-314 92.636.864 180-170 461.898.916 155-150 37.325.554 280-278 36.619 253-241 650 190
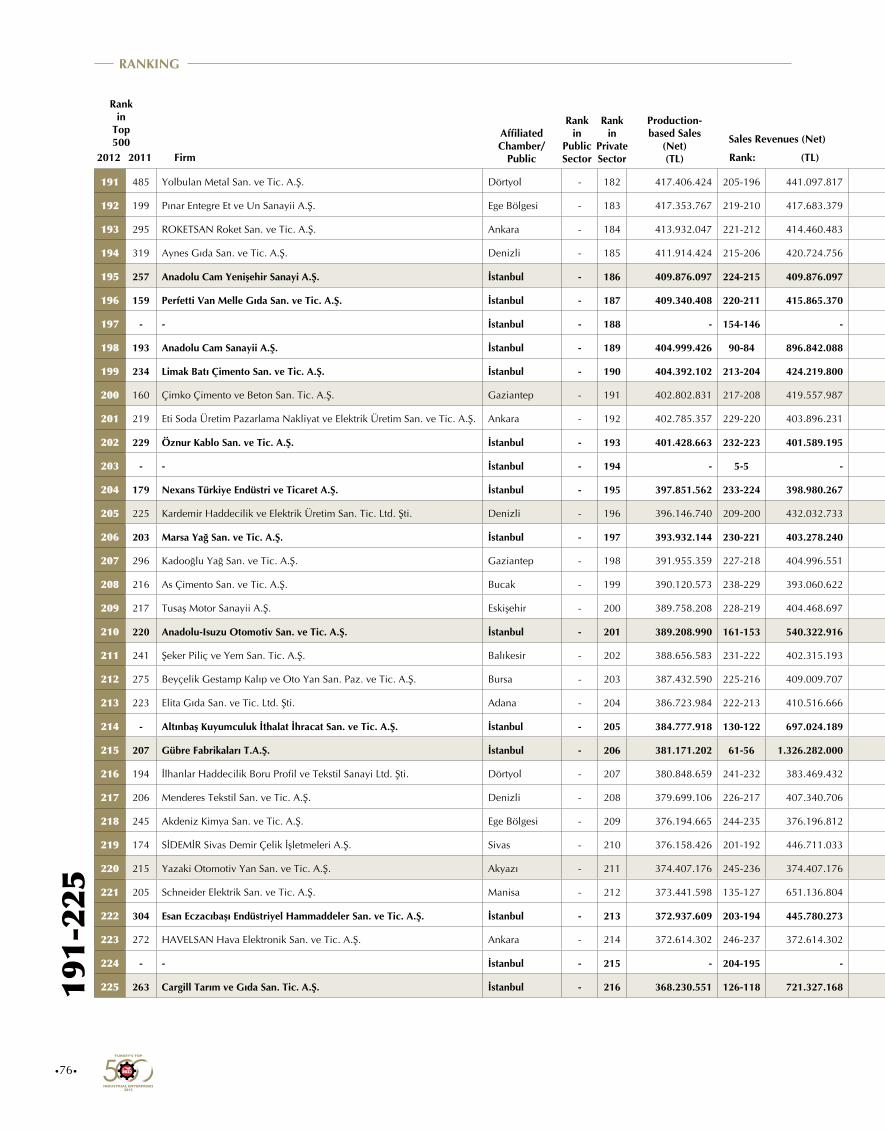
Rank: Rank: Rank: Rank:Rank:(TL) (TL) Rank: (TL) (TL) Number:($ 000)Firm2012 2011 Rank: (TL)
Gross Value Added (at Producers’ Prices) Equity Capital Total Assets Exports
Profit (Before Tax)/Loss for the Period
Average No. of Wage Employees
Rank in
Top 500
Affiliated Chamber/
Public
Rank in
Public Sector
Rank in
Private Sector
Production-based Sales
(Net) (TL)
Sales Revenues (Net)
Rank in
Top 5002012
•76•
191-
225
RANKING
191 485 Yolbulan Metal San. ve Tic. A.Ş. Dörtyol - 182 417.406.424 205-196 441.097.817 259-248 61.899.921 299-288 106.547.157 255-243 314.902.149 333-327 7.970.817 267-265 40.047 340-328 408 191
192 199 Pınar Entegre Et ve Un Sanayii A.Ş. Ege Bölgesi - 183 417.353.767 219-210 417.683.379 206-196 81.621.749 201-192 186.704.086 296-284 273.023.632 134-129 43.234.190 416-411 4.348 239-227 702 192
193 295 ROKETSAN Roket San. ve Tic. A.Ş. Ankara - 184 413.932.047 221-212 414.460.483 50-43 311.193.472 83-75 411.250.261 39-34 1.832.704.536 32-28 189.572.680 191-190 71.211 117-108 1.432 193
194 319 Aynes Gıda San. ve Tic. A.Ş. Denizli - 185 411.914.424 215-206 420.724.756 291-278 53.609.117 416-404 45.257.913 298-286 270.280.760 310-304 9.506.530 411-406 5.160 196-185 900 194
195 257 Anadolu Cam Yenişehir Sanayi A.Ş. İstanbul - 186 409.876.097 224-215 409.876.097 71-64 213.347.649 136-127 278.557.788 220-209 376.498.214 71-66 95.330.141 --- - 245-233 684 195
196 159 Perfetti Van Melle Gıda San. ve Tic. A.Ş. İstanbul - 187 409.340.408 220-211 415.865.370 217-207 77.992.012 163-154 237.287.621 291-279 280.049.356 178-172 31.557.106 105-104 120.303 149-140 1.145 196
197 - - İstanbul - 188 - 154-146 - 120-111 - 346-335 - 412-399 - 106-101 - 340-338 - 368-355 - 197
198 193 Anadolu Cam Sanayii A.Ş. İstanbul - 189 404.999.426 90-84 896.842.088 84-77 182.476.874 48-41 751.505.973 81-73 1.003.699.942 69-64 98.883.842 284-282 36.092 122-113 1.365 198
199 234 Limak Batı Çimento San. ve Tic. A.Ş. İstanbul - 190 404.392.102 213-204 424.219.800 176-167 97.775.933 187-178 209.014.085 214-203 390.147.614 222-216 21.754.045 432-427 2.722 286-274 540 199
200 160 Çimko Çimento ve Beton San. Tic. A.Ş. Gaziantep - 191 402.802.831 217-208 419.557.987 175-166 98.404.791 100-91 361.222.996 158-148 530.749.677 145-140 39.765.839 188-187 72.591 208-197 853 200
201 219 Eti Soda Üretim Pazarlama Nakliyat ve Elektrik Üretim San. ve Tic. A.Ş. Ankara - 192 402.785.357 229-220 403.896.231 --- - 210-201 176.795.055 159-149 527.108.814 --- - 223-221 55.895 326-314 427 201
202 229 Öznur Kablo San. ve Tic. A.Ş. İstanbul - 193 401.428.663 232-223 401.589.195 --- - 330-319 91.076.053 201-191 415.834.879 --- - 401-397 5.799 439-426 196 202
203 - - İstanbul - 194 - 5-5 - 8-7 - 55-47 - 31-27 - 335-329 - 206-205 - 329-317 - 203
204 179 Nexans Türkiye Endüstri ve Ticaret A.Ş. İstanbul - 195 397.851.562 233-224 398.980.267 --- - --- - 348-336 217.840.720 --- - 121-120 108.076 324-312 429 204
205 225 Kardemir Haddecilik ve Elektrik Üretim San. Tic. Ltd. Şti. Denizli - 196 396.146.740 209-200 432.032.733 235-224 71.065.985 327-316 91.549.478 338-326 225.528.180 404-397 2.015.144 59-58 200.237 298-286 500 205
206 203 Marsa Yağ San. ve Tic. A.Ş. İstanbul - 197 393.932.144 230-221 403.278.240 --- - --- - --- - --- - 190-189 71.897 --- - 206
207 296 Kadooğlu Yağ San. ve Tic. A.Ş. Gaziantep - 198 391.955.359 227-218 404.996.551 474-461 8.190.212 471-458 15.266.123 397-384 174.764.767 329-323 8.168.560 60-59 200.090 486-473 122 207
208 216 As Çimento San. ve Tic. A.Ş. Bucak - 199 390.120.573 238-229 393.060.622 --- - --- - --- - --- - --- - --- - 208
209 217 Tusaş Motor Sanayii A.Ş. Eskişehir - 200 389.758.208 228-219 404.468.697 161-152 109.273.106 118-109 307.491.233 162-152 512.655.977 220-214 22.427.038 56-55 203.000 126-117 1.327 209
210 220 Anadolu-Isuzu Otomotiv San. ve Tic. A.Ş. İstanbul - 201 389.208.990 161-153 540.322.916 310-297 47.743.358 266-255 132.611.199 211-200 391.833.853 450-443 -2.575.731 231-229 51.393 292-280 520 210
211 241 Şeker Piliç ve Yem San. Tic. A.Ş. Balıkesir - 202 388.656.583 231-222 402.315.193 477-464 7.728.088 495-482 -48.615.913 362-349 204.832.910 489-479 -55.085.773 294-292 33.210 104-96 1.599 211
212 275 Beyçelik Gestamp Kalıp ve Oto Yan San. Paz. ve Tic. A.Ş. Bursa - 203 387.432.590 225-216 409.009.707 --- - --- - 231-220 350.996.914 --- - 233-231 50.546 129-120 1.309 212
213 223 Elita Gıda San. ve Tic. Ltd. Şti. Adana - 204 386.723.984 222-213 410.516.666 406-393 24.319.072 456-443 22.459.921 369-356 200.552.004 370-364 4.486.677 179-178 78.382 481-468 135 213
214 - Altınbaş Kuyumculuk İthalat İhracat San. ve Tic. A.Ş. İstanbul - 205 384.777.918 130-122 697.024.189 462-449 10.727.678 388-376 59.776.359 316-304 252.939.008 365-359 4.997.403 78-77 159.145 458-445 164 214
215 207 Gübre Fabrikaları T.A.Ş. İstanbul - 206 381.171.202 61-56 1.326.282.000 496-483 -56.586.119 102-93 356.041.966 63-55 1.181.033.501 24-20 214.018.006 345-343 19.533 331-319 420 215
216 194 İlhanlar Haddecilik Boru Profil ve Tekstil Sanayi Ltd. Şti. Dörtyol - 207 380.848.659 241-232 383.469.432 --- - 468-455 16.305.132 442-429 134.326.271 --- - 333-331 22.479 410-397 264 216
217 206 Menderes Tekstil San. ve Tic. A.Ş. Denizli - 208 379.699.106 226-217 407.340.706 178-169 97.693.080 126-117 293.986.824 175-165 467.358.650 346-340 6.715.206 73-72 165.718 85-77 1.854 217
218 245 Akdeniz Kimya San. ve Tic. A.Ş. Ege Bölgesi - 209 376.194.665 244-235 376.196.812 --- - 239-228 152.830.151 250-238 324.891.019 --- - --- - 302-290 485 218
219 174 SİDEMİR Sivas Demir Çelik İşletmeleri A.Ş. Sivas - 210 376.158.426 201-192 446.711.033 --- - --- - --- - --- - --- - 282-270 570 219
220 215 Yazaki Otomotiv Yan San. ve Tic. A.Ş. Akyazı - 211 374.407.176 245-236 374.407.176 --- - --- - --- - --- - 75-74 162.774 31-23 3.596 220
221 205 Schneider Elektrik San. ve Tic. A.Ş. Manisa - 212 373.441.598 135-127 651.136.804 --- - --- - --- - --- - 99-98 127.179 132-123 1.300 221
222 304 Esan Eczacıbaşı Endüstriyel Hammaddeler San. ve Tic. A.Ş. İstanbul - 213 372.937.609 203-194 445.780.273 --- - --- - --- - --- - --- - --- - 222
223 272 HAVELSAN Hava Elektronik San. ve Tic. A.Ş. Ankara - 214 372.614.302 246-237 372.614.302 132-123 131.549.455 151-142 254.869.504 120-112 666.446.901 128-123 46.165.560 110-109 116.319 145-136 1.177 223
224 - - İstanbul - 215 - 204-195 - 143-134 - 211-202 - 314-302 - 107-102 - 126-125 - 323-311 - 224
225 263 Cargill Tarım ve Gıda San. Tic. A.Ş. İstanbul - 216 368.230.551 126-118 721.327.168 111-102 157.074.457 96-87 371.712.784 198-188 420.026.356 36-32 159.819.971 418-413 4.188 389-376 307 225

•77•
Rank: Rank: Rank: Rank:Rank:(TL) (TL) Rank: (TL) (TL) Number:($ 000)Firm2012 2011 Rank: (TL)
Gross Value Added (at Producers’ Prices) Equity Capital Total Assets Exports
Profit (Before Tax)/Loss for the Period
Average No. of Wage Employees
Rank in
Top 500
Affiliated Chamber/
Public
Rank in
Public Sector
Rank in
Private Sector
Production-based Sales
(Net) (TL)
Sales Revenues (Net)
Rank in
Top 5002012
191-225RANKING
191 485 Yolbulan Metal San. ve Tic. A.Ş. Dörtyol - 182 417.406.424 205-196 441.097.817 259-248 61.899.921 299-288 106.547.157 255-243 314.902.149 333-327 7.970.817 267-265 40.047 340-328 408 191
192 199 Pınar Entegre Et ve Un Sanayii A.Ş. Ege Bölgesi - 183 417.353.767 219-210 417.683.379 206-196 81.621.749 201-192 186.704.086 296-284 273.023.632 134-129 43.234.190 416-411 4.348 239-227 702 192
193 295 ROKETSAN Roket San. ve Tic. A.Ş. Ankara - 184 413.932.047 221-212 414.460.483 50-43 311.193.472 83-75 411.250.261 39-34 1.832.704.536 32-28 189.572.680 191-190 71.211 117-108 1.432 193
194 319 Aynes Gıda San. ve Tic. A.Ş. Denizli - 185 411.914.424 215-206 420.724.756 291-278 53.609.117 416-404 45.257.913 298-286 270.280.760 310-304 9.506.530 411-406 5.160 196-185 900 194
195 257 Anadolu Cam Yenişehir Sanayi A.Ş. İstanbul - 186 409.876.097 224-215 409.876.097 71-64 213.347.649 136-127 278.557.788 220-209 376.498.214 71-66 95.330.141 --- - 245-233 684 195
196 159 Perfetti Van Melle Gıda San. ve Tic. A.Ş. İstanbul - 187 409.340.408 220-211 415.865.370 217-207 77.992.012 163-154 237.287.621 291-279 280.049.356 178-172 31.557.106 105-104 120.303 149-140 1.145 196
197 - - İstanbul - 188 - 154-146 - 120-111 - 346-335 - 412-399 - 106-101 - 340-338 - 368-355 - 197
198 193 Anadolu Cam Sanayii A.Ş. İstanbul - 189 404.999.426 90-84 896.842.088 84-77 182.476.874 48-41 751.505.973 81-73 1.003.699.942 69-64 98.883.842 284-282 36.092 122-113 1.365 198
199 234 Limak Batı Çimento San. ve Tic. A.Ş. İstanbul - 190 404.392.102 213-204 424.219.800 176-167 97.775.933 187-178 209.014.085 214-203 390.147.614 222-216 21.754.045 432-427 2.722 286-274 540 199
200 160 Çimko Çimento ve Beton San. Tic. A.Ş. Gaziantep - 191 402.802.831 217-208 419.557.987 175-166 98.404.791 100-91 361.222.996 158-148 530.749.677 145-140 39.765.839 188-187 72.591 208-197 853 200
201 219 Eti Soda Üretim Pazarlama Nakliyat ve Elektrik Üretim San. ve Tic. A.Ş. Ankara - 192 402.785.357 229-220 403.896.231 --- - 210-201 176.795.055 159-149 527.108.814 --- - 223-221 55.895 326-314 427 201
202 229 Öznur Kablo San. ve Tic. A.Ş. İstanbul - 193 401.428.663 232-223 401.589.195 --- - 330-319 91.076.053 201-191 415.834.879 --- - 401-397 5.799 439-426 196 202
203 - - İstanbul - 194 - 5-5 - 8-7 - 55-47 - 31-27 - 335-329 - 206-205 - 329-317 - 203
204 179 Nexans Türkiye Endüstri ve Ticaret A.Ş. İstanbul - 195 397.851.562 233-224 398.980.267 --- - --- - 348-336 217.840.720 --- - 121-120 108.076 324-312 429 204
205 225 Kardemir Haddecilik ve Elektrik Üretim San. Tic. Ltd. Şti. Denizli - 196 396.146.740 209-200 432.032.733 235-224 71.065.985 327-316 91.549.478 338-326 225.528.180 404-397 2.015.144 59-58 200.237 298-286 500 205
206 203 Marsa Yağ San. ve Tic. A.Ş. İstanbul - 197 393.932.144 230-221 403.278.240 --- - --- - --- - --- - 190-189 71.897 --- - 206
207 296 Kadooğlu Yağ San. ve Tic. A.Ş. Gaziantep - 198 391.955.359 227-218 404.996.551 474-461 8.190.212 471-458 15.266.123 397-384 174.764.767 329-323 8.168.560 60-59 200.090 486-473 122 207
208 216 As Çimento San. ve Tic. A.Ş. Bucak - 199 390.120.573 238-229 393.060.622 --- - --- - --- - --- - --- - --- - 208
209 217 Tusaş Motor Sanayii A.Ş. Eskişehir - 200 389.758.208 228-219 404.468.697 161-152 109.273.106 118-109 307.491.233 162-152 512.655.977 220-214 22.427.038 56-55 203.000 126-117 1.327 209
210 220 Anadolu-Isuzu Otomotiv San. ve Tic. A.Ş. İstanbul - 201 389.208.990 161-153 540.322.916 310-297 47.743.358 266-255 132.611.199 211-200 391.833.853 450-443 -2.575.731 231-229 51.393 292-280 520 210
211 241 Şeker Piliç ve Yem San. Tic. A.Ş. Balıkesir - 202 388.656.583 231-222 402.315.193 477-464 7.728.088 495-482 -48.615.913 362-349 204.832.910 489-479 -55.085.773 294-292 33.210 104-96 1.599 211
212 275 Beyçelik Gestamp Kalıp ve Oto Yan San. Paz. ve Tic. A.Ş. Bursa - 203 387.432.590 225-216 409.009.707 --- - --- - 231-220 350.996.914 --- - 233-231 50.546 129-120 1.309 212
213 223 Elita Gıda San. ve Tic. Ltd. Şti. Adana - 204 386.723.984 222-213 410.516.666 406-393 24.319.072 456-443 22.459.921 369-356 200.552.004 370-364 4.486.677 179-178 78.382 481-468 135 213
214 - Altınbaş Kuyumculuk İthalat İhracat San. ve Tic. A.Ş. İstanbul - 205 384.777.918 130-122 697.024.189 462-449 10.727.678 388-376 59.776.359 316-304 252.939.008 365-359 4.997.403 78-77 159.145 458-445 164 214
215 207 Gübre Fabrikaları T.A.Ş. İstanbul - 206 381.171.202 61-56 1.326.282.000 496-483 -56.586.119 102-93 356.041.966 63-55 1.181.033.501 24-20 214.018.006 345-343 19.533 331-319 420 215
216 194 İlhanlar Haddecilik Boru Profil ve Tekstil Sanayi Ltd. Şti. Dörtyol - 207 380.848.659 241-232 383.469.432 --- - 468-455 16.305.132 442-429 134.326.271 --- - 333-331 22.479 410-397 264 216
217 206 Menderes Tekstil San. ve Tic. A.Ş. Denizli - 208 379.699.106 226-217 407.340.706 178-169 97.693.080 126-117 293.986.824 175-165 467.358.650 346-340 6.715.206 73-72 165.718 85-77 1.854 217
218 245 Akdeniz Kimya San. ve Tic. A.Ş. Ege Bölgesi - 209 376.194.665 244-235 376.196.812 --- - 239-228 152.830.151 250-238 324.891.019 --- - --- - 302-290 485 218
219 174 SİDEMİR Sivas Demir Çelik İşletmeleri A.Ş. Sivas - 210 376.158.426 201-192 446.711.033 --- - --- - --- - --- - --- - 282-270 570 219
220 215 Yazaki Otomotiv Yan San. ve Tic. A.Ş. Akyazı - 211 374.407.176 245-236 374.407.176 --- - --- - --- - --- - 75-74 162.774 31-23 3.596 220
221 205 Schneider Elektrik San. ve Tic. A.Ş. Manisa - 212 373.441.598 135-127 651.136.804 --- - --- - --- - --- - 99-98 127.179 132-123 1.300 221
222 304 Esan Eczacıbaşı Endüstriyel Hammaddeler San. ve Tic. A.Ş. İstanbul - 213 372.937.609 203-194 445.780.273 --- - --- - --- - --- - --- - --- - 222
223 272 HAVELSAN Hava Elektronik San. ve Tic. A.Ş. Ankara - 214 372.614.302 246-237 372.614.302 132-123 131.549.455 151-142 254.869.504 120-112 666.446.901 128-123 46.165.560 110-109 116.319 145-136 1.177 223
224 - - İstanbul - 215 - 204-195 - 143-134 - 211-202 - 314-302 - 107-102 - 126-125 - 323-311 - 224
225 263 Cargill Tarım ve Gıda San. Tic. A.Ş. İstanbul - 216 368.230.551 126-118 721.327.168 111-102 157.074.457 96-87 371.712.784 198-188 420.026.356 36-32 159.819.971 418-413 4.188 389-376 307 225
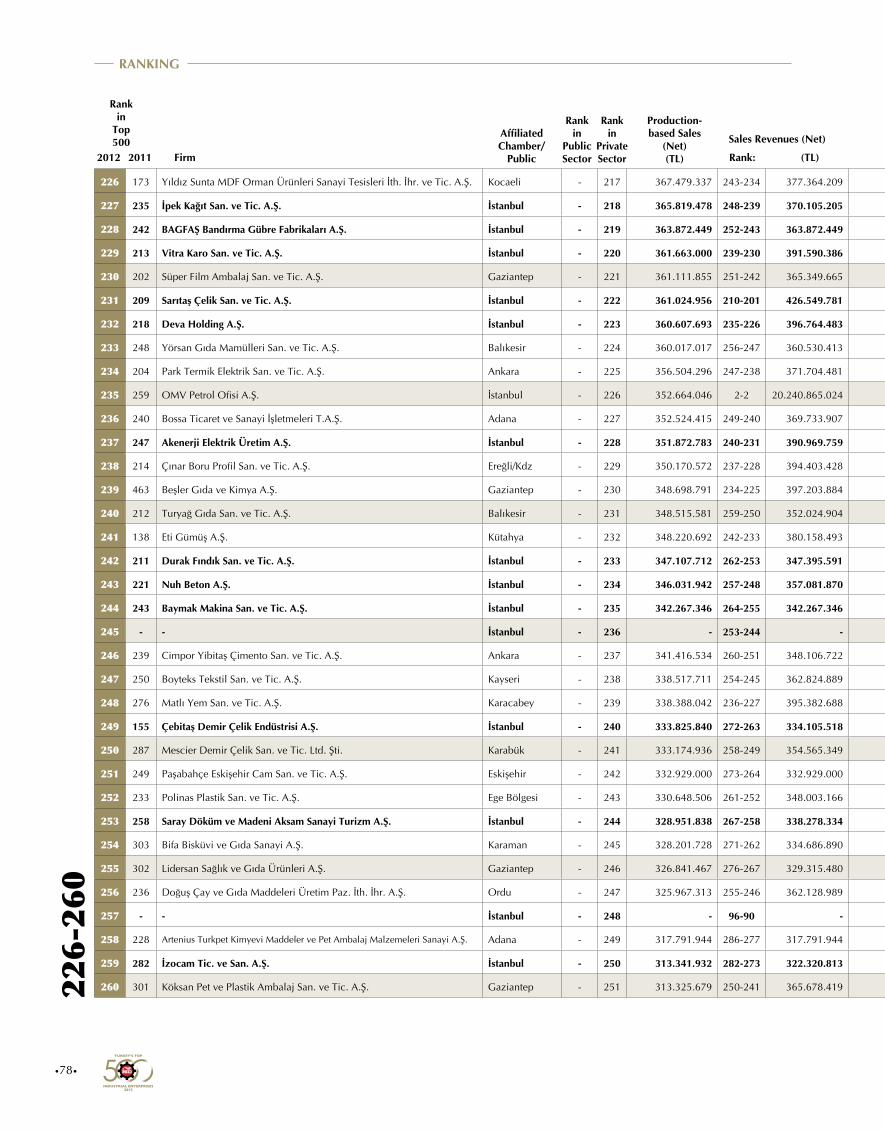
Rank: Rank: Rank: Rank:Rank:(TL) (TL) Rank: (TL) (TL) Number:($ 000)Firm2012 2011 Rank: (TL)
Gross Value Added (at Producers’ Prices) Equity Capital Total Assets Exports
Profit (Before Tax)/Loss for the Period
Average No. of Wage Employees
Rank in
Top 500
Affiliated Chamber/
Public
Rank in
Public Sector
Rank in
Private Sector
Production-based Sales
(Net) (TL)
Sales Revenues (Net)
Rank in
Top 5002012
•78•
226-
260
RANKING
226 173 Yıldız Sunta MDF Orman Ürünleri Sanayi Tesisleri İth. İhr. ve Tic. A.Ş. Kocaeli - 217 367.479.337 243-234 377.364.209 --- - --- - --- - --- - 349-347 17.924 246-234 679 226
227 235 İpek Kağıt San. ve Tic. A.Ş. İstanbul - 218 365.819.478 248-239 370.105.205 --- - --- - --- - --- - --- - 345-333 388 227
228 242 BAGFAŞ Bandırma Gübre Fabrikaları A.Ş. İstanbul - 219 363.872.449 252-243 363.872.449 274-262 58.905.647 169-160 231.409.901 244-232 329.564.274 200-194 25.691.740 258-256 42.990 391-378 304 228
229 213 Vitra Karo San. ve Tic. A.Ş. İstanbul - 220 361.663.000 239-230 391.590.386 --- - --- - 161-151 524.601.428 --- - 94-93 129.845 136-127 1.269 229
230 202 Süper Film Ambalaj San. ve Tic. A.Ş. Gaziantep - 221 361.111.855 251-242 365.349.665 --- - 196-187 192.998.446 191-181 443.150.991 --- - 320-318 24.398 279-267 578 230
231 209 Sarıtaş Çelik San. ve Tic. A.Ş. İstanbul - 222 361.024.956 210-201 426.549.781 --- - 155-146 248.270.106 182-172 456.528.323 --- - 313-311 26.560 493-480 78 231
232 218 Deva Holding A.Ş. İstanbul - 223 360.607.693 235-226 396.764.483 130-121 135.874.661 78-70 429.457.053 106-98 771.392.707 143-138 40.765.378 395-391 7.649 97-89 1.661 232
233 248 Yörsan Gıda Mamülleri San. ve Tic. A.Ş. Balıkesir - 224 360.017.017 256-247 360.530.413 --- - 288-277 111.700.418 427-414 148.684.398 --- - 389-385 8.514 283-271 561 233
234 204 Park Termik Elektrik San. ve Tic. A.Ş. Ankara - 225 356.504.296 247-238 371.704.481 70-63 214.643.098 --- - --- - 73-68 88.509.584 --- - --- - 234
235 259 OMV Petrol Ofisi A.Ş. İstanbul - 226 352.664.046 2-2 20.240.865.024 4-4 4.578.456.481 13-8 1.556.237.531 8-6 6.421.322.187 65-60 103.376.569 8-8 1.211.981 193-182 911 235
236 240 Bossa Ticaret ve Sanayi İşletmeleri T.A.Ş. Adana - 227 352.524.415 249-240 369.733.907 196-186 88.544.583 125-116 295.595.927 190-180 445.963.907 294-288 10.736.042 123-122 107.605 48-40 2.500 236
237 247 Akenerji Elektrik Üretim A.Ş. İstanbul - 228 351.872.783 240-231 390.969.759 148-139 117.080.773 32-26 1.044.267.793 34-30 2.035.007.301 111-106 50.492.289 --- - 445-432 181 237
238 214 Çınar Boru Profil San. ve Tic. A.Ş. Ereğli/Kdz - 229 350.170.572 237-228 394.403.428 --- - --- - --- - --- - --- - --- - 238
239 463 Beşler Gıda ve Kimya A.Ş. Gaziantep - 230 348.698.791 234-225 397.203.884 --- - 481-468 12.006.800 446-433 130.280.786 --- - 87-86 139.554 480-467 138 239
240 212 Turyağ Gıda San. ve Tic. A.Ş. Balıkesir - 231 348.515.581 259-250 352.024.904 401-388 24.508.189 361-349 71.290.582 424-411 149.575.234 342-336 7.332.237 415-410 4.600 426-413 225 240
241 138 Eti Gümüş A.Ş. Kütahya - 232 348.220.692 242-233 380.158.493 138-129 126.377.719 59-51 580.948.024 80-72 1.009.387.736 103-98 56.496.255 197-196 66.221 200-189 891 241
242 211 Durak Fındık San. ve Tic. A.Ş. İstanbul - 233 347.107.712 262-253 347.395.591 473-460 8.442.729 453-440 24.209.438 443-430 134.027.484 411-404 1.629.335 124-123 106.615 330-318 423 242
243 221 Nuh Beton A.Ş. İstanbul - 234 346.031.942 257-248 357.081.870 485-472 5.943.602 184-175 212.427.321 245-233 329.385.023 458-450 -5.230.423 --- - 454-441 170 243
244 243 Baymak Makina San. ve Tic. A.Ş. İstanbul - 235 342.267.346 264-255 342.267.346 198-188 85.640.241 205-196 180.653.237 350-338 216.130.053 105-100 55.110.295 329-327 23.151 277-265 582 244
245 - - İstanbul - 236 - 253-244 - 202-192 - 193-184 - 264-252 - 109-104 - 369-366 - 106-98 - 245
246 239 Cimpor Yibitaş Çimento San. ve Tic. A.Ş. Ankara - 237 341.416.534 260-251 348.106.722 216-206 78.525.362 134-125 283.479.324 148-139 556.203.925 238-232 18.562.524 445-440 1.062 259-247 640 246
247 250 Boyteks Tekstil San. ve Tic. A.Ş. Kayseri - 238 338.517.711 254-245 362.824.889 137-128 126.532.753 144-135 261.202.243 228-217 355.699.690 87-82 68.300.284 101-100 124.276 148-139 1.151 247
248 276 Matlı Yem San. ve Tic. A.Ş. Karacabey - 239 338.388.042 236-227 395.382.688 345-332 40.519.669 240-229 152.626.643 326-314 243.025.312 345-339 6.800.749 --- - 284-272 550 248
249 155 Çebitaş Demir Çelik Endüstrisi A.Ş. İstanbul - 240 333.825.840 272-263 334.105.518 427-414 18.129.918 236-225 154.757.943 385-372 184.400.673 417-410 1.247.894 96-95 128.616 358-345 352 249
250 287 Mescier Demir Çelik San. ve Tic. Ltd. Şti. Karabük - 241 333.174.936 258-249 354.565.349 414-401 21.600.026 449-436 28.053.978 450-437 125.865.136 349-343 6.412.281 91-90 132.167 351-338 366 250
251 249 Paşabahçe Eskişehir Cam San. ve Tic. A.Ş. Eskişehir - 242 332.929.000 273-264 332.929.000 134-125 128.142.001 195-186 193.391.962 249-237 325.395.016 153-148 37.419.629 118-117 111.052 143-134 1.202 251
252 233 Polinas Plastik San. ve Tic. A.Ş. Ege Bölgesi - 243 330.648.506 261-252 348.003.166 --- - --- - --- - --- - --- - 347-335 379 252
253 258 Saray Döküm ve Madeni Aksam Sanayi Turizm A.Ş. İstanbul - 244 328.951.838 267-258 338.278.334 194-184 88.660.876 145-136 261.019.836 288-276 282.186.267 102-97 56.886.624 143-142 96.904 315-303 443 253
254 303 Bifa Bisküvi ve Gıda Sanayi A.Ş. Karaman - 245 328.201.728 271-262 334.686.890 242-231 67.600.522 334-323 86.645.243 393-380 177.123.200 201-195 25.467.651 225-223 54.442 66-58 2.137 254
255 302 Lidersan Sağlık ve Gıda Ürünleri A.Ş. Gaziantep - 246 326.841.467 276-267 329.315.480 303-290 50.003.653 377-365 62.884.545 431-418 145.372.816 298-292 10.402.627 69-68 173.997 354-341 360 255
256 236 Doğuş Çay ve Gıda Maddeleri Üretim Paz. İth. İhr. A.Ş. Ordu - 247 325.967.313 255-246 362.128.989 224-214 74.310.202 316-305 96.801.313 229-218 352.986.668 202-196 25.200.672 447-442 451 165-154 1.071 256
257 - - İstanbul - 248 - 96-90 - 119-110 - 247-236 - 152-143 - 280-274 - 318-316 - 152-142 - 257
258 228 Artenius Turkpet Kimyevi Maddeler ve Pet Ambalaj Malzemeleri Sanayi A.Ş. Adana - 249 317.791.944 286-277 317.791.944 448-435 13.856.481 268-257 128.608.954 336-324 228.999.586 463-455 -6.601.926 365-362 13.665 471-458 153 258
259 282 İzocam Tic. ve San. A.Ş. İstanbul - 250 313.341.932 282-273 322.320.813 221-211 76.919.334 259-248 137.198.569 373-360 198.624.362 188-182 28.282.133 300-298 29.528 317-305 436 259
260 301 Köksan Pet ve Plastik Ambalaj San. ve Tic. A.Ş. Gaziantep - 251 313.325.679 250-241 365.678.419 --- - --- - --- - --- - 178-177 78.732 --- - 260
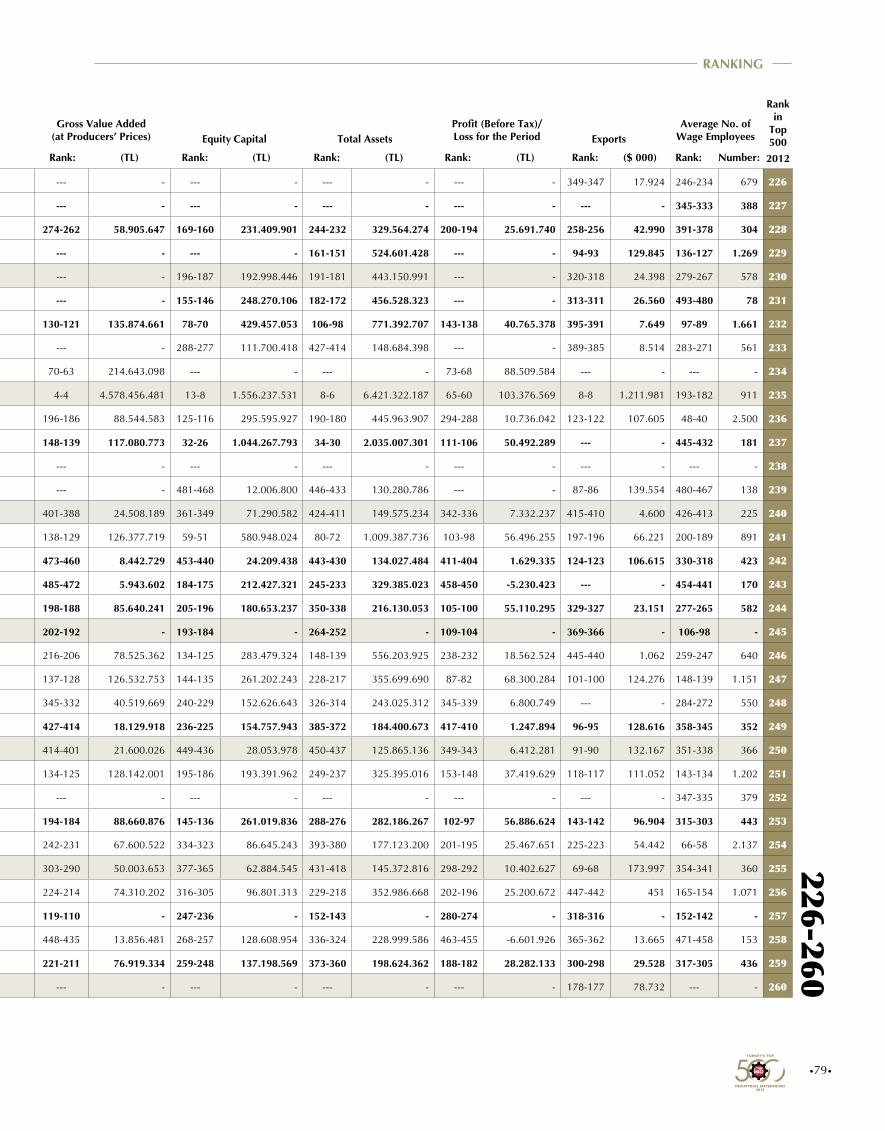
•79•
Rank: Rank: Rank: Rank:Rank:(TL) (TL) Rank: (TL) (TL) Number:($ 000)Firm2012 2011 Rank: (TL)
Gross Value Added (at Producers’ Prices) Equity Capital Total Assets Exports
Profit (Before Tax)/Loss for the Period
Average No. of Wage Employees
Rank in
Top 500
Affiliated Chamber/
Public
Rank in
Public Sector
Rank in
Private Sector
Production-based Sales
(Net) (TL)
Sales Revenues (Net)
Rank in
Top 5002012
226-260RANKING
226 173 Yıldız Sunta MDF Orman Ürünleri Sanayi Tesisleri İth. İhr. ve Tic. A.Ş. Kocaeli - 217 367.479.337 243-234 377.364.209 --- - --- - --- - --- - 349-347 17.924 246-234 679 226
227 235 İpek Kağıt San. ve Tic. A.Ş. İstanbul - 218 365.819.478 248-239 370.105.205 --- - --- - --- - --- - --- - 345-333 388 227
228 242 BAGFAŞ Bandırma Gübre Fabrikaları A.Ş. İstanbul - 219 363.872.449 252-243 363.872.449 274-262 58.905.647 169-160 231.409.901 244-232 329.564.274 200-194 25.691.740 258-256 42.990 391-378 304 228
229 213 Vitra Karo San. ve Tic. A.Ş. İstanbul - 220 361.663.000 239-230 391.590.386 --- - --- - 161-151 524.601.428 --- - 94-93 129.845 136-127 1.269 229
230 202 Süper Film Ambalaj San. ve Tic. A.Ş. Gaziantep - 221 361.111.855 251-242 365.349.665 --- - 196-187 192.998.446 191-181 443.150.991 --- - 320-318 24.398 279-267 578 230
231 209 Sarıtaş Çelik San. ve Tic. A.Ş. İstanbul - 222 361.024.956 210-201 426.549.781 --- - 155-146 248.270.106 182-172 456.528.323 --- - 313-311 26.560 493-480 78 231
232 218 Deva Holding A.Ş. İstanbul - 223 360.607.693 235-226 396.764.483 130-121 135.874.661 78-70 429.457.053 106-98 771.392.707 143-138 40.765.378 395-391 7.649 97-89 1.661 232
233 248 Yörsan Gıda Mamülleri San. ve Tic. A.Ş. Balıkesir - 224 360.017.017 256-247 360.530.413 --- - 288-277 111.700.418 427-414 148.684.398 --- - 389-385 8.514 283-271 561 233
234 204 Park Termik Elektrik San. ve Tic. A.Ş. Ankara - 225 356.504.296 247-238 371.704.481 70-63 214.643.098 --- - --- - 73-68 88.509.584 --- - --- - 234
235 259 OMV Petrol Ofisi A.Ş. İstanbul - 226 352.664.046 2-2 20.240.865.024 4-4 4.578.456.481 13-8 1.556.237.531 8-6 6.421.322.187 65-60 103.376.569 8-8 1.211.981 193-182 911 235
236 240 Bossa Ticaret ve Sanayi İşletmeleri T.A.Ş. Adana - 227 352.524.415 249-240 369.733.907 196-186 88.544.583 125-116 295.595.927 190-180 445.963.907 294-288 10.736.042 123-122 107.605 48-40 2.500 236
237 247 Akenerji Elektrik Üretim A.Ş. İstanbul - 228 351.872.783 240-231 390.969.759 148-139 117.080.773 32-26 1.044.267.793 34-30 2.035.007.301 111-106 50.492.289 --- - 445-432 181 237
238 214 Çınar Boru Profil San. ve Tic. A.Ş. Ereğli/Kdz - 229 350.170.572 237-228 394.403.428 --- - --- - --- - --- - --- - --- - 238
239 463 Beşler Gıda ve Kimya A.Ş. Gaziantep - 230 348.698.791 234-225 397.203.884 --- - 481-468 12.006.800 446-433 130.280.786 --- - 87-86 139.554 480-467 138 239
240 212 Turyağ Gıda San. ve Tic. A.Ş. Balıkesir - 231 348.515.581 259-250 352.024.904 401-388 24.508.189 361-349 71.290.582 424-411 149.575.234 342-336 7.332.237 415-410 4.600 426-413 225 240
241 138 Eti Gümüş A.Ş. Kütahya - 232 348.220.692 242-233 380.158.493 138-129 126.377.719 59-51 580.948.024 80-72 1.009.387.736 103-98 56.496.255 197-196 66.221 200-189 891 241
242 211 Durak Fındık San. ve Tic. A.Ş. İstanbul - 233 347.107.712 262-253 347.395.591 473-460 8.442.729 453-440 24.209.438 443-430 134.027.484 411-404 1.629.335 124-123 106.615 330-318 423 242
243 221 Nuh Beton A.Ş. İstanbul - 234 346.031.942 257-248 357.081.870 485-472 5.943.602 184-175 212.427.321 245-233 329.385.023 458-450 -5.230.423 --- - 454-441 170 243
244 243 Baymak Makina San. ve Tic. A.Ş. İstanbul - 235 342.267.346 264-255 342.267.346 198-188 85.640.241 205-196 180.653.237 350-338 216.130.053 105-100 55.110.295 329-327 23.151 277-265 582 244
245 - - İstanbul - 236 - 253-244 - 202-192 - 193-184 - 264-252 - 109-104 - 369-366 - 106-98 - 245
246 239 Cimpor Yibitaş Çimento San. ve Tic. A.Ş. Ankara - 237 341.416.534 260-251 348.106.722 216-206 78.525.362 134-125 283.479.324 148-139 556.203.925 238-232 18.562.524 445-440 1.062 259-247 640 246
247 250 Boyteks Tekstil San. ve Tic. A.Ş. Kayseri - 238 338.517.711 254-245 362.824.889 137-128 126.532.753 144-135 261.202.243 228-217 355.699.690 87-82 68.300.284 101-100 124.276 148-139 1.151 247
248 276 Matlı Yem San. ve Tic. A.Ş. Karacabey - 239 338.388.042 236-227 395.382.688 345-332 40.519.669 240-229 152.626.643 326-314 243.025.312 345-339 6.800.749 --- - 284-272 550 248
249 155 Çebitaş Demir Çelik Endüstrisi A.Ş. İstanbul - 240 333.825.840 272-263 334.105.518 427-414 18.129.918 236-225 154.757.943 385-372 184.400.673 417-410 1.247.894 96-95 128.616 358-345 352 249
250 287 Mescier Demir Çelik San. ve Tic. Ltd. Şti. Karabük - 241 333.174.936 258-249 354.565.349 414-401 21.600.026 449-436 28.053.978 450-437 125.865.136 349-343 6.412.281 91-90 132.167 351-338 366 250
251 249 Paşabahçe Eskişehir Cam San. ve Tic. A.Ş. Eskişehir - 242 332.929.000 273-264 332.929.000 134-125 128.142.001 195-186 193.391.962 249-237 325.395.016 153-148 37.419.629 118-117 111.052 143-134 1.202 251
252 233 Polinas Plastik San. ve Tic. A.Ş. Ege Bölgesi - 243 330.648.506 261-252 348.003.166 --- - --- - --- - --- - --- - 347-335 379 252
253 258 Saray Döküm ve Madeni Aksam Sanayi Turizm A.Ş. İstanbul - 244 328.951.838 267-258 338.278.334 194-184 88.660.876 145-136 261.019.836 288-276 282.186.267 102-97 56.886.624 143-142 96.904 315-303 443 253
254 303 Bifa Bisküvi ve Gıda Sanayi A.Ş. Karaman - 245 328.201.728 271-262 334.686.890 242-231 67.600.522 334-323 86.645.243 393-380 177.123.200 201-195 25.467.651 225-223 54.442 66-58 2.137 254
255 302 Lidersan Sağlık ve Gıda Ürünleri A.Ş. Gaziantep - 246 326.841.467 276-267 329.315.480 303-290 50.003.653 377-365 62.884.545 431-418 145.372.816 298-292 10.402.627 69-68 173.997 354-341 360 255
256 236 Doğuş Çay ve Gıda Maddeleri Üretim Paz. İth. İhr. A.Ş. Ordu - 247 325.967.313 255-246 362.128.989 224-214 74.310.202 316-305 96.801.313 229-218 352.986.668 202-196 25.200.672 447-442 451 165-154 1.071 256
257 - - İstanbul - 248 - 96-90 - 119-110 - 247-236 - 152-143 - 280-274 - 318-316 - 152-142 - 257
258 228 Artenius Turkpet Kimyevi Maddeler ve Pet Ambalaj Malzemeleri Sanayi A.Ş. Adana - 249 317.791.944 286-277 317.791.944 448-435 13.856.481 268-257 128.608.954 336-324 228.999.586 463-455 -6.601.926 365-362 13.665 471-458 153 258
259 282 İzocam Tic. ve San. A.Ş. İstanbul - 250 313.341.932 282-273 322.320.813 221-211 76.919.334 259-248 137.198.569 373-360 198.624.362 188-182 28.282.133 300-298 29.528 317-305 436 259
260 301 Köksan Pet ve Plastik Ambalaj San. ve Tic. A.Ş. Gaziantep - 251 313.325.679 250-241 365.678.419 --- - --- - --- - --- - 178-177 78.732 --- - 260
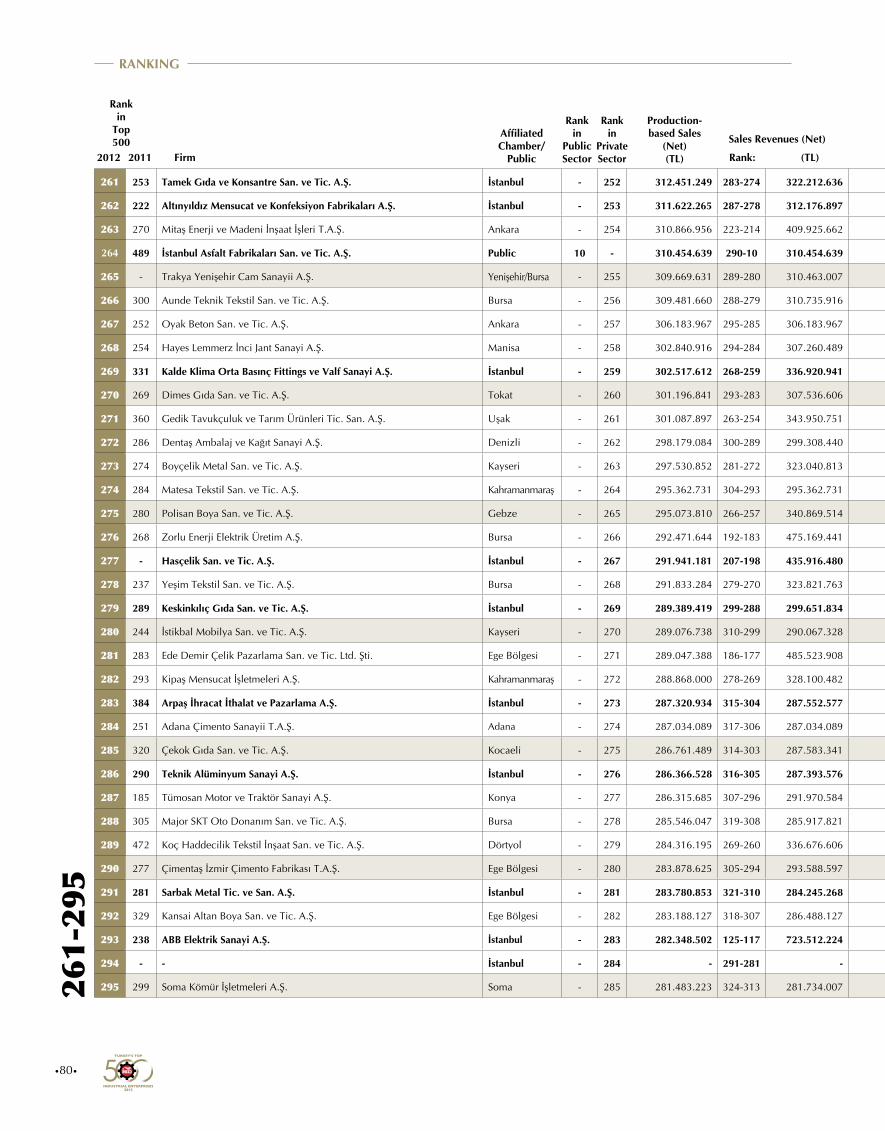
•80•
Rank: Rank: Rank: Rank:Rank:(TL) (TL) Rank: (TL) (TL) Number:($ 000)Firm2012 2011 Rank: (TL)
Gross Value Added (at Producers’ Prices) Equity Capital Total Assets Exports
Profit (Before Tax)/Loss for the Period
Average No. of Wage Employees
Rank in
Top 500
Affiliated Chamber/
Public
Rank in
Public Sector
Rank in
Private Sector
Production-based Sales
(Net) (TL)
Sales Revenues (Net)
Rank in
Top 5002012
261-
295
RANKING
261 253 Tamek Gıda ve Konsantre San. ve Tic. A.Ş. İstanbul - 252 312.451.249 283-274 322.212.636 280-268 55.954.289 --- - --- - 340-334 7.532.162 360-358 14.695 --- - 261
262 222 Altınyıldız Mensucat ve Konfeksiyon Fabrikaları A.Ş. İstanbul - 253 311.622.265 287-278 312.176.897 231-220 72.096.208 200-191 187.196.038 112-104 749.883.392 491-481 -58.178.373 296-294 32.494 88-80 1.775 262
263 270 Mitaş Enerji ve Madeni İnşaat İşleri T.A.Ş. Ankara - 254 310.866.956 223-214 409.925.662 341-328 41.387.859 297-286 107.527.494 304-292 261.434.100 205-199 24.509.502 64-63 191.031 249-237 660 263
264 489 İstanbul Asfalt Fabrikaları San. ve Tic. A.Ş. Public 10 - 310.454.639 290-10 310.454.639 --- - --- - --- - --- - --- - --- - 264
265 - Trakya Yenişehir Cam Sanayii A.Ş. Yenişehir/Bursa - 255 309.669.631 289-280 310.463.007 135-126 127.732.377 114-105 318.045.428 188-178 448.883.021 92-87 63.991.223 398-394 7.419 335-323 413 265
266 300 Aunde Teknik Tekstil San. ve Tic. A.Ş. Bursa - 256 309.481.660 288-279 310.735.916 323-310 44.595.499 399-387 55.618.435 339-327 225.171.359 266-260 14.598.419 79-78 156.791 72-64 2.048 266
267 252 Oyak Beton San. ve Tic. A.Ş. Ankara - 257 306.183.967 295-285 306.183.967 --- - 410-398 47.692.421 407-394 157.701.047 --- - --- - 452-439 174 267
268 254 Hayes Lemmerz İnci Jant Sanayi A.Ş. Manisa - 258 302.840.916 294-284 307.260.489 --- - 249-238 144.410.946 370-357 200.318.673 --- - 107-106 118.951 229-217 755 268
269 331 Kalde Klima Orta Basınç Fittings ve Valf Sanayi A.Ş. İstanbul - 259 302.517.612 268-259 336.920.941 256-245 62.752.163 405-393 49.701.262 273-261 294.185.845 242-236 17.481.750 134-133 98.873 241-229 700 269
270 269 Dimes Gıda San. ve Tic. A.Ş. Tokat - 260 301.196.841 293-283 307.536.606 348-335 39.972.271 333-322 86.770.674 303-291 264.596.147 435-428 403.149 352-350 16.694 320-308 433 270
271 360 Gedik Tavukçuluk ve Tarım Ürünleri Tic. San. A.Ş. Uşak - 261 301.087.897 263-254 343.950.751 --- - --- - --- - --- - --- - --- - 271
272 286 Dentaş Ambalaj ve Kağıt Sanayi A.Ş. Denizli - 262 298.179.084 300-289 299.308.440 187-178 91.987.941 301-290 106.540.655 287-275 282.870.583 169-163 33.245.538 396-392 7.463 213-201 832 272
273 274 Boyçelik Metal San. ve Tic. A.Ş. Kayseri - 263 297.530.852 281-272 323.040.813 378-365 32.261.104 295-284 108.714.540 383-370 189.072.002 312-306 9.357.230 282-280 36.435 306-294 463 273
274 284 Matesa Tekstil San. ve Tic. A.Ş. Kahramanmaraş - 264 295.362.731 304-293 295.362.731 230-219 72.427.789 160-151 242.385.396 294-282 276.864.447 243-237 17.480.882 226-224 53.800 64-56 2.150 274
275 280 Polisan Boya San. ve Tic. A.Ş. Gebze - 265 295.073.810 266-257 340.869.514 --- - --- - 265-253 302.135.105 --- - 405-400 5.472 --- - 275
276 268 Zorlu Enerji Elektrik Üretim A.Ş. Bursa - 266 292.471.644 192-183 475.169.441 499-486 -217.531.831 56-48 615.455.778 15-12 3.546.752.959 495-484 -127.909.096 386-383 9.876 459-446 164 276
277 - Hasçelik San. ve Tic. A.Ş. İstanbul - 267 291.941.181 207-198 435.916.480 --- - --- - --- - --- - --- - --- - 277
278 237 Yeşim Tekstil San. ve Tic. A.Ş. Bursa - 268 291.833.284 279-270 323.821.763 --- - --- - --- - --- - 116-115 111.565 56-48 2.381 278
279 289 Keskinkılıç Gıda San. ve Tic. A.Ş. İstanbul - 269 289.389.419 299-288 299.651.834 --- - 80-72 415.370.691 195-185 440.879.261 --- - 449-444 248 336-324 413 279
280 244 İstikbal Mobilya San. ve Tic. A.Ş. Kayseri - 270 289.076.738 310-299 290.067.328 200-190 84.543.271 138-129 272.791.606 242-230 332.096.275 99-94 58.079.827 361-359 14.625 271-259 607 280
281 283 Ede Demir Çelik Pazarlama San. ve Tic. Ltd. Şti. Ege Bölgesi - 271 289.047.388 186-177 485.523.908 --- - --- - --- - --- - --- - 297-285 501 281
282 293 Kipaş Mensucat İşletmeleri A.Ş. Kahramanmaraş - 272 288.868.000 278-269 328.100.482 --- - 110-101 320.860.396 138-129 576.789.525 --- - 335-333 22.096 63-55 2.190 282
283 384 Arpaş İhracat İthalat ve Pazarlama A.Ş. İstanbul - 273 287.320.934 315-304 287.552.577 --- - --- - --- - --- - 80-79 154.876 189-178 947 283
284 251 Adana Çimento Sanayii T.A.Ş. Adana - 274 287.034.089 317-306 287.034.089 149-140 116.701.759 60-52 569.965.143 118-110 677.406.036 56-51 111.070.934 331-329 22.950 307-295 462 284
285 320 Çekok Gıda San. ve Tic. A.Ş. Kocaeli - 275 286.761.489 314-303 287.583.341 454-441 11.899.311 431-418 37.698.831 472-459 100.269.163 371-365 4.468.672 430-425 3.043 484-471 129 285
286 290 Teknik Alüminyum Sanayi A.Ş. İstanbul - 276 286.366.528 316-305 287.393.576 380-367 31.339.966 415-403 45.542.699 290-278 281.526.763 441-434 -1.122.685 155-154 90.370 384-371 310 286
287 185 Tümosan Motor ve Traktör Sanayi A.Ş. Konya - 277 286.315.685 307-296 291.970.584 312-299 47.468.589 220-210 166.095.680 281-269 286.875.373 142-137 41.147.344 419-414 4.149 348-336 379 287
288 305 Major SKT Oto Donanım San. ve Tic. A.Ş. Bursa - 278 285.546.047 319-308 285.917.821 271-260 59.434.361 447-434 29.290.350 480-467 90.552.314 234-228 19.465.549 439-434 1.429 256-244 647 288
289 472 Koç Haddecilik Tekstil İnşaat San. ve Tic. A.Ş. Dörtyol - 279 284.316.195 269-260 336.676.606 489-476 3.129.656 342-331 79.256.958 267-255 300.234.439 292-286 11.072.751 289-287 34.077 487-474 118 289
290 277 Çimentaş İzmir Çimento Fabrikası T.A.Ş. Ege Bölgesi - 280 283.878.625 305-294 293.588.597 257-246 62.100.844 98-89 368.001.224 115-107 699.247.189 217-211 22.782.742 317-315 24.996 318-306 435 290
291 281 Sarbak Metal Tic. ve San. A.Ş. İstanbul - 281 283.780.853 321-310 284.245.268 433-420 16.182.068 403-391 53.270.339 441-428 134.476.805 366-360 4.925.561 217-216 58.873 433-420 208 291
292 329 Kansai Altan Boya San. ve Tic. A.Ş. Ege Bölgesi - 282 283.188.127 318-307 286.488.127 --- - --- - 438-425 136.182.782 --- - 429-424 3.386 280-268 574 292
293 238 ABB Elektrik Sanayi A.Ş. İstanbul - 283 282.348.502 125-117 723.512.224 --- - 111-102 319.315.110 127-119 633.675.611 --- - 187-186 73.479 205-194 863 293
294 - - İstanbul - 284 - 291-281 - 320-307 - 396-384 - 367-354 - 327-321 - 180-179 - 399-386 - 294
295 299 Soma Kömür İşletmeleri A.Ş. Soma - 285 281.483.223 324-313 281.734.007 126-117 140.186.836 460-447 19.573.232 448-435 127.902.603 354-348 6.036.137 --- - 26-19 3.912 295
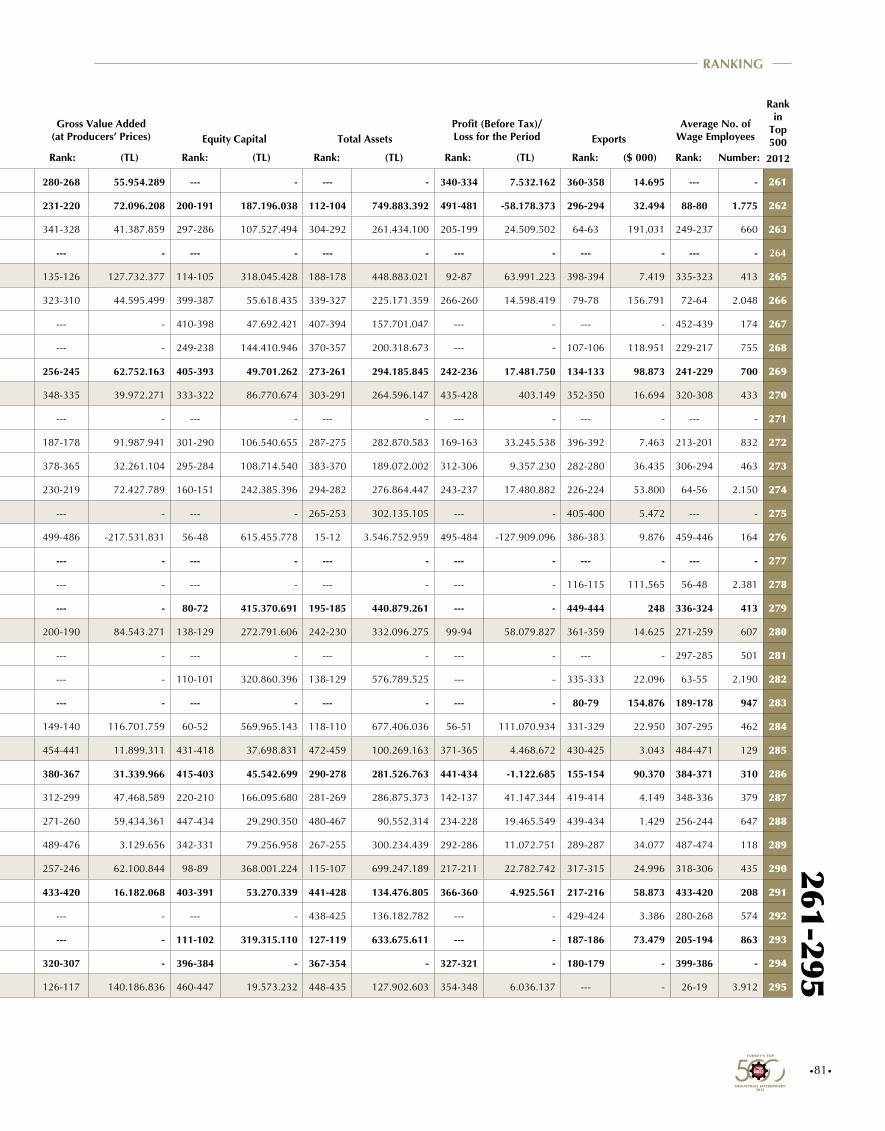
•81•
Rank: Rank: Rank: Rank:Rank:(TL) (TL) Rank: (TL) (TL) Number:($ 000)Firm2012 2011 Rank: (TL)
Gross Value Added (at Producers’ Prices) Equity Capital Total Assets Exports
Profit (Before Tax)/Loss for the Period
Average No. of Wage Employees
Rank in
Top 500
Affiliated Chamber/
Public
Rank in
Public Sector
Rank in
Private Sector
Production-based Sales
(Net) (TL)
Sales Revenues (Net)
Rank in
Top 5002012
261-295RANKING
261 253 Tamek Gıda ve Konsantre San. ve Tic. A.Ş. İstanbul - 252 312.451.249 283-274 322.212.636 280-268 55.954.289 --- - --- - 340-334 7.532.162 360-358 14.695 --- - 261
262 222 Altınyıldız Mensucat ve Konfeksiyon Fabrikaları A.Ş. İstanbul - 253 311.622.265 287-278 312.176.897 231-220 72.096.208 200-191 187.196.038 112-104 749.883.392 491-481 -58.178.373 296-294 32.494 88-80 1.775 262
263 270 Mitaş Enerji ve Madeni İnşaat İşleri T.A.Ş. Ankara - 254 310.866.956 223-214 409.925.662 341-328 41.387.859 297-286 107.527.494 304-292 261.434.100 205-199 24.509.502 64-63 191.031 249-237 660 263
264 489 İstanbul Asfalt Fabrikaları San. ve Tic. A.Ş. Public 10 - 310.454.639 290-10 310.454.639 --- - --- - --- - --- - --- - --- - 264
265 - Trakya Yenişehir Cam Sanayii A.Ş. Yenişehir/Bursa - 255 309.669.631 289-280 310.463.007 135-126 127.732.377 114-105 318.045.428 188-178 448.883.021 92-87 63.991.223 398-394 7.419 335-323 413 265
266 300 Aunde Teknik Tekstil San. ve Tic. A.Ş. Bursa - 256 309.481.660 288-279 310.735.916 323-310 44.595.499 399-387 55.618.435 339-327 225.171.359 266-260 14.598.419 79-78 156.791 72-64 2.048 266
267 252 Oyak Beton San. ve Tic. A.Ş. Ankara - 257 306.183.967 295-285 306.183.967 --- - 410-398 47.692.421 407-394 157.701.047 --- - --- - 452-439 174 267
268 254 Hayes Lemmerz İnci Jant Sanayi A.Ş. Manisa - 258 302.840.916 294-284 307.260.489 --- - 249-238 144.410.946 370-357 200.318.673 --- - 107-106 118.951 229-217 755 268
269 331 Kalde Klima Orta Basınç Fittings ve Valf Sanayi A.Ş. İstanbul - 259 302.517.612 268-259 336.920.941 256-245 62.752.163 405-393 49.701.262 273-261 294.185.845 242-236 17.481.750 134-133 98.873 241-229 700 269
270 269 Dimes Gıda San. ve Tic. A.Ş. Tokat - 260 301.196.841 293-283 307.536.606 348-335 39.972.271 333-322 86.770.674 303-291 264.596.147 435-428 403.149 352-350 16.694 320-308 433 270
271 360 Gedik Tavukçuluk ve Tarım Ürünleri Tic. San. A.Ş. Uşak - 261 301.087.897 263-254 343.950.751 --- - --- - --- - --- - --- - --- - 271
272 286 Dentaş Ambalaj ve Kağıt Sanayi A.Ş. Denizli - 262 298.179.084 300-289 299.308.440 187-178 91.987.941 301-290 106.540.655 287-275 282.870.583 169-163 33.245.538 396-392 7.463 213-201 832 272
273 274 Boyçelik Metal San. ve Tic. A.Ş. Kayseri - 263 297.530.852 281-272 323.040.813 378-365 32.261.104 295-284 108.714.540 383-370 189.072.002 312-306 9.357.230 282-280 36.435 306-294 463 273
274 284 Matesa Tekstil San. ve Tic. A.Ş. Kahramanmaraş - 264 295.362.731 304-293 295.362.731 230-219 72.427.789 160-151 242.385.396 294-282 276.864.447 243-237 17.480.882 226-224 53.800 64-56 2.150 274
275 280 Polisan Boya San. ve Tic. A.Ş. Gebze - 265 295.073.810 266-257 340.869.514 --- - --- - 265-253 302.135.105 --- - 405-400 5.472 --- - 275
276 268 Zorlu Enerji Elektrik Üretim A.Ş. Bursa - 266 292.471.644 192-183 475.169.441 499-486 -217.531.831 56-48 615.455.778 15-12 3.546.752.959 495-484 -127.909.096 386-383 9.876 459-446 164 276
277 - Hasçelik San. ve Tic. A.Ş. İstanbul - 267 291.941.181 207-198 435.916.480 --- - --- - --- - --- - --- - --- - 277
278 237 Yeşim Tekstil San. ve Tic. A.Ş. Bursa - 268 291.833.284 279-270 323.821.763 --- - --- - --- - --- - 116-115 111.565 56-48 2.381 278
279 289 Keskinkılıç Gıda San. ve Tic. A.Ş. İstanbul - 269 289.389.419 299-288 299.651.834 --- - 80-72 415.370.691 195-185 440.879.261 --- - 449-444 248 336-324 413 279
280 244 İstikbal Mobilya San. ve Tic. A.Ş. Kayseri - 270 289.076.738 310-299 290.067.328 200-190 84.543.271 138-129 272.791.606 242-230 332.096.275 99-94 58.079.827 361-359 14.625 271-259 607 280
281 283 Ede Demir Çelik Pazarlama San. ve Tic. Ltd. Şti. Ege Bölgesi - 271 289.047.388 186-177 485.523.908 --- - --- - --- - --- - --- - 297-285 501 281
282 293 Kipaş Mensucat İşletmeleri A.Ş. Kahramanmaraş - 272 288.868.000 278-269 328.100.482 --- - 110-101 320.860.396 138-129 576.789.525 --- - 335-333 22.096 63-55 2.190 282
283 384 Arpaş İhracat İthalat ve Pazarlama A.Ş. İstanbul - 273 287.320.934 315-304 287.552.577 --- - --- - --- - --- - 80-79 154.876 189-178 947 283
284 251 Adana Çimento Sanayii T.A.Ş. Adana - 274 287.034.089 317-306 287.034.089 149-140 116.701.759 60-52 569.965.143 118-110 677.406.036 56-51 111.070.934 331-329 22.950 307-295 462 284
285 320 Çekok Gıda San. ve Tic. A.Ş. Kocaeli - 275 286.761.489 314-303 287.583.341 454-441 11.899.311 431-418 37.698.831 472-459 100.269.163 371-365 4.468.672 430-425 3.043 484-471 129 285
286 290 Teknik Alüminyum Sanayi A.Ş. İstanbul - 276 286.366.528 316-305 287.393.576 380-367 31.339.966 415-403 45.542.699 290-278 281.526.763 441-434 -1.122.685 155-154 90.370 384-371 310 286
287 185 Tümosan Motor ve Traktör Sanayi A.Ş. Konya - 277 286.315.685 307-296 291.970.584 312-299 47.468.589 220-210 166.095.680 281-269 286.875.373 142-137 41.147.344 419-414 4.149 348-336 379 287
288 305 Major SKT Oto Donanım San. ve Tic. A.Ş. Bursa - 278 285.546.047 319-308 285.917.821 271-260 59.434.361 447-434 29.290.350 480-467 90.552.314 234-228 19.465.549 439-434 1.429 256-244 647 288
289 472 Koç Haddecilik Tekstil İnşaat San. ve Tic. A.Ş. Dörtyol - 279 284.316.195 269-260 336.676.606 489-476 3.129.656 342-331 79.256.958 267-255 300.234.439 292-286 11.072.751 289-287 34.077 487-474 118 289
290 277 Çimentaş İzmir Çimento Fabrikası T.A.Ş. Ege Bölgesi - 280 283.878.625 305-294 293.588.597 257-246 62.100.844 98-89 368.001.224 115-107 699.247.189 217-211 22.782.742 317-315 24.996 318-306 435 290
291 281 Sarbak Metal Tic. ve San. A.Ş. İstanbul - 281 283.780.853 321-310 284.245.268 433-420 16.182.068 403-391 53.270.339 441-428 134.476.805 366-360 4.925.561 217-216 58.873 433-420 208 291
292 329 Kansai Altan Boya San. ve Tic. A.Ş. Ege Bölgesi - 282 283.188.127 318-307 286.488.127 --- - --- - 438-425 136.182.782 --- - 429-424 3.386 280-268 574 292
293 238 ABB Elektrik Sanayi A.Ş. İstanbul - 283 282.348.502 125-117 723.512.224 --- - 111-102 319.315.110 127-119 633.675.611 --- - 187-186 73.479 205-194 863 293
294 - - İstanbul - 284 - 291-281 - 320-307 - 396-384 - 367-354 - 327-321 - 180-179 - 399-386 - 294
295 299 Soma Kömür İşletmeleri A.Ş. Soma - 285 281.483.223 324-313 281.734.007 126-117 140.186.836 460-447 19.573.232 448-435 127.902.603 354-348 6.036.137 --- - 26-19 3.912 295
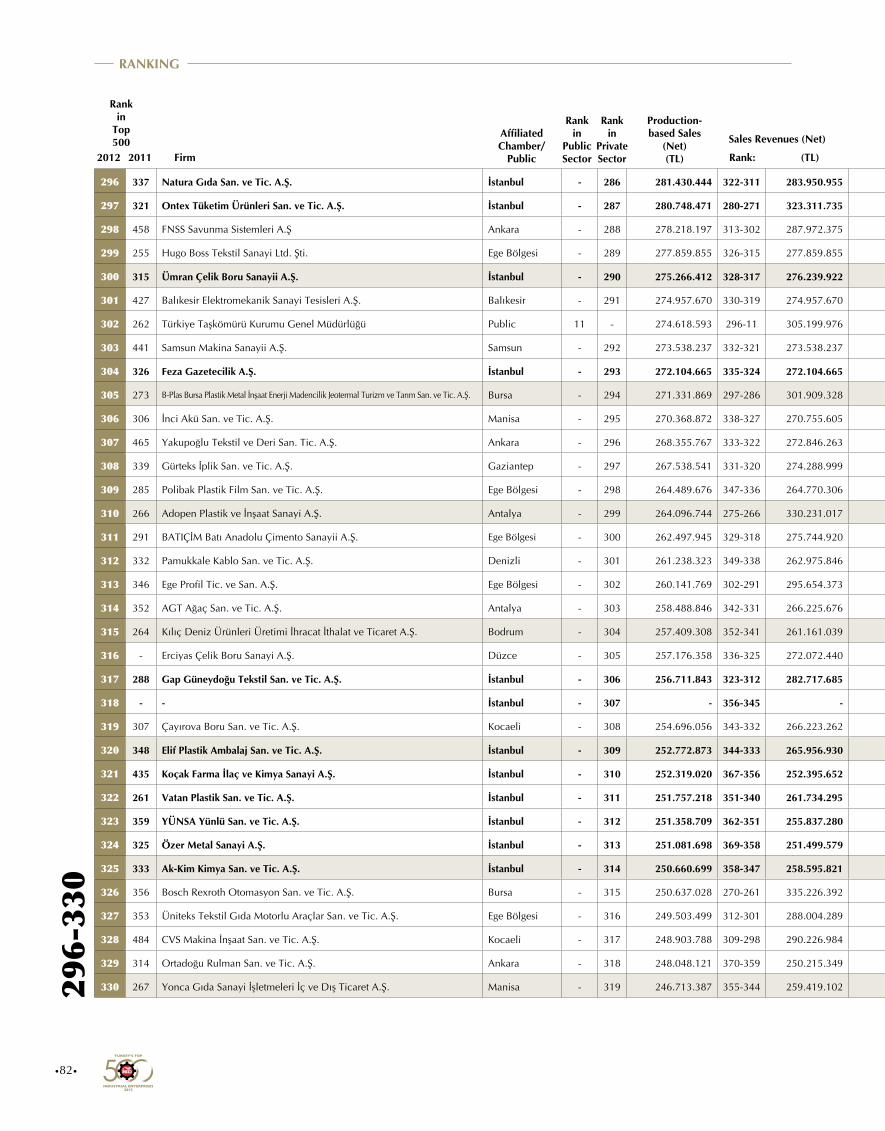
•82•
Rank: Rank: Rank: Rank:Rank:(TL) (TL) Rank: (TL) (TL) Number:($ 000)Firm2012 2011 Rank: (TL)
Gross Value Added (at Producers’ Prices) Equity Capital Total Assets Exports
Profit (Before Tax)/Loss for the Period
Average No. of Wage Employees
Rank in
Top 500
Affiliated Chamber/
Public
Rank in
Public Sector
Rank in
Private Sector
Production-based Sales
(Net) (TL)
Sales Revenues (Net)
Rank in
Top 5002012
296-
330
RANKING
296 337 Natura Gıda San. ve Tic. A.Ş. İstanbul - 286 281.430.444 322-311 283.950.955 255-244 63.607.860 423-410 40.741.437 260-248 310.422.589 473-465 -13.170.889 378-375 11.300 300-288 496 296
297 321 Ontex Tüketim Ürünleri San. ve Tic. A.Ş. İstanbul - 287 280.748.471 280-271 323.311.735 --- - --- - --- - --- - 203-202 64.779 --- - 297
298 458 FNSS Savunma Sistemleri A.Ş Ankara - 288 278.218.197 313-302 287.972.375 --- - --- - --- - --- - --- - --- - 298
299 255 Hugo Boss Tekstil Sanayi Ltd. Şti. Ege Bölgesi - 289 277.859.855 326-315 277.859.855 156-147 110.844.897 350-339 76.710.020 455-442 121.125.626 432-425 517.272 81-80 154.367 32-24 3.428 299
300 315 Ümran Çelik Boru Sanayii A.Ş. İstanbul - 290 275.266.412 328-317 276.239.922 363-350 37.616.513 133-124 285.446.153 227-216 355.786.246 313-307 9.291.149 164-163 86.644 304-292 476 300
301 427 Balıkesir Elektromekanik Sanayi Tesisleri A.Ş. Balıkesir - 291 274.957.670 330-319 274.957.670 248-237 64.871.789 311-300 97.963.360 221-210 373.649.605 426-419 893.337 237-235 49.600 221-209 800 301
302 262 Türkiye Taşkömürü Kurumu Genel Müdürlüğü Public 11 - 274.618.593 296-11 305.199.976 102-9 166.923.485 90-9 387.020.020 156-10 538.913.492 500-13 -529.356.141 --- - 3-2 11.948 302
303 441 Samsun Makina Sanayii A.Ş. Samsun - 292 273.538.237 332-321 273.538.237 --- - 170-161 228.669.213 306-294 257.310.777 --- - 303-301 28.944 276-264 591 303
304 326 Feza Gazetecilik A.Ş. İstanbul - 293 272.104.665 335-324 272.104.665 --- - --- - --- - --- - --- - --- - 304
305 273 B-Plas Bursa Plastik Metal İnşaat Enerji Madencilik Jeotermal Turizm ve Tarım San. ve Tic. A.Ş. Bursa - 294 271.331.869 297-286 301.909.328 --- - 146-137 259.204.742 --- - --- - 392-388 8.370 134-125 1.288 305
306 306 İnci Akü San. ve Tic. A.Ş. Manisa - 295 270.368.872 338-327 270.755.605 334-321 42.430.028 371-359 68.590.333 409-396 154.737.030 303-297 10.144.560 166-165 85.818 291-279 522 306
307 465 Yakupoğlu Tekstil ve Deri San. Tic. A.Ş. Ankara - 296 268.355.767 333-322 272.846.263 385-372 29.569.786 222-212 163.336.772 276-264 291.924.726 260-254 15.336.315 342-340 20.779 197-186 900 307
308 339 Gürteks İplik San. ve Tic. A.Ş. Gaziantep - 297 267.538.541 331-320 274.288.999 244-233 65.981.284 221-211 163.605.160 202-192 414.000.208 287-281 12.018.937 458-453 14 102-94 1.626 308
309 285 Polibak Plastik Film San. ve Tic. A.Ş. Ege Bölgesi - 298 264.489.676 347-336 264.770.306 --- - --- - --- - --- - 251-249 45.717 --- - 309
310 266 Adopen Plastik ve İnşaat Sanayi A.Ş. Antalya - 299 264.096.744 275-266 330.231.017 261-250 61.429.200 227-216 161.069.407 164-154 510.669.579 212-206 24.084.195 177-176 78.739 202-191 870 310
311 291 BATIÇİM Batı Anadolu Çimento Sanayii A.Ş. Ege Bölgesi - 300 262.497.945 329-318 275.744.920 293-280 53.149.074 91-82 384.407.933 172-162 479.004.537 218-212 22.684.527 341-339 20.856 366-353 334 311
312 332 Pamukkale Kablo San. ve Tic. A.Ş. Denizli - 301 261.238.323 349-338 262.975.846 457-444 11.590.226 438-425 33.956.271 467-454 112.049.279 341-335 7.361.644 147-146 95.207 455-442 170 312
313 346 Ege Profil Tic. ve San. A.Ş. Ege Bölgesi - 302 260.141.769 302-291 295.654.373 214-204 79.297.898 282-271 119.958.274 282-270 286.800.894 223-217 21.750.089 344-342 19.597 387-374 308 313
314 352 AGT Ağaç San. ve Tic. A.Ş. Antalya - 303 258.488.846 342-331 266.225.676 204-194 83.401.709 232-221 157.542.907 323-311 247.750.142 126-121 46.518.420 186-185 73.895 240-228 701 314
315 264 Kılıç Deniz Ürünleri Üretimi İhracat İthalat ve Ticaret A.Ş. Bodrum - 304 257.409.308 352-341 261.161.039 227-217 73.010.672 275-264 124.477.055 218-207 381.097.648 180-174 30.980.744 --- - 211-199 839 315
316 - Erciyas Çelik Boru Sanayi A.Ş. Düzce - 305 257.176.358 336-325 272.072.440 444-431 14.629.093 283-272 117.319.495 277-265 291.845.852 380-374 3.601.316 109-108 117.077 392-379 303 316
317 288 Gap Güneydoğu Tekstil San. ve Tic. A.Ş. İstanbul - 306 256.711.843 323-312 282.717.685 279-267 56.163.373 189-180 206.081.010 194-184 441.223.247 211-205 24.113.134 151-150 91.784 108-100 1.505 317
318 - - İstanbul - 307 - 356-345 - 350-337 - 434-421 - 468-455 - 323-317 - 367-364 - 237-225 - 318
319 307 Çayırova Boru San. ve Tic. A.Ş. Kocaeli - 308 254.696.056 343-332 266.223.262 351-338 39.579.208 258-247 137.314.574 331-319 237.454.016 334-328 7.965.400 241-239 48.178 353-340 361 319
320 348 Elif Plastik Ambalaj San. ve Tic. A.Ş. İstanbul - 309 252.772.873 344-333 265.956.930 --- - --- - --- - --- - --- - --- - 320
321 435 Koçak Farma İlaç ve Kimya Sanayi A.Ş. İstanbul - 310 252.319.020 367-356 252.395.652 --- - 244-233 147.112.508 364-351 203.491.470 --- - --- - --- - 321
322 261 Vatan Plastik San. ve Tic. A.Ş. İstanbul - 311 251.757.218 351-340 261.734.295 --- - 402-390 53.988.602 325-313 246.183.638 --- - 244-242 46.940 364-351 340 322
323 359 YÜNSA Yünlü San. ve Tic. A.Ş. İstanbul - 312 251.358.709 362-351 255.837.280 215-205 78.635.135 353-341 75.337.628 355-343 212.748.534 336-330 7.627.797 174-173 80.872 84-76 1.859 323
324 325 Özer Metal Sanayi A.Ş. İstanbul - 313 251.081.698 369-358 251.499.579 275-263 58.334.841 242-231 149.043.306 399-386 172.513.652 255-249 16.200.372 227-225 53.471 485-472 125 324
325 333 Ak-Kim Kimya San. ve Tic. A.Ş. İstanbul - 314 250.660.699 358-347 258.595.821 246-235 65.646.329 279-268 121.874.196 357-345 210.943.403 233-227 19.470.464 295-293 32.565 312-300 449 325
326 356 Bosch Rexroth Otomasyon San. ve Tic. A.Ş. Bursa - 315 250.637.028 270-261 335.226.392 --- - --- - --- - --- - 88-87 138.829 174-163 1.033 326
327 353 Üniteks Tekstil Gıda Motorlu Araçlar San. ve Tic. A.Ş. Ege Bölgesi - 316 249.503.499 312-301 288.004.289 --- - 389-377 59.707.034 456-443 120.342.733 --- - 97-96 128.044 363-350 341 327
328 484 CVS Makina İnşaat San. ve Tic. A.Ş. Kocaeli - 317 248.903.788 309-298 290.226.984 305-292 49.595.219 443-430 32.616.626 311-299 255.230.316 347-341 6.709.256 83-82 151.407 266-254 620 328
329 314 Ortadoğu Rulman San. ve Tic. A.Ş. Ankara - 318 248.048.121 370-359 250.215.349 131-122 133.952.742 147-138 258.782.017 176-166 466.560.846 124-119 46.677.860 169-168 83.575 79-71 1.922 329
330 267 Yonca Gıda Sanayi İşletmeleri İç ve Dış Ticaret A.Ş. Manisa - 319 246.713.387 355-344 259.419.102 --- - --- - 414-401 153.175.416 --- - 260-258 42.912 212-200 839 330

•83•
Rank: Rank: Rank: Rank:Rank:(TL) (TL) Rank: (TL) (TL) Number:($ 000)Firm2012 2011 Rank: (TL)
Gross Value Added (at Producers’ Prices) Equity Capital Total Assets Exports
Profit (Before Tax)/Loss for the Period
Average No. of Wage Employees
Rank in
Top 500
Affiliated Chamber/
Public
Rank in
Public Sector
Rank in
Private Sector
Production-based Sales
(Net) (TL)
Sales Revenues (Net)
Rank in
Top 5002012
296-330RANKING
296 337 Natura Gıda San. ve Tic. A.Ş. İstanbul - 286 281.430.444 322-311 283.950.955 255-244 63.607.860 423-410 40.741.437 260-248 310.422.589 473-465 -13.170.889 378-375 11.300 300-288 496 296
297 321 Ontex Tüketim Ürünleri San. ve Tic. A.Ş. İstanbul - 287 280.748.471 280-271 323.311.735 --- - --- - --- - --- - 203-202 64.779 --- - 297
298 458 FNSS Savunma Sistemleri A.Ş Ankara - 288 278.218.197 313-302 287.972.375 --- - --- - --- - --- - --- - --- - 298
299 255 Hugo Boss Tekstil Sanayi Ltd. Şti. Ege Bölgesi - 289 277.859.855 326-315 277.859.855 156-147 110.844.897 350-339 76.710.020 455-442 121.125.626 432-425 517.272 81-80 154.367 32-24 3.428 299
300 315 Ümran Çelik Boru Sanayii A.Ş. İstanbul - 290 275.266.412 328-317 276.239.922 363-350 37.616.513 133-124 285.446.153 227-216 355.786.246 313-307 9.291.149 164-163 86.644 304-292 476 300
301 427 Balıkesir Elektromekanik Sanayi Tesisleri A.Ş. Balıkesir - 291 274.957.670 330-319 274.957.670 248-237 64.871.789 311-300 97.963.360 221-210 373.649.605 426-419 893.337 237-235 49.600 221-209 800 301
302 262 Türkiye Taşkömürü Kurumu Genel Müdürlüğü Public 11 - 274.618.593 296-11 305.199.976 102-9 166.923.485 90-9 387.020.020 156-10 538.913.492 500-13 -529.356.141 --- - 3-2 11.948 302
303 441 Samsun Makina Sanayii A.Ş. Samsun - 292 273.538.237 332-321 273.538.237 --- - 170-161 228.669.213 306-294 257.310.777 --- - 303-301 28.944 276-264 591 303
304 326 Feza Gazetecilik A.Ş. İstanbul - 293 272.104.665 335-324 272.104.665 --- - --- - --- - --- - --- - --- - 304
305 273 B-Plas Bursa Plastik Metal İnşaat Enerji Madencilik Jeotermal Turizm ve Tarım San. ve Tic. A.Ş. Bursa - 294 271.331.869 297-286 301.909.328 --- - 146-137 259.204.742 --- - --- - 392-388 8.370 134-125 1.288 305
306 306 İnci Akü San. ve Tic. A.Ş. Manisa - 295 270.368.872 338-327 270.755.605 334-321 42.430.028 371-359 68.590.333 409-396 154.737.030 303-297 10.144.560 166-165 85.818 291-279 522 306
307 465 Yakupoğlu Tekstil ve Deri San. Tic. A.Ş. Ankara - 296 268.355.767 333-322 272.846.263 385-372 29.569.786 222-212 163.336.772 276-264 291.924.726 260-254 15.336.315 342-340 20.779 197-186 900 307
308 339 Gürteks İplik San. ve Tic. A.Ş. Gaziantep - 297 267.538.541 331-320 274.288.999 244-233 65.981.284 221-211 163.605.160 202-192 414.000.208 287-281 12.018.937 458-453 14 102-94 1.626 308
309 285 Polibak Plastik Film San. ve Tic. A.Ş. Ege Bölgesi - 298 264.489.676 347-336 264.770.306 --- - --- - --- - --- - 251-249 45.717 --- - 309
310 266 Adopen Plastik ve İnşaat Sanayi A.Ş. Antalya - 299 264.096.744 275-266 330.231.017 261-250 61.429.200 227-216 161.069.407 164-154 510.669.579 212-206 24.084.195 177-176 78.739 202-191 870 310
311 291 BATIÇİM Batı Anadolu Çimento Sanayii A.Ş. Ege Bölgesi - 300 262.497.945 329-318 275.744.920 293-280 53.149.074 91-82 384.407.933 172-162 479.004.537 218-212 22.684.527 341-339 20.856 366-353 334 311
312 332 Pamukkale Kablo San. ve Tic. A.Ş. Denizli - 301 261.238.323 349-338 262.975.846 457-444 11.590.226 438-425 33.956.271 467-454 112.049.279 341-335 7.361.644 147-146 95.207 455-442 170 312
313 346 Ege Profil Tic. ve San. A.Ş. Ege Bölgesi - 302 260.141.769 302-291 295.654.373 214-204 79.297.898 282-271 119.958.274 282-270 286.800.894 223-217 21.750.089 344-342 19.597 387-374 308 313
314 352 AGT Ağaç San. ve Tic. A.Ş. Antalya - 303 258.488.846 342-331 266.225.676 204-194 83.401.709 232-221 157.542.907 323-311 247.750.142 126-121 46.518.420 186-185 73.895 240-228 701 314
315 264 Kılıç Deniz Ürünleri Üretimi İhracat İthalat ve Ticaret A.Ş. Bodrum - 304 257.409.308 352-341 261.161.039 227-217 73.010.672 275-264 124.477.055 218-207 381.097.648 180-174 30.980.744 --- - 211-199 839 315
316 - Erciyas Çelik Boru Sanayi A.Ş. Düzce - 305 257.176.358 336-325 272.072.440 444-431 14.629.093 283-272 117.319.495 277-265 291.845.852 380-374 3.601.316 109-108 117.077 392-379 303 316
317 288 Gap Güneydoğu Tekstil San. ve Tic. A.Ş. İstanbul - 306 256.711.843 323-312 282.717.685 279-267 56.163.373 189-180 206.081.010 194-184 441.223.247 211-205 24.113.134 151-150 91.784 108-100 1.505 317
318 - - İstanbul - 307 - 356-345 - 350-337 - 434-421 - 468-455 - 323-317 - 367-364 - 237-225 - 318
319 307 Çayırova Boru San. ve Tic. A.Ş. Kocaeli - 308 254.696.056 343-332 266.223.262 351-338 39.579.208 258-247 137.314.574 331-319 237.454.016 334-328 7.965.400 241-239 48.178 353-340 361 319
320 348 Elif Plastik Ambalaj San. ve Tic. A.Ş. İstanbul - 309 252.772.873 344-333 265.956.930 --- - --- - --- - --- - --- - --- - 320
321 435 Koçak Farma İlaç ve Kimya Sanayi A.Ş. İstanbul - 310 252.319.020 367-356 252.395.652 --- - 244-233 147.112.508 364-351 203.491.470 --- - --- - --- - 321
322 261 Vatan Plastik San. ve Tic. A.Ş. İstanbul - 311 251.757.218 351-340 261.734.295 --- - 402-390 53.988.602 325-313 246.183.638 --- - 244-242 46.940 364-351 340 322
323 359 YÜNSA Yünlü San. ve Tic. A.Ş. İstanbul - 312 251.358.709 362-351 255.837.280 215-205 78.635.135 353-341 75.337.628 355-343 212.748.534 336-330 7.627.797 174-173 80.872 84-76 1.859 323
324 325 Özer Metal Sanayi A.Ş. İstanbul - 313 251.081.698 369-358 251.499.579 275-263 58.334.841 242-231 149.043.306 399-386 172.513.652 255-249 16.200.372 227-225 53.471 485-472 125 324
325 333 Ak-Kim Kimya San. ve Tic. A.Ş. İstanbul - 314 250.660.699 358-347 258.595.821 246-235 65.646.329 279-268 121.874.196 357-345 210.943.403 233-227 19.470.464 295-293 32.565 312-300 449 325
326 356 Bosch Rexroth Otomasyon San. ve Tic. A.Ş. Bursa - 315 250.637.028 270-261 335.226.392 --- - --- - --- - --- - 88-87 138.829 174-163 1.033 326
327 353 Üniteks Tekstil Gıda Motorlu Araçlar San. ve Tic. A.Ş. Ege Bölgesi - 316 249.503.499 312-301 288.004.289 --- - 389-377 59.707.034 456-443 120.342.733 --- - 97-96 128.044 363-350 341 327
328 484 CVS Makina İnşaat San. ve Tic. A.Ş. Kocaeli - 317 248.903.788 309-298 290.226.984 305-292 49.595.219 443-430 32.616.626 311-299 255.230.316 347-341 6.709.256 83-82 151.407 266-254 620 328
329 314 Ortadoğu Rulman San. ve Tic. A.Ş. Ankara - 318 248.048.121 370-359 250.215.349 131-122 133.952.742 147-138 258.782.017 176-166 466.560.846 124-119 46.677.860 169-168 83.575 79-71 1.922 329
330 267 Yonca Gıda Sanayi İşletmeleri İç ve Dış Ticaret A.Ş. Manisa - 319 246.713.387 355-344 259.419.102 --- - --- - 414-401 153.175.416 --- - 260-258 42.912 212-200 839 330
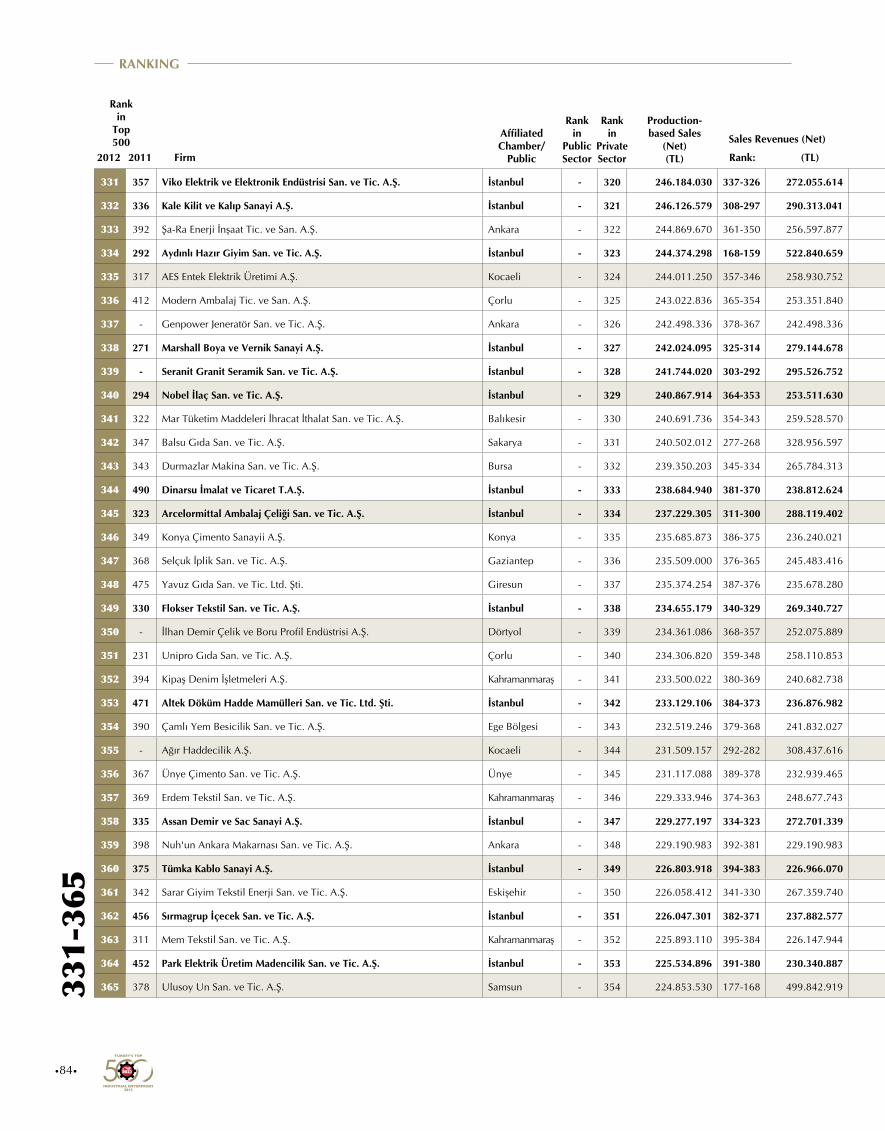
•84•
Rank: Rank: Rank: Rank:Rank:(TL) (TL) Rank: (TL) (TL) Number:($ 000)Firm2012 2011 Rank: (TL)
Gross Value Added (at Producers’ Prices) Equity Capital Total Assets Exports
Profit (Before Tax)/Loss for the Period
Average No. of Wage Employees
Rank in
Top 500
Affiliated Chamber/
Public
Rank in
Public Sector
Rank in
Private Sector
Production-based Sales
(Net) (TL)
Sales Revenues (Net)
Rank in
Top 5002012
331-
365
RANKING
331 357 Viko Elektrik ve Elektronik Endüstrisi San. ve Tic. A.Ş. İstanbul - 320 246.184.030 337-326 272.055.614 166-157 104.332.327 284-273 117.183.090 322-310 248.911.301 125-120 46.609.574 207-206 62.648 243-231 697 331
332 336 Kale Kilit ve Kalıp Sanayi A.Ş. İstanbul - 321 246.126.579 308-297 290.313.041 294-281 53.040.788 265-254 133.214.455 254-242 316.164.807 433-426 512.077 212-211 60.911 125-116 1.328 332
333 392 Şa-Ra Enerji İnşaat Tic. ve San. A.Ş. Ankara - 322 244.869.670 361-350 256.597.877 --- - --- - --- - --- - 357-355 15.309 --- - 333
334 292 Aydınlı Hazır Giyim San. ve Tic. A.Ş. İstanbul - 323 244.374.298 168-159 522.840.659 100-92 168.386.869 206-197 180.035.299 135-126 587.102.105 93-88 62.268.923 238-236 49.306 39-31 3.109 334
335 317 AES Entek Elektrik Üretimi A.Ş. Kocaeli - 324 244.011.250 357-346 258.930.752 479-466 7.391.436 84-76 409.375.013 133-124 596.910.310 485-475 -37.438.495 --- - 489-476 101 335
336 412 Modern Ambalaj Tic. ve San. A.Ş. Çorlu - 325 243.022.836 365-354 253.351.840 --- - --- - --- - --- - --- - --- - 336
337 - Genpower Jeneratör San. ve Tic. A.Ş. Ankara - 326 242.498.336 378-367 242.498.336 339-326 41.870.998 296-285 108.328.511 240-228 333.635.310 399-392 2.127.135 168-167 84.219 460-447 164 337
338 271 Marshall Boya ve Vernik Sanayi A.Ş. İstanbul - 327 242.024.095 325-314 279.144.678 307-294 49.369.499 309-298 98.590.367 395-382 176.134.071 459-451 -5.469.456 388-384 8.844 371-358 330 338
339 - Seranit Granit Seramik San. ve Tic. A.Ş. İstanbul - 328 241.744.020 303-292 295.526.752 247-236 65.629.818 364-352 70.189.301 146-137 559.333.576 240-234 17.930.193 302-300 29.231 172-161 1.037 339
340 294 Nobel İlaç San. ve Tic. A.Ş. İstanbul - 329 240.867.914 364-353 253.511.630 --- - --- - 315-303 253.580.965 --- - 252-250 45.565 327-315 425 340
341 322 Mar Tüketim Maddeleri İhracat İthalat San. ve Tic. A.Ş. Balıkesir - 330 240.691.736 354-343 259.528.570 --- - --- - --- - --- - 434-429 2.237 --- - 341
342 347 Balsu Gıda San. ve Tic. A.Ş. Sakarya - 331 240.502.012 277-268 328.956.597 --- - --- - --- - --- - 89-88 134.823 419-406 237 342
343 343 Durmazlar Makina San. ve Tic. A.Ş. Bursa - 332 239.350.203 345-334 265.784.313 212-202 79.760.821 181-172 215.631.925 205-195 410.194.288 293-287 11.008.368 130-129 102.204 188-177 950 343
344 490 Dinarsu İmalat ve Ticaret T.A.Ş. İstanbul - 333 238.684.940 381-370 238.812.624 286-274 54.506.985 384-372 60.630.649 300-288 268.146.274 368-362 4.852.108 224-222 54.639 162-151 1.077 344
345 323 Arcelormittal Ambalaj Çeliği San. ve Tic. A.Ş. İstanbul - 334 237.229.305 311-300 288.119.402 493-480 206.763 439-426 33.713.518 283-271 286.119.997 464-456 -7.398.076 310-308 27.296 465-452 160 345
346 349 Konya Çimento Sanayii A.Ş. Konya - 335 235.685.873 386-375 236.240.021 223-213 74.619.724 117-108 309.706.203 225-214 363.293.728 114-109 49.257.064 442-437 1.157 446-433 180 346
347 368 Selçuk İplik San. ve Tic. A.Ş. Gaziantep - 336 235.509.000 376-365 245.483.416 --- - 255-244 139.345.588 257-245 314.701.844 --- - 323-321 24.125 137-128 1.250 347
348 475 Yavuz Gıda San. ve Tic. Ltd. Şti. Giresun - 337 235.374.254 387-376 235.678.280 487-474 4.674.827 463-450 18.213.061 499-486 37.752.802 401-394 2.053.772 135-134 98.752 467-454 158 348
349 330 Flokser Tekstil San. ve Tic. A.Ş. İstanbul - 338 234.655.179 340-329 269.340.727 356-343 38.879.513 277-266 123.136.127 301-289 267.293.393 409-402 1.857.885 239-237 49.281 168-157 1.050 349
350 - İlhan Demir Çelik ve Boru Profil Endüstrisi A.Ş. Dörtyol - 339 234.361.086 368-357 252.075.889 --- - 487-474 5.927.968 488-475 80.078.930 --- - 334-332 22.318 468-455 158 350
351 231 Unipro Gıda San. ve Tic. A.Ş. Çorlu - 340 234.306.820 359-348 258.110.853 --- - --- - --- - --- - 412-407 4.842 --- - 351
352 394 Kipaş Denim İşletmeleri A.Ş. Kahramanmaraş - 341 233.500.022 380-369 240.682.738 --- - 218-208 168.225.596 321-309 249.529.773 --- - 413-408 4.716 113-104 1.458 352
353 471 Altek Döküm Hadde Mamülleri San. ve Tic. Ltd. Şti. İstanbul - 342 233.129.106 384-373 236.876.982 410-397 23.498.253 317-306 95.713.471 432-419 145.187.319 262-256 15.063.788 194-193 67.241 441-428 190 353
354 390 Çamlı Yem Besicilik San. ve Tic. A.Ş. Ege Bölgesi - 343 232.519.246 379-368 241.832.027 471-458 8.993.152 392-380 57.946.676 377-364 196.012.807 456-448 -5.085.780 375-372 11.921 322-310 432 354
355 - Ağır Haddecilik A.Ş. Kocaeli - 344 231.509.157 292-282 308.437.616 --- - --- - 439-426 135.621.397 --- - 214-213 59.950 478-465 140 355
356 367 Ünye Çimento San. ve Tic. A.Ş. Ünye - 345 231.117.088 389-378 232.939.465 142-133 123.106.609 149-140 256.242.270 274-262 293.396.774 76-71 81.778.356 370-367 12.828 428-415 224 356
357 369 Erdem Tekstil San. ve Tic. A.Ş. Kahramanmaraş - 346 229.333.946 374-363 248.677.743 --- - --- - --- - --- - --- - --- - 357
358 335 Assan Demir ve Sac Sanayi A.Ş. İstanbul - 347 229.277.197 334-323 272.701.339 464-451 10.248.439 357-345 73.999.731 342-330 222.069.293 443-436 -1.619.732 348-346 18.133 463-450 161 358
359 398 Nuh'un Ankara Makarnası San. ve Tic. A.Ş. Ankara - 348 229.190.983 392-381 229.190.983 299-286 51.546.513 326-315 92.374.694 415-402 151.893.265 208-202 24.212.128 324-322 23.961 310-298 450 359
360 375 Tümka Kablo Sanayi A.Ş. İstanbul - 349 226.803.918 394-383 226.966.070 392-379 27.031.823 451-438 25.441.147 449-436 126.677.240 410-403 1.794.544 150-149 92.261 443-430 185 360
361 342 Sarar Giyim Tekstil Enerji San. ve Tic. A.Ş. Eskişehir - 350 226.058.412 341-330 267.359.740 185-176 93.635.203 112-103 319.102.615 196-186 438.289.214 110-105 50.495.207 305-303 28.444 65-57 2.142 361
362 456 Sırmagrup İçecek San. ve Tic. A.Ş. İstanbul - 351 226.047.301 382-371 237.882.577 --- - --- - --- - --- - --- - --- - 362
363 311 Mem Tekstil San. ve Tic. A.Ş. Kahramanmaraş - 352 225.893.110 395-384 226.147.944 347-334 40.115.991 237-226 153.990.600 280-268 287.585.332 302-296 10.162.733 355-353 16.023 133-124 1.292 363
364 452 Park Elektrik Üretim Madencilik San. ve Tic. A.Ş. İstanbul - 353 225.534.896 391-380 230.340.887 86-79 181.766.901 81-73 415.204.976 167-157 491.962.005 55-50 111.263.592 146-145 95.839 261-249 631 364
365 378 Ulusoy Un San. ve Tic. A.Ş. Samsun - 354 224.853.530 177-168 499.842.919 --- - --- - --- - --- - --- - 456-443 168 365

•85•
Rank: Rank: Rank: Rank:Rank:(TL) (TL) Rank: (TL) (TL) Number:($ 000)Firm2012 2011 Rank: (TL)
Gross Value Added (at Producers’ Prices) Equity Capital Total Assets Exports
Profit (Before Tax)/Loss for the Period
Average No. of Wage Employees
Rank in
Top 500
Affiliated Chamber/
Public
Rank in
Public Sector
Rank in
Private Sector
Production-based Sales
(Net) (TL)
Sales Revenues (Net)
Rank in
Top 5002012
331-365RANKING
331 357 Viko Elektrik ve Elektronik Endüstrisi San. ve Tic. A.Ş. İstanbul - 320 246.184.030 337-326 272.055.614 166-157 104.332.327 284-273 117.183.090 322-310 248.911.301 125-120 46.609.574 207-206 62.648 243-231 697 331
332 336 Kale Kilit ve Kalıp Sanayi A.Ş. İstanbul - 321 246.126.579 308-297 290.313.041 294-281 53.040.788 265-254 133.214.455 254-242 316.164.807 433-426 512.077 212-211 60.911 125-116 1.328 332
333 392 Şa-Ra Enerji İnşaat Tic. ve San. A.Ş. Ankara - 322 244.869.670 361-350 256.597.877 --- - --- - --- - --- - 357-355 15.309 --- - 333
334 292 Aydınlı Hazır Giyim San. ve Tic. A.Ş. İstanbul - 323 244.374.298 168-159 522.840.659 100-92 168.386.869 206-197 180.035.299 135-126 587.102.105 93-88 62.268.923 238-236 49.306 39-31 3.109 334
335 317 AES Entek Elektrik Üretimi A.Ş. Kocaeli - 324 244.011.250 357-346 258.930.752 479-466 7.391.436 84-76 409.375.013 133-124 596.910.310 485-475 -37.438.495 --- - 489-476 101 335
336 412 Modern Ambalaj Tic. ve San. A.Ş. Çorlu - 325 243.022.836 365-354 253.351.840 --- - --- - --- - --- - --- - --- - 336
337 - Genpower Jeneratör San. ve Tic. A.Ş. Ankara - 326 242.498.336 378-367 242.498.336 339-326 41.870.998 296-285 108.328.511 240-228 333.635.310 399-392 2.127.135 168-167 84.219 460-447 164 337
338 271 Marshall Boya ve Vernik Sanayi A.Ş. İstanbul - 327 242.024.095 325-314 279.144.678 307-294 49.369.499 309-298 98.590.367 395-382 176.134.071 459-451 -5.469.456 388-384 8.844 371-358 330 338
339 - Seranit Granit Seramik San. ve Tic. A.Ş. İstanbul - 328 241.744.020 303-292 295.526.752 247-236 65.629.818 364-352 70.189.301 146-137 559.333.576 240-234 17.930.193 302-300 29.231 172-161 1.037 339
340 294 Nobel İlaç San. ve Tic. A.Ş. İstanbul - 329 240.867.914 364-353 253.511.630 --- - --- - 315-303 253.580.965 --- - 252-250 45.565 327-315 425 340
341 322 Mar Tüketim Maddeleri İhracat İthalat San. ve Tic. A.Ş. Balıkesir - 330 240.691.736 354-343 259.528.570 --- - --- - --- - --- - 434-429 2.237 --- - 341
342 347 Balsu Gıda San. ve Tic. A.Ş. Sakarya - 331 240.502.012 277-268 328.956.597 --- - --- - --- - --- - 89-88 134.823 419-406 237 342
343 343 Durmazlar Makina San. ve Tic. A.Ş. Bursa - 332 239.350.203 345-334 265.784.313 212-202 79.760.821 181-172 215.631.925 205-195 410.194.288 293-287 11.008.368 130-129 102.204 188-177 950 343
344 490 Dinarsu İmalat ve Ticaret T.A.Ş. İstanbul - 333 238.684.940 381-370 238.812.624 286-274 54.506.985 384-372 60.630.649 300-288 268.146.274 368-362 4.852.108 224-222 54.639 162-151 1.077 344
345 323 Arcelormittal Ambalaj Çeliği San. ve Tic. A.Ş. İstanbul - 334 237.229.305 311-300 288.119.402 493-480 206.763 439-426 33.713.518 283-271 286.119.997 464-456 -7.398.076 310-308 27.296 465-452 160 345
346 349 Konya Çimento Sanayii A.Ş. Konya - 335 235.685.873 386-375 236.240.021 223-213 74.619.724 117-108 309.706.203 225-214 363.293.728 114-109 49.257.064 442-437 1.157 446-433 180 346
347 368 Selçuk İplik San. ve Tic. A.Ş. Gaziantep - 336 235.509.000 376-365 245.483.416 --- - 255-244 139.345.588 257-245 314.701.844 --- - 323-321 24.125 137-128 1.250 347
348 475 Yavuz Gıda San. ve Tic. Ltd. Şti. Giresun - 337 235.374.254 387-376 235.678.280 487-474 4.674.827 463-450 18.213.061 499-486 37.752.802 401-394 2.053.772 135-134 98.752 467-454 158 348
349 330 Flokser Tekstil San. ve Tic. A.Ş. İstanbul - 338 234.655.179 340-329 269.340.727 356-343 38.879.513 277-266 123.136.127 301-289 267.293.393 409-402 1.857.885 239-237 49.281 168-157 1.050 349
350 - İlhan Demir Çelik ve Boru Profil Endüstrisi A.Ş. Dörtyol - 339 234.361.086 368-357 252.075.889 --- - 487-474 5.927.968 488-475 80.078.930 --- - 334-332 22.318 468-455 158 350
351 231 Unipro Gıda San. ve Tic. A.Ş. Çorlu - 340 234.306.820 359-348 258.110.853 --- - --- - --- - --- - 412-407 4.842 --- - 351
352 394 Kipaş Denim İşletmeleri A.Ş. Kahramanmaraş - 341 233.500.022 380-369 240.682.738 --- - 218-208 168.225.596 321-309 249.529.773 --- - 413-408 4.716 113-104 1.458 352
353 471 Altek Döküm Hadde Mamülleri San. ve Tic. Ltd. Şti. İstanbul - 342 233.129.106 384-373 236.876.982 410-397 23.498.253 317-306 95.713.471 432-419 145.187.319 262-256 15.063.788 194-193 67.241 441-428 190 353
354 390 Çamlı Yem Besicilik San. ve Tic. A.Ş. Ege Bölgesi - 343 232.519.246 379-368 241.832.027 471-458 8.993.152 392-380 57.946.676 377-364 196.012.807 456-448 -5.085.780 375-372 11.921 322-310 432 354
355 - Ağır Haddecilik A.Ş. Kocaeli - 344 231.509.157 292-282 308.437.616 --- - --- - 439-426 135.621.397 --- - 214-213 59.950 478-465 140 355
356 367 Ünye Çimento San. ve Tic. A.Ş. Ünye - 345 231.117.088 389-378 232.939.465 142-133 123.106.609 149-140 256.242.270 274-262 293.396.774 76-71 81.778.356 370-367 12.828 428-415 224 356
357 369 Erdem Tekstil San. ve Tic. A.Ş. Kahramanmaraş - 346 229.333.946 374-363 248.677.743 --- - --- - --- - --- - --- - --- - 357
358 335 Assan Demir ve Sac Sanayi A.Ş. İstanbul - 347 229.277.197 334-323 272.701.339 464-451 10.248.439 357-345 73.999.731 342-330 222.069.293 443-436 -1.619.732 348-346 18.133 463-450 161 358
359 398 Nuh'un Ankara Makarnası San. ve Tic. A.Ş. Ankara - 348 229.190.983 392-381 229.190.983 299-286 51.546.513 326-315 92.374.694 415-402 151.893.265 208-202 24.212.128 324-322 23.961 310-298 450 359
360 375 Tümka Kablo Sanayi A.Ş. İstanbul - 349 226.803.918 394-383 226.966.070 392-379 27.031.823 451-438 25.441.147 449-436 126.677.240 410-403 1.794.544 150-149 92.261 443-430 185 360
361 342 Sarar Giyim Tekstil Enerji San. ve Tic. A.Ş. Eskişehir - 350 226.058.412 341-330 267.359.740 185-176 93.635.203 112-103 319.102.615 196-186 438.289.214 110-105 50.495.207 305-303 28.444 65-57 2.142 361
362 456 Sırmagrup İçecek San. ve Tic. A.Ş. İstanbul - 351 226.047.301 382-371 237.882.577 --- - --- - --- - --- - --- - --- - 362
363 311 Mem Tekstil San. ve Tic. A.Ş. Kahramanmaraş - 352 225.893.110 395-384 226.147.944 347-334 40.115.991 237-226 153.990.600 280-268 287.585.332 302-296 10.162.733 355-353 16.023 133-124 1.292 363
364 452 Park Elektrik Üretim Madencilik San. ve Tic. A.Ş. İstanbul - 353 225.534.896 391-380 230.340.887 86-79 181.766.901 81-73 415.204.976 167-157 491.962.005 55-50 111.263.592 146-145 95.839 261-249 631 364
365 378 Ulusoy Un San. ve Tic. A.Ş. Samsun - 354 224.853.530 177-168 499.842.919 --- - --- - --- - --- - --- - 456-443 168 365
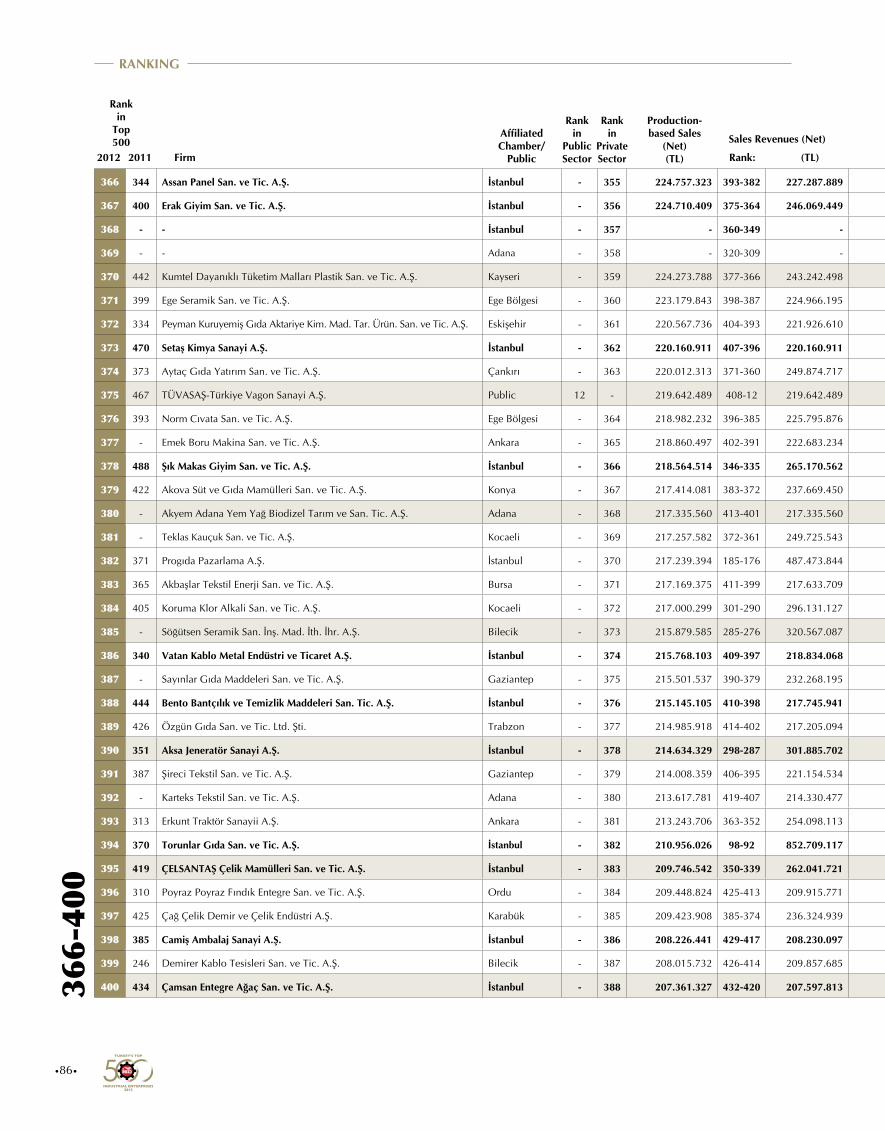
•86•
Rank: Rank: Rank: Rank:Rank:(TL) (TL) Rank: (TL) (TL) Number:($ 000)Firm2012 2011 Rank: (TL)
Gross Value Added (at Producers’ Prices) Equity Capital Total Assets Exports
Profit (Before Tax)/Loss for the Period
Average No. of Wage Employees
Rank in
Top 500
Affiliated Chamber/
Public
Rank in
Public Sector
Rank in
Private Sector
Production-based Sales
(Net) (TL)
Sales Revenues (Net)
Rank in
Top 5002012
366-
400
RANKING
366 344 Assan Panel San. ve Tic. A.Ş. İstanbul - 355 224.757.323 393-382 227.287.889 387-374 28.858.653 375-363 66.280.442 419-406 150.669.418 325-319 8.406.161 306-304 28.374 437-424 204 366
367 400 Erak Giyim San. ve Tic. A.Ş. İstanbul - 356 224.710.409 375-364 246.069.449 292-279 53.388.029 360-348 71.660.937 347-335 218.692.183 385-379 2.980.703 205-204 62.966 124-115 1.332 367
368 - - İstanbul - 357 - 360-349 - 426-413 - 395-383 - 398-385 - 316-310 - 144-143 - 397-384 - 368
369 - - Adana - 358 - 320-309 - 232-221 - 203-194 - 352-340 - 112-107 - 316-314 - 462-449 - 369
370 442 Kumtel Dayanıklı Tüketim Malları Plastik San. ve Tic. A.Ş. Kayseri - 359 224.273.788 377-366 243.242.498 306-293 49.571.074 292-281 110.011.584 346-334 219.892.850 253-247 16.230.570 160-159 88.319 339-327 409 370
371 399 Ege Seramik San. ve Tic. A.Ş. Ege Bölgesi - 360 223.179.843 398-387 224.966.195 283-271 54.976.279 219-209 166.458.313 307-295 257.274.133 198-192 26.308.907 247-245 46.479 178-167 1.002 371
372 334 Peyman Kuruyemiş Gıda Aktariye Kim. Mad. Tar. Ürün. San. ve Tic. A.Ş. Eskişehir - 361 220.567.736 404-393 221.926.610 --- - --- - --- - --- - --- - 342-330 400 372
373 470 Setaş Kimya Sanayi A.Ş. İstanbul - 362 220.160.911 407-396 220.160.911 322-309 45.273.523 300-289 106.546.049 391-378 178.565.054 196-190 26.435.661 325-323 23.869 423-410 231 373
374 373 Aytaç Gıda Yatırım San. ve Tic. A.Ş. Çankırı - 363 220.012.313 371-360 249.874.717 --- - 340-329 82.106.143 368-355 201.262.137 --- - 403-399 5.674 260-248 634 374
375 467 TÜVASAŞ-Türkiye Vagon Sanayi A.Ş. Public 12 - 219.642.489 408-12 219.642.489 273-12 58.955.721 420-13 41.871.201 209-11 400.937.340 479-9 -22.301.509 --- - 159-11 1.086 375
376 393 Norm Cıvata San. ve Tic. A.Ş. Ege Bölgesi - 364 218.982.232 396-385 225.795.876 --- - 241-230 149.345.579 --- - --- - 263-261 42.090 301-289 491 376
377 - Emek Boru Makina San. ve Tic. A.Ş. Ankara - 365 218.860.497 402-391 222.683.234 423-410 19.032.765 404-392 52.720.662 371-358 198.978.057 406-399 1.978.523 286-284 35.581 396-383 296 377
378 488 Şık Makas Giyim San. ve Tic. A.Ş. İstanbul - 366 218.564.514 346-335 265.170.562 337-324 42.027.380 386-374 60.015.853 384-371 186.554.524 390-384 2.823.543 90-89 132.329 58-50 2.342 378
379 422 Akova Süt ve Gıda Mamülleri San. ve Tic. A.Ş. Konya - 367 217.414.081 383-372 237.669.450 398-385 25.941.108 419-407 42.265.601 477-464 94.625.264 286-280 12.114.462 446-441 549 332-320 419 379
380 - Akyem Adana Yem Yağ Biodizel Tarım ve San. Tic. A.Ş. Adana - 368 217.335.560 413-401 217.335.560 441-428 15.114.762 421-408 41.837.167 420-407 150.514.230 418-411 1.246.260 307-305 28.085 156-146 1.100 380
381 - Teklas Kauçuk San. ve Tic. A.Ş. Kocaeli - 369 217.257.582 372-361 249.725.543 --- - 235-224 154.994.195 374-361 198.089.222 --- - --- - --- - 381
382 371 Progıda Pazarlama A.Ş. İstanbul - 370 217.239.394 185-176 487.473.844 --- - --- - 454-441 121.708.689 --- - 106-105 119.811 500-487 12 382
383 365 Akbaşlar Tekstil Enerji San. ve Tic. A.Ş. Bursa - 371 217.169.375 411-399 217.633.709 343-330 40.671.813 312-301 97.644.108 351-339 215.806.681 250-244 16.497.552 444-439 1.066 190-179 923 383
384 405 Koruma Klor Alkali San. ve Tic. A.Ş. Kocaeli - 372 217.000.299 301-290 296.131.127 268-257 59.867.378 307-296 99.455.307 297-285 271.084.436 187-181 28.890.841 426-421 3.450 375-362 321 384
385 - Söğütsen Seramik San. İnş. Mad. İth. İhr. A.Ş. Bilecik - 373 215.879.585 285-276 320.567.087 --- - --- - --- - --- - --- - --- - 385
386 340 Vatan Kablo Metal Endüstri ve Ticaret A.Ş. İstanbul - 374 215.768.103 409-397 218.834.068 --- - --- - --- - --- - 210-209 61.644 --- - 386
387 - Sayınlar Gıda Maddeleri San. ve Tic. A.Ş. Gaziantep - 375 215.501.537 390-379 232.268.195 469-456 9.303.257 485-472 6.990.791 491-478 72.222.832 338-332 7.564.977 162-161 86.849 412-399 261 387
388 444 Bento Bantçılık ve Temizlik Maddeleri San. Tic. A.Ş. İstanbul - 376 215.145.105 410-398 217.745.941 --- - --- - 436-423 137.917.635 --- - 266-264 40.882 400-387 283 388
389 426 Özgün Gıda San. ve Tic. Ltd. Şti. Trabzon - 377 214.985.918 414-402 217.205.094 480-467 7.041.638 488-475 5.684.421 426-413 148.766.020 429-422 714.624 159-158 88.981 490-477 101 389
390 351 Aksa Jeneratör Sanayi A.Ş. İstanbul - 378 214.634.329 298-287 301.885.702 --- - --- - 130-121 612.736.291 --- - --- - 405-392 275 390
391 387 Şireci Tekstil San. ve Tic. A.Ş. Gaziantep - 379 214.008.359 406-395 221.154.534 301-288 51.323.085 374-362 67.185.155 332-320 234.634.177 279-273 12.992.795 425-420 3.729 100-92 1.652 391
392 - Karteks Tekstil San. ve Tic. A.Ş. Adana - 380 213.617.781 419-407 214.330.477 318-305 45.874.747 345-334 78.720.303 334-322 232.845.846 263-257 15.048.746 427-422 3.431 254-242 650 392
393 313 Erkunt Traktör Sanayii A.Ş. Ankara - 381 213.243.706 363-352 254.098.113 419-406 20.361.809 --- - --- - 419-412 1.244.511 327-325 23.494 --- - 393
394 370 Torunlar Gıda San. ve Tic. A.Ş. İstanbul - 382 210.956.026 98-92 852.709.117 371-358 35.527.169 103-94 352.943.951 65-57 1.168.373.812 190-184 27.947.574 --- - 469-456 157 394
395 419 ÇELSANTAŞ Çelik Mamülleri San. ve Tic. A.Ş. İstanbul - 383 209.746.542 350-339 262.041.721 465-452 10.123.056 372-360 67.937.521 461-448 116.249.721 374-368 4.123.817 368-365 12.967 472-459 152 395
396 310 Poyraz Poyraz Fındık Entegre San. ve Tic. A.Ş. Ordu - 384 209.448.824 425-413 209.915.771 490-477 2.209.462 422-409 41.764.448 437-424 136.522.693 436-429 324.382 154-153 90.967 409-396 267 396
397 425 Çağ Çelik Demir ve Çelik Endüstri A.Ş. Karabük - 385 209.423.908 385-374 236.324.939 466-453 10.071.384 478-465 13.613.677 494-481 69.634.053 373-367 4.257.814 152-151 91.510 381-368 312 397
398 385 Camiş Ambalaj Sanayi A.Ş. İstanbul - 386 208.226.441 429-417 208.230.097 282-270 55.239.205 323-312 92.922.551 451-438 124.917.354 300-294 10.202.370 431-426 2.770 274-262 595 398
399 246 Demirer Kablo Tesisleri San. ve Tic. A.Ş. Bilecik - 387 208.015.732 426-414 209.857.685 365-352 37.113.615 264-253 134.229.274 224-213 363.480.942 448-441 -2.201.013 133-132 99.630 408-395 268 399
400 434 Çamsan Entegre Ağaç San. ve Tic. A.Ş. İstanbul - 388 207.361.327 432-420 207.597.813 362-349 38.150.218 381-369 61.092.654 381-368 190.383.919 315-309 9.060.036 399-395 6.824 370-357 331 400
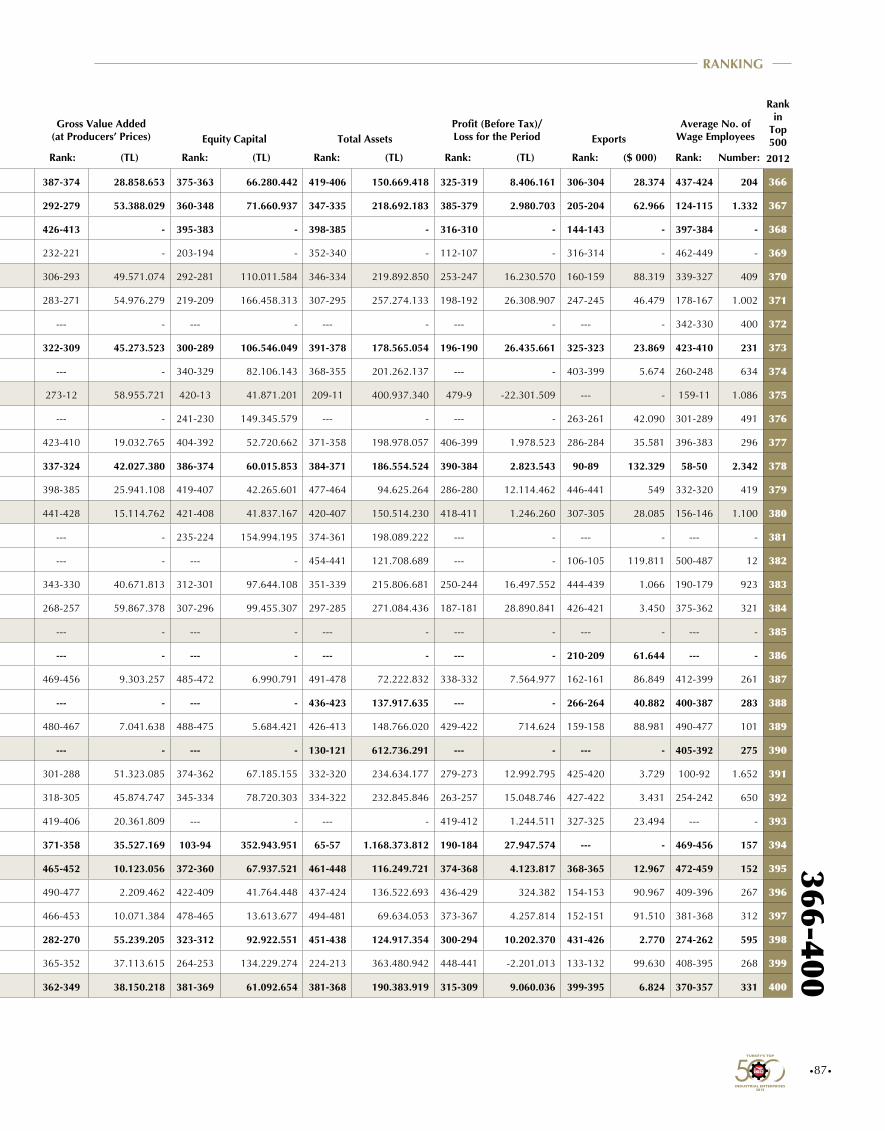
•87•
Rank: Rank: Rank: Rank:Rank:(TL) (TL) Rank: (TL) (TL) Number:($ 000)Firm2012 2011 Rank: (TL)
Gross Value Added (at Producers’ Prices) Equity Capital Total Assets Exports
Profit (Before Tax)/Loss for the Period
Average No. of Wage Employees
Rank in
Top 500
Affiliated Chamber/
Public
Rank in
Public Sector
Rank in
Private Sector
Production-based Sales
(Net) (TL)
Sales Revenues (Net)
Rank in
Top 5002012
366-400RANKING
366 344 Assan Panel San. ve Tic. A.Ş. İstanbul - 355 224.757.323 393-382 227.287.889 387-374 28.858.653 375-363 66.280.442 419-406 150.669.418 325-319 8.406.161 306-304 28.374 437-424 204 366
367 400 Erak Giyim San. ve Tic. A.Ş. İstanbul - 356 224.710.409 375-364 246.069.449 292-279 53.388.029 360-348 71.660.937 347-335 218.692.183 385-379 2.980.703 205-204 62.966 124-115 1.332 367
368 - - İstanbul - 357 - 360-349 - 426-413 - 395-383 - 398-385 - 316-310 - 144-143 - 397-384 - 368
369 - - Adana - 358 - 320-309 - 232-221 - 203-194 - 352-340 - 112-107 - 316-314 - 462-449 - 369
370 442 Kumtel Dayanıklı Tüketim Malları Plastik San. ve Tic. A.Ş. Kayseri - 359 224.273.788 377-366 243.242.498 306-293 49.571.074 292-281 110.011.584 346-334 219.892.850 253-247 16.230.570 160-159 88.319 339-327 409 370
371 399 Ege Seramik San. ve Tic. A.Ş. Ege Bölgesi - 360 223.179.843 398-387 224.966.195 283-271 54.976.279 219-209 166.458.313 307-295 257.274.133 198-192 26.308.907 247-245 46.479 178-167 1.002 371
372 334 Peyman Kuruyemiş Gıda Aktariye Kim. Mad. Tar. Ürün. San. ve Tic. A.Ş. Eskişehir - 361 220.567.736 404-393 221.926.610 --- - --- - --- - --- - --- - 342-330 400 372
373 470 Setaş Kimya Sanayi A.Ş. İstanbul - 362 220.160.911 407-396 220.160.911 322-309 45.273.523 300-289 106.546.049 391-378 178.565.054 196-190 26.435.661 325-323 23.869 423-410 231 373
374 373 Aytaç Gıda Yatırım San. ve Tic. A.Ş. Çankırı - 363 220.012.313 371-360 249.874.717 --- - 340-329 82.106.143 368-355 201.262.137 --- - 403-399 5.674 260-248 634 374
375 467 TÜVASAŞ-Türkiye Vagon Sanayi A.Ş. Public 12 - 219.642.489 408-12 219.642.489 273-12 58.955.721 420-13 41.871.201 209-11 400.937.340 479-9 -22.301.509 --- - 159-11 1.086 375
376 393 Norm Cıvata San. ve Tic. A.Ş. Ege Bölgesi - 364 218.982.232 396-385 225.795.876 --- - 241-230 149.345.579 --- - --- - 263-261 42.090 301-289 491 376
377 - Emek Boru Makina San. ve Tic. A.Ş. Ankara - 365 218.860.497 402-391 222.683.234 423-410 19.032.765 404-392 52.720.662 371-358 198.978.057 406-399 1.978.523 286-284 35.581 396-383 296 377
378 488 Şık Makas Giyim San. ve Tic. A.Ş. İstanbul - 366 218.564.514 346-335 265.170.562 337-324 42.027.380 386-374 60.015.853 384-371 186.554.524 390-384 2.823.543 90-89 132.329 58-50 2.342 378
379 422 Akova Süt ve Gıda Mamülleri San. ve Tic. A.Ş. Konya - 367 217.414.081 383-372 237.669.450 398-385 25.941.108 419-407 42.265.601 477-464 94.625.264 286-280 12.114.462 446-441 549 332-320 419 379
380 - Akyem Adana Yem Yağ Biodizel Tarım ve San. Tic. A.Ş. Adana - 368 217.335.560 413-401 217.335.560 441-428 15.114.762 421-408 41.837.167 420-407 150.514.230 418-411 1.246.260 307-305 28.085 156-146 1.100 380
381 - Teklas Kauçuk San. ve Tic. A.Ş. Kocaeli - 369 217.257.582 372-361 249.725.543 --- - 235-224 154.994.195 374-361 198.089.222 --- - --- - --- - 381
382 371 Progıda Pazarlama A.Ş. İstanbul - 370 217.239.394 185-176 487.473.844 --- - --- - 454-441 121.708.689 --- - 106-105 119.811 500-487 12 382
383 365 Akbaşlar Tekstil Enerji San. ve Tic. A.Ş. Bursa - 371 217.169.375 411-399 217.633.709 343-330 40.671.813 312-301 97.644.108 351-339 215.806.681 250-244 16.497.552 444-439 1.066 190-179 923 383
384 405 Koruma Klor Alkali San. ve Tic. A.Ş. Kocaeli - 372 217.000.299 301-290 296.131.127 268-257 59.867.378 307-296 99.455.307 297-285 271.084.436 187-181 28.890.841 426-421 3.450 375-362 321 384
385 - Söğütsen Seramik San. İnş. Mad. İth. İhr. A.Ş. Bilecik - 373 215.879.585 285-276 320.567.087 --- - --- - --- - --- - --- - --- - 385
386 340 Vatan Kablo Metal Endüstri ve Ticaret A.Ş. İstanbul - 374 215.768.103 409-397 218.834.068 --- - --- - --- - --- - 210-209 61.644 --- - 386
387 - Sayınlar Gıda Maddeleri San. ve Tic. A.Ş. Gaziantep - 375 215.501.537 390-379 232.268.195 469-456 9.303.257 485-472 6.990.791 491-478 72.222.832 338-332 7.564.977 162-161 86.849 412-399 261 387
388 444 Bento Bantçılık ve Temizlik Maddeleri San. Tic. A.Ş. İstanbul - 376 215.145.105 410-398 217.745.941 --- - --- - 436-423 137.917.635 --- - 266-264 40.882 400-387 283 388
389 426 Özgün Gıda San. ve Tic. Ltd. Şti. Trabzon - 377 214.985.918 414-402 217.205.094 480-467 7.041.638 488-475 5.684.421 426-413 148.766.020 429-422 714.624 159-158 88.981 490-477 101 389
390 351 Aksa Jeneratör Sanayi A.Ş. İstanbul - 378 214.634.329 298-287 301.885.702 --- - --- - 130-121 612.736.291 --- - --- - 405-392 275 390
391 387 Şireci Tekstil San. ve Tic. A.Ş. Gaziantep - 379 214.008.359 406-395 221.154.534 301-288 51.323.085 374-362 67.185.155 332-320 234.634.177 279-273 12.992.795 425-420 3.729 100-92 1.652 391
392 - Karteks Tekstil San. ve Tic. A.Ş. Adana - 380 213.617.781 419-407 214.330.477 318-305 45.874.747 345-334 78.720.303 334-322 232.845.846 263-257 15.048.746 427-422 3.431 254-242 650 392
393 313 Erkunt Traktör Sanayii A.Ş. Ankara - 381 213.243.706 363-352 254.098.113 419-406 20.361.809 --- - --- - 419-412 1.244.511 327-325 23.494 --- - 393
394 370 Torunlar Gıda San. ve Tic. A.Ş. İstanbul - 382 210.956.026 98-92 852.709.117 371-358 35.527.169 103-94 352.943.951 65-57 1.168.373.812 190-184 27.947.574 --- - 469-456 157 394
395 419 ÇELSANTAŞ Çelik Mamülleri San. ve Tic. A.Ş. İstanbul - 383 209.746.542 350-339 262.041.721 465-452 10.123.056 372-360 67.937.521 461-448 116.249.721 374-368 4.123.817 368-365 12.967 472-459 152 395
396 310 Poyraz Poyraz Fındık Entegre San. ve Tic. A.Ş. Ordu - 384 209.448.824 425-413 209.915.771 490-477 2.209.462 422-409 41.764.448 437-424 136.522.693 436-429 324.382 154-153 90.967 409-396 267 396
397 425 Çağ Çelik Demir ve Çelik Endüstri A.Ş. Karabük - 385 209.423.908 385-374 236.324.939 466-453 10.071.384 478-465 13.613.677 494-481 69.634.053 373-367 4.257.814 152-151 91.510 381-368 312 397
398 385 Camiş Ambalaj Sanayi A.Ş. İstanbul - 386 208.226.441 429-417 208.230.097 282-270 55.239.205 323-312 92.922.551 451-438 124.917.354 300-294 10.202.370 431-426 2.770 274-262 595 398
399 246 Demirer Kablo Tesisleri San. ve Tic. A.Ş. Bilecik - 387 208.015.732 426-414 209.857.685 365-352 37.113.615 264-253 134.229.274 224-213 363.480.942 448-441 -2.201.013 133-132 99.630 408-395 268 399
400 434 Çamsan Entegre Ağaç San. ve Tic. A.Ş. İstanbul - 388 207.361.327 432-420 207.597.813 362-349 38.150.218 381-369 61.092.654 381-368 190.383.919 315-309 9.060.036 399-395 6.824 370-357 331 400
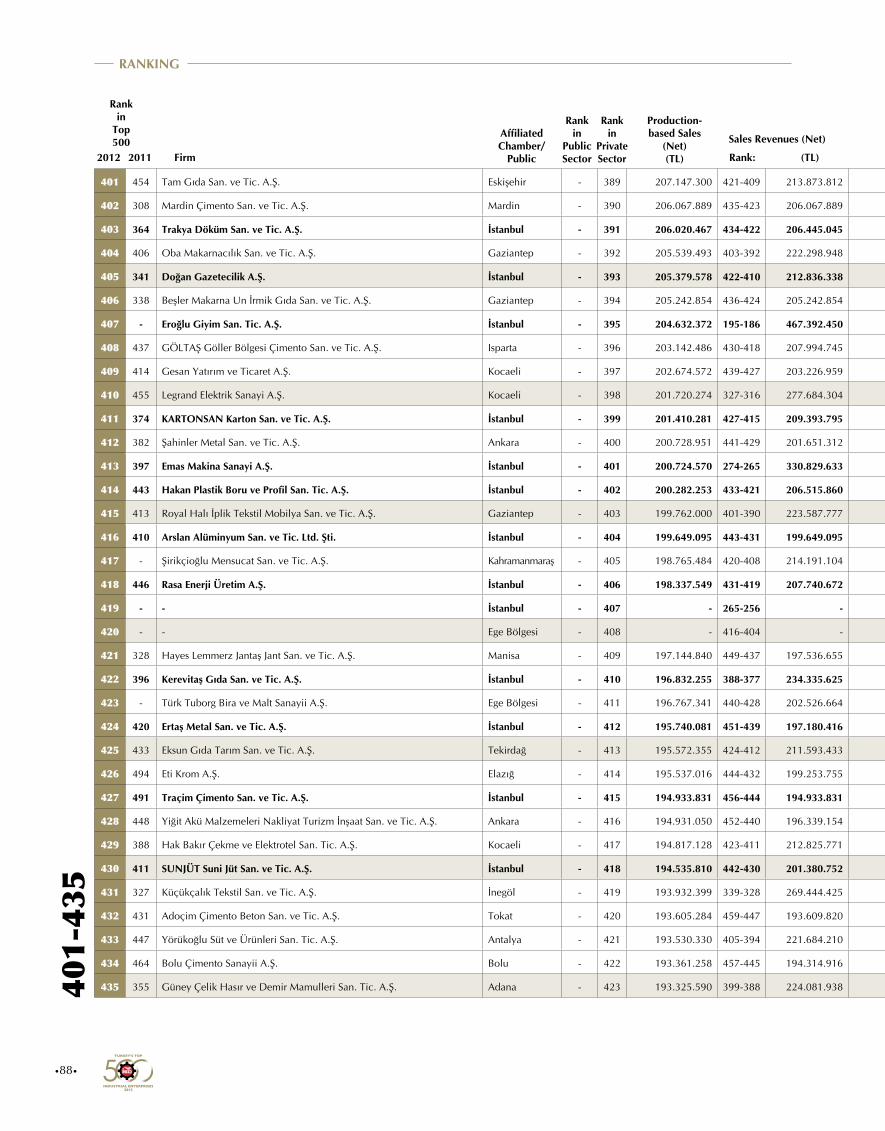
•88•
Rank: Rank: Rank: Rank:Rank:(TL) (TL) Rank: (TL) (TL) Number:($ 000)Firm2012 2011 Rank: (TL)
Gross Value Added (at Producers’ Prices) Equity Capital Total Assets Exports
Profit (Before Tax)/Loss for the Period
Average No. of Wage Employees
Rank in
Top 500
Affiliated Chamber/
Public
Rank in
Public Sector
Rank in
Private Sector
Production-based Sales
(Net) (TL)
Sales Revenues (Net)
Rank in
Top 5002012
401-
435
RANKING
401 454 Tam Gıda San. ve Tic. A.Ş. Eskişehir - 389 207.147.300 421-409 213.873.812 --- - --- - --- - --- - 358-356 15.030 --- - 401
402 308 Mardin Çimento San. ve Tic. A.Ş. Mardin - 390 206.067.889 435-423 206.067.889 210-200 80.845.387 179-170 218.310.322 263-251 304.756.954 119-114 47.759.486 259-257 42.920 390-377 305 402
403 364 Trakya Döküm San. ve Tic. A.Ş. İstanbul - 391 206.020.467 434-422 206.445.045 209-199 80.998.577 293-282 109.768.822 237-226 336.038.899 175-169 31.926.200 290-288 34.077 210-198 846 403
404 406 Oba Makarnacılık San. ve Tic. A.Ş. Gaziantep - 392 205.539.493 403-392 222.298.948 405-392 24.358.529 385-373 60.125.217 453-440 121.870.702 332-326 8.018.086 --- - 393-380 299 404
405 341 Doğan Gazetecilik A.Ş. İstanbul - 393 205.379.578 422-410 212.836.338 258-247 61.975.162 150-141 255.609.819 284-272 285.935.148 245-239 17.425.968 --- - 385-372 309 405
406 338 Beşler Makarna Un İrmik Gıda San. ve Tic. A.Ş. Gaziantep - 394 205.242.854 436-424 205.242.854 455-442 11.684.608 430-417 38.338.788 358-346 210.464.070 397-390 2.461.381 249-247 45.995 424-411 231 406
407 - Eroğlu Giyim San. Tic. A.Ş. İstanbul - 395 204.632.372 195-186 467.392.450 --- - --- - --- - --- - --- - --- - 407
408 437 GÖLTAŞ Göller Bölgesi Çimento San. ve Tic. A.Ş. Isparta - 396 203.142.486 430-418 207.994.745 309-296 47.974.560 141-132 266.530.305 258-246 313.088.966 258-252 15.768.434 245-243 46.922 356-343 357 408
409 414 Gesan Yatırım ve Ticaret A.Ş. Kocaeli - 397 202.674.572 439-427 203.226.959 222-212 76.222.671 469-456 15.717.700 500-487 34.205.372 382-376 3.562.541 --- - 494-481 70 409
410 455 Legrand Elektrik Sanayi A.Ş. Kocaeli - 398 201.720.274 327-316 277.684.304 --- - 291-280 110.558.319 387-374 182.746.171 --- - 140-139 97.265 308-296 461 410
411 374 KARTONSAN Karton San. ve Tic. A.Ş. İstanbul - 399 201.410.281 427-415 209.393.795 262-251 61.266.210 188-179 207.983.237 327-315 242.339.454 167-161 33.852.618 288-286 34.597 411-398 264 411
412 382 Şahinler Metal San. ve Tic. A.Ş. Ankara - 400 200.728.951 441-429 201.651.312 --- - --- - --- - --- - --- - --- - 412
413 397 Emas Makina Sanayi A.Ş. İstanbul - 401 200.724.570 274-265 330.829.633 --- - 336-325 86.255.334 380-367 193.358.688 --- - 424-419 3.883 378-365 318 413
414 443 Hakan Plastik Boru ve Profil San. Tic. A.Ş. İstanbul - 402 200.282.253 433-421 206.515.860 --- - --- - --- - --- - --- - --- - 414
415 413 Royal Halı İplik Tekstil Mobilya San. ve Tic. A.Ş. Gaziantep - 403 199.762.000 401-390 223.587.777 260-249 61.821.110 285-274 116.029.894 378-365 193.693.435 131-126 44.295.250 330-328 23.029 272-260 606 415
416 410 Arslan Alüminyum San. ve Tic. Ltd. Şti. İstanbul - 404 199.649.095 443-431 199.649.095 --- - --- - --- - --- - 347-345 18.259 --- - 416
417 - Şirikçioğlu Mensucat San. ve Tic. A.Ş. Kahramanmaraş - 405 198.765.484 420-408 214.191.104 254-243 63.773.845 269-258 128.483.957 271-259 296.669.567 157-152 36.339.187 414-409 4.602 191-180 919 417
418 446 Rasa Enerji Üretim A.Ş. İstanbul - 406 198.337.549 431-419 207.740.672 338-325 41.887.783 411-399 46.996.439 333-321 234.212.068 375-369 4.097.089 456-451 25 492-479 84 418
419 - - İstanbul - 407 - 265-256 - 162-153 - 223-213 - 259-247 - 367-361 - 254-252 - 59-51 - 419
420 - - Ege Bölgesi - 408 - 416-404 - 270-259 - 393-381 - 365-352 - 427-420 - 406-401 - 421-408 - 420
421 328 Hayes Lemmerz Jantaş Jant San. ve Tic. A.Ş. Manisa - 409 197.144.840 449-437 197.536.655 --- - 347-336 78.301.711 466-453 112.894.595 --- - 196-195 66.599 319-307 435 421
422 396 Kerevitaş Gıda San. ve Tic. A.Ş. İstanbul - 410 196.832.255 388-377 234.335.625 390-377 27.304.973 494-481 -19.970.990 313-301 254.388.539 383-377 3.123.711 410-405 5.164 142-133 1.207 422
423 - Türk Tuborg Bira ve Malt Sanayii A.Ş. Ege Bölgesi - 411 196.767.341 440-428 202.526.664 28-23 647.296.857 85-77 405.810.763 137-128 580.919.844 241-235 17.848.879 283-281 36.116 436-423 205 423
424 420 Ertaş Metal San. ve Tic. A.Ş. İstanbul - 412 195.740.081 451-439 197.180.416 382-369 30.781.225 --- - 376-363 196.372.815 389-383 2.833.458 407-402 5.314 444-431 184 424
425 433 Eksun Gıda Tarım San. ve Tic. A.Ş. Tekirdağ - 413 195.572.355 424-412 211.593.433 --- - 486-473 6.342.592 423-410 149.981.574 --- - 268-266 39.907 453-440 173 425
426 494 Eti Krom A.Ş. Elazığ - 414 195.537.016 444-432 199.253.755 276-264 57.637.927 107-98 336.714.630 145-136 559.608.328 232-226 19.477.479 --- - 264-252 623 426
427 491 Traçim Çimento San. ve Tic. A.Ş. İstanbul - 415 194.933.831 456-444 194.933.831 326-313 43.961.779 483-470 10.969.827 343-331 221.231.375 229-223 20.003.603 243-241 47.470 425-412 230 427
428 448 Yiğit Akü Malzemeleri Nakliyat Turizm İnşaat San. ve Tic. A.Ş. Ankara - 416 194.931.050 452-440 196.339.154 --- - --- - 445-432 130.334.301 --- - 200-199 65.474 334-322 415 428
429 388 Hak Bakır Çekme ve Elektrotel San. Tic. A.Ş. Kocaeli - 417 194.817.128 423-411 212.825.771 --- - --- - --- - --- - 420-415 4.071 --- - 429
430 411 SUNJÜT Suni Jüt San. ve Tic. A.Ş. İstanbul - 418 194.535.810 442-430 201.380.752 386-373 29.002.563 355-343 74.387.982 464-451 114.226.356 322-316 8.605.473 153-152 91.227 305-293 470 430
431 327 Küçükçalık Tekstil San. ve Tic. A.Ş. İnegöl - 419 193.932.399 339-328 269.444.425 355-342 39.259.833 224-214 162.462.238 309-297 255.624.002 289-283 11.925.291 156-155 89.838 120-111 1.392 431
432 431 Adoçim Çimento Beton San. ve Tic. A.Ş. Tokat - 420 193.605.284 459-447 193.609.820 267-256 60.090.202 315-304 97.451.327 272-260 296.344.139 191-185 27.691.048 377-374 11.562 416-403 251 432
433 447 Yörükoğlu Süt ve Ürünleri San. Tic. A.Ş. Antalya - 421 193.530.330 405-394 221.684.210 --- - 459-446 19.918.051 457-444 120.113.920 --- - 423-418 3.952 303-291 480 433
434 464 Bolu Çimento Sanayii A.Ş. Bolu - 422 193.361.258 457-445 194.314.916 238-227 69.395.358 176-167 221.477.175 308-296 256.418.022 174-168 32.152.118 453-448 171 420-407 236 434
435 355 Güney Çelik Hasır ve Demir Mamulleri San. Tic. A.Ş. Adana - 423 193.325.590 399-388 224.081.938 446-433 14.236.078 470-457 15.699.857 490-477 77.434.236 434-427 504.321 312-310 26.854 367-354 333 435

•89•
Rank: Rank: Rank: Rank:Rank:(TL) (TL) Rank: (TL) (TL) Number:($ 000)Firm2012 2011 Rank: (TL)
Gross Value Added (at Producers’ Prices) Equity Capital Total Assets Exports
Profit (Before Tax)/Loss for the Period
Average No. of Wage Employees
Rank in
Top 500
Affiliated Chamber/
Public
Rank in
Public Sector
Rank in
Private Sector
Production-based Sales
(Net) (TL)
Sales Revenues (Net)
Rank in
Top 5002012
401-435RANKING
401 454 Tam Gıda San. ve Tic. A.Ş. Eskişehir - 389 207.147.300 421-409 213.873.812 --- - --- - --- - --- - 358-356 15.030 --- - 401
402 308 Mardin Çimento San. ve Tic. A.Ş. Mardin - 390 206.067.889 435-423 206.067.889 210-200 80.845.387 179-170 218.310.322 263-251 304.756.954 119-114 47.759.486 259-257 42.920 390-377 305 402
403 364 Trakya Döküm San. ve Tic. A.Ş. İstanbul - 391 206.020.467 434-422 206.445.045 209-199 80.998.577 293-282 109.768.822 237-226 336.038.899 175-169 31.926.200 290-288 34.077 210-198 846 403
404 406 Oba Makarnacılık San. ve Tic. A.Ş. Gaziantep - 392 205.539.493 403-392 222.298.948 405-392 24.358.529 385-373 60.125.217 453-440 121.870.702 332-326 8.018.086 --- - 393-380 299 404
405 341 Doğan Gazetecilik A.Ş. İstanbul - 393 205.379.578 422-410 212.836.338 258-247 61.975.162 150-141 255.609.819 284-272 285.935.148 245-239 17.425.968 --- - 385-372 309 405
406 338 Beşler Makarna Un İrmik Gıda San. ve Tic. A.Ş. Gaziantep - 394 205.242.854 436-424 205.242.854 455-442 11.684.608 430-417 38.338.788 358-346 210.464.070 397-390 2.461.381 249-247 45.995 424-411 231 406
407 - Eroğlu Giyim San. Tic. A.Ş. İstanbul - 395 204.632.372 195-186 467.392.450 --- - --- - --- - --- - --- - --- - 407
408 437 GÖLTAŞ Göller Bölgesi Çimento San. ve Tic. A.Ş. Isparta - 396 203.142.486 430-418 207.994.745 309-296 47.974.560 141-132 266.530.305 258-246 313.088.966 258-252 15.768.434 245-243 46.922 356-343 357 408
409 414 Gesan Yatırım ve Ticaret A.Ş. Kocaeli - 397 202.674.572 439-427 203.226.959 222-212 76.222.671 469-456 15.717.700 500-487 34.205.372 382-376 3.562.541 --- - 494-481 70 409
410 455 Legrand Elektrik Sanayi A.Ş. Kocaeli - 398 201.720.274 327-316 277.684.304 --- - 291-280 110.558.319 387-374 182.746.171 --- - 140-139 97.265 308-296 461 410
411 374 KARTONSAN Karton San. ve Tic. A.Ş. İstanbul - 399 201.410.281 427-415 209.393.795 262-251 61.266.210 188-179 207.983.237 327-315 242.339.454 167-161 33.852.618 288-286 34.597 411-398 264 411
412 382 Şahinler Metal San. ve Tic. A.Ş. Ankara - 400 200.728.951 441-429 201.651.312 --- - --- - --- - --- - --- - --- - 412
413 397 Emas Makina Sanayi A.Ş. İstanbul - 401 200.724.570 274-265 330.829.633 --- - 336-325 86.255.334 380-367 193.358.688 --- - 424-419 3.883 378-365 318 413
414 443 Hakan Plastik Boru ve Profil San. Tic. A.Ş. İstanbul - 402 200.282.253 433-421 206.515.860 --- - --- - --- - --- - --- - --- - 414
415 413 Royal Halı İplik Tekstil Mobilya San. ve Tic. A.Ş. Gaziantep - 403 199.762.000 401-390 223.587.777 260-249 61.821.110 285-274 116.029.894 378-365 193.693.435 131-126 44.295.250 330-328 23.029 272-260 606 415
416 410 Arslan Alüminyum San. ve Tic. Ltd. Şti. İstanbul - 404 199.649.095 443-431 199.649.095 --- - --- - --- - --- - 347-345 18.259 --- - 416
417 - Şirikçioğlu Mensucat San. ve Tic. A.Ş. Kahramanmaraş - 405 198.765.484 420-408 214.191.104 254-243 63.773.845 269-258 128.483.957 271-259 296.669.567 157-152 36.339.187 414-409 4.602 191-180 919 417
418 446 Rasa Enerji Üretim A.Ş. İstanbul - 406 198.337.549 431-419 207.740.672 338-325 41.887.783 411-399 46.996.439 333-321 234.212.068 375-369 4.097.089 456-451 25 492-479 84 418
419 - - İstanbul - 407 - 265-256 - 162-153 - 223-213 - 259-247 - 367-361 - 254-252 - 59-51 - 419
420 - - Ege Bölgesi - 408 - 416-404 - 270-259 - 393-381 - 365-352 - 427-420 - 406-401 - 421-408 - 420
421 328 Hayes Lemmerz Jantaş Jant San. ve Tic. A.Ş. Manisa - 409 197.144.840 449-437 197.536.655 --- - 347-336 78.301.711 466-453 112.894.595 --- - 196-195 66.599 319-307 435 421
422 396 Kerevitaş Gıda San. ve Tic. A.Ş. İstanbul - 410 196.832.255 388-377 234.335.625 390-377 27.304.973 494-481 -19.970.990 313-301 254.388.539 383-377 3.123.711 410-405 5.164 142-133 1.207 422
423 - Türk Tuborg Bira ve Malt Sanayii A.Ş. Ege Bölgesi - 411 196.767.341 440-428 202.526.664 28-23 647.296.857 85-77 405.810.763 137-128 580.919.844 241-235 17.848.879 283-281 36.116 436-423 205 423
424 420 Ertaş Metal San. ve Tic. A.Ş. İstanbul - 412 195.740.081 451-439 197.180.416 382-369 30.781.225 --- - 376-363 196.372.815 389-383 2.833.458 407-402 5.314 444-431 184 424
425 433 Eksun Gıda Tarım San. ve Tic. A.Ş. Tekirdağ - 413 195.572.355 424-412 211.593.433 --- - 486-473 6.342.592 423-410 149.981.574 --- - 268-266 39.907 453-440 173 425
426 494 Eti Krom A.Ş. Elazığ - 414 195.537.016 444-432 199.253.755 276-264 57.637.927 107-98 336.714.630 145-136 559.608.328 232-226 19.477.479 --- - 264-252 623 426
427 491 Traçim Çimento San. ve Tic. A.Ş. İstanbul - 415 194.933.831 456-444 194.933.831 326-313 43.961.779 483-470 10.969.827 343-331 221.231.375 229-223 20.003.603 243-241 47.470 425-412 230 427
428 448 Yiğit Akü Malzemeleri Nakliyat Turizm İnşaat San. ve Tic. A.Ş. Ankara - 416 194.931.050 452-440 196.339.154 --- - --- - 445-432 130.334.301 --- - 200-199 65.474 334-322 415 428
429 388 Hak Bakır Çekme ve Elektrotel San. Tic. A.Ş. Kocaeli - 417 194.817.128 423-411 212.825.771 --- - --- - --- - --- - 420-415 4.071 --- - 429
430 411 SUNJÜT Suni Jüt San. ve Tic. A.Ş. İstanbul - 418 194.535.810 442-430 201.380.752 386-373 29.002.563 355-343 74.387.982 464-451 114.226.356 322-316 8.605.473 153-152 91.227 305-293 470 430
431 327 Küçükçalık Tekstil San. ve Tic. A.Ş. İnegöl - 419 193.932.399 339-328 269.444.425 355-342 39.259.833 224-214 162.462.238 309-297 255.624.002 289-283 11.925.291 156-155 89.838 120-111 1.392 431
432 431 Adoçim Çimento Beton San. ve Tic. A.Ş. Tokat - 420 193.605.284 459-447 193.609.820 267-256 60.090.202 315-304 97.451.327 272-260 296.344.139 191-185 27.691.048 377-374 11.562 416-403 251 432
433 447 Yörükoğlu Süt ve Ürünleri San. Tic. A.Ş. Antalya - 421 193.530.330 405-394 221.684.210 --- - 459-446 19.918.051 457-444 120.113.920 --- - 423-418 3.952 303-291 480 433
434 464 Bolu Çimento Sanayii A.Ş. Bolu - 422 193.361.258 457-445 194.314.916 238-227 69.395.358 176-167 221.477.175 308-296 256.418.022 174-168 32.152.118 453-448 171 420-407 236 434
435 355 Güney Çelik Hasır ve Demir Mamulleri San. Tic. A.Ş. Adana - 423 193.325.590 399-388 224.081.938 446-433 14.236.078 470-457 15.699.857 490-477 77.434.236 434-427 504.321 312-310 26.854 367-354 333 435
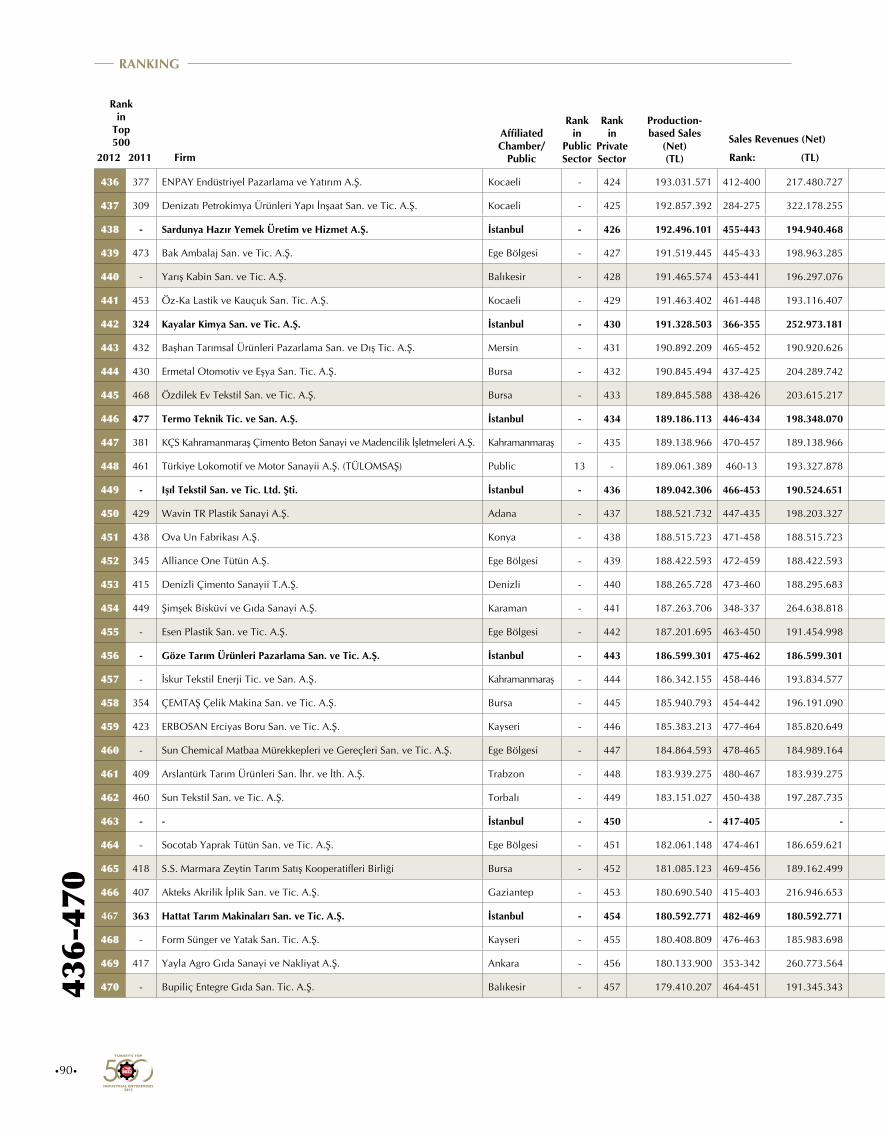
•90•
Rank: Rank: Rank: Rank:Rank:(TL) (TL) Rank: (TL) (TL) Number:($ 000)Firm2012 2011 Rank: (TL)
Gross Value Added (at Producers’ Prices) Equity Capital Total Assets Exports
Profit (Before Tax)/Loss for the Period
Average No. of Wage Employees
Rank in
Top 500
Affiliated Chamber/
Public
Rank in
Public Sector
Rank in
Private Sector
Production-based Sales
(Net) (TL)
Sales Revenues (Net)
Rank in
Top 5002012
436-
470
RANKING
436 377 ENPAY Endüstriyel Pazarlama ve Yatırım A.Ş. Kocaeli - 424 193.031.571 412-400 217.480.727 --- - --- - --- - --- - 173-172 81.386 --- - 436
437 309 Denizatı Petrokimya Ürünleri Yapı İnşaat San. ve Tic. A.Ş. Kocaeli - 425 192.857.392 284-275 322.178.255 428-415 18.060.939 370-358 68.669.989 299-287 268.249.261 357-351 6.007.432 --- - 498-485 44 437
438 - Sardunya Hazır Yemek Üretim ve Hizmet A.Ş. İstanbul - 426 192.496.101 455-443 194.940.468 219-209 77.801.496 480-467 12.642.980 495-482 60.841.589 324-318 8.490.765 --- - 41-33 3.084 438
439 473 Bak Ambalaj San. ve Tic. A.Ş. Ege Bölgesi - 427 191.519.445 445-433 198.963.285 336-323 42.175.648 358-346 73.365.502 408-395 154.856.851 296-290 10.607.619 182-181 76.964 346-334 388 439
440 - Yarış Kabin San. ve Tic. A.Ş. Balıkesir - 428 191.465.574 453-441 196.297.076 330-317 43.450.164 427-414 39.475.974 440-427 134.538.715 274-268 13.492.793 270-268 38.887 220-208 805 440
441 453 Öz-Ka Lastik ve Kauçuk San. Tic. A.Ş. Kocaeli - 429 191.463.402 461-448 193.116.407 370-357 35.746.402 448-435 29.269.388 433-420 143.862.867 264-258 14.941.477 221-219 56.226 482-469 130 441
442 324 Kayalar Kimya San. ve Tic. A.Ş. İstanbul - 430 191.328.503 366-355 252.973.181 296-283 52.030.363 378-366 62.616.367 403-390 164.680.607 314-308 9.236.969 337-335 21.673 373-360 328 442
443 432 Başhan Tarımsal Ürünleri Pazarlama San. ve Dış Tic. A.Ş. Mersin - 431 190.892.209 465-452 190.920.626 458-445 11.385.362 380-368 61.144.038 459-446 117.419.574 412-405 1.620.513 269-267 39.665 434-421 207 443
444 430 Ermetal Otomotiv ve Eşya San. Tic. A.Ş. Bursa - 432 190.845.494 437-425 204.289.742 --- - 435-422 34.967.596 430-417 146.490.131 --- - 397-393 7.458 234-222 712 444
445 468 Özdilek Ev Tekstil San. ve Tic. A.Ş. Bursa - 433 189.845.588 438-426 203.615.217 295-282 52.949.231 272-261 127.643.957 382-369 190.160.110 224-218 21.651.347 291-289 33.796 163-152 1.075 445
446 477 Termo Teknik Tic. ve San. A.Ş. İstanbul - 434 189.186.113 446-434 198.348.070 --- - 356-344 74.259.450 416-403 151.664.920 --- - 204-203 63.333 314-302 445 446
447 381 KÇS Kahramanmaraş Çimento Beton Sanayi ve Madencilik İşletmeleri A.Ş. Kahramanmaraş - 435 189.138.966 470-457 189.138.966 --- - 289-278 110.753.846 199-189 419.428.758 --- - 354-352 16.124 288-276 538 447
448 461 Türkiye Lokomotif ve Motor Sanayii A.Ş. (TÜLOMSAŞ) Public 13 - 189.061.389 460-13 193.327.878 189-10 90.749.508 225-11 162.191.400 360-13 207.669.833 454-8 -4.325.874 404-5 5.493 111-9 1.474 448
449 - Işıl Tekstil San. ve Tic. Ltd. Şti. İstanbul - 436 189.042.306 466-453 190.524.651 240-229 68.452.430 303-292 103.052.390 344-332 221.104.861 269-263 14.198.385 319-317 24.464 179-168 1.000 449
450 429 Wavin TR Plastik Sanayi A.Ş. Adana - 437 188.521.732 447-435 198.203.327 --- - --- - --- - --- - 279-277 36.702 --- - 450
451 438 Ova Un Fabrikası A.Ş. Konya - 438 188.515.723 471-458 188.515.723 422-409 19.401.791 322-311 93.690.059 458-445 118.412.000 288-282 11.936.801 --- - 466-453 159 451
452 345 Alliance One Tütün A.Ş. Ege Bölgesi - 439 188.422.593 472-459 188.422.593 --- - --- - 253-241 318.973.469 --- - 149-148 92.401 362-349 343 452
453 415 Denizli Çimento Sanayii T.A.Ş. Denizli - 440 188.265.728 473-460 188.295.683 251-240 64.472.689 252-241 143.999.473 386-373 183.456.302 147-142 39.727.628 336-334 21.937 414-401 258 453
454 449 Şimşek Bisküvi ve Gıda Sanayi A.Ş. Karaman - 441 187.263.706 348-337 264.638.818 --- - --- - --- - --- - --- - --- - 454
455 - Esen Plastik San. ve Tic. A.Ş. Ege Bölgesi - 442 187.201.695 463-450 191.454.998 411-398 22.297.306 379-367 61.555.143 341-329 222.331.878 392-386 2.765.031 400-396 6.008 377-364 320 455
456 - Göze Tarım Ürünleri Pazarlama San. ve Tic. A.Ş. İstanbul - 443 186.599.301 475-462 186.599.301 476-463 8.031.809 472-459 15.094.249 460-447 117.363.483 416-409 1.328.200 374-371 11.934 495-482 68 456
457 - İskur Tekstil Enerji Tic. ve San. A.Ş. Kahramanmaraş - 444 186.342.155 458-446 193.834.577 357-344 38.779.343 332-321 88.420.532 349-337 216.811.356 166-160 33.991.300 235-233 50.025 223-211 785 457
458 354 ÇEMTAŞ Çelik Makina San. ve Tic. A.Ş. Bursa - 445 185.940.793 454-442 196.191.090 417-404 21.342.084 238-227 153.974.988 396-383 175.486.838 439-432 -924.884 198-197 65.879 365-352 336 458
459 423 ERBOSAN Erciyas Boru San. ve Tic. A.Ş. Kayseri - 446 185.383.213 477-464 185.820.649 396-383 26.069.073 354-342 75.071.528 452-439 122.683.921 239-233 18.018.979 257-255 43.156 357-344 353 459
460 - Sun Chemical Matbaa Mürekkepleri ve Gereçleri San. ve Tic. A.Ş. Ege Bölgesi - 447 184.864.593 478-465 184.989.164 --- - --- - 356-344 211.442.527 --- - 409-404 5.273 464-451 161 460
461 409 Arslantürk Tarım Ürünleri San. İhr. ve İth. A.Ş. Trabzon - 448 183.939.275 480-467 183.939.275 486-473 5.344.992 474-461 14.197.817 498-485 53.819.192 403-396 2.026.738 229-227 52.458 431-418 210 461
462 460 Sun Tekstil San. ve Tic. A.Ş. Torbalı - 449 183.151.027 450-438 197.287.735 445-432 14.337.752 429-416 38.405.403 478-465 94.215.333 320-314 8.654.704 127-126 104.162 448-435 180 462
463 - - İstanbul - 450 - 417-405 - 319-306 - 348-337 - 401-388 - 164-158 - 384-381 - 398-385 - 463
464 - Socotab Yaprak Tütün San. ve Tic. A.Ş. Ege Bölgesi - 451 182.061.148 474-461 186.659.621 --- - 338-327 84.889.180 328-316 240.564.323 --- - 161-160 87.478 287-275 540 464
465 418 S.S. Marmara Zeytin Tarım Satış Kooperatifleri Birliği Bursa - 452 181.085.123 469-456 189.162.499 346-333 40.260.229 246-235 146.509.274 293-281 277.017.623 244-238 17.452.524 338-336 21.367 289-277 538 465
466 407 Akteks Akrilik İplik San. ve Tic. A.Ş. Gaziantep - 453 180.690.540 415-403 216.946.653 374-361 34.581.408 365-353 69.987.007 268-256 298.264.599 350-344 6.305.413 240-238 48.935 225-213 768 466
467 363 Hattat Tarım Makinaları San. ve Tic. A.Ş. İstanbul - 454 180.592.771 482-469 180.592.771 413-400 21.942.910 428-415 39.306.322 417-404 151.334.641 343-337 7.280.843 356-354 16.002 388-375 308 467
468 - Form Sünger ve Yatak San. Tic. A.Ş. Kayseri - 455 180.408.809 476-463 185.983.698 324-311 44.167.311 367-355 69.635.414 475-462 97.315.012 186-180 29.389.660 382-379 10.921 435-422 207 468
469 417 Yayla Agro Gıda Sanayi ve Nakliyat A.Ş. Ankara - 456 180.133.900 353-342 260.773.564 416-403 21.473.081 444-431 31.208.727 340-328 222.661.684 377-371 3.960.994 256-254 43.157 429-416 215 469
470 - Bupiliç Entegre Gıda San. Tic. A.Ş. Balıkesir - 457 179.410.207 464-451 191.345.343 425-412 18.898.883 475-462 14.133.868 483-470 87.269.758 407-400 1.960.416 301-299 29.361 252-240 654 470
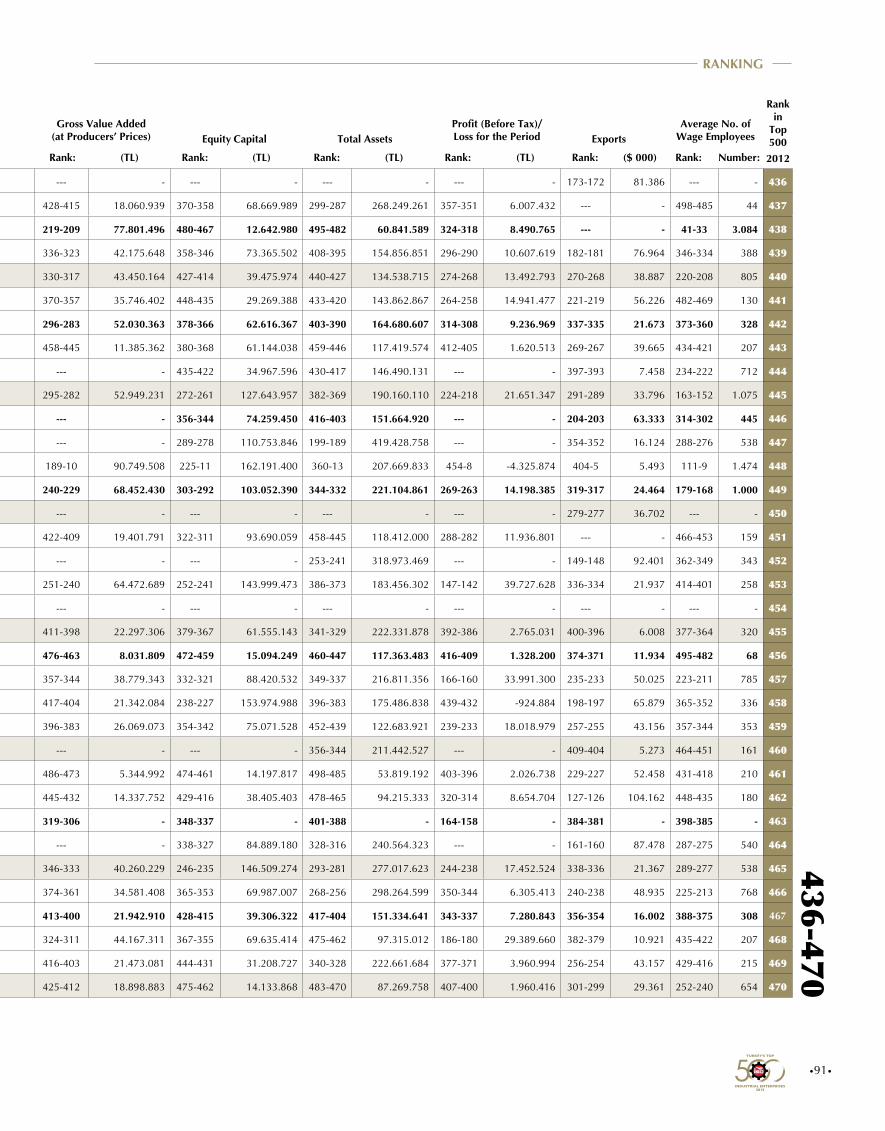
•91•
Rank: Rank: Rank: Rank:Rank:(TL) (TL) Rank: (TL) (TL) Number:($ 000)Firm2012 2011 Rank: (TL)
Gross Value Added (at Producers’ Prices) Equity Capital Total Assets Exports
Profit (Before Tax)/Loss for the Period
Average No. of Wage Employees
Rank in
Top 500
Affiliated Chamber/
Public
Rank in
Public Sector
Rank in
Private Sector
Production-based Sales
(Net) (TL)
Sales Revenues (Net)
Rank in
Top 5002012
436-470RANKING
436 377 ENPAY Endüstriyel Pazarlama ve Yatırım A.Ş. Kocaeli - 424 193.031.571 412-400 217.480.727 --- - --- - --- - --- - 173-172 81.386 --- - 436
437 309 Denizatı Petrokimya Ürünleri Yapı İnşaat San. ve Tic. A.Ş. Kocaeli - 425 192.857.392 284-275 322.178.255 428-415 18.060.939 370-358 68.669.989 299-287 268.249.261 357-351 6.007.432 --- - 498-485 44 437
438 - Sardunya Hazır Yemek Üretim ve Hizmet A.Ş. İstanbul - 426 192.496.101 455-443 194.940.468 219-209 77.801.496 480-467 12.642.980 495-482 60.841.589 324-318 8.490.765 --- - 41-33 3.084 438
439 473 Bak Ambalaj San. ve Tic. A.Ş. Ege Bölgesi - 427 191.519.445 445-433 198.963.285 336-323 42.175.648 358-346 73.365.502 408-395 154.856.851 296-290 10.607.619 182-181 76.964 346-334 388 439
440 - Yarış Kabin San. ve Tic. A.Ş. Balıkesir - 428 191.465.574 453-441 196.297.076 330-317 43.450.164 427-414 39.475.974 440-427 134.538.715 274-268 13.492.793 270-268 38.887 220-208 805 440
441 453 Öz-Ka Lastik ve Kauçuk San. Tic. A.Ş. Kocaeli - 429 191.463.402 461-448 193.116.407 370-357 35.746.402 448-435 29.269.388 433-420 143.862.867 264-258 14.941.477 221-219 56.226 482-469 130 441
442 324 Kayalar Kimya San. ve Tic. A.Ş. İstanbul - 430 191.328.503 366-355 252.973.181 296-283 52.030.363 378-366 62.616.367 403-390 164.680.607 314-308 9.236.969 337-335 21.673 373-360 328 442
443 432 Başhan Tarımsal Ürünleri Pazarlama San. ve Dış Tic. A.Ş. Mersin - 431 190.892.209 465-452 190.920.626 458-445 11.385.362 380-368 61.144.038 459-446 117.419.574 412-405 1.620.513 269-267 39.665 434-421 207 443
444 430 Ermetal Otomotiv ve Eşya San. Tic. A.Ş. Bursa - 432 190.845.494 437-425 204.289.742 --- - 435-422 34.967.596 430-417 146.490.131 --- - 397-393 7.458 234-222 712 444
445 468 Özdilek Ev Tekstil San. ve Tic. A.Ş. Bursa - 433 189.845.588 438-426 203.615.217 295-282 52.949.231 272-261 127.643.957 382-369 190.160.110 224-218 21.651.347 291-289 33.796 163-152 1.075 445
446 477 Termo Teknik Tic. ve San. A.Ş. İstanbul - 434 189.186.113 446-434 198.348.070 --- - 356-344 74.259.450 416-403 151.664.920 --- - 204-203 63.333 314-302 445 446
447 381 KÇS Kahramanmaraş Çimento Beton Sanayi ve Madencilik İşletmeleri A.Ş. Kahramanmaraş - 435 189.138.966 470-457 189.138.966 --- - 289-278 110.753.846 199-189 419.428.758 --- - 354-352 16.124 288-276 538 447
448 461 Türkiye Lokomotif ve Motor Sanayii A.Ş. (TÜLOMSAŞ) Public 13 - 189.061.389 460-13 193.327.878 189-10 90.749.508 225-11 162.191.400 360-13 207.669.833 454-8 -4.325.874 404-5 5.493 111-9 1.474 448
449 - Işıl Tekstil San. ve Tic. Ltd. Şti. İstanbul - 436 189.042.306 466-453 190.524.651 240-229 68.452.430 303-292 103.052.390 344-332 221.104.861 269-263 14.198.385 319-317 24.464 179-168 1.000 449
450 429 Wavin TR Plastik Sanayi A.Ş. Adana - 437 188.521.732 447-435 198.203.327 --- - --- - --- - --- - 279-277 36.702 --- - 450
451 438 Ova Un Fabrikası A.Ş. Konya - 438 188.515.723 471-458 188.515.723 422-409 19.401.791 322-311 93.690.059 458-445 118.412.000 288-282 11.936.801 --- - 466-453 159 451
452 345 Alliance One Tütün A.Ş. Ege Bölgesi - 439 188.422.593 472-459 188.422.593 --- - --- - 253-241 318.973.469 --- - 149-148 92.401 362-349 343 452
453 415 Denizli Çimento Sanayii T.A.Ş. Denizli - 440 188.265.728 473-460 188.295.683 251-240 64.472.689 252-241 143.999.473 386-373 183.456.302 147-142 39.727.628 336-334 21.937 414-401 258 453
454 449 Şimşek Bisküvi ve Gıda Sanayi A.Ş. Karaman - 441 187.263.706 348-337 264.638.818 --- - --- - --- - --- - --- - --- - 454
455 - Esen Plastik San. ve Tic. A.Ş. Ege Bölgesi - 442 187.201.695 463-450 191.454.998 411-398 22.297.306 379-367 61.555.143 341-329 222.331.878 392-386 2.765.031 400-396 6.008 377-364 320 455
456 - Göze Tarım Ürünleri Pazarlama San. ve Tic. A.Ş. İstanbul - 443 186.599.301 475-462 186.599.301 476-463 8.031.809 472-459 15.094.249 460-447 117.363.483 416-409 1.328.200 374-371 11.934 495-482 68 456
457 - İskur Tekstil Enerji Tic. ve San. A.Ş. Kahramanmaraş - 444 186.342.155 458-446 193.834.577 357-344 38.779.343 332-321 88.420.532 349-337 216.811.356 166-160 33.991.300 235-233 50.025 223-211 785 457
458 354 ÇEMTAŞ Çelik Makina San. ve Tic. A.Ş. Bursa - 445 185.940.793 454-442 196.191.090 417-404 21.342.084 238-227 153.974.988 396-383 175.486.838 439-432 -924.884 198-197 65.879 365-352 336 458
459 423 ERBOSAN Erciyas Boru San. ve Tic. A.Ş. Kayseri - 446 185.383.213 477-464 185.820.649 396-383 26.069.073 354-342 75.071.528 452-439 122.683.921 239-233 18.018.979 257-255 43.156 357-344 353 459
460 - Sun Chemical Matbaa Mürekkepleri ve Gereçleri San. ve Tic. A.Ş. Ege Bölgesi - 447 184.864.593 478-465 184.989.164 --- - --- - 356-344 211.442.527 --- - 409-404 5.273 464-451 161 460
461 409 Arslantürk Tarım Ürünleri San. İhr. ve İth. A.Ş. Trabzon - 448 183.939.275 480-467 183.939.275 486-473 5.344.992 474-461 14.197.817 498-485 53.819.192 403-396 2.026.738 229-227 52.458 431-418 210 461
462 460 Sun Tekstil San. ve Tic. A.Ş. Torbalı - 449 183.151.027 450-438 197.287.735 445-432 14.337.752 429-416 38.405.403 478-465 94.215.333 320-314 8.654.704 127-126 104.162 448-435 180 462
463 - - İstanbul - 450 - 417-405 - 319-306 - 348-337 - 401-388 - 164-158 - 384-381 - 398-385 - 463
464 - Socotab Yaprak Tütün San. ve Tic. A.Ş. Ege Bölgesi - 451 182.061.148 474-461 186.659.621 --- - 338-327 84.889.180 328-316 240.564.323 --- - 161-160 87.478 287-275 540 464
465 418 S.S. Marmara Zeytin Tarım Satış Kooperatifleri Birliği Bursa - 452 181.085.123 469-456 189.162.499 346-333 40.260.229 246-235 146.509.274 293-281 277.017.623 244-238 17.452.524 338-336 21.367 289-277 538 465
466 407 Akteks Akrilik İplik San. ve Tic. A.Ş. Gaziantep - 453 180.690.540 415-403 216.946.653 374-361 34.581.408 365-353 69.987.007 268-256 298.264.599 350-344 6.305.413 240-238 48.935 225-213 768 466
467 363 Hattat Tarım Makinaları San. ve Tic. A.Ş. İstanbul - 454 180.592.771 482-469 180.592.771 413-400 21.942.910 428-415 39.306.322 417-404 151.334.641 343-337 7.280.843 356-354 16.002 388-375 308 467
468 - Form Sünger ve Yatak San. Tic. A.Ş. Kayseri - 455 180.408.809 476-463 185.983.698 324-311 44.167.311 367-355 69.635.414 475-462 97.315.012 186-180 29.389.660 382-379 10.921 435-422 207 468
469 417 Yayla Agro Gıda Sanayi ve Nakliyat A.Ş. Ankara - 456 180.133.900 353-342 260.773.564 416-403 21.473.081 444-431 31.208.727 340-328 222.661.684 377-371 3.960.994 256-254 43.157 429-416 215 469
470 - Bupiliç Entegre Gıda San. Tic. A.Ş. Balıkesir - 457 179.410.207 464-451 191.345.343 425-412 18.898.883 475-462 14.133.868 483-470 87.269.758 407-400 1.960.416 301-299 29.361 252-240 654 470
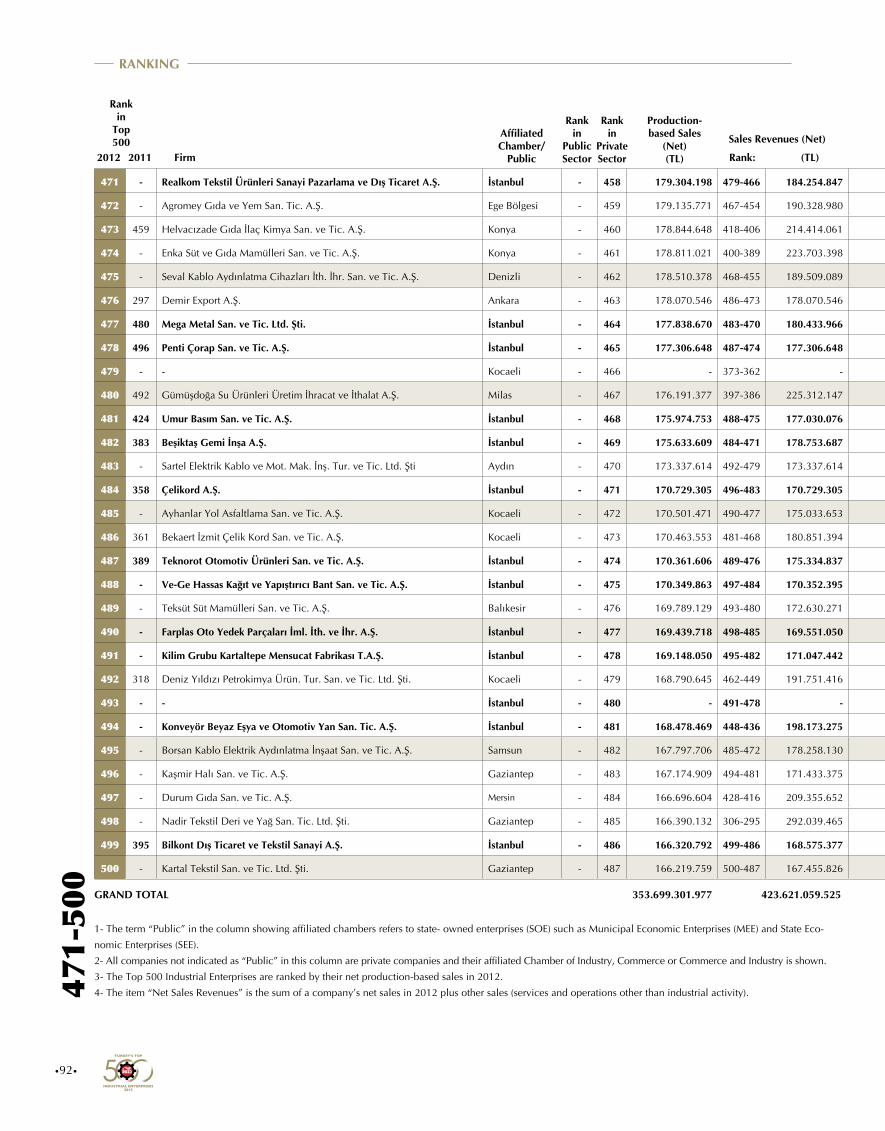
•92•
Rank: Rank: Rank: Rank:Rank:(TL) (TL) Rank: (TL) (TL) Number:($ 000)Firm2012 2011 Rank: (TL)
Gross Value Added (at Producers’ Prices) Equity Capital Total Assets Exports
Profit (Before Tax)/Loss for the Period
Average No. of Wage Employees
Rank in
Top 500
Affiliated Chamber/
Public
Rank in
Public Sector
Rank in
Private Sector
Production-based Sales
(Net) (TL)
Sales Revenues (Net)
Rank in
Top 5002012
471-
500
1- The term “Public” in the column showing affiliated chambers refers to state- owned enterprises (SOE) such as Municipal Economic Enterprises (MEE) and State Eco-
nomic Enterprises (SEE).
2- All companies not indicated as “Public” in this column are private companies and their affiliated Chamber of Industry, Commerce or Commerce and Industry is shown.
3- The Top 500 Industrial Enterprises are ranked by their net production-based sales in 2012.
4- The item “Net Sales Revenues” is the sum of a company’s net sales in 2012 plus other sales (services and operations other than industrial activity).
GRAND TOTAL
RANKING
471 - Realkom Tekstil Ürünleri Sanayi Pazarlama ve Dış Ticaret A.Ş. İstanbul - 458 179.304.198 479-466 184.254.847 420-407 20.237.572 465-452 17.133.694 484-471 86.026.180 356-350 6.019.051 441-436 1.234 394-381 298 471
472 - Agromey Gıda ve Yem San. Tic. A.Ş. Ege Bölgesi - 459 179.135.771 467-454 190.328.980 --- - --- - 305-293 260.298.079 --- - 304-302 28.503 309-297 456 472
473 459 Helvacızade Gıda İlaç Kimya San. ve Tic. A.Ş. Konya - 460 178.844.648 418-406 214.414.061 --- - --- - --- - --- - 366-363 13.655 450-437 177 473
474 - Enka Süt ve Gıda Mamülleri San. ve Tic. A.Ş. Konya - 461 178.811.021 400-389 223.703.398 --- - --- - --- - --- - 438-433 1.435 --- - 474
475 - Seval Kablo Aydınlatma Cihazları İth. İhr. San. ve Tic. A.Ş. Denizli - 462 178.510.378 468-455 189.509.089 438-425 15.691.799 464-451 17.198.831 486-473 82.927.263 415-408 1.378.094 185-184 74.942 457-444 165 475
476 297 Demir Export A.Ş. Ankara - 463 178.070.546 486-473 178.070.546 --- - --- - --- - --- - --- - --- - 476
477 480 Mega Metal San. ve Tic. Ltd. Şti. İstanbul - 464 177.838.670 483-470 180.433.966 --- - --- - --- - --- - 264-262 42.049 --- - 477
478 496 Penti Çorap San. ve Tic. A.Ş. İstanbul - 465 177.306.648 487-474 177.306.648 229-218 72.532.983 267-256 130.791.369 390-377 179.511.625 168-162 33.377.345 --- - 160-149 1.081 478
479 - - Kocaeli - 466 - 373-362 - 325-312 - 191-182 - 359-347 - 156-151 - 292-290 - 449-436 - 479
480 492 Gümüşdoğa Su Ürünleri Üretim İhracat ve İthalat A.Ş. Milas - 467 176.191.377 397-386 225.312.147 315-302 46.143.092 319-308 94.768.206 404-391 160.980.226 165-159 34.290.846 339-337 21.039 251-239 658 480
481 424 Umur Basım San. ve Tic. A.Ş. İstanbul - 468 175.974.753 488-475 177.030.076 --- - --- - 372-359 198.846.470 --- - 436-431 1.590 379-366 318 481
482 383 Beşiktaş Gemi İnşa A.Ş. İstanbul - 469 175.633.609 484-471 178.753.687 --- - --- - --- - --- - 137-136 97.767 --- - 482
483 - Sartel Elektrik Kablo ve Mot. Mak. İnş. Tur. ve Tic. Ltd. Şti Aydın - 470 173.337.614 492-479 173.337.614 482-469 6.791.190 479-466 13.372.136 493-480 70.985.490 414-407 1.495.351 230-228 51.618 470-457 155 483
484 358 Çelikord A.Ş. İstanbul - 471 170.729.305 496-483 170.729.305 352-339 39.565.201 363-351 70.473.124 469-456 108.327.786 319-313 8.803.216 220-218 56.336 333-321 419 484
485 - Ayhanlar Yol Asfaltlama San. ve Tic. A.Ş. Kocaeli - 472 170.501.471 490-477 175.033.653 409-396 23.621.643 294-283 108.990.339 235-224 337.966.153 424-417 1.020.137 455-450 57 344-332 396 485
486 361 Bekaert İzmit Çelik Kord San. ve Tic. A.Ş. Kocaeli - 473 170.463.553 481-468 180.851.394 --- - 304-293 102.134.106 428-415 147.053.524 --- - 326-324 23.769 316-304 440 486
487 389 Teknorot Otomotiv Ürünleri San. ve Tic. A.Ş. İstanbul - 474 170.361.606 489-476 175.334.837 191-181 90.006.185 382-370 60.710.954 410-397 154.037.398 297-291 10.569.241 165-164 86.593 121-112 1.390 487
488 - Ve-Ge Hassas Kağıt ve Yapıştırıcı Bant San. ve Tic. A.Ş. İstanbul - 475 170.349.863 497-484 170.352.395 --- - --- - --- - --- - --- - --- - 488
489 - Teksüt Süt Mamülleri San. ve Tic. A.Ş. Balıkesir - 476 169.789.129 493-480 172.630.271 472-459 8.664.119 412-400 45.852.701 481-468 90.160.928 376-370 4.013.047 421-416 4.023 403-390 280 489
490 - Farplas Oto Yedek Parçaları İml. İth. ve İhr. A.Ş. İstanbul - 477 169.439.718 498-485 169.551.050 329-316 43.655.834 409-397 48.800.636 411-398 153.875.061 306-300 9.933.371 372-369 12.805 311-299 450 490
491 - Kilim Grubu Kartaltepe Mensucat Fabrikası T.A.Ş. İstanbul - 478 169.148.050 495-482 171.047.442 331-318 43.414.578 234-223 155.071.392 389-376 179.712.559 396-389 2.517.629 346-344 18.744 201-190 886 491
492 318 Deniz Yıldızı Petrokimya Ürün. Tur. San. ve Tic. Ltd. Şti. Kocaeli - 479 168.790.645 462-449 191.751.416 460-447 11.332.262 441-428 33.244.719 492-479 71.217.351 339-333 7.536.865 --- - 496-483 49 492
493 - - İstanbul - 480 - 491-478 - 360-347 - 286-275 - 434-421 - 348-342 - 201-200 - 146-137 - 493
494 - Konveyör Beyaz Eşya ve Otomotiv Yan San. Tic. A.Ş. İstanbul - 481 168.478.469 448-436 198.173.275 366-353 37.087.499 446-433 29.693.104 479-466 91.478.392 360-354 5.816.306 343-341 19.715 169-158 1.050 494
495 - Borsan Kablo Elektrik Aydınlatma İnşaat San. ve Tic. A.Ş. Samsun - 482 167.797.706 485-472 178.258.130 452-439 12.829.189 426-413 39.491.668 465-452 113.516.868 379-373 3.783.341 309-307 27.478 442-429 190 495
496 - Kaşmir Halı San. ve Tic. A.Ş. Gaziantep - 483 167.174.909 494-481 171.433.375 --- - --- - --- - --- - --- - 257-245 642 496
497 - Durum Gıda San. ve Tic. A.Ş. Mersin - 484 166.696.604 428-416 209.355.652 468-455 9.367.023 440-427 33.358.080 392-379 178.072.449 457-449 -5.155.039 236-234 49.709 476-463 146 497
498 - Nadir Tekstil Deri ve Yağ San. Tic. Ltd. Şti. Gaziantep - 485 166.390.132 306-295 292.039.465 478-465 7.708.053 458-445 20.010.081 497-484 58.579.821 408-401 1.921.284 285-283 35.639 461-448 164 498
499 395 Bilkont Dış Ticaret ve Tekstil Sanayi A.Ş. İstanbul - 486 166.320.792 499-486 168.575.377 --- - 271-260 127.873.213 212-201 391.362.706 --- - 274-272 37.757 236-224 711 499
500 - Kartal Tekstil San. ve Tic. Ltd. Şti. Gaziantep - 487 166.219.759 500-487 167.455.826 353-340 39.557.566 401-389 54.107.456 447-434 128.247.982 270-264 14.183.516 457-452 22 207-196 854 500
423.621.059.525353.699.301.977
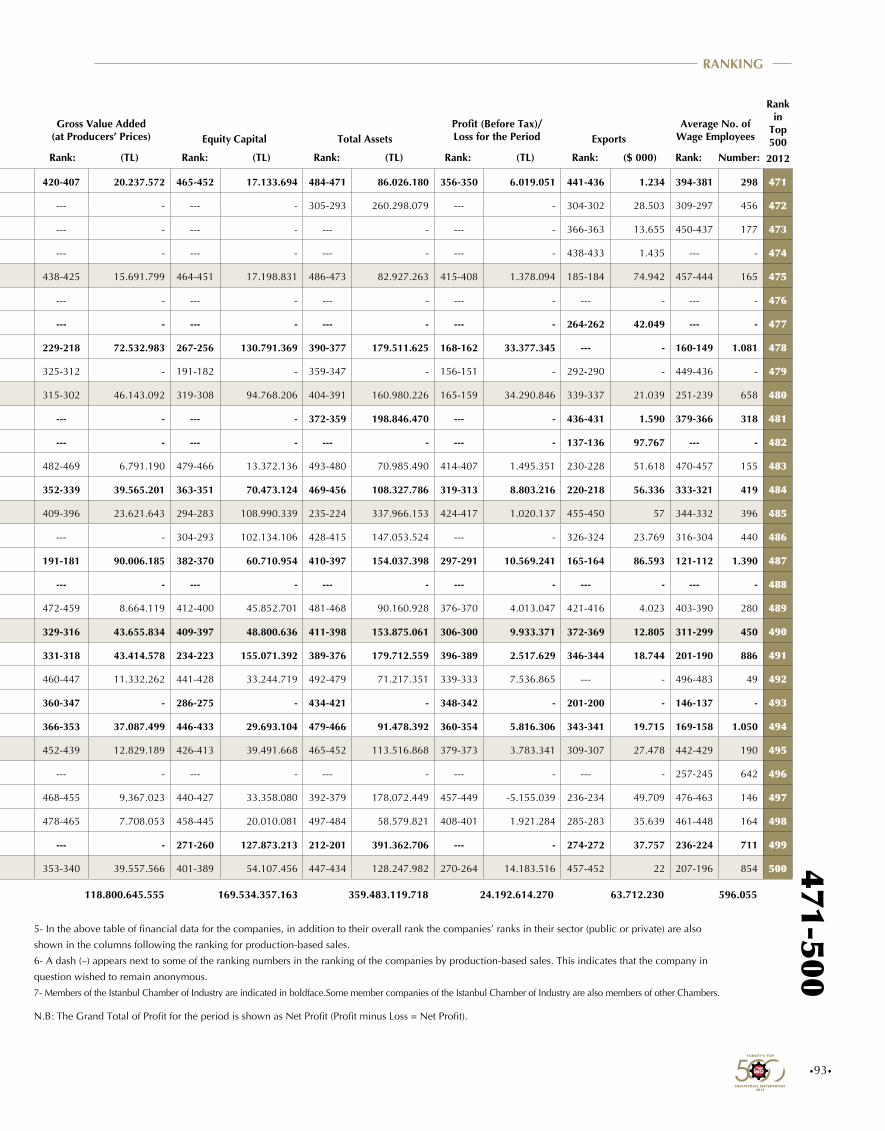
•93•
Rank: Rank: Rank: Rank:Rank:(TL) (TL) Rank: (TL) (TL) Number:($ 000)Firm2012 2011 Rank: (TL)
Gross Value Added (at Producers’ Prices) Equity Capital Total Assets Exports
Profit (Before Tax)/Loss for the Period
Average No. of Wage Employees
Rank in
Top 500
Affiliated Chamber/
Public
Rank in
Public Sector
Rank in
Private Sector
Production-based Sales
(Net) (TL)
Sales Revenues (Net)
Rank in
Top 5002012
471-500
5- In the above table of financial data for the companies, in addition to their overall rank the companies’ ranks in their sector (public or private) are also
shown in the columns following the ranking for production-based sales.
6- A dash (–) appears next to some of the ranking numbers in the ranking of the companies by production-based sales. This indicates that the company in
question wished to remain anonymous.
7- Members of the Istanbul Chamber of Industry are indicated in boldface.Some member companies of the Istanbul Chamber of Industry are also members of other Chambers.
N.B: The Grand Total of Profit for the period is shown as Net Profit (Profit minus Loss = Net Profit).
RANKING
471 - Realkom Tekstil Ürünleri Sanayi Pazarlama ve Dış Ticaret A.Ş. İstanbul - 458 179.304.198 479-466 184.254.847 420-407 20.237.572 465-452 17.133.694 484-471 86.026.180 356-350 6.019.051 441-436 1.234 394-381 298 471
472 - Agromey Gıda ve Yem San. Tic. A.Ş. Ege Bölgesi - 459 179.135.771 467-454 190.328.980 --- - --- - 305-293 260.298.079 --- - 304-302 28.503 309-297 456 472
473 459 Helvacızade Gıda İlaç Kimya San. ve Tic. A.Ş. Konya - 460 178.844.648 418-406 214.414.061 --- - --- - --- - --- - 366-363 13.655 450-437 177 473
474 - Enka Süt ve Gıda Mamülleri San. ve Tic. A.Ş. Konya - 461 178.811.021 400-389 223.703.398 --- - --- - --- - --- - 438-433 1.435 --- - 474
475 - Seval Kablo Aydınlatma Cihazları İth. İhr. San. ve Tic. A.Ş. Denizli - 462 178.510.378 468-455 189.509.089 438-425 15.691.799 464-451 17.198.831 486-473 82.927.263 415-408 1.378.094 185-184 74.942 457-444 165 475
476 297 Demir Export A.Ş. Ankara - 463 178.070.546 486-473 178.070.546 --- - --- - --- - --- - --- - --- - 476
477 480 Mega Metal San. ve Tic. Ltd. Şti. İstanbul - 464 177.838.670 483-470 180.433.966 --- - --- - --- - --- - 264-262 42.049 --- - 477
478 496 Penti Çorap San. ve Tic. A.Ş. İstanbul - 465 177.306.648 487-474 177.306.648 229-218 72.532.983 267-256 130.791.369 390-377 179.511.625 168-162 33.377.345 --- - 160-149 1.081 478
479 - - Kocaeli - 466 - 373-362 - 325-312 - 191-182 - 359-347 - 156-151 - 292-290 - 449-436 - 479
480 492 Gümüşdoğa Su Ürünleri Üretim İhracat ve İthalat A.Ş. Milas - 467 176.191.377 397-386 225.312.147 315-302 46.143.092 319-308 94.768.206 404-391 160.980.226 165-159 34.290.846 339-337 21.039 251-239 658 480
481 424 Umur Basım San. ve Tic. A.Ş. İstanbul - 468 175.974.753 488-475 177.030.076 --- - --- - 372-359 198.846.470 --- - 436-431 1.590 379-366 318 481
482 383 Beşiktaş Gemi İnşa A.Ş. İstanbul - 469 175.633.609 484-471 178.753.687 --- - --- - --- - --- - 137-136 97.767 --- - 482
483 - Sartel Elektrik Kablo ve Mot. Mak. İnş. Tur. ve Tic. Ltd. Şti Aydın - 470 173.337.614 492-479 173.337.614 482-469 6.791.190 479-466 13.372.136 493-480 70.985.490 414-407 1.495.351 230-228 51.618 470-457 155 483
484 358 Çelikord A.Ş. İstanbul - 471 170.729.305 496-483 170.729.305 352-339 39.565.201 363-351 70.473.124 469-456 108.327.786 319-313 8.803.216 220-218 56.336 333-321 419 484
485 - Ayhanlar Yol Asfaltlama San. ve Tic. A.Ş. Kocaeli - 472 170.501.471 490-477 175.033.653 409-396 23.621.643 294-283 108.990.339 235-224 337.966.153 424-417 1.020.137 455-450 57 344-332 396 485
486 361 Bekaert İzmit Çelik Kord San. ve Tic. A.Ş. Kocaeli - 473 170.463.553 481-468 180.851.394 --- - 304-293 102.134.106 428-415 147.053.524 --- - 326-324 23.769 316-304 440 486
487 389 Teknorot Otomotiv Ürünleri San. ve Tic. A.Ş. İstanbul - 474 170.361.606 489-476 175.334.837 191-181 90.006.185 382-370 60.710.954 410-397 154.037.398 297-291 10.569.241 165-164 86.593 121-112 1.390 487
488 - Ve-Ge Hassas Kağıt ve Yapıştırıcı Bant San. ve Tic. A.Ş. İstanbul - 475 170.349.863 497-484 170.352.395 --- - --- - --- - --- - --- - --- - 488
489 - Teksüt Süt Mamülleri San. ve Tic. A.Ş. Balıkesir - 476 169.789.129 493-480 172.630.271 472-459 8.664.119 412-400 45.852.701 481-468 90.160.928 376-370 4.013.047 421-416 4.023 403-390 280 489
490 - Farplas Oto Yedek Parçaları İml. İth. ve İhr. A.Ş. İstanbul - 477 169.439.718 498-485 169.551.050 329-316 43.655.834 409-397 48.800.636 411-398 153.875.061 306-300 9.933.371 372-369 12.805 311-299 450 490
491 - Kilim Grubu Kartaltepe Mensucat Fabrikası T.A.Ş. İstanbul - 478 169.148.050 495-482 171.047.442 331-318 43.414.578 234-223 155.071.392 389-376 179.712.559 396-389 2.517.629 346-344 18.744 201-190 886 491
492 318 Deniz Yıldızı Petrokimya Ürün. Tur. San. ve Tic. Ltd. Şti. Kocaeli - 479 168.790.645 462-449 191.751.416 460-447 11.332.262 441-428 33.244.719 492-479 71.217.351 339-333 7.536.865 --- - 496-483 49 492
493 - - İstanbul - 480 - 491-478 - 360-347 - 286-275 - 434-421 - 348-342 - 201-200 - 146-137 - 493
494 - Konveyör Beyaz Eşya ve Otomotiv Yan San. Tic. A.Ş. İstanbul - 481 168.478.469 448-436 198.173.275 366-353 37.087.499 446-433 29.693.104 479-466 91.478.392 360-354 5.816.306 343-341 19.715 169-158 1.050 494
495 - Borsan Kablo Elektrik Aydınlatma İnşaat San. ve Tic. A.Ş. Samsun - 482 167.797.706 485-472 178.258.130 452-439 12.829.189 426-413 39.491.668 465-452 113.516.868 379-373 3.783.341 309-307 27.478 442-429 190 495
496 - Kaşmir Halı San. ve Tic. A.Ş. Gaziantep - 483 167.174.909 494-481 171.433.375 --- - --- - --- - --- - --- - 257-245 642 496
497 - Durum Gıda San. ve Tic. A.Ş. Mersin - 484 166.696.604 428-416 209.355.652 468-455 9.367.023 440-427 33.358.080 392-379 178.072.449 457-449 -5.155.039 236-234 49.709 476-463 146 497
498 - Nadir Tekstil Deri ve Yağ San. Tic. Ltd. Şti. Gaziantep - 485 166.390.132 306-295 292.039.465 478-465 7.708.053 458-445 20.010.081 497-484 58.579.821 408-401 1.921.284 285-283 35.639 461-448 164 498
499 395 Bilkont Dış Ticaret ve Tekstil Sanayi A.Ş. İstanbul - 486 166.320.792 499-486 168.575.377 --- - 271-260 127.873.213 212-201 391.362.706 --- - 274-272 37.757 236-224 711 499
500 - Kartal Tekstil San. ve Tic. Ltd. Şti. Gaziantep - 487 166.219.759 500-487 167.455.826 353-340 39.557.566 401-389 54.107.456 447-434 128.247.982 270-264 14.183.516 457-452 22 207-196 854 500
118.800.645.555 169.534.357.163 359.483.119.718 24.192.614.270 596.05563.712.230
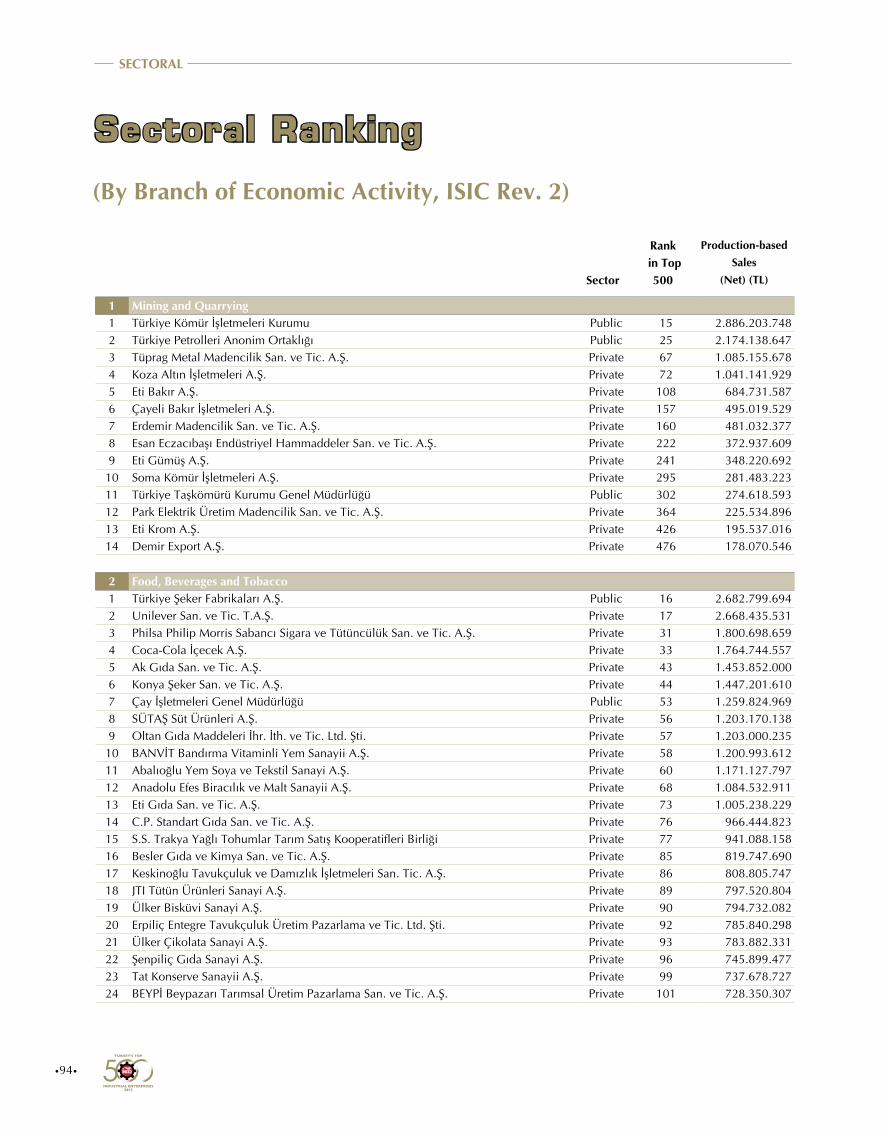
•94•
SECTORAL
Sectoral Ranking
Sector
Rank in Top
500
(By Branch of Economic Activity, ISIC Rev. 2)
Production-based Sales
(Net) (TL)
1 Mining and Quarrying1 Türkiye Kömür İşletmeleri Kurumu Public 15 2.886.203.7482 Türkiye Petrolleri Anonim Ortaklığı Public 25 2.174.138.6473 Tüprag Metal Madencilik San. ve Tic. A.Ş. Private 67 1.085.155.6784 Koza Altın İşletmeleri A.Ş. Private 72 1.041.141.9295 Eti Bakır A.Ş. Private 108 684.731.5876 Çayeli Bakır İşletmeleri A.Ş. Private 157 495.019.5297 Erdemir Madencilik San. ve Tic. A.Ş. Private 160 481.032.3778 Esan Eczacıbaşı Endüstriyel Hammaddeler San. ve Tic. A.Ş. Private 222 372.937.6099 Eti Gümüş A.Ş. Private 241 348.220.692
10 Soma Kömür İşletmeleri A.Ş. Private 295 281.483.22311 Türkiye Taşkömürü Kurumu Genel Müdürlüğü Public 302 274.618.59312 Park Elektrik Üretim Madencilik San. ve Tic. A.Ş. Private 364 225.534.89613 Eti Krom A.Ş. Private 426 195.537.01614 Demir Export A.Ş. Private 476 178.070.546
2 Food, Beverages and Tobacco1 Türkiye Şeker Fabrikaları A.Ş. Public 16 2.682.799.6942 Unilever San. ve Tic. T.A.Ş. Private 17 2.668.435.5313 Philsa Philip Morris Sabancı Sigara ve Tütüncülük San. ve Tic. A.Ş. Private 31 1.800.698.6594 Coca-Cola İçecek A.Ş. Private 33 1.764.744.5575 Ak Gıda San. ve Tic. A.Ş. Private 43 1.453.852.0006 Konya Şeker San. ve Tic. A.Ş. Private 44 1.447.201.6107 Çay İşletmeleri Genel Müdürlüğü Public 53 1.259.824.9698 SÜTAŞ Süt Ürünleri A.Ş. Private 56 1.203.170.1389 Oltan Gıda Maddeleri İhr. İth. ve Tic. Ltd. Şti. Private 57 1.203.000.235
10 BANVİT Bandırma Vitaminli Yem Sanayii A.Ş. Private 58 1.200.993.61211 Abalıoğlu Yem Soya ve Tekstil Sanayi A.Ş. Private 60 1.171.127.79712 Anadolu Efes Biracılık ve Malt Sanayii A.Ş. Private 68 1.084.532.91113 Eti Gıda San. ve Tic. A.Ş. Private 73 1.005.238.22914 C.P. Standart Gıda San. ve Tic. A.Ş. Private 76 966.444.82315 S.S. Trakya Yağlı Tohumlar Tarım Satış Kooperatifleri Birliği Private 77 941.088.15816 Besler Gıda ve Kimya San. ve Tic. A.Ş. Private 85 819.747.69017 Keskinoğlu Tavukçuluk ve Damızlık İşletmeleri San. Tic. A.Ş. Private 86 808.805.74718 JTI Tütün Ürünleri Sanayi A.Ş. Private 89 797.520.80419 Ülker Bisküvi Sanayi A.Ş. Private 90 794.732.08220 Erpiliç Entegre Tavukçuluk Üretim Pazarlama ve Tic. Ltd. Şti. Private 92 785.840.29821 Ülker Çikolata Sanayi A.Ş. Private 93 783.882.33122 Şenpiliç Gıda Sanayi A.Ş. Private 96 745.899.47723 Tat Konserve Sanayii A.Ş. Private 99 737.678.72724 BEYPİ Beypazarı Tarımsal Üretim Pazarlama San. ve Tic. A.Ş. Private 101 728.350.307
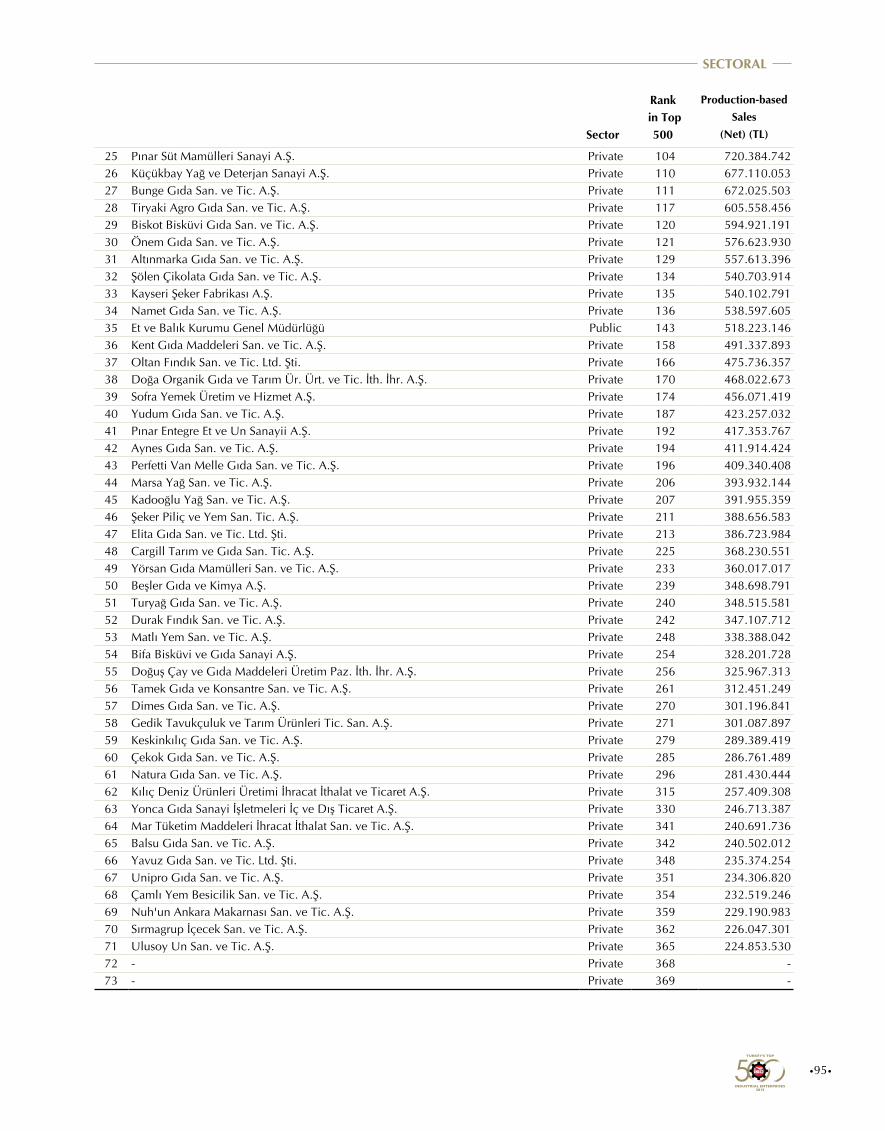
•95•
SECTORAL
Sector
Rank in Top
500
Production-based Sales
(Net) (TL)
25 Pınar Süt Mamülleri Sanayi A.Ş. Private 104 720.384.74226 Küçükbay Yağ ve Deterjan Sanayi A.Ş. Private 110 677.110.05327 Bunge Gıda San. ve Tic. A.Ş. Private 111 672.025.50328 Tiryaki Agro Gıda San. ve Tic. A.Ş. Private 117 605.558.45629 Biskot Bisküvi Gıda San. ve Tic. A.Ş. Private 120 594.921.19130 Önem Gıda San. ve Tic. A.Ş. Private 121 576.623.93031 Altınmarka Gıda San. ve Tic. A.Ş. Private 129 557.613.39632 Şölen Çikolata Gıda San. ve Tic. A.Ş. Private 134 540.703.91433 Kayseri Şeker Fabrikası A.Ş. Private 135 540.102.79134 Namet Gıda San. ve Tic. A.Ş. Private 136 538.597.60535 Et ve Balık Kurumu Genel Müdürlüğü Public 143 518.223.14636 Kent Gıda Maddeleri San. ve Tic. A.Ş. Private 158 491.337.89337 Oltan Fındık San. ve Tic. Ltd. Şti. Private 166 475.736.35738 Doğa Organik Gıda ve Tarım Ür. Ürt. ve Tic. İth. İhr. A.Ş. Private 170 468.022.67339 Sofra Yemek Üretim ve Hizmet A.Ş. Private 174 456.071.41940 Yudum Gıda San. ve Tic. A.Ş. Private 187 423.257.03241 Pınar Entegre Et ve Un Sanayii A.Ş. Private 192 417.353.76742 Aynes Gıda San. ve Tic. A.Ş. Private 194 411.914.42443 Perfetti Van Melle Gıda San. ve Tic. A.Ş. Private 196 409.340.40844 Marsa Yağ San. ve Tic. A.Ş. Private 206 393.932.14445 Kadooğlu Yağ San. ve Tic. A.Ş. Private 207 391.955.35946 Şeker Piliç ve Yem San. Tic. A.Ş. Private 211 388.656.58347 Elita Gıda San. ve Tic. Ltd. Şti. Private 213 386.723.98448 Cargill Tarım ve Gıda San. Tic. A.Ş. Private 225 368.230.55149 Yörsan Gıda Mamülleri San. ve Tic. A.Ş. Private 233 360.017.01750 Beşler Gıda ve Kimya A.Ş. Private 239 348.698.79151 Turyağ Gıda San. ve Tic. A.Ş. Private 240 348.515.58152 Durak Fındık San. ve Tic. A.Ş. Private 242 347.107.71253 Matlı Yem San. ve Tic. A.Ş. Private 248 338.388.04254 Bifa Bisküvi ve Gıda Sanayi A.Ş. Private 254 328.201.72855 Doğuş Çay ve Gıda Maddeleri Üretim Paz. İth. İhr. A.Ş. Private 256 325.967.31356 Tamek Gıda ve Konsantre San. ve Tic. A.Ş. Private 261 312.451.24957 Dimes Gıda San. ve Tic. A.Ş. Private 270 301.196.84158 Gedik Tavukçuluk ve Tarım Ürünleri Tic. San. A.Ş. Private 271 301.087.89759 Keskinkılıç Gıda San. ve Tic. A.Ş. Private 279 289.389.41960 Çekok Gıda San. ve Tic. A.Ş. Private 285 286.761.48961 Natura Gıda San. ve Tic. A.Ş. Private 296 281.430.44462 Kılıç Deniz Ürünleri Üretimi İhracat İthalat ve Ticaret A.Ş. Private 315 257.409.30863 Yonca Gıda Sanayi İşletmeleri İç ve Dış Ticaret A.Ş. Private 330 246.713.38764 Mar Tüketim Maddeleri İhracat İthalat San. ve Tic. A.Ş. Private 341 240.691.73665 Balsu Gıda San. ve Tic. A.Ş. Private 342 240.502.01266 Yavuz Gıda San. ve Tic. Ltd. Şti. Private 348 235.374.25467 Unipro Gıda San. ve Tic. A.Ş. Private 351 234.306.82068 Çamlı Yem Besicilik San. ve Tic. A.Ş. Private 354 232.519.24669 Nuh'un Ankara Makarnası San. ve Tic. A.Ş. Private 359 229.190.98370 Sırmagrup İçecek San. ve Tic. A.Ş. Private 362 226.047.30171 Ulusoy Un San. ve Tic. A.Ş. Private 365 224.853.53072 - Private 368 -73 - Private 369 -
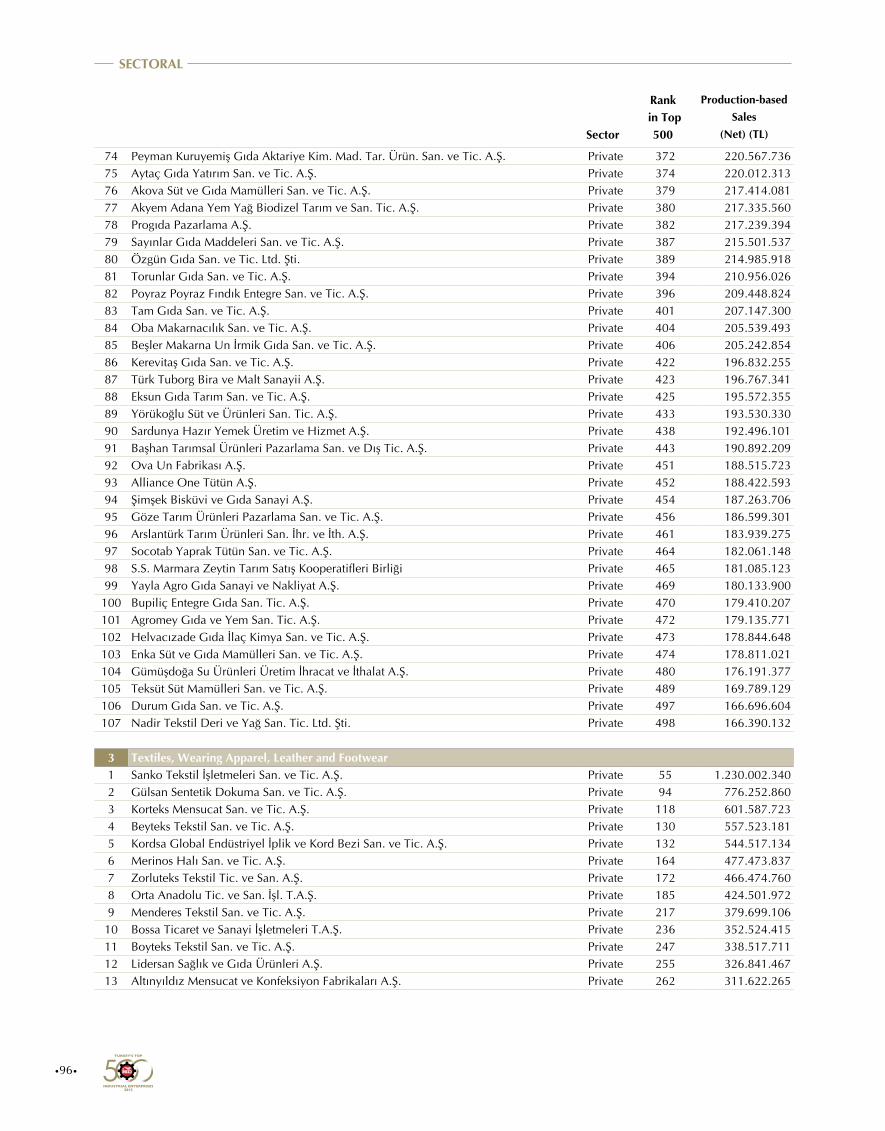
•96•
SECTORAL
Sector
Rank in Top
500
Production-based Sales
(Net) (TL)
74 Peyman Kuruyemiş Gıda Aktariye Kim. Mad. Tar. Ürün. San. ve Tic. A.Ş. Private 372 220.567.73675 Aytaç Gıda Yatırım San. ve Tic. A.Ş. Private 374 220.012.31376 Akova Süt ve Gıda Mamülleri San. ve Tic. A.Ş. Private 379 217.414.08177 Akyem Adana Yem Yağ Biodizel Tarım ve San. Tic. A.Ş. Private 380 217.335.56078 Progıda Pazarlama A.Ş. Private 382 217.239.39479 Sayınlar Gıda Maddeleri San. ve Tic. A.Ş. Private 387 215.501.53780 Özgün Gıda San. ve Tic. Ltd. Şti. Private 389 214.985.91881 Torunlar Gıda San. ve Tic. A.Ş. Private 394 210.956.02682 Poyraz Poyraz Fındık Entegre San. ve Tic. A.Ş. Private 396 209.448.82483 Tam Gıda San. ve Tic. A.Ş. Private 401 207.147.30084 Oba Makarnacılık San. ve Tic. A.Ş. Private 404 205.539.49385 Beşler Makarna Un İrmik Gıda San. ve Tic. A.Ş. Private 406 205.242.85486 Kerevitaş Gıda San. ve Tic. A.Ş. Private 422 196.832.25587 Türk Tuborg Bira ve Malt Sanayii A.Ş. Private 423 196.767.34188 Eksun Gıda Tarım San. ve Tic. A.Ş. Private 425 195.572.35589 Yörükoğlu Süt ve Ürünleri San. Tic. A.Ş. Private 433 193.530.33090 Sardunya Hazır Yemek Üretim ve Hizmet A.Ş. Private 438 192.496.10191 Başhan Tarımsal Ürünleri Pazarlama San. ve Dış Tic. A.Ş. Private 443 190.892.20992 Ova Un Fabrikası A.Ş. Private 451 188.515.72393 Alliance One Tütün A.Ş. Private 452 188.422.59394 Şimşek Bisküvi ve Gıda Sanayi A.Ş. Private 454 187.263.70695 Göze Tarım Ürünleri Pazarlama San. ve Tic. A.Ş. Private 456 186.599.30196 Arslantürk Tarım Ürünleri San. İhr. ve İth. A.Ş. Private 461 183.939.27597 Socotab Yaprak Tütün San. ve Tic. A.Ş. Private 464 182.061.14898 S.S. Marmara Zeytin Tarım Satış Kooperatifleri Birliği Private 465 181.085.12399 Yayla Agro Gıda Sanayi ve Nakliyat A.Ş. Private 469 180.133.900100 Bupiliç Entegre Gıda San. Tic. A.Ş. Private 470 179.410.207101 Agromey Gıda ve Yem San. Tic. A.Ş. Private 472 179.135.771102 Helvacızade Gıda İlaç Kimya San. ve Tic. A.Ş. Private 473 178.844.648103 Enka Süt ve Gıda Mamülleri San. ve Tic. A.Ş. Private 474 178.811.021104 Gümüşdoğa Su Ürünleri Üretim İhracat ve İthalat A.Ş. Private 480 176.191.377105 Teksüt Süt Mamülleri San. ve Tic. A.Ş. Private 489 169.789.129106 Durum Gıda San. ve Tic. A.Ş. Private 497 166.696.604107 Nadir Tekstil Deri ve Yağ San. Tic. Ltd. Şti. Private 498 166.390.132
3 Textiles, Wearing Apparel, Leather and Footwear1 Sanko Tekstil İşletmeleri San. ve Tic. A.Ş. Private 55 1.230.002.3402 Gülsan Sentetik Dokuma San. ve Tic. A.Ş. Private 94 776.252.8603 Korteks Mensucat San. ve Tic. A.Ş. Private 118 601.587.7234 Beyteks Tekstil San. ve Tic. A.Ş. Private 130 557.523.1815 Kordsa Global Endüstriyel İplik ve Kord Bezi San. ve Tic. A.Ş. Private 132 544.517.1346 Merinos Halı San. ve Tic. A.Ş. Private 164 477.473.8377 Zorluteks Tekstil Tic. ve San. A.Ş. Private 172 466.474.7608 Orta Anadolu Tic. ve San. İşl. T.A.Ş. Private 185 424.501.9729 Menderes Tekstil San. ve Tic. A.Ş. Private 217 379.699.10610 Bossa Ticaret ve Sanayi İşletmeleri T.A.Ş. Private 236 352.524.41511 Boyteks Tekstil San. ve Tic. A.Ş. Private 247 338.517.71112 Lidersan Sağlık ve Gıda Ürünleri A.Ş. Private 255 326.841.46713 Altınyıldız Mensucat ve Konfeksiyon Fabrikaları A.Ş. Private 262 311.622.265
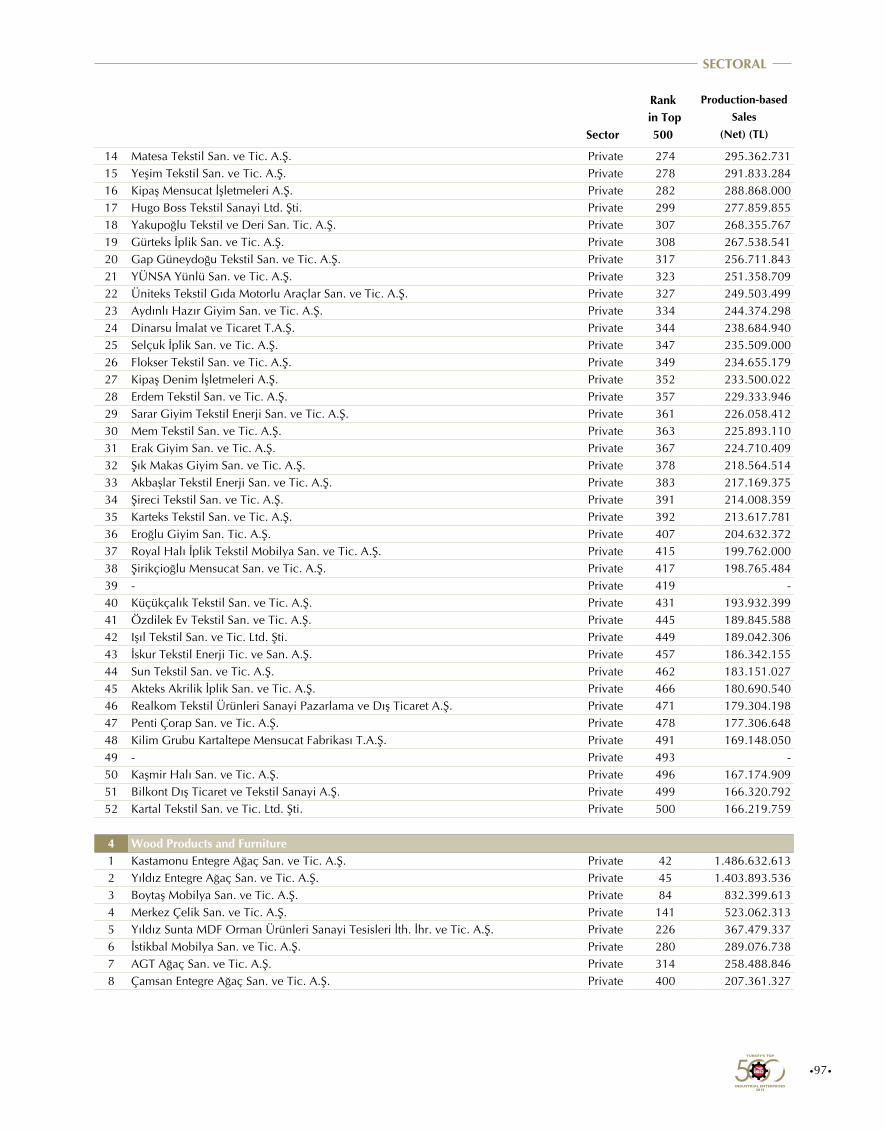
•97•
SECTORAL
Sector
Rank in Top
500
Production-based Sales
(Net) (TL)
14 Matesa Tekstil San. ve Tic. A.Ş. Private 274 295.362.73115 Yeşim Tekstil San. ve Tic. A.Ş. Private 278 291.833.28416 Kipaş Mensucat İşletmeleri A.Ş. Private 282 288.868.00017 Hugo Boss Tekstil Sanayi Ltd. Şti. Private 299 277.859.85518 Yakupoğlu Tekstil ve Deri San. Tic. A.Ş. Private 307 268.355.76719 Gürteks İplik San. ve Tic. A.Ş. Private 308 267.538.54120 Gap Güneydoğu Tekstil San. ve Tic. A.Ş. Private 317 256.711.84321 YÜNSA Yünlü San. ve Tic. A.Ş. Private 323 251.358.70922 Üniteks Tekstil Gıda Motorlu Araçlar San. ve Tic. A.Ş. Private 327 249.503.49923 Aydınlı Hazır Giyim San. ve Tic. A.Ş. Private 334 244.374.29824 Dinarsu İmalat ve Ticaret T.A.Ş. Private 344 238.684.94025 Selçuk İplik San. ve Tic. A.Ş. Private 347 235.509.00026 Flokser Tekstil San. ve Tic. A.Ş. Private 349 234.655.17927 Kipaş Denim İşletmeleri A.Ş. Private 352 233.500.02228 Erdem Tekstil San. ve Tic. A.Ş. Private 357 229.333.94629 Sarar Giyim Tekstil Enerji San. ve Tic. A.Ş. Private 361 226.058.41230 Mem Tekstil San. ve Tic. A.Ş. Private 363 225.893.11031 Erak Giyim San. ve Tic. A.Ş. Private 367 224.710.40932 Şık Makas Giyim San. ve Tic. A.Ş. Private 378 218.564.51433 Akbaşlar Tekstil Enerji San. ve Tic. A.Ş. Private 383 217.169.37534 Şireci Tekstil San. ve Tic. A.Ş. Private 391 214.008.35935 Karteks Tekstil San. ve Tic. A.Ş. Private 392 213.617.78136 Eroğlu Giyim San. Tic. A.Ş. Private 407 204.632.37237 Royal Halı İplik Tekstil Mobilya San. ve Tic. A.Ş. Private 415 199.762.00038 Şirikçioğlu Mensucat San. ve Tic. A.Ş. Private 417 198.765.48439 - Private 419 -40 Küçükçalık Tekstil San. ve Tic. A.Ş. Private 431 193.932.39941 Özdilek Ev Tekstil San. ve Tic. A.Ş. Private 445 189.845.58842 Işıl Tekstil San. ve Tic. Ltd. Şti. Private 449 189.042.30643 İskur Tekstil Enerji Tic. ve San. A.Ş. Private 457 186.342.15544 Sun Tekstil San. ve Tic. A.Ş. Private 462 183.151.02745 Akteks Akrilik İplik San. ve Tic. A.Ş. Private 466 180.690.54046 Realkom Tekstil Ürünleri Sanayi Pazarlama ve Dış Ticaret A.Ş. Private 471 179.304.19847 Penti Çorap San. ve Tic. A.Ş. Private 478 177.306.64848 Kilim Grubu Kartaltepe Mensucat Fabrikası T.A.Ş. Private 491 169.148.05049 - Private 493 -50 Kaşmir Halı San. ve Tic. A.Ş. Private 496 167.174.90951 Bilkont Dış Ticaret ve Tekstil Sanayi A.Ş. Private 499 166.320.79252 Kartal Tekstil San. ve Tic. Ltd. Şti. Private 500 166.219.759
4 Wood Products and Furniture1 Kastamonu Entegre Ağaç San. ve Tic. A.Ş. Private 42 1.486.632.6132 Yıldız Entegre Ağaç San. ve Tic. A.Ş. Private 45 1.403.893.5363 Boytaş Mobilya San. ve Tic. A.Ş. Private 84 832.399.6134 Merkez Çelik San. ve Tic. A.Ş. Private 141 523.062.3135 Yıldız Sunta MDF Orman Ürünleri Sanayi Tesisleri İth. İhr. ve Tic. A.Ş. Private 226 367.479.3376 İstikbal Mobilya San. ve Tic. A.Ş. Private 280 289.076.7387 AGT Ağaç San. ve Tic. A.Ş. Private 314 258.488.8468 Çamsan Entegre Ağaç San. ve Tic. A.Ş. Private 400 207.361.327
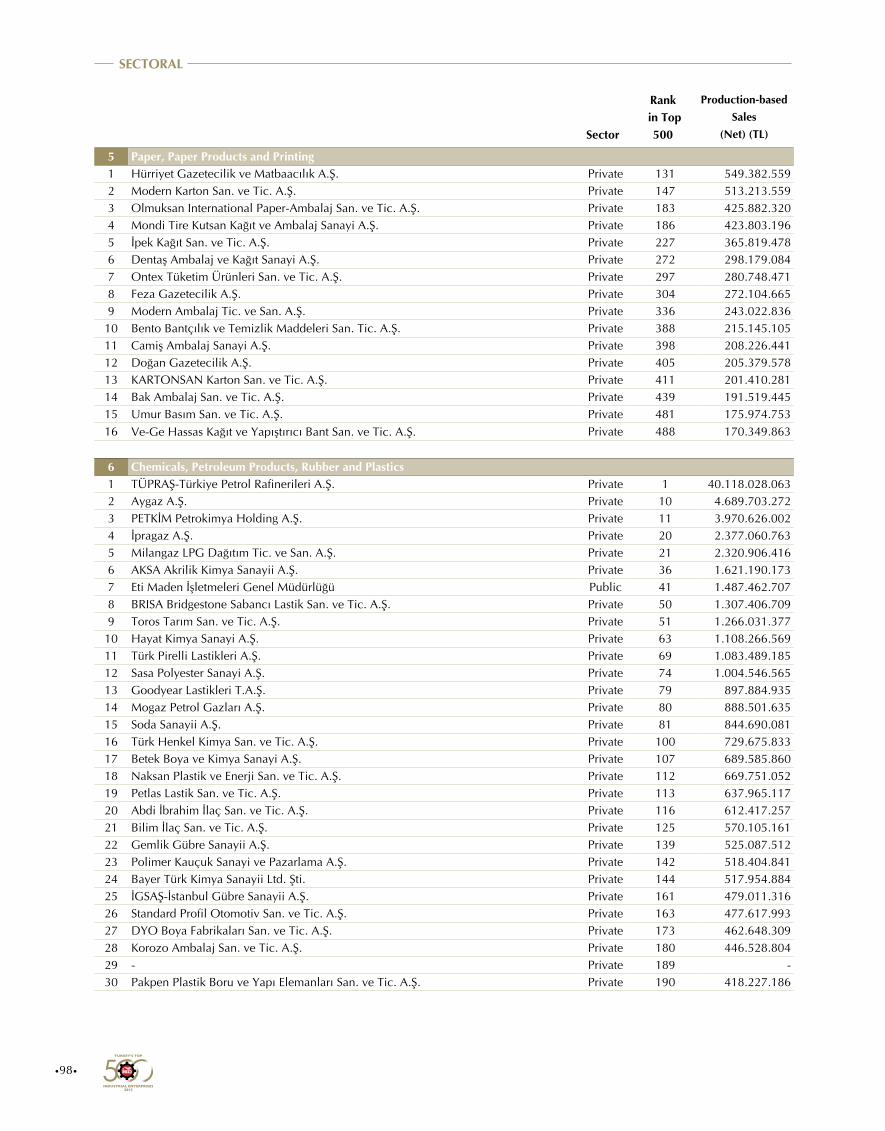
•98•
SECTORAL
Sector
Rank in Top
500
Production-based Sales
(Net) (TL)
5 Paper, Paper Products and Printing1 Hürriyet Gazetecilik ve Matbaacılık A.Ş. Private 131 549.382.5592 Modern Karton San. ve Tic. A.Ş. Private 147 513.213.5593 Olmuksan International Paper-Ambalaj San. ve Tic. A.Ş. Private 183 425.882.3204 Mondi Tire Kutsan Kağıt ve Ambalaj Sanayi A.Ş. Private 186 423.803.1965 İpek Kağıt San. ve Tic. A.Ş. Private 227 365.819.4786 Dentaş Ambalaj ve Kağıt Sanayi A.Ş. Private 272 298.179.0847 Ontex Tüketim Ürünleri San. ve Tic. A.Ş. Private 297 280.748.4718 Feza Gazetecilik A.Ş. Private 304 272.104.6659 Modern Ambalaj Tic. ve San. A.Ş. Private 336 243.022.83610 Bento Bantçılık ve Temizlik Maddeleri San. Tic. A.Ş. Private 388 215.145.10511 Camiş Ambalaj Sanayi A.Ş. Private 398 208.226.44112 Doğan Gazetecilik A.Ş. Private 405 205.379.57813 KARTONSAN Karton San. ve Tic. A.Ş. Private 411 201.410.28114 Bak Ambalaj San. ve Tic. A.Ş. Private 439 191.519.44515 Umur Basım San. ve Tic. A.Ş. Private 481 175.974.75316 Ve-Ge Hassas Kağıt ve Yapıştırıcı Bant San. ve Tic. A.Ş. Private 488 170.349.863
6 Chemicals, Petroleum Products, Rubber and Plastics1 TÜPRAŞ-Türkiye Petrol Rafinerileri A.Ş. Private 1 40.118.028.0632 Aygaz A.Ş. Private 10 4.689.703.2723 PETKİM Petrokimya Holding A.Ş. Private 11 3.970.626.0024 İpragaz A.Ş. Private 20 2.377.060.7635 Milangaz LPG Dağıtım Tic. ve San. A.Ş. Private 21 2.320.906.4166 AKSA Akrilik Kimya Sanayii A.Ş. Private 36 1.621.190.1737 Eti Maden İşletmeleri Genel Müdürlüğü Public 41 1.487.462.7078 BRISA Bridgestone Sabancı Lastik San. ve Tic. A.Ş. Private 50 1.307.406.7099 Toros Tarım San. ve Tic. A.Ş. Private 51 1.266.031.37710 Hayat Kimya Sanayi A.Ş. Private 63 1.108.266.56911 Türk Pirelli Lastikleri A.Ş. Private 69 1.083.489.18512 Sasa Polyester Sanayi A.Ş. Private 74 1.004.546.56513 Goodyear Lastikleri T.A.Ş. Private 79 897.884.93514 Mogaz Petrol Gazları A.Ş. Private 80 888.501.63515 Soda Sanayii A.Ş. Private 81 844.690.08116 Türk Henkel Kimya San. ve Tic. A.Ş. Private 100 729.675.83317 Betek Boya ve Kimya Sanayi A.Ş. Private 107 689.585.86018 Naksan Plastik ve Enerji San. ve Tic. A.Ş. Private 112 669.751.05219 Petlas Lastik San. ve Tic. A.Ş. Private 113 637.965.11720 Abdi İbrahim İlaç San. ve Tic. A.Ş. Private 116 612.417.25721 Bilim İlaç San. ve Tic. A.Ş. Private 125 570.105.16122 Gemlik Gübre Sanayii A.Ş. Private 139 525.087.51223 Polimer Kauçuk Sanayi ve Pazarlama A.Ş. Private 142 518.404.84124 Bayer Türk Kimya Sanayii Ltd. Şti. Private 144 517.954.88425 İGSAŞ-İstanbul Gübre Sanayii A.Ş. Private 161 479.011.31626 Standard Profil Otomotiv San. ve Tic. A.Ş. Private 163 477.617.99327 DYO Boya Fabrikaları San. ve Tic. A.Ş. Private 173 462.648.30928 Korozo Ambalaj San. ve Tic. A.Ş. Private 180 446.528.80429 - Private 189 -30 Pakpen Plastik Boru ve Yapı Elemanları San. ve Tic. A.Ş. Private 190 418.227.186
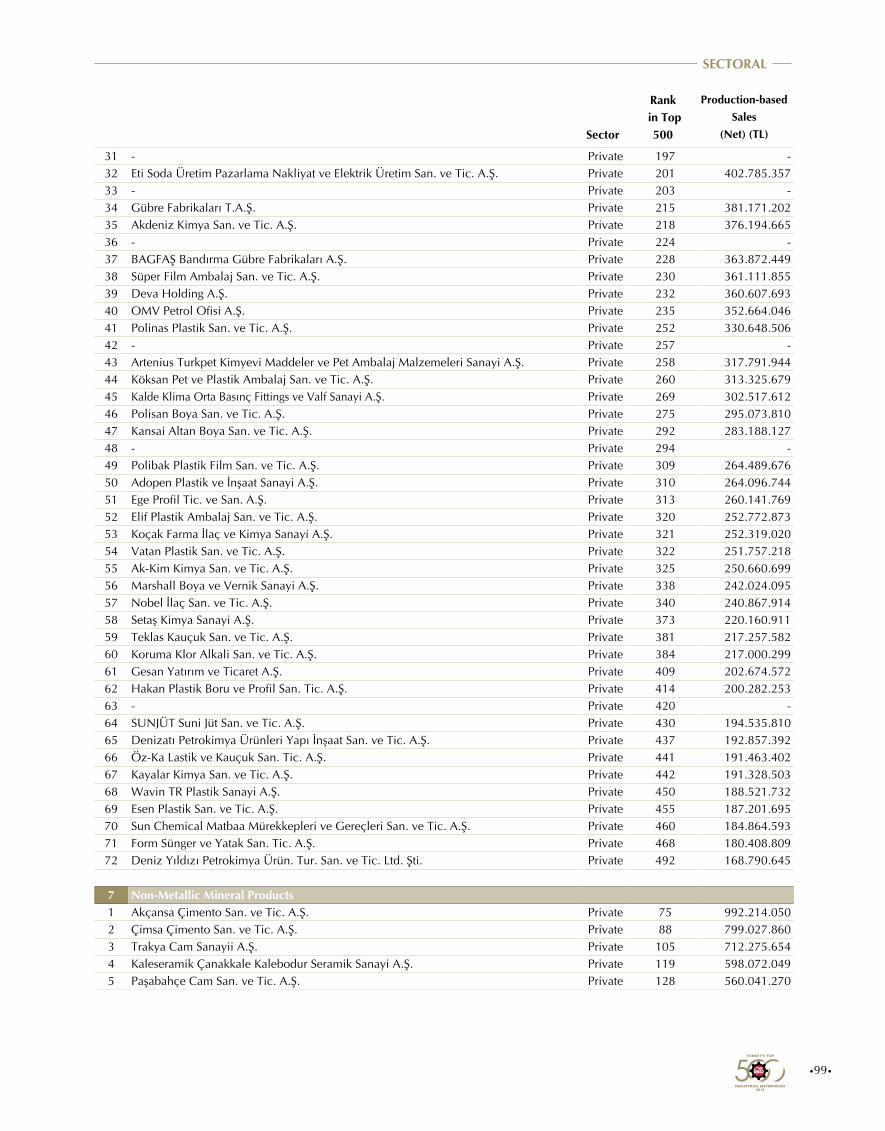
•99•
SECTORAL
Sector
Rank in Top
500
Production-based Sales
(Net) (TL)
31 - Private 197 -32 Eti Soda Üretim Pazarlama Nakliyat ve Elektrik Üretim San. ve Tic. A.Ş. Private 201 402.785.35733 - Private 203 -34 Gübre Fabrikaları T.A.Ş. Private 215 381.171.20235 Akdeniz Kimya San. ve Tic. A.Ş. Private 218 376.194.66536 - Private 224 -37 BAGFAŞ Bandırma Gübre Fabrikaları A.Ş. Private 228 363.872.44938 Süper Film Ambalaj San. ve Tic. A.Ş. Private 230 361.111.85539 Deva Holding A.Ş. Private 232 360.607.69340 OMV Petrol Ofisi A.Ş. Private 235 352.664.04641 Polinas Plastik San. ve Tic. A.Ş. Private 252 330.648.50642 - Private 257 -43 Artenius Turkpet Kimyevi Maddeler ve Pet Ambalaj Malzemeleri Sanayi A.Ş. Private 258 317.791.94444 Köksan Pet ve Plastik Ambalaj San. ve Tic. A.Ş. Private 260 313.325.67945 Kalde Klima Orta Basınç Fittings ve Valf Sanayi A.Ş. Private 269 302.517.61246 Polisan Boya San. ve Tic. A.Ş. Private 275 295.073.81047 Kansai Altan Boya San. ve Tic. A.Ş. Private 292 283.188.12748 - Private 294 -49 Polibak Plastik Film San. ve Tic. A.Ş. Private 309 264.489.67650 Adopen Plastik ve İnşaat Sanayi A.Ş. Private 310 264.096.74451 Ege Profil Tic. ve San. A.Ş. Private 313 260.141.76952 Elif Plastik Ambalaj San. ve Tic. A.Ş. Private 320 252.772.87353 Koçak Farma İlaç ve Kimya Sanayi A.Ş. Private 321 252.319.02054 Vatan Plastik San. ve Tic. A.Ş. Private 322 251.757.21855 Ak-Kim Kimya San. ve Tic. A.Ş. Private 325 250.660.69956 Marshall Boya ve Vernik Sanayi A.Ş. Private 338 242.024.09557 Nobel İlaç San. ve Tic. A.Ş. Private 340 240.867.91458 Setaş Kimya Sanayi A.Ş. Private 373 220.160.91159 Teklas Kauçuk San. ve Tic. A.Ş. Private 381 217.257.58260 Koruma Klor Alkali San. ve Tic. A.Ş. Private 384 217.000.29961 Gesan Yatırım ve Ticaret A.Ş. Private 409 202.674.57262 Hakan Plastik Boru ve Profil San. Tic. A.Ş. Private 414 200.282.25363 - Private 420 -64 SUNJÜT Suni Jüt San. ve Tic. A.Ş. Private 430 194.535.81065 Denizatı Petrokimya Ürünleri Yapı İnşaat San. ve Tic. A.Ş. Private 437 192.857.39266 Öz-Ka Lastik ve Kauçuk San. Tic. A.Ş. Private 441 191.463.40267 Kayalar Kimya San. ve Tic. A.Ş. Private 442 191.328.50368 Wavin TR Plastik Sanayi A.Ş. Private 450 188.521.73269 Esen Plastik San. ve Tic. A.Ş. Private 455 187.201.69570 Sun Chemical Matbaa Mürekkepleri ve Gereçleri San. ve Tic. A.Ş. Private 460 184.864.59371 Form Sünger ve Yatak San. Tic. A.Ş. Private 468 180.408.80972 Deniz Yıldızı Petrokimya Ürün. Tur. San. ve Tic. Ltd. Şti. Private 492 168.790.645
7 Non-Metallic Mineral Products1 Akçansa Çimento San. ve Tic. A.Ş. Private 75 992.214.0502 Çimsa Çimento San. ve Tic. A.Ş. Private 88 799.027.8603 Trakya Cam Sanayii A.Ş. Private 105 712.275.6544 Kaleseramik Çanakkale Kalebodur Seramik Sanayi A.Ş. Private 119 598.072.0495 Paşabahçe Cam San. ve Tic. A.Ş. Private 128 560.041.270

•100•
SECTORAL
Sector
Rank in Top
500
Production-based Sales
(Net) (TL)
6 Limak Çimento San. ve Tic. A.Ş. Private 155 496.166.7687 Eczacıbaşı Yapı Gereçleri San. ve Tic. A.Ş. Private 167 471.915.8228 Aşkale Çimento Sanayii T.A.Ş. Private 168 468.812.3579 Nuh Çimento Sanayi A.Ş. Private 169 468.522.56510 Anadolu Cam Yenişehir Sanayi A.Ş. Private 195 409.876.09711 Anadolu Cam Sanayii A.Ş. Private 198 404.999.42612 Limak Batı Çimento San. ve Tic. A.Ş. Private 199 404.392.10213 Çimko Çimento ve Beton San. Tic. A.Ş. Private 200 402.802.83114 As Çimento San. ve Tic. A.Ş. Private 208 390.120.57315 Vitra Karo San. ve Tic. A.Ş. Private 229 361.663.00016 Nuh Beton A.Ş. Private 243 346.031.94217 Cimpor Yibitaş Çimento San. ve Tic. A.Ş. Private 246 341.416.53418 Paşabahçe Eskişehir Cam San. ve Tic. A.Ş. Private 251 332.929.00019 İzocam Tic. ve San. A.Ş. Private 259 313.341.93220 İstanbul Asfalt Fabrikaları San. ve Tic. A.Ş. Public 264 310.454.63921 Trakya Yenişehir Cam Sanayii A.Ş. Private 265 309.669.63122 Oyak Beton San. ve Tic. A.Ş. Private 267 306.183.96723 Adana Çimento Sanayii T.A.Ş. Private 284 287.034.08924 Çimentaş İzmir Çimento Fabrikası T.A.Ş. Private 290 283.878.62525 BATIÇİM Batı Anadolu Çimento Sanayii A.Ş. Private 311 262.497.94526 Seranit Granit Seramik San. ve Tic. A.Ş. Private 339 241.744.02027 Konya Çimento Sanayii A.Ş. Private 346 235.685.87328 Ünye Çimento San. ve Tic. A.Ş. Private 356 231.117.08829 Ege Seramik San. ve Tic. A.Ş. Private 371 223.179.84330 Söğütsen Seramik San. İnş. Mad. İth. İhr. A.Ş. Private 385 215.879.58531 Mardin Çimento San. ve Tic. A.Ş. Private 402 206.067.88932 GÖLTAŞ Göller Bölgesi Çimento San. ve Tic. A.Ş. Private 408 203.142.48633 Traçim Çimento San. ve Tic. A.Ş. Private 427 194.933.83134 Adoçim Çimento Beton San. ve Tic. A.Ş. Private 432 193.605.28435 Bolu Çimento Sanayii A.Ş. Private 434 193.361.25836 KÇS Kahramanmaraş Çimento Beton Sanayi ve Madencilik İşletmeleri A.Ş. Private 447 189.138.96637 Denizli Çimento Sanayii T.A.Ş. Private 453 188.265.72838 Ayhanlar Yol Asfaltlama San. ve Tic. A.Ş. Private 485 170.501.471
8 Primary Metals1 İskenderun Demir ve Çelik A.Ş. Private 7 5.399.769.4552 Ereğli Demir ve Çelik Fabrikaları T.A.Ş. Private 8 5.107.059.3853 İçdaş Çelik Enerji Tersane ve Ulaşım Sanayi A.Ş. Private 9 4.921.735.2224 Çolakoğlu Metalurji A.Ş. Private 12 3.588.003.4755 Nadir Metal Rafineri San. ve Tic. A.Ş. Private 19 2.428.112.2696 Tosçelik Profil ve Sac Endüstrisi A.Ş. Private 22 2.301.546.7817 Er-Bakır Elektrolitik Bakır Mamülleri A.Ş. Private 23 2.229.932.0008 Kroman Çelik Sanayii A.Ş. Private 24 2.220.408.0859 Sarkuysan Elektrolitik Bakır San. ve Tic. A.Ş. Private 26 2.135.657.22110 Diler Demir Çelik Endüstri ve Ticaret A.Ş. Private 27 1.948.104.66111 Borçelik Çelik San. Tic. A.Ş. Private 28 1.932.093.49812 KARDEMİR Karabük Demir Çelik San. ve Tic. A.Ş. Private 34 1.665.264.21813 Yolbulan Baştuğ Metalurji Sanayi A.Ş. Private 35 1.645.692.51414 İzmir Demir Çelik Sanayi A.Ş. Private 38 1.562.122.304
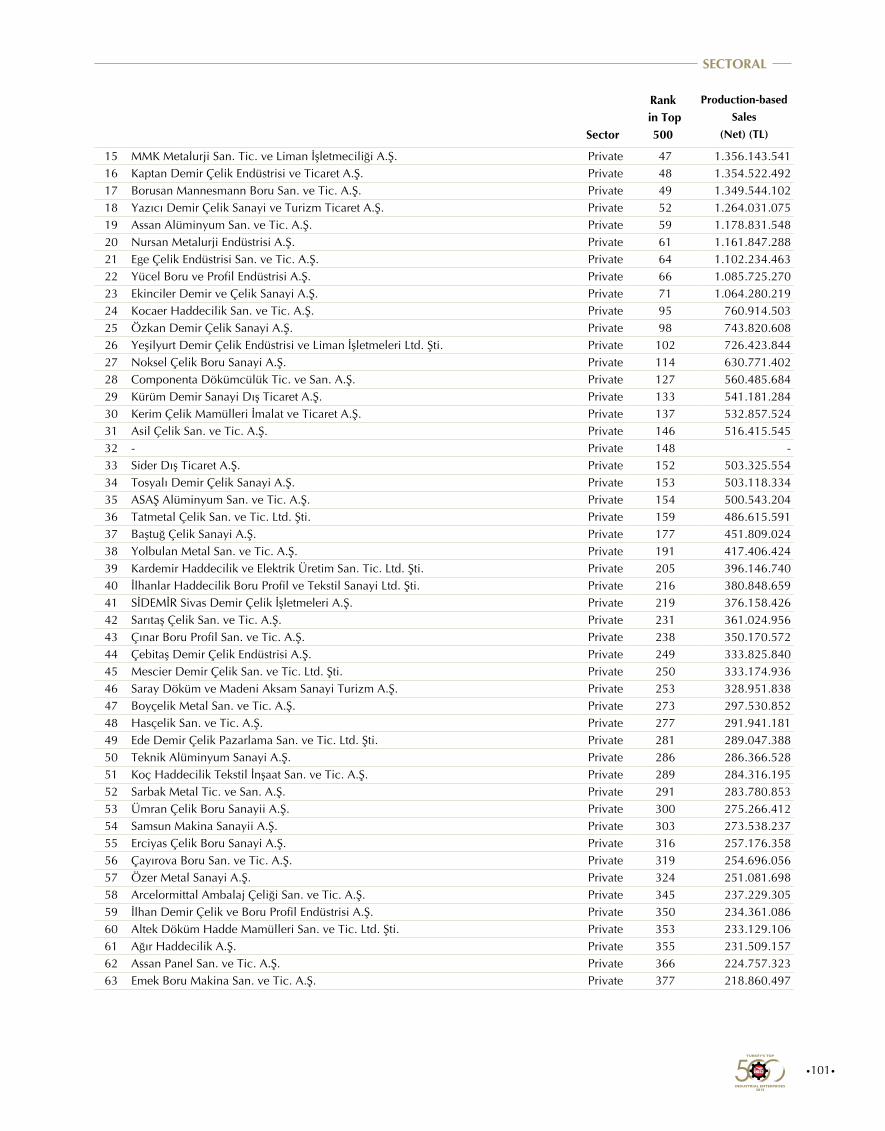
•101•
SECTORAL
Sector
Rank in Top
500
Production-based Sales
(Net) (TL)
15 MMK Metalurji San. Tic. ve Liman İşletmeciliği A.Ş. Private 47 1.356.143.54116 Kaptan Demir Çelik Endüstrisi ve Ticaret A.Ş. Private 48 1.354.522.49217 Borusan Mannesmann Boru San. ve Tic. A.Ş. Private 49 1.349.544.10218 Yazıcı Demir Çelik Sanayi ve Turizm Ticaret A.Ş. Private 52 1.264.031.07519 Assan Alüminyum San. ve Tic. A.Ş. Private 59 1.178.831.54820 Nursan Metalurji Endüstrisi A.Ş. Private 61 1.161.847.28821 Ege Çelik Endüstrisi San. ve Tic. A.Ş. Private 64 1.102.234.46322 Yücel Boru ve Profil Endüstrisi A.Ş. Private 66 1.085.725.27023 Ekinciler Demir ve Çelik Sanayi A.Ş. Private 71 1.064.280.21924 Kocaer Haddecilik San. ve Tic. A.Ş. Private 95 760.914.50325 Özkan Demir Çelik Sanayi A.Ş. Private 98 743.820.60826 Yeşilyurt Demir Çelik Endüstrisi ve Liman İşletmeleri Ltd. Şti. Private 102 726.423.84427 Noksel Çelik Boru Sanayi A.Ş. Private 114 630.771.40228 Componenta Dökümcülük Tic. ve San. A.Ş. Private 127 560.485.68429 Kürüm Demir Sanayi Dış Ticaret A.Ş. Private 133 541.181.28430 Kerim Çelik Mamülleri İmalat ve Ticaret A.Ş. Private 137 532.857.52431 Asil Çelik San. ve Tic. A.Ş. Private 146 516.415.54532 - Private 148 -33 Sider Dış Ticaret A.Ş. Private 152 503.325.55434 Tosyalı Demir Çelik Sanayi A.Ş. Private 153 503.118.33435 ASAŞ Alüminyum San. ve Tic. A.Ş. Private 154 500.543.20436 Tatmetal Çelik San. ve Tic. Ltd. Şti. Private 159 486.615.59137 Baştuğ Çelik Sanayi A.Ş. Private 177 451.809.02438 Yolbulan Metal San. ve Tic. A.Ş. Private 191 417.406.42439 Kardemir Haddecilik ve Elektrik Üretim San. Tic. Ltd. Şti. Private 205 396.146.74040 İlhanlar Haddecilik Boru Profil ve Tekstil Sanayi Ltd. Şti. Private 216 380.848.65941 SİDEMİR Sivas Demir Çelik İşletmeleri A.Ş. Private 219 376.158.42642 Sarıtaş Çelik San. ve Tic. A.Ş. Private 231 361.024.95643 Çınar Boru Profil San. ve Tic. A.Ş. Private 238 350.170.57244 Çebitaş Demir Çelik Endüstrisi A.Ş. Private 249 333.825.84045 Mescier Demir Çelik San. ve Tic. Ltd. Şti. Private 250 333.174.93646 Saray Döküm ve Madeni Aksam Sanayi Turizm A.Ş. Private 253 328.951.83847 Boyçelik Metal San. ve Tic. A.Ş. Private 273 297.530.85248 Hasçelik San. ve Tic. A.Ş. Private 277 291.941.18149 Ede Demir Çelik Pazarlama San. ve Tic. Ltd. Şti. Private 281 289.047.38850 Teknik Alüminyum Sanayi A.Ş. Private 286 286.366.52851 Koç Haddecilik Tekstil İnşaat San. ve Tic. A.Ş. Private 289 284.316.19552 Sarbak Metal Tic. ve San. A.Ş. Private 291 283.780.85353 Ümran Çelik Boru Sanayii A.Ş. Private 300 275.266.41254 Samsun Makina Sanayii A.Ş. Private 303 273.538.23755 Erciyas Çelik Boru Sanayi A.Ş. Private 316 257.176.35856 Çayırova Boru San. ve Tic. A.Ş. Private 319 254.696.05657 Özer Metal Sanayi A.Ş. Private 324 251.081.69858 Arcelormittal Ambalaj Çeliği San. ve Tic. A.Ş. Private 345 237.229.30559 İlhan Demir Çelik ve Boru Profil Endüstrisi A.Ş. Private 350 234.361.08660 Altek Döküm Hadde Mamülleri San. ve Tic. Ltd. Şti. Private 353 233.129.10661 Ağır Haddecilik A.Ş. Private 355 231.509.15762 Assan Panel San. ve Tic. A.Ş. Private 366 224.757.32363 Emek Boru Makina San. ve Tic. A.Ş. Private 377 218.860.497

•102•
SECTORAL
Sector
Rank in Top
500
Production-based Sales
(Net) (TL)
64 ÇELSANTAŞ Çelik Mamülleri San. ve Tic. A.Ş. Private 395 209.746.54265 Çağ Çelik Demir ve Çelik Endüstri A.Ş. Private 397 209.423.90866 Trakya Döküm San. ve Tic. A.Ş. Private 403 206.020.46767 Şahinler Metal San. ve Tic. A.Ş. Private 412 200.728.95168 Ertaş Metal San. ve Tic. A.Ş. Private 424 195.740.08169 Hak Bakır Çekme ve Elektrotel San. Tic. A.Ş. Private 429 194.817.12870 Güney Çelik Hasır ve Demir Mamulleri San. Tic. A.Ş. Private 435 193.325.59071 ÇEMTAŞ Çelik Makina San. ve Tic. A.Ş. Private 458 185.940.79372 ERBOSAN Erciyas Boru San. ve Tic. A.Ş. Private 459 185.383.21373 Mega Metal San. ve Tic. Ltd. Şti. Private 477 177.838.67074 Çelikord A.Ş. Private 484 170.729.30575 Bekaert İzmit Çelik Kord San. ve Tic. A.Ş. Private 486 170.463.553
9 Metal Products, Machinery and Equipment, Professional Instruments1 Arçelik A.Ş. Private 4 7.221.822.8542 Vestel Elektronik San. ve Tic. A.Ş. Private 14 3.378.591.8473 BSH Ev Aletleri San. ve Tic. A.Ş. Private 18 2.544.013.6094 Vestel Beyaz Eşya San. ve Tic. A.Ş. Private 30 1.813.102.6965 Türk Traktör ve Ziraat Makineleri A.Ş. Private 32 1.781.623.2686 Aselsan Elektronik San. ve Tic. A.Ş. Private 46 1.369.000.2417 HES Hacılar Elektrik San. ve Tic. A.Ş. Private 65 1.087.022.5388 Siemens San. ve Tic. A.Ş. Private 70 1.082.433.8659 Vestel Dijital Üretim Sanayi A.Ş. Private 82 840.507.64510 Tezcan Galvanizli Yapı Elemanları San. ve Tic. A.Ş. Private 91 791.845.32011 Makina ve Kimya Endüstrisi Kurumu (M.K.E.K.) Genel Müdürlüğü Public 103 720.468.35012 Türk Prysmian Kablo ve Sistemleri A.Ş. Private 109 679.598.22113 Indesit Company Beyaz Eşya San. ve Tic. A.Ş. Private 115 615.102.61514 HİDROMEK Hidrolik ve Mekanik Makina İmalat San. ve Tic. A.Ş. Private 123 570.217.39815 Bosch Termoteknik San. ve Tic. A.Ş. Private 124 570.132.57716 Sarten Ambalaj San. ve Tic. A.Ş. Private 126 565.871.45117 Türk Demir Döküm Fabrikaları A.Ş. Private 138 526.765.79318 Alstom Grid Enerji Endüstrisi A.Ş. Private 145 517.472.93519 Coşkunöz Metal Form Makina Endüstri ve Tic. A.Ş. Private 156 495.251.25320 Federal-Mogul Piston Segman ve Gömlek Üretim Tesisleri A.Ş. Private 176 454.473.37221 - Private 179 -22 Has Çelik ve Halat San. Tic. A.Ş Private 182 437.942.74123 Mutlu Akü ve Malzemeleri Sanayi A.Ş. Private 188 420.150.18224 ROKETSAN Roket San. ve Tic. A.Ş. Private 193 413.932.04725 Öznur Kablo San. ve Tic. A.Ş. Private 202 401.428.66326 Nexans Türkiye Endüstri ve Ticaret A.Ş. Private 204 397.851.56227 Schneider Elektrik San. ve Tic. A.Ş. Private 221 373.441.59828 HAVELSAN Hava Elektronik San. ve Tic. A.Ş. Private 223 372.614.30229 Baymak Makina San. ve Tic. A.Ş. Private 244 342.267.34630 Mitaş Enerji ve Madeni İnşaat İşleri T.A.Ş. Private 263 310.866.95631 Tümosan Motor ve Traktör Sanayi A.Ş. Private 287 286.315.68532 ABB Elektrik Sanayi A.Ş. Private 293 282.348.50233 Balıkesir Elektromekanik Sanayi Tesisleri A.Ş. Private 301 274.957.67034 İnci Akü San. ve Tic. A.Ş. Private 306 270.368.87235 Pamukkale Kablo San. ve Tic. A.Ş. Private 312 261.238.323

•103•
SECTORAL
Sector
Rank in Top
500
Production-based Sales
(Net) (TL)
36 Bosch Rexroth Otomasyon San. ve Tic. A.Ş. Private 326 250.637.02837 CVS Makina İnşaat San. ve Tic. A.Ş. Private 328 248.903.78838 Ortadoğu Rulman San. ve Tic. A.Ş. Private 329 248.048.12139 Viko Elektrik ve Elektronik Endüstrisi San. ve Tic. A.Ş. Private 331 246.184.03040 Kale Kilit ve Kalıp Sanayi A.Ş. Private 332 246.126.57941 Şa-Ra Enerji İnşaat Tic. ve San. A.Ş. Private 333 244.869.67042 Genpower Jeneratör San. ve Tic. A.Ş. Private 337 242.498.33643 Durmazlar Makina San. ve Tic. A.Ş. Private 343 239.350.20344 Assan Demir ve Sac Sanayi A.Ş. Private 358 229.277.19745 Tümka Kablo Sanayi A.Ş. Private 360 226.803.91846 Kumtel Dayanıklı Tüketim Malları Plastik San. ve Tic. A.Ş. Private 370 224.273.78847 Norm Cıvata San. ve Tic. A.Ş. Private 376 218.982.23248 Vatan Kablo Metal Endüstri ve Ticaret A.Ş. Private 386 215.768.10349 Aksa Jeneratör Sanayi A.Ş. Private 390 214.634.32950 Erkunt Traktör Sanayii A.Ş. Private 393 213.243.70651 Demirer Kablo Tesisleri San. ve Tic. A.Ş. Private 399 208.015.73252 Legrand Elektrik Sanayi A.Ş. Private 410 201.720.27453 Emas Makina Sanayi A.Ş. Private 413 200.724.57054 Arslan Alüminyum San. ve Tic. Ltd. Şti. Private 416 199.649.09555 Yiğit Akü Malzemeleri Nakliyat Turizm İnşaat San. ve Tic. A.Ş. Private 428 194.931.05056 ENPAY Endüstriyel Pazarlama ve Yatırım A.Ş. Private 436 193.031.57157 Termo Teknik Tic. ve San. A.Ş. Private 446 189.186.11358 - Private 463 -59 Hattat Tarım Makinaları San. ve Tic. A.Ş. Private 467 180.592.77160 Seval Kablo Aydınlatma Cihazları İth. İhr. San. ve Tic. A.Ş. Private 475 178.510.37861 - Private 479 -62 Sartel Elektrik Kablo ve Mot. Mak. İnş. Tur. ve Tic. Ltd. Şti Private 483 173.337.61463 Farplas Oto Yedek Parçaları İml. İth. ve İhr. A.Ş. Private 490 169.439.71864 Konveyör Beyaz Eşya ve Otomotiv Yan San. Tic. A.Ş. Private 494 168.478.46965 Borsan Kablo Elektrik Aydınlatma İnşaat San. ve Tic. A.Ş. Private 495 167.797.706
10 Motor Vehicles1 Ford Otomotiv Sanayi A.Ş. Private 2 8.164.892.9722 Oyak-Renault Otomobil Fabrikaları A.Ş. Private 3 7.529.420.3433 TOFAŞ Türk Otomobil Fabrikası A.Ş. Private 6 5.611.895.8754 Mercedes-Benz T.A.Ş. Private 13 3.512.714.2265 Toyota Otomotiv Sanayi Türkiye A.Ş. Private 29 1.927.006.8076 Hyundai Assan Otomotiv San. ve Tic. A.Ş. Private 37 1.580.838.0157 Bosch San. ve Tic. A.Ş. Private 39 1.552.961.5168 Delphi Automotive Systems Ltd. Şti. Private 78 923.159.2369 TUSAŞ-Türk Havacılık ve Uzay Sanayii A.Ş. Private 83 833.745.21710 Otokar Otomotiv ve Savunma Sanayi A.Ş. Private 87 804.079.24411 Honda Türkiye A.Ş. Private 122 573.862.43612 Autoliv Cankor Otomotiv Emniyet Sistemleri San. ve Tic. A.Ş. Private 140 523.270.25613 Man Türkiye A.Ş. Private 149 505.717.33914 Karsan Otomotiv San. ve Tic. A.Ş. Private 151 503.377.34615 CMS Jant ve Makina Sanayii A.Ş. Private 162 477.702.90716 Hema Endüstri A.Ş. Private 165 477.294.05417 Temsa Global San. ve Tic. A.Ş. Private 171 467.262.190

•104•
SECTORAL
Sector
Rank in Top
500
Production-based Sales
(Net) (TL)
18 Tırsan Treyler San. Tic. ve Nakliyat A.Ş. Private 178 449.461.20819 Tusaş Motor Sanayii A.Ş. Private 209 389.758.20820 Anadolu-Isuzu Otomotiv San. ve Tic. A.Ş. Private 210 389.208.99021 Beyçelik Gestamp Kalıp ve Oto Yan San. Paz. ve Tic. A.Ş. Private 212 387.432.59022 Yazaki Otomotiv Yan San. ve Tic. A.Ş. Private 220 374.407.17623 - Private 245 -24 Aunde Teknik Tekstil San. ve Tic. A.Ş. Private 266 309.481.66025 Hayes Lemmerz İnci Jant Sanayi A.Ş. Private 268 302.840.91626 Major SKT Oto Donanım San. ve Tic. A.Ş. Private 288 285.546.04727 FNSS Savunma Sistemleri A.Ş Private 298 278.218.19728 B-Plas Bursa Plastik Metal İnşaat Enerji Madencilik Jeotermal Turizm ve Tarım San. ve Tic. A.Ş. Private 305 271.331.86929 - Private 318 -30 TÜVASAŞ-Türkiye Vagon Sanayi A.Ş. Public 375 219.642.48931 Hayes Lemmerz Jantaş Jant San. ve Tic. A.Ş. Private 421 197.144.84032 Yarış Kabin San. ve Tic. A.Ş. Private 440 191.465.57433 Ermetal Otomotiv ve Eşya San. Tic. A.Ş. Private 444 190.845.49434 Türkiye Lokomotif ve Motor Sanayii A.Ş. (TÜLOMSAŞ) Public 448 189.061.38935 Beşiktaş Gemi İnşa A.Ş. Private 482 175.633.60936 Teknorot Otomotiv Ürünleri San. ve Tic. A.Ş. Private 487 170.361.606
11 Other Manufacturing1 Dünya Uluslararası Mücevherat ve Kuyumculuk San. ve Tic. A.Ş. Private 175 454.701.5952 Onsa Mücevherat İmalatı ve Dış Ticaret A.Ş. Private 181 440.441.4423 Karakaş Atlantis Kıymetli Madenler Kuyumculuk Telekomünikasyon San. ve Tic. A.Ş. Private 184 424.859.9184 Altınbaş Kuyumculuk İthalat İhracat San. ve Tic. A.Ş. Private 214 384.777.9185 Arpaş İhracat İthalat ve Pazarlama A.Ş. Private 283 287.320.934
12 Electricity Sector1 EÜAŞ Elektrik Üretim A.Ş. Genel Müdürlüğü Public 5 6.939.885.2872 Eren Enerji Elektrik Üretim A.Ş. Private 40 1.533.390.3733 Enerjisa Enerji Üretim A.Ş. Private 54 1.244.389.0594 Aksa Enerji Üretim A.Ş. Private 62 1.138.804.7075 Soma Elektrik Üretim ve Ticaret A.Ş. Public 97 743.889.0066 İçdaş Elektrik Enerjisi Üretim ve Yatırım A.Ş. Private 106 706.976.9707 Bis Enerji Elektrik Üretim A.Ş. Private 150 504.210.6218 Park Termik Elektrik San. ve Tic. A.Ş. Private 234 356.504.2969 Akenerji Elektrik Üretim A.Ş. Private 237 351.872.78310 Zorlu Enerji Elektrik Üretim A.Ş. Private 276 292.471.64411 AES Entek Elektrik Üretimi A.Ş. Private 335 244.011.25012 Rasa Enerji Üretim A.Ş. Private 418 198.337.549

•105•
The Top 50 Companies by Profit
Rank by Profit (Before Tax) for the
Period FirmAffiliated
Chamber/Public
Rank By Profit (before tax)
For the Period Public/Private
Rank in Top 500 in 2012
Profit (Before Tax)for the
Period (TL)
PROFIT
1 Türkiye Petrolleri Anonim Ortaklığı Public 1 1.471.136.277 252 TÜPRAŞ-Türkiye Petrol Rafinerileri A.Ş. Kocaeli 1 1.183.493.662 13 Türkiye Kömür İşletmeleri Kurumu Public 2 860.015.795 154 - - - - -5 Eti Maden İşletmeleri Genel Müdürlüğü Public 3 779.076.724 416 Koza Altın İşletmeleri A.Ş. Ankara 3 712.747.544 727 Tüprag Metal Madencilik San. ve Tic. A.Ş. Ankara 4 681.692.288 678 TOFAŞ Türk Otomobil Fabrikası A.Ş. İstanbul 5 535.643.853 69 Ford Otomotiv Sanayi A.Ş. İstanbul 6 502.155.243 210 - - - - -11 - - - - -12 EÜAŞ Elektrik Üretim A.Ş. Genel Müdürlüğü Public 4 423.448.443 513 Anadolu Efes Biracılık ve Malt Sanayii A.Ş. İstanbul 9 354.897.086 6814 AKSA Akrilik Kimya Sanayii A.Ş. İstanbul 10 335.345.461 3615 Türk Traktör ve Ziraat Makineleri A.Ş. Ankara 11 297.701.096 3216 Eti Bakır A.Ş. İnebolu 12 289.923.990 10817 Çayeli Bakır İşletmeleri A.Ş. Çayeli 13 254.205.619 15718 Aselsan Elektronik San. ve Tic. A.Ş. Ankara 14 244.902.216 4619 - - - - -20 Erdemir Madencilik San. ve Tic. A.Ş. Sivas 16 239.520.899 16021 Yıldız Entegre Ağaç San. ve Tic. A.Ş. Kocaeli 17 232.538.007 4522 - - - - -23 Coca-Cola İçecek A.Ş. İstanbul 19 224.293.664 3324 Gübre Fabrikaları T.A.Ş. İstanbul 20 214.018.006 21525 BSH Ev Aletleri San. ve Tic. A.Ş. İstanbul 21 210.674.549 1826 Kastamonu Entegre Ağaç San. ve Tic. A.Ş. İstanbul 22 210.243.727 4227 TUSAŞ-Türk Havacılık ve Uzay Sanayii A.Ş. Ankara 23 209.611.535 8328 Arçelik A.Ş. İstanbul 24 209.606.787 429 - - - - -30 Hürriyet Gazetecilik ve Matbaacılık A.Ş. İstanbul 26 196.551.025 13131 - - - - -32 ROKETSAN Roket San. ve Tic. A.Ş. Ankara 28 189.572.680 19333 Siemens San. ve Tic. A.Ş. İstanbul 29 185.761.614 7034 Aygaz A.Ş. İstanbul 30 170.058.084 1035 Gemlik Gübre Sanayii A.Ş. Gemlik 31 164.661.027 13936 Cargill Tarım ve Gıda San. Tic. A.Ş. İstanbul 32 159.819.971 22537 Akçansa Çimento San. ve Tic. A.Ş. İstanbul 33 156.165.842 7538 İçdaş Elektrik Enerjisi Üretim ve Yatırım A.Ş. Çanakkale 34 150.048.106 10639 Ereğli Demir ve Çelik Fabrikaları T.A.Ş. Ereğli/Kdz 35 146.783.470 840 - - - - -41 Trakya Cam Sanayii A.Ş. İstanbul 37 146.447.002 10542 Konya Şeker San. ve Tic. A.Ş. Konya 38 142.782.148 4443 Makina ve Kimya Endüstrisi Kurumu (M.K.E.K.) Genel Müdürlüğü Public 5 138.807.779 10344 - - - - -45 Çimsa Çimento San. ve Tic. A.Ş. Mersin 40 134.096.514 8846 Toros Tarım San. ve Tic. A.Ş. İstanbul 41 133.554.338 5147 SÜTAŞ Süt Ürünleri A.Ş. Karacabey 42 128.352.668 5648 Ülker Çikolata Sanayi A.Ş. İstanbul 43 125.051.662 9349 Vestel Elektronik San. ve Tic. A.Ş. İstanbul 44 121.715.107 1450 - - - - -
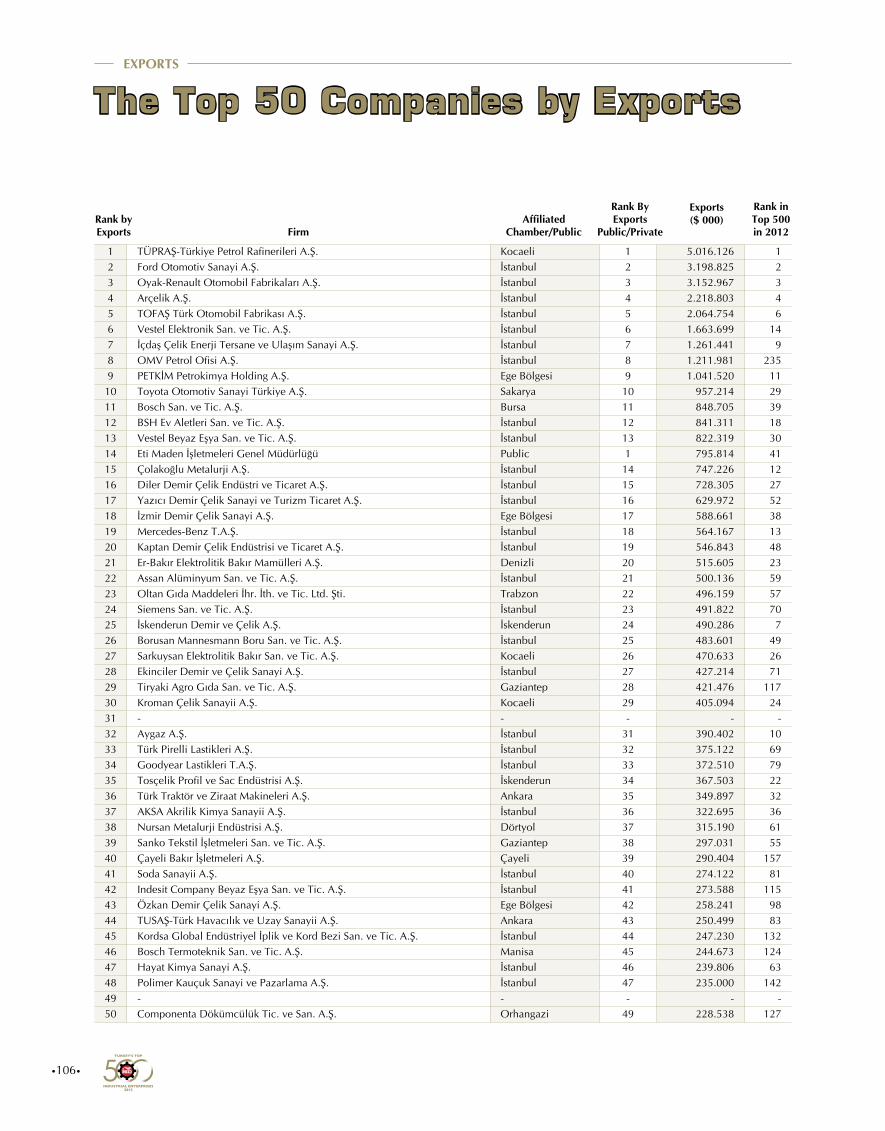
•106•
The Top 50 Companies by Exports
FirmAffiliated
Chamber/Public
Exports ($ 000)
EXPORTS
Rank by Exports
Rank By Exports
Public/Private
Rank in Top 500 in 2012
1 TÜPRAŞ-Türkiye Petrol Rafinerileri A.Ş. Kocaeli 1 5.016.126 12 Ford Otomotiv Sanayi A.Ş. İstanbul 2 3.198.825 23 Oyak-Renault Otomobil Fabrikaları A.Ş. İstanbul 3 3.152.967 34 Arçelik A.Ş. İstanbul 4 2.218.803 45 TOFAŞ Türk Otomobil Fabrikası A.Ş. İstanbul 5 2.064.754 66 Vestel Elektronik San. ve Tic. A.Ş. İstanbul 6 1.663.699 147 İçdaş Çelik Enerji Tersane ve Ulaşım Sanayi A.Ş. İstanbul 7 1.261.441 98 OMV Petrol Ofisi A.Ş. İstanbul 8 1.211.981 2359 PETKİM Petrokimya Holding A.Ş. Ege Bölgesi 9 1.041.520 1110 Toyota Otomotiv Sanayi Türkiye A.Ş. Sakarya 10 957.214 2911 Bosch San. ve Tic. A.Ş. Bursa 11 848.705 3912 BSH Ev Aletleri San. ve Tic. A.Ş. İstanbul 12 841.311 1813 Vestel Beyaz Eşya San. ve Tic. A.Ş. İstanbul 13 822.319 3014 Eti Maden İşletmeleri Genel Müdürlüğü Public 1 795.814 4115 Çolakoğlu Metalurji A.Ş. İstanbul 14 747.226 1216 Diler Demir Çelik Endüstri ve Ticaret A.Ş. İstanbul 15 728.305 2717 Yazıcı Demir Çelik Sanayi ve Turizm Ticaret A.Ş. İstanbul 16 629.972 5218 İzmir Demir Çelik Sanayi A.Ş. Ege Bölgesi 17 588.661 3819 Mercedes-Benz T.A.Ş. İstanbul 18 564.167 1320 Kaptan Demir Çelik Endüstrisi ve Ticaret A.Ş. İstanbul 19 546.843 4821 Er-Bakır Elektrolitik Bakır Mamülleri A.Ş. Denizli 20 515.605 2322 Assan Alüminyum San. ve Tic. A.Ş. İstanbul 21 500.136 5923 Oltan Gıda Maddeleri İhr. İth. ve Tic. Ltd. Şti. Trabzon 22 496.159 5724 Siemens San. ve Tic. A.Ş. İstanbul 23 491.822 7025 İskenderun Demir ve Çelik A.Ş. İskenderun 24 490.286 726 Borusan Mannesmann Boru San. ve Tic. A.Ş. İstanbul 25 483.601 4927 Sarkuysan Elektrolitik Bakır San. ve Tic. A.Ş. Kocaeli 26 470.633 2628 Ekinciler Demir ve Çelik Sanayi A.Ş. İstanbul 27 427.214 7129 Tiryaki Agro Gıda San. ve Tic. A.Ş. Gaziantep 28 421.476 11730 Kroman Çelik Sanayii A.Ş. Kocaeli 29 405.094 2431 - - - - -32 Aygaz A.Ş. İstanbul 31 390.402 1033 Türk Pirelli Lastikleri A.Ş. İstanbul 32 375.122 6934 Goodyear Lastikleri T.A.Ş. İstanbul 33 372.510 7935 Tosçelik Profil ve Sac Endüstrisi A.Ş. İskenderun 34 367.503 2236 Türk Traktör ve Ziraat Makineleri A.Ş. Ankara 35 349.897 3237 AKSA Akrilik Kimya Sanayii A.Ş. İstanbul 36 322.695 3638 Nursan Metalurji Endüstrisi A.Ş. Dörtyol 37 315.190 6139 Sanko Tekstil İşletmeleri San. ve Tic. A.Ş. Gaziantep 38 297.031 5540 Çayeli Bakır İşletmeleri A.Ş. Çayeli 39 290.404 15741 Soda Sanayii A.Ş. İstanbul 40 274.122 8142 Indesit Company Beyaz Eşya San. ve Tic. A.Ş. İstanbul 41 273.588 11543 Özkan Demir Çelik Sanayi A.Ş. Ege Bölgesi 42 258.241 9844 TUSAŞ-Türk Havacılık ve Uzay Sanayii A.Ş. Ankara 43 250.499 8345 Kordsa Global Endüstriyel İplik ve Kord Bezi San. ve Tic. A.Ş. İstanbul 44 247.230 13246 Bosch Termoteknik San. ve Tic. A.Ş. Manisa 45 244.673 12447 Hayat Kimya Sanayi A.Ş. İstanbul 46 239.806 6348 Polimer Kauçuk Sanayi ve Pazarlama A.Ş. İstanbul 47 235.000 14249 - - - - -50 Componenta Dökümcülük Tic. ve San. A.Ş. Orhangazi 49 228.538 127
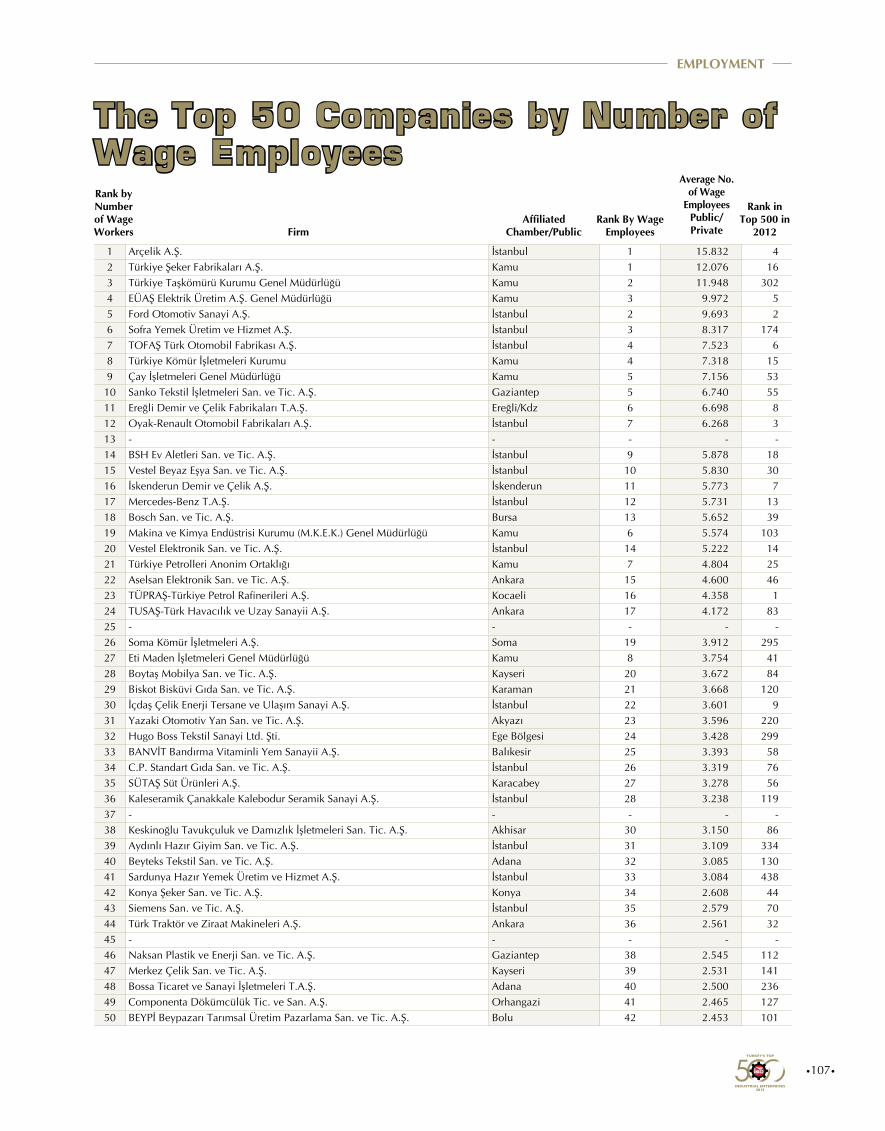
•107•
EMPLOYMENT
The Top 50 Companies by Number of Wage Employees
FirmAffiliated
Chamber/PublicRank By Wage
Employees
Rank by Number of Wage Workers
Rank in Top 500 in
2012
Average No. of Wage
Employees Public/Private
1 Arçelik A.Ş. İstanbul 1 15.832 42 Türkiye Şeker Fabrikaları A.Ş. Kamu 1 12.076 163 Türkiye Taşkömürü Kurumu Genel Müdürlüğü Kamu 2 11.948 3024 EÜAŞ Elektrik Üretim A.Ş. Genel Müdürlüğü Kamu 3 9.972 55 Ford Otomotiv Sanayi A.Ş. İstanbul 2 9.693 26 Sofra Yemek Üretim ve Hizmet A.Ş. İstanbul 3 8.317 1747 TOFAŞ Türk Otomobil Fabrikası A.Ş. İstanbul 4 7.523 68 Türkiye Kömür İşletmeleri Kurumu Kamu 4 7.318 159 Çay İşletmeleri Genel Müdürlüğü Kamu 5 7.156 5310 Sanko Tekstil İşletmeleri San. ve Tic. A.Ş. Gaziantep 5 6.740 5511 Ereğli Demir ve Çelik Fabrikaları T.A.Ş. Ereğli/Kdz 6 6.698 812 Oyak-Renault Otomobil Fabrikaları A.Ş. İstanbul 7 6.268 313 - - - - -14 BSH Ev Aletleri San. ve Tic. A.Ş. İstanbul 9 5.878 1815 Vestel Beyaz Eşya San. ve Tic. A.Ş. İstanbul 10 5.830 3016 İskenderun Demir ve Çelik A.Ş. İskenderun 11 5.773 717 Mercedes-Benz T.A.Ş. İstanbul 12 5.731 1318 Bosch San. ve Tic. A.Ş. Bursa 13 5.652 3919 Makina ve Kimya Endüstrisi Kurumu (M.K.E.K.) Genel Müdürlüğü Kamu 6 5.574 10320 Vestel Elektronik San. ve Tic. A.Ş. İstanbul 14 5.222 1421 Türkiye Petrolleri Anonim Ortaklığı Kamu 7 4.804 2522 Aselsan Elektronik San. ve Tic. A.Ş. Ankara 15 4.600 4623 TÜPRAŞ-Türkiye Petrol Rafinerileri A.Ş. Kocaeli 16 4.358 124 TUSAŞ-Türk Havacılık ve Uzay Sanayii A.Ş. Ankara 17 4.172 8325 - - - - -26 Soma Kömür İşletmeleri A.Ş. Soma 19 3.912 29527 Eti Maden İşletmeleri Genel Müdürlüğü Kamu 8 3.754 4128 Boytaş Mobilya San. ve Tic. A.Ş. Kayseri 20 3.672 8429 Biskot Bisküvi Gıda San. ve Tic. A.Ş. Karaman 21 3.668 12030 İçdaş Çelik Enerji Tersane ve Ulaşım Sanayi A.Ş. İstanbul 22 3.601 931 Yazaki Otomotiv Yan San. ve Tic. A.Ş. Akyazı 23 3.596 22032 Hugo Boss Tekstil Sanayi Ltd. Şti. Ege Bölgesi 24 3.428 29933 BANVİT Bandırma Vitaminli Yem Sanayii A.Ş. Balıkesir 25 3.393 5834 C.P. Standart Gıda San. ve Tic. A.Ş. İstanbul 26 3.319 7635 SÜTAŞ Süt Ürünleri A.Ş. Karacabey 27 3.278 5636 Kaleseramik Çanakkale Kalebodur Seramik Sanayi A.Ş. İstanbul 28 3.238 11937 - - - - -38 Keskinoğlu Tavukçuluk ve Damızlık İşletmeleri San. Tic. A.Ş. Akhisar 30 3.150 8639 Aydınlı Hazır Giyim San. ve Tic. A.Ş. İstanbul 31 3.109 33440 Beyteks Tekstil San. ve Tic. A.Ş. Adana 32 3.085 13041 Sardunya Hazır Yemek Üretim ve Hizmet A.Ş. İstanbul 33 3.084 43842 Konya Şeker San. ve Tic. A.Ş. Konya 34 2.608 4443 Siemens San. ve Tic. A.Ş. İstanbul 35 2.579 7044 Türk Traktör ve Ziraat Makineleri A.Ş. Ankara 36 2.561 3245 - - - - -46 Naksan Plastik ve Enerji San. ve Tic. A.Ş. Gaziantep 38 2.545 11247 Merkez Çelik San. ve Tic. A.Ş. Kayseri 39 2.531 14148 Bossa Ticaret ve Sanayi İşletmeleri T.A.Ş. Adana 40 2.500 23649 Componenta Dökümcülük Tic. ve San. A.Ş. Orhangazi 41 2.465 12750 BEYPİ Beypazarı Tarımsal Üretim Pazarlama San. ve Tic. A.Ş. Bolu 42 2.453 101
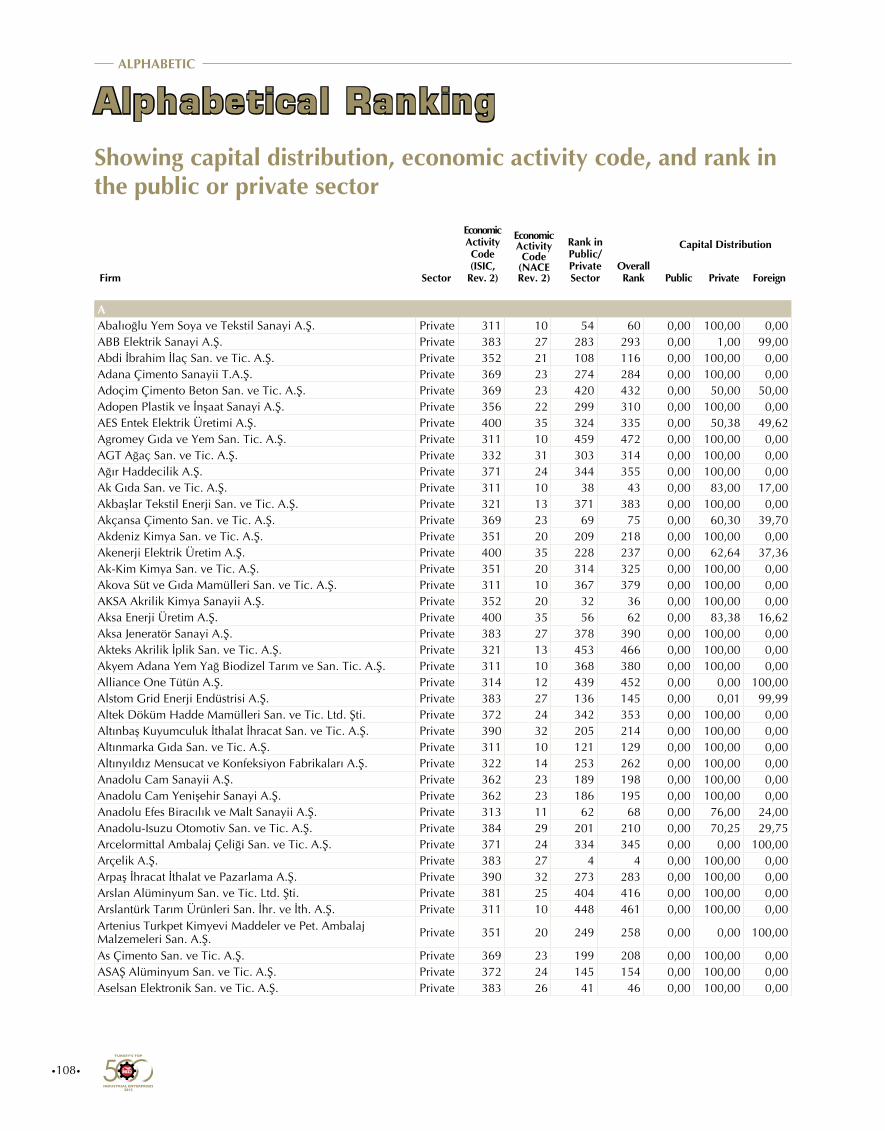
•108•
Alphabetical RankingShowing capital distribution, economic activity code, and rank in the public or private sector
ALPHABETIC
AAbalıoğlu Yem Soya ve Tekstil Sanayi A.Ş. Private 311 10 54 60 0,00 100,00 0,00ABB Elektrik Sanayi A.Ş. Private 383 27 283 293 0,00 1,00 99,00Abdi İbrahim İlaç San. ve Tic. A.Ş. Private 352 21 108 116 0,00 100,00 0,00Adana Çimento Sanayii T.A.Ş. Private 369 23 274 284 0,00 100,00 0,00Adoçim Çimento Beton San. ve Tic. A.Ş. Private 369 23 420 432 0,00 50,00 50,00Adopen Plastik ve İnşaat Sanayi A.Ş. Private 356 22 299 310 0,00 100,00 0,00AES Entek Elektrik Üretimi A.Ş. Private 400 35 324 335 0,00 50,38 49,62Agromey Gıda ve Yem San. Tic. A.Ş. Private 311 10 459 472 0,00 100,00 0,00AGT Ağaç San. ve Tic. A.Ş. Private 332 31 303 314 0,00 100,00 0,00Ağır Haddecilik A.Ş. Private 371 24 344 355 0,00 100,00 0,00Ak Gıda San. ve Tic. A.Ş. Private 311 10 38 43 0,00 83,00 17,00Akbaşlar Tekstil Enerji San. ve Tic. A.Ş. Private 321 13 371 383 0,00 100,00 0,00Akçansa Çimento San. ve Tic. A.Ş. Private 369 23 69 75 0,00 60,30 39,70Akdeniz Kimya San. ve Tic. A.Ş. Private 351 20 209 218 0,00 100,00 0,00Akenerji Elektrik Üretim A.Ş. Private 400 35 228 237 0,00 62,64 37,36Ak-Kim Kimya San. ve Tic. A.Ş. Private 351 20 314 325 0,00 100,00 0,00Akova Süt ve Gıda Mamülleri San. ve Tic. A.Ş. Private 311 10 367 379 0,00 100,00 0,00AKSA Akrilik Kimya Sanayii A.Ş. Private 352 20 32 36 0,00 100,00 0,00Aksa Enerji Üretim A.Ş. Private 400 35 56 62 0,00 83,38 16,62Aksa Jeneratör Sanayi A.Ş. Private 383 27 378 390 0,00 100,00 0,00Akteks Akrilik İplik San. ve Tic. A.Ş. Private 321 13 453 466 0,00 100,00 0,00Akyem Adana Yem Yağ Biodizel Tarım ve San. Tic. A.Ş. Private 311 10 368 380 0,00 100,00 0,00Alliance One Tütün A.Ş. Private 314 12 439 452 0,00 0,00 100,00Alstom Grid Enerji Endüstrisi A.Ş. Private 383 27 136 145 0,00 0,01 99,99Altek Döküm Hadde Mamülleri San. ve Tic. Ltd. Şti. Private 372 24 342 353 0,00 100,00 0,00Altınbaş Kuyumculuk İthalat İhracat San. ve Tic. A.Ş. Private 390 32 205 214 0,00 100,00 0,00Altınmarka Gıda San. ve Tic. A.Ş. Private 311 10 121 129 0,00 100,00 0,00Altınyıldız Mensucat ve Konfeksiyon Fabrikaları A.Ş. Private 322 14 253 262 0,00 100,00 0,00Anadolu Cam Sanayii A.Ş. Private 362 23 189 198 0,00 100,00 0,00Anadolu Cam Yenişehir Sanayi A.Ş. Private 362 23 186 195 0,00 100,00 0,00Anadolu Efes Biracılık ve Malt Sanayii A.Ş. Private 313 11 62 68 0,00 76,00 24,00Anadolu-Isuzu Otomotiv San. ve Tic. A.Ş. Private 384 29 201 210 0,00 70,25 29,75Arcelormittal Ambalaj Çeliği San. ve Tic. A.Ş. Private 371 24 334 345 0,00 0,00 100,00Arçelik A.Ş. Private 383 27 4 4 0,00 100,00 0,00Arpaş İhracat İthalat ve Pazarlama A.Ş. Private 390 32 273 283 0,00 100,00 0,00Arslan Alüminyum San. ve Tic. Ltd. Şti. Private 381 25 404 416 0,00 100,00 0,00Arslantürk Tarım Ürünleri San. İhr. ve İth. A.Ş. Private 311 10 448 461 0,00 100,00 0,00Artenius Turkpet Kimyevi Maddeler ve Pet. Ambalaj Malzemeleri San. A.Ş. Private 351 20 249 258 0,00 0,00 100,00
As Çimento San. ve Tic. A.Ş. Private 369 23 199 208 0,00 100,00 0,00ASAŞ Alüminyum San. ve Tic. A.Ş. Private 372 24 145 154 0,00 100,00 0,00Aselsan Elektronik San. ve Tic. A.Ş. Private 383 26 41 46 0,00 100,00 0,00
Firm Sector
Economic Activity Code (ISIC,
Rev. 2)
Economic Activity Code
(NACE Rev. 2)
Rank in Public/Private Sector
Overall Rank
Capital Distribution
Public Private Foreign
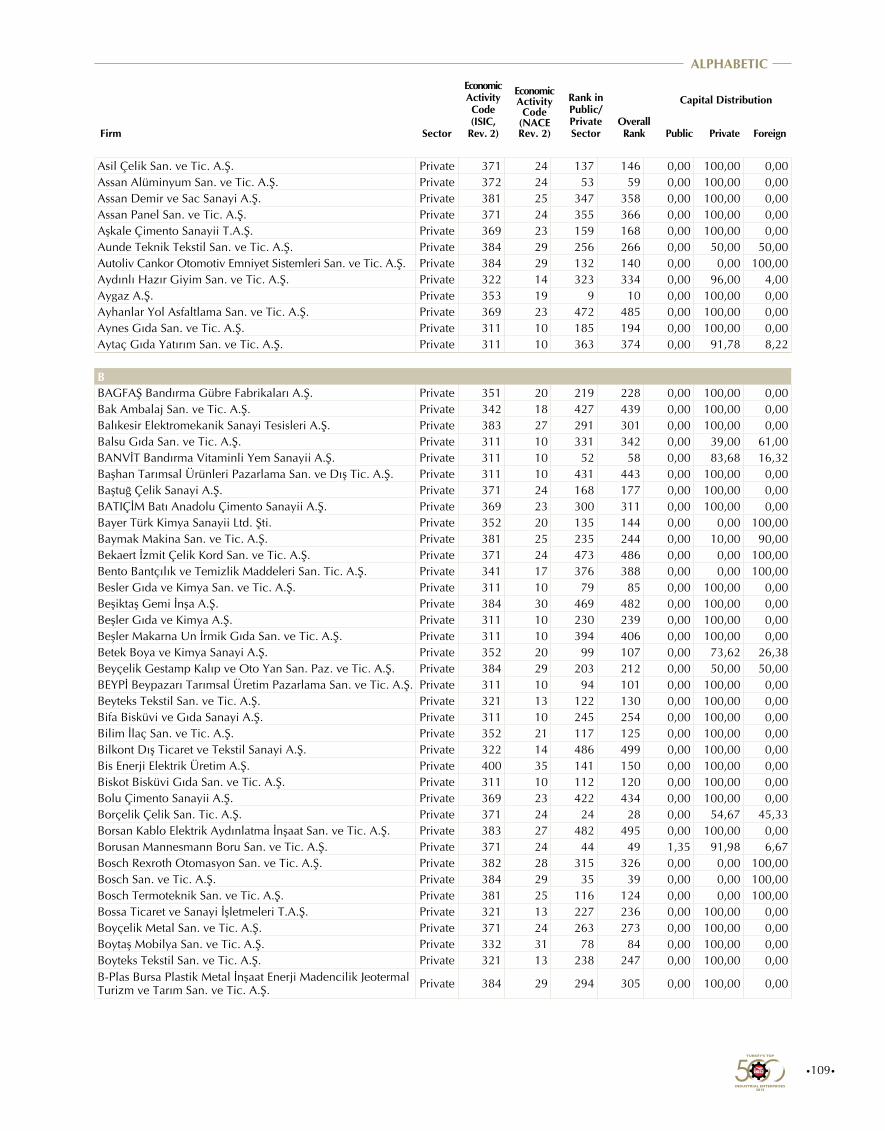
•109•
ALPHABETIC
Asil Çelik San. ve Tic. A.Ş. Private 371 24 137 146 0,00 100,00 0,00Assan Alüminyum San. ve Tic. A.Ş. Private 372 24 53 59 0,00 100,00 0,00Assan Demir ve Sac Sanayi A.Ş. Private 381 25 347 358 0,00 100,00 0,00Assan Panel San. ve Tic. A.Ş. Private 371 24 355 366 0,00 100,00 0,00Aşkale Çimento Sanayii T.A.Ş. Private 369 23 159 168 0,00 100,00 0,00Aunde Teknik Tekstil San. ve Tic. A.Ş. Private 384 29 256 266 0,00 50,00 50,00Autoliv Cankor Otomotiv Emniyet Sistemleri San. ve Tic. A.Ş. Private 384 29 132 140 0,00 0,00 100,00Aydınlı Hazır Giyim San. ve Tic. A.Ş. Private 322 14 323 334 0,00 96,00 4,00Aygaz A.Ş. Private 353 19 9 10 0,00 100,00 0,00Ayhanlar Yol Asfaltlama San. ve Tic. A.Ş. Private 369 23 472 485 0,00 100,00 0,00Aynes Gıda San. ve Tic. A.Ş. Private 311 10 185 194 0,00 100,00 0,00Aytaç Gıda Yatırım San. ve Tic. A.Ş. Private 311 10 363 374 0,00 91,78 8,22
BBAGFAŞ Bandırma Gübre Fabrikaları A.Ş. Private 351 20 219 228 0,00 100,00 0,00Bak Ambalaj San. ve Tic. A.Ş. Private 342 18 427 439 0,00 100,00 0,00Balıkesir Elektromekanik Sanayi Tesisleri A.Ş. Private 383 27 291 301 0,00 100,00 0,00Balsu Gıda San. ve Tic. A.Ş. Private 311 10 331 342 0,00 39,00 61,00BANVİT Bandırma Vitaminli Yem Sanayii A.Ş. Private 311 10 52 58 0,00 83,68 16,32Başhan Tarımsal Ürünleri Pazarlama San. ve Dış Tic. A.Ş. Private 311 10 431 443 0,00 100,00 0,00Baştuğ Çelik Sanayi A.Ş. Private 371 24 168 177 0,00 100,00 0,00BATIÇİM Batı Anadolu Çimento Sanayii A.Ş. Private 369 23 300 311 0,00 100,00 0,00Bayer Türk Kimya Sanayii Ltd. Şti. Private 352 20 135 144 0,00 0,00 100,00Baymak Makina San. ve Tic. A.Ş. Private 381 25 235 244 0,00 10,00 90,00Bekaert İzmit Çelik Kord San. ve Tic. A.Ş. Private 371 24 473 486 0,00 0,00 100,00Bento Bantçılık ve Temizlik Maddeleri San. Tic. A.Ş. Private 341 17 376 388 0,00 0,00 100,00Besler Gıda ve Kimya San. ve Tic. A.Ş. Private 311 10 79 85 0,00 100,00 0,00Beşiktaş Gemi İnşa A.Ş. Private 384 30 469 482 0,00 100,00 0,00Beşler Gıda ve Kimya A.Ş. Private 311 10 230 239 0,00 100,00 0,00Beşler Makarna Un İrmik Gıda San. ve Tic. A.Ş. Private 311 10 394 406 0,00 100,00 0,00Betek Boya ve Kimya Sanayi A.Ş. Private 352 20 99 107 0,00 73,62 26,38Beyçelik Gestamp Kalıp ve Oto Yan San. Paz. ve Tic. A.Ş. Private 384 29 203 212 0,00 50,00 50,00BEYPİ Beypazarı Tarımsal Üretim Pazarlama San. ve Tic. A.Ş. Private 311 10 94 101 0,00 100,00 0,00Beyteks Tekstil San. ve Tic. A.Ş. Private 321 13 122 130 0,00 100,00 0,00Bifa Bisküvi ve Gıda Sanayi A.Ş. Private 311 10 245 254 0,00 100,00 0,00Bilim İlaç San. ve Tic. A.Ş. Private 352 21 117 125 0,00 100,00 0,00Bilkont Dış Ticaret ve Tekstil Sanayi A.Ş. Private 322 14 486 499 0,00 100,00 0,00Bis Enerji Elektrik Üretim A.Ş. Private 400 35 141 150 0,00 100,00 0,00Biskot Bisküvi Gıda San. ve Tic. A.Ş. Private 311 10 112 120 0,00 100,00 0,00Bolu Çimento Sanayii A.Ş. Private 369 23 422 434 0,00 100,00 0,00Borçelik Çelik San. Tic. A.Ş. Private 371 24 24 28 0,00 54,67 45,33Borsan Kablo Elektrik Aydınlatma İnşaat San. ve Tic. A.Ş. Private 383 27 482 495 0,00 100,00 0,00Borusan Mannesmann Boru San. ve Tic. A.Ş. Private 371 24 44 49 1,35 91,98 6,67Bosch Rexroth Otomasyon San. ve Tic. A.Ş. Private 382 28 315 326 0,00 0,00 100,00Bosch San. ve Tic. A.Ş. Private 384 29 35 39 0,00 0,00 100,00Bosch Termoteknik San. ve Tic. A.Ş. Private 381 25 116 124 0,00 0,00 100,00Bossa Ticaret ve Sanayi İşletmeleri T.A.Ş. Private 321 13 227 236 0,00 100,00 0,00Boyçelik Metal San. ve Tic. A.Ş. Private 371 24 263 273 0,00 100,00 0,00Boytaş Mobilya San. ve Tic. A.Ş. Private 332 31 78 84 0,00 100,00 0,00Boyteks Tekstil San. ve Tic. A.Ş. Private 321 13 238 247 0,00 100,00 0,00B-Plas Bursa Plastik Metal İnşaat Enerji Madencilik Jeotermal Turizm ve Tarım San. ve Tic. A.Ş. Private 384 29 294 305 0,00 100,00 0,00
Firm Sector
Economic Activity Code (ISIC,
Rev. 2)
Economic Activity Code
(NACE Rev. 2)
Rank in Public/Private Sector
Overall Rank
Capital Distribution
Public Private Foreign
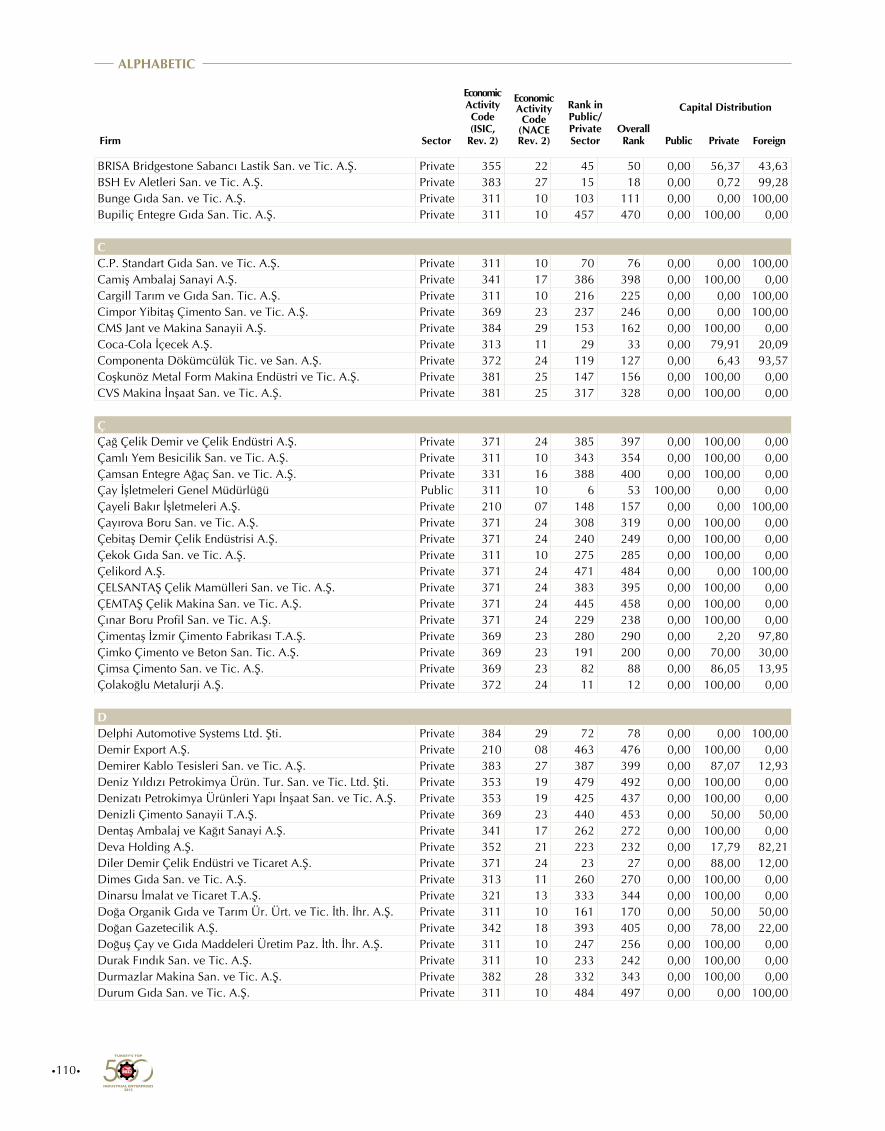
•110•
ALPHABETIC
Firm Sector
Economic Activity Code (ISIC,
Rev. 2)
Economic Activity Code
(NACE Rev. 2)
Rank in Public/Private Sector
Overall Rank
Capital Distribution
Public Private Foreign
BRISA Bridgestone Sabancı Lastik San. ve Tic. A.Ş. Private 355 22 45 50 0,00 56,37 43,63BSH Ev Aletleri San. ve Tic. A.Ş. Private 383 27 15 18 0,00 0,72 99,28Bunge Gıda San. ve Tic. A.Ş. Private 311 10 103 111 0,00 0,00 100,00Bupiliç Entegre Gıda San. Tic. A.Ş. Private 311 10 457 470 0,00 100,00 0,00
CC.P. Standart Gıda San. ve Tic. A.Ş. Private 311 10 70 76 0,00 0,00 100,00Camiş Ambalaj Sanayi A.Ş. Private 341 17 386 398 0,00 100,00 0,00Cargill Tarım ve Gıda San. Tic. A.Ş. Private 311 10 216 225 0,00 0,00 100,00Cimpor Yibitaş Çimento San. ve Tic. A.Ş. Private 369 23 237 246 0,00 0,00 100,00CMS Jant ve Makina Sanayii A.Ş. Private 384 29 153 162 0,00 100,00 0,00Coca-Cola İçecek A.Ş. Private 313 11 29 33 0,00 79,91 20,09Componenta Dökümcülük Tic. ve San. A.Ş. Private 372 24 119 127 0,00 6,43 93,57Coşkunöz Metal Form Makina Endüstri ve Tic. A.Ş. Private 381 25 147 156 0,00 100,00 0,00CVS Makina İnşaat San. ve Tic. A.Ş. Private 381 25 317 328 0,00 100,00 0,00
ÇÇağ Çelik Demir ve Çelik Endüstri A.Ş. Private 371 24 385 397 0,00 100,00 0,00Çamlı Yem Besicilik San. ve Tic. A.Ş. Private 311 10 343 354 0,00 100,00 0,00Çamsan Entegre Ağaç San. ve Tic. A.Ş. Private 331 16 388 400 0,00 100,00 0,00Çay İşletmeleri Genel Müdürlüğü Public 311 10 6 53 100,00 0,00 0,00Çayeli Bakır İşletmeleri A.Ş. Private 210 07 148 157 0,00 0,00 100,00Çayırova Boru San. ve Tic. A.Ş. Private 371 24 308 319 0,00 100,00 0,00Çebitaş Demir Çelik Endüstrisi A.Ş. Private 371 24 240 249 0,00 100,00 0,00Çekok Gıda San. ve Tic. A.Ş. Private 311 10 275 285 0,00 100,00 0,00Çelikord A.Ş. Private 371 24 471 484 0,00 0,00 100,00ÇELSANTAŞ Çelik Mamülleri San. ve Tic. A.Ş. Private 371 24 383 395 0,00 100,00 0,00ÇEMTAŞ Çelik Makina San. ve Tic. A.Ş. Private 371 24 445 458 0,00 100,00 0,00Çınar Boru Profil San. ve Tic. A.Ş. Private 371 24 229 238 0,00 100,00 0,00Çimentaş İzmir Çimento Fabrikası T.A.Ş. Private 369 23 280 290 0,00 2,20 97,80Çimko Çimento ve Beton San. Tic. A.Ş. Private 369 23 191 200 0,00 70,00 30,00Çimsa Çimento San. ve Tic. A.Ş. Private 369 23 82 88 0,00 86,05 13,95Çolakoğlu Metalurji A.Ş. Private 372 24 11 12 0,00 100,00 0,00
DDelphi Automotive Systems Ltd. Şti. Private 384 29 72 78 0,00 0,00 100,00Demir Export A.Ş. Private 210 08 463 476 0,00 100,00 0,00Demirer Kablo Tesisleri San. ve Tic. A.Ş. Private 383 27 387 399 0,00 87,07 12,93Deniz Yıldızı Petrokimya Ürün. Tur. San. ve Tic. Ltd. Şti. Private 353 19 479 492 0,00 100,00 0,00Denizatı Petrokimya Ürünleri Yapı İnşaat San. ve Tic. A.Ş. Private 353 19 425 437 0,00 100,00 0,00Denizli Çimento Sanayii T.A.Ş. Private 369 23 440 453 0,00 50,00 50,00Dentaş Ambalaj ve Kağıt Sanayi A.Ş. Private 341 17 262 272 0,00 100,00 0,00Deva Holding A.Ş. Private 352 21 223 232 0,00 17,79 82,21Diler Demir Çelik Endüstri ve Ticaret A.Ş. Private 371 24 23 27 0,00 88,00 12,00Dimes Gıda San. ve Tic. A.Ş. Private 313 11 260 270 0,00 100,00 0,00Dinarsu İmalat ve Ticaret T.A.Ş. Private 321 13 333 344 0,00 100,00 0,00Doğa Organik Gıda ve Tarım Ür. Ürt. ve Tic. İth. İhr. A.Ş. Private 311 10 161 170 0,00 50,00 50,00Doğan Gazetecilik A.Ş. Private 342 18 393 405 0,00 78,00 22,00Doğuş Çay ve Gıda Maddeleri Üretim Paz. İth. İhr. A.Ş. Private 311 10 247 256 0,00 100,00 0,00Durak Fındık San. ve Tic. A.Ş. Private 311 10 233 242 0,00 100,00 0,00Durmazlar Makina San. ve Tic. A.Ş. Private 382 28 332 343 0,00 100,00 0,00Durum Gıda San. ve Tic. A.Ş. Private 311 10 484 497 0,00 0,00 100,00
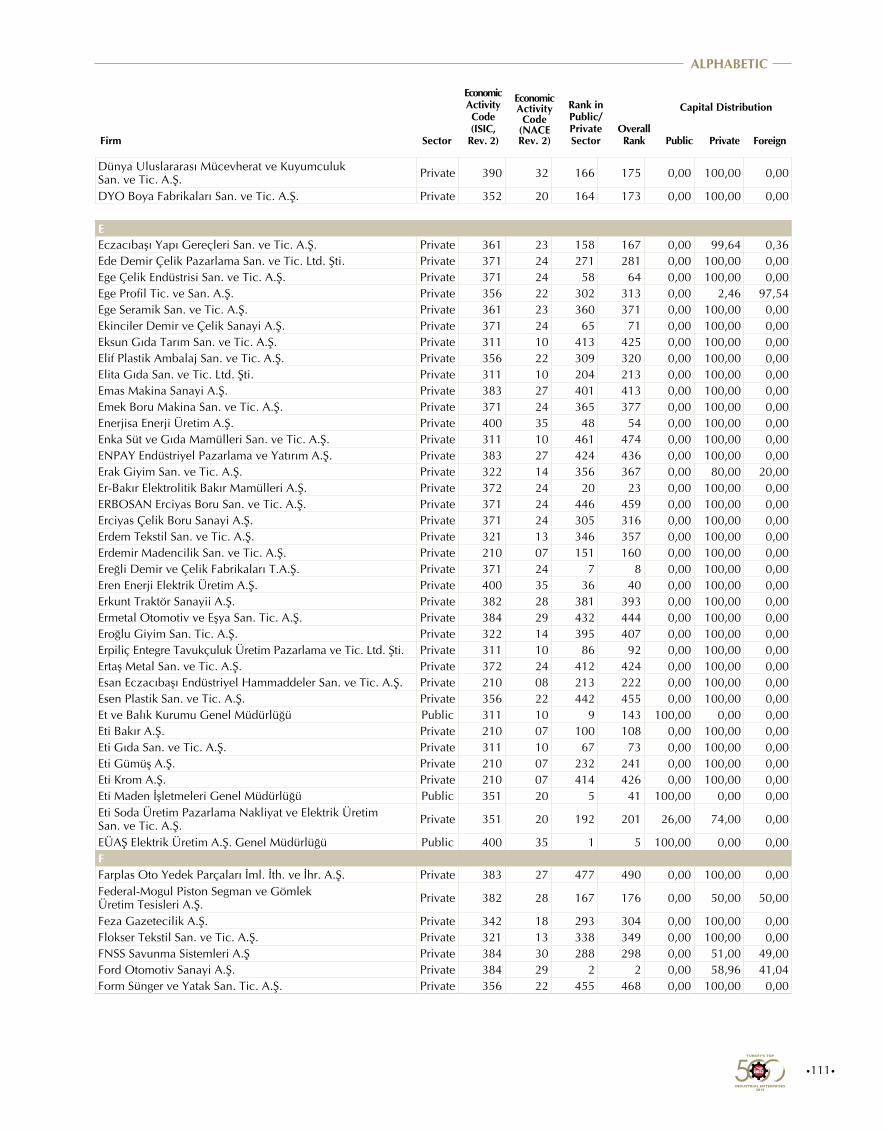
•111•
ALPHABETIC
Firm Sector
Economic Activity Code (ISIC,
Rev. 2)
Economic Activity Code
(NACE Rev. 2)
Rank in Public/Private Sector
Overall Rank
Capital Distribution
Public Private Foreign
Dünya Uluslararası Mücevherat ve Kuyumculuk San. ve Tic. A.Ş. Private 390 32 166 175 0,00 100,00 0,00
DYO Boya Fabrikaları San. ve Tic. A.Ş. Private 352 20 164 173 0,00 100,00 0,00
EEczacıbaşı Yapı Gereçleri San. ve Tic. A.Ş. Private 361 23 158 167 0,00 99,64 0,36Ede Demir Çelik Pazarlama San. ve Tic. Ltd. Şti. Private 371 24 271 281 0,00 100,00 0,00Ege Çelik Endüstrisi San. ve Tic. A.Ş. Private 371 24 58 64 0,00 100,00 0,00Ege Profil Tic. ve San. A.Ş. Private 356 22 302 313 0,00 2,46 97,54Ege Seramik San. ve Tic. A.Ş. Private 361 23 360 371 0,00 100,00 0,00Ekinciler Demir ve Çelik Sanayi A.Ş. Private 371 24 65 71 0,00 100,00 0,00Eksun Gıda Tarım San. ve Tic. A.Ş. Private 311 10 413 425 0,00 100,00 0,00Elif Plastik Ambalaj San. ve Tic. A.Ş. Private 356 22 309 320 0,00 100,00 0,00Elita Gıda San. ve Tic. Ltd. Şti. Private 311 10 204 213 0,00 100,00 0,00Emas Makina Sanayi A.Ş. Private 383 27 401 413 0,00 100,00 0,00Emek Boru Makina San. ve Tic. A.Ş. Private 371 24 365 377 0,00 100,00 0,00Enerjisa Enerji Üretim A.Ş. Private 400 35 48 54 0,00 100,00 0,00Enka Süt ve Gıda Mamülleri San. ve Tic. A.Ş. Private 311 10 461 474 0,00 100,00 0,00ENPAY Endüstriyel Pazarlama ve Yatırım A.Ş. Private 383 27 424 436 0,00 100,00 0,00Erak Giyim San. ve Tic. A.Ş. Private 322 14 356 367 0,00 80,00 20,00Er-Bakır Elektrolitik Bakır Mamülleri A.Ş. Private 372 24 20 23 0,00 100,00 0,00ERBOSAN Erciyas Boru San. ve Tic. A.Ş. Private 371 24 446 459 0,00 100,00 0,00Erciyas Çelik Boru Sanayi A.Ş. Private 371 24 305 316 0,00 100,00 0,00Erdem Tekstil San. ve Tic. A.Ş. Private 321 13 346 357 0,00 100,00 0,00Erdemir Madencilik San. ve Tic. A.Ş. Private 210 07 151 160 0,00 100,00 0,00Ereğli Demir ve Çelik Fabrikaları T.A.Ş. Private 371 24 7 8 0,00 100,00 0,00Eren Enerji Elektrik Üretim A.Ş. Private 400 35 36 40 0,00 100,00 0,00Erkunt Traktör Sanayii A.Ş. Private 382 28 381 393 0,00 100,00 0,00Ermetal Otomotiv ve Eşya San. Tic. A.Ş. Private 384 29 432 444 0,00 100,00 0,00Eroğlu Giyim San. Tic. A.Ş. Private 322 14 395 407 0,00 100,00 0,00Erpiliç Entegre Tavukçuluk Üretim Pazarlama ve Tic. Ltd. Şti. Private 311 10 86 92 0,00 100,00 0,00Ertaş Metal San. ve Tic. A.Ş. Private 372 24 412 424 0,00 100,00 0,00Esan Eczacıbaşı Endüstriyel Hammaddeler San. ve Tic. A.Ş. Private 210 08 213 222 0,00 100,00 0,00Esen Plastik San. ve Tic. A.Ş. Private 356 22 442 455 0,00 100,00 0,00Et ve Balık Kurumu Genel Müdürlüğü Public 311 10 9 143 100,00 0,00 0,00Eti Bakır A.Ş. Private 210 07 100 108 0,00 100,00 0,00Eti Gıda San. ve Tic. A.Ş. Private 311 10 67 73 0,00 100,00 0,00Eti Gümüş A.Ş. Private 210 07 232 241 0,00 100,00 0,00Eti Krom A.Ş. Private 210 07 414 426 0,00 100,00 0,00Eti Maden İşletmeleri Genel Müdürlüğü Public 351 20 5 41 100,00 0,00 0,00Eti Soda Üretim Pazarlama Nakliyat ve Elektrik Üretim San. ve Tic. A.Ş. Private 351 20 192 201 26,00 74,00 0,00
EÜAŞ Elektrik Üretim A.Ş. Genel Müdürlüğü Public 400 35 1 5 100,00 0,00 0,00FFarplas Oto Yedek Parçaları İml. İth. ve İhr. A.Ş. Private 383 27 477 490 0,00 100,00 0,00Federal-Mogul Piston Segman ve Gömlek Üretim Tesisleri A.Ş. Private 382 28 167 176 0,00 50,00 50,00
Feza Gazetecilik A.Ş. Private 342 18 293 304 0,00 100,00 0,00Flokser Tekstil San. ve Tic. A.Ş. Private 321 13 338 349 0,00 100,00 0,00FNSS Savunma Sistemleri A.Ş Private 384 30 288 298 0,00 51,00 49,00Ford Otomotiv Sanayi A.Ş. Private 384 29 2 2 0,00 58,96 41,04Form Sünger ve Yatak San. Tic. A.Ş. Private 356 22 455 468 0,00 100,00 0,00
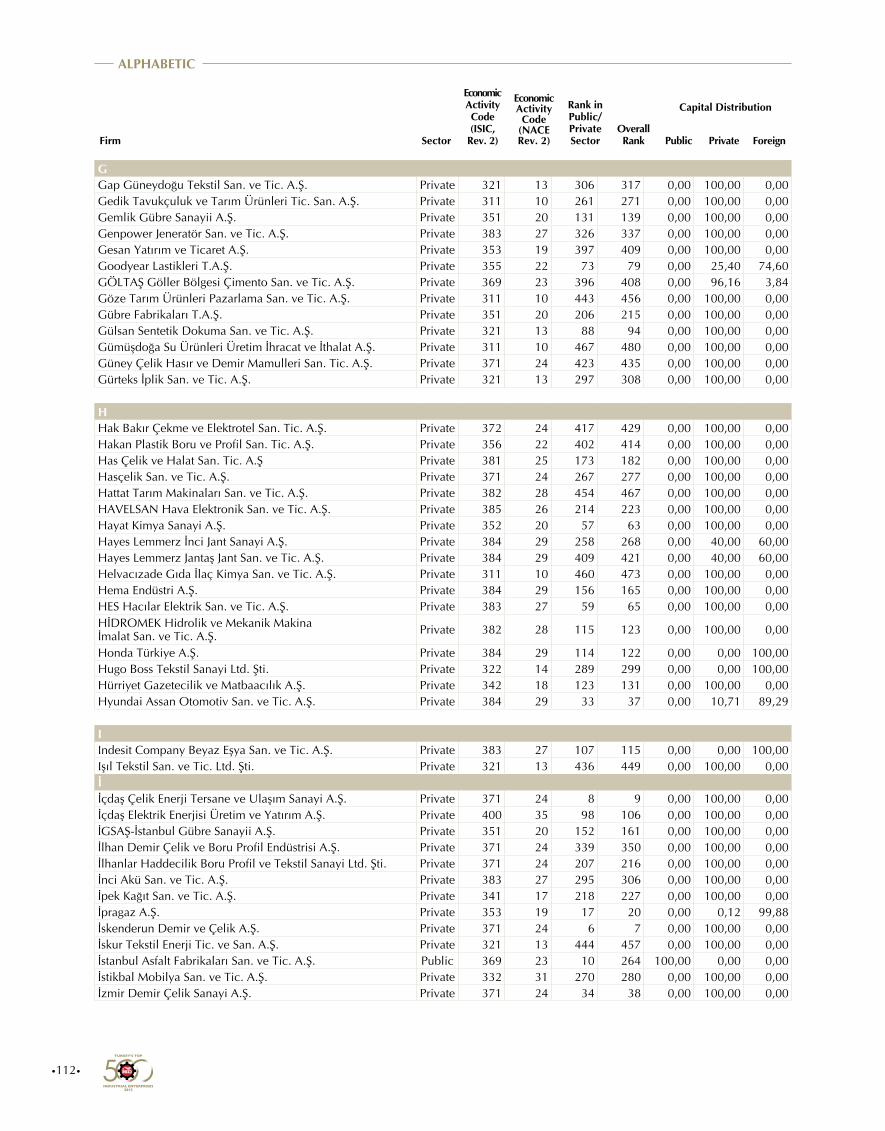
•112•
ALPHABETIC
Firm Sector
Economic Activity Code (ISIC,
Rev. 2)
Economic Activity Code
(NACE Rev. 2)
Rank in Public/Private Sector
Overall Rank
Capital Distribution
Public Private Foreign
GGap Güneydoğu Tekstil San. ve Tic. A.Ş. Private 321 13 306 317 0,00 100,00 0,00Gedik Tavukçuluk ve Tarım Ürünleri Tic. San. A.Ş. Private 311 10 261 271 0,00 100,00 0,00Gemlik Gübre Sanayii A.Ş. Private 351 20 131 139 0,00 100,00 0,00Genpower Jeneratör San. ve Tic. A.Ş. Private 383 27 326 337 0,00 100,00 0,00Gesan Yatırım ve Ticaret A.Ş. Private 353 19 397 409 0,00 100,00 0,00Goodyear Lastikleri T.A.Ş. Private 355 22 73 79 0,00 25,40 74,60GÖLTAŞ Göller Bölgesi Çimento San. ve Tic. A.Ş. Private 369 23 396 408 0,00 96,16 3,84Göze Tarım Ürünleri Pazarlama San. ve Tic. A.Ş. Private 311 10 443 456 0,00 100,00 0,00Gübre Fabrikaları T.A.Ş. Private 351 20 206 215 0,00 100,00 0,00Gülsan Sentetik Dokuma San. ve Tic. A.Ş. Private 321 13 88 94 0,00 100,00 0,00Gümüşdoğa Su Ürünleri Üretim İhracat ve İthalat A.Ş. Private 311 10 467 480 0,00 100,00 0,00Güney Çelik Hasır ve Demir Mamulleri San. Tic. A.Ş. Private 371 24 423 435 0,00 100,00 0,00Gürteks İplik San. ve Tic. A.Ş. Private 321 13 297 308 0,00 100,00 0,00
HHak Bakır Çekme ve Elektrotel San. Tic. A.Ş. Private 372 24 417 429 0,00 100,00 0,00Hakan Plastik Boru ve Profil San. Tic. A.Ş. Private 356 22 402 414 0,00 100,00 0,00Has Çelik ve Halat San. Tic. A.Ş Private 381 25 173 182 0,00 100,00 0,00Hasçelik San. ve Tic. A.Ş. Private 371 24 267 277 0,00 100,00 0,00Hattat Tarım Makinaları San. ve Tic. A.Ş. Private 382 28 454 467 0,00 100,00 0,00HAVELSAN Hava Elektronik San. ve Tic. A.Ş. Private 385 26 214 223 0,00 100,00 0,00Hayat Kimya Sanayi A.Ş. Private 352 20 57 63 0,00 100,00 0,00Hayes Lemmerz İnci Jant Sanayi A.Ş. Private 384 29 258 268 0,00 40,00 60,00Hayes Lemmerz Jantaş Jant San. ve Tic. A.Ş. Private 384 29 409 421 0,00 40,00 60,00Helvacızade Gıda İlaç Kimya San. ve Tic. A.Ş. Private 311 10 460 473 0,00 100,00 0,00Hema Endüstri A.Ş. Private 384 29 156 165 0,00 100,00 0,00HES Hacılar Elektrik San. ve Tic. A.Ş. Private 383 27 59 65 0,00 100,00 0,00HİDROMEK Hidrolik ve Mekanik Makina İmalat San. ve Tic. A.Ş. Private 382 28 115 123 0,00 100,00 0,00
Honda Türkiye A.Ş. Private 384 29 114 122 0,00 0,00 100,00Hugo Boss Tekstil Sanayi Ltd. Şti. Private 322 14 289 299 0,00 0,00 100,00Hürriyet Gazetecilik ve Matbaacılık A.Ş. Private 342 18 123 131 0,00 100,00 0,00Hyundai Assan Otomotiv San. ve Tic. A.Ş. Private 384 29 33 37 0,00 10,71 89,29
IIndesit Company Beyaz Eşya San. ve Tic. A.Ş. Private 383 27 107 115 0,00 0,00 100,00Işıl Tekstil San. ve Tic. Ltd. Şti. Private 321 13 436 449 0,00 100,00 0,00İİçdaş Çelik Enerji Tersane ve Ulaşım Sanayi A.Ş. Private 371 24 8 9 0,00 100,00 0,00İçdaş Elektrik Enerjisi Üretim ve Yatırım A.Ş. Private 400 35 98 106 0,00 100,00 0,00İGSAŞ-İstanbul Gübre Sanayii A.Ş. Private 351 20 152 161 0,00 100,00 0,00İlhan Demir Çelik ve Boru Profil Endüstrisi A.Ş. Private 371 24 339 350 0,00 100,00 0,00İlhanlar Haddecilik Boru Profil ve Tekstil Sanayi Ltd. Şti. Private 371 24 207 216 0,00 100,00 0,00İnci Akü San. ve Tic. A.Ş. Private 383 27 295 306 0,00 100,00 0,00İpek Kağıt San. ve Tic. A.Ş. Private 341 17 218 227 0,00 100,00 0,00İpragaz A.Ş. Private 353 19 17 20 0,00 0,12 99,88İskenderun Demir ve Çelik A.Ş. Private 371 24 6 7 0,00 100,00 0,00İskur Tekstil Enerji Tic. ve San. A.Ş. Private 321 13 444 457 0,00 100,00 0,00İstanbul Asfalt Fabrikaları San. ve Tic. A.Ş. Public 369 23 10 264 100,00 0,00 0,00İstikbal Mobilya San. ve Tic. A.Ş. Private 332 31 270 280 0,00 100,00 0,00İzmir Demir Çelik Sanayi A.Ş. Private 371 24 34 38 0,00 100,00 0,00
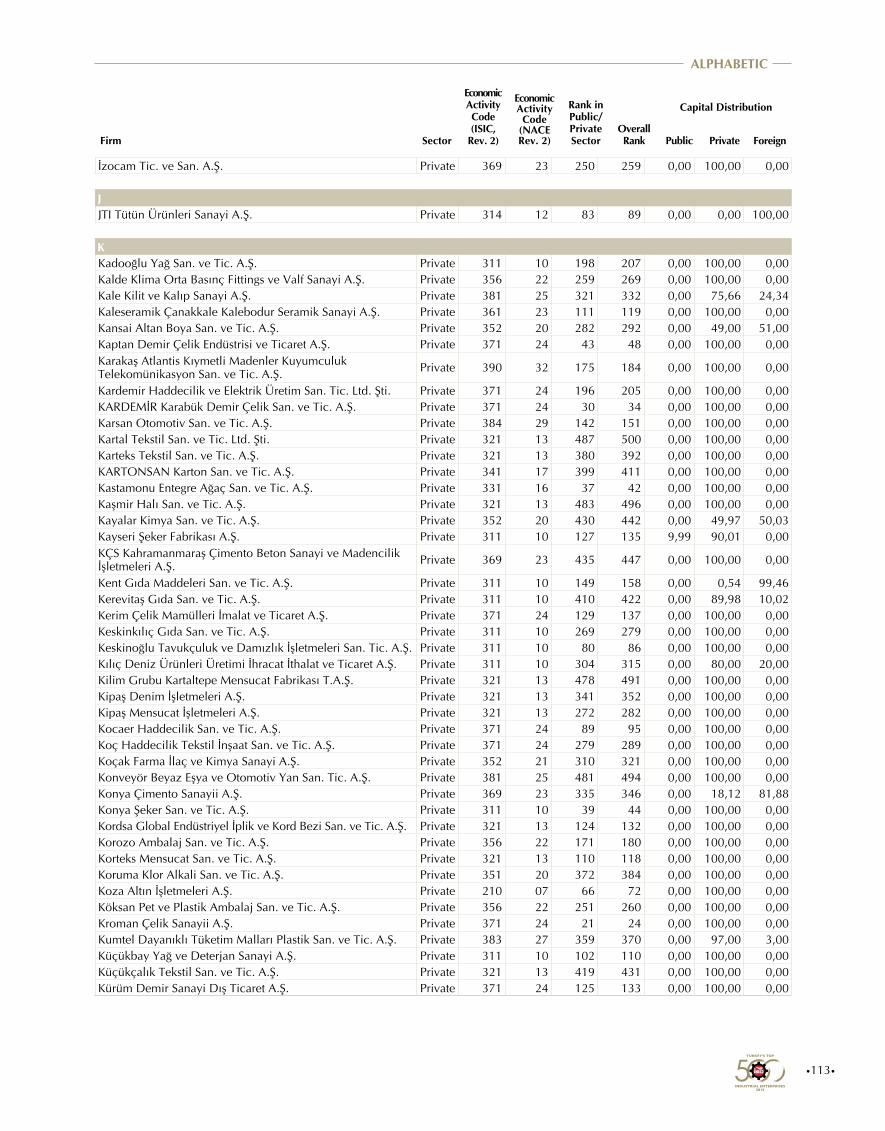
•113•
ALPHABETIC
Firm Sector
Economic Activity Code (ISIC,
Rev. 2)
Economic Activity Code
(NACE Rev. 2)
Rank in Public/Private Sector
Overall Rank
Capital Distribution
Public Private Foreign
İzocam Tic. ve San. A.Ş. Private 369 23 250 259 0,00 100,00 0,00
JJTI Tütün Ürünleri Sanayi A.Ş. Private 314 12 83 89 0,00 0,00 100,00
KKadooğlu Yağ San. ve Tic. A.Ş. Private 311 10 198 207 0,00 100,00 0,00Kalde Klima Orta Basınç Fittings ve Valf Sanayi A.Ş. Private 356 22 259 269 0,00 100,00 0,00Kale Kilit ve Kalıp Sanayi A.Ş. Private 381 25 321 332 0,00 75,66 24,34Kaleseramik Çanakkale Kalebodur Seramik Sanayi A.Ş. Private 361 23 111 119 0,00 100,00 0,00Kansai Altan Boya San. ve Tic. A.Ş. Private 352 20 282 292 0,00 49,00 51,00Kaptan Demir Çelik Endüstrisi ve Ticaret A.Ş. Private 371 24 43 48 0,00 100,00 0,00Karakaş Atlantis Kıymetli Madenler Kuyumculuk Telekomünikasyon San. ve Tic. A.Ş. Private 390 32 175 184 0,00 100,00 0,00
Kardemir Haddecilik ve Elektrik Üretim San. Tic. Ltd. Şti. Private 371 24 196 205 0,00 100,00 0,00KARDEMİR Karabük Demir Çelik San. ve Tic. A.Ş. Private 371 24 30 34 0,00 100,00 0,00Karsan Otomotiv San. ve Tic. A.Ş. Private 384 29 142 151 0,00 100,00 0,00Kartal Tekstil San. ve Tic. Ltd. Şti. Private 321 13 487 500 0,00 100,00 0,00Karteks Tekstil San. ve Tic. A.Ş. Private 321 13 380 392 0,00 100,00 0,00KARTONSAN Karton San. ve Tic. A.Ş. Private 341 17 399 411 0,00 100,00 0,00Kastamonu Entegre Ağaç San. ve Tic. A.Ş. Private 331 16 37 42 0,00 100,00 0,00Kaşmir Halı San. ve Tic. A.Ş. Private 321 13 483 496 0,00 100,00 0,00Kayalar Kimya San. ve Tic. A.Ş. Private 352 20 430 442 0,00 49,97 50,03Kayseri Şeker Fabrikası A.Ş. Private 311 10 127 135 9,99 90,01 0,00KÇS Kahramanmaraş Çimento Beton Sanayi ve Madencilik İşletmeleri A.Ş. Private 369 23 435 447 0,00 100,00 0,00
Kent Gıda Maddeleri San. ve Tic. A.Ş. Private 311 10 149 158 0,00 0,54 99,46Kerevitaş Gıda San. ve Tic. A.Ş. Private 311 10 410 422 0,00 89,98 10,02Kerim Çelik Mamülleri İmalat ve Ticaret A.Ş. Private 371 24 129 137 0,00 100,00 0,00Keskinkılıç Gıda San. ve Tic. A.Ş. Private 311 10 269 279 0,00 100,00 0,00Keskinoğlu Tavukçuluk ve Damızlık İşletmeleri San. Tic. A.Ş. Private 311 10 80 86 0,00 100,00 0,00Kılıç Deniz Ürünleri Üretimi İhracat İthalat ve Ticaret A.Ş. Private 311 10 304 315 0,00 80,00 20,00Kilim Grubu Kartaltepe Mensucat Fabrikası T.A.Ş. Private 321 13 478 491 0,00 100,00 0,00Kipaş Denim İşletmeleri A.Ş. Private 321 13 341 352 0,00 100,00 0,00Kipaş Mensucat İşletmeleri A.Ş. Private 321 13 272 282 0,00 100,00 0,00Kocaer Haddecilik San. ve Tic. A.Ş. Private 371 24 89 95 0,00 100,00 0,00Koç Haddecilik Tekstil İnşaat San. ve Tic. A.Ş. Private 371 24 279 289 0,00 100,00 0,00Koçak Farma İlaç ve Kimya Sanayi A.Ş. Private 352 21 310 321 0,00 100,00 0,00Konveyör Beyaz Eşya ve Otomotiv Yan San. Tic. A.Ş. Private 381 25 481 494 0,00 100,00 0,00Konya Çimento Sanayii A.Ş. Private 369 23 335 346 0,00 18,12 81,88Konya Şeker San. ve Tic. A.Ş. Private 311 10 39 44 0,00 100,00 0,00Kordsa Global Endüstriyel İplik ve Kord Bezi San. ve Tic. A.Ş. Private 321 13 124 132 0,00 100,00 0,00Korozo Ambalaj San. ve Tic. A.Ş. Private 356 22 171 180 0,00 100,00 0,00Korteks Mensucat San. ve Tic. A.Ş. Private 321 13 110 118 0,00 100,00 0,00Koruma Klor Alkali San. ve Tic. A.Ş. Private 351 20 372 384 0,00 100,00 0,00Koza Altın İşletmeleri A.Ş. Private 210 07 66 72 0,00 100,00 0,00Köksan Pet ve Plastik Ambalaj San. ve Tic. A.Ş. Private 356 22 251 260 0,00 100,00 0,00Kroman Çelik Sanayii A.Ş. Private 371 24 21 24 0,00 100,00 0,00Kumtel Dayanıklı Tüketim Malları Plastik San. ve Tic. A.Ş. Private 383 27 359 370 0,00 97,00 3,00Küçükbay Yağ ve Deterjan Sanayi A.Ş. Private 311 10 102 110 0,00 100,00 0,00Küçükçalık Tekstil San. ve Tic. A.Ş. Private 321 13 419 431 0,00 100,00 0,00Kürüm Demir Sanayi Dış Ticaret A.Ş. Private 371 24 125 133 0,00 100,00 0,00
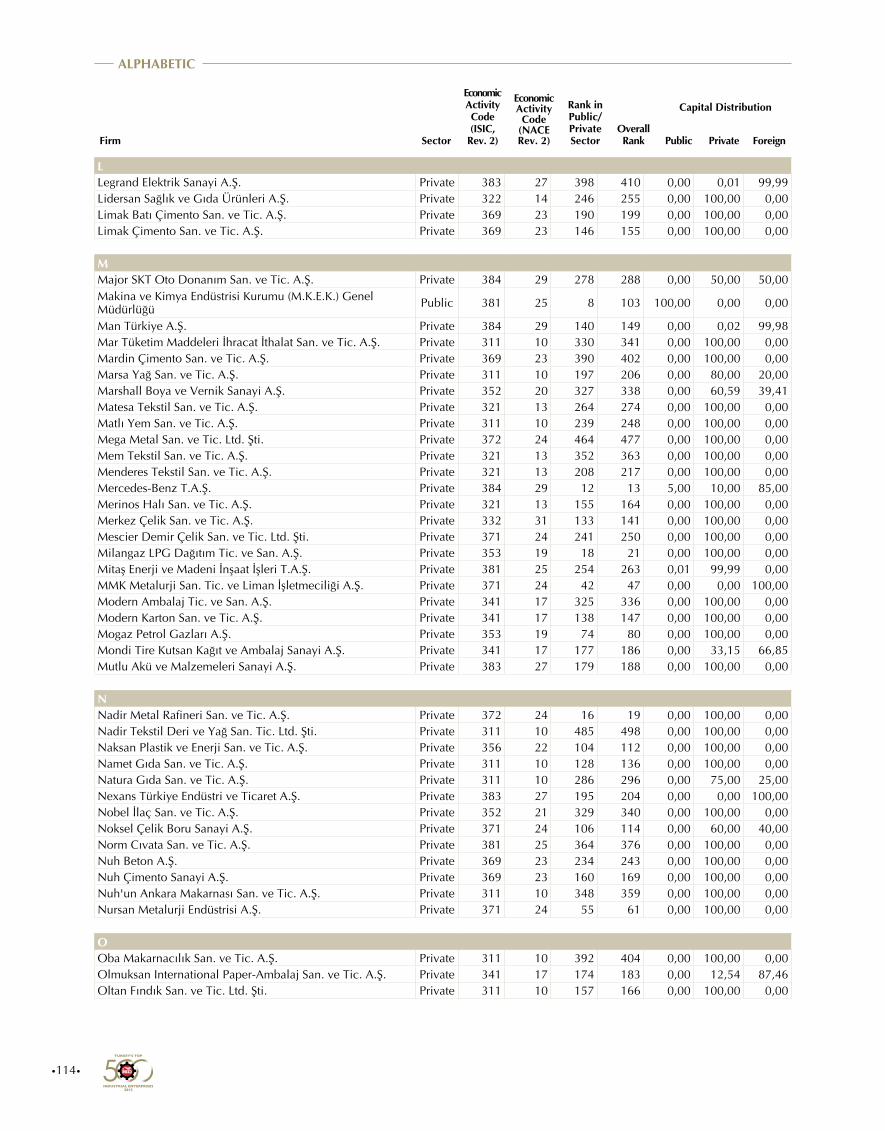
•114•
ALPHABETIC
Firm Sector
Economic Activity Code (ISIC,
Rev. 2)
Economic Activity Code
(NACE Rev. 2)
Rank in Public/Private Sector
Overall Rank
Capital Distribution
Public Private Foreign
LLegrand Elektrik Sanayi A.Ş. Private 383 27 398 410 0,00 0,01 99,99Lidersan Sağlık ve Gıda Ürünleri A.Ş. Private 322 14 246 255 0,00 100,00 0,00Limak Batı Çimento San. ve Tic. A.Ş. Private 369 23 190 199 0,00 100,00 0,00Limak Çimento San. ve Tic. A.Ş. Private 369 23 146 155 0,00 100,00 0,00
MMajor SKT Oto Donanım San. ve Tic. A.Ş. Private 384 29 278 288 0,00 50,00 50,00Makina ve Kimya Endüstrisi Kurumu (M.K.E.K.) Genel Müdürlüğü Public 381 25 8 103 100,00 0,00 0,00
Man Türkiye A.Ş. Private 384 29 140 149 0,00 0,02 99,98Mar Tüketim Maddeleri İhracat İthalat San. ve Tic. A.Ş. Private 311 10 330 341 0,00 100,00 0,00Mardin Çimento San. ve Tic. A.Ş. Private 369 23 390 402 0,00 100,00 0,00Marsa Yağ San. ve Tic. A.Ş. Private 311 10 197 206 0,00 80,00 20,00Marshall Boya ve Vernik Sanayi A.Ş. Private 352 20 327 338 0,00 60,59 39,41Matesa Tekstil San. ve Tic. A.Ş. Private 321 13 264 274 0,00 100,00 0,00Matlı Yem San. ve Tic. A.Ş. Private 311 10 239 248 0,00 100,00 0,00Mega Metal San. ve Tic. Ltd. Şti. Private 372 24 464 477 0,00 100,00 0,00Mem Tekstil San. ve Tic. A.Ş. Private 321 13 352 363 0,00 100,00 0,00Menderes Tekstil San. ve Tic. A.Ş. Private 321 13 208 217 0,00 100,00 0,00Mercedes-Benz T.A.Ş. Private 384 29 12 13 5,00 10,00 85,00Merinos Halı San. ve Tic. A.Ş. Private 321 13 155 164 0,00 100,00 0,00Merkez Çelik San. ve Tic. A.Ş. Private 332 31 133 141 0,00 100,00 0,00Mescier Demir Çelik San. ve Tic. Ltd. Şti. Private 371 24 241 250 0,00 100,00 0,00Milangaz LPG Dağıtım Tic. ve San. A.Ş. Private 353 19 18 21 0,00 100,00 0,00Mitaş Enerji ve Madeni İnşaat İşleri T.A.Ş. Private 381 25 254 263 0,01 99,99 0,00MMK Metalurji San. Tic. ve Liman İşletmeciliği A.Ş. Private 371 24 42 47 0,00 0,00 100,00Modern Ambalaj Tic. ve San. A.Ş. Private 341 17 325 336 0,00 100,00 0,00Modern Karton San. ve Tic. A.Ş. Private 341 17 138 147 0,00 100,00 0,00Mogaz Petrol Gazları A.Ş. Private 353 19 74 80 0,00 100,00 0,00Mondi Tire Kutsan Kağıt ve Ambalaj Sanayi A.Ş. Private 341 17 177 186 0,00 33,15 66,85Mutlu Akü ve Malzemeleri Sanayi A.Ş. Private 383 27 179 188 0,00 100,00 0,00
NNadir Metal Rafineri San. ve Tic. A.Ş. Private 372 24 16 19 0,00 100,00 0,00Nadir Tekstil Deri ve Yağ San. Tic. Ltd. Şti. Private 311 10 485 498 0,00 100,00 0,00Naksan Plastik ve Enerji San. ve Tic. A.Ş. Private 356 22 104 112 0,00 100,00 0,00Namet Gıda San. ve Tic. A.Ş. Private 311 10 128 136 0,00 100,00 0,00Natura Gıda San. ve Tic. A.Ş. Private 311 10 286 296 0,00 75,00 25,00Nexans Türkiye Endüstri ve Ticaret A.Ş. Private 383 27 195 204 0,00 0,00 100,00Nobel İlaç San. ve Tic. A.Ş. Private 352 21 329 340 0,00 100,00 0,00Noksel Çelik Boru Sanayi A.Ş. Private 371 24 106 114 0,00 60,00 40,00Norm Cıvata San. ve Tic. A.Ş. Private 381 25 364 376 0,00 100,00 0,00Nuh Beton A.Ş. Private 369 23 234 243 0,00 100,00 0,00Nuh Çimento Sanayi A.Ş. Private 369 23 160 169 0,00 100,00 0,00Nuh'un Ankara Makarnası San. ve Tic. A.Ş. Private 311 10 348 359 0,00 100,00 0,00Nursan Metalurji Endüstrisi A.Ş. Private 371 24 55 61 0,00 100,00 0,00
OOba Makarnacılık San. ve Tic. A.Ş. Private 311 10 392 404 0,00 100,00 0,00Olmuksan International Paper-Ambalaj San. ve Tic. A.Ş. Private 341 17 174 183 0,00 12,54 87,46Oltan Fındık San. ve Tic. Ltd. Şti. Private 311 10 157 166 0,00 100,00 0,00
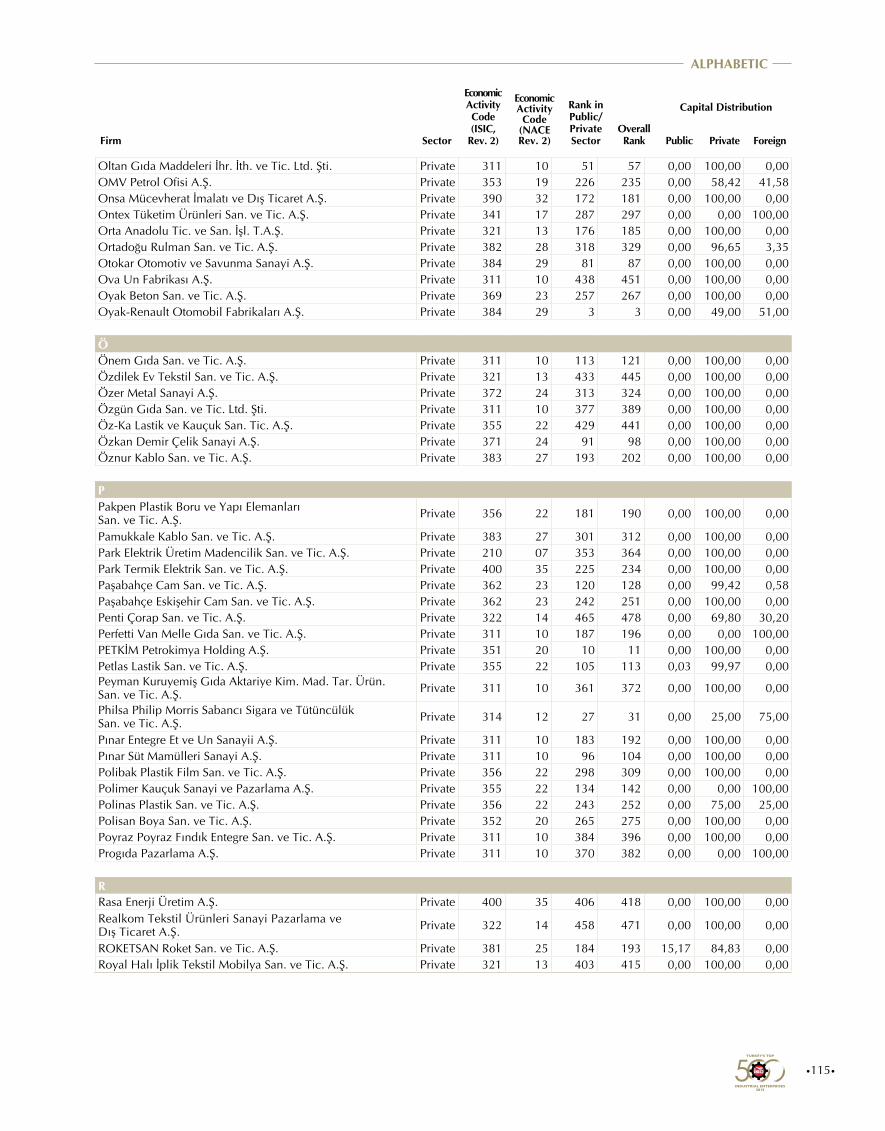
•115•
ALPHABETIC
Firm Sector
Economic Activity Code (ISIC,
Rev. 2)
Economic Activity Code
(NACE Rev. 2)
Rank in Public/Private Sector
Overall Rank
Capital Distribution
Public Private Foreign
Oltan Gıda Maddeleri İhr. İth. ve Tic. Ltd. Şti. Private 311 10 51 57 0,00 100,00 0,00OMV Petrol Ofisi A.Ş. Private 353 19 226 235 0,00 58,42 41,58Onsa Mücevherat İmalatı ve Dış Ticaret A.Ş. Private 390 32 172 181 0,00 100,00 0,00Ontex Tüketim Ürünleri San. ve Tic. A.Ş. Private 341 17 287 297 0,00 0,00 100,00Orta Anadolu Tic. ve San. İşl. T.A.Ş. Private 321 13 176 185 0,00 100,00 0,00Ortadoğu Rulman San. ve Tic. A.Ş. Private 382 28 318 329 0,00 96,65 3,35Otokar Otomotiv ve Savunma Sanayi A.Ş. Private 384 29 81 87 0,00 100,00 0,00Ova Un Fabrikası A.Ş. Private 311 10 438 451 0,00 100,00 0,00Oyak Beton San. ve Tic. A.Ş. Private 369 23 257 267 0,00 100,00 0,00Oyak-Renault Otomobil Fabrikaları A.Ş. Private 384 29 3 3 0,00 49,00 51,00
ÖÖnem Gıda San. ve Tic. A.Ş. Private 311 10 113 121 0,00 100,00 0,00Özdilek Ev Tekstil San. ve Tic. A.Ş. Private 321 13 433 445 0,00 100,00 0,00Özer Metal Sanayi A.Ş. Private 372 24 313 324 0,00 100,00 0,00Özgün Gıda San. ve Tic. Ltd. Şti. Private 311 10 377 389 0,00 100,00 0,00Öz-Ka Lastik ve Kauçuk San. Tic. A.Ş. Private 355 22 429 441 0,00 100,00 0,00Özkan Demir Çelik Sanayi A.Ş. Private 371 24 91 98 0,00 100,00 0,00Öznur Kablo San. ve Tic. A.Ş. Private 383 27 193 202 0,00 100,00 0,00
PPakpen Plastik Boru ve Yapı Elemanları San. ve Tic. A.Ş. Private 356 22 181 190 0,00 100,00 0,00
Pamukkale Kablo San. ve Tic. A.Ş. Private 383 27 301 312 0,00 100,00 0,00Park Elektrik Üretim Madencilik San. ve Tic. A.Ş. Private 210 07 353 364 0,00 100,00 0,00Park Termik Elektrik San. ve Tic. A.Ş. Private 400 35 225 234 0,00 100,00 0,00Paşabahçe Cam San. ve Tic. A.Ş. Private 362 23 120 128 0,00 99,42 0,58Paşabahçe Eskişehir Cam San. ve Tic. A.Ş. Private 362 23 242 251 0,00 100,00 0,00Penti Çorap San. ve Tic. A.Ş. Private 322 14 465 478 0,00 69,80 30,20Perfetti Van Melle Gıda San. ve Tic. A.Ş. Private 311 10 187 196 0,00 0,00 100,00PETKİM Petrokimya Holding A.Ş. Private 351 20 10 11 0,00 100,00 0,00Petlas Lastik San. ve Tic. A.Ş. Private 355 22 105 113 0,03 99,97 0,00Peyman Kuruyemiş Gıda Aktariye Kim. Mad. Tar. Ürün. San. ve Tic. A.Ş. Private 311 10 361 372 0,00 100,00 0,00
Philsa Philip Morris Sabancı Sigara ve Tütüncülük San. ve Tic. A.Ş. Private 314 12 27 31 0,00 25,00 75,00
Pınar Entegre Et ve Un Sanayii A.Ş. Private 311 10 183 192 0,00 100,00 0,00Pınar Süt Mamülleri Sanayi A.Ş. Private 311 10 96 104 0,00 100,00 0,00Polibak Plastik Film San. ve Tic. A.Ş. Private 356 22 298 309 0,00 100,00 0,00Polimer Kauçuk Sanayi ve Pazarlama A.Ş. Private 355 22 134 142 0,00 0,00 100,00Polinas Plastik San. ve Tic. A.Ş. Private 356 22 243 252 0,00 75,00 25,00Polisan Boya San. ve Tic. A.Ş. Private 352 20 265 275 0,00 100,00 0,00Poyraz Poyraz Fındık Entegre San. ve Tic. A.Ş. Private 311 10 384 396 0,00 100,00 0,00Progıda Pazarlama A.Ş. Private 311 10 370 382 0,00 0,00 100,00
RRasa Enerji Üretim A.Ş. Private 400 35 406 418 0,00 100,00 0,00Realkom Tekstil Ürünleri Sanayi Pazarlama veDış Ticaret A.Ş. Private 322 14 458 471 0,00 100,00 0,00
ROKETSAN Roket San. ve Tic. A.Ş. Private 381 25 184 193 15,17 84,83 0,00Royal Halı İplik Tekstil Mobilya San. ve Tic. A.Ş. Private 321 13 403 415 0,00 100,00 0,00
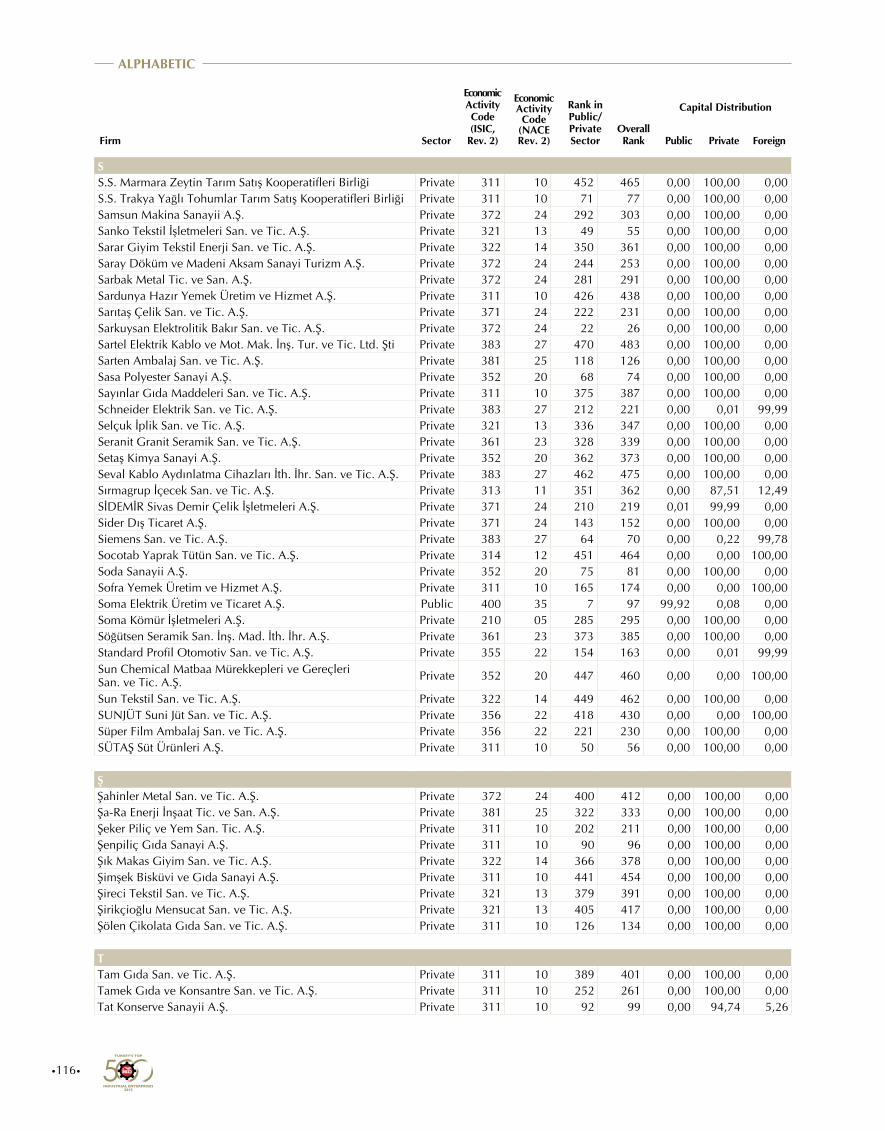
•116•
ALPHABETIC
Firm Sector
Economic Activity Code (ISIC,
Rev. 2)
Economic Activity Code
(NACE Rev. 2)
Rank in Public/Private Sector
Overall Rank
Capital Distribution
Public Private Foreign
SS.S. Marmara Zeytin Tarım Satış Kooperatifleri Birliği Private 311 10 452 465 0,00 100,00 0,00S.S. Trakya Yağlı Tohumlar Tarım Satış Kooperatifleri Birliği Private 311 10 71 77 0,00 100,00 0,00Samsun Makina Sanayii A.Ş. Private 372 24 292 303 0,00 100,00 0,00Sanko Tekstil İşletmeleri San. ve Tic. A.Ş. Private 321 13 49 55 0,00 100,00 0,00Sarar Giyim Tekstil Enerji San. ve Tic. A.Ş. Private 322 14 350 361 0,00 100,00 0,00Saray Döküm ve Madeni Aksam Sanayi Turizm A.Ş. Private 372 24 244 253 0,00 100,00 0,00Sarbak Metal Tic. ve San. A.Ş. Private 372 24 281 291 0,00 100,00 0,00Sardunya Hazır Yemek Üretim ve Hizmet A.Ş. Private 311 10 426 438 0,00 100,00 0,00Sarıtaş Çelik San. ve Tic. A.Ş. Private 371 24 222 231 0,00 100,00 0,00Sarkuysan Elektrolitik Bakır San. ve Tic. A.Ş. Private 372 24 22 26 0,00 100,00 0,00Sartel Elektrik Kablo ve Mot. Mak. İnş. Tur. ve Tic. Ltd. Şti Private 383 27 470 483 0,00 100,00 0,00Sarten Ambalaj San. ve Tic. A.Ş. Private 381 25 118 126 0,00 100,00 0,00Sasa Polyester Sanayi A.Ş. Private 352 20 68 74 0,00 100,00 0,00Sayınlar Gıda Maddeleri San. ve Tic. A.Ş. Private 311 10 375 387 0,00 100,00 0,00Schneider Elektrik San. ve Tic. A.Ş. Private 383 27 212 221 0,00 0,01 99,99Selçuk İplik San. ve Tic. A.Ş. Private 321 13 336 347 0,00 100,00 0,00Seranit Granit Seramik San. ve Tic. A.Ş. Private 361 23 328 339 0,00 100,00 0,00Setaş Kimya Sanayi A.Ş. Private 352 20 362 373 0,00 100,00 0,00Seval Kablo Aydınlatma Cihazları İth. İhr. San. ve Tic. A.Ş. Private 383 27 462 475 0,00 100,00 0,00Sırmagrup İçecek San. ve Tic. A.Ş. Private 313 11 351 362 0,00 87,51 12,49SİDEMİR Sivas Demir Çelik İşletmeleri A.Ş. Private 371 24 210 219 0,01 99,99 0,00Sider Dış Ticaret A.Ş. Private 371 24 143 152 0,00 100,00 0,00Siemens San. ve Tic. A.Ş. Private 383 27 64 70 0,00 0,22 99,78Socotab Yaprak Tütün San. ve Tic. A.Ş. Private 314 12 451 464 0,00 0,00 100,00Soda Sanayii A.Ş. Private 352 20 75 81 0,00 100,00 0,00Sofra Yemek Üretim ve Hizmet A.Ş. Private 311 10 165 174 0,00 0,00 100,00Soma Elektrik Üretim ve Ticaret A.Ş. Public 400 35 7 97 99,92 0,08 0,00Soma Kömür İşletmeleri A.Ş. Private 210 05 285 295 0,00 100,00 0,00Söğütsen Seramik San. İnş. Mad. İth. İhr. A.Ş. Private 361 23 373 385 0,00 100,00 0,00Standard Profil Otomotiv San. ve Tic. A.Ş. Private 355 22 154 163 0,00 0,01 99,99Sun Chemical Matbaa Mürekkepleri ve Gereçleri San. ve Tic. A.Ş. Private 352 20 447 460 0,00 0,00 100,00
Sun Tekstil San. ve Tic. A.Ş. Private 322 14 449 462 0,00 100,00 0,00SUNJÜT Suni Jüt San. ve Tic. A.Ş. Private 356 22 418 430 0,00 0,00 100,00Süper Film Ambalaj San. ve Tic. A.Ş. Private 356 22 221 230 0,00 100,00 0,00SÜTAŞ Süt Ürünleri A.Ş. Private 311 10 50 56 0,00 100,00 0,00
ŞŞahinler Metal San. ve Tic. A.Ş. Private 372 24 400 412 0,00 100,00 0,00Şa-Ra Enerji İnşaat Tic. ve San. A.Ş. Private 381 25 322 333 0,00 100,00 0,00Şeker Piliç ve Yem San. Tic. A.Ş. Private 311 10 202 211 0,00 100,00 0,00Şenpiliç Gıda Sanayi A.Ş. Private 311 10 90 96 0,00 100,00 0,00Şık Makas Giyim San. ve Tic. A.Ş. Private 322 14 366 378 0,00 100,00 0,00Şimşek Bisküvi ve Gıda Sanayi A.Ş. Private 311 10 441 454 0,00 100,00 0,00Şireci Tekstil San. ve Tic. A.Ş. Private 321 13 379 391 0,00 100,00 0,00Şirikçioğlu Mensucat San. ve Tic. A.Ş. Private 321 13 405 417 0,00 100,00 0,00Şölen Çikolata Gıda San. ve Tic. A.Ş. Private 311 10 126 134 0,00 100,00 0,00
TTam Gıda San. ve Tic. A.Ş. Private 311 10 389 401 0,00 100,00 0,00Tamek Gıda ve Konsantre San. ve Tic. A.Ş. Private 311 10 252 261 0,00 100,00 0,00Tat Konserve Sanayii A.Ş. Private 311 10 92 99 0,00 94,74 5,26
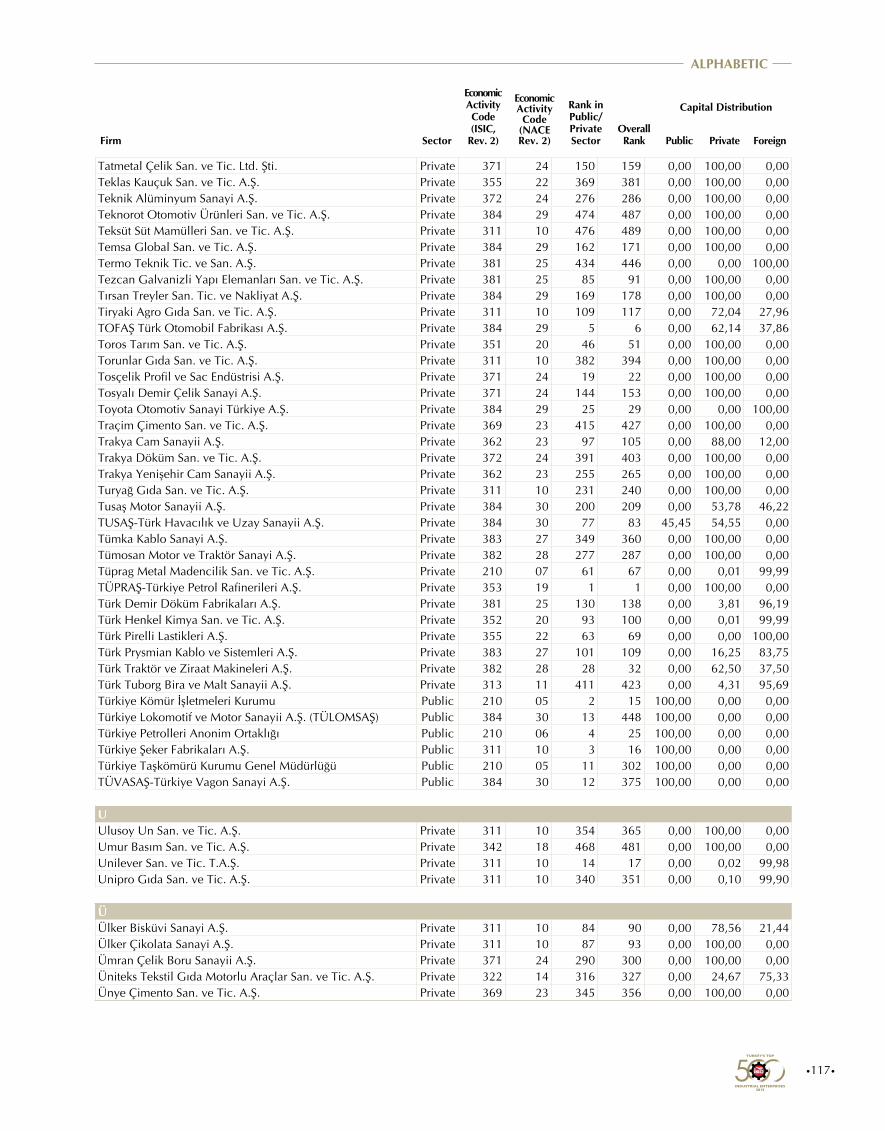
•117•
ALPHABETIC
Firm Sector
Economic Activity Code (ISIC,
Rev. 2)
Economic Activity Code
(NACE Rev. 2)
Rank in Public/Private Sector
Overall Rank
Capital Distribution
Public Private Foreign
Tatmetal Çelik San. ve Tic. Ltd. Şti. Private 371 24 150 159 0,00 100,00 0,00Teklas Kauçuk San. ve Tic. A.Ş. Private 355 22 369 381 0,00 100,00 0,00Teknik Alüminyum Sanayi A.Ş. Private 372 24 276 286 0,00 100,00 0,00Teknorot Otomotiv Ürünleri San. ve Tic. A.Ş. Private 384 29 474 487 0,00 100,00 0,00Teksüt Süt Mamülleri San. ve Tic. A.Ş. Private 311 10 476 489 0,00 100,00 0,00Temsa Global San. ve Tic. A.Ş. Private 384 29 162 171 0,00 100,00 0,00Termo Teknik Tic. ve San. A.Ş. Private 381 25 434 446 0,00 0,00 100,00Tezcan Galvanizli Yapı Elemanları San. ve Tic. A.Ş. Private 381 25 85 91 0,00 100,00 0,00Tırsan Treyler San. Tic. ve Nakliyat A.Ş. Private 384 29 169 178 0,00 100,00 0,00Tiryaki Agro Gıda San. ve Tic. A.Ş. Private 311 10 109 117 0,00 72,04 27,96TOFAŞ Türk Otomobil Fabrikası A.Ş. Private 384 29 5 6 0,00 62,14 37,86Toros Tarım San. ve Tic. A.Ş. Private 351 20 46 51 0,00 100,00 0,00Torunlar Gıda San. ve Tic. A.Ş. Private 311 10 382 394 0,00 100,00 0,00Tosçelik Profil ve Sac Endüstrisi A.Ş. Private 371 24 19 22 0,00 100,00 0,00Tosyalı Demir Çelik Sanayi A.Ş. Private 371 24 144 153 0,00 100,00 0,00Toyota Otomotiv Sanayi Türkiye A.Ş. Private 384 29 25 29 0,00 0,00 100,00Traçim Çimento San. ve Tic. A.Ş. Private 369 23 415 427 0,00 100,00 0,00Trakya Cam Sanayii A.Ş. Private 362 23 97 105 0,00 88,00 12,00Trakya Döküm San. ve Tic. A.Ş. Private 372 24 391 403 0,00 100,00 0,00Trakya Yenişehir Cam Sanayii A.Ş. Private 362 23 255 265 0,00 100,00 0,00Turyağ Gıda San. ve Tic. A.Ş. Private 311 10 231 240 0,00 100,00 0,00Tusaş Motor Sanayii A.Ş. Private 384 30 200 209 0,00 53,78 46,22TUSAŞ-Türk Havacılık ve Uzay Sanayii A.Ş. Private 384 30 77 83 45,45 54,55 0,00Tümka Kablo Sanayi A.Ş. Private 383 27 349 360 0,00 100,00 0,00Tümosan Motor ve Traktör Sanayi A.Ş. Private 382 28 277 287 0,00 100,00 0,00Tüprag Metal Madencilik San. ve Tic. A.Ş. Private 210 07 61 67 0,00 0,01 99,99TÜPRAŞ-Türkiye Petrol Rafinerileri A.Ş. Private 353 19 1 1 0,00 100,00 0,00Türk Demir Döküm Fabrikaları A.Ş. Private 381 25 130 138 0,00 3,81 96,19Türk Henkel Kimya San. ve Tic. A.Ş. Private 352 20 93 100 0,00 0,01 99,99Türk Pirelli Lastikleri A.Ş. Private 355 22 63 69 0,00 0,00 100,00Türk Prysmian Kablo ve Sistemleri A.Ş. Private 383 27 101 109 0,00 16,25 83,75Türk Traktör ve Ziraat Makineleri A.Ş. Private 382 28 28 32 0,00 62,50 37,50Türk Tuborg Bira ve Malt Sanayii A.Ş. Private 313 11 411 423 0,00 4,31 95,69Türkiye Kömür İşletmeleri Kurumu Public 210 05 2 15 100,00 0,00 0,00Türkiye Lokomotif ve Motor Sanayii A.Ş. (TÜLOMSAŞ) Public 384 30 13 448 100,00 0,00 0,00Türkiye Petrolleri Anonim Ortaklığı Public 210 06 4 25 100,00 0,00 0,00Türkiye Şeker Fabrikaları A.Ş. Public 311 10 3 16 100,00 0,00 0,00Türkiye Taşkömürü Kurumu Genel Müdürlüğü Public 210 05 11 302 100,00 0,00 0,00TÜVASAŞ-Türkiye Vagon Sanayi A.Ş. Public 384 30 12 375 100,00 0,00 0,00
UUlusoy Un San. ve Tic. A.Ş. Private 311 10 354 365 0,00 100,00 0,00Umur Basım San. ve Tic. A.Ş. Private 342 18 468 481 0,00 100,00 0,00Unilever San. ve Tic. T.A.Ş. Private 311 10 14 17 0,00 0,02 99,98Unipro Gıda San. ve Tic. A.Ş. Private 311 10 340 351 0,00 0,10 99,90
ÜÜlker Bisküvi Sanayi A.Ş. Private 311 10 84 90 0,00 78,56 21,44Ülker Çikolata Sanayi A.Ş. Private 311 10 87 93 0,00 100,00 0,00Ümran Çelik Boru Sanayii A.Ş. Private 371 24 290 300 0,00 100,00 0,00Üniteks Tekstil Gıda Motorlu Araçlar San. ve Tic. A.Ş. Private 322 14 316 327 0,00 24,67 75,33Ünye Çimento San. ve Tic. A.Ş. Private 369 23 345 356 0,00 100,00 0,00
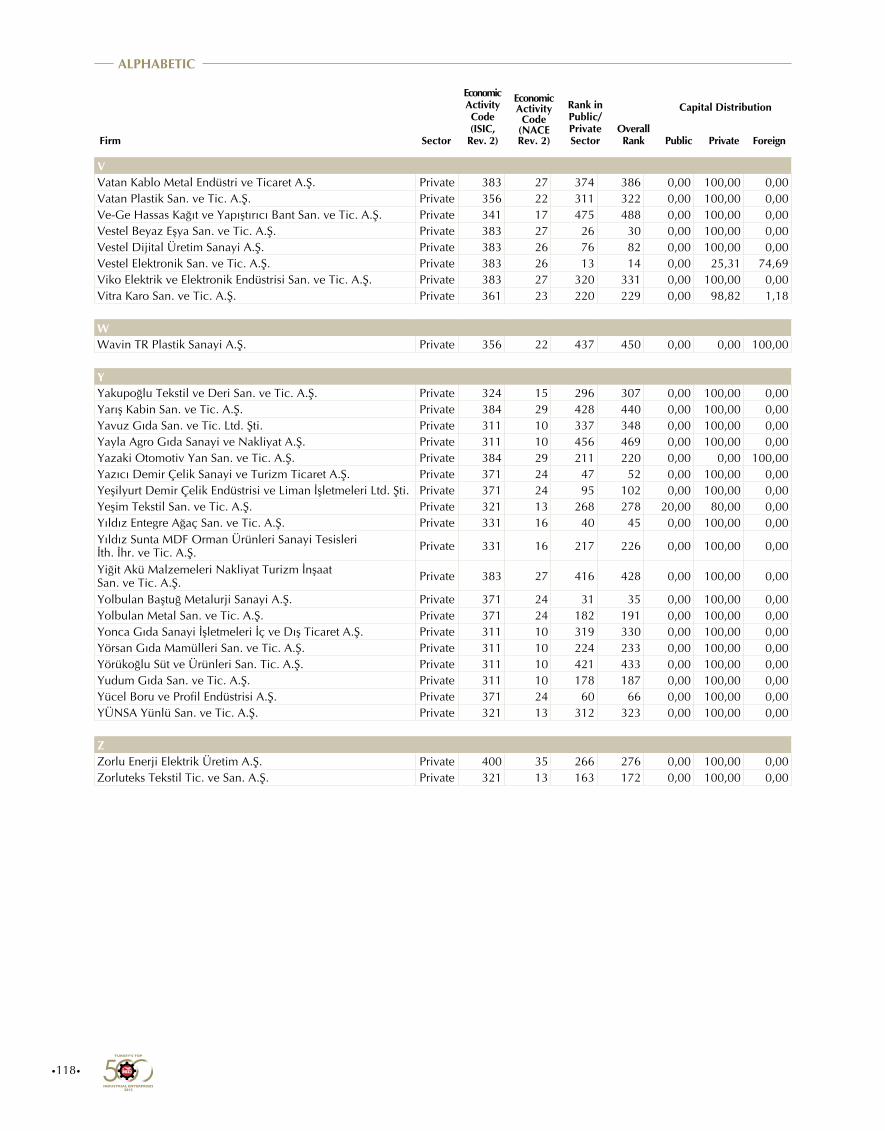
•118•
ALPHABETIC
Firm Sector
Economic Activity Code (ISIC,
Rev. 2)
Economic Activity Code
(NACE Rev. 2)
Rank in Public/Private Sector
Overall Rank
Capital Distribution
Public Private Foreign
VVatan Kablo Metal Endüstri ve Ticaret A.Ş. Private 383 27 374 386 0,00 100,00 0,00Vatan Plastik San. ve Tic. A.Ş. Private 356 22 311 322 0,00 100,00 0,00Ve-Ge Hassas Kağıt ve Yapıştırıcı Bant San. ve Tic. A.Ş. Private 341 17 475 488 0,00 100,00 0,00Vestel Beyaz Eşya San. ve Tic. A.Ş. Private 383 27 26 30 0,00 100,00 0,00Vestel Dijital Üretim Sanayi A.Ş. Private 383 26 76 82 0,00 100,00 0,00Vestel Elektronik San. ve Tic. A.Ş. Private 383 26 13 14 0,00 25,31 74,69Viko Elektrik ve Elektronik Endüstrisi San. ve Tic. A.Ş. Private 383 27 320 331 0,00 100,00 0,00Vitra Karo San. ve Tic. A.Ş. Private 361 23 220 229 0,00 98,82 1,18
WWavin TR Plastik Sanayi A.Ş. Private 356 22 437 450 0,00 0,00 100,00
YYakupoğlu Tekstil ve Deri San. ve Tic. A.Ş. Private 324 15 296 307 0,00 100,00 0,00Yarış Kabin San. ve Tic. A.Ş. Private 384 29 428 440 0,00 100,00 0,00Yavuz Gıda San. ve Tic. Ltd. Şti. Private 311 10 337 348 0,00 100,00 0,00Yayla Agro Gıda Sanayi ve Nakliyat A.Ş. Private 311 10 456 469 0,00 100,00 0,00Yazaki Otomotiv Yan San. ve Tic. A.Ş. Private 384 29 211 220 0,00 0,00 100,00Yazıcı Demir Çelik Sanayi ve Turizm Ticaret A.Ş. Private 371 24 47 52 0,00 100,00 0,00Yeşilyurt Demir Çelik Endüstrisi ve Liman İşletmeleri Ltd. Şti. Private 371 24 95 102 0,00 100,00 0,00Yeşim Tekstil San. ve Tic. A.Ş. Private 321 13 268 278 20,00 80,00 0,00Yıldız Entegre Ağaç San. ve Tic. A.Ş. Private 331 16 40 45 0,00 100,00 0,00Yıldız Sunta MDF Orman Ürünleri Sanayi Tesisleri İth. İhr. ve Tic. A.Ş. Private 331 16 217 226 0,00 100,00 0,00
Yiğit Akü Malzemeleri Nakliyat Turizm İnşaat San. ve Tic. A.Ş. Private 383 27 416 428 0,00 100,00 0,00
Yolbulan Baştuğ Metalurji Sanayi A.Ş. Private 371 24 31 35 0,00 100,00 0,00Yolbulan Metal San. ve Tic. A.Ş. Private 371 24 182 191 0,00 100,00 0,00Yonca Gıda Sanayi İşletmeleri İç ve Dış Ticaret A.Ş. Private 311 10 319 330 0,00 100,00 0,00Yörsan Gıda Mamülleri San. ve Tic. A.Ş. Private 311 10 224 233 0,00 100,00 0,00Yörükoğlu Süt ve Ürünleri San. Tic. A.Ş. Private 311 10 421 433 0,00 100,00 0,00Yudum Gıda San. ve Tic. A.Ş. Private 311 10 178 187 0,00 100,00 0,00Yücel Boru ve Profil Endüstrisi A.Ş. Private 371 24 60 66 0,00 100,00 0,00YÜNSA Yünlü San. ve Tic. A.Ş. Private 321 13 312 323 0,00 100,00 0,00
ZZorlu Enerji Elektrik Üretim A.Ş. Private 400 35 266 276 0,00 100,00 0,00Zorluteks Tekstil Tic. ve San. A.Ş. Private 321 13 163 172 0,00 100,00 0,00
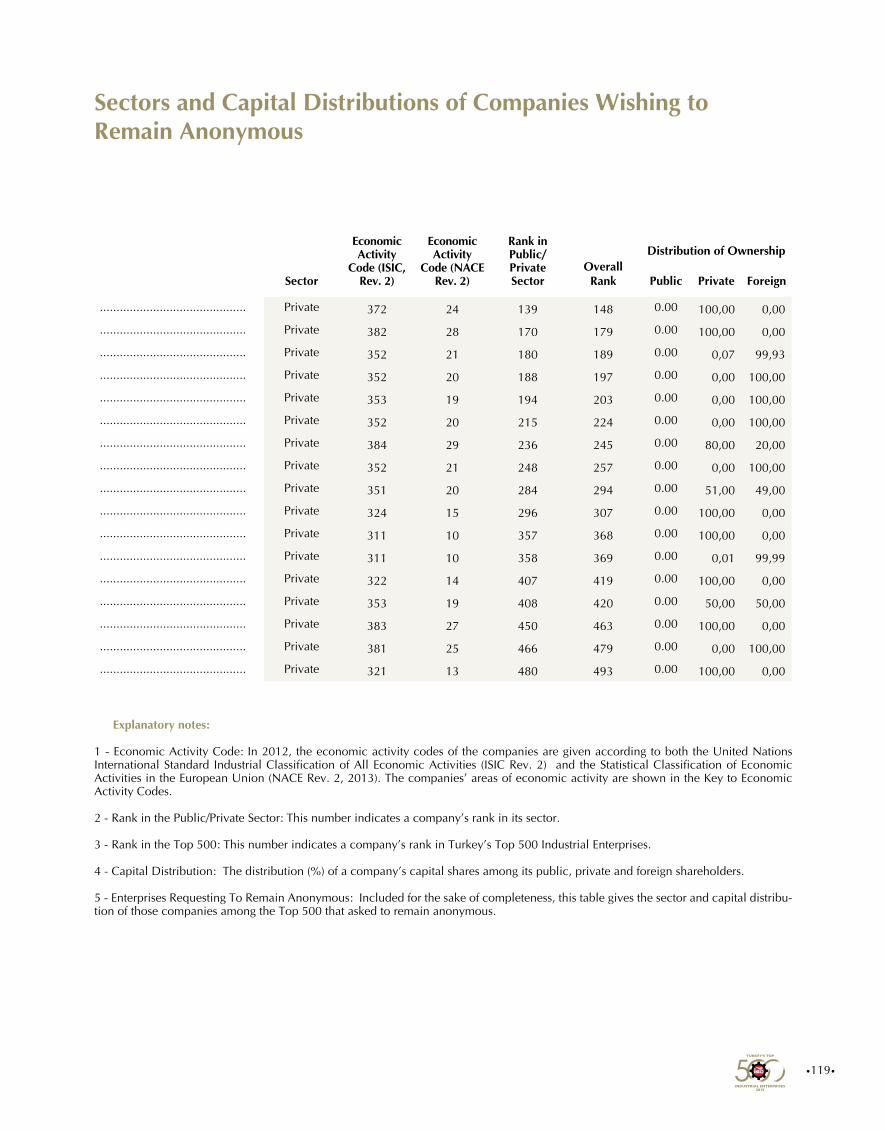
•119•
Sectors and Capital Distributions of Companies Wishing to Remain Anonymous
Explanatory notes:
1 - Economic Activity Code: In 2012, the economic activity codes of the companies are given according to both the United Nations International Standard Industrial Classification of All Economic Activities (ISIC Rev. 2) and the Statistical Classification of Economic Activities in the European Union (NACE Rev. 2, 2013). The companies’ areas of economic activity are shown in the Key to Economic Activity Codes.
2 - Rank in the Public/Private Sector: This number indicates a company’s rank in its sector.
3 - Rank in the Top 500: This number indicates a company’s rank in Turkey’s Top 500 Industrial Enterprises. 4 - Capital Distribution: The distribution (%) of a company’s capital shares among its public, private and foreign shareholders.
5 - Enterprises Requesting To Remain Anonymous: Included for the sake of completeness, this table gives the sector and capital distribu-tion of those companies among the Top 500 that asked to remain anonymous.
Sector
Economic Activity
Code (ISIC, Rev. 2)
Economic Activity
Code (NACE Rev. 2)
Rank in Public/Private Sector
Overall Rank
Distribution of Ownership
Public Private Foreign
............................................ Private 372 24 139 148 0.00 100,00 0,00
............................................ Private 382 28 170 179 0.00 100,00 0,00
............................................ Private 352 21 180 189 0.00 0,07 99,93
............................................ Private 352 20 188 197 0.00 0,00 100,00
............................................ Private 353 19 194 203 0.00 0,00 100,00
............................................ Private 352 20 215 224 0.00 0,00 100,00
............................................ Private 384 29 236 245 0.00 80,00 20,00
............................................ Private 352 21 248 257 0.00 0,00 100,00
............................................ Private 351 20 284 294 0.00 51,00 49,00
............................................ Private 324 15 296 307 0.00 100,00 0,00
............................................ Private 311 10 357 368 0.00 100,00 0,00
............................................ Private 311 10 358 369 0.00 0,01 99,99
............................................ Private 322 14 407 419 0.00 100,00 0,00
............................................ Private 353 19 408 420 0.00 50,00 50,00
............................................ Private 383 27 450 463 0.00 100,00 0,00
............................................ Private 381 25 466 479 0.00 0,00 100,00
............................................ Private 321 13 480 493 0.00 100,00 0,00

•121•

•122•