Embed Size (px)
Citation preview
TOC World presentation.ppt / kak 05/19/00 02:50 PM 1
Identifying the BottleneckIdentifying the Bottleneck in GM Assembly Systems in GM Assembly Systems
Kevin A. Kohls, P.E.Director - Technical Systems and Data Analysis
General Motors North America
Quality Reliability & Competitive Operations Implementation
TOC World presentation.ppt / kak 05/19/00 02:50 PM 2
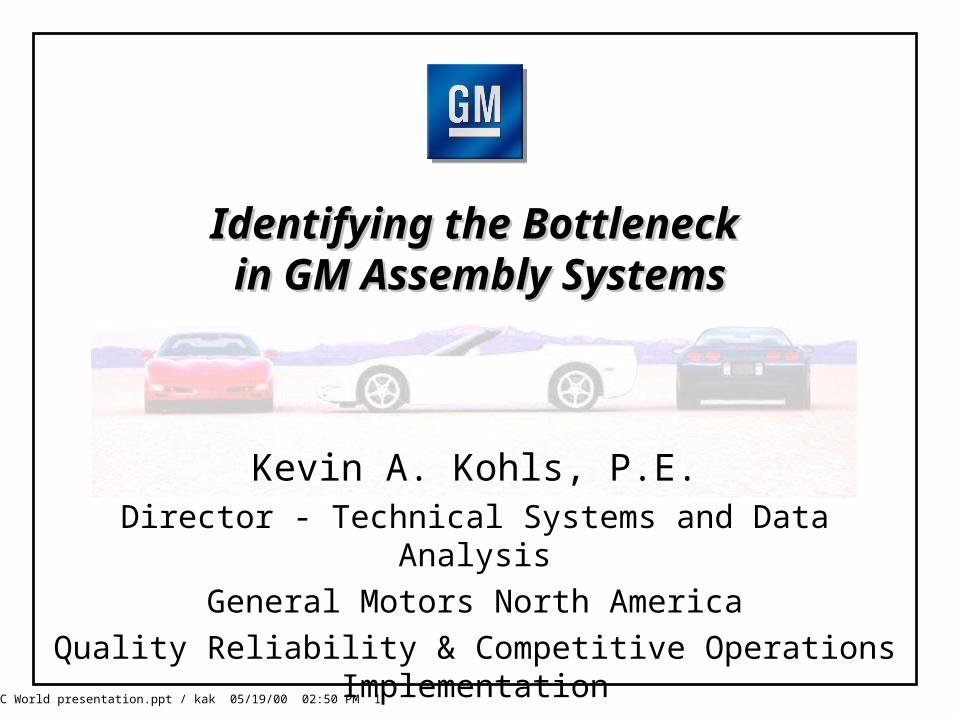
BackgroundBackground• Founded in 1908Founded in 1908• World's largest automotive corporation and full-line vehicle World's largest automotive corporation and full-line vehicle
manufacturer. manufacturer. • Employs more than 388,000 peopleEmploys more than 388,000 people• Partners with over 30,000 supplier companies worldwide.Partners with over 30,000 supplier companies worldwide.• Largest U.S. exporter of cars and trucksLargest U.S. exporter of cars and trucks• Manufacturing operations in 50 countries, has a global Manufacturing operations in 50 countries, has a global
presence in more than 200 countries. presence in more than 200 countries. • Has substantial interests in digital communications, Has substantial interests in digital communications,
financial and insurance services, locomotives, and heavy-financial and insurance services, locomotives, and heavy-duty automatic transmissions. duty automatic transmissions.
TOC World presentation.ppt / kak 05/19/00 02:50 PM 3
Before TOC in GM ManufacturingBefore TOC in GM Manufacturing
• New or renovated plants started up poorly.• Efforts to improve throughput were
generating results slowly.• Large investments were made in the
plants to try and improve throughput.• Overtime was extensively used to try and
keep up with demand.• RONA and profit targets were far below
expectations.
TOC World presentation.ppt / kak 05/19/00 02:50 PM 4
History of TOC in ProductionHistory of TOC in Production
• Started in GM in1980 in Saginaw Division with a product call OP.
• GM develops C-Thru bottleneck identification tool in 1984 (Now called C-More).
• First successful implementation of C-Thru in 1987 at Detroit/Hamtramck.
• A divisional group was then started, which has grown from a few people to over 50 at corporate level.
• Other active groups in Powertrain, Supplier Development.
TOC World presentation.ppt / kak 05/19/00 02:50 PM 5
Alfred SloanAlfred Sloan
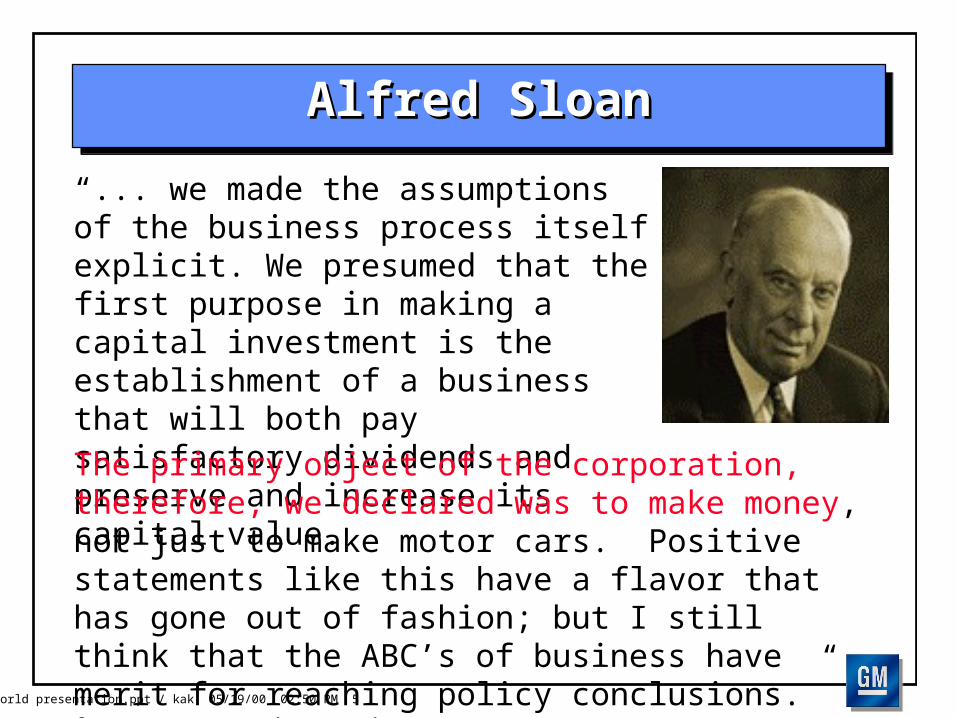
“... we made the assumptions of the business process itself explicit. We presumed that the first purpose in making a capital investment is the establishment of a business that will both pay satisfactory dividends and preserve and increase its capital value.
The primary object of the corporation, therefore, we declared was to make money, not just to make motor cars. Positive statements like this have a flavor that has gone out of fashion; but I still think that the ABC’s of business have merit for reaching policy conclusions.”from “My Years with General Motors”
TOC World presentation.ppt / kak 05/19/00 02:50 PM 6
Comparison of SystemsComparison of Systems
TOC World presentation.ppt / kak 05/19/00 02:50 PM 7
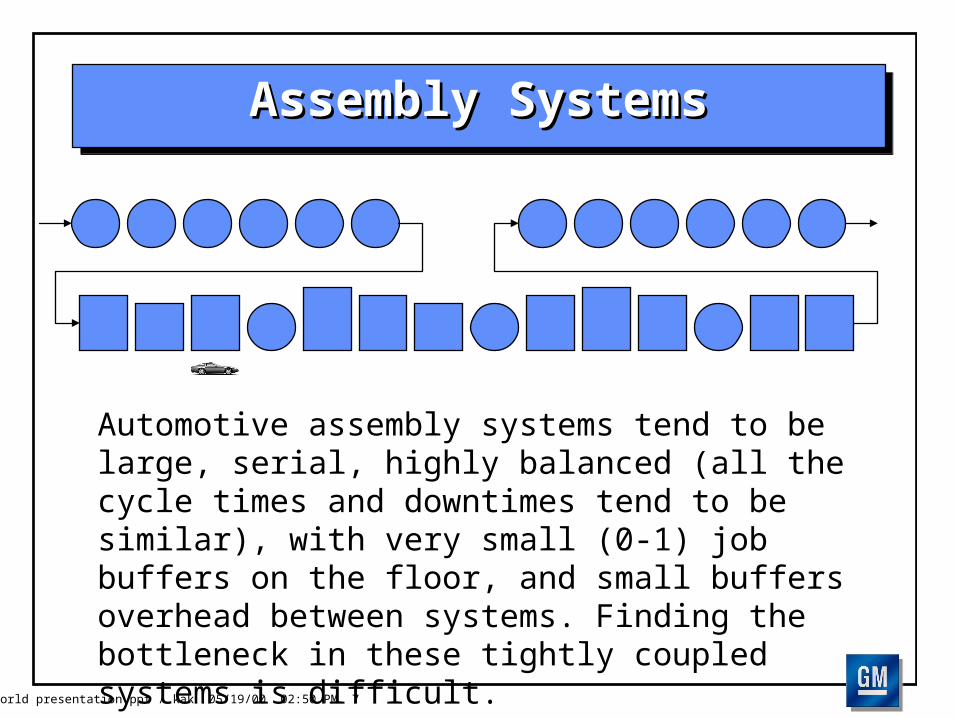
Assembly SystemsAssembly Systems
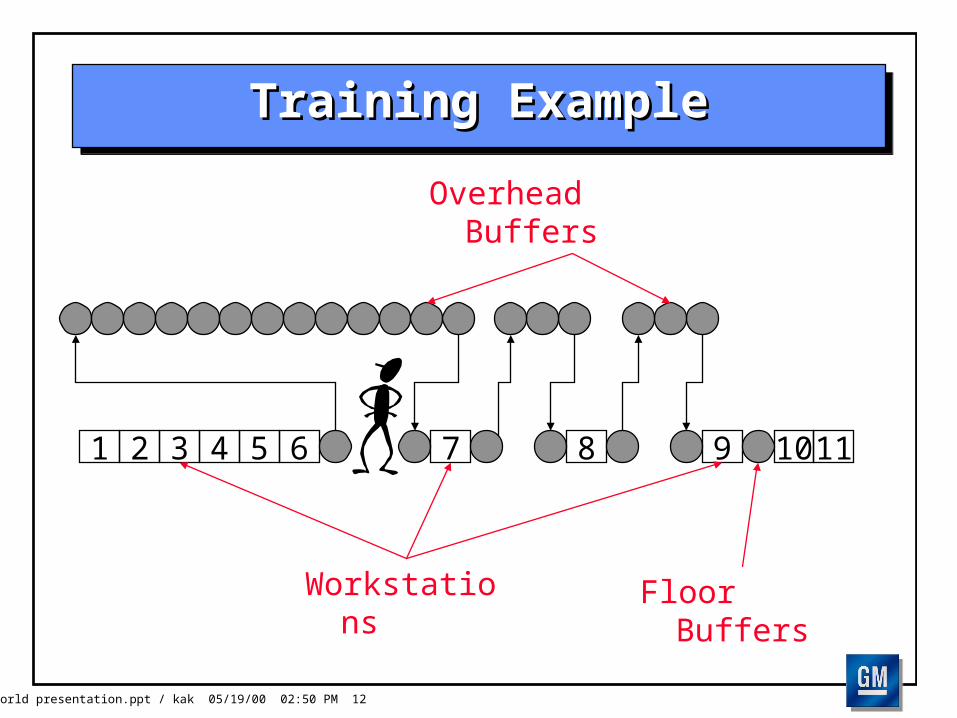
Automotive assembly systems tend to be large, serial, highly balanced (all the cycle times and downtimes tend to be similar), with very small (0-1) job buffers on the floor, and small buffers overhead between systems. Finding the bottleneck in these tightly coupled systems is difficult.
TOC World presentation.ppt / kak 05/19/00 02:50 PM 8
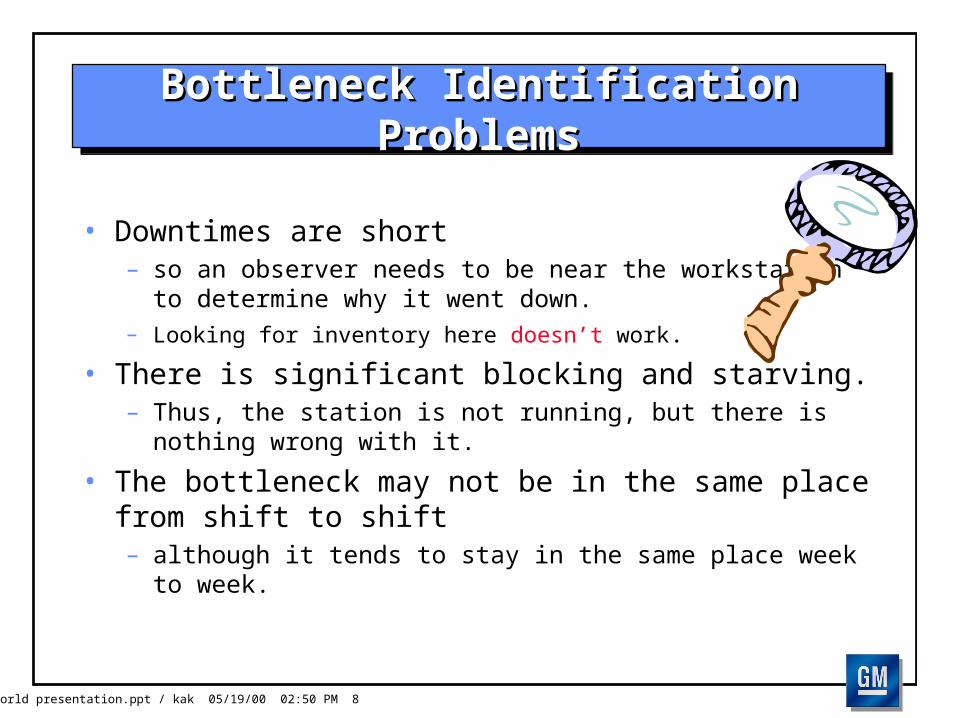
Bottleneck Identification ProblemsBottleneck Identification Problems
• Downtimes are short– so an observer needs to be near the workstation to
determine why it went down.– Looking for inventory here doesn’t work.
• There is significant blocking and starving. – Thus, the station is not running, but there is nothing wrong
with it.
• The bottleneck may not be in the same place from shift to shift– although it tends to stay in the same place week to week.
TOC World presentation.ppt / kak 05/19/00 02:50 PM 9
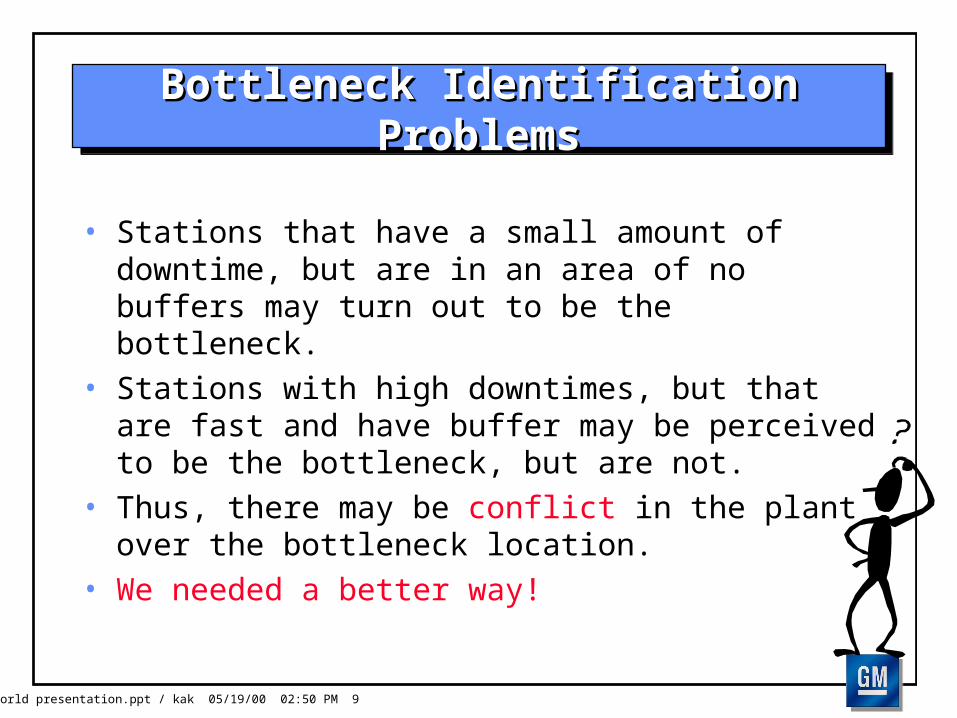
Bottleneck Identification ProblemsBottleneck Identification Problems
• Stations that have a small amount of downtime, but are in an area of no buffers may turn out to be the bottleneck.
• Stations with high downtimes, but that are fast and have buffer may be perceived to be the bottleneck, but are not.
• Thus, there may be conflict in the plant over the bottleneck location.
• We needed a better way!
TOC World presentation.ppt / kak 05/19/00 02:50 PM 10
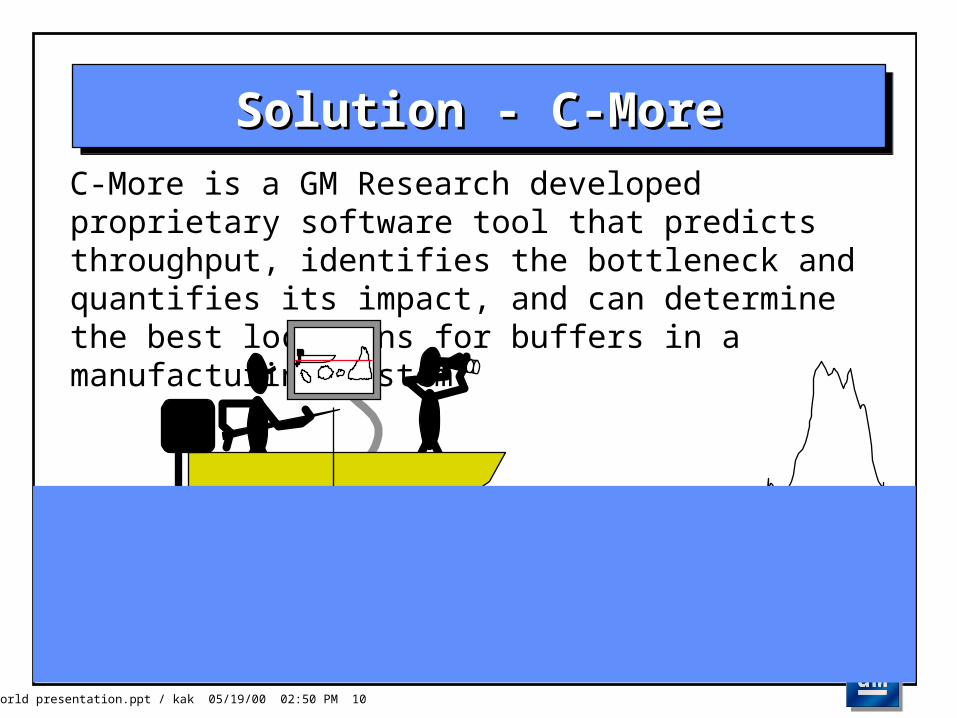
Solution - C-MoreSolution - C-More
C-More is a GM Research developed proprietary software tool that predicts throughput, identifies the bottleneck and quantifies its impact, and can determine the best locations for buffers in a manufacturing system.
TOC World presentation.ppt / kak 05/19/00 02:50 PM 11
• Training is the key. We have courses in Constraints Management, C-More (basic and advanced), and GM’s Throughput Improvement Process.
• We distribute Goldratt books throughout GM without charge to individuals (The Goal, La Meta, The Race, It’s Not Luck, Critical Chain, etc.)
• We install data collection in the plants to drive C-More.
• We do direct training with a plant that is installing this process or has a new manufacturing system.
Causing the ChangeCausing the Change
TOC World presentation.ppt / kak 05/19/00 02:50 PM 12
Training ExampleTraining Example
1 2 3 4 5 6 7 8 9 10 11
Overhead Buffers
Workstations
Floor Buffers
TOC World presentation.ppt / kak 05/19/00 02:50 PM 13
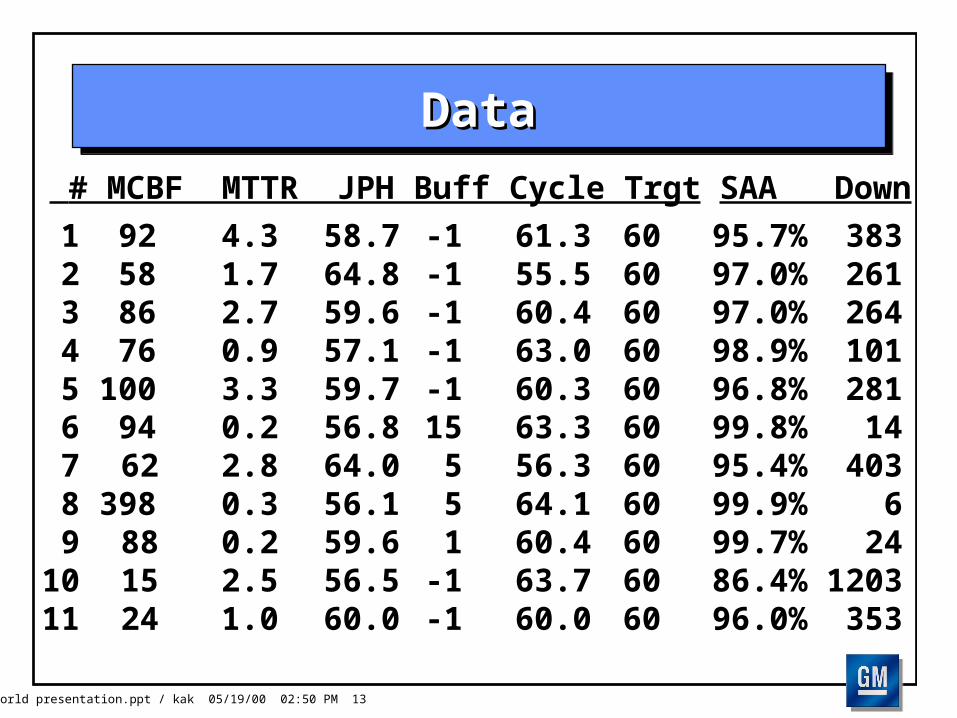
DataData
1 92 4.3 58.7 -1 61.3 60 95.7% 383 2 58 1.7 64.8 -1 55.5 60 97.0% 261 3 86 2.7 59.6 -1 60.4 60 97.0% 264 4 76 0.9 57.1 -1 63.0 60 98.9% 101 5 100 3.3 59.7 -1 60.3 60 96.8% 281 6 94 0.2 56.8 15 63.3 60 99.8% 14 7 62 2.8 64.0 5 56.3 60 95.4% 403 8 398 0.3 56.1 5 64.1 60 99.9% 6 9 88 0.2 59.6 1 60.4 60 99.7% 2410 15 2.5 56.5 -1 63.7 60 86.4% 120311 24 1.0 60.0 -1 60.0 60 96.0% 353
# MCBF MTTR JPH Buff Cycle Trgt SAA Down
TOC World presentation.ppt / kak 05/19/00 02:50 PM 14
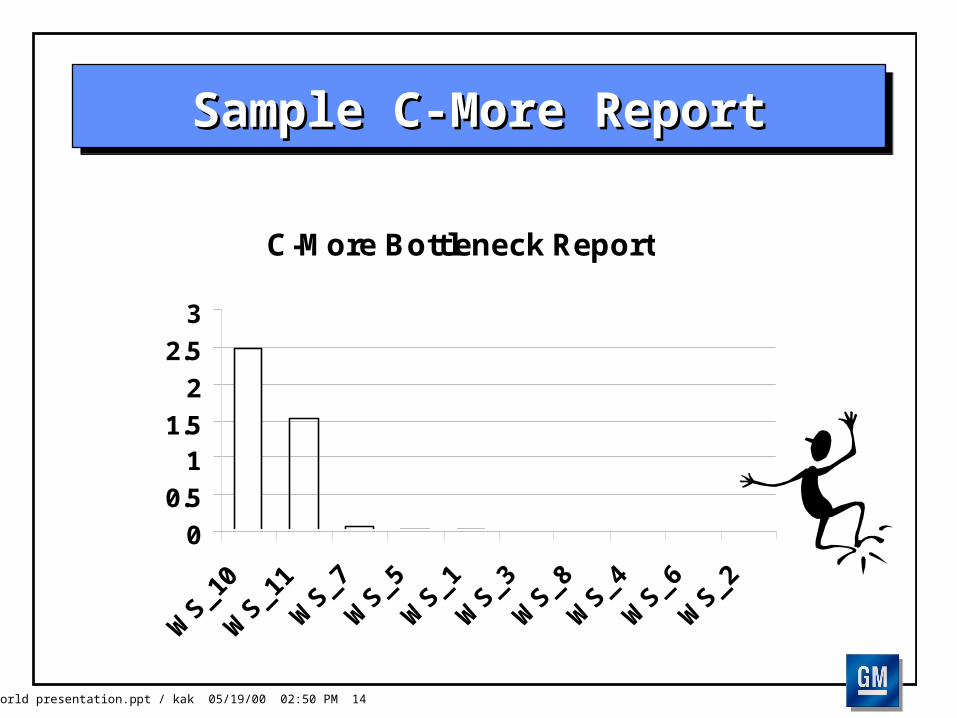
Sample C-More ReportSample C-More Report
C-More Bottleneck Report
0
0.5
11.5
2
2.5
3
TOC World presentation.ppt / kak 05/19/00 02:50 PM 15
5 Steps & C-More5 Steps & C-More
C-More Bottleneck Report
00.5
11.5
2
2.53
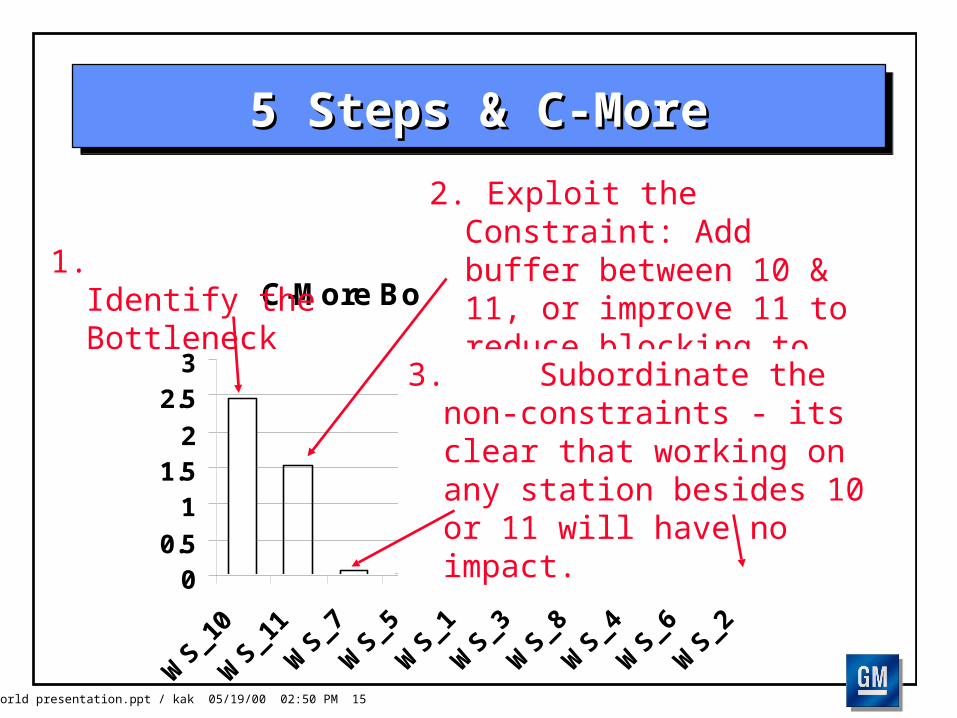
2. Exploit the Constraint: Add buffer between 10 & 11, or improve 11 to reduce blocking to the bottleneck.
1. Identify the Bottleneck
3. Subordinate the non-constraints - its clear that working on any station besides 10 or 11 will have no impact.
TOC World presentation.ppt / kak 05/19/00 02:50 PM 16
ElevateElevate
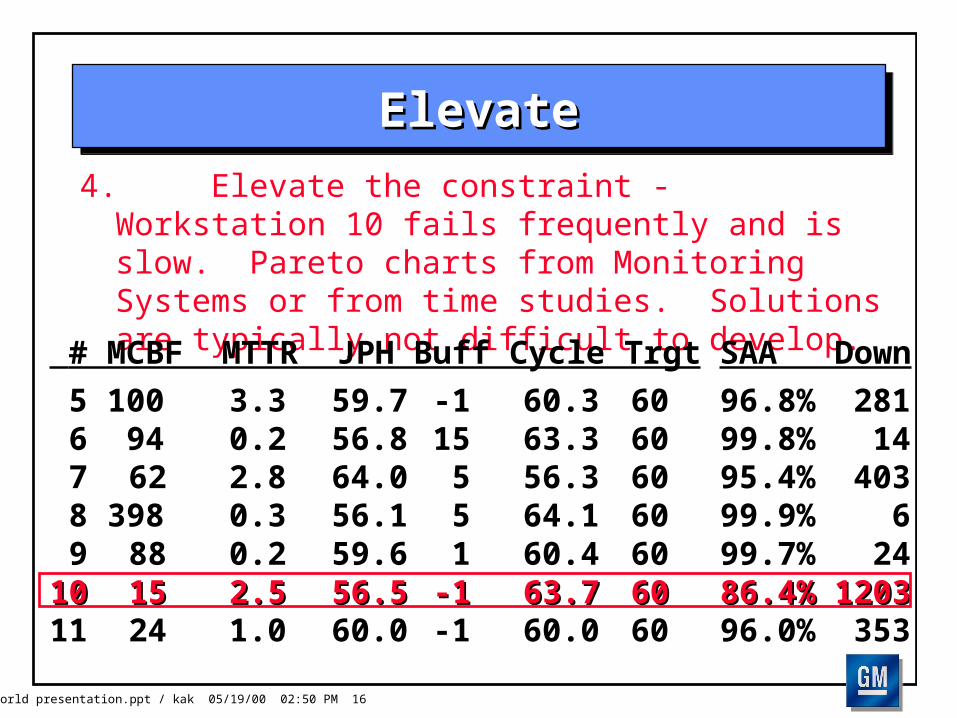
4. Elevate the constraint - Workstation 10 fails frequently and is slow. Pareto charts from Monitoring Systems or from time studies. Solutions are typically not difficult to develop.
5 100 3.3 59.7 -1 60.3 60 96.8% 281 6 94 0.2 56.8 15 63.3 60 99.8% 14 7 62 2.8 64.0 5 56.3 60 95.4% 403 8 398 0.3 56.1 5 64.1 60 99.9% 6 9 88 0.2 59.6 1 60.4 60 99.7% 241010 15 15 2.52.5 56.556.5 -1-1 63.763.7 6060 86.4%86.4% 1203120311 24 1.0 60.0 -1 60.0 60 96.0% 353
# MCBF MTTR JPH Buff Cycle Trgt SAA Down
TOC World presentation.ppt / kak 05/19/00 02:50 PM 17
RestudyRestudy
C-More Bottleneck Report
00.20.40.60.8
11.21.4
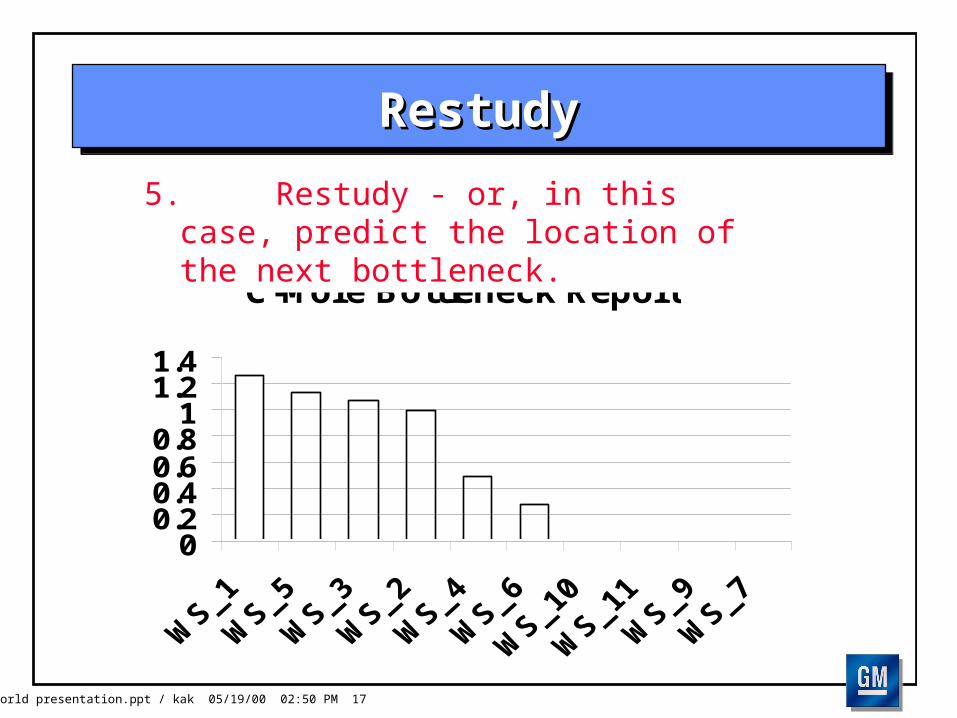
5. Restudy - or, in this case, predict the location of the next bottleneck.
TOC World presentation.ppt / kak 05/19/00 02:50 PM 18
Typical Training ResultsTypical Training Results
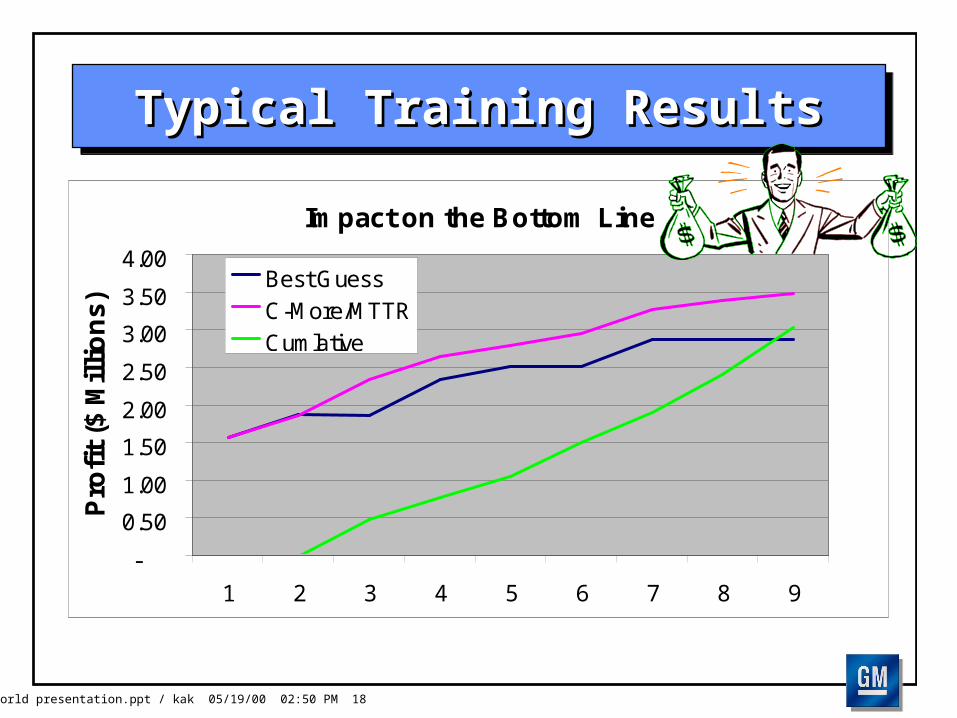
Impact on the Bottom Line
-
0.50
1.00
1.50
2.00
2.50
3.00
3.50
4.00
1 2 3 4 5 6 7 8 9
Pro
fit
($ M
illi
on
s)
Best GuessC-More/MTTRCumlative
TOC World presentation.ppt / kak 05/19/00 02:50 PM 19
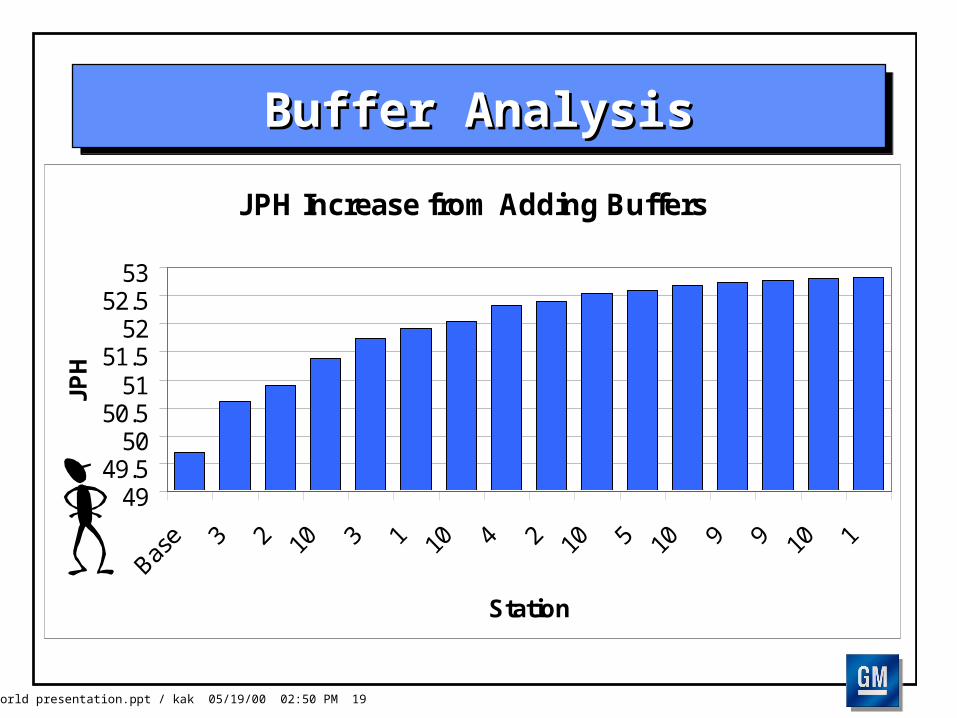
Buffer AnalysisBuffer Analysis
JPH Increase from Adding Buffers
4949.5
5050.5
5151.5
5252.5
53
Station
JPH
TOC World presentation.ppt / kak 05/19/00 02:50 PM 20
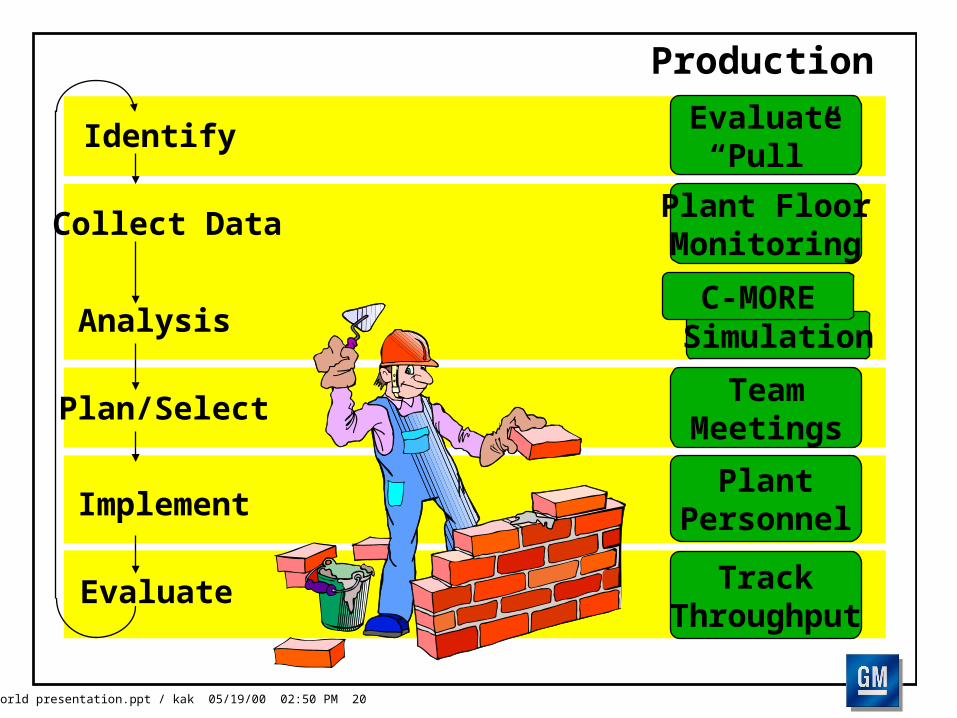
Identify
Analysis
Collect Data
Evaluate“Pull”
Plant FloorMonitoring
Plan/Select
Implement
Evaluate
TeamMeetings
PlantPersonnel
TrackThroughput
Production
SimulationC-MORE
TOC World presentation.ppt / kak 05/19/00 02:50 PM 21
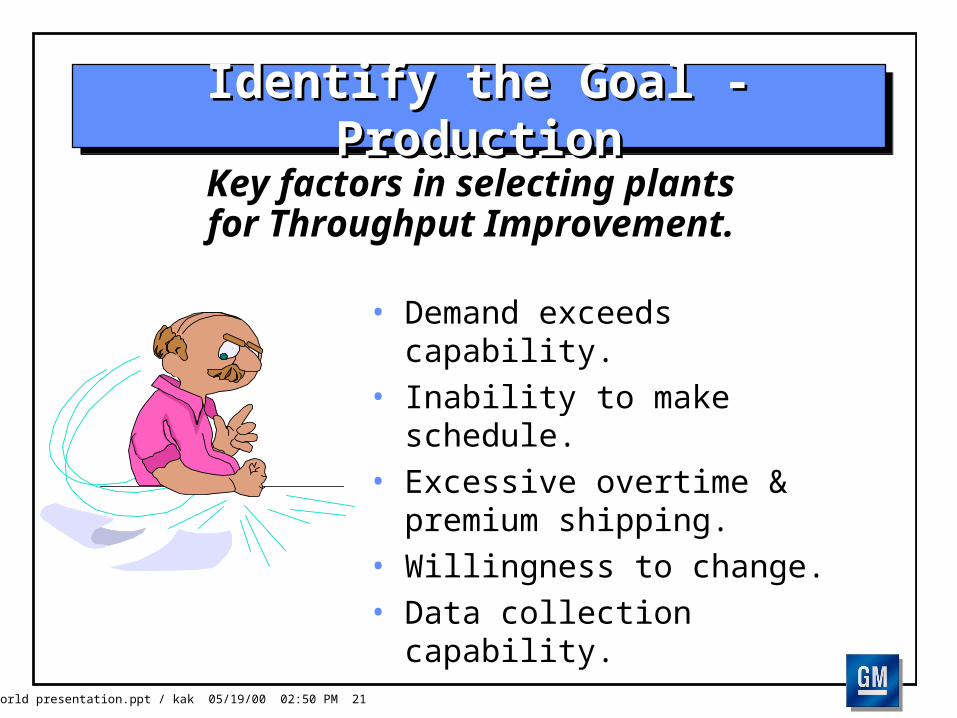
Identify the Goal - ProductionIdentify the Goal - Production
• Demand exceeds capability.• Inability to make schedule.• Excessive overtime & premium
shipping.• Willingness to change.• Data collection capability.
Key factors in selecting plants for Throughput Improvement.
TOC World presentation.ppt / kak 05/19/00 02:50 PM 22
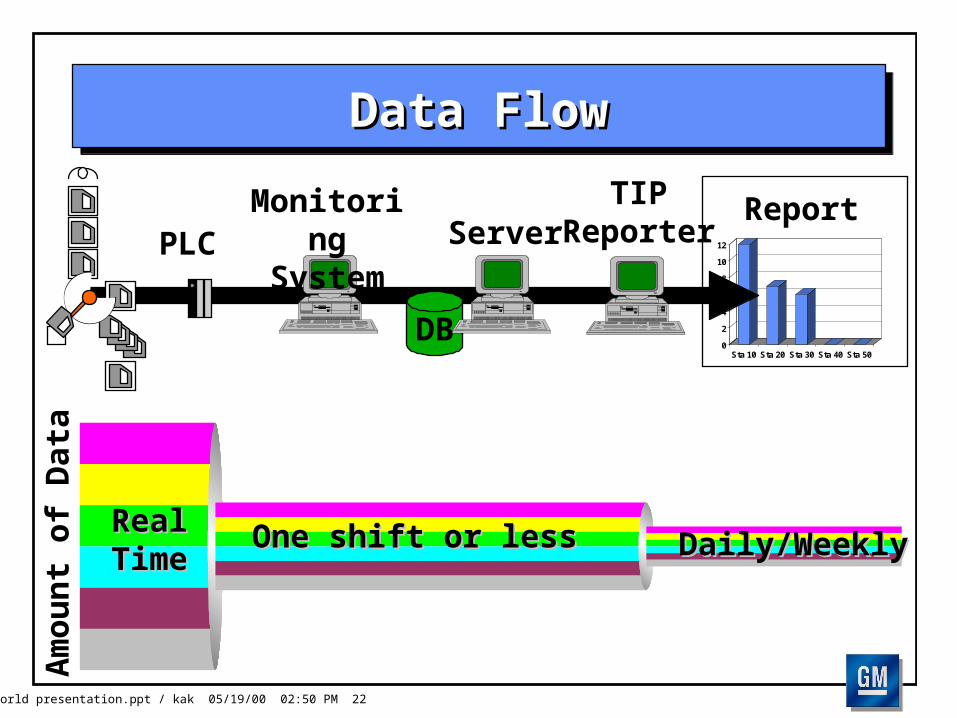
Data FlowData Flow
Report
0
2
4
6
8
10
12
Sta 10 Sta 20 Sta 30 Sta 40 Sta 50
PCDB
TIPReporter
Monitoring System ServerPLC
Am
ou
nt
of
Dat
a
RealRealTimeTime
One shift or lessOne shift or less Daily/WeeklyDaily/Weekly
TOC World presentation.ppt / kak 05/19/00 02:50 PM 23
Data Collection Issues at GMData Collection Issues at GM
• “All data is wrong - some of it’s useful.”• Data is being collected to find the
bottleneck in the plant, but can also be used for simulation of future systems.
• C-MORE analysis and data rarely matches our perceptions, unless we are willing to go down to the floor and stare at one workstation for at least a shift.
• Perceived need to “micro-analyze” the data - challenge its validity instead of attacking the problem.
TOC World presentation.ppt / kak 05/19/00 02:50 PM 24
Analysis - ProductionAnalysis - Production
• C-More for finding bottlenecks, setting priorities, basic “what-ifs.”
• Add Selling Price, Raw Material Costs, Operating Expense to help determine Net Profit impact.
• Emphasize that buffers, while “Non-Value Added,” can be “Net Profit Added” if properly located.
• Simulation for production strategies, detailed “what-ifs.”
• Use Pareto analysis & delay studies for breakdown of problems on the Bottleneck.
TOC World presentation.ppt / kak 05/19/00 02:50 PM 25
Implement/Evaluate - ProductionImplement/Evaluate - Production
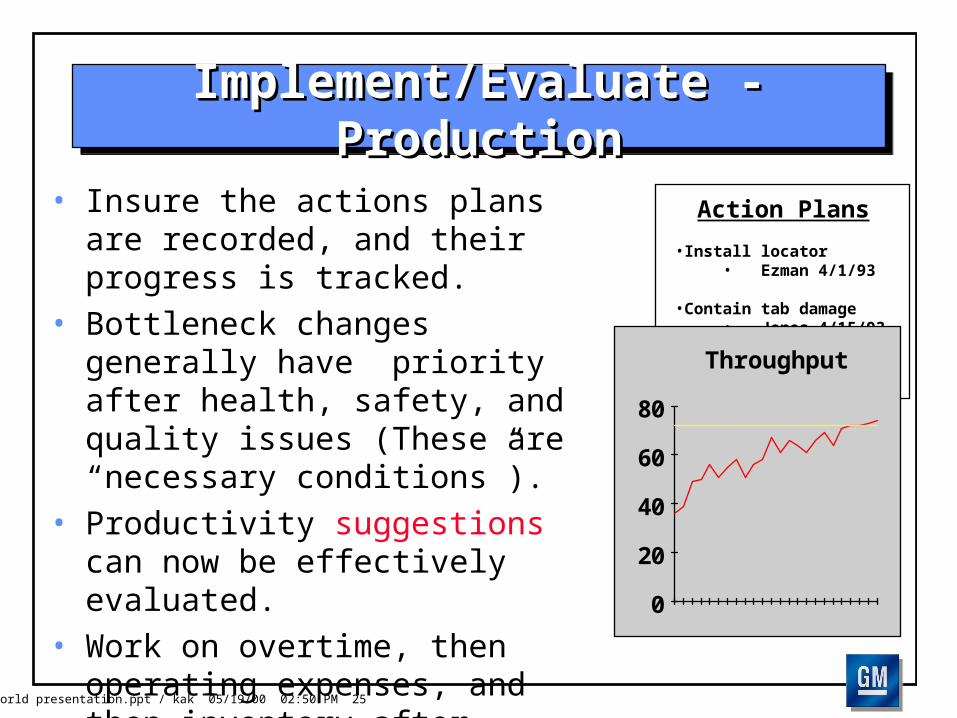
Action Plans
•Install locator • Ezman 4/1/93
•Contain tab damage • Jones 4/15/93
• Insure the actions plans are recorded, and their progress is tracked.
• Bottleneck changes generally have priority after health, safety, and quality issues (These are “necessary conditions”).
• Productivity suggestions can now be effectively evaluated.
• Work on overtime, then operating expenses, and then inventory after throughput goals are obtained.
0
20
40
60
80
Throughput
TOC World presentation.ppt / kak 05/19/00 02:50 PM 26
Team Meetings - ProductionTeam Meetings - Production
• Appoint Champion of overall process.• Appoint TIP Coordinator.• Hold team meetings at floor level to resolve
problems.• Involve operators & skilled trades in meetings.• Bring C-MORE results, Pareto of faults to the
meeting to help prioritize resources.• Use five step process for problem solving.
TOC World presentation.ppt / kak 05/19/00 02:50 PM 27
Status in GMStatus in GM
• To date Net Profit improvements, validated with internal customers, exceeds $2 billion.
• All GM assembly plants have been allocated a throughput improvement coordinator position.
• Impact is large, so even having a few action plans focused on the bottleneck yields results.
TOC World presentation.ppt / kak 05/19/00 02:50 PM 28
Current StatusCurrent Status
• Have one Throughput Coordinator position in every Truck and Car plant.
• There are 56 engineers working in or around this area of data collection, bottleneck analysis, bottleneck resolution, or new system design.
• TOC classes are taught as part of the General Motors University Curriculum. As of 6/9/2000, over 600 of our GM people have attended a 2-day course.
TOC World presentation.ppt / kak 05/19/00 02:50 PM 29
Relentless Pursuit of the ConstraintRelentless Pursuit of the Constraint
• While we were learning how to improve throughput once that plant was running, it became apparent that the root cause was in process design. Designs for new manufacturing systems were not capable of reaching throughput targets.
• So, were started to pursue the constraint into the design world....
ManufacturingEngineering
TOC World presentation.ppt / kak 05/19/00 02:50 PM 30
Design of Manufacturing SystemsDesign of Manufacturing Systems
Manufacturing: A series of material Manufacturing: A series of material handling steps we occasionally handling steps we occasionally
interrupt with value-added interrupt with value-added operationsoperations
TOC World presentation.ppt / kak 05/19/00 02:50 PM 31
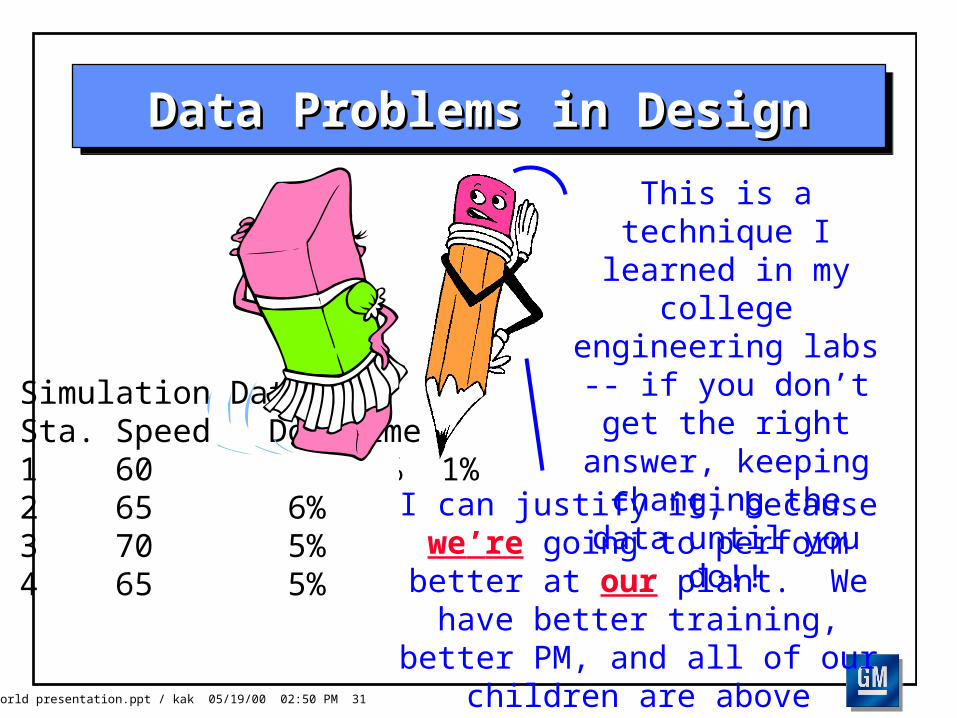
Data Problems in DesignData Problems in Design
Simulation DataSta. Speed Downtime1 60 5% 3% 1%2 65 6%3 70 5%4 65 5%
This is a technique I learned in my
college engineering labs -- if you don’t
get the right answer, keeping
changing the data until you do!!
I can justify it, because we’re going to perform better at our plant. We have better training,
better PM, and all of our children are above average!
TOC World presentation.ppt / kak 05/19/00 02:50 PM 32
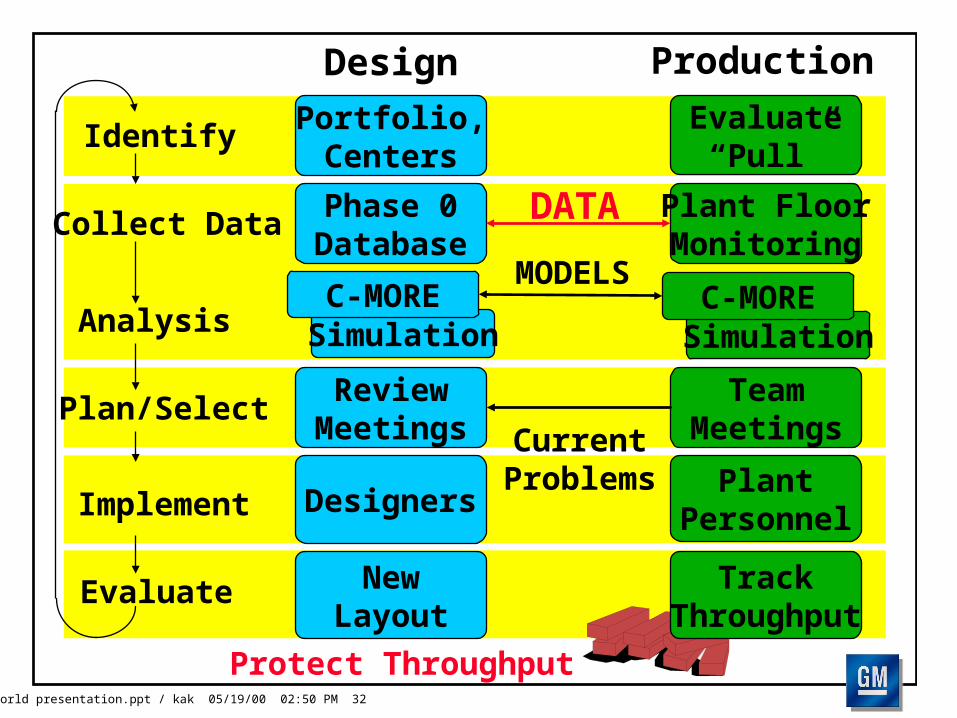
Identify
Analysis
Collect Data
Portfolio,Centers
Phase 0Database
Evaluate“Pull”
Plant FloorMonitoring
MODELS
Plan/Select
Implement
Evaluate
ReviewMeetings
Designers
NewLayout
TeamMeetings
PlantPersonnel
CurrentProblems
Design Production
DATA
SimulationC-MORE
SimulationC-MORE
Protect Throughput
TrackThroughput
TOC World presentation.ppt / kak 05/19/00 02:50 PM 33
0
2
4
6
8
10
12
Sta 10 Sta 20 Sta 30 Sta 40 Sta 50
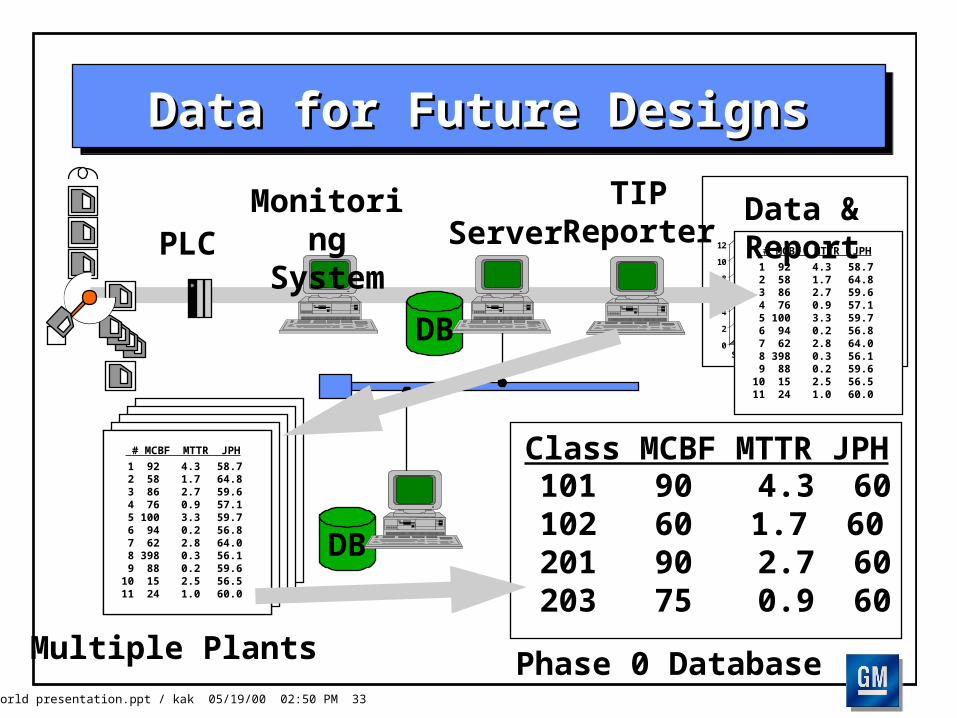
1 92 4.3 58.7 2 58 1.7 64.8 3 86 2.7 59.6 4 76 0.9 57.1 5 100 3.3 59.7 6 94 0.2 56.8 7 62 2.8 64.0 8 398 0.3 56.1 9 88 0.2 59.6 10 15 2.5 56.511 24 1.0 60.0
# MCBF MTTR JPH
Data for Future DesignsData for Future Designs
Data & Report
PCDB
TIPReporter
Monitoring System ServerPLC
PCDB
1 92 4.3 58.7 2 58 1.7 64.8 3 86 2.7 59.6 4 76 0.9 57.1 5 100 3.3 59.7 6 94 0.2 56.8 7 62 2.8 64.0 8 398 0.3 56.1 9 88 0.2 59.6 10 15 2.5 56.511 24 1.0 60.0
# MCBF MTTR JPH
101 90 4.3 60 102 60 1.7 60 201 90 2.7 60 203 75 0.9 60
Class MCBF MTTR JPH
Multiple Plants Phase 0 Database
TOC World presentation.ppt / kak 05/19/00 02:50 PM 34
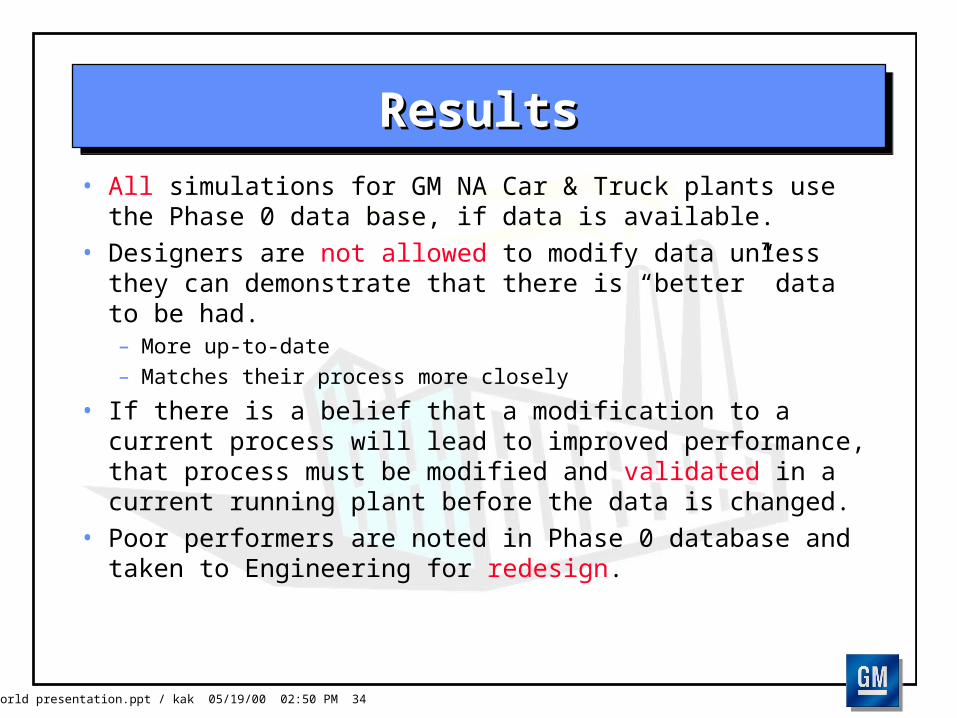
• All simulations for GM NA Car & Truck plants use the Phase 0 data base, if data is available.
• Designers are not allowed to modify data unless they can demonstrate that there is “better” data to be had.– More up-to-date
– Matches their process more closely
• If there is a belief that a modification to a current process will lead to improved performance, that process must be modified and validated in a current running plant before the data is changed.
• Poor performers are noted in Phase 0 database and taken to Engineering for redesign.
ResultsResults
TOC World presentation.ppt / kak 05/19/00 02:50 PM 35
ResultsResults
• Our latest GMT800 truck plant designs have performed much better, and have not required the massive injections of investment required in the past to improve throughput.
• These plants accelerated up their throughput curves more quickly than past plants.
• Loss of net profit from not being able to supply these highly profitable trucks was avoided.
TOC World presentation.ppt / kak 05/19/00 02:50 PM 36
Relentless Pursuit of the ConstraintRelentless Pursuit of the Constraint
• Designs were performing better, but the design process still appeared to be in chaos.
• So, were started to pursue the constraint into the policy & measurement world....
ManufacturingManagement
ManufacturingEngineering
TOC World presentation.ppt / kak 05/19/00 02:50 PM 37
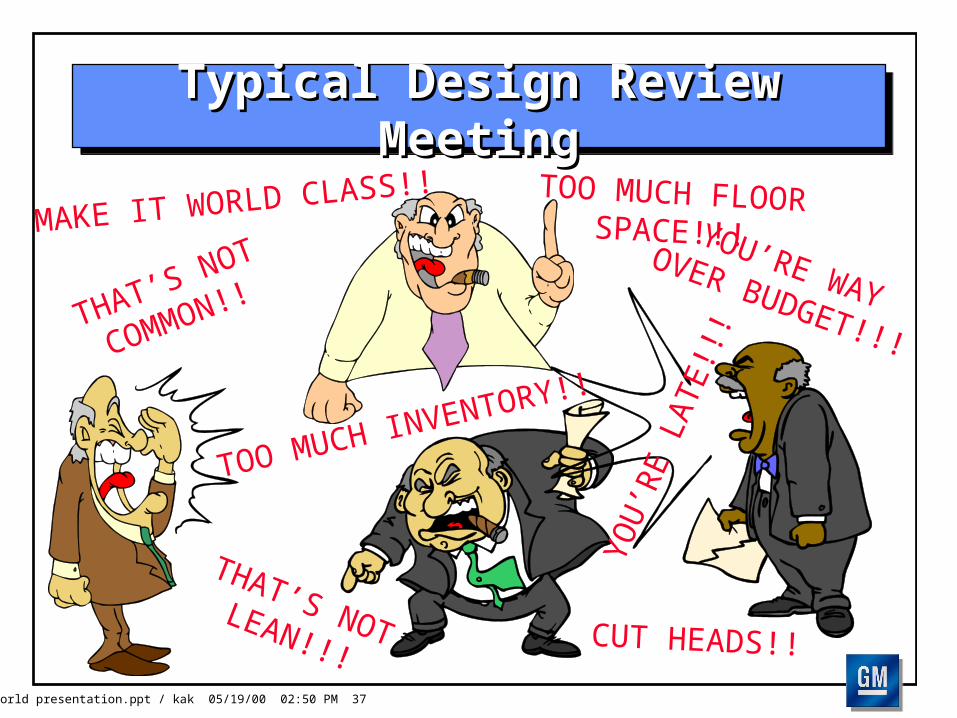
Typical Design Review MeetingTypical Design Review Meeting
THAT’S NOT
COMMON!!
YOU’RE WAY OVER BUDGET!!!
THAT’S NOT LEAN!!!
TOO MUCH FLOOR SPACE!!!MAKE IT WORLD CLASS!!
CUT HEADS!!
TOO MUCH INVENTORY!!
YOU
’RE
LATE
!!!
TOC World presentation.ppt / kak 05/19/00 02:50 PM 38
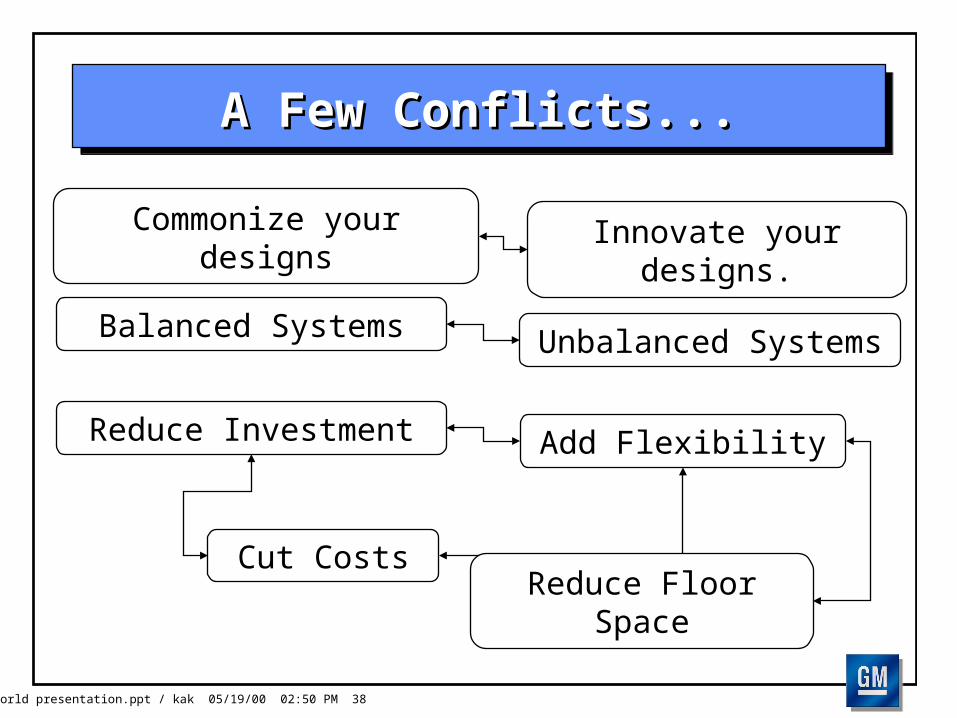
A Few Conflicts...A Few Conflicts...
Balanced Systems Unbalanced Systems
Reduce Investment
Cut Costs
Add Flexibility
Commonize your designs Innovate your designs.
Reduce Floor Space
TOC World presentation.ppt / kak 05/19/00 02:50 PM 39
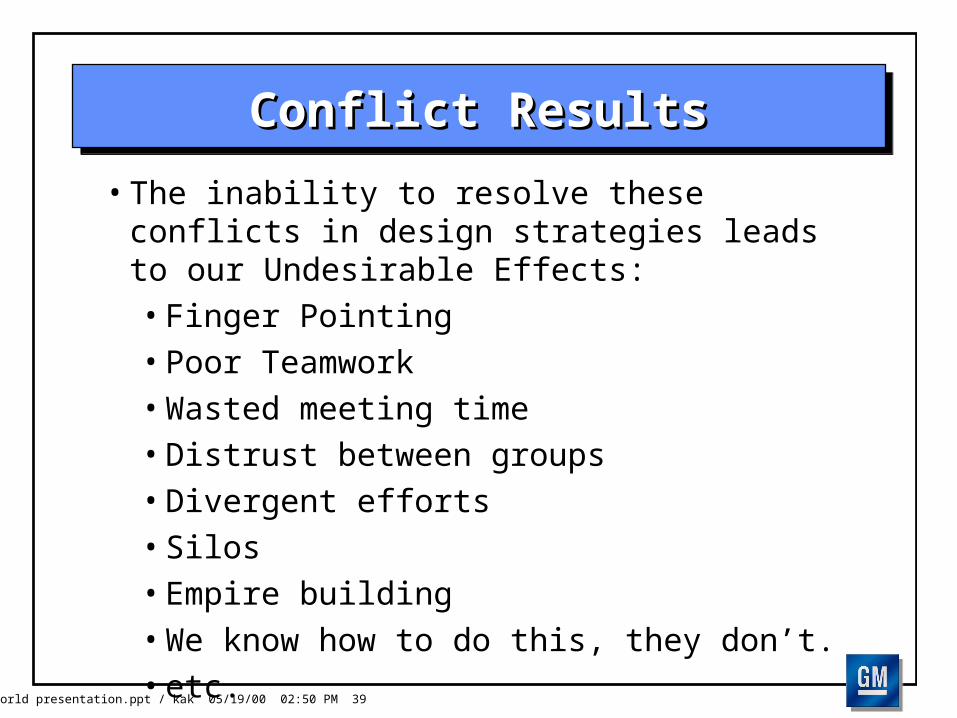
Conflict ResultsConflict Results
• The inability to resolve these conflicts in design strategies leads to our Undesirable Effects:• Finger Pointing• Poor Teamwork• Wasted meeting time• Distrust between groups• Divergent efforts• Silos• Empire building• We know how to do this, they don’t.• etc.
TOC World presentation.ppt / kak 05/19/00 02:50 PM 40
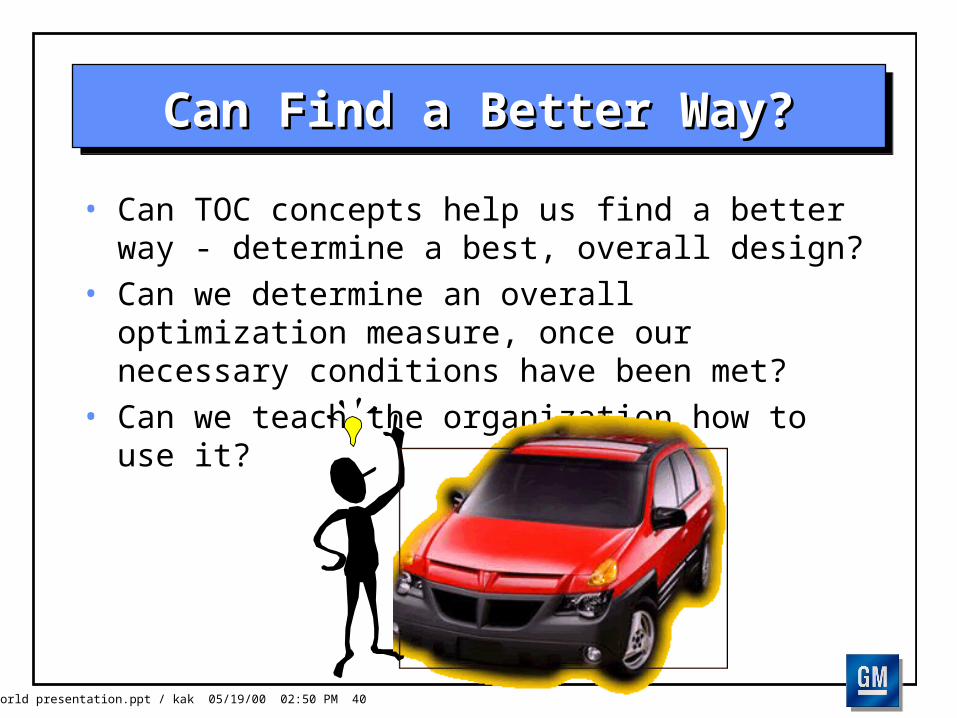
Can Find a Better Way?Can Find a Better Way?
• Can TOC concepts help us find a better way - determine a best, overall design?
• Can we determine an overall optimization measure, once our necessary conditions have been met?
• Can we teach the organization how to use it?
TOC World presentation.ppt / kak 05/19/00 02:50 PM 41
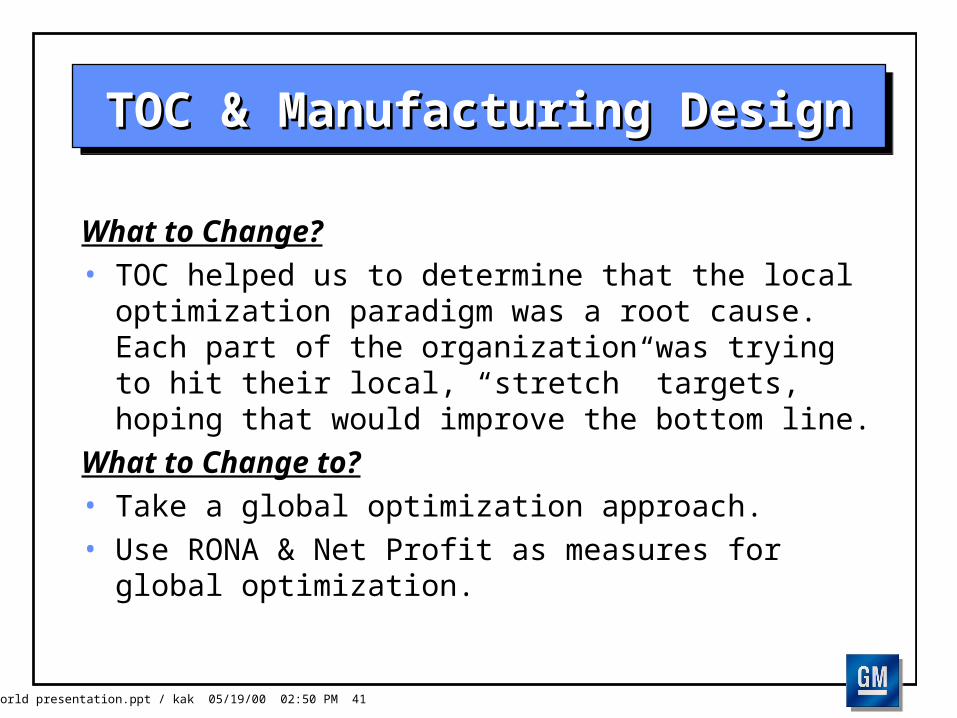
TOC & Manufacturing DesignTOC & Manufacturing Design
What to Change?• TOC helped us to determine that the local
optimization paradigm was a root cause. Each part of the organization was trying to hit their local, “stretch” targets, hoping that would improve the bottom line.
What to Change to?• Take a global optimization approach.• Use RONA & Net Profit as measures for global
optimization.
TOC World presentation.ppt / kak 05/19/00 02:50 PM 42
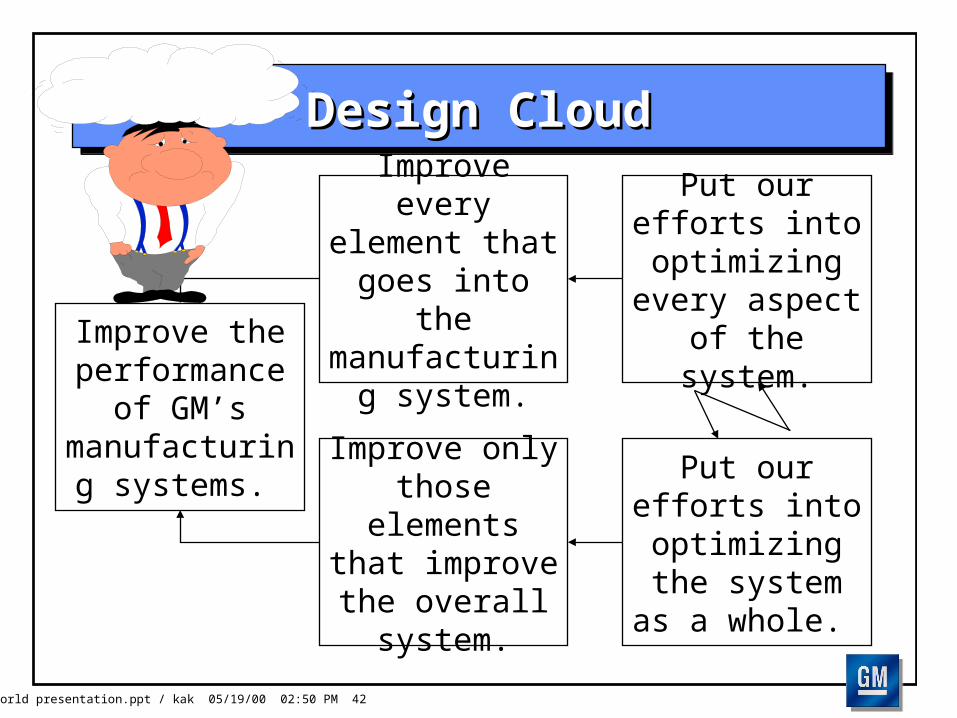
Design CloudDesign Cloud
Improve the performance of GM’s manufacturing
systems.
Improve every element that goes
into the manufacturing
system.
Put our efforts into optimizing every
aspect of the system.
Improve only those elements that
improve the overall system.
Put our efforts into optimizing the
system as a whole.
TOC World presentation.ppt / kak 05/19/00 02:50 PM 43
Developing SolutionsDeveloping Solutions
• How are we going to obtain the needed consensus and active collaboration to implement this solution?
• Obviously, we have to play a game!– Go to groups in manufacturing design who are in crisis.– Have them verbalize their current situation.– Convince them their current efforts will not change the
situation.– Demonstrate a better method.– Apply to their design.
TOC World presentation.ppt / kak 05/19/00 02:50 PM 44
Design GameDesign Game
• Ask the question, “What are GM’s obstacles to successfully designing manufacturing systems?”
• As in the TOC class, we take their list of obstacles and then eliminate them.
• Give them a scenario with perfectly accurate data, clear expectations, with perfect employees, no product problems, etc.
TOC World presentation.ppt / kak 05/19/00 02:50 PM 45
Design Game ScenarioDesign Game Scenario
Problem• Design the optimal manufacturing line. It should be
“world class” in every measure.• There are 7 station types plus a conveyor. There are
five possible choices for each station type and the conveyor.
• Add buffer as required.
TOC World presentation.ppt / kak 05/19/00 02:50 PM 46
MandatesMandates
• Meet the budget!• Serial Lines are Synchronous and allow for better
quality!!!• Create your own targets based on actual data.• Since you create the above targets you should have
no trouble meeting them.• Move the company towards World Class in every
measure!!• Minimize Buffers & Inventories - NVA• Keep Operating Expense Low.• Keep downtime to a minimum!!• Keep Scrap to a minimum!• Don't create waste by overspeeding machines.
TOC World presentation.ppt / kak 05/19/00 02:50 PM 47
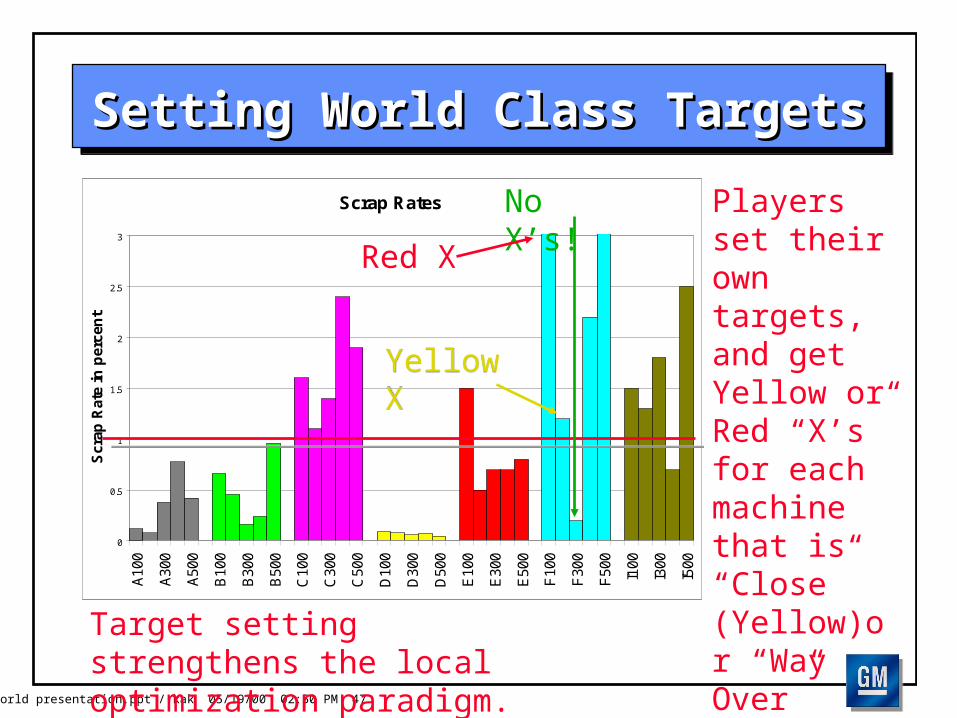
Setting World Class TargetsSetting World Class Targets
Scrap Rates
0
0.5
1
1.5
2
2.5
3
A10
0
A30
0
A50
0
B10
0
B30
0
B50
0
C10
0
C30
0
C50
0
D10
0
D30
0
D50
0
E10
0
E30
0
E50
0
F10
0
F30
0
F50
0
I100
I300
I500
Scr
ap R
ate
in p
erce
nt
Target setting strengthens the local optimization paradigm.
Players set their own targets, and get Yellow or Red “X ’s” for each machine that is “Close” (Yellow)or “Way Over” (Red).
No X’s!
Red X
Yellow XYellow X
TOC World presentation.ppt / kak 05/19/00 02:50 PM 48
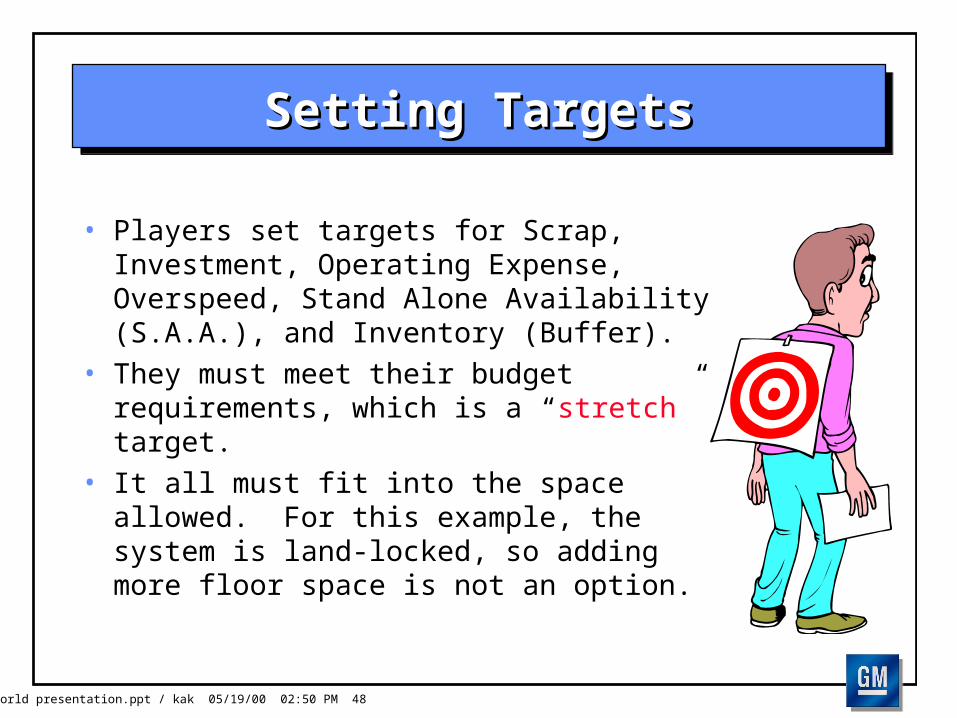
Setting TargetsSetting Targets
• Players set targets for Scrap, Investment, Operating Expense, Overspeed, Stand Alone Availability (S.A.A.), and Inventory (Buffer).
• They must meet their budget requirements, which is a “stretch” target.
• It all must fit into the space allowed. For this example, the system is land-locked, so adding more floor space is not an option.
TOC World presentation.ppt / kak 05/19/00 02:50 PM 49
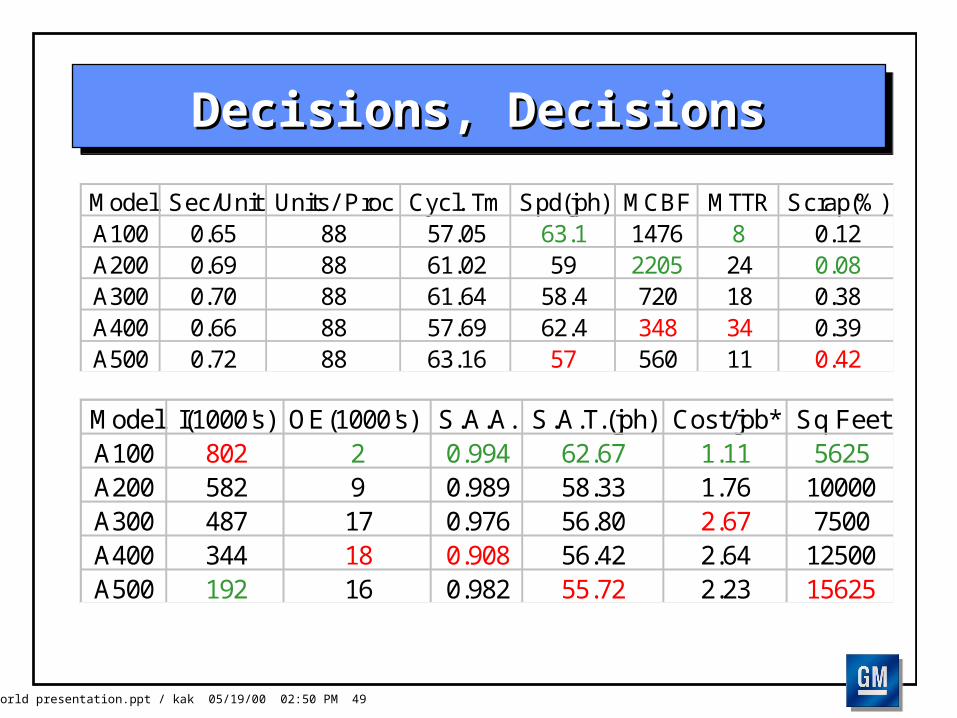
Decisions, DecisionsDecisions, Decisions
Model Sec/Unit Units/ Proc Cycl. Tm Spd(jph) MCBF MTTR Scrap(%)A100 0.65 88 57.05 63.1 1476 8 0.12A200 0.69 88 61.02 59 2205 24 0.08A300 0.70 88 61.64 58.4 720 18 0.38A400 0.66 88 57.69 62.4 348 34 0.39A500 0.72 88 63.16 57 560 11 0.42
Model I(1000's) OE(1000's) S.A.A. S.A.T.(jph) Cost/job* Sq FeetA100 802 2 0.994 62.67 1.11 5625A200 582 9 0.989 58.33 1.76 10000A300 487 17 0.976 56.80 2.67 7500A400 344 18 0.908 56.42 2.64 12500A500 192 16 0.982 55.72 2.23 15625
TOC World presentation.ppt / kak 05/19/00 02:50 PM 50
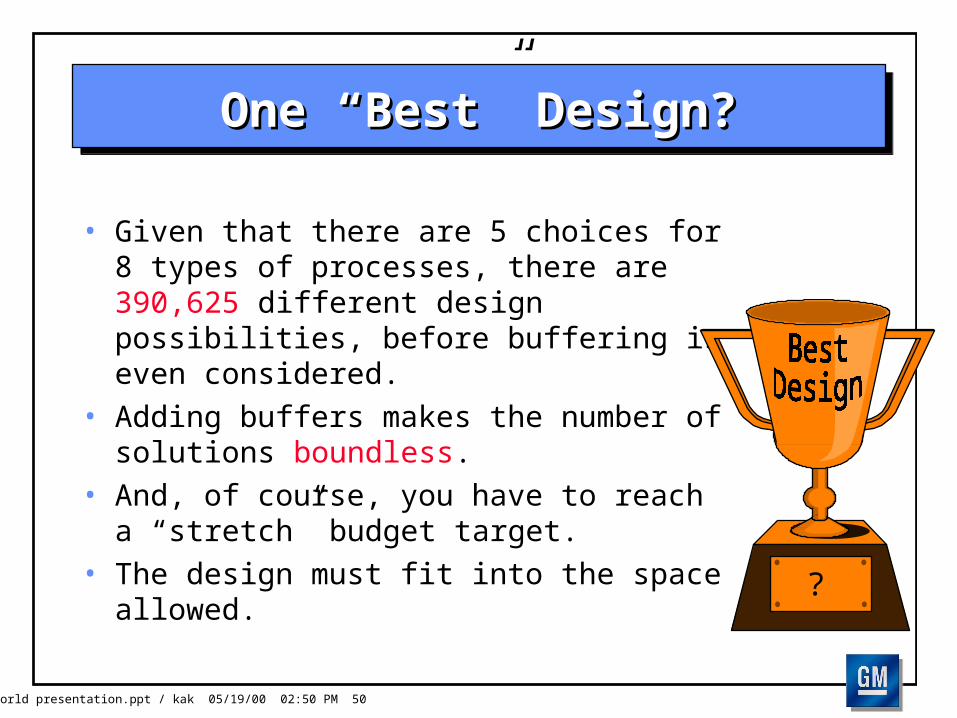
One One ““BestBest”” Design? Design?
• Given that there are 5 choices for 8 types of processes, there are 390,625 different design possibilities, before buffering is even considered.
• Adding buffers makes the number of solutions boundless.
• And, of course, you have to reach a “stretch” budget target.
• The design must fit into the space allowed.?
TOC World presentation.ppt / kak 05/19/00 02:50 PM 51
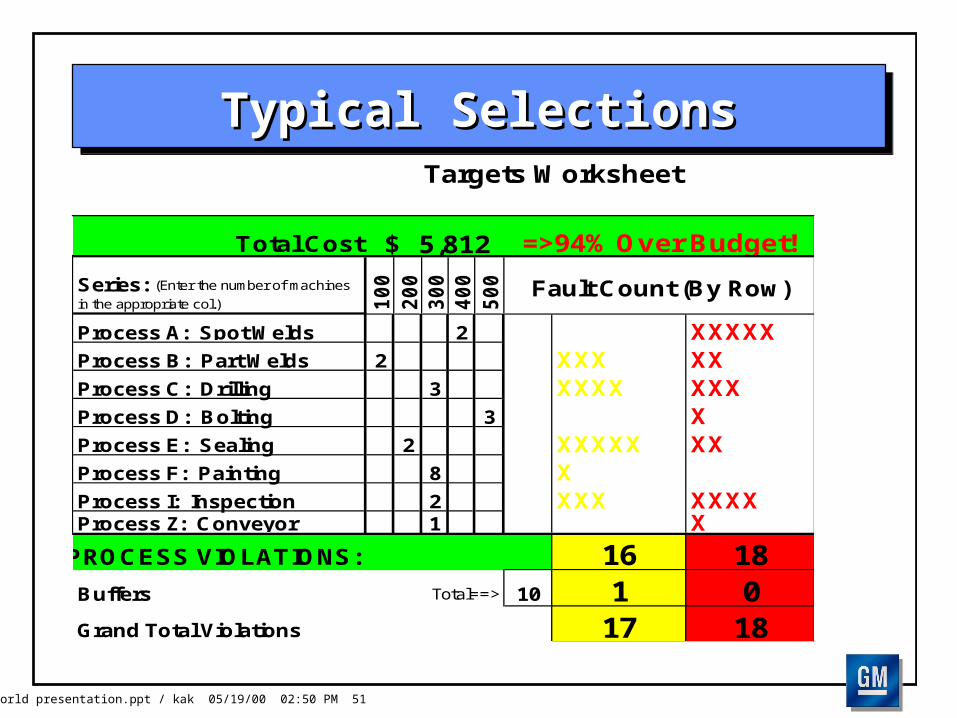
Typical SelectionsTypical SelectionsTargets Worksheet
Total Cost 5,812$ =>94% Over Budget! WARNINGS+FAULTS
Series: (Enter the number of machines
in the appropriate col.) 10
0
20
0
30
0
40
0
50
0 Fault Count (By Row)
Process A: Spot Welds 2 XXXXXProcess B: Part Welds 2 XXX XXProcess C: Drilling 3 XXXX XXXProcess D: Bolting 3 XProcess E: Sealing 2 XXXXX XXProcess F: Painting 8 XProcess I: Inspection 2 XXX XXXXProcess Z: Conveyor 1 X
PROCESS VIOLATIONS: 16 18Buffers Total==> 10 1 0Grand Total Violations 17 18
TOC World presentation.ppt / kak 05/19/00 02:50 PM 52
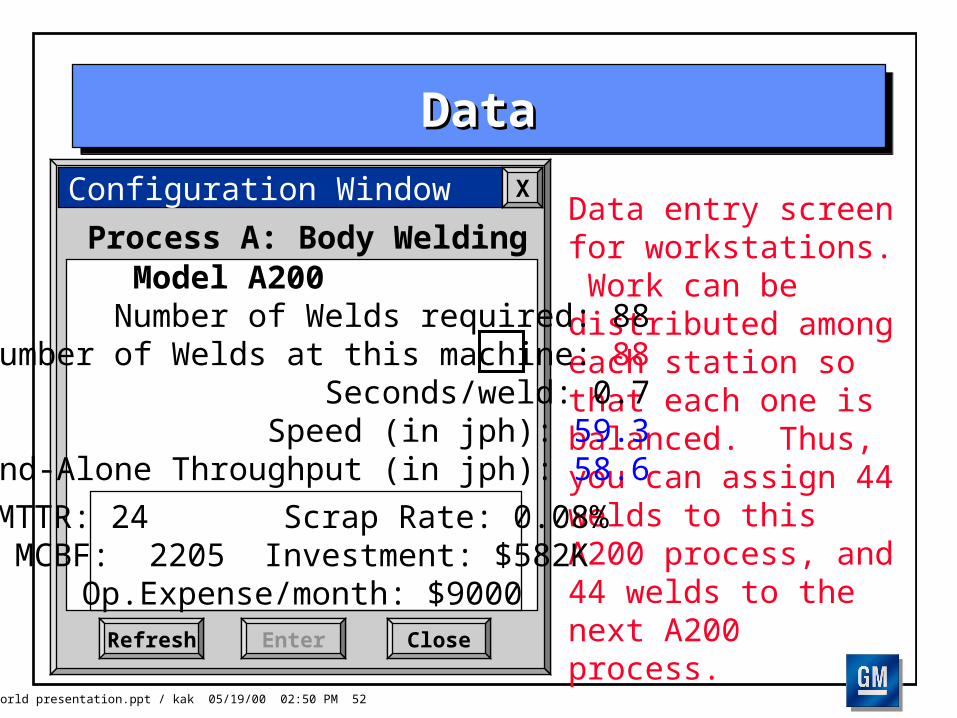
DataData
Data entry screen for workstations. Work can be distributed among each station so that each one is balanced. Thus, you can assign 44 welds to this A200 process, and 44 welds to the next A200 process.
Configuration Window
Refresh
X
Enter Close
Model A200 Number of Welds required: 88
Number of Welds at this machine: 88Seconds/weld: 0.7
Speed (in jph): 59.3Stand-Alone Throughput (in jph): 58.6
MTTR: 24 Scrap Rate: 0.08%MCBF: 2205 Investment: $582K
Op.Expense/month: $9000
Process A: Body Welding
TOC World presentation.ppt / kak 05/19/00 02:50 PM 53
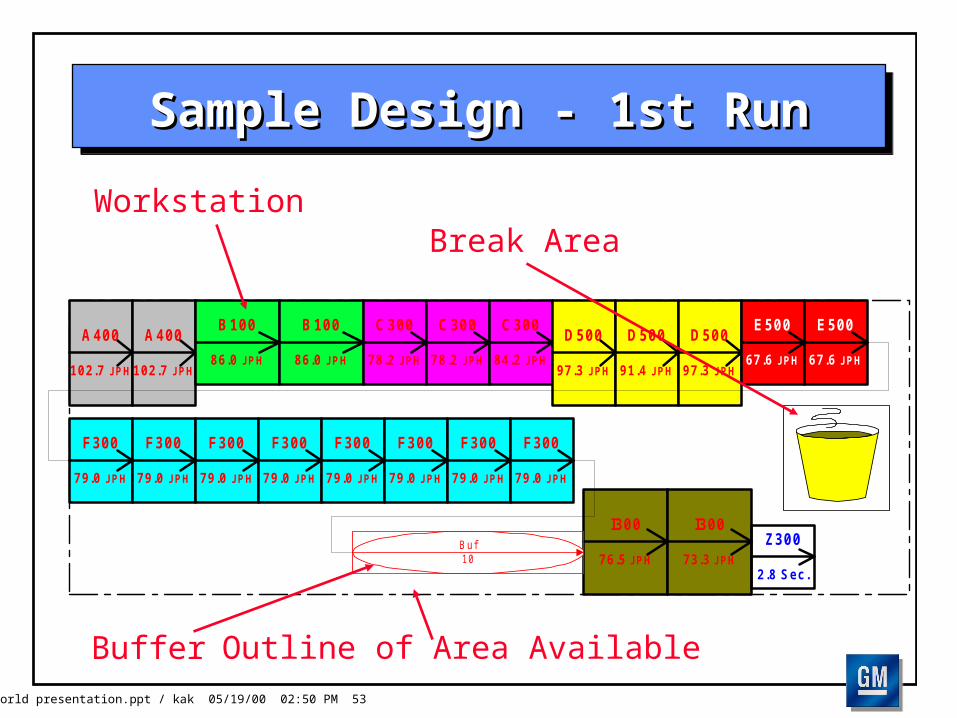
Sample Design - 1st RunSample Design - 1st Run
Workstation
A400
102.7 JPH
A400
102.7 JPH
B100
86.0 JPH
B100
86.0 JPH
C300
78.2 JPH
C300
78.2 JPH
C300
84.2 JPH
D500
97.3 JPH
D500
91.4 JPH
D500
97.3 JPH
E500
67.6 JPH
E500
67.6 JPH
F300
79.0 JPH
F300
79.0 JPH
F300
79.0 JPH
F300
79.0 JPH
F300
79.0 JPH
F300
79.0 JPH
F300
79.0 JPH
F300
79.0 JPH
I300
76.5 JPH
I300
73.3 JPH
Z300
2.8 Sec.
Buf10
Buffer
Break Area
Outline of Area Available
TOC World presentation.ppt / kak 05/19/00 02:50 PM 54
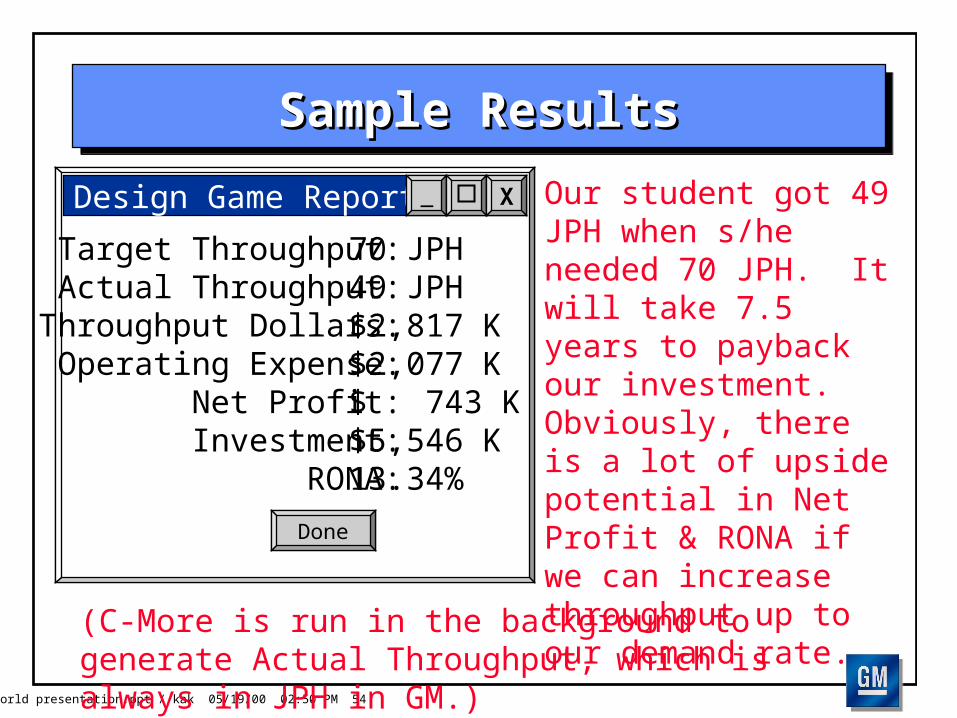
Sample ResultsSample Results
Our student got 49 JPH when s/he needed 70 JPH. It will take 7.5 years to payback our investment. Obviously, there is a lot of upside potential in Net Profit & RONA if we can increase throughput up to our demand rate.
Target Throughput:Actual Throughput:
Throughput Dollars:Operating Expense:
Net Profit:Investment:
RONA:
70 JPH49 JPH$2,817 K$2,077 K$ 743 K$5,546 K13.34%
Design Game Report
Done
_ X
(C-More is run in the background to generate Actual Throughput, which is always in JPH in GM.)
TOC World presentation.ppt / kak 05/19/00 02:50 PM 56
End of 1st RunEnd of 1st Run
• Using the traditional method of local optimization results in every team having a different design, and all falling well short of their throughput goals. Most “bleed red” and/or fail to fit into the required area, miss their budgets, and have too many red X’s.
• What are the possibilities of consensus among the teams on the best design?
• Buffers are often the first thing “sacrificed.”• Leads to our list of Undesirables Effects listed earlier.
TOC World presentation.ppt / kak 05/19/00 02:50 PM 57
Second RunSecond Run
• Remove all mandates and local measures - only use Net Profit & RONA for decision making.
• Use RONA at the workstation level to decide on each workstation.
• End up with only a few variations to test from an system level perspective. (Down from 390,625)
• Use C-More to add the optimal amount of buffer to maximize RONA.
• End up with one “best” design for making money. GM NA!
TOC World presentation.ppt / kak 05/19/00 02:50 PM 58
Workstation RONAWorkstation RONA
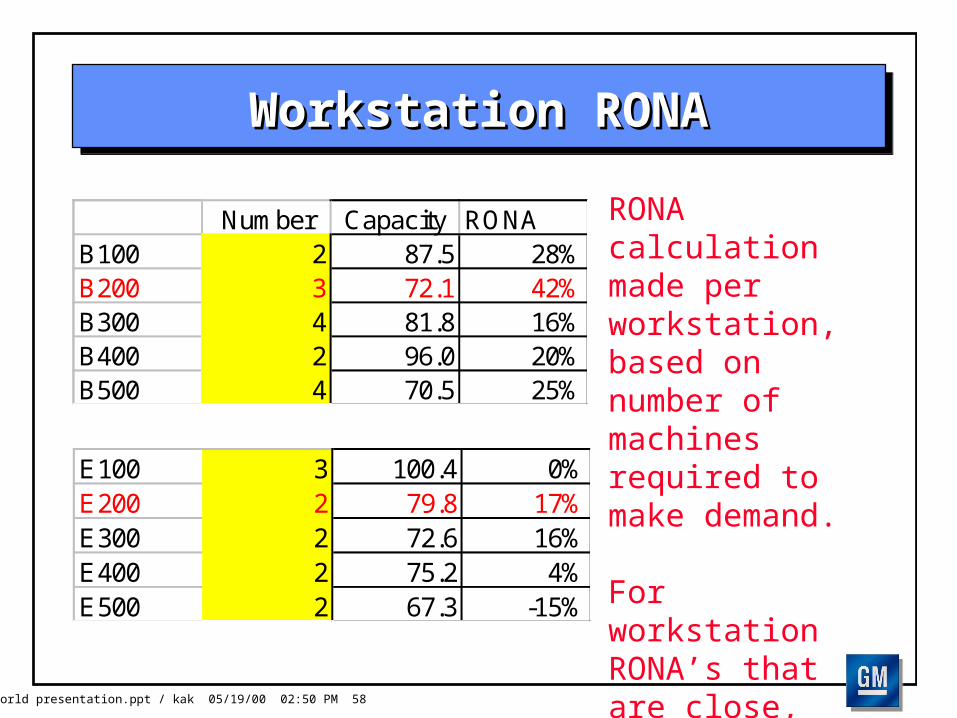
RONA calculation made per workstation, based on number of machines required to make demand. For workstation RONA’s that are close, check both in system model.
Number Capacity RONAB100 2 87.5 28%B200 3 72.1 42%B300 4 81.8 16%B400 2 96.0 20%B500 4 70.5 25%
E100 3 100.4 0%E200 2 79.8 17%E300 2 72.6 16%E400 2 75.2 4%E500 2 67.3 -15%
TOC World presentation.ppt / kak 05/19/00 02:50 PM 59
Designed-In ConstraintDesigned-In Constraint
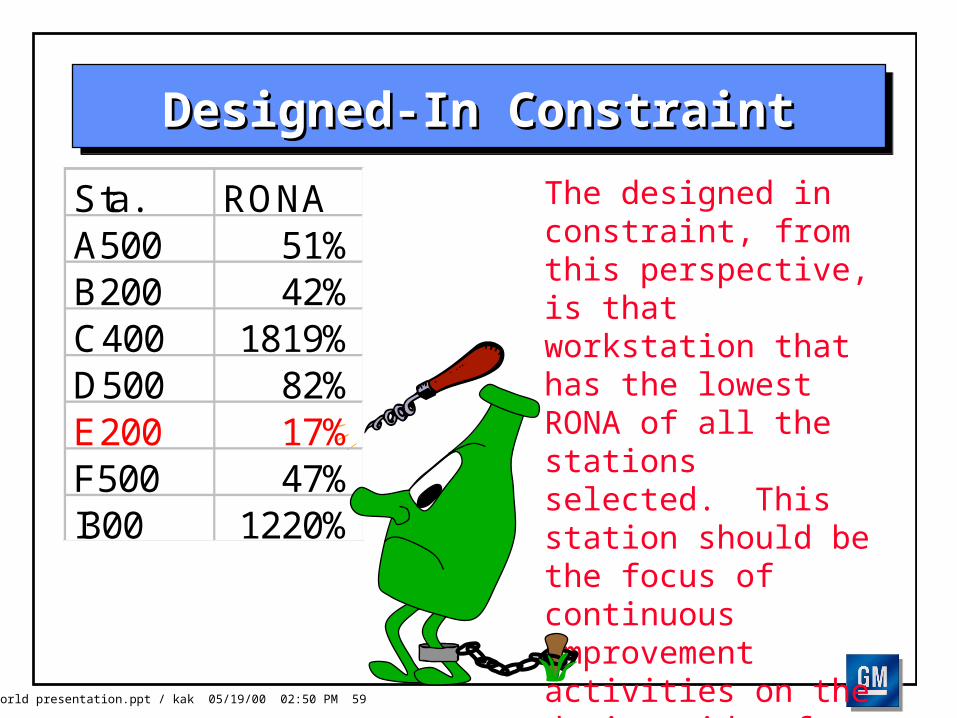
The designed in constraint, from this perspective, is that workstation that has the lowest RONA of all the stations selected. This station should be the focus of continuous improvement activities on the design side of the house.
Sta. RONAA500 51%B200 42%C400 1819%D500 82%E200 17%F500 47%I300 1220%
TOC World presentation.ppt / kak 05/19/00 02:50 PM 60
Results after 2nd RunResults after 2nd Run
• One basic design that can be agreed upon by everyone in the room.
• Experimentation past this point is usually around uncertainty.– Demand, model mix– Downtime data– Buffer protection investment to cover uncertainty risk
• Basis for incremental change - will the change increase Net Profit or improve RONA?
TOC World presentation.ppt / kak 05/19/00 02:50 PM 61
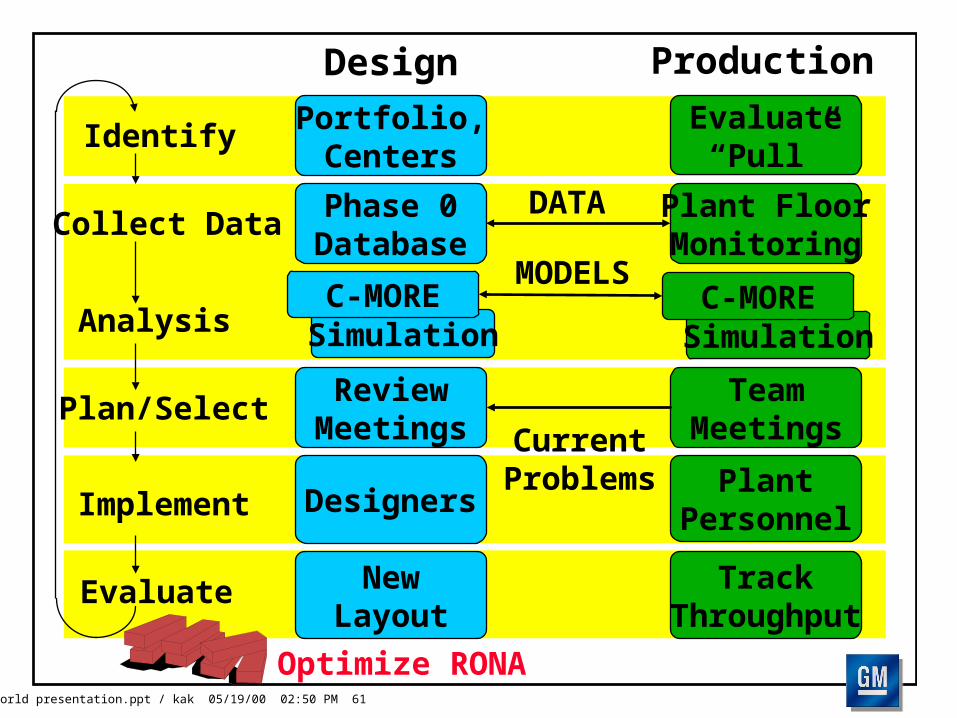
Optimize RONA
Identify
Analysis
Collect Data
Portfolio,Centers
Phase 0Database
Evaluate“Pull”
Plant FloorMonitoring
MODELS
Plan/Select
Implement
Evaluate
ReviewMeetings
Designers
NewLayout
TeamMeetings
PlantPersonnel
TrackThroughput
CurrentProblems
Design Production
DATA
SimulationC-MORE
SimulationC-MORE
TOC World presentation.ppt / kak 05/19/00 02:50 PM 62
System Design using TOC in GMSystem Design using TOC in GM
• Design assembly lines to be unbalanced, and design in the constraint.
• Break up the system with buffers. Use C-More & the RONA equation to get the most “bang for the buck.”
• Over protect the “designed in constraint” with buffers.
• Use RONA calculations to optimize design, perform trade-offs.
• Our basic rule of thumb is: “There is no rule of thumb - you gotta do the math (analysis).”
TOC World presentation.ppt / kak 05/19/00 02:50 PM 63
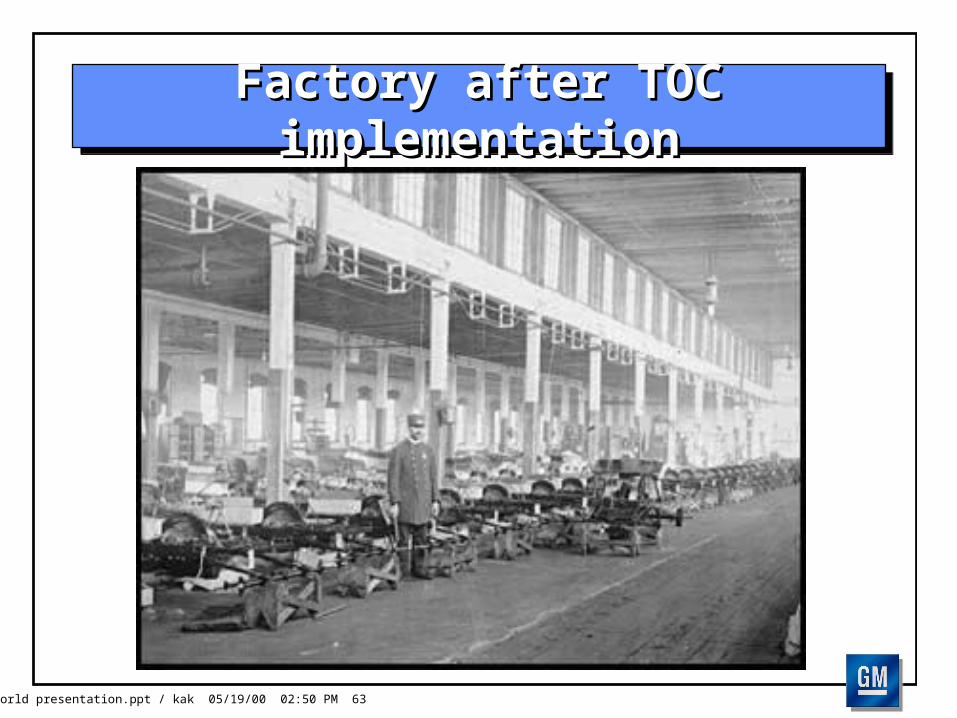
Factory after TOC implementationFactory after TOC implementation
TOC World presentation.ppt / kak 05/19/00 02:50 PM 64
Status within GMStatus within GM
• Class developed for training engineers on optimizing system design using RONA. Focus is on simulation engineers.
• Rolling out to manufacturing design groups in GM.
• Used for understanding impact of changes to current designs.
TOC World presentation.ppt / kak 05/19/00 02:50 PM 65
SummarySummary
• Improving throughput in GM assembly plants has increased our Net Profits by over $2 billion.
• The data we collected from these plants help us design the next wave of plants. These new plants having higher throughput than the previous designs.
• The use of RONA in design is our next step to further improving our profitability.
• TOC is still primarily a “Production thing” in GM.