Embed Size (px)
Citation preview

Agenda Item No: 9.1
Report No. 9/1 Sts
SUBJECT: TECHNICAL SERVICES DIRECTORATE UPDATE
AUTHOR: DIRECTOR TECHNICAL SERVICES - SCOTT ALLEN
EXECUTIVE SUMMARY
This report provides an update of current Technical Services programmes, projects and events for January 2018.
RECOMMENDATIONThat it be a recommendation to Council:
That this report be received and noted.
REPORT
1. DISCUSSION
The attached reports summarise activities that occurred within the Technical Services Department for the month of January 2018.
1.1 SUMMARY OF BUSINESS ARISING FROM PREVIOUS MINUTES OF THE ORDINARY COUNCIL MEETING 29 JANUARY 2018.
All matters actioned.
2. POLICY IMPACTS
All projects relate to and reflect the appropriate policies and components of the Alice Springs Town Council Strategic Plan.
3. FINANCIAL IMPACTS
All committed projects are working within their approved budget and funding agreements.
4. SOCIAL IMPACTS
As per individual projects and plans.
5. ENVIRONMENTAL IMPACTS
As per the projects and relevant plans.
6. PUBLIC RELATION
TO: TECHNICAL SERVICE COMMITTEE - MONDAY 12 FEBRUARY 2018
Nil
Report No. 9/1 Sts Agenda Item 9.1
7. ATTACHMENTS
A. Manager Infrastructure ReportB. Sports Officer ReportC Manager WorksD. Manager Regional Waste Management FacilityE. Manager DevelopmentsF. Environment Officer Report
Scott AllenDIRECTOR TECHNICAL SERVICES
TO: DIRECTOR TECHNICAL SERVICES - SCOTT ALLENATTACHMENT A
AUTHOR: MANAGER INFRASTRUCTURE - STEPHEN BALOBAN
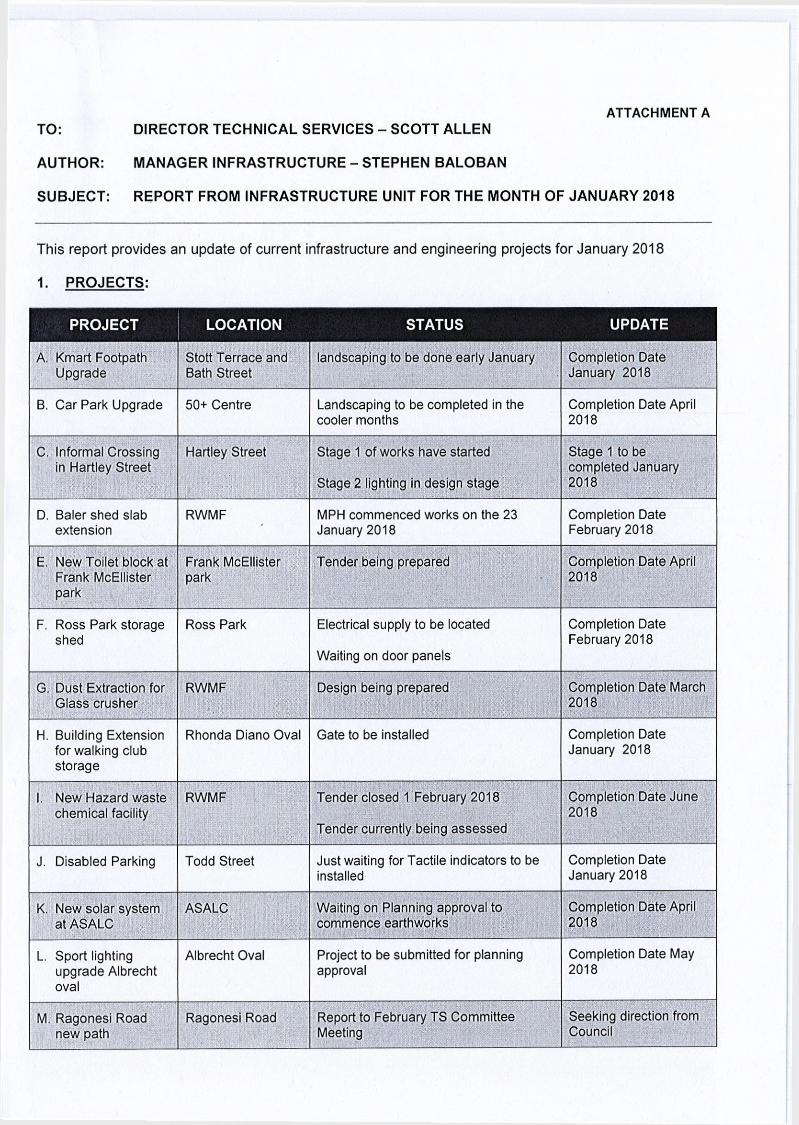
SUBJECT: REPORT FROM INFRASTRUCTURE UNIT FOR THE MONTH OF JANUARY 2018
This report provides an update of current infrastructure and engineering projects for January 2018
1. PROJECTS:
A. Kmart Footpath Upgrade
Stott Terrace and Bath Street
landscaping to be done early January Completion DateJanuary 2018
B. Car Park Upgrade 50+ Centre Landscaping to be completed in the cooler months
Completion Date April 2018
C. Informal Crossing in Hartley Street
Hartley Street Stage 1 of works have started
Stage 2 lighting in design stage
Stage 1 to be completed January2018
D. Baler shed slab extension
RWMF MPH commenced works on the 23 January 2018
Completion DateFebruary 2018
E. New Toilet block at Frank McEllister park
Frank McEllister park
Tender being prepared Completion Date April 2018
F. Ross Park storage shed
Ross Park Electrical supply to be located
Waiting on door panels
Completion DateFebruary 2018
G. Dust Extraction for Glass crusher
RWMF Design being prepared Completion Date March 2018
H. Building Extension for walking club storage
Rhonda Diano Oval Gate to be installed Completion DateJanuary 2018
I. New Hazard waste chemical facility
RWMF Tender closed 1 February 2018
Tender currently being assessed
Completion Date June 2018
J. Disabled Parking Todd Street Just waiting for Tactile indicators to be installed
Completion DateJanuary 2018
K. New solar system at ASALC
ASALC Waiting on Planning approval to commence earthworks
Completion Date April 2018
L. Sport lighting upgrade Albrecht oval
Albrecht Oval Project to be submitted for planning approval
Completion Date May 2018
M. Ragonesi Road new path
Ragonesi Road Report to February TS CommitteeMeeting
Seeking direction from Council

Report No. 9/1 StsAttachment A
Agenda Item. 9.1Page.../2
As-PefcStephen BalobanMANAGER INFRASTRUCTURE
ATTACHMENT B
TO: DIRECTOR TECHNICAL SERVICES - SCOTT ALLEN
AUTHOR: SPORT OFFICER - EMMA KRAFT
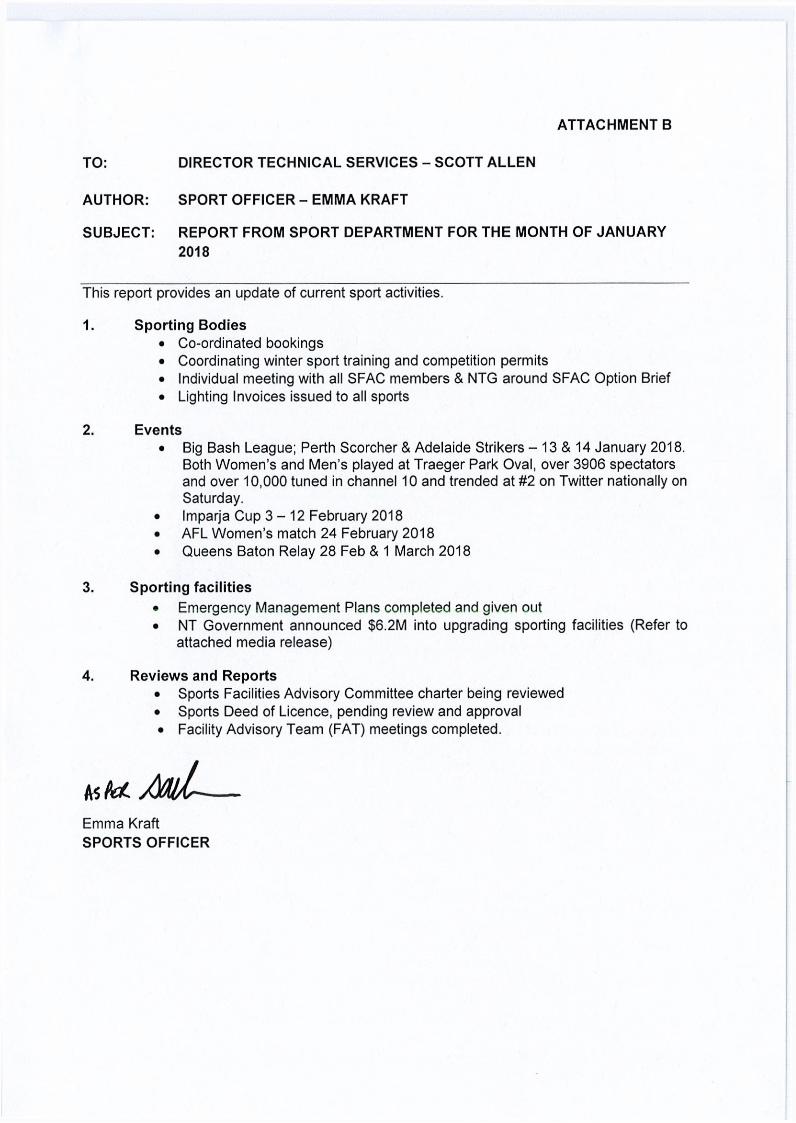
SUBJECT: REPORT FROM SPORT DEPARTMENT FOR THE MONTH OF JANUARY2018
This report provides an update of current sport activities.
1. Sporting Bodies• Co-ordinated bookings• Coordinating winter sport training and competition permits• Individual meeting with all SFAC members & NTG around SFAC Option Brief• Lighting Invoices issued to all sports
2. Events• Big Bash League; Perth Scorcher & Adelaide Strikers - 13 & 14 January 2018.
Both Women’s and Men’s played at Traeger Park Oval, over 3906 spectators and over 10,000 tuned in channel 10 and trended at #2 on Twitter nationally on Saturday.
• Imparja Cup 3-12 February 2018• AFL Women’s match 24 February 2018• Queens Baton Relay 28 Feb & 1 March 2018
3. Sporting facilities• Emergency Management Plans completed and given out• NT Government announced $6.2M into upgrading sporting facilities (Refer to
attached media release)
4. Reviews and Reports• Sports Facilities Advisory Committee charter being reviewed• Sports Deed of Licence, pending review and approval• Facility Advisory Team (FAT) meetings completed.
Emma KraftSPORTS OFFICER
2/2/2018 Media Release | Newsroom
MEDIA RELEASE
DALE WAKEFIELDMEMBER FOR BRAITLING
Dale Wakefield, Member for Braiding
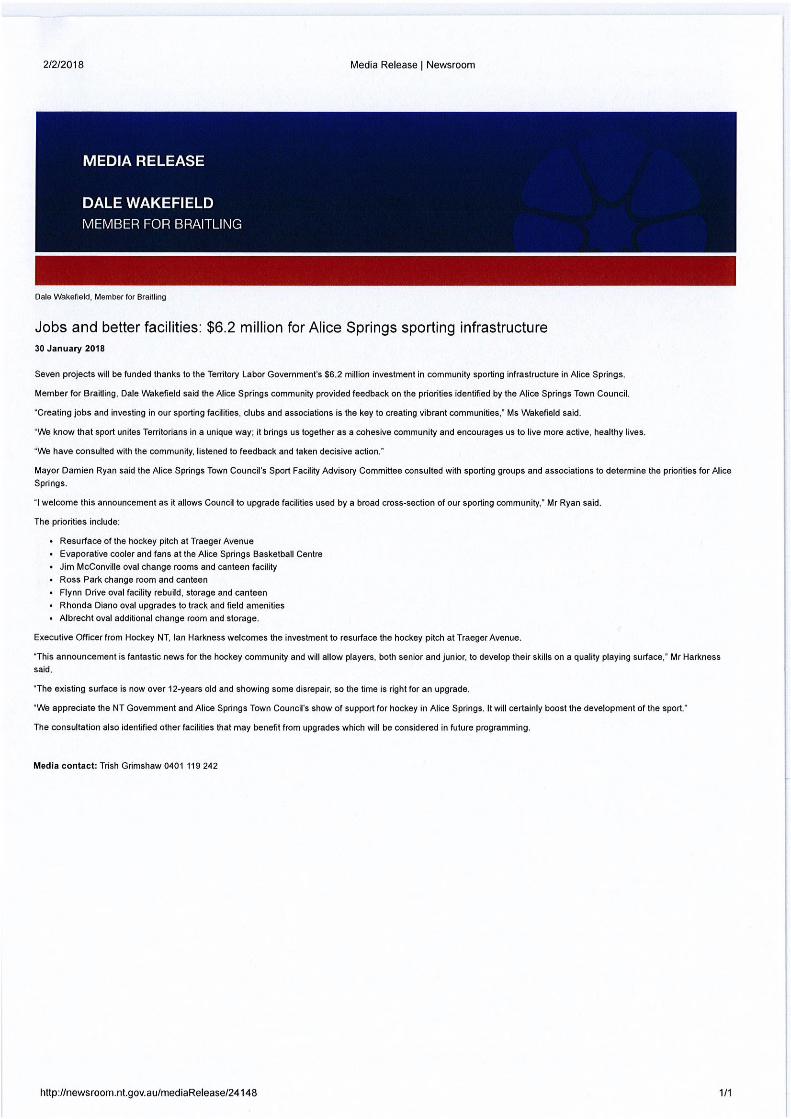
Jobs and better facilities: $6.2 million for Alice Springs sporting infrastructure30 January 2018
Seven projects will be funded thanks to the Territory Labor Government's $6.2 million investment in community sporting infrastructure in Alice Springs.
Member for Braiding, Dale Wakefield said the Alice Springs community provided feedback on the priorities identified by the Alice Springs Town Council.
"Creating jobs and investing in our sporting facilities, clubs and associations is the key to creating vibrant communities," Ms Wakefield said.
"We know that sport unites Territorians in a unique way; it brings us together as a cohesive community and encourages us to live more active, healthy lives.
“We have consulted with the community, listened to feedback and taken decisive action."
Mayor Damien Ryan said the Alice Springs Town Council's Sport Facility Advisory Committee consulted with sporting groups and associations to determine the priorities for Alice Springs.
“I welcome this announcement as it allows Council to upgrade facilities used by a broad cross-section of our sporting community," Mr Ryan said.
The priorities include:
• Resurface of the hockey pitch at Traeger Avenue• Evaporative cooler and fans at the Alice Springs Basketball Centre• Jim McConville oval change rooms and canteen facility• Ross Park change room and canteen• Flynn Drive oval facility rebuild, storage and canteen• Rhonda Diano oval upgrades to track and field amenities• Albrecht oval additional change room and storage.
Executive Officer from Hockey NT, Ian Harkness welcomes the investment to resurface the hockey pitch at Traeger Avenue.
"This announcement is fantastic news for the hockey community and will allow players, both senior and junior, to develop their skills on a quality playing surface," Mr Harkness said.
"The existing surface is now over 12-years old and showing some disrepair, so the time is right for an upgrade.
"We appreciate the NT Government and Alice Springs Town Council's show of support for hockey in Alice Springs. It will certainly boost the development of the sport."
The consultation also identified other facilities that may benefit from upgrades which will be considered in future programming.
Media contact: Trish Grimshaw 0401 119 242
http://newsroom.nt.gov.au/mediaRelease/24148 1/1
ATTACHMENTC
TO: DIRECTOR TECHNICAL SERVICES - SCOTT ALLEN
AUTHOR: MANAGER WORKS - BEN FITZGERALD
SUBJECT: REPORT FROM WORKS DEPARTMENT FOR THE MONTH OF JANUARY 2018
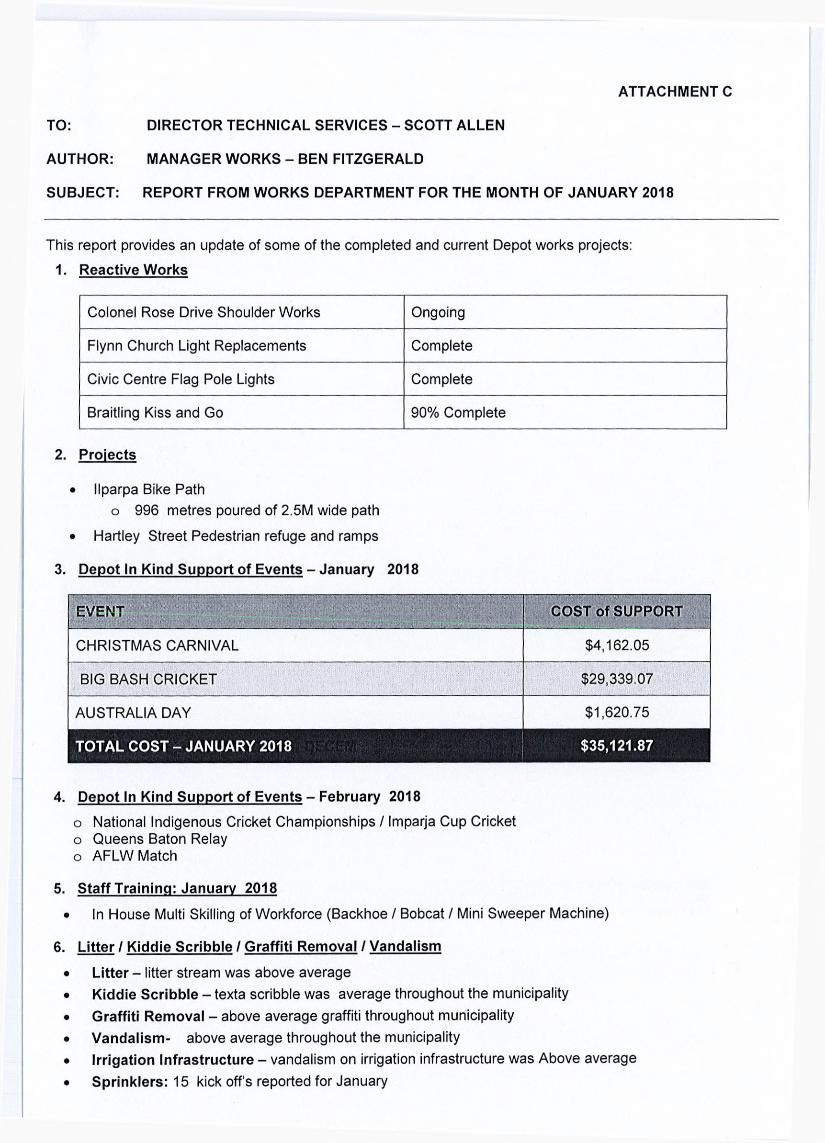
This report provides an update of some of the completed and current Depot works projects:
1. Reactive Works
Colonel Rose Drive Shoulder Works Ongoing
Flynn Church Light Replacements Complete
Civic Centre Flag Pole Lights Complete
Braitling Kiss and Go 90% Complete
2. Projects
• llparpa Bike Patho 996 metres poured of 2.5M wide path
• Hartley Street Pedestrian refuge and ramps
3. Depot In Kind Support of Events - January 2018
EVENT COST of SUPPORT
CHRISTMAS CARNIVAL $4,162.05
BIG BASH CRICKET $29,339.07
AUSTRALIA DAY $1,620.75
4. Depot In Kind Support of Events - February 2018o National Indigenous Cricket Championships / Imparja Cup Cricket o Queens Baton Relay o AFLW Match
5. Staff Training: January 2018
• In House Multi Skilling of Workforce (Backhoe / Bobcat / Mini Sweeper Machine)
6. Litter / Kiddie Scribble / Graffiti Removal / Vandalism
• Litter - litter stream was above average• Kiddie Scribble - texta scribble was average throughout the municipality• Graffiti Removal - above average graffiti throughout municipality• Vandalism- above average throughout the municipality• Irrigation Infrastructure - vandalism on irrigation infrastructure was Above average• Sprinklers: 15 kick off’s reported for January
Report No. 9/1 StsAttachment C
Agenda Item 9.1Page.../2
• Facilities:> Anzac Oval Above average> Traeger average> Jim McConville average> Albrecht Oval average
• Infrastructure: Cemetery fence damaged in various locations
• Playgrounds: Minor vandalism recorded for January
7. Neat Streets
• Notifications - 97 Neat street notifications in January 2018• 66 - ASTC Depot Responsibility (55 Complete)
■ ASTC incomplete Neat Streets• Bath Street (blocked drain)• Undoolya Road (vegetation)• Parson Street (graffiti)• Parson Street (graffiti)• Skate Park (water fountain)• Skate Park (paving under water fountain)• Albrecht Drive (pop up)• Albrecht Drive (pop up)• Palm Circuit Floodway (sign spikes)• Gregory Terrace (surface of road)• Gregory Terrace (surface of road)
• 12 - ASTC Rangers Responsibility• 7 - NTG• 2 - Telstra• 10 - Private Property
8. Vehicle Plant Replacement 2017 / 2018
• 53106 - Hyundai Santa Fe - TBA• Wiedenmann SUPER 600 Scarifier - Completed• Isuzu Wood Chipper Truck - Completed• Kubota front deck mower - Completed• Mini sweeper machine- Tender Lodged closes 28/2/18• Manager Works Vehicle - Completed
Vehicle Added• Isuzu D-Max Crew cab- Delivered 4/10/17
9. Tree Removals - January 2018
A total of 0 trees were removed throughout the municipality for the month of January
10. New Tree Plantings - January 2018
No Trees were planted throughout the municipality for the month of January
Ben FitzgeraldMANAGER WORKS
TO:
SUBJECT:
AUTHOR:
ATTACHMENTDDIRECTOR TECHNICAL SERVICES -SCOTT ALLEN
MANAGER REGIONAL WASTE MANAGEMENT FACILITY - REINIER LAAN
REPORT FOR THE REGIONAL WASTE MANAGEMENT FACILITY FOR THE MONTH OFJANUARY 2018
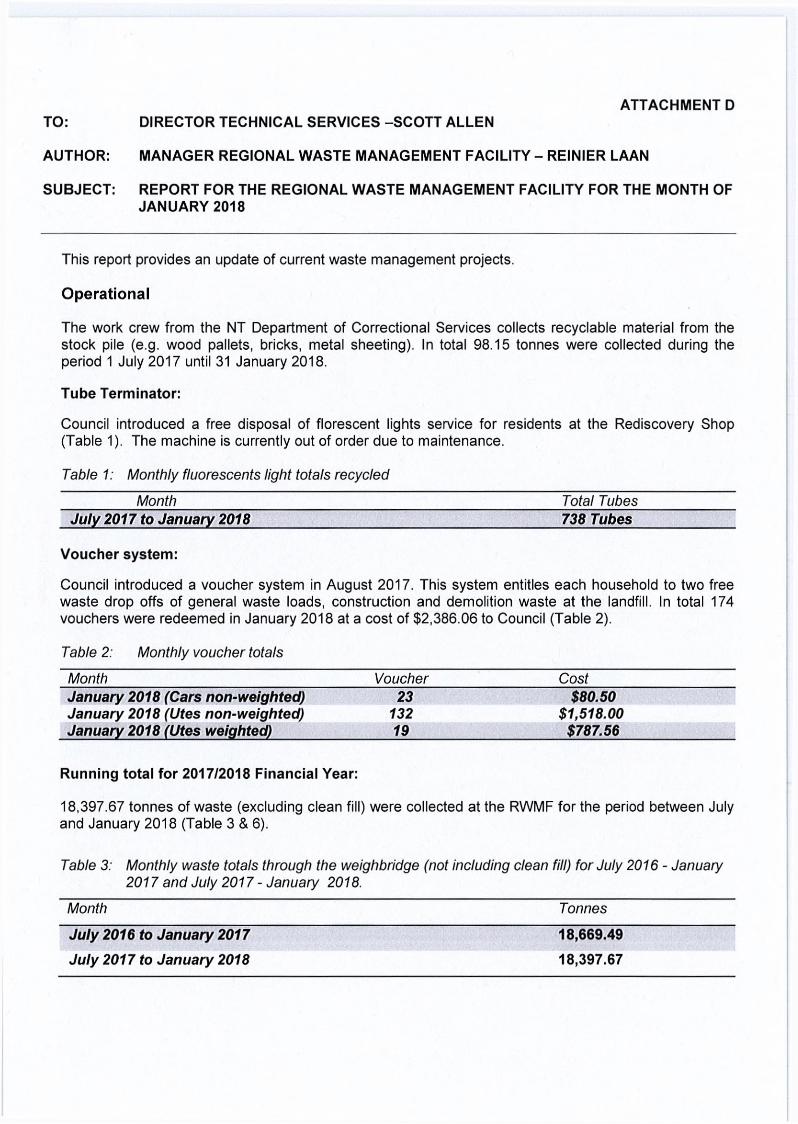
This report provides an update of current waste management projects.
Operational
The work crew from the NT Department of Correctional Services collects recyclable material from the stock pile (e.g. wood pallets, bricks, metal sheeting). In total 98.15 tonnes were collected during the period 1 July 2017 until 31 January 2018.
Tube Terminator:
Council introduced a free disposal of florescent lights service for residents at the Rediscovery Shop (Table 1). The machine is currently out of order due to maintenance.
Table 1: Monthly fluorescents light totals recycled
Month Total TubesJuly 2017 to January 2018 738 Tubes
Voucher system:
Council introduced a voucher system in August 2017. This system entitles each household to two free waste drop offs of general waste loads, construction and demolition waste at the landfill. In total 174 vouchers were redeemed in January 2018 at a cost of $2,386.06 to Council (Table 2).
Table 2: Monthly voucher totals
Month Voucher CostJanuary 2018 (Cars non-weighted) 23 $80.50January 2018 (Utes non-weighted) 132 $1,518.00January 2018 (Utes weighted) 19 $787.56
Running total for 2017/2018 Financial Year:
18,397.67 tonnes of waste (excluding clean fill) were collected at the RWMF for the period between July and January 2018 (Table 3 & 6).
Table 3: Monthly waste totals through the weighbridge (not including clean fill) for July 2016 - January 2017 and July 2017 - January 2018.
Month Tonnes
July 2016 to January 2017 18,669.49
July 2017 to January 2018 18,397.67

Report No. 9/1 StsAttachment D
Agenda Item 9.1Page.../2
Table 4: Monthly recycling totals through the weighbridge for July 2016 January 2018.(see also Table 4,5 and Figure 2)
- January 2017 and July 2017 -
Month Tonnes
July 2016 to January 2017 5,251.69July 2017 to January 2018 831.20
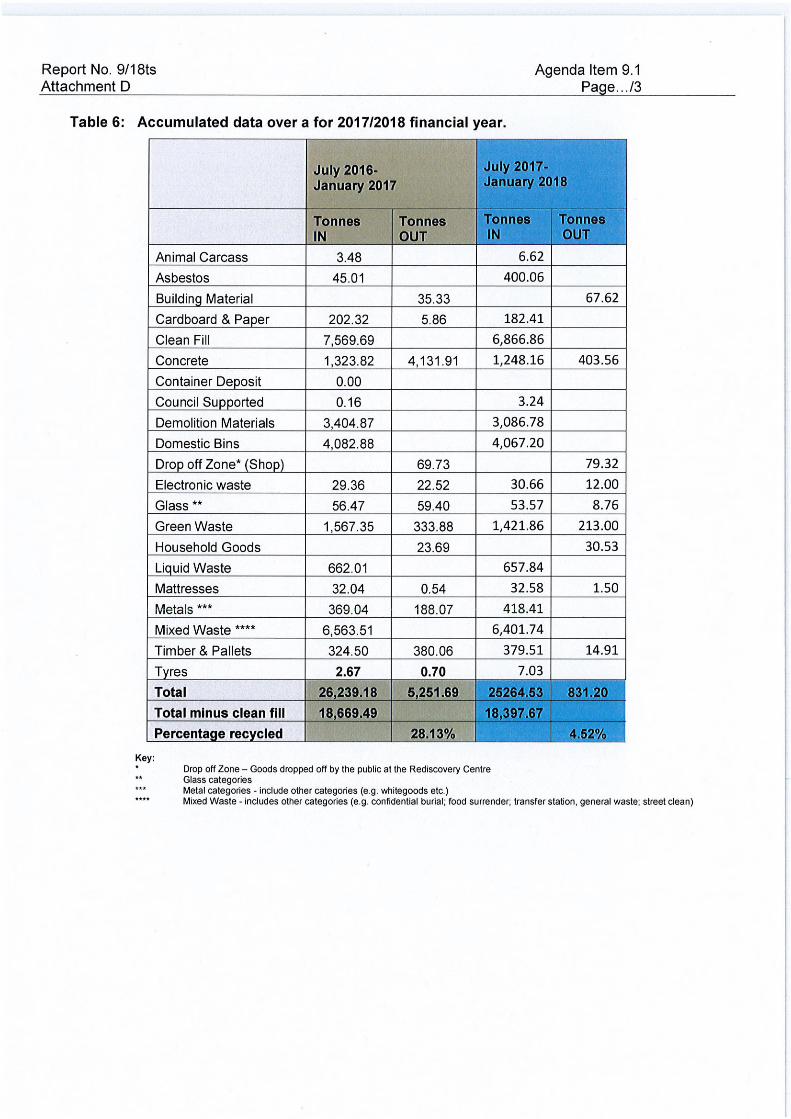
A figure of 4.52% of the total waste for the period between July and January 2018 was recycled. The recycled total for 2017 was higher than 2018, due to crushed concrete being used in large road projects (Table 5). 2000 tons of crushed concrete is available in stock.
Table 5: Breakdown of items through the weighbridge on a month by month basis for 2017 and 2018
Jan-17 Jan-18Tonnes
INTonnes
OUTTonnes
INTonnes
OUTAnimal Carcass 0.35 0.62Asbestos 3.78 11.12Building Material 0.63 14.7Cardboard & Paper 28.58 14.74Clean Fill 675.64 408.77Concrete 133.45 183.11 300Container DepositCouncil SupportedDemolition Materials 448.27 283.85Domestic Bins 640.86 595.32Drop off Zone* (Shop) 8.67 8.42Electronic waste 6.20 12.52 2.52Glass ** 15.74 1.66Green Waste 128.50 10.20 151.17 39.6Household Goods 2.89 1.32Liquid Waste 78.36 79.06Mattresses 3.45 3.93 0.18Metals *** 36.76 56.08Mixed Waste **** 937.04 943.23Timber & Pallets 47.42 63.37 2.34Tyres 0.21 0.41Total 3184.612 34.91 2798.96 366.56Total minus clean fill 2,508.97 2390.19Percentage recycled 1.39% 15.34%
Key:* Drop off Zone - Goods dropped off by the public at the Rediscovery Centre
Glass categoriesMetal categories - include other categories (e.g. whitegoods etc.)Mixed Waste - includes other categories (e.g. confidential burial; food surrender; transfer station, general waste; street clean)
Report No. 9/1 StsAttachment D
Agenda Item 9.1Page.../3
Table 6: Accumulated data over a for 2017/2018 financial year.
July 2016- January 2017
July 2017- January 2018
TonnesIN
TonnesOUT
TonnesIN
TonnesOUT
Animal Carcass 3.48 6.62Asbestos 45.01 400.06Building Material 35.33 67.62Cardboard & Paper 202.32 5.86 182.41Clean Fill 7,569.69 6,866.86Concrete 1,323.82 4,131.91 1,248.16 403.56Container Deposit 0.00Council Supported 0.16 3.24Demolition Materials 3,404.87 3,086.78Domestic Bins 4,082.88 4,067.20Drop off Zone* (Shop) 69.73 79.32Electronic waste 29.36 22.52 30.66 12.00Glass ** 56.47 59.40 53.57 8.76Green Waste 1,567.35 333.88 1,421.86 213.00Household Goods 23.69 30.53Liquid Waste 662.01 657.84Mattresses 32.04 0.54 32.58 1.50Metals *** 369.04 188.07 418.41Mixed Waste **** 6,563.51 6,401.74Timber & Pallets 324.50 380.06 379.51 14.91Tyres 2.67 0.70 7.03Total 26,239.18 5,251.69 25264.53 831.20Total minus clean fill 18,669.49 18,397.67Percentage recycled 28.13% 4.52%
Drop off Zone - Goods dropped off by the public at the Rediscovery Centre Glass categoriesMetal categories - include other categories (e g. whitegoods etc.)Mixed Waste - includes other categories (e.g. confidential burial; food surrender; transfer station, general waste; street clean)
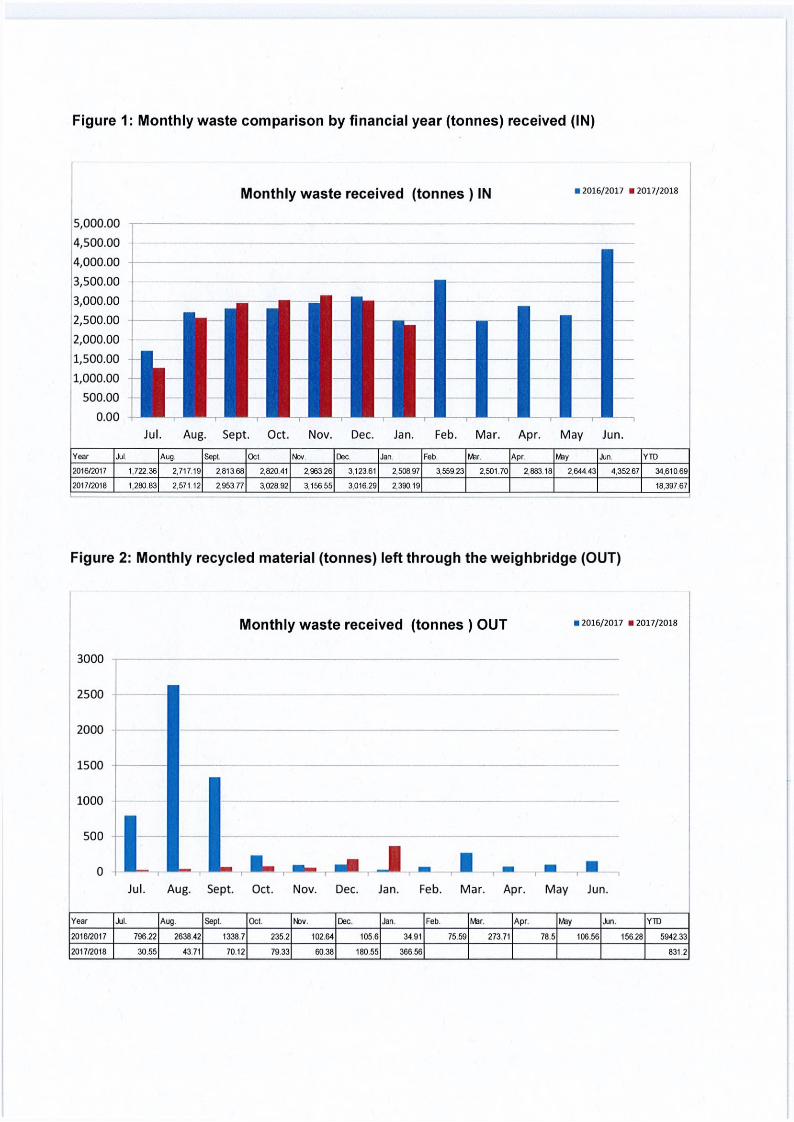
Figure 1: Monthly waste comparison by financial year (tonnes) received (IN)
Monthly waste received (tonnes ) IN *2016/2017 *2017/2018
5.000. 00
4.500.004.000. 00
3.500.003.000. 00
2.500.002.000. 00
1.500.001,000.00
500.00
Jul. Aug. Sept. Oct. Nov. Dec. Jan. Feb. Mar. Apr. May Jun.
Year Jul Aug Sept Oct Nov. Dec Jan Feb. Mar. Apr. M3y Jun. YTD
2016/2017 1,722.36 2,717.19 2,813.68 2,820.41 2,963.26 3,123.61 2,50897 3,55923 2,501.70 2,883.18 2,644.43 4,352.67 34,61069
2017/2018 1,280 83 2,571.12 2,953.77 3,028.92 3,156.55 3,01629 2,39019 18,397.67
Figure 2: Monthly recycled material (tonnes) left through the weighbridge (OUT)
Monthly waste received (tonnes ) OUT *2016/2017 *2017/2018
3000
2500
2000
1500
Jul. Aug. Sept. Oct. Nov. Dec. Jan. Feb. Mar. Apr. May Jun.
Year Jul. Aug. Sept. Oct. Nav. Dec. Jan. Feb. Mar. Apr. May Jun. YTD
2016/2017 796.22 2638.42 1338.7 235.2 102.64 105.6 34.91 75.59 273.71 78.5 106.56 156.28 5942.33
2017/2018 30.55 43.71 70.12 79.33 60.38 180.55 366.56 831.2
Report No. 9/1 StsAttachment D
Agenda Item 9.1Page.../5
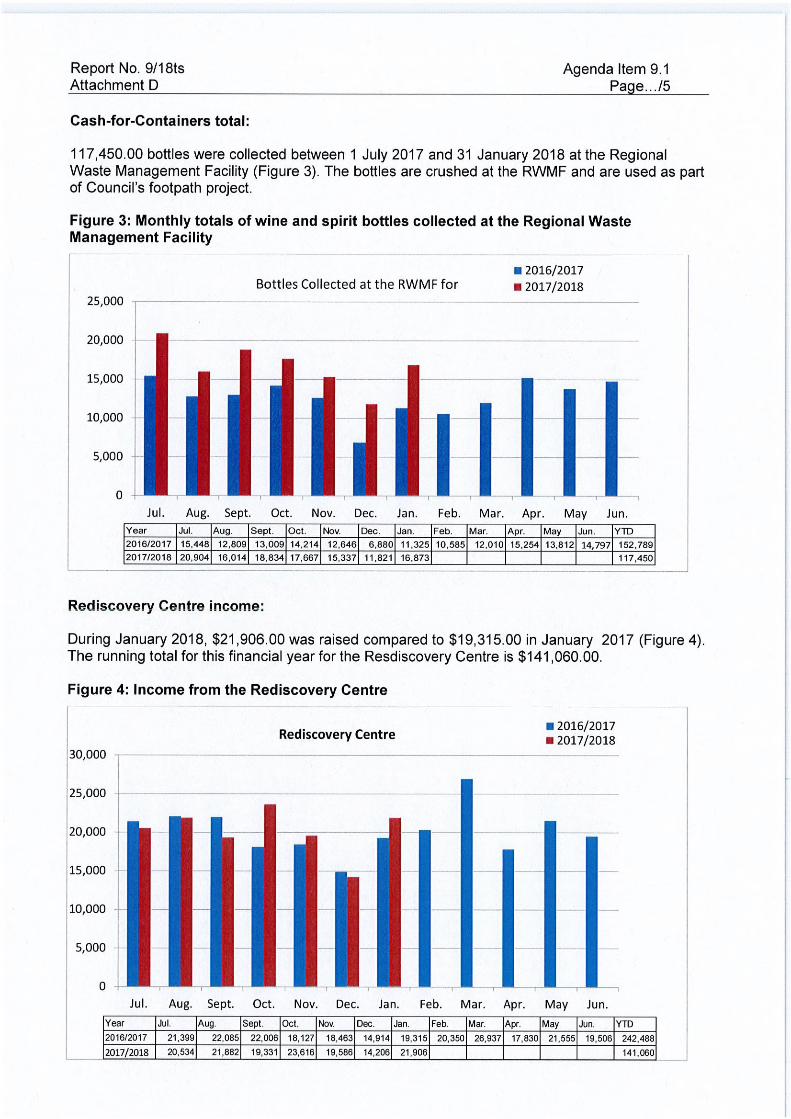
Cash-for-Containers total:
117,450.00 bottles were collected between 1 July 2017 and 31 January 2018 at the Regional Waste Management Facility (Figure 3). The bottles are crushed at the RWMF and are used as part of Council’s footpath project.
Figure 3: Monthly totals of wine and spirit bottles collected at the Regional Waste Management Facility
■ 2016/2017Bottles Collected at the RWMF for ■ 2017/2018
25.000
20.000
15.000
10.000
5,000
0Jul. Aug. Sept. Oct. Nov. Dec. Jan. Feb. Mar. Apr. May Jun.
Year Jul. Aug. Sept. Oct. Nov. Dec. Jan. Feb. Mar. Apr. May Jun. YTD2016/2017 15.448 12,809 13,009 14,214 12,646 6,880 11,325 10,585 12,010 15,254 13,812 14,797 152,7892017/2018 20,904 16,014 18,834 17,667 15,337 11,821 16,873 117,450
Rediscovery Centre income:
During January 2018, $21,906.00 was raised compared to $19,315.00 in January 2017 (Figure 4). The running total for this financial year for the Resdiscovery Centre is $141,060.00.
Figure 4: Income from the Rediscovery Centre
30,000
Rediscovery Centre2016/20172017/2018
4-^"
Jul. Aug. Sept. Oct. Nov Dec Jan. Feb. K/lar. Apr. May Jun.Year Jul. Aug. Sept. Oct. Nov. Dec. Jan. Feb. Mar. Apr. May Jun. YTD2016/2017 21,399 22,085 22,006 18,127 18,463 14,914 19,315 20,350 26,937 17,830 21,555 19,506 242,488
2017/2018 20,534 21,882 19,331 23,616 19,586 14,206 21,906 141,060
Report No. 9/1 StsAttachment D
Agenda Item 9.1Page.../6
Items in the Rediscovery Centre are recorded by three different streams:1. Building materials; salvaged from landfill2. Drop-off zone items; include anything dropped off at the Rediscovery Centre3. Household goods; salvaged from landfill
For the period 1 July 2017 up to 31 January 2018, the total stock intake at the Rediscovery Centrewas 177.47 tonnes.
Third grade stock (low grade) of 72.09 tonnes was subsequently returned to the landfill. The finalweight of second-hand goods recycled through the Rediscovery Centre, was 105.38 tonnes for theperiod 1 July 2017 upto 31 January 2018.
Waste News and Other Events:
• Free disposal of computers and televisions is available to the public on the first Saturday of every month through the National Television and Computer Stewardship Program. The next e- waste free drop off day will be Saturday, 3rd March 2018. These items are not processed by the RWMF, but collected and processed by TechCollect.
Reinier LaanMANAGER REGIONAL WASTE MANAGEMENT FACILITY
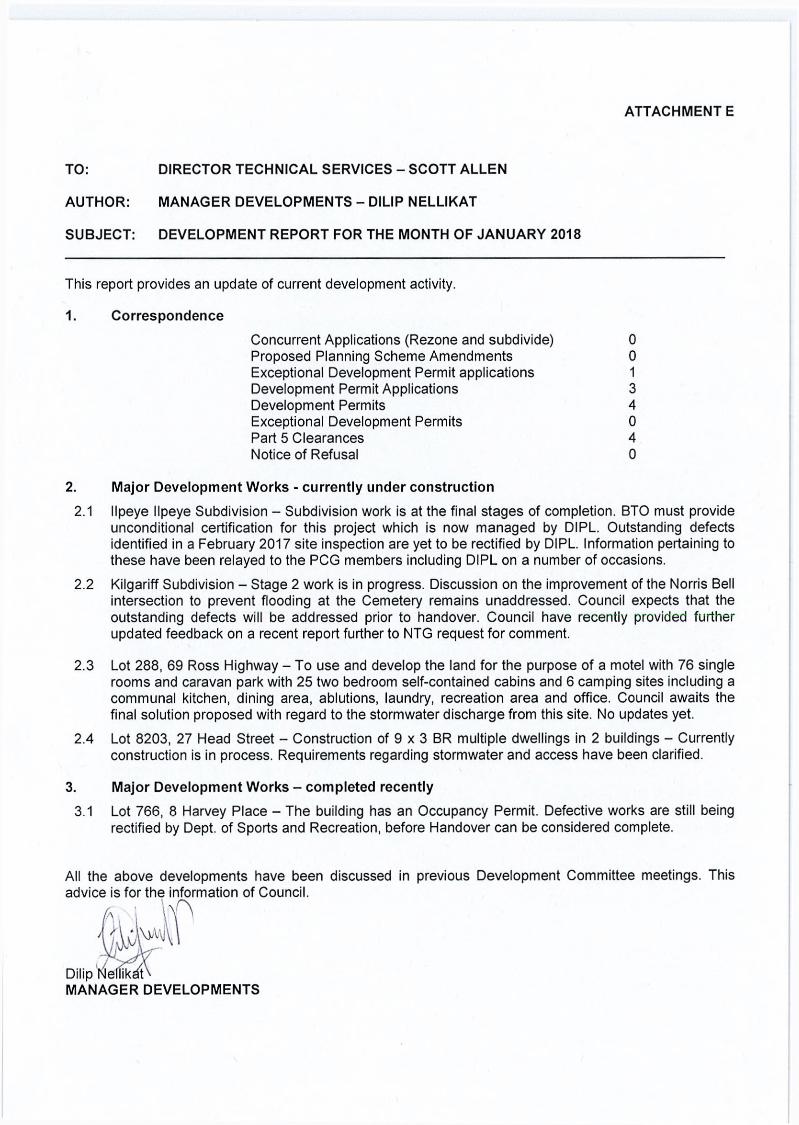
ATTACHMENT E
TO: DIRECTOR TECHNICAL SERVICES - SCOTT ALLEN
AUTHOR: MANAGER DEVELOPMENTS - DILIP NELLIKAT
SUBJECT: DEVELOPMENT REPORT FOR THE MONTH OF JANUARY 2018
This report provides an update of current development activity.
1. CorrespondenceConcurrent Applications (Rezone and subdivide) 0Proposed Planning Scheme Amendments 0Exceptional Development Permit applications 1Development Permit Applications 3Development Permits 4Exceptional Development Permits 0Part 5 Clearances 4Notice of Refusal 0
2. Major Development Works - currently under construction2.1 llpeye llpeye Subdivision - Subdivision work is at the final stages of completion. BTO must provide
unconditional certification for this project which is now managed by DIPL. Outstanding defects identified in a February 2017 site inspection are yet to be rectified by DIPL. Information pertaining to these have been relayed to the PCG members including DIPL on a number of occasions.
2.2 Kilgariff Subdivision - Stage 2 work is in progress. Discussion on the improvement of the Norris Bell intersection to prevent flooding at the Cemetery remains unaddressed. Council expects that the outstanding defects will be addressed prior to handover. Council have recently provided further updated feedback on a recent report further to NTG request for comment.
2.3 Lot 288, 69 Ross Highway - To use and develop the land for the purpose of a motel with 76 single rooms and caravan park with 25 two bedroom self-contained cabins and 6 camping sites including a communal kitchen, dining area, ablutions, laundry, recreation area and office. Council awaits the final solution proposed with regard to the stormwater discharge from this site. No updates yet.
2.4 Lot 8203, 27 Head Street - Construction of 9 x 3 BR multiple dwellings in 2 buildings - Currently construction is in process. Requirements regarding stormwater and access have been clarified.
3. Major Development Works - completed recently3.1 Lot 766, 8 Harvey Place - The building has an Occupancy Permit. Defective works are still being
rectified by Dept, of Sports and Recreation, before Handover can be considered complete.
All the above developments have been discussed in previous Development Committee meetings. This advice is for the information of Council.
MANAGER DEVELOPMENTS
TO:
AUTHOR:
SUBJECT:
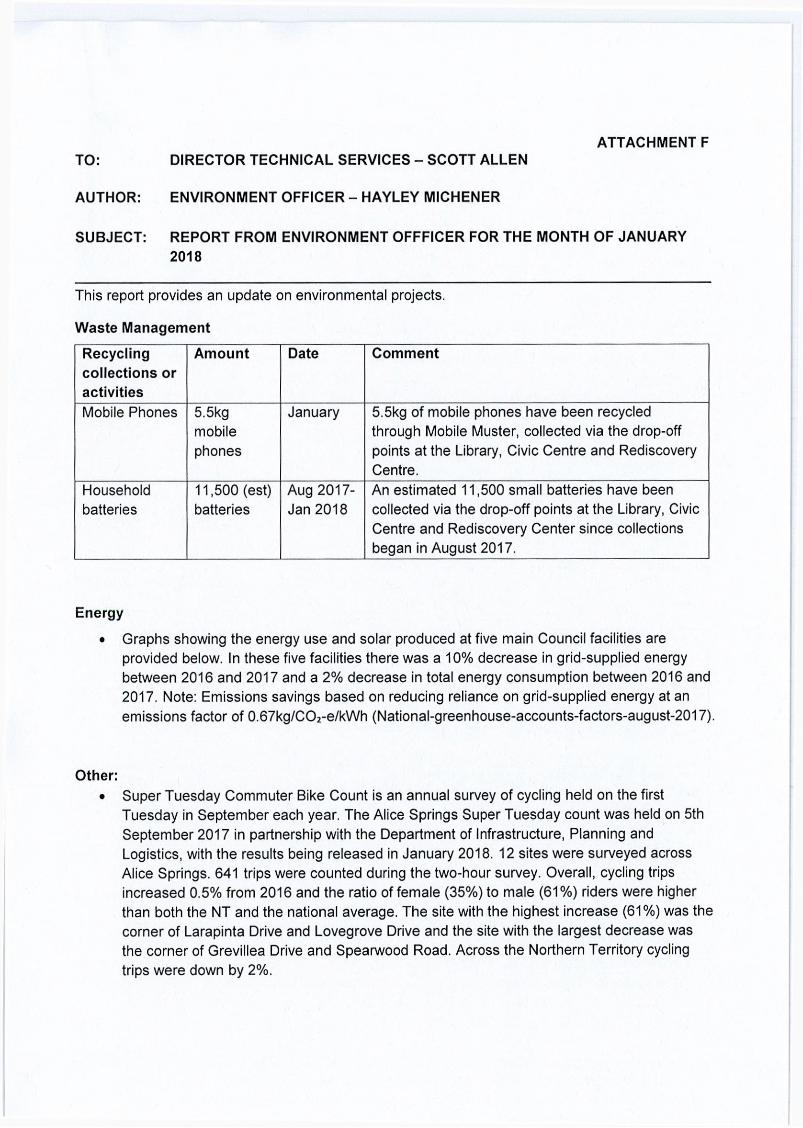
ATTACHMENT FDIRECTOR TECHNICAL SERVICES - SCOTT ALLEN
ENVIRONMENT OFFICER - HAYLEY MICHENER
REPORT FROM ENVIRONMENT OFFFICER FOR THE MONTH OF JANUARY 2018
This report provides an update on environmental projects.
Waste Management
Recycling collections oractivities
Amount Date Comment
Mobile Phones 5.5kgmobilephones
January 5.5kg of mobile phones have been recycled through Mobile Muster, collected via the drop-off points at the Library, Civic Centre and Rediscovery Centre.
Householdbatteries
11,500 (est) batteries
Aug 2017- Jan 2018
An estimated 11,500 small batteries have been collected via the drop-off points at the Library, Civic Centre and Rediscovery Center since collections began in August 2017.
Energy
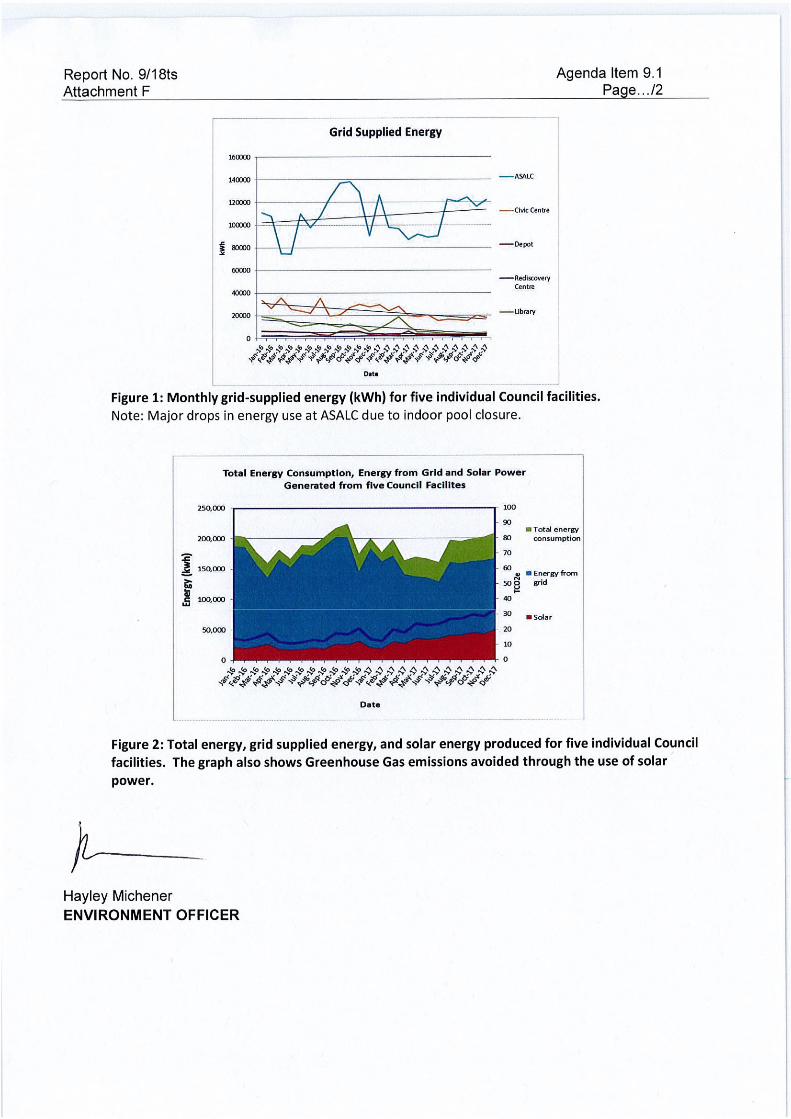
• Graphs showing the energy use and solar produced at five main Council facilities are provided below. In these five facilities there was a 10% decrease in grid-supplied energy between 2016 and 2017 and a 2% decrease in total energy consumption between 2016 and 2017. Note: Emissions savings based on reducing reliance on grid-supplied energy at an emissions factor of 0.67kg/CO2-e/kWh (National-greenhouse-accounts-factors-august-2017).
Other:• Super Tuesday Commuter Bike Count is an annual survey of cycling held on the first
Tuesday in September each year. The Alice Springs Super Tuesday count was held on 5th September 2017 in partnership with the Department of Infrastructure, Planning and Logistics, with the results being released in January 2018. 12 sites were surveyed across Alice Springs. 641 trips were counted during the two-hour survey. Overall, cycling trips increased 0.5% from 2016 and the ratio of female (35%) to male (61%) riders were higher than both the NT and the national average. The site with the highest increase (61%) was the corner of Larapinta Drive and Lovegrove Drive and the site with the largest decrease was the corner of Grevillea Drive and Spearwood Road. Across the Northern Territory cycling trips were down by 2%.
Report No. 9/1 StsAttachment F
Agenda Item 9.1Page.../2
Grid Supplied Energy
140000
120000
100000
$ 80000
60000
40000
20000
S? y y,y ,s? y.y S’ S’,S’s’, S’ y > >,> > >>,vVV' nW°V
------ ASALC
------Civic Centre
------ Rediscovery
Date
Figure 1: Monthly grid-supplied energy (kWh) for five individual Council facilities.Note: Major drops in energy use at ASALC due to indoor pool closure.
Total Energy Consumption, Energy from Grid and Solar Power Generated from five Council Faciiites
Date
Figure 2: Total energy, grid supplied energy, and solar energy produced for five individual Council facilities. The graph also shows Greenhouse Gas emissions avoided through the use of solar power.
Hayley MichenerENVIRONMENT OFFICER