Embed Size (px)
Citation preview

To shortcut a third rail issue
Christer Sanne
http:/goto.glocalnet.net/christersanne/
Paris, April 18 2008
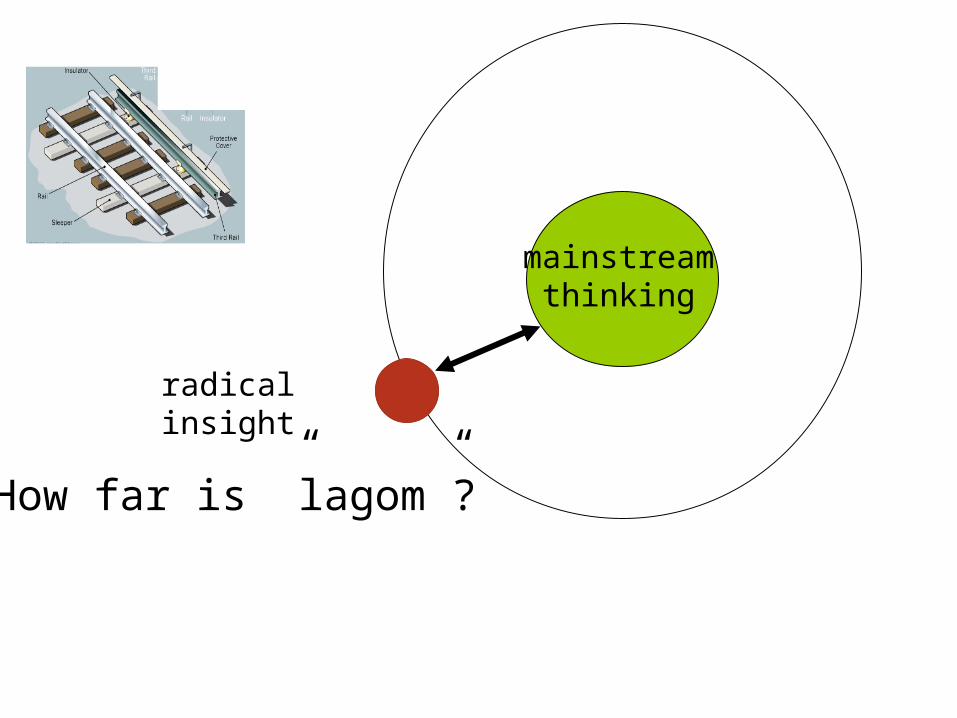
radical insight
mainstreamthinking
How far is ”lagom”?
Growth = ∆ GDP = ∆ productivity * ∆ labour volume
”Degrowth” = ? * ?
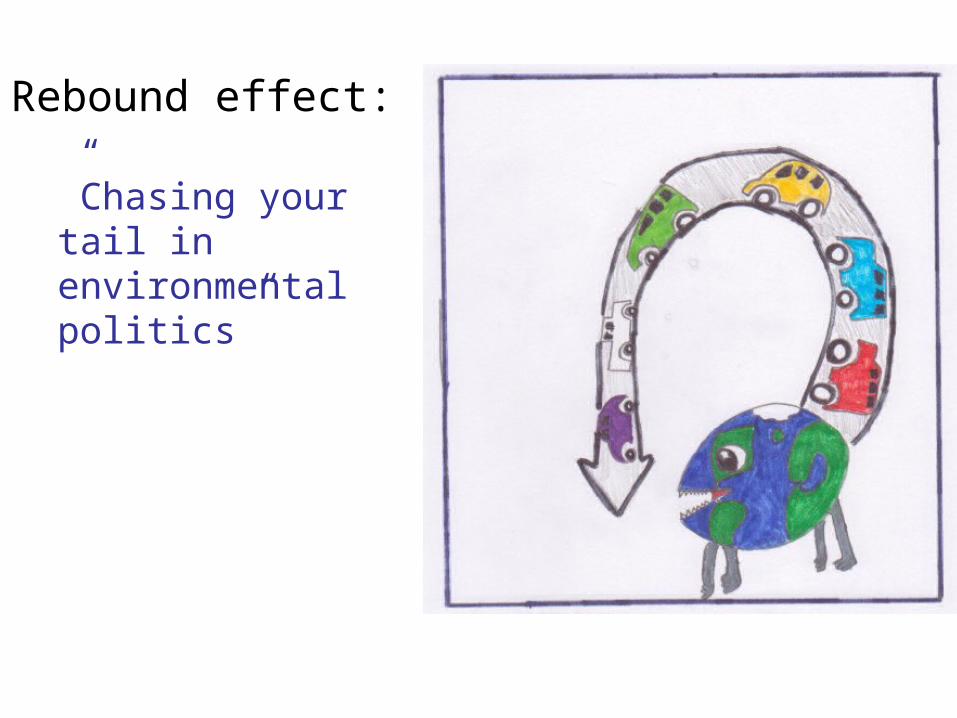
”Chasing your tail in environmental politics”
Rebound effect:
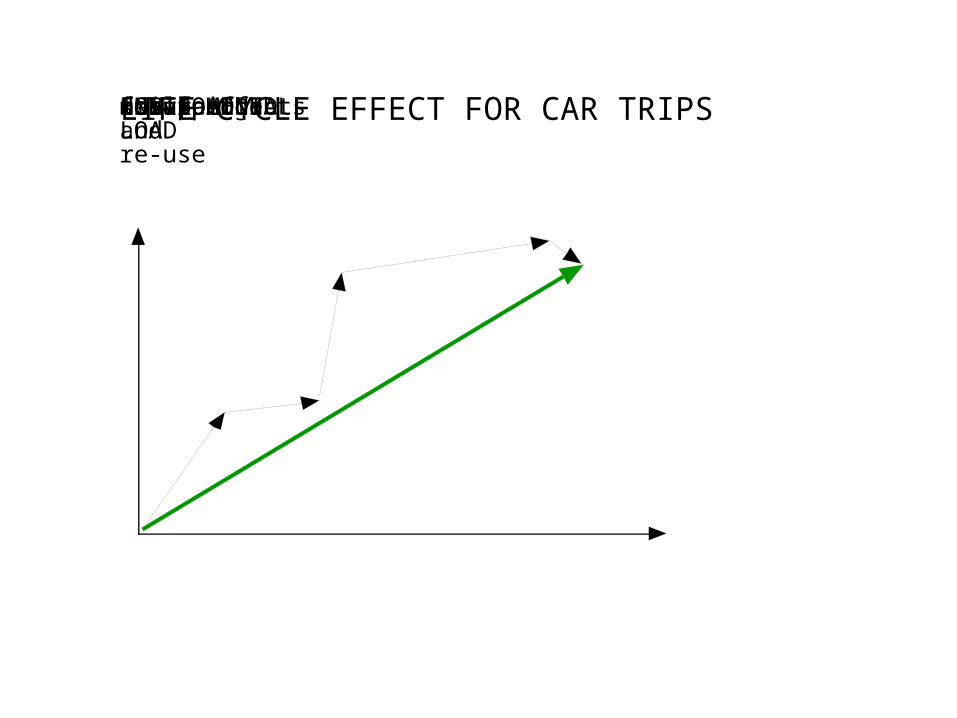
COSTS ADDEDmanufacturedrivinginsurancescrapping and re-use
total effectsLIFE CYCLE EFFECT FOR CAR TRIPSfuel productionENVIROMENTAL LOAD
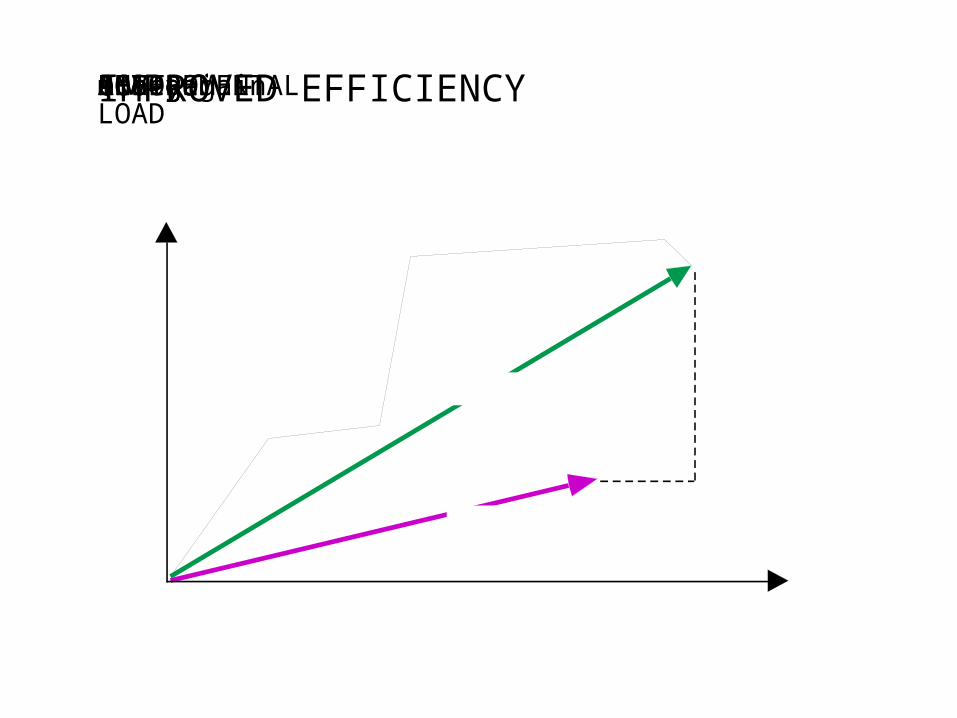
AFTER eco-gainmoney gainENVIROMENTAL LOADCOSTBEFORE IMPROVED EFFICIENCYeco-gaineco-gain
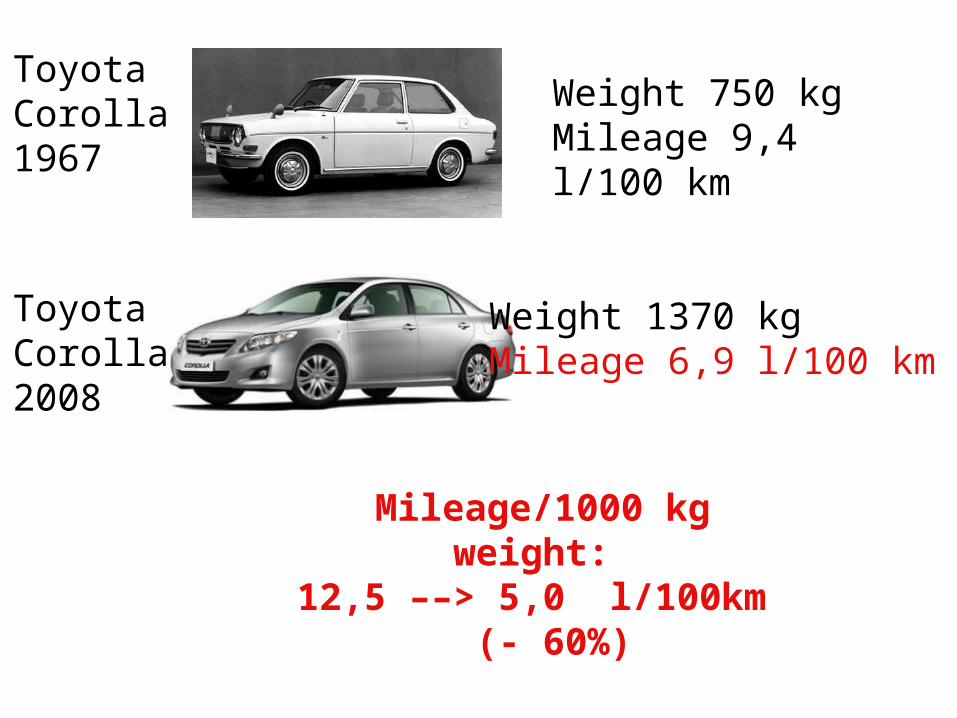
Weight 750 kgMileage 9,4 l/100 km
Weight 1370 kgMileage 6,9 l/100 km
Mileage/1000 kg weight: 12,5 ––> 5,0 l/100km (- 60%)
Toyota Corolla1967
Toyota Corolla2008
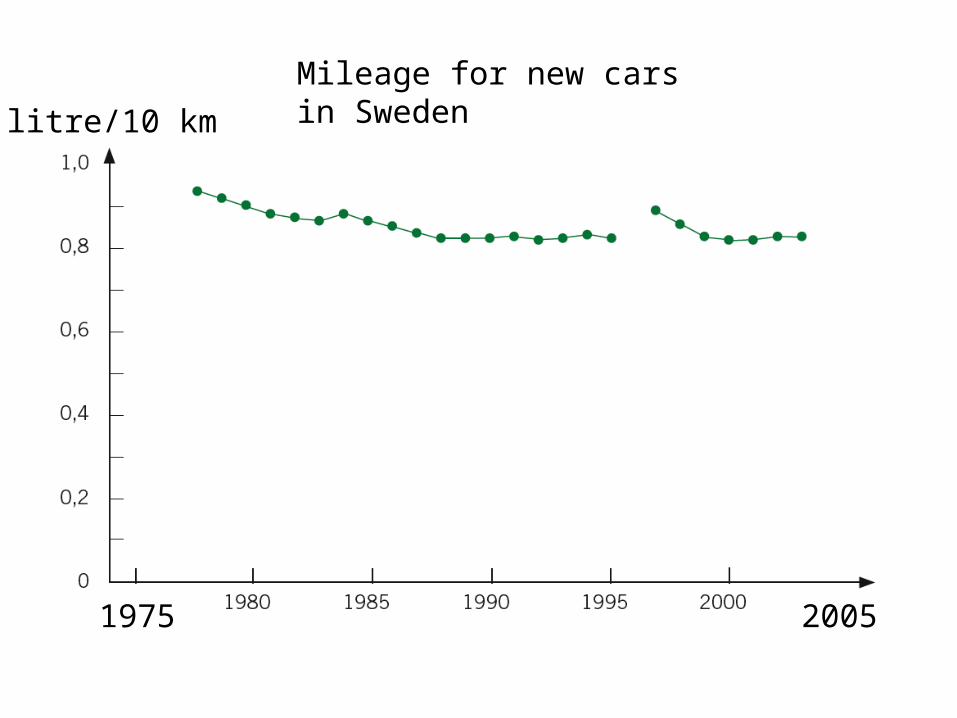
Mileage for new cars in Sweden
litre/10 km
1975 2005
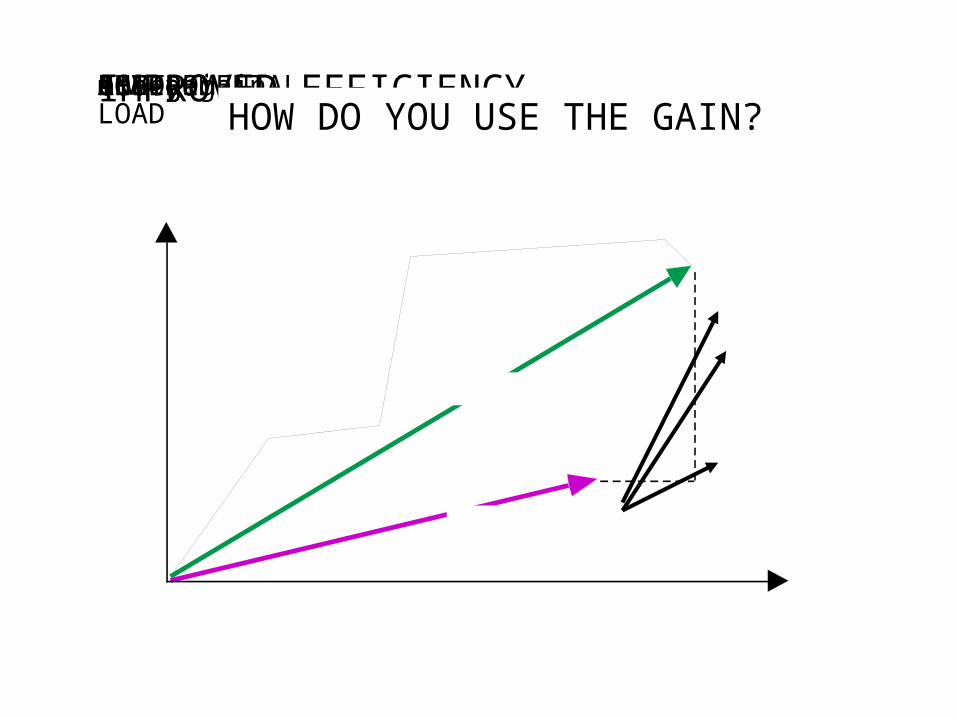
AFTER eco-gainmoney gainENVIROMENTAL LOADCOSTBEFORE IMPROVED EFFICIENCYeco-gaineco-gain
HOW DO YOU USE THE GAIN?
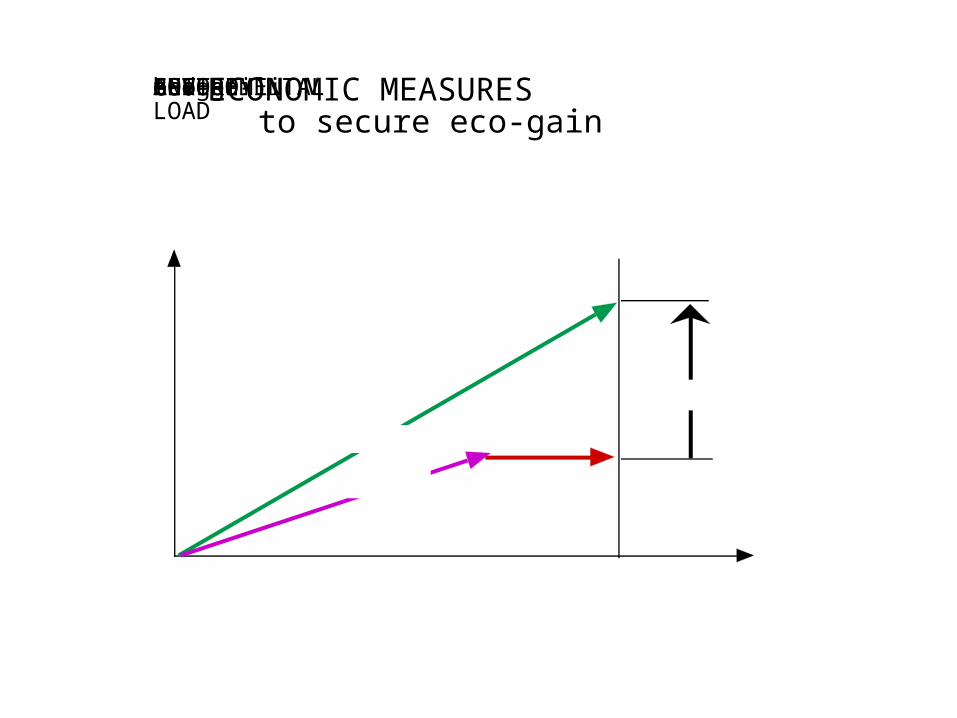
taxbudget-lineCOSTECONOMIC MEASURESto secure eco-gain
eco-gainENVIROMENTAL LOADAFTER BEFORE eco-gain
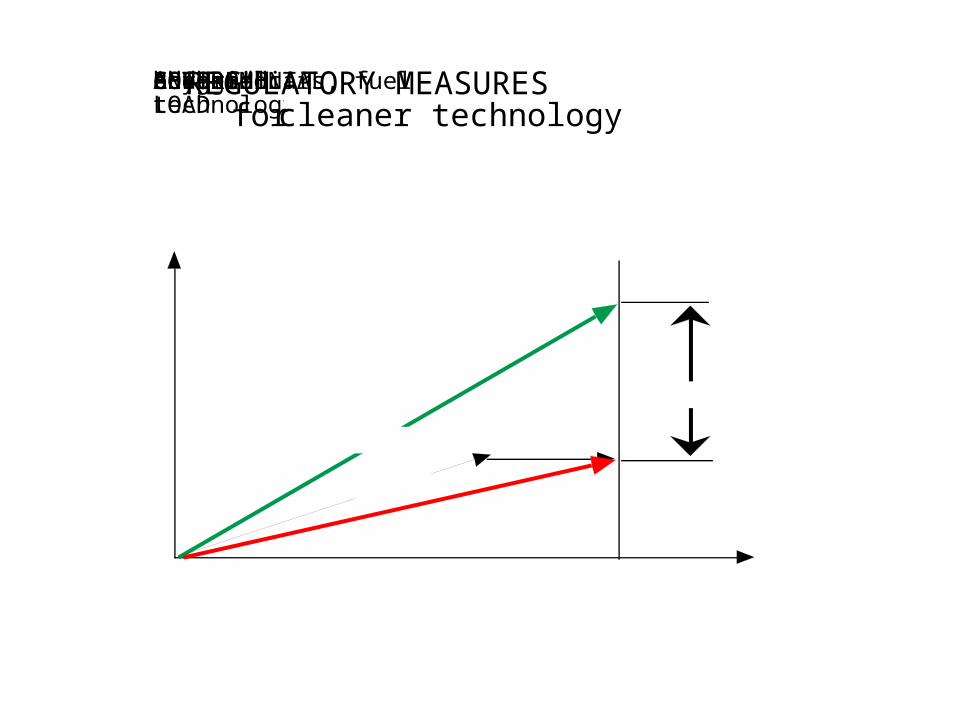
advanced technology*
REGULATORY MEASURESfor cleaner technology
ENVIROMENTAL LOADAFTER BEFORE COSTeco-gainbudget-line*hybrid cars, fuel cells etc
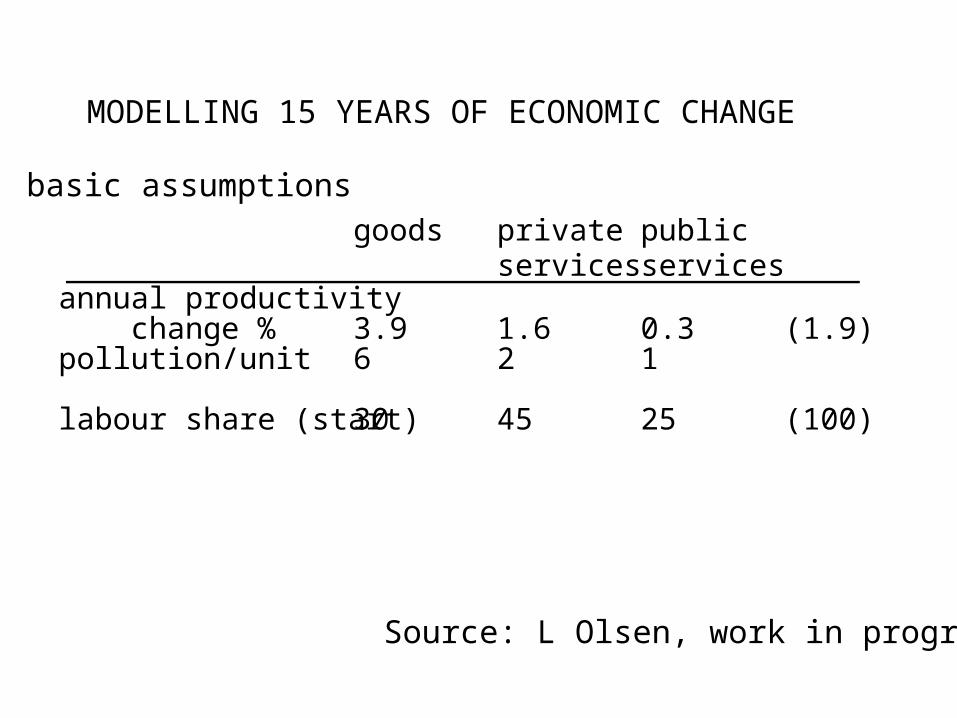
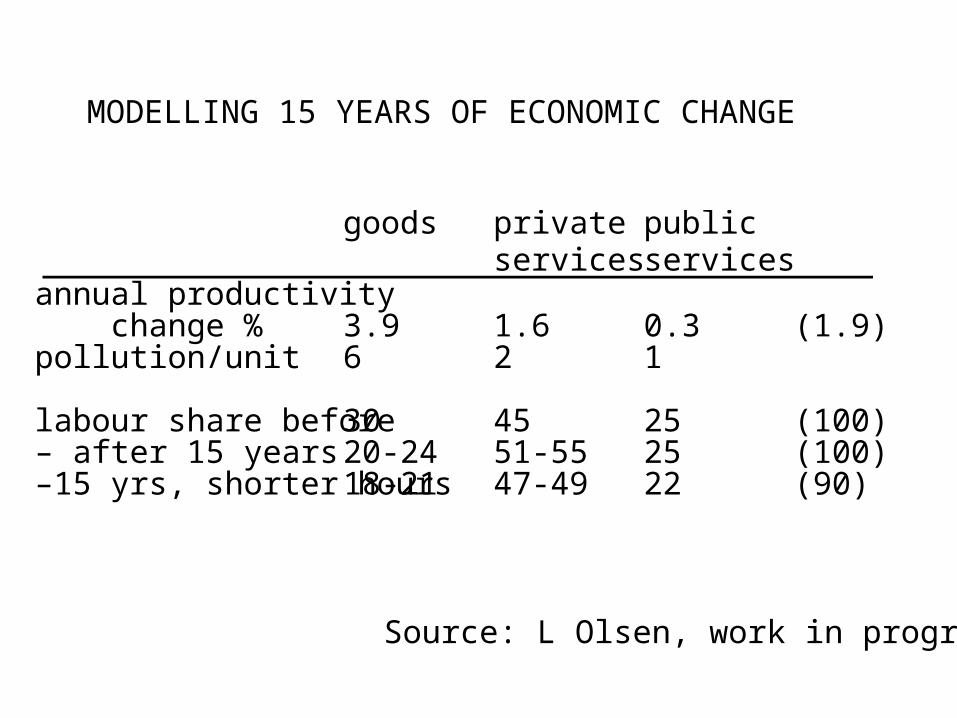
MODELLING 15 YEARS OF ECONOMIC CHANGE
Source: L Olsen, work in progress
goods private publicservices services
annual productivity change % 3.9 1.6 0.3 (1.9)pollution/unit 6 2 1
labour share (start) 30 45 25 (100)
basic assumptions
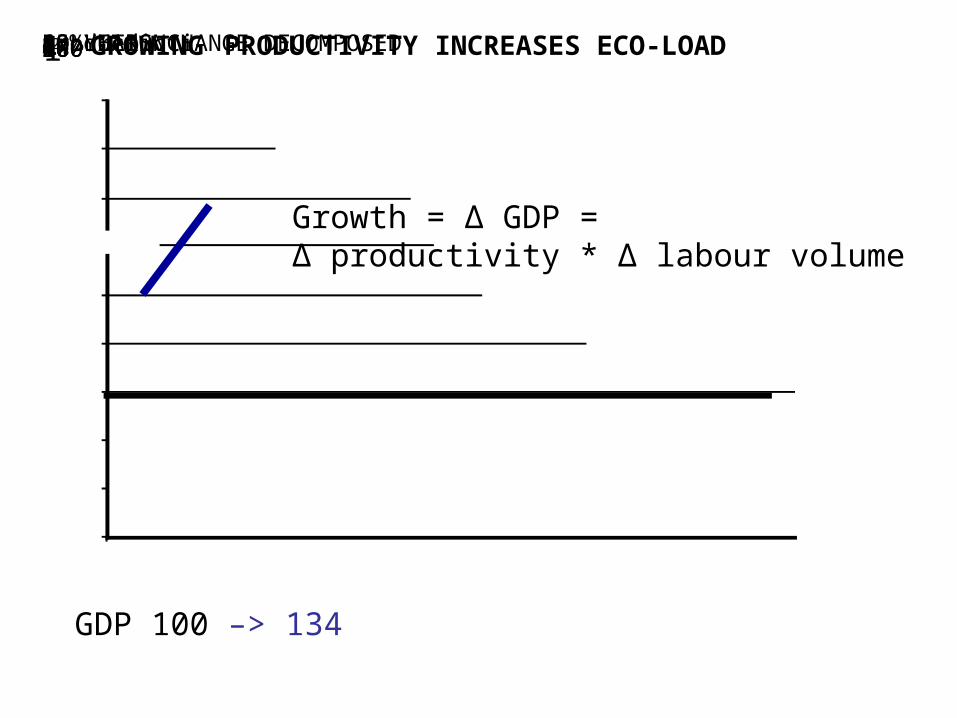
020406010012016040% reductionproductivity1. GROWING PRODUCTIVITY INCREASES ECO-LOAD15 YEARS CHANGE DECOMPOSEDPOLLUTION1
Growth = ∆ GDP = ∆ productivity * ∆ labour volume
GDP 100 –> 134
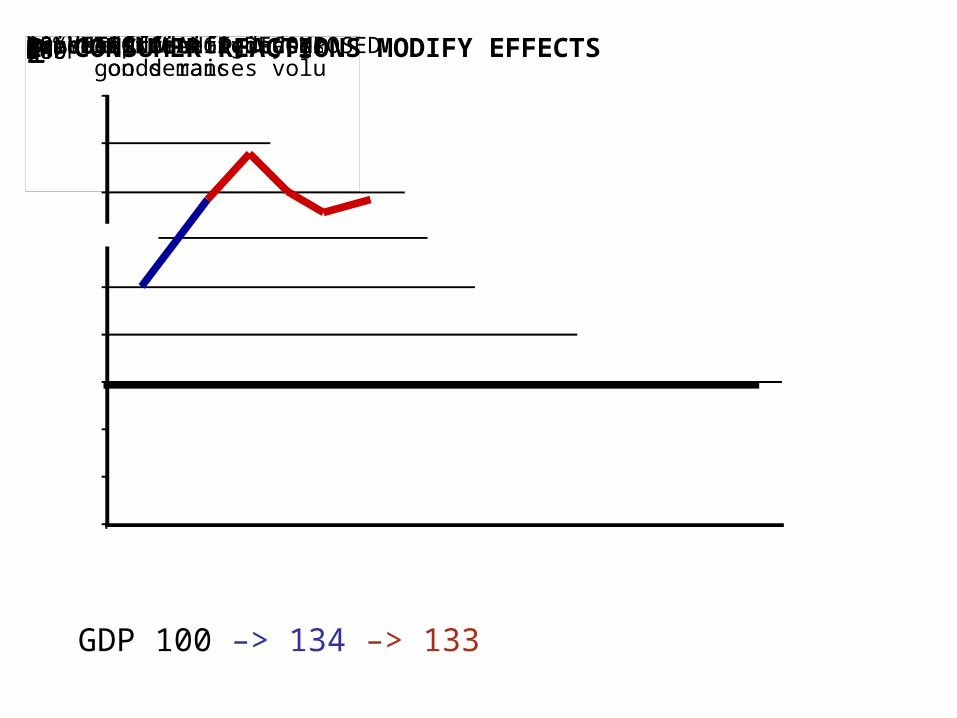
1200204060100160composition effectson demand
40% reductionproductivity2. CONSUMER REACTIONS MODIFY EFFECTS15 YEARS CHANGE DECOMPOSED12POLLUTIONPOLLUTIONhigher productivity growth for goods raises volumesincome effect reduces goodsprice effect increases goodsconstant ratio goods/services
GDP 100 –> 134 –> 133
120composition effectson demand
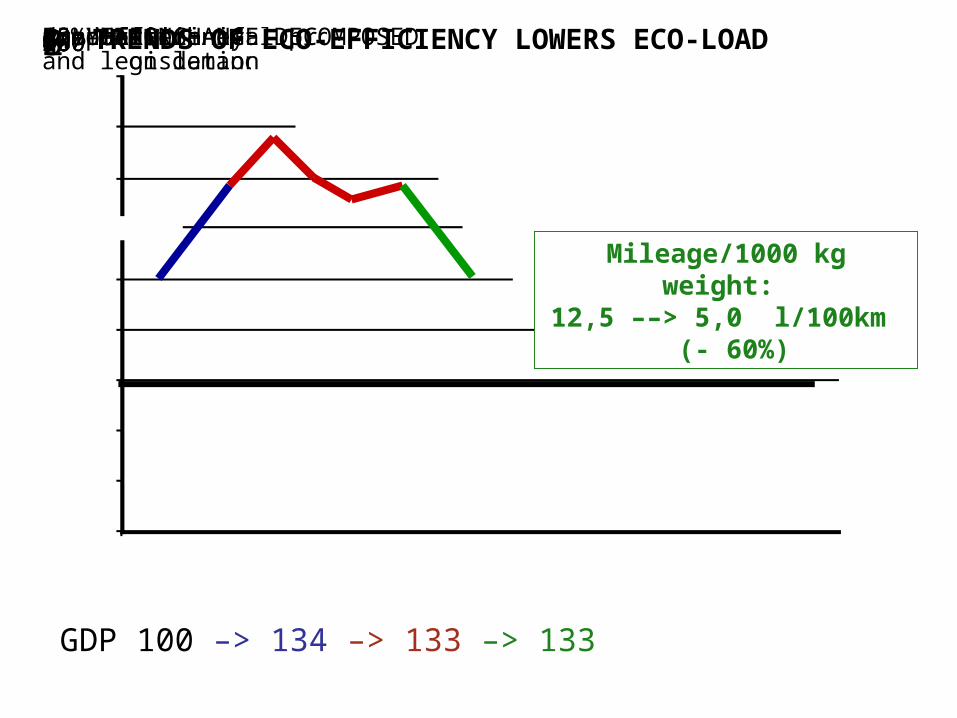
eco-efficiency trend40% reductiondue to technical progressand legislationproductivity3. TRENDS OF ECO-EFFICIENCY LOWERS ECO-LOAD0204060100160POLLUTION15 YEARS CHANGE DECOMPOSED123
GDP 100 –> 134 –> 133 –> 133
Mileage/1000 kg weight: 12,5 ––> 5,0 l/100km (- 60%)
120composition effectson demand
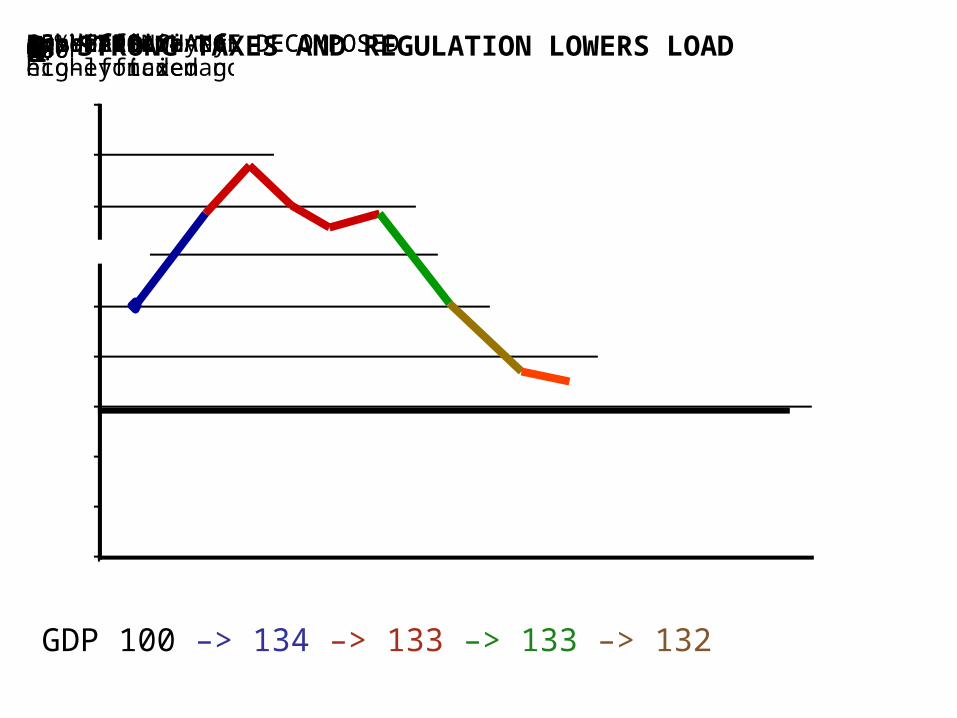
eco-efficiency trendenhanced eco-efficiency40% reduction+ shift away fromhighly taxed goodsproductivity4. STRONG TAXES AND REGULATION LOWERS LOAD020406010016015 YEARS CHANGE DECOMPOSED15 YEARS CHANGE DECOMPOSED1234POLLUTION
GDP 100 –> 134 –> 133 –> 133 –> 132
120productivitycomposition effectson demand
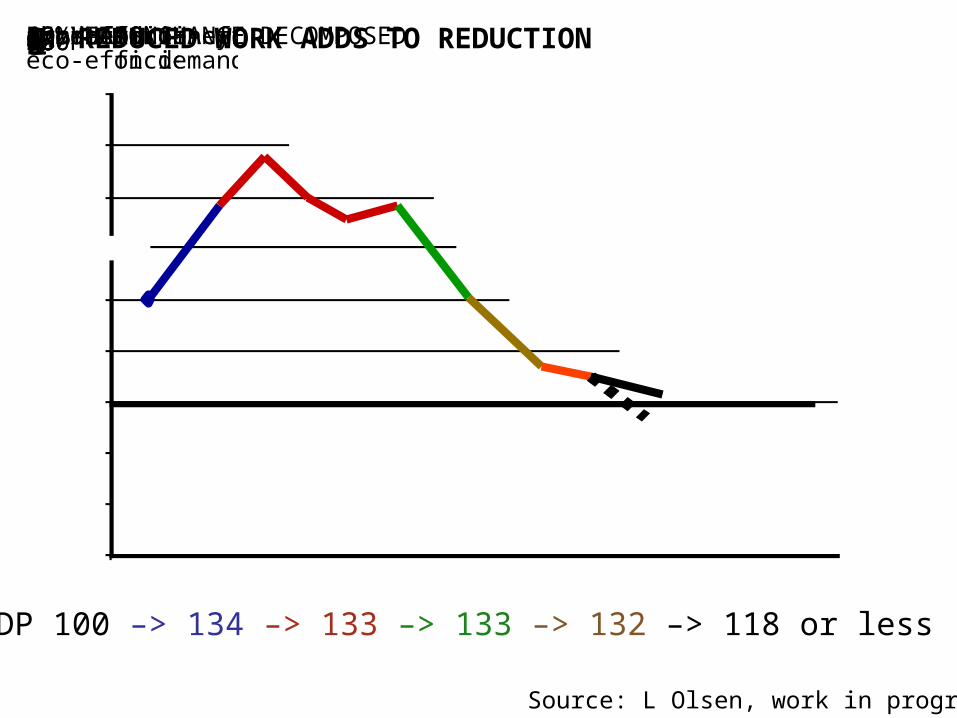
eco-efficiency trendshorter hoursenhanced eco-efficiency40% reduction5. REDUCED WORK ADDS TO REDUCTION020406010016015 YEARS CHANGE DECOMPOSED12345POLLUTION
Source: L Olsen, work in progress
GDP 100 –> 134 –> 133 –> 133 –> 132 –> 118 or less

mainstreamthinking
How to argue and be listened to – without compromising one’s world view?
radical insight

spare
goods private publicservices services
annual productivity change % 3.9 1.6 0.3 (1.9)pollution/unit 6 2 1
labour share before 30 45 25 (100)– after 15 years 20-24 51-55 25 (100)–15 yrs, shorter hours 18-21 47-49 22 (90)
MODELLING 15 YEARS OF ECONOMIC CHANGE
Source: L Olsen, work in progress