Embed Size (px)
Citation preview

…To become a star you need to be good, ambitious
and consider the “constrictions” of your life…
Stephen C. Woods
International Doctorate Program in
Molecular Oncology and Endocrinology
Doctorate School in Molecular Medicine
XXII cycle - 2006–2009
Coordinator: Prof. Giancarlo Vecchio
“The transcription complex Prep1-Pbx1
regulates the gene expression of tyrosine
phosphatases and impairs insulin action in
liver cells”
Salvatore Iovino
University of Naples Federico II
Dipartimento di Biologia e Patologia Cellulare e Molecolare
“L. Califano”
Administrative Location
Dipartimento di Biologia e Patologia Cellulare e Molecolare “L. Califano”
Università degli Studi di Napoli Federico II
Partner Institutions
Italian Institutions Università degli Studi di Napoli “Federico II”, Naples, Italy
Istituto di Endocrinologia ed Oncologia Sperimentale “G. Salvatore”, CNR, Naples, Italy
Seconda Università di Napoli, Naples, Italy
Università degli Studi di Napoli “Parthenope”, Naples, Italy
Università del Sannio, Benevento, Italy
Università di Genova, Genoa, Italy
Università di Padova, Padua, Italy
Università degli Studi “Magna Graecia”, Catanzaro, Italy
Università degli Studi di Firenze, Florence, Italy
Università degli Studi di Bologna, Bologna, Italy
Università degli Studi del Molise, Campobasso, Italy
Università degli Studi di Torino, Turin, Italy
Università di Udine, Udine, Italy
Foreign Institutions Université Libre de Bruxelles, Brussels, Belgium
Universidade Federal de Sao Paulo, Brazil
University of Turku, Turku, Finland
Université Paris Sud XI, Paris, France
University of Madras, Chennai, India
University Pavol Jozef Šafàrik, Kosice, Slovakia
Universidad Autonoma de Madrid, Centro de Investigaciones Oncologicas (CNIO), Spain
Johns Hopkins School of Medicine, Baltimore, MD, USA
Johns Hopkins Krieger School of Arts and Sciences, Baltimore, MD, USA
National Institutes of Health, Bethesda, MD, USA
Ohio State University, Columbus, OH, USA
Albert Einstein College of Medicine of Yeshiwa University, N.Y., USA
Supporting Institutions Ministero dell’Università e della Ricerca
Associazione Leonardo di Capua, Naples, Italy
Dipartimento di Biologia e Patologia Cellulare e Molecolare “L. Califano”, Università degli Studi
di Napoli “Federico II”, Naples, Italy
Istituto Superiore di Oncologia (ISO), Genoa, Italy
Università Italo-Francese, Torino, Naples, Italy
Università degli Studi di Udine, Udine, Italy
Agenzia Spaziale Italiana
Istituto di Endocrinologia ed Oncologia Sperimentale “G. Salvatore”, CNR, Naples, Italy

Italian Faculty
Giancarlo Vecchio, MD, Co-ordinator
Salvatore Maria Aloj, MD
Francesco Saverio Ambesi Impiombato,
MD
Francesco Beguinot, MD
Maria Teresa Berlingieri, MD
Angelo Raffaele Bianco, MD
Bernadette Biondi, MD
Francesca Carlomagno, MD
Gabriella Castoria, MD
Angela Celetti, MD
Mario Chiariello, MD
Lorenzo Chiariotti, MD
Vincenzo Ciminale, MD
Annamaria Cirafici, PhD
Annamaria Colao, MD
Alma Contegiacomo, MD
Sabino De Placido, MD
Gabriella De Vita, MD
Monica Fedele, PhD
Pietro Formisano, MD
Alfredo Fusco, MD
Michele Grieco, MD
Massimo Imbriaco, MD
Paolo Laccetti, PhD
Antonio Leonardi, MD
Paolo Emidio Macchia, MD
Barbara Majello, PhD
Rosa Marina Melillo, MD
Claudia Miele, PhD
Francesco Oriente, MD
Roberto Pacelli, MD
Giuseppe Palumbo, PhD
Silvio Parodi, MD
Nicola Perrotti, MD
Giuseppe Portella, MD
Giorgio Punzo, MD
Antonio Rosato, MD
Guido Rossi, MD
Giuliana SalvatoreMD,
Massimo Santoro, MD
Giampaolo Tortora, MD
Donatella Tramontano, PhD
Giancarlo Troncone, MD
Giuseppe Viglietto, MD
Roberta Visconti, MD
Mario Vitale, MD

Foreign Faculty
Université Libre de Bruxelles,
Belgium
Gilbert Vassart, MD
Jacques E. Dumont, MD
Universidade Federal de Sao Paulo,
Brazil
Janete Maria Cerutti, PhD
Rui Monteiro de Barros Maciel, MD
PhD
University of Turku, Turku, Finland
Mikko Laukkanen, PhD
Université Paris Sud XI, Paris,
France
Martin Schlumberger, MD
Jean Michel Bidart, MD
University of Madras, Chennai,
India
Arasambattu K. Munirajan, PhD
University Pavol Jozef Šafàrik,
Kosice, Slovakia
Eva Cellárová, PhD
Peter Fedoročko, PhD
Universidad Autonoma de Madrid -
Instituto de Investigaciones
Biomedicas, Spain
Juan Bernal, MD, PhD
Pilar Santisteban, PhD
Centro de Investigaciones
Oncologicas, Spain
Mariano Barbacid, MD
Johns Hopkins School of Medicine,
USA
Vincenzo Casolaro, MD
Pierre A. Coulombe, PhD
James G. Herman MD
Robert P. Schleimer, PhD
Johns Hopkins Krieger School of
Arts and Sciences, USA Eaton E. Lattman, MD
National Institutes of Health,
Bethesda, MD, USA
Michael M. Gottesman, MD
J. Silvio Gutkind, PhD
Genoveffa Franchini, MD
Stephen J. Marx, MD
Ira Pastan, MD
Phillip Gorden, MD
Ohio State University, Columbus,
OH, USA
Carlo M. Croce, MD
Ginny L. Bumgardner, MD PhD
Albert Einstein College of Medicine
of Yeshiwa University, N.Y., USA
Luciano D’Adamio, MD
Nancy Carrasco, MD
“The transcription complex Prep1-
Pbx1 regulates the gene expression
of tyrosine phosphatases and
impairs insulin action in liver cells”
TABLE OF CONTENTS
ABSTRACT…………………………………………………………………........1
BACKGROUND…....................................................................................................2
1 Type 2 Diabetes: an overview.…………………………………………….........2
2 Glucose homeostasis……………………………...................................................3
3 Insulin.....................................……………………………………………..........3
4 Insulin signaling system........................................................................................4
4.1 Regulation of glycogen synthesis.........................................................................6
4.2 Regulation of gluconeogenesis............................................................................7
5 Inhibition of insulin signaling: the tyrosine phosphatases…...................................8
6 Type 2 diabetes..................................................................................................10
7 Genes in type 2 diabetes.....................................................................................11
8 TALE proteins…...............................................................................................14
8.1 Pbx1 protein….................................................................................................16
8.2 Prep1 protein…................................................................................................17
8.2.1 Prep1 and diabetes.........................................................................................18
AIMS OF THE STUDY.......................................................................................20
MATERIALS AND METHODS ..........................................................................21
RESULTS AND DISCUSSION…….......................................................................25
CONCLUSIONS…..............................................................................................41
ACKNOWLEDGEMENTS…............................................................................42
REFERENCES…………….................................................................................43
LIST OF PUBLICATIONS
This dissertation is based upon the following publications:
Perfetti A, Oriente F, Iovino S, Alberobello AT, Barbagallo APM, Esposito I,
Fiory F, Teperino R, Ungaro P, Miele C, Formisano P, Begiunot F. Phorbol esters
induce intracellular accumalation of the antiapoptotic protein PED/PEA-15 by
preventing ubiquitinylation and proteasomal degradation. J Biol Chem 2007 Mar
23;282:8648-57
Oriente F, Fernandez Diaz LC, Miele C, Iovino S, Mori S, Diaz VE, Troncone G,
Cassese A., Formisano P, Blasi F, Beguinot F. Prep1 deficiency induces protection
from diabetes and increased insulin sensitivity through a p160-mediated
mechanism. Mol Cel Biol. 2008 Sep;28:5634-45.
Oriente F*. Iovino S.*, Cassese A., Romano C., Miele C., Troncone G., Balletta
M., Perfetti A., Santulli G., Iaccarino G., Valentino R., Beguinot F., Formisano P.
Overexpression of PED/PEA-15 induces mesangial expansion and up-regulates
Protein kinase C-beta activity and Transforming Growth Factor-beta 1 expression.
Diabetologia. 2009 Dec;52:2642–2652
* Equally contributed to the study.

1
ABSTRACT
Prep1 is an homeodomain transcription factor belonging to the MEINOX
subfamily of the TALE (three amino acid loop extension) proteins. Prep1 forms
DNA-independent dimeric complexes with all isoforms of the Pbx homeodomain
transcription factor, enhancing target specificity and regulatory function. Recently,
we have shown that Prep1 deficiency in mice induces protection from diabetes and
increased insulin sensitivity in muscle tissue through a mechanism which involves
increased protein and mRNA levels of the glucose transporter (GLUT)-4 and the
PPAR gamma coactivator-1 alpha (PGC-1 . Since PGC-1 promotes the
gluconeogenesis in hepatic tissue, I have studied the role of Prep1 in regulating
insulin signaling in liver of Prep1 hypomorphic (Prep1i/i, Prep1i/+) mice, which
expressed respectively only 5-7% and 55-57% of protein. Despite the results
obtained in muscle tissue, Prep1i/i and Prep1i/+ mice did not show changes in
PGC-1 protein and mRNA levels, but surprisingly they have an improved
insulin-stimulated phosphorylation of IR and IRS-1/2. This is paralleled by an
increase of glycogen content and a reduction of Glucose-6-phosphatase and
PEPCK expression. Western blot analysis and qRT-PCR experiments displayed a
gene-dosage dependent reduction of protein and mRNA levels of SHP1 and SYP
tyrosine phosphatases in liver extracts of Prep1i/i, Prep1i/+ mice. In parallel, the
overexpression of Prep1 and Pbx1 in and HepG2 (Human Hepatoma cell line)
cells induced insulin resistance by increasing the protein content and mRNA
expression of SHP1 and SYP phosphatases, which were paralleled by an inhibition
of insulin-stimulated phosphorylation of IR, IRS-1/2 and glycogen accumulation.
Interestingly, the overexpression of an inactive form of Prep1 (Prep1HR1), lacking
of the interaction site between Prep1 and Pbx1, did not impair SHP1 and SYP
expression and insulin-signaling in HepG2 cells. Moreover, in Prep1
overexpressing cells, antisense silencing of SHP1 but not that of SYP rescued
insulin-dependent IR phosphorylation and glycogen accumulation. Finally, ChIP
and Re-Chip experiments pointed out that the dimeric complex Prep1-Pbx1 bound
specific sequences upstream the ATG codon of SYP and SHP1 genes (-625bp and
-2113bp respectively) suggesting a direct gene regulation. Luciferase assays
confirmed that the regions upstream SYP and SHP1 genes, were functionally
activated by Prep1 and Pbx1 overexpression. Thus, the dimeric complex Prep1-
Pbx1 directly regulates the gene expression of SYP and SHP1 tyrosine
phosphatases by promoting insulin-resistance in liver cells.

2
BACKGROUND
1. Type 2 Diabetes: an overview
Diabetes mellitus, long considered a disease of minor significance to world health,
is now taking its place as one of the main threats to human health in the 21st
century. The past two decades have seen an explosive increase in the number of
people diagnosed with diabetes worldwide. The global figure of people with
diabetes is set to rise from the current estimate of 220 million (2010) to 300
million in 2025 (Figure 1).
Figure 1. Number of people with diabetes (millions) for 2000 and 2010 (top and middle values
respectively), and the percentage increase. Data adapted from the reference Amos et al. 1997.
There are two main forms of diabetes. Type 1 diabetes is due primarily to
autoimmune-mediated destruction of pancreatic cells, resulting in absolute
insulin deficiency. Its frequency is low compared to type 2 diabetes, which
accounts for over 90% of cases globally. Type 2 diabetes is characterized by both
insulin resistance and impaired insulin secretion. People with type 2 diabetes are
not dependent on exogenous insulin, but may require the hormone for the control
of glucose homeostasis if this is not achieved with diet alone or with oral
hypoglycaemic agents.
3
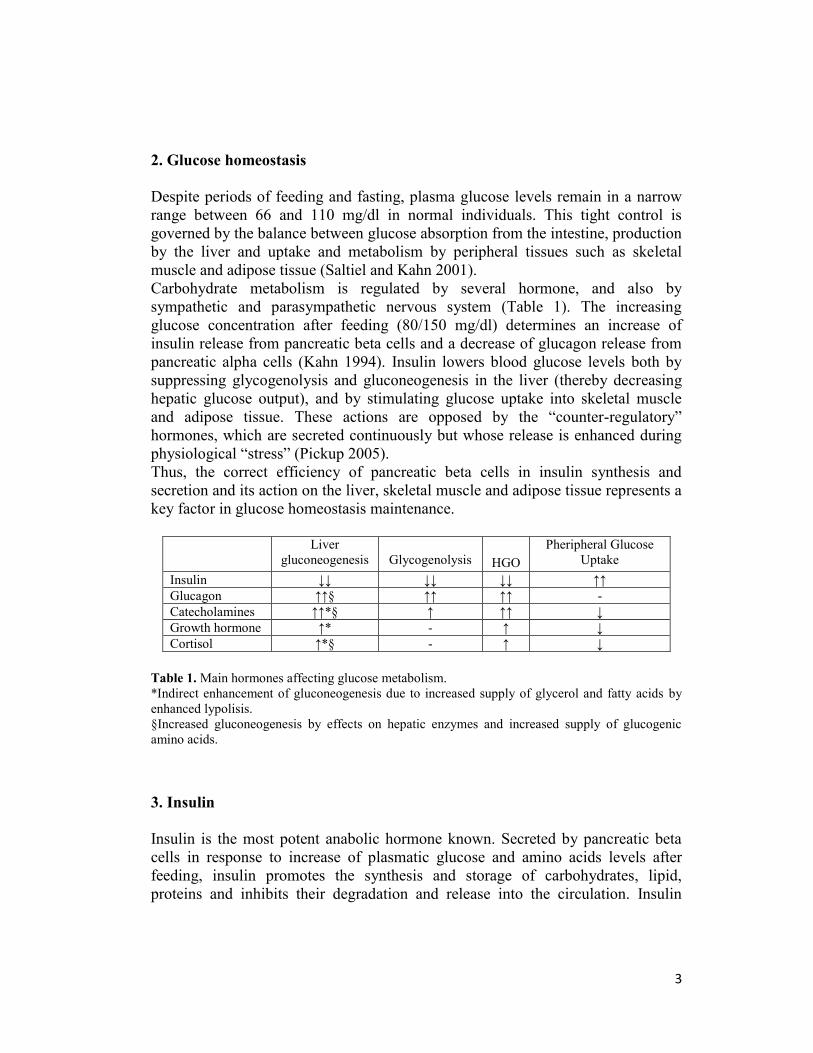
2. Glucose homeostasis
Despite periods of feeding and fasting, plasma glucose levels remain in a narrow
range between 66 and 110 mg/dl in normal individuals. This tight control is
governed by the balance between glucose absorption from the intestine, production
by the liver and uptake and metabolism by peripheral tissues such as skeletal
muscle and adipose tissue (Saltiel and Kahn 2001).
Carbohydrate metabolism is regulated by several hormone, and also by
sympathetic and parasympathetic nervous system (Table 1). The increasing
glucose concentration after feeding (80/150 mg/dl) determines an increase of
insulin release from pancreatic beta cells and a decrease of glucagon release from
pancreatic alpha cells (Kahn 1994). Insulin lowers blood glucose levels both by
suppressing glycogenolysis and gluconeogenesis in the liver (thereby decreasing
hepatic glucose output), and by stimulating glucose uptake into skeletal muscle
and adipose tissue. These actions are opposed by the “counter-regulatory”
hormones, which are secreted continuously but whose release is enhanced during
physiological “stress” (Pickup 2005).
Thus, the correct efficiency of pancreatic beta cells in insulin synthesis and
secretion and its action on the liver, skeletal muscle and adipose tissue represents a
key factor in glucose homeostasis maintenance.
Liver
gluconeogenesis
Glycogenolysis
HGO
Pheripheral Glucose
Uptake
Insulin ↓↓ ↓↓ ↓↓ ↑↑
Glucagon ↑↑§ ↑↑ ↑↑ -
Catecholamines ↑↑*§ ↑ ↑↑ ↓
Growth hormone ↑* - ↑ ↓
Cortisol ↑*§ - ↑ ↓
Table 1. Main hormones affecting glucose metabolism.
*Indirect enhancement of gluconeogenesis due to increased supply of glycerol and fatty acids by
enhanced lypolisis.
§Increased gluconeogenesis by effects on hepatic enzymes and increased supply of glucogenic
amino acids.
3. Insulin
Insulin is the most potent anabolic hormone known. Secreted by pancreatic beta
cells in response to increase of plasmatic glucose and amino acids levels after
feeding, insulin promotes the synthesis and storage of carbohydrates, lipid,
proteins and inhibits their degradation and release into the circulation. Insulin

4
stimulates the uptake of glucose, amino acids and fatty acids into cells, and
increases the expression and activity of enzymes that catalyse glycogen, lipid and
protein synthesis (Saltiel and Kahn 2001).
Insulin increases glucose uptake in muscle and fat, and inhibits hepatic glucose
production (glycogenolysis and gluconeogenesis), thus serving as primary
regulator of blood glucose concentration. Insulin also stimulates cell growth and
differentiation, promotes the storage of substrates in fat, liver and muscle by
stimulating lipogenesis, glycogen and protein synthesis, and inhibiting lipolysis,
glycogenolysis and protein breakdown (Figure 2) (Saltiel and Kahn 2001).
Figure 2. The regulation of metabolism by the insulin.
Insulin promotes the synthesis and storage of carbohydrates, lipids and proteins. Indeed, insulin
stimulates the uptake of glucose, amino acids and fatty acids into cells, and increases the
expression or activity of enzymes that catalyse glycogen, lipid and protein synthesis, while
inhibiting the activity or expression of those that catalyse degradation.
4. Insulin signaling system
Insulin action is mediated through the insulin receptor (IR), a transmembrane
glycoprotein with intrinsic protein tyrosine kinase activity. The insulin receptor
belongs to a subfamily of receptor tyrosine kinases that includes the insulin-like
growth factor (IGF)-I receptor and the insulin receptor-related receptor (IRR).
These receptors are tetrameric proteins consisting of two α- and two β-subunits
that function as allosteric enzymes where the α-subunit inhibits the tyrosine kinase
activity of the β-subunit. Insulin binding to the α-subunit leads to derepression of
the kinase activity of the β-subunit followed by trans-phosphorylation of the β-
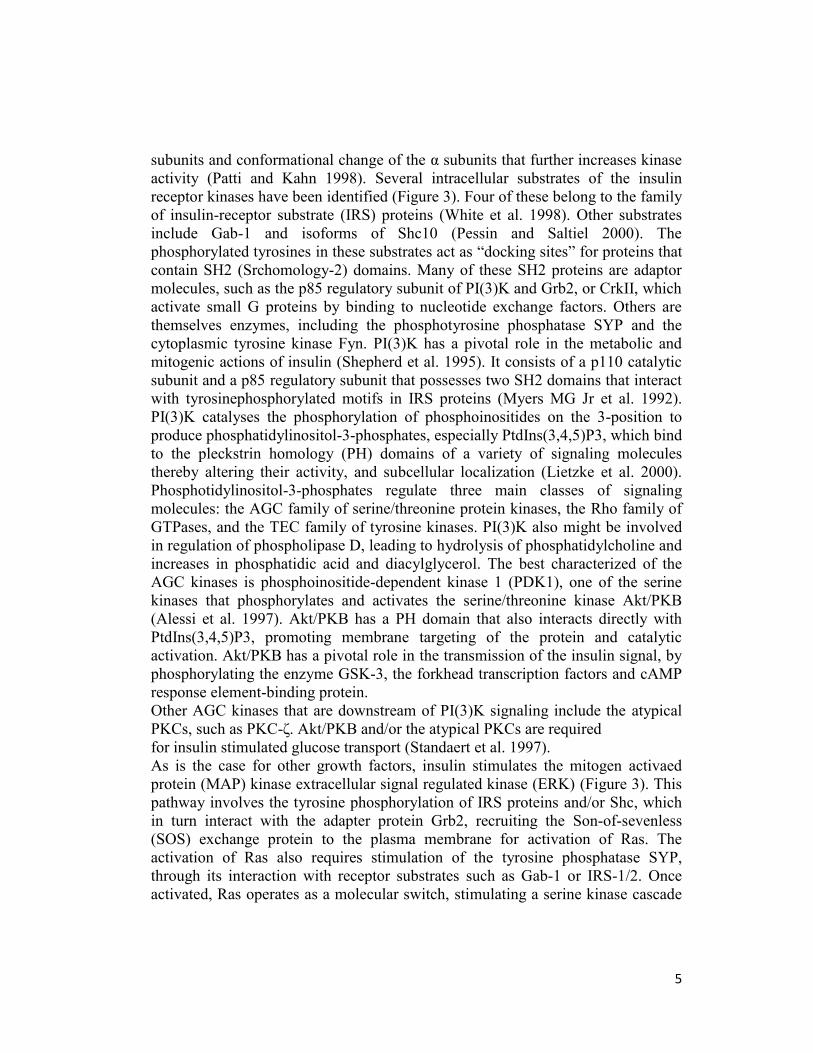
5
subunits and conformational change of the α subunits that further increases kinase
activity (Patti and Kahn 1998). Several intracellular substrates of the insulin
receptor kinases have been identified (Figure 3). Four of these belong to the family
of insulin-receptor substrate (IRS) proteins (White et al. 1998). Other substrates
include Gab-1 and isoforms of Shc10 (Pessin and Saltiel 2000). The
phosphorylated tyrosines in these substrates act as “docking sites” for proteins that
contain SH2 (Srchomology-2) domains. Many of these SH2 proteins are adaptor
molecules, such as the p85 regulatory subunit of PI(3)K and Grb2, or CrkII, which
activate small G proteins by binding to nucleotide exchange factors. Others are
themselves enzymes, including the phosphotyrosine phosphatase SYP and the
cytoplasmic tyrosine kinase Fyn. PI(3)K has a pivotal role in the metabolic and
mitogenic actions of insulin (Shepherd et al. 1995). It consists of a p110 catalytic
subunit and a p85 regulatory subunit that possesses two SH2 domains that interact
with tyrosinephosphorylated motifs in IRS proteins (Myers MG Jr et al. 1992).
PI(3)K catalyses the phosphorylation of phosphoinositides on the 3-position to
produce phosphatidylinositol-3-phosphates, especially PtdIns(3,4,5)P3, which bind
to the pleckstrin homology (PH) domains of a variety of signaling molecules
thereby altering their activity, and subcellular localization (Lietzke et al. 2000).
Phosphotidylinositol-3-phosphates regulate three main classes of signaling
molecules: the AGC family of serine/threonine protein kinases, the Rho family of
GTPases, and the TEC family of tyrosine kinases. PI(3)K also might be involved
in regulation of phospholipase D, leading to hydrolysis of phosphatidylcholine and
increases in phosphatidic acid and diacylglycerol. The best characterized of the
AGC kinases is phosphoinositide-dependent kinase 1 (PDK1), one of the serine
kinases that phosphorylates and activates the serine/threonine kinase Akt/PKB
(Alessi et al. 1997). Akt/PKB has a PH domain that also interacts directly with
PtdIns(3,4,5)P3, promoting membrane targeting of the protein and catalytic
activation. Akt/PKB has a pivotal role in the transmission of the insulin signal, by
phosphorylating the enzyme GSK-3, the forkhead transcription factors and cAMP
response element-binding protein.
Other AGC kinases that are downstream of PI(3)K signaling include the atypical
PKCs, such as PKC-δ. Akt/PKB and/or the atypical PKCs are required
for insulin stimulated glucose transport (Standaert et al. 1997).
As is the case for other growth factors, insulin stimulates the mitogen activaed
protein (MAP) kinase extracellular signal regulated kinase (ERK) (Figure 3). This
pathway involves the tyrosine phosphorylation of IRS proteins and/or Shc, which
in turn interact with the adapter protein Grb2, recruiting the Son-of-sevenless
(SOS) exchange protein to the plasma membrane for activation of Ras. The
activation of Ras also requires stimulation of the tyrosine phosphatase SYP,
through its interaction with receptor substrates such as Gab-1 or IRS-1/2. Once
activated, Ras operates as a molecular switch, stimulating a serine kinase cascade
6
through the stepwise activation of Raf, MEK and ERK. Activated ERK can
translocate into the nucleus, where it catalyses the phosphorylation of transcription
factors such as p62TCF, initiating a transcriptional programme that leads to
cellular proliferation or differentiation (Boulton et al. 1991).
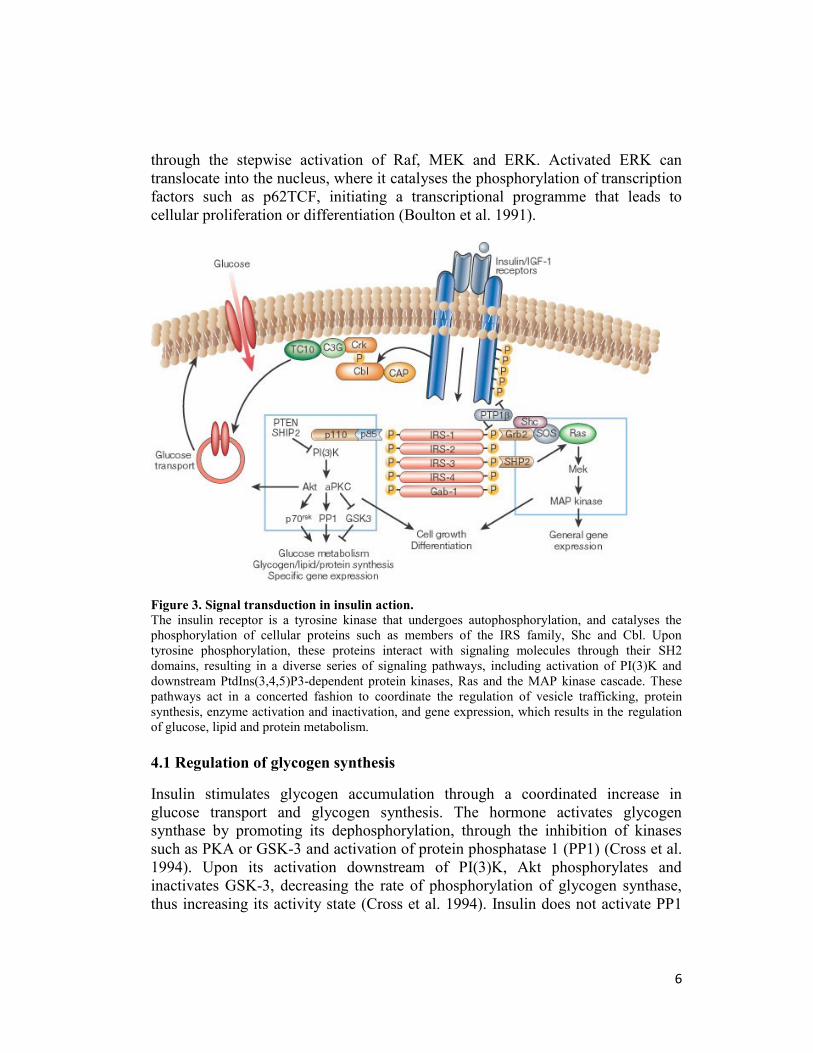
Figure 3. Signal transduction in insulin action.
The insulin receptor is a tyrosine kinase that undergoes autophosphorylation, and catalyses the
phosphorylation of cellular proteins such as members of the IRS family, Shc and Cbl. Upon
tyrosine phosphorylation, these proteins interact with signaling molecules through their SH2
domains, resulting in a diverse series of signaling pathways, including activation of PI(3)K and
downstream PtdIns(3,4,5)P3-dependent protein kinases, Ras and the MAP kinase cascade. These
pathways act in a concerted fashion to coordinate the regulation of vesicle trafficking, protein
synthesis, enzyme activation and inactivation, and gene expression, which results in the regulation
of glucose, lipid and protein metabolism.
4.1 Regulation of glycogen synthesis
Insulin stimulates glycogen accumulation through a coordinated increase in
glucose transport and glycogen synthesis. The hormone activates glycogen
synthase by promoting its dephosphorylation, through the inhibition of kinases
such as PKA or GSK-3 and activation of protein phosphatase 1 (PP1) (Cross et al.
1994). Upon its activation downstream of PI(3)K, Akt phosphorylates and
inactivates GSK-3, decreasing the rate of phosphorylation of glycogen synthase,
thus increasing its activity state (Cross et al. 1994). Insulin does not activate PP1
7
globally, but rather specifically targets discrete pools of the phosphatase, primarily
increasing PP1 activity localized at the glycogen particle. The compartmentalized
activation of PP1 by insulin is due to glycogen-targeting subunits, which serve as
'molecular scaffolds', bringing together the enzyme directly with its substrates
glycogen synthase and phosphorylase in a macromolecular complex, and in the
process exerting profound effects on PP1 substrate-specific activity (Newgard et
al. 2000).
Four different proteins have been reported to target PP1 to the glycogen particle.
Despite a proposed common function, no two targeting subunits share more than
50% sequence homology, and this is largely confined to the PP1- and glycogen-
binding regions. Overexpression of these scaffolding proteins in cells or in vivo
results in a marked increase in cellular glycogen levels (Newgard et al. 2000).
Although the mechanism by which insulin activates glycogen-associated PP1
remains unknown, inhibitors of PI(3)K block this effect, suggesting that
PtdIns(3,4,5)P3-dependent protein kinases are involved. These scaffolding proteins
have a critical permissive role in the hormonal activation of the enzyme, perhaps
interacting with additional proteins that regulate the interaction of PP1 with
glycogen synthase and phosphorylase
4.2 Regulation of gluconeogenesis
Insulin inhibits the production and release of glucose by the liver by blocking
gluconeogenesis and glycogenolysis (Figure 4). This occurs through a direct effect
of insulin on the liver (Micheal et al. 2000), as well as by indirect effects of insulin
on substrate availability (Bergman and Ader 2000). Insulin can also influence
glucose metabolism indirectly by changes in free fatty acids generated from
visceral fat, the so called “single gateway” hypothesis (Bergman 1997). Because
visceral fat is less sensitive to insulin than subcutaneous fat, even after a meal
there is little suppression of lipolysis by the hormone in this fat depot. The
resulting direct flux of fatty acids derived from these fat cells through the portal
vein to the liver can stimulate glucose production, thus providing a signal for both
insulin action and insulin resistance in the liver.
Insulin directly controls the activities of a set of metabolic enzymes by
phosphorylation or dephosphorylation and also regulates the expression of genes
encoding hepatic enzymes of gluconeogenesis and glycolysis (Pilkis and Granner
1992). It inhibits the transcription of the gene encoding phosphoenolpyruvate
carboxykinase, the rate-limiting step in gluconeogenesis (Sutherland et al. 1996).
The hormone also decreases transcription of the genes encoding fructose-1,6-
bisphosphatase and glucose-6-phosphatase, and increases transcription of
glycolytic enzymes such as glucokinase and pyruvate kinase, and lipogenic
enzymes such as fatty acid synthase and acetyl-CoA carboxylase. Although the
transcription factors that control the expression of these genes have remained
8
elusive, new data suggest a potential role for the forkhead family of transcription
factors through phosphorylation by Akt-related protein kinases (Nakae et al.
1999), and the PPAR co-activator PGC-1 (Yoon et al. 2001).
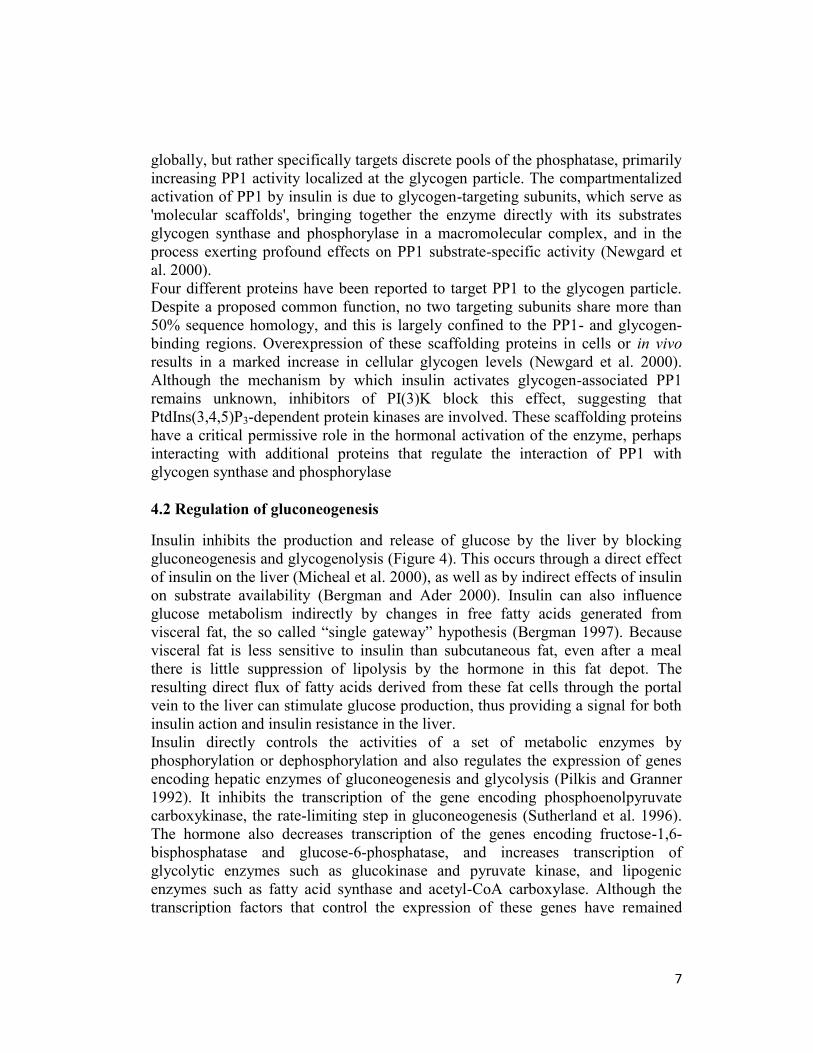
Figure 4. The regulation of glucose metabolism in the liver.
In the hepatocyte, insulin stimulates the utilization and storage of glucose as lipid and glycogen,
while repressing glucose synthesis and release. This is accomplished through a coordinated
regulation of enzyme synthesis and activity. Insulin stimulates the expression of genes encoding
glycolytic and fatty-acid synthetic enzymes (in blue), while inhibiting the expression of those
encoding gluconeogenic enzymes (in red). These effects are mediated by a series of transcription
factors and co-factors, including sterol regulatory element-binding protein (SREBP)-1, hepatic
nuclear factor (HNF)-4, the forkhead protein family (Fox) and PPAR co-activator 1 (PGC1). The
hormone also regulates the activities of some enzymes, such as glycogen synthase and citrate lyase
(in green), through changes in phosphorylation state. GK, glucokinase; Glucose-6-P, glucose-6-
phosphate; G6Pase, glucose-6-phosphatase; F-1,6-Pase, fructose-1,6-bisphosphatase; PEPCK,
phosphoenolpyruvate carboxykinase; PFK, phosphofructokinase; PK, pyruvate kinase; ACC,
acetyl-CoA carboxylase; FAS, fatty-acid synthase.
5. Inhibition of insulin signaling: the tyrosine phosphatases
Insulin signaling cascade may be attenuated by several enzymes, one of the most
important are the protein tyrosine phosphatases (PTPases), which catalyse the
rapid dephosphorylation of the receptor and its substrates. A number of PTPases
have been identified that catalyse dephosphorylation of the insulin receptor in
vitro, some of which are expressed in insulin-responsive cells, or up-regulated in
9
states of insulin resistance. Most attention has focused on the cytoplasmic
phosphatases PTP-1B, SYP and SHP1.
PTP-1B was the first mammalian PTP identified and purified to homogeneity. This
phosphatase is widely expressed and localizes predominantly to the ER through a
cleavable proline-rich C-terminal segment (Frangioni et al. 1992).
In addition to the IR, IRS-1 might also be a substrate of PTP-1B because in the
presence of Grb2, IRS-1 dephosphorylation by PTP-1B is accelerated (Goldstein
et al. 2000).
Knockout of PTP-1B leads to increased insulin induced IR phosphorylation in
liver and muscle but not adipose tissue. IRS-1 phosphorylation was also increased
in muscle, but it is unclear whether this is because IRS-1 is a substrate of PTP-1B,
or an increased IR activity in knockout mice. Furthermore, PTP-1B-deficient mice
are hypersensitive as assayed by oral glucose tolerance tests, intraperitoneal
insulin tolerance tests, and blood levels of glucose and insulin (Elchebly et al.
1999). Importantly, PTP-1B–/– mice are also resistant to diet-induced obesity, due
in part to a decrease in fat cell mass and increased energy expenditure (Klaman et
al. 2000).
SYP is a widely expressed PTP that contains two N-terminal SH2 domains, a C-
terminal catalytic domain and a C-terminal segment containing two tyrosyl
phosphorylation sites (Feng 1999). In contrast to many other growth factor
receptor associated PTPs, SYP does not seem to dephosphorylate the receptor.
However, Kuhne et al. proposed that the binding of IRS-1 to SYP enhances its
phosphatase activity toward IRS-1, resulting in its dephosphorylation in vivo.
Genetic studies in mice indicate that SYP is required for embryonic development
(Saxton et al. 1997). SYP heterozygous knockout mice are viable, and in these
mice, plasma insulin and glucose uptake were normal (Arrandale et al. 1996).
Moreover tyrosine phosphorylation of IR and IRS-1 from muscle tissue was
similar to that of wild-type controls. These results suggest that SYP might play a
minor role in the metabolic effects of insulin. In another approach, when SYP is
expressed in a transgenic mouse model, an insulin-resistant phenotype is observed
that implicates the PTP as a negative regulator of insulin signaling (Maegawa et al.
1999).
Another PTP recently linked to insulin signaling and glucose metabolism is SHP1.
Insulin may stimulate the phosphorylation and activation of SHP1, presumably by
a direct association between SHP1 and the insulin receptor (Uchida et al. 1994,
Bousquet et al. 1998). Mice expressing a catalytically defective SHP1 (Ptpn6me-
v/me-v) are markedly glucose tolerant and insulin sensitive compared to wild-type
controls, as a result of enhanced insulin receptor signaling to IRS-PI3K-Akt in
liver and muscle and increased phosphorylation of CEACAM1 (Dubois et al.
2006). This metabolic phenotype of Ptpn6me-v/me-v
mice is recapitulated in normal
mice through adenoviral expression of a dominant-negative inactive form of SHP1
10
in the liver or hepatic knockdown of SHP1 by small hairpin (sh)RNA mediated
gene silencing, confirming a crucial role for SHP1 in negatively modulating
insulin action and clearance in the liver, thereby regulating whole-body glucose
homeostasis (Dubois et al. 1996).
Thus, the combination of these effects implicate PTP-1B, SYP and SHP1 as
crucial therapeutic targets in diabetes and obesity.
6. Type 2 diabetes and insulin-resistance
T2D accounts for 90% of all forms of diabetes and is most common in people
older than 45 who are overweight. However, as a consequence of increased obesity
among young people, it is becoming more common in children and young adults.
T2D is a heterogeneous syndrome with many possible causes. This is due to the
interaction of environmental factors with a genetic susceptibility to the disease
(Table 3), and it is becoming more and more evident that the relative contribution
of genes and environment can differ considerably, even among individual whose
clinical phenotype is similar (Diabetes Atlas 2006). The maintenance of normal
glucose homeostasis depends on a precisely balanced and dynamic interaction
between tissue sensitivity to insulin and insulin secretion. Type 2 diabetes
develops because of defects in both insulin secretion and action, both of these with
a genetic as well as an acquired component. Thus, T2D is made up of different
forms each of which is characterized by variable degrees of insulin- resistance and
beta cell dysfunction, and which together lead to hyperglycaemia. Insulin
resistance, typically, is an early feature of T2D. It results from a genetically
determined reduction in insulin sensitivity, compounded by exposure to the
environmental factors, which further impair insulin action. Major sites of insulin
resistance include liver and the peripheral tissues, skeletal muscle and fat. In
muscle and fat, insulin resistance is manifested by decreased glucose uptake; in
muscle, it impaired utilization of glucose by non-oxidative pathways as well as by
decrease in glucose oxidation; in the liver, insulin resistance leads to failure of
insulin to suppress hepatic glucose production, which is followed by glycogen
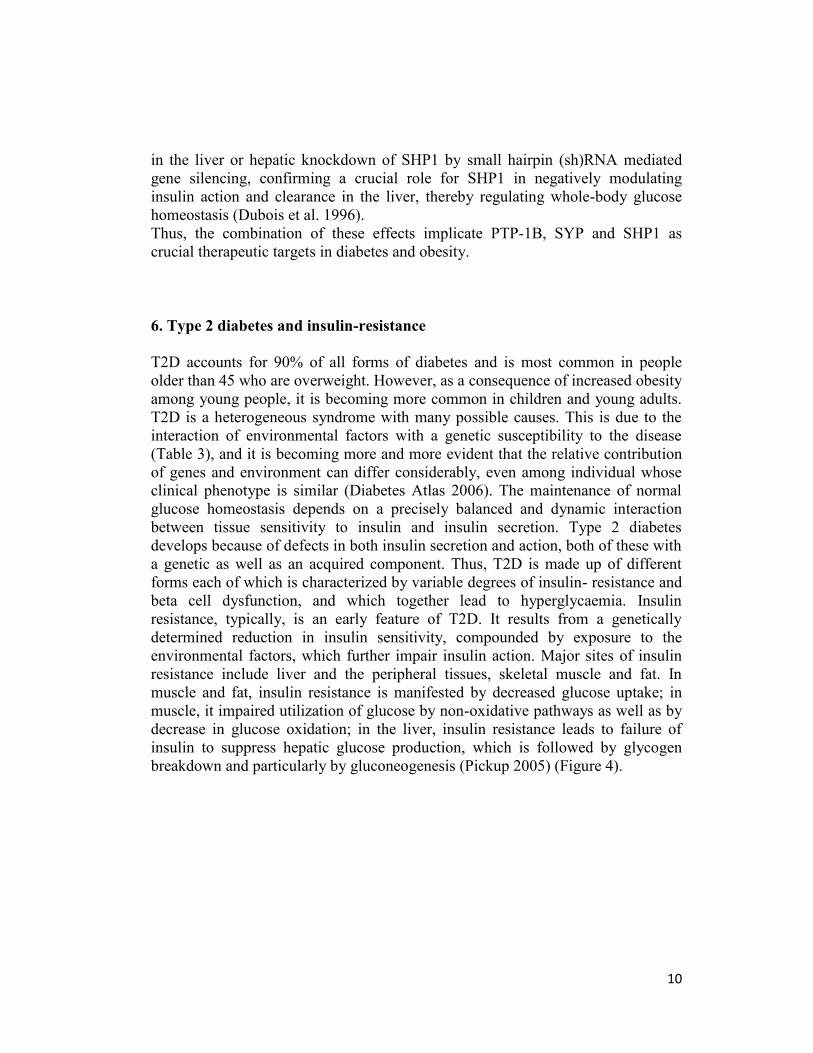
breakdown and particularly by gluconeogenesis (Pickup 2005) (Figure 4).
11
Figure 4. Insulin resistance on tissue targets.
The main sites of insulin resistance are liver and the peripheral tissue, skeletal muscle and fat.
insulin resistance is manifested by decreased glucose uptake in muscle and fat, and by failure
of insulin to suppress hepatic glucose production in the liver.
The beta cell dysfunction, the other key component of T2D pathophysiology,
involves a relatively selective defect in the ability of glucose to provoke insulin
secretion by beta cells, a temporal irregularity in the pulse and oscillations of
insulin secretion, and a loss of the tight coupling between pulses of insulin
secretion and pulse in glucose. This defect accounts for the failure of beta cells to
compensate for increasing insulin-resistance and for the ultimate development of
overt hyperglycaemia. The disease often remains asymptomatic and undetected for
years. People with type 2 diabetes are not completely dependent on exogenous
insulin, but may require the hormone for the control of blood glucose levels if this
is not achieved with diet alone, regular exercise or with oral hypoglycaemic
agents.
But if T2 diabetic people are not diagnosed or successfully treated, may develop
“diabetic complications”, such as micro-vascular complications (disease of the
small blood vessels) including retinopathy, neuropathy and nephropathy, and
macro-vascular complications (disease of the large blood vessels) including
coronary heart disease, myocardial infarction and stroke.
7. Genes in type 2 diabetes
As mentioned above, insulin resistance and impaired beta cell function are the
prominent features of T2D, and they are contributed by genetic and environmental
factors. These factors might affect either the process of insulin signal transmission
12
across the plasma membrane and/or the biochemical pathways allowing glucose
uptake and metabolism by the cells, or might affect the pathways regulating beta
cell function, including those for beta cell compensation. While several
environmental factors have been identified, discovery and characterization of the
genes involved in T2D has been an arduous task and has proceeded slowly. In the
past 10 years, indeed, geneticists have devoted a large amount of effort to finding
T2D genes. These efforts have included many candidate-gene studies, extensive
efforts to fine map linkage signals, and an international linkage consortium that
was perhaps the best example of a multi-centre collaboration in common-disease
genetics (Genome Wide Association Studies, GWAS). Of these efforts, only the
candidate-gene studies produced unequivocal evidence for common variants
involved in T2D. These are the E23K variant in the potassium inwardly-rectifying
channel, subfamily J, member 11 (KCNJ11) gene (Nielsen, et al. 2003), the P12A
variant in the peroxisome proliferator-activated receptor-γ (PPARG) gene
(Altshuler, et al. 2000), and common variation in the transcription factor 2, hepatic
(TCF2) (Gudmundsson, et al. 2007) and the Wolfram syndrome 1 (WFS1)10 genes
(Sandhu, et al. 2007). All of these genes encode proteins that have strong
biological links to diabetes. Rare, severe mutations in these four genes cause
monogenic forms of diabetes, and two of them are targets of antidiabetic therapies:
KCNJ11 encodes a component of a potassium channel with a key role in beta cell
physiology and it is targeted by the sulphonylurea class of drugs; PPARG encodes
a transcription factor involved in adipocyte differentiation and it is targeted by the
thiazolidinedione class of drugs (Figure 5). A common amino-acid polymorphism
(Pro12Ala) in peroxisome proliferator activated receptor-γ (PPARγ) has been
associated with T2D. People homozygous for the Pro12 allele are more insulin
resistant than those having one Ala12 allele and have a 1.25-fold increased risk of
developing diabetes. Moreover, there is also evidence for interaction between this
polymorphism and fatty acids, thereby linking this locus with diet (Altshuler, et al.
2000). In 2006, by far the most spectacular recent development in the field of
multifactorial T2D genetics has been the identification of TCF7L2 (encoding
transcription factor 7-like 2) as the most important T2D-susceptibility gene to date
(Owen and McCarthy 2007). The estimate of effect size (an odds ratio for T2D of
1.4-fold per allele) was identified in an intronic SNP with uncertain functional
credentials (rs7903146). TCF7L2 variation is strongly associated with rates of
progression from impaired glucose tolerance to diabetes (with a hazard ratio of
1.55 between homozygote groups). TCF7L2 is widely expressed and involved in
the Wnt signaling cascade. Most studies suggest that the predominant intermediate
phenotype associated with TCF7L2 variation is impaired insulin secretion,
consistent with the replicated observation that the TCF7L2 association is greater
among lean than obese T2D subjects. Early mechanistic hypotheses have focused
on the known role of TCF7L2 in the gut, postulating the involvement of impaired

13
release of glucagon-like peptide-1 (an important islet secretagogue), reduced beta
cell mass or intrinsic beta cell dysfunction. Body mass index data and some
preliminary associations with leptin and ghrelin levels, however, could point
towards a central mechanism. TCF7L2 result was encouraging for two reasons.
First, this study analysed more than 200 markers across a region of linkage on
chromosome 10q, but the variants that were found to alter risk did not explain the
linkage signal, suggesting that a non-candidate-gene or region-based association
effort (such as a GWAS) could work. Second, TCF7L2 was a completely
unexpected gene showing that a genome-wide approach could uncover previously
unexpected disease pathways.
IPF-1/PDX-1 (Insulin Promoter Factor-1/Pancreatic and Duodenal Homeobox-1)
is an homeodomain-containing transcription factor involved in pancreatic
development, transcriptional regulation of a number of beta cell genes including
insulin, glucokinase, islet amyloid polypeptide and GLUT2, and mediation of
glucose-stimulated insulin gene transcription. Mutations in the heterozygous state
are associated with MODY4 (Maturity Onset Diabetes in the Young 4), a non-
ketotic monogenic form of diabetes mellitus, characterized by an autosomal
dominant mode of inheritance, onset usually before 25 years of age and a primary
defect in pancreatic beta cell function. IPF-1 mutations have also been discovered
in a small fraction of patients with typical adult-onset type 2 diabetes. Subjects
with heterozygous mutations in IPF-1 demonstrated reduced insulin secretory
responses to glucose and glucagon-like peptide-1, consistent with a defect in the
signaling pathways that regulate secretion in the beta cell and/or a defect in beta
cell mass.
Functional and cooperative interactions between IPF-1 and another family of
homeodomain-containing transcription factors named TALE (Three Aminoacid
Loop Extension) is required for several genes regulation. Recently, TALE
homeoproteins have been related to diabetes and insulin-resistance (Kim et al.
2002, Oriente et al 2008).
14
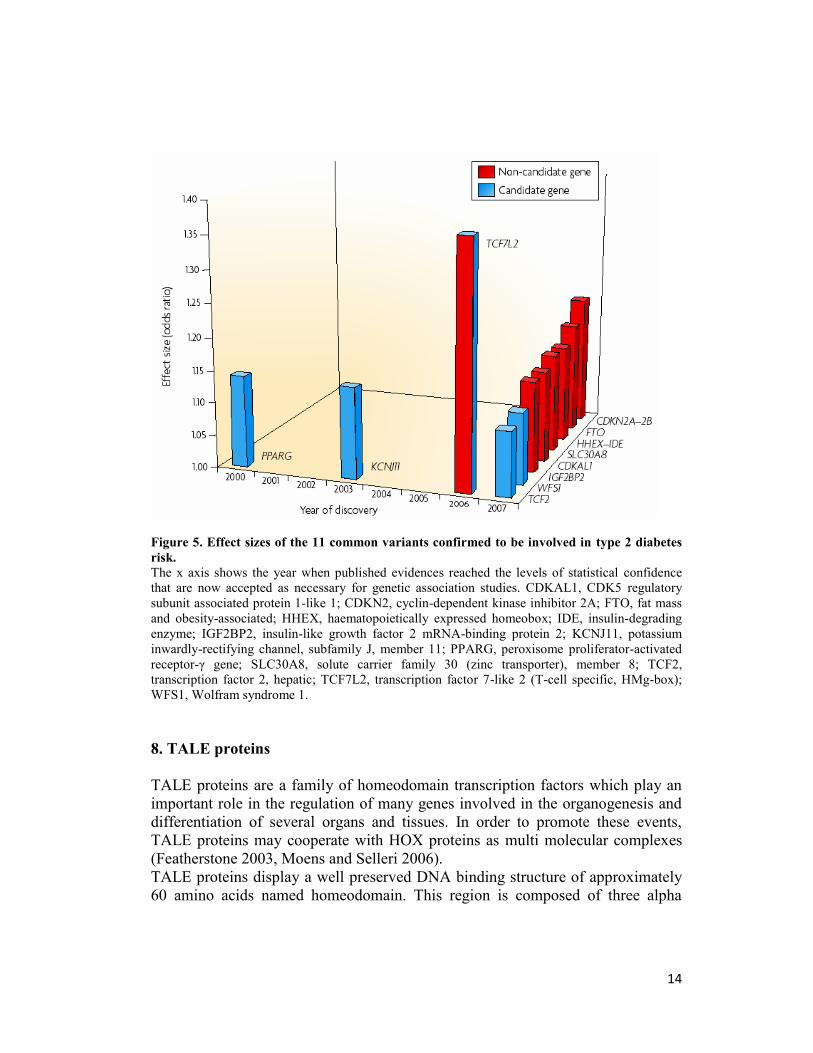
Figure 5. Effect sizes of the 11 common variants confirmed to be involved in type 2 diabetes
risk.
The x axis shows the year when published evidences reached the levels of statistical confidence
that are now accepted as necessary for genetic association studies. CDKAL1, CDK5 regulatory
subunit associated protein 1-like 1; CDKN2, cyclin-dependent kinase inhibitor 2A; FTO, fat mass
and obesity-associated; HHEX, haematopoietically expressed homeobox; IDE, insulin-degrading
enzyme; IGF2BP2, insulin-like growth factor 2 mRNA-binding protein 2; KCNJ11, potassium
inwardly-rectifying channel, subfamily J, member 11; PPARG, peroxisome proliferator-activated
receptor-γ gene; SLC30A8, solute carrier family 30 (zinc transporter), member 8; TCF2,
transcription factor 2, hepatic; TCF7L2, transcription factor 7-like 2 (T-cell specific, HMg-box);
WFS1, Wolfram syndrome 1.
8. TALE proteins
TALE proteins are a family of homeodomain transcription factors which play an
important role in the regulation of many genes involved in the organogenesis and
differentiation of several organs and tissues. In order to promote these events,
TALE proteins may cooperate with HOX proteins as multi molecular complexes
(Featherstone 2003, Moens and Selleri 2006).
TALE proteins display a well preserved DNA binding structure of approximately
60 amino acids named homeodomain. This region is composed of three alpha

15
helices and a flexible N-terminal arm. The homeodomain interacts with the DNA
through the third helix making base-specific contacts in the major groove of DNA
and through the N-terminal arm which contacts the minor groove of DNA.
Between the first and the second alpha helices of the homeodomain there is a 3
aminoacid, virtually represented by a proline (P) - tyrosine (Y) - proline (P) in
positions 24-26, loop extension (TALE) responsible for the interaction with HOX
proteins (Featherstone 2003, Moens and Selleri 2006).
TALE homeodomain proteins are divided into two groups: the PBC family,
including the vertebrate Pbx proteins, fly Extradenticle and worm Ceh-20, and the
MEIS family, including vertebrate Meis and Prep, fly Homothorax (Hth) and
worm Unc-62 (Figure 6) (Moens and Selleri 2006).
Recent papers have shown the molecular mechanisms through Prep1 and Pbx1
TALE proteins may induce insulin-resistance in animal models (Oriente et al.
2008). These studies have confirmed a novel role of these transcription factors in
the pathogenesis of the disease.
Figure 6. Phylogeny and structure TALE homeodomain proteins. TALE homeodomain proteins are divided into two groups: the PBC family, including the
vertebrate Pbx proteins, fly Extradenticle and worm Ceh-20, and the MEIS family, including
vertebrate Meis and Prep, fly Homothorax (Hth) and worm Unc-62. Orange letters indicate mouse
proteins, purple lettering indicates their zebrafish orthologs. Although in some cases the orthology
assignments are not clear (as for pbx2 and pbx4), genetic rescue experiments in zebrafish have

16
suggested that the different pbx genes are functionally identical. Similar information is not yet
available with regard to mammalian Pbx genes.
8.1 Pbx1 protein
Pbx1 (pre-B cell leukemia transcription factor) protein is a small ubiquitous
molecule which belongs to the PBC family. Pbx1, was identified at the (1;19)
chromosomal breakpoint present in 25% of pediatric pre-B cell leukemias. Further
studies have shown Pbx1 interact with other transcription factors and play an
important role in the embryonic development (Nourse et al. 1990).
Pbx1 protein is characterized by the homeodomain region including the three
aminoacid loop extension which interacts with the specific sequences of the HOX
transcription factors. Near the amino terminal region there are two highly
homologous regions named PBC- A and -B important for the protein-protein
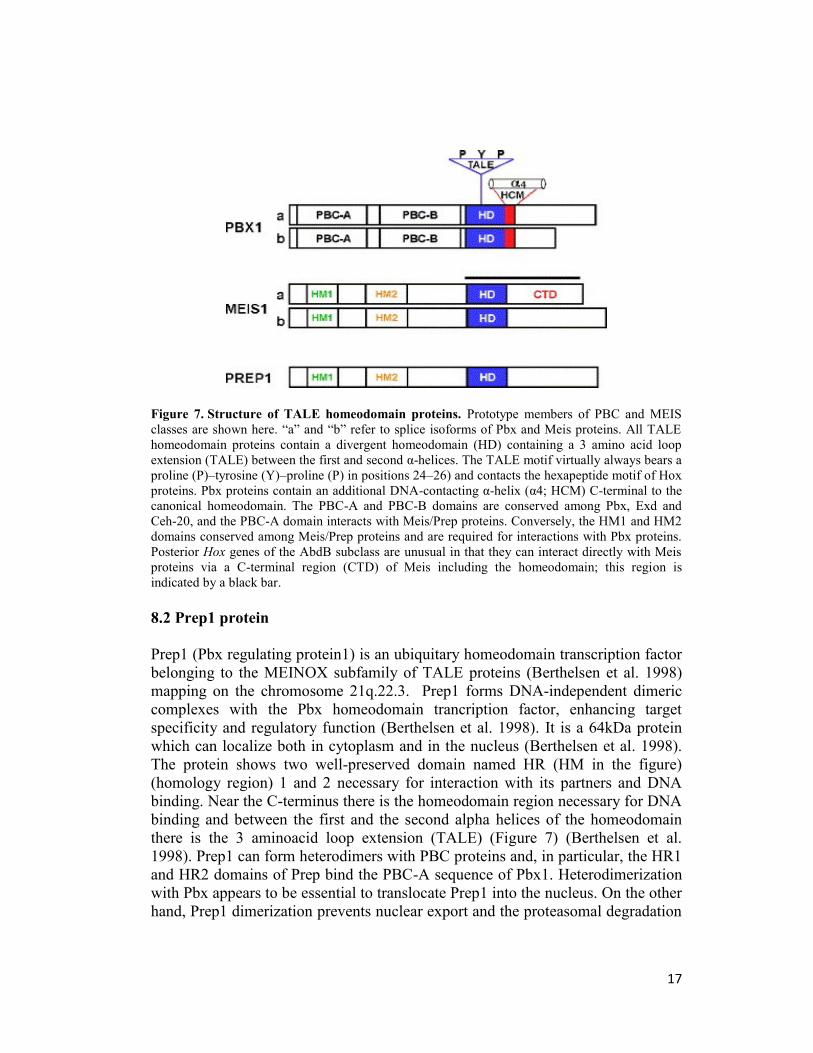
interaction (Figure 7) (Burglin 1997, Piper et al. 1999, Moens and Selleri 2006,).
The relevance of Pbx1 on glucose metabolism has been underlined by several
studies involving knock-out mice. Pbx1−/− mice die during the embryogenesis and
show pancreatic hypoplasia and impaired differentiation of endocrine cells.
Moreover, Pbx1-/+ mice have low levels of plasma insulin which contributes to
the onset of a severe glucose intolerance. In these animals, the levels of PDX-1, a
gene involved in the transcription of the insulin gene and the genesis of the
pancreas, is strongly reduced, indicating that Pbx1 is important for its expression
and most probably assessing the molecular events responsible for the observed
phenotype (Selleri et al. 2001, Brendolan et al. 2005, Kim et al. 2002). The
different actions of the Pbx class of proteins are also determined by the large
numbers of interactors, including homeodomain and non-homeodomain proteins.
The affinity of Pbx to the other cofactors or the specific DNA sequences mostly
depends on the interaction with another important TALE homeoprotein named
Prep1 (Moens and Selleri 2006).
17
Figure 7. Structure of TALE homeodomain proteins. Prototype members of PBC and MEIS
classes are shown here. “a” and “b” refer to splice isoforms of Pbx and Meis proteins. All TALE
homeodomain proteins contain a divergent homeodomain (HD) containing a 3 amino acid loop
extension (TALE) between the first and second α-helices. The TALE motif virtually always bears a
proline (P)–tyrosine (Y)–proline (P) in positions 24–26) and contacts the hexapeptide motif of Hox
proteins. Pbx proteins contain an additional DNA-contacting α-helix (α4; HCM) C-terminal to the
canonical homeodomain. The PBC-A and PBC-B domains are conserved among Pbx, Exd and
Ceh-20, and the PBC-A domain interacts with Meis/Prep proteins. Conversely, the HM1 and HM2
domains conserved among Meis/Prep proteins and are required for interactions with Pbx proteins.
Posterior Hox genes of the AbdB subclass are unusual in that they can interact directly with Meis
proteins via a C-terminal region (CTD) of Meis including the homeodomain; this region is
indicated by a black bar.
8.2 Prep1 protein
Prep1 (Pbx regulating protein1) is an ubiquitary homeodomain transcription factor
belonging to the MEINOX subfamily of TALE proteins (Berthelsen et al. 1998)
mapping on the chromosome 21q.22.3. Prep1 forms DNA-independent dimeric
complexes with the Pbx homeodomain trancription factor, enhancing target
specificity and regulatory function (Berthelsen et al. 1998). It is a 64kDa protein
which can localize both in cytoplasm and in the nucleus (Berthelsen et al. 1998).
The protein shows two well-preserved domain named HR (HM in the figure)
(homology region) 1 and 2 necessary for interaction with its partners and DNA
binding. Near the C-terminus there is the homeodomain region necessary for DNA
binding and between the first and the second alpha helices of the homeodomain
there is the 3 aminoacid loop extension (TALE) (Figure 7) (Berthelsen et al.
1998). Prep1 can form heterodimers with PBC proteins and, in particular, the HR1
and HR2 domains of Prep bind the PBC-A sequence of Pbx1. Heterodimerization
with Pbx appears to be essential to translocate Prep1 into the nucleus. On the other
hand, Prep1 dimerization prevents nuclear export and the proteasomal degradation
18
of Pbx prolonging its half-life (Berthelsen et al. 1999). Heterodimerization of
Prep1 with Pbx forms the UEF-3 (urokinase Enhancer factor-3) transcription
factor which is important in the regulation of the expression of the interleukin 3
(IL-3), stromelysin and urokinase plasminogen activator (uPA), a protease
involved in fibrinolysis, innate and adaptive immunity (Berthelsen et al. 1996). In
addition, co-expression of Pbx1-Prep1 inhibits the glucagon gene transcription in
non-glucagon-producing cells, (Herzig et al. 2000). Prep1 and Pbx1 can form
ternary complexes with the pancreatic and duodenal homeobox 1 (PDX-1).
Functional and cooperative interactions between PDX-1, Pbx, and Prep1 is
required for somatostatin gene transcription (Goudet et al. 1999). Several studies
on Prep1 have been conducted in different kind of animals. In mice, a null Prep1
mutation results in early lethality (E7.5) (Fernandez and Blasi, unpublished data),
precluding a study of the Prep1 role(s) in later developmental processes. An
insertion of a retroviral vector in the first intron of the Prep1 gene results in a
hypomorphic mutation (Prep1i/i) that exhibits variable penetrance and
expressivity. Most Prep1i/i embryos die between E17.5 and P0, although about 1/4
of these escape embryonic lethality. The mice escaping embryonic lethality show
T-cell development anomalies (Penkov). In addition, erythropoiesis and
angiogenesis are impaired, with liver hypoplasia, decreased hematocrit, anemia,
and delayed erythroid differentiation together with a decrease in capillary
formation. Prep1i/i embryos also display major eye anomalies and exhibit
decreased levels of Pbx1, Pbx2, and Meis1 proteins as well as decreased
expression of cMyb and Pax6, consistent with the hematopoietic and eye
phenotype, respectively (Ferretti et al. 2006).
8.2.1 Prep1 and diabetes
In our laboratory we have recently evidenced an important role of Prep1 in
pancreas development and in glucose homeostasis (Oriente et al. 2008). Prep1
hypomorphic (Prep1i/i) mice, which expressed only 5-7% of Prep1, show smaller
islets consistent with a 35% decrease of both glucagon and insulin secretion. Pbx1
levels are reduced in Prep1i/i mice, emphasizing the idea that Prep1 hierarchically
acts upstream in the network regulating pancreas development by controlling the
levels of Pbx1. However, Prep1i/i animals exhibit enhanced sensitivity to insulin
action in skeletal muscle and are protected from developing streptozotocin-
induced diabetes. Measurement of the expression of several proteins playing an
important role in insulin sensitivity and glucose disposal, like the insulin receptor
(IR), Insulin Receptor Substrate-1 and -2, Akt/PKB, PKC zeta, ERK1/2 and Pbx1,
have revealed no significant differences in Prep1i/i and control mice. In contrast,
the levels of glucose transporter (GLUT4) and the PPAR gamma coactivator-1
alpha (PGC-1 are markedly increased, while the p160 Myb-binding protein

19
(p160), a molecule which is known to inhibit the PGC-1 -mediated glucose
transport and competes with Pbx1 to bind Prep1, is reduced in hypomorphic mice.
These findings raises the possibility that, in the skeletal muscle, Prep1 down-
regulation results in activation of the glucose transport machinery by decreasing
p160 levels. These effects have been confirmed by transfecting Prep1, Pbx1 and
p160 cDNA in differentiating L6 skeletal muscle cells. Overexpression of Prep1
reduces the levels of PGC1 and GLUT4 and increases p160 protein expression in
these cells, while overexpression of Pbx1 boosts the levels of PGC1 and GLUT4.
Thus, Pbx1 and Prep1 have opposite effects on insulin-dependent glucose disposal
by muscle. Prep1-mediated p160 expression is, at least in part, post-translational.
In addition, a direct delivery of p160 cDNA in the muscle of Prep1 hypomorphic
mice mimics the effect of Prep1, decreasing PGC-1 and GLUT4 expression. On
the basis of the results, Prep1 might be considered as a new gene involved in the
pathogenesis of type 2 diabetes and insulin-resistance.
20
AIMS OF THE STUDY
This thesis concerns the role of Prep1 homeodomain protein on liver insulin action
in animal models and in hepatic cultured cells. In particular, I focused my attention
on the effects mediated by the transcription complex Prep1-Pbx1.
Data produced in our lab indicate that Prep1 deficiency may positively modulate
the intracellular pool of GLUT4 in muscle tissue by enhancing the transcription of
the PPAR gamma coactivator-1 alpha (PGC-1 gene (Oriente et al. 2008). This
molecular effects lead to improvement of insulin sensitivity in this tissue.
As mentioned before, liver gluconeogenesis is a major process determining
insulin-regulated glucose metabolism. Expression of the gluconeogenic enzymes
G6Pase and PEPCK is regulated not only by the recruitment or modifications of
transcription factors but also of co-activator proteins, including PGC-1 (Yoon et
al. 2001). Whether and how Prep1 affects glucose metabolism in liver is unknow
at the present but important to clarify in order to elucidate how Prep1 regulates
insulin-dependent glucose metabolism at the whole-body level.
Thus, my purpose was to investigate whether the deficiency of Prep1 in liver
might reproduce the molecular changes in PGC-1α levels observed in muscle
tissue and modulate the glucose metabolism in this organ.
To achieve my aim I have studied glucose metabolism and insulin action in liver
of Prep1 hypomorphic mice (Prep1i/i) and focused my attention on the possible
genes which could have been regulated by the transcription complex Prep1-Pbx1.
Secondly, I have investigated whether the overexpression of Prep1 might induce
insulin-resistance in hepatic cells (HepG2) and confirm the molecular mechanism
by which Prep1 acts.
21
MATERIALS AND METHODS
Materials
Media, sera, antibiotics for cell culture and the lipofectamine reagent were from
Invitrogen (Grand Island, NY). The Prep1, PGC-1 , actin, IR, Pbx1, SYP, SHP1
and PTP-1B antibodies were from Santa Cruz Biotechnology, Inc. (Santa Cruz,
CA). The pY, IRS1, IRS2, antibodies were from Upstate Biotechnolgy (Lake
Placid, NY). Protein electrophoresis, Real Time PCR, luciferase assay reagents
were purchased from Bio-Rad (Richmond, VA), Western blotting and ECL
reagents from Amersham Biosciences (Arlington Heights, IL). All other chemicals
were from Sigma (St. Louis, MO).
Generation of Prep1 hypomorphic mice
Prep1 targeted mice were generated by gene trapping by Lexikon Genetics, Inc.
(The Woodlands, Texas) and have been previously described (15, 38). In the
experiments reported in this paper, heterozygous mice were backcrossed with
wild-type (WT) C57BL/6 for 4 generations. All animal handling conformed to
regulations of the Ethics Committee on Animal Use of H. S. Raffaele (IACUC
permission number 207). Hepatic tissue samples were collected rapidly after mice
were sacrificed by pentobarbitone overdose. Tissues were snap frozen in liquid
nitrogen and stored at –80°C for subsequent western blotting.
Determination of glycogen content and pyruvate tolerance test
Hepatic tissue samples or HepG2 cells were homogenized in 0.1% SDS
(1ml/24mg tissue or 1 ml/culture plate) using a glass-teflon potter and incubated
30’ at 37°C. After the incubation, 500 l of lysates were used for the assay. The
glycogen was precipitated by adding ½ vol. (250 l) saturated Na2SO4 and 1.2 vol.
(600 l) 95% EtOH and incubating 30’ in ice. To isolate the glycogen, the samples
were centrifuged at 4°C 20’ at 1000rpm. The glycogen pellet was completely dried
in vacuum conditions by SPEED VAC centrifugation and resuspended in 1ml
dH2O. Finally, the samples were transferred into glass tubes and mixed with 1ml
5% Aqueous Phenol (Sigma-Aldrich) and 5ml 98% H2SO4 to disrupt the
molecules of glycogen. The samples were incubated 10’ at RT and subsequently
20’ at 30° C in agitation. The molecules of glucose derived by the intracellular
pool of glycogen were quantified by spectrophotometric analysis (reading 490

22
nm), compared with a linear standard curve of standard glycogen samples and
normalized for the proteins content of the samples. For the pyruvate tolerance test,
mice deprived of food for 16 hours were injected intraperitoneally with pyruvate
dissolved in saline (2g/Kg) and venous blood glucose was drawn by tail clipping at
0, 30, 60, 90, and 120 min and measured with a glucometer (A. Menarini
Diagnostics).
Cell culture procedures and transfection
HepG2 hepatoma cells and NMuLi mouse liver cells were cultured at 37°C in
Dulbecco’ s modified Eagle’ s medium (DMEM) supplemented with 10% fetal
bovine serum, 2% L-glutamine, 10,000 units/ml penicillin, 10,000 g/ml
streptomycin. Transient transfection of Prep1, Prep1HR, p160 and Pbx1 plasmid
sDNAs or SYP and SHP1 phosphorothioate antisense oligonucleotides were
performed by the Lipofectamine reagent according to the manufacturer’s
instruction. For these studies, 60-80% confluent cells were washed twice with
Optimem (Invitrogen) and incubated for 8h with 3-5 g of plasmid construct or
with 250nM of oligonucleotides and 45-60 l of lipofectamine reagent. In
transient transfection, the medium was then replaced with DMEM with 10% fetal
bovine serum and cells further incubated for 15 h before being assayed. In stably
transfection individual G418-resistant clones were selected by the limiting dilution
technique (G418 effective dose, 0.8 mg/ml).
Western blot analysis and immunoprecipitation procedures
Tissue samples were homogenized in a Polytron (Brinkman Instruments, N.Y.) in
20 ml T-PER reagent/gram of tissue according to manufacture (Pierce, IL). After
centrifugation at 10,000 rpm for 5 minutes, supernatant was collected. Cells were
solubilized in lysis buffer (50 mmol/l HEPES, pH 7.5, 150 mmol/l NaCl, 10
mmol/L EDTA, 10 mmol/l Na4P2O7, 2 mmol/L Na3VO4, 100 mmol/L NaF, 10%
glycerol, 1% Triton X-100, 1 mmol/L PMSF, 10 mg/ml aprotinin) for 1 h at 4C
and lysates were centrifuged at 5,000g for 20 min. Total or immunoprecipitated
homogenates were separated by SDS-PAGE and transferred on 0.45 m
Immobilon-P membranes. Upon incubation with primary and secondary
antibodies, immunoreactive bands were detected by ECL according to the
manufacturer's instructions.
23
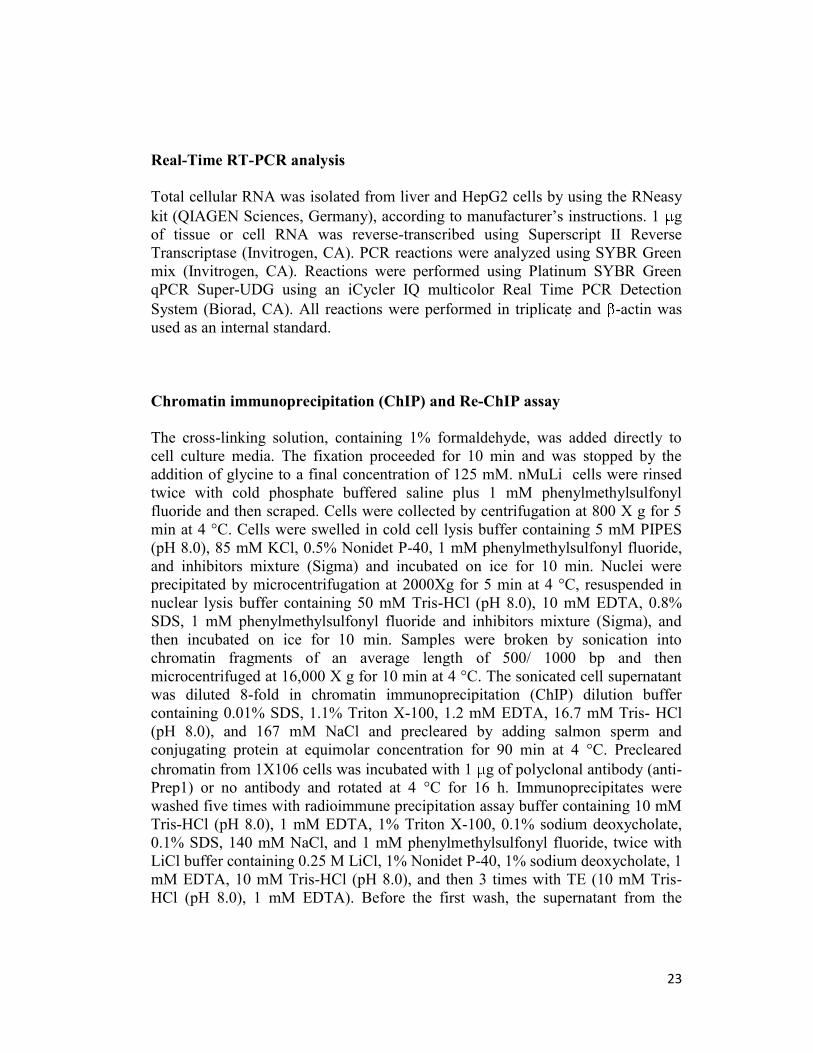
Real-Time RT-PCR analysis
Total cellular RNA was isolated from liver and HepG2 cells by using the RNeasy
kit (QIAGEN Sciences, Germany), according to manufacturer’s instructions. 1 g
of tissue or cell RNA was reverse-transcribed using Superscript II Reverse
Transcriptase (Invitrogen, CA). PCR reactions were analyzed using SYBR Green
mix (Invitrogen, CA). Reactions were performed using Platinum SYBR Green
qPCR Super-UDG using an iCycler IQ multicolor Real Time PCR Detection
System (Biorad, CA). All reactions were performed in triplicate and -actin was
used as an internal standard.
Chromatin immunoprecipitation (ChIP) and Re-ChIP assay
The cross-linking solution, containing 1% formaldehyde, was added directly to
cell culture media. The fixation proceeded for 10 min and was stopped by the
addition of glycine to a final concentration of 125 mM. nMuLi cells were rinsed
twice with cold phosphate buffered saline plus 1 mM phenylmethylsulfonyl
fluoride and then scraped. Cells were collected by centrifugation at 800 X g for 5
min at 4 °C. Cells were swelled in cold cell lysis buffer containing 5 mM PIPES
(pH 8.0), 85 mM KCl, 0.5% Nonidet P-40, 1 mM phenylmethylsulfonyl fluoride,
and inhibitors mixture (Sigma) and incubated on ice for 10 min. Nuclei were
precipitated by microcentrifugation at 2000Xg for 5 min at 4 °C, resuspended in
nuclear lysis buffer containing 50 mM Tris-HCl (pH 8.0), 10 mM EDTA, 0.8%
SDS, 1 mM phenylmethylsulfonyl fluoride and inhibitors mixture (Sigma), and
then incubated on ice for 10 min. Samples were broken by sonication into
chromatin fragments of an average length of 500/ 1000 bp and then
microcentrifuged at 16,000 X g for 10 min at 4 °C. The sonicated cell supernatant
was diluted 8-fold in chromatin immunoprecipitation (ChIP) dilution buffer
containing 0.01% SDS, 1.1% Triton X-100, 1.2 mM EDTA, 16.7 mM Tris- HCl
(pH 8.0), and 167 mM NaCl and precleared by adding salmon sperm and
conjugating protein at equimolar concentration for 90 min at 4 °C. Precleared
chromatin from 1X10⁶ cells was incubated with 1 g of polyclonal antibody (anti-
Prep1) or no antibody and rotated at 4 °C for 16 h. Immunoprecipitates were
washed five times with radioimmune precipitation assay buffer containing 10 mM
Tris-HCl (pH 8.0), 1 mM EDTA, 1% Triton X-100, 0.1% sodium deoxycholate,
0.1% SDS, 140 mM NaCl, and 1 mM phenylmethylsulfonyl fluoride, twice with
LiCl buffer containing 0.25 M LiCl, 1% Nonidet P-40, 1% sodium deoxycholate, 1
mM EDTA, 10 mM Tris-HCl (pH 8.0), and then 3 times with TE (10 mM Tris-
HCl (pH 8.0), 1 mM EDTA). Before the first wash, the supernatant from the
24
reaction lacking primary antibody was saved as total input of chromatin and was
processed with the eluted immunoprecipitates beginning at the cross-link reversal
step. Immunoprecipitates were eluted by adding 1% SDS, 0.1 M NaHCO3, and
reverse cross-linked by the addition of NaCl to a final concentration of 200 mM
and by heating at 65 °C for at least 4 h. Recovered material was treated with
proteinase K, extracted with phenol-chloroform-isoamyl alcohol (25:24:1), and
precipitated. The pellets were resuspended in 30 l of TE and analyzed by PCR
using specific primers for the analyzed regions. The input sample was resuspended
in 30 l of TE and diluted 1:10 before PCR. For ReChIP assay,
immunoprecipitates with the first antibody were eluted in 50 ml of DTT 10 mM,
diluted 10-fold in ChIP Dilution Buffer supplemented with protease inhibitors, and
immunoprecipitated with the second antibody. Following immunoprecipitation,
samples are processed as described above for ChIP assay and eluted DNA
amplified by PCR with specific oligos.
Luciferase assay
The mouse genomic region of SHP1 n.2 (-2113/-1778) was amplified by PCR
from genomic mouse DNA isolated from murine liver cell line (NmuLi cells). The
following primers were used: F: 5’-KpnI- TCGGTGTGAGATCGGTACAA-3’
and R:5’-SacI- TCCGAGTTGGTGTCTCAGTG-3’ (SHP1 n°2), (where SacI and
KpnI indicate the restriction sites added to the sequence). The amplified regions
were cloned in Plg3 promoter vector (Promega) by SacI and KpnI cloning
strategy. To examine the effect of Prep1 and Pbx1 on SHP1 n°2 regions, HeLa
cells were cotransfected with 2 g of SHP1 n.2 promoter vector together with
different amounts of Prep1 and Pbx1 expression vectors. Total DNA content (up to
4 g/plate) was normalized to the empty vector devoid of Prep1 and Pbx1 coding
sequence. 48 h after transfection luciferase activity was measured by a commercial
luciferase assay kit (Promega). Values were normalized for beta-galactosidase.
Statistical procedures
Data were analysed with the Statview software (Abacus-concepts) by one-factor
analysis of variance. P values of less than 0.05 were considered statistically
significant.
25
RESULTS AND DISCUSSION
Prep1 deficiency may positively modulate the intracellular pool of GLUT4 in
muscle tissue by enhancing the transcription of the PPAR gamma coactivator-1
alpha (PGC-1 gene (Oriente et al. 2008). These molecular changes have been
observed in Prep1 hypomorphic mice (Prep1i/i) and lead to increase insulin
sensitivity in this tissue.
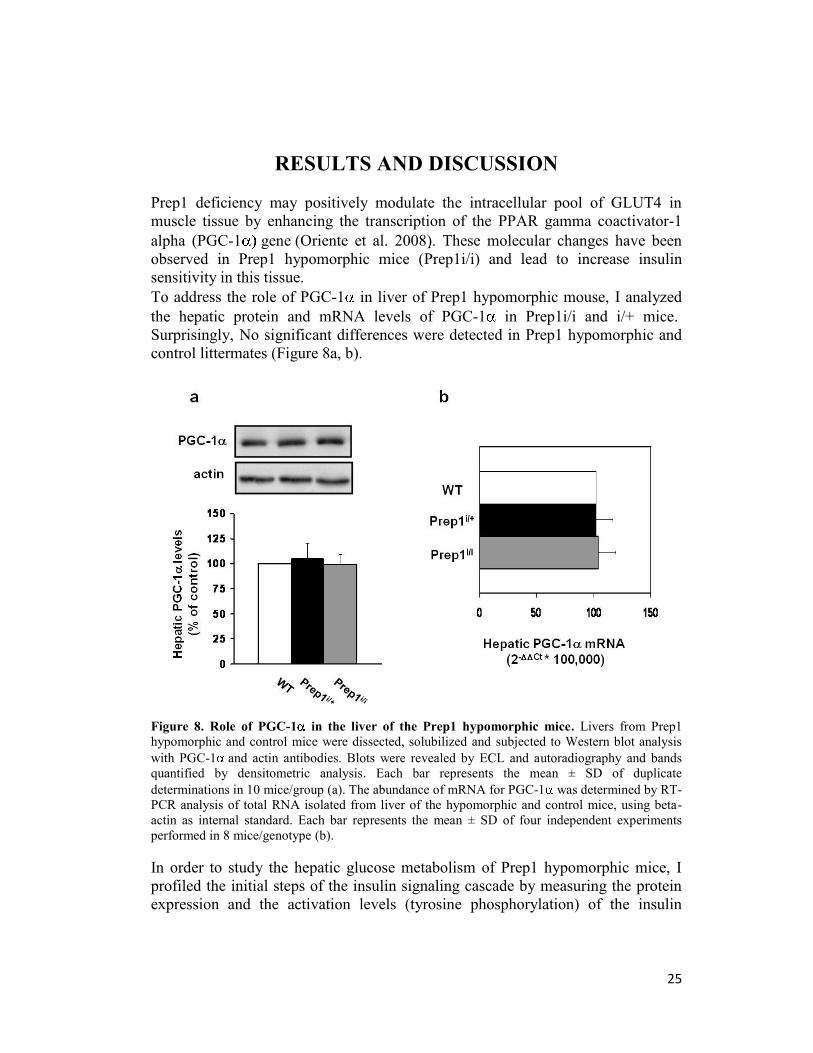
To address the role of PGC-1 in liver of Prep1 hypomorphic mouse, I analyzed
the hepatic protein and mRNA levels of PGC-1 in Prep1i/i and i/+ mice. Surprisingly, No significant differences were detected in Prep1 hypomorphic and
control littermates (Figure 8a, b).
Figure 8. Role of PGC-1 in the liver of the Prep1 hypomorphic mice. Livers from Prep1
hypomorphic and control mice were dissected, solubilized and subjected to Western blot analysis
with PGC-1 and actin antibodies. Blots were revealed by ECL and autoradiography and bands
quantified by densitometric analysis. Each bar represents the mean ± SD of duplicate
determinations in 10 mice/group (a). The abundance of mRNA for PGC-1 was determined by RT-
PCR analysis of total RNA isolated from liver of the hypomorphic and control mice, using beta-
actin as internal standard. Each bar represents the mean ± SD of four independent experiments
performed in 8 mice/genotype (b).
In order to study the hepatic glucose metabolism of Prep1 hypomorphic mice, I
profiled the initial steps of the insulin signaling cascade by measuring the protein
expression and the activation levels (tyrosine phosphorylation) of the insulin

26
receptor (IR) and the IRSs proteins (IRS1-2). In particular, I activated the insulin
signaling cascade by injecting control and hypomorphic mice intraperitoneally
with insulin 0.75mU/g. Subsequently, mice were sacrificed and
immunopreciptiation assays were performed with specific antibodies against the
phosphorylated tyrosines of IR and IRS1-2 in liver extracts. No change was
evidenced in either IR, IRS1 or IRS2 total protein levels, while, tyrosine
phosphorylation of all these proteins was significantly increased in Prep1
hypomorphic mice, in a gene dosage-dependent manner, compared to wild type
mice (Figure 9).
Figure 9. Insulin signaling in liver of Prep1 hypomorphic mice. Protein lysates (250 g) from
liver tissue of WT and Prep1 hypomorphic mice, injected with insulin 0.75mU/g, were
immunoprecipitated with IR, IRS-1 or IRS-2 antibodies followed by blotting with phosphotyrosine,
IR, IRS-1 or IRS-2 antibodies. Actin antibodies were used for the loading control normalization.
The autoradiograph is representative of four independent experiments.
It is known that the effect of insulin on liver cells is to block the gluconeogenesis
by reducing the expression of G6Pase and PEPCK and induce glycogen storage. I
assessed whether the enhanced insulin signaling might affect the final steps of
insulin pathway by measuring the gene expression of G6Pase and PEPCK and by
checking the gluconeogenesis and the glycogen storage after insulin stimulation.
27
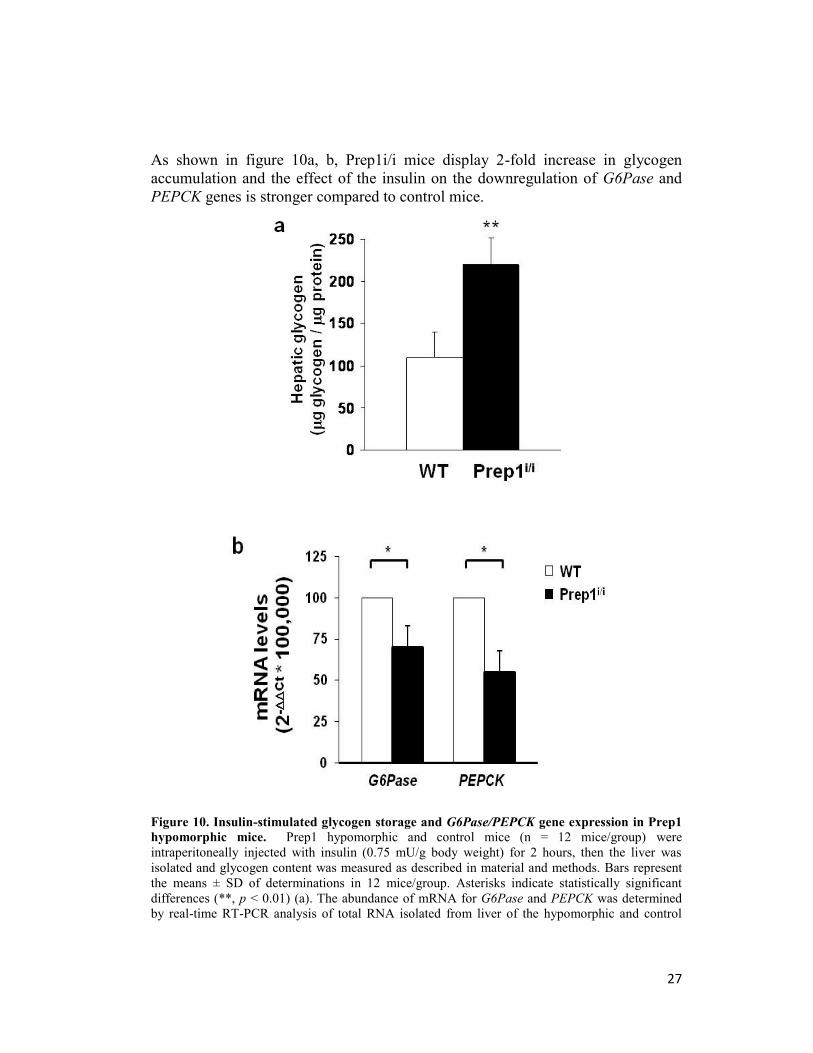
As shown in figure 10a, b, Prep1i/i mice display 2-fold increase in glycogen
accumulation and the effect of the insulin on the downregulation of G6Pase and
PEPCK genes is stronger compared to control mice.
Figure 10. Insulin-stimulated glycogen storage and G6Pase/PEPCK gene expression in Prep1
hypomorphic mice. Prep1 hypomorphic and control mice (n = 12 mice/group) were
intraperitoneally injected with insulin (0.75 mU/g body weight) for 2 hours, then the liver was
isolated and glycogen content was measured as described in material and methods. Bars represent
the means ± SD of determinations in 12 mice/group. Asterisks indicate statistically significant
differences (**, p < 0.01) (a). The abundance of mRNA for G6Pase and PEPCK was determined
by real-time RT-PCR analysis of total RNA isolated from liver of the hypomorphic and control

28
mice, using beta-actin as internal standard. Each bar represents the mean ± SD of four independent
experiments performed in 8 mice/genotype (b).
G6Pase and PEPCK are key enzymes in the hepatic regulation of glucose output
and gluconeogenesis respectively. I have evaluated if the reduction of G6Pase and
PEPCK observed in the liver of Prep1 hypomorphic mice in response to insulin
might have modified the rate of glucose output/gluconeogenesis. One of the test,
widely used in literature, to study this aspect of glucose metabolism is the pyruvate
tolerance test (PTT), because, pyruvate gets into the hepatic cells and it is quickly
converted into glucose. I have measured the blood glucose levels during 2 hours
after the Na pyruvate administration. As shown in figure 11 the profile of blood
glucose of Prep1i/+ mice indicated that the sensitivity to pyruvate-induced
hyperglycemia was significantly lower in Prep1i/+.
Figure 11. Pyruvate tolerance test in Prep1i/+ mice. B. WT and Prep1i/+ mice (n=12
mice/group) were fasted for 16 hours, injected with pyruvate (2g/Kg) and plasma glucose
concentrations were quantified at the indicated times. Data points represent the means ± SD of
results obtained from each group of mice. Asterisks denote statistically significant differences (*, p
< 0.05; **, p < 0.01).
Thus, the reduction of G6Pase and PEPCK expression observed in the liver of
Prep1 hypomorphic mice, reflects the lower glycemia observed during the
experiment. The enhanced insulin signaling of these mice may contribute to reduce
pyruvate-induced hyperglycemia in Prep1 hypomorphic mice compared to WT
mice. This last set of results indicate that Prep1 deficiency may significantly
29
modify insulin action in hepatic tissue by improving either the first steps of the
cascade and the functional effects of the hormone. Moreover, the network
involved in Prep1 action in liver is completely different from the muscle, since
PGC-1 is not involved.
To investigate the molecular mechanisms of this phenotype, I evaluated the
activation and the protein levels of several serine/threonine kinase proteins
involved in the negative regulation of insulin action. No difference was detected
for members of PKC isoforms ( and ), ERK1/2 and JNK between WT and
Prep1 hypomorphic mice (data not shown). Also GRB10, an adapter protein which
interact with IR and reduces insulin-stimulated tyrosine phosphorylation of IRS1
and IRS2, was unchanged (data not shown). The insulin-dependent liver
glucoregulatory function is also known to be regulated by the tyrosine
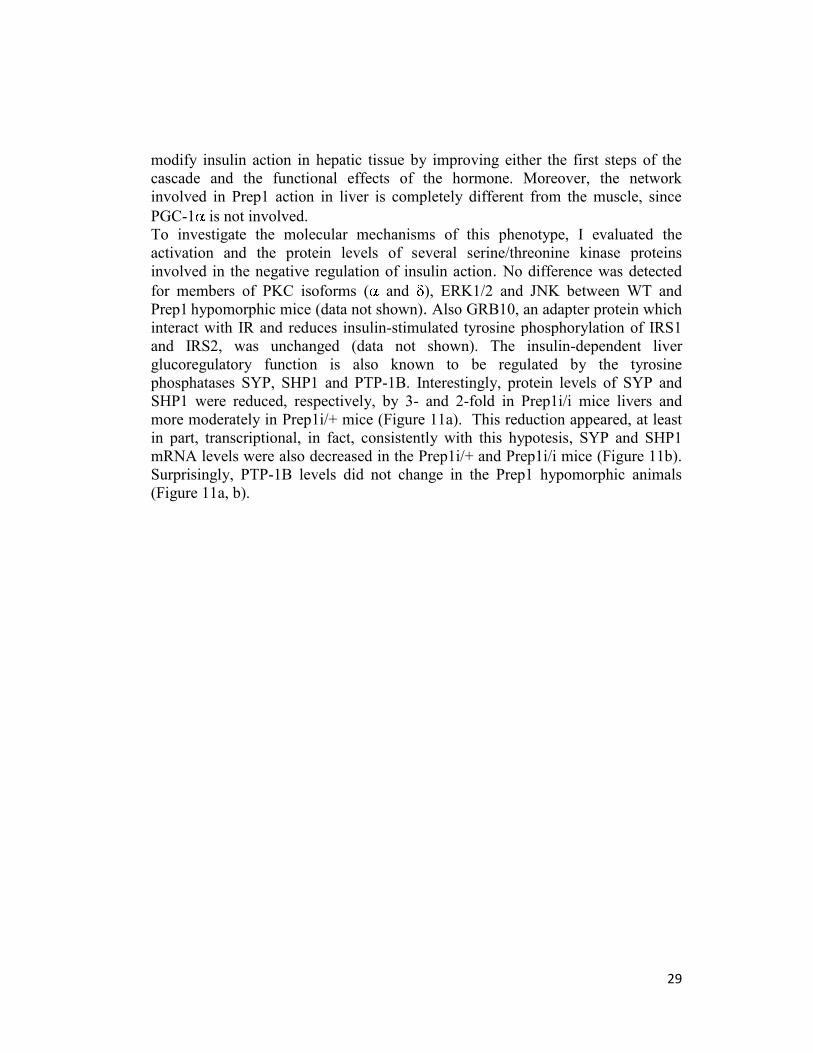
phosphatases SYP, SHP1 and PTP-1B. Interestingly, protein levels of SYP and
SHP1 were reduced, respectively, by 3- and 2-fold in Prep1i/i mice livers and
more moderately in Prep1i/+ mice (Figure 11a). This reduction appeared, at least
in part, transcriptional, in fact, consistently with this hypotesis, SYP and SHP1
mRNA levels were also decreased in the Prep1i/+ and Prep1i/i mice (Figure 11b).
Surprisingly, PTP-1B levels did not change in the Prep1 hypomorphic animals
(Figure 11a, b).
30
Figure 11. Protein and mRNA levels of SYP, PTP1-B and SHP1 in hepatic tissue of Prep1
hypomorphic mice. SYP, PTP1-B and SHP1 tyrosine phosphatases protein expression was
measured by western blot in hepatic tissues from hypomorphic and control mice using anti- SYP,
PTP-1B and SHP1 antibodies. Each bar represents the mean ± SD of duplicate determinations in
10 mice/group. Asterisks denote statistically significant differences (**, p < 0.01; ***, p < 0.001)
(a). The abundance of mRNAs of SYP, PTP-1B and SHP1 genes was determined by real-time RT-
PCR analysis of total RNA isolated from liver tissue of the hypomorphic and control mice, using
beta-actin as internal standard. Each bar represents the mean ± SD of four independent experiments
performed in 6 mice/genotype (b).
The tyrosine phosphatases PTP-1B, SYP, and SHP1 play a fundamental role in the
insulin-dependent liver glucoregulatory function. They are known to negatively
modulate insulin action on liver glucose metabolism through tyrosine
dephosphorylation of the insulin receptor and/or insulin receptor substrates. The
balance in the level of activity of these individual phosphatases represents an
important determinant of normal liver glucoregulation. How, at the physiological
and molecular levels, this balance is maintained has been only partially elucidated.
Prep1 might be a pivotal molecule in the regulation of these phosphatases and it
could be a novel candidate in their transcriptional modulation.
To further examine Prep1 action on early tyrosine phosphorylation in the insulin
signaling cascade and on the regulation of tyrosine phosphatases, I have transiently
31
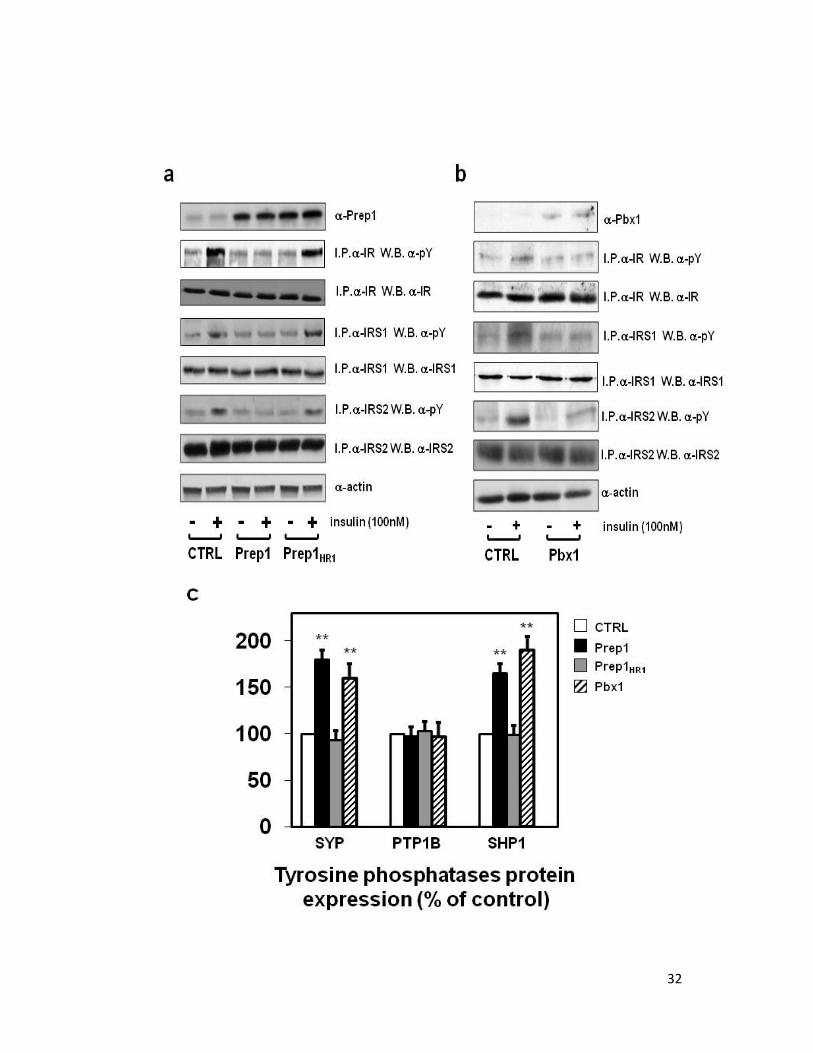
transfected a Prep1 cDNA in the HepG2 hepatoma cells, which represent a good
model of liver cells. As shown in figure 12a, the transfection almost completely
prevented insulin-induced tyrosine phosphorylation of the insulin receptor as well
as that of IRS-1 and IRS-2. No change was evidenced in the abundance of any of
these proteins. Furthermore, Prep1 transfection up-regulated SYP and SHP1
expression both at the mRNA and the protein levels but elicited no action on that
of PTP-1B (figure 12c, d).
The effects of Prep1 on gene regulation is tightly dependent on many interactors
which can recruit it in different transcription networks and modulate the target of
its transcription activity. Since one of the main partners of Prep1 is Pbx1, I focused
my attention on the transcription complex Prep1-Pbx1 as a possible regulator of
the transcription of the SYP and SHP1 genes. To validate this hypothesis, I
transfected HepG2 cells with cDNAs of Pbx1 and Prep1HR1 This mutant contains
one point mutation in the domain HR1 which is fundamental for the interaction
between Prep1 and Pbx1, resulting in an abolishment of the recruitment and
function of the transcription complex. Interestingly, the overexpression of a Pbx1
cDNA in HepG2 cells mimicked Prep1 effects on insulin-stimulated tyrosine
phosphorylation of the insulin receptor kinase and IRS-1/2 (figure 12b), as well as
the effects of Prep1 on SYP and SHP1 gene and protein expression (figure 12c, d).
More importantly, Prep1HR1 mutant was unable to exert the biological effects
exerted by the overexpression of the WT protein and Pbx1 (Figure 12a,c,d).
Moreover, transfection of the Prep1 cDNA, but not that of the Prep1HR1 mutant,
abolished insulin-induced glycogen accumulation in the HepG2 cells (figure 13).
As in the case of the insulin signal activation, the effect of Prep1 was mimicked by
Pbx1 overexpression.
32

33
Figure 12. Effect of Prep1, Pbx1 and Prep1HR1 cDNAs transfection on insulin signaling and
tyrosine phosphatases expression. HepG2 cells were transiently transfected with the Prep1, Pbx1
and Prep1HR1 mutant cDNAs and exposed to 100 nM insulin for 5 minutes. Afterwards, cells were
solubilized and the lysates were immunoprecipitated with anti IR, IRS1 or IRS2 antibodies
followed by blotting with pY, IR, IRS1 or IRS2 antibodies. The total lysates were blotted with anti
Prep1, Pbx1 or actin antibodies. Bands were revealed by ECL and autoradiography. The
autoradiograph shown is representative of four independent experiments (a,b). Lysates from
HepG2 cells transiently overexpressing were subjected to western blot analysis blotted with anti
SYP, PTP-1B and SHP1 antibodies. Each bar represents the mean ± SD of duplicate determinations
in four independent experiments. (c). The levels of mRNAs encoding SYP, PTP-1B and SHP1 was
quantified by real-time RT-PCR analysis, using beta-actin as internal standard. Bars represent the
mean ± SD of four independent experiments (d). Asterisks denote statistically significant
differences (**, p < 0.01; ***, p < 0.001) (c, d).
34
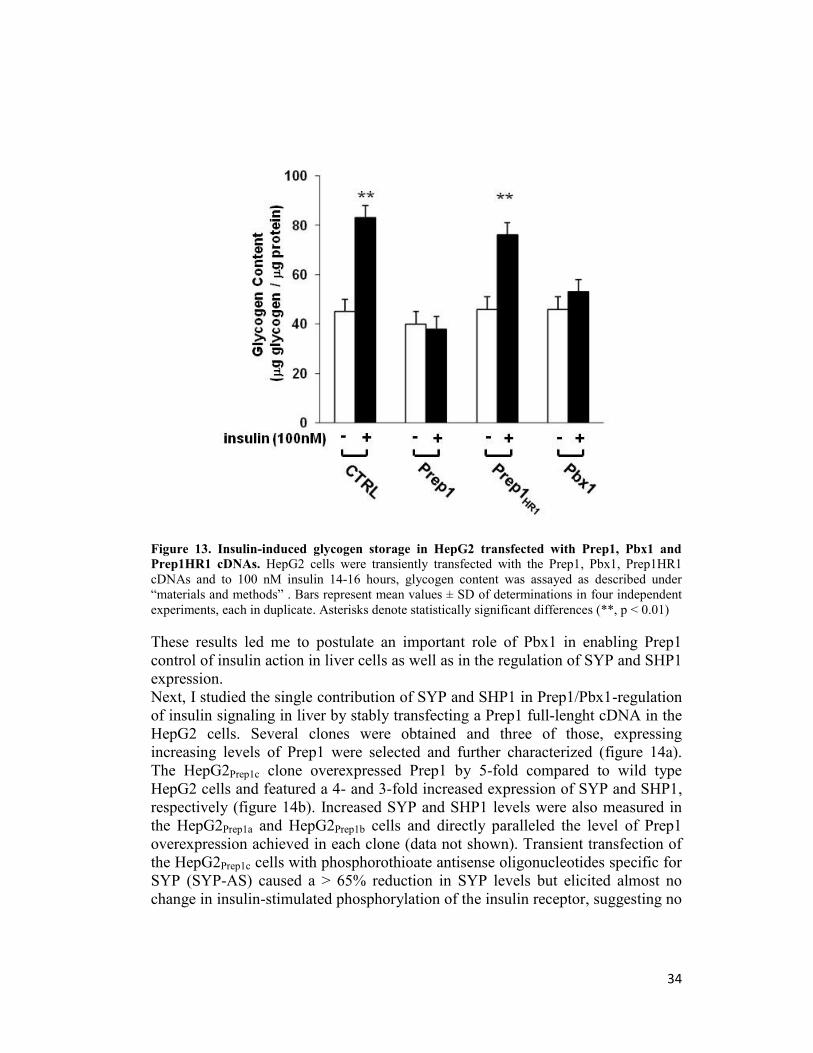
Figure 13. Insulin-induced glycogen storage in HepG2 transfected with Prep1, Pbx1 and Prep1HR1 cDNAs. HepG2 cells were transiently transfected with the Prep1, Pbx1, Prep1HR1
cDNAs and to 100 nM insulin 14-16 hours, glycogen content was assayed as described under
“materials and methods” . Bars represent mean values ± SD of determinations in four independent
experiments, each in duplicate. Asterisks denote statistically significant differences (**, p < 0.01)
These results led me to postulate an important role of Pbx1 in enabling Prep1
control of insulin action in liver cells as well as in the regulation of SYP and SHP1
expression.
Next, I studied the single contribution of SYP and SHP1 in Prep1/Pbx1-regulation
of insulin signaling in liver by stably transfecting a Prep1 full-lenght cDNA in the
HepG2 cells. Several clones were obtained and three of those, expressing
increasing levels of Prep1 were selected and further characterized (figure 14a).
The HepG2Prep1c clone overexpressed Prep1 by 5-fold compared to wild type
HepG2 cells and featured a 4- and 3-fold increased expression of SYP and SHP1,
respectively (figure 14b). Increased SYP and SHP1 levels were also measured in
the HepG2Prep1a and HepG2Prep1b cells and directly paralleled the level of Prep1
overexpression achieved in each clone (data not shown). Transient transfection of
the HepG2Prep1c cells with phosphorothioate antisense oligonucleotides specific for
SYP (SYP-AS) caused a > 65% reduction in SYP levels but elicited almost no
change in insulin-stimulated phosphorylation of the insulin receptor, suggesting no

35
change in insulin action in these cells (figure 14c). At variance, treatment with
SHP1 antisense oligonucleotides (SHP1-AS) silenced SHP1 expression by only
50% but increased insulin receptor tyrosine phosphorylation by almost 3-fold
(figure 14d). Indeed, the impaired insulin-dependent accumulation of glycogen
observed in liver cells overexpressing Prep1 was unaffected by SYP silencing but
was rescued by the SHP1 AS (figure 15). Thus, regulation of the SHP1 gene
function appeared to represent a mechanism relevant to Prep1 control on insulin
signaling and action in the hepatocyte. However, I cannot exclude the fact that
there could be a major role for SYP in regulating insulin signaling in a different
tissue or in different environmental conditions.
Figure 14. Effect of SYP and SHP1 silencing in HePG2 cells stably transfected with Prep1
cDNA. HepG2 cells were stably transfected with the Prep1 cDNA. Clones HepG2Prep1A,

36
HepG2Prep1B, HepG2Prep1C were subjected to western blot analysis, blotted with Prep1
antibodies, and compared with control cells (HepG2) (a). Cell lysates from HepG2 or
HepG2Prep1c cells were blotted with anti SYP, SHP1 and actin antibodies. HepG2 and
HepG2Prep1c cells were transfected with SYP (SYP-AS) (c) or SHP1 (SHP1-AS) (d) specific
phosphorothioate antisense oligonucleotides, then stimulated with 100nM insulin for 5 minutes and
the insulin receptor was immunoprecipitated with specific antibodies and followed by blotting with
either pY and IR antibodies. For control, total lysates were blotted with anti SYP (c) or SHP1 (d)
and actin antibodies. The autoradiographs shown are representative of three independent
experiments.
Figure 15. Insulin-induced glycogen accumulation in HepG2 cells stably overexpressing
Prep1 interfered with SYP and SHP1 antisense oligonucleotides. Cells were stimulated with
100nM insulin for 14-16 hours, afterwards, glycogen content was assayed as described under
“Materials and Methods”. Bars represent mean values ± SD of determinations in four independent
experiments, each in duplicate. Asterisks denote statistically significant differences (**, p < 0.01).
Understanding how Prep1-Pbx1 might regulate the expression of SHP1 gene is a
critical point to better define the action of this transcription complex in modulating
insulin action in liver cells. I therefore examined the further possibility that the
transcription complex Prep1-Pbx1 might directly regulates SHP1 gene
transcription. To address this hypothesis, I performed a bioinformatic analysis of
4000 base pairs region upstream the ATG codon of SHP1 gene searching potential
binding sites for the Prep1 and Pbx1 complex. This analysis revealed the presence
of at least 7 potential binding sites resumed in the table 2. Interestingly, these
sequences were arranged in 3 clusters, indicated as SHP1 n.1, n.2, n.3 mapping
from -2489 to -2139bp, -2113 to -1778bp, -1680 to -1350bp respectively from the
ATG codon (figure 16). As negative control, I also analyzed the sequence
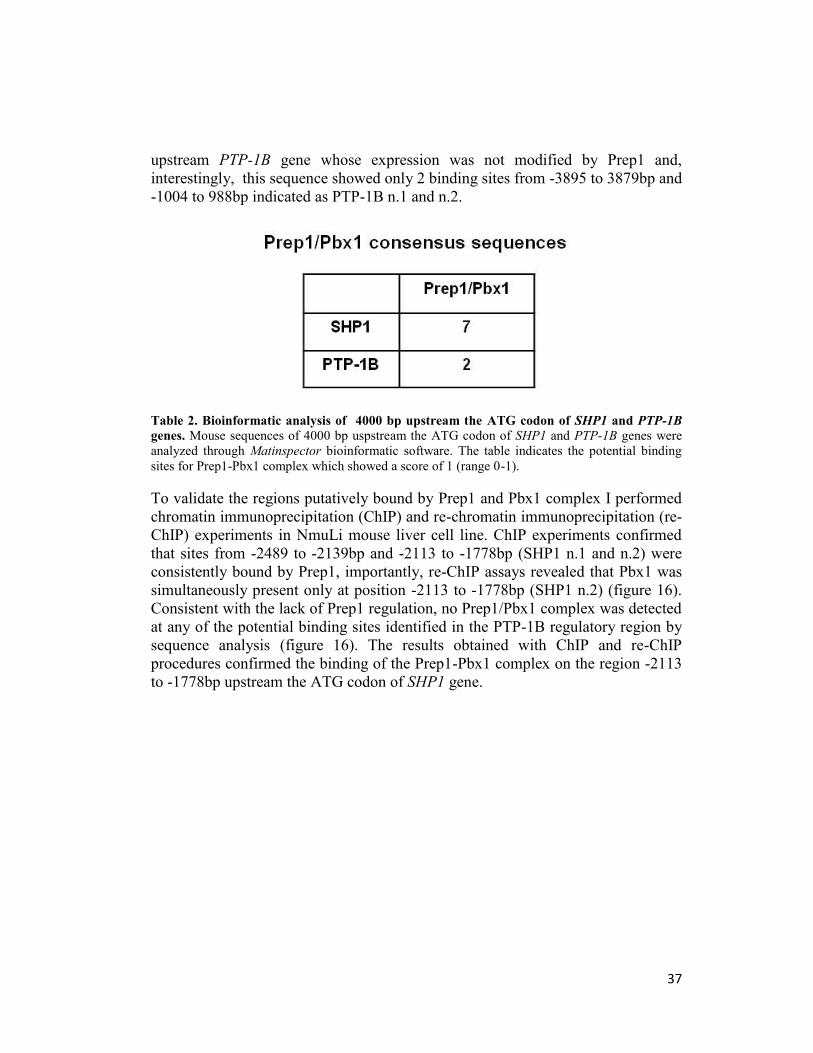
37
upstream PTP-1B gene whose expression was not modified by Prep1 and,
interestingly, this sequence showed only 2 binding sites from -3895 to 3879bp and
-1004 to 988bp indicated as PTP-1B n.1 and n.2.
Table 2. Bioinformatic analysis of 4000 bp upstream the ATG codon of SHP1 and PTP-1B
genes. Mouse sequences of 4000 bp uspstream the ATG codon of SHP1 and PTP-1B genes were
analyzed through Matinspector bioinformatic software. The table indicates the potential binding
sites for Prep1-Pbx1 complex which showed a score of 1 (range 0-1).
To validate the regions putatively bound by Prep1 and Pbx1 complex I performed
chromatin immunoprecipitation (ChIP) and re-chromatin immunoprecipitation (re-
ChIP) experiments in NmuLi mouse liver cell line. ChIP experiments confirmed
that sites from -2489 to -2139bp and -2113 to -1778bp (SHP1 n.1 and n.2) were
consistently bound by Prep1, importantly, re-ChIP assays revealed that Pbx1 was
simultaneously present only at position -2113 to -1778bp (SHP1 n.2) (figure 16).
Consistent with the lack of Prep1 regulation, no Prep1/Pbx1 complex was detected
at any of the potential binding sites identified in the PTP-1B regulatory region by
sequence analysis (figure 16). The results obtained with ChIP and re-ChIP
procedures confirmed the binding of the Prep1-Pbx1 complex on the region -2113
to -1778bp upstream the ATG codon of SHP1 gene.
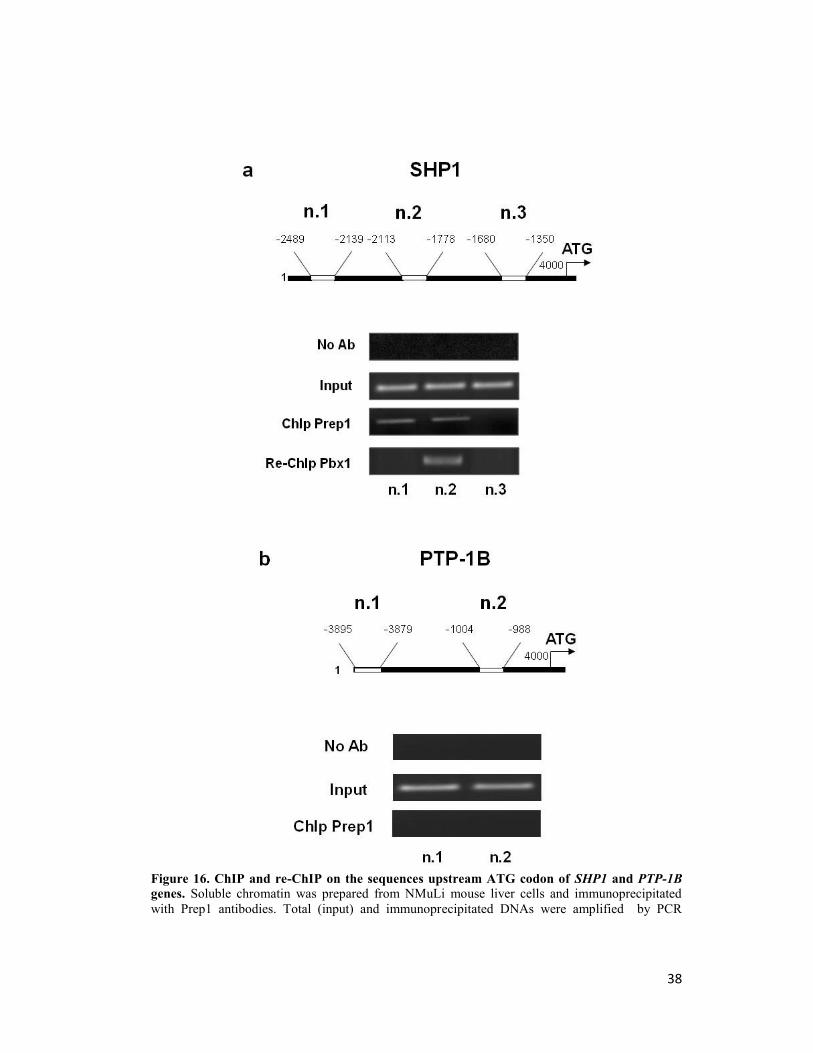
38
Figure 16. ChIP and re-ChIP on the sequences upstream ATG codon of SHP1 and PTP-1B
genes. Soluble chromatin was prepared from NMuLi mouse liver cells and immunoprecipitated
with Prep1 antibodies. Total (input) and immunoprecipitated DNAs were amplified by PCR
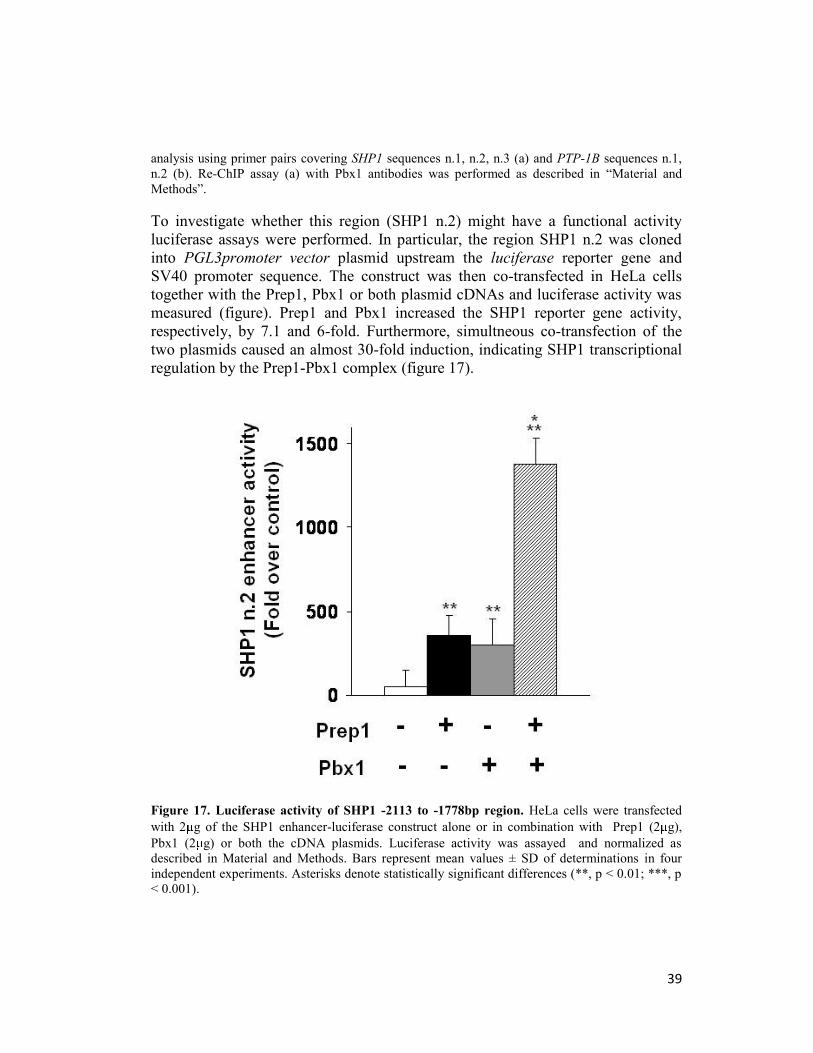
39
analysis using primer pairs covering SHP1 sequences n.1, n.2, n.3 (a) and PTP-1B sequences n.1,
n.2 (b). Re-ChIP assay (a) with Pbx1 antibodies was performed as described in “Material and
Methods”.
To investigate whether this region (SHP1 n.2) might have a functional activity
luciferase assays were performed. In particular, the region SHP1 n.2 was cloned
into PGL3promoter vector plasmid upstream the luciferase reporter gene and
SV40 promoter sequence. The construct was then co-transfected in HeLa cells
together with the Prep1, Pbx1 or both plasmid cDNAs and luciferase activity was
measured (figure). Prep1 and Pbx1 increased the SHP1 reporter gene activity,
respectively, by 7.1 and 6-fold. Furthermore, simultneous co-transfection of the
two plasmids caused an almost 30-fold induction, indicating SHP1 transcriptional
regulation by the Prep1-Pbx1 complex (figure 17).
Figure 17. Luciferase activity of SHP1 -2113 to -1778bp region. HeLa cells were transfected
with 2 g of the SHP1 enhancer-luciferase construct alone or in combination with Prep1 (2 g),
Pbx1 (2 g) or both the cDNA plasmids. Luciferase activity was assayed and normalized as
described in Material and Methods. Bars represent mean values ± SD of determinations in four
independent experiments. Asterisks denote statistically significant differences (**, p < 0.01; ***, p
< 0.001).
40
These results indicated that the transcription complex Prep1-Pbx1 may directly
bind consensus sequences upstream the ATG codon of SHP1 gene and directly up-
regulate its promoter activity. In particular, since the plasmid which I have used to
perform the luciferase assays already have a promoter sequence (SV40), the results
indicated that the sequence SHP1 n.2 which I have cloned upstream this promoter
has an enhancer activity in response to Prep1-Pbx1 complex. However, if the
region SHP1 n.2 also has a promoter activity is currently under investigation, but
the relatively large distance from the ATG codon (-2113 base pairs) makes
unfavourable this hypothesis.
Additional data in my possess collected by ChIP procedures and luciferase assays
indicated that SYP tyrosine phosphatases may also be directly regulated by Prep1-
Pbx1 complex but the results obtained after the silencing of the single
phosphatases (figure 15) induced me to focus my attention on SHP1 and its
transcriptional regulation. How and, above all, in which tissue SYP may contribute
in Prep1-dependent insulin action is actually another field of my research activity.
The quest of tyrosine phosphatases and their action is always been controversial
and debated. In this work I have identified a novel transcription complex which
may directly be involved in the regulation of at least 2 tyrosine phosphatases in
liver cells and in mouse liver which may modulate insulin action.
41
CONCLUSIONS
Insulin-dependent liver glucoregulatory function plays a central role in glucose
metabolism and it is known to be modulated by a number of different mechanisms.
In the present work I have focused my attention on Prep1 action on hepatic
glucose metabolism. I have described that Prep1 deficiency in animal models
improves insulin signaling in liver increasing glycogen storage and reducing
glucose output. These effects are paralleled by a significant reduction of
expression of SYP and SHP1 tyrosine phosphatases. In particular, expression of
SHP1 in animal and cellular models negatively correlates with insulin signaling.
This evidence led me to focus the research activity on the transcriptional
regulation of SHP1 by the Prep1-Pbx1 complex. In this context, I have shown that
Prep1-Pbx1 may enhance SHP1 gene transcription by acting on regulatory
sequences upstream the ATG codon.
In conclusion, these findings have contributed to underline the link between the
TALE proteins and insulin-resistance and/or diabetes and to clarify the role of
tyrosine phosphatases on hepatic insulin-resistance.
42
ACKNOWLEDGEMENTS
I’d like to say thanks to:
Prof. Francesco Beguinot, for giving me the opportunity to work in his lab,
believing in me and demonstrating to me everyday, by example, what devotion to
work means.
Prof. Pietro Formisano, for all the time he has spent helping me, for his ability to
be a guidance and for the pleasant atmosphere he is able to create even during the
worst moments of this work.
Dr. Francesco Oriente, for the time spent discussing data, helping me with
constructive suggestions and for passion for reaserch he transmitted me.
Dr. Serena Cabaro whose day by day help was essential to this work and to me.
Dr. Giuseppe Perruolo, Iolanda Esposito, Vittoria D’Esposito, Francesca Fiory
and everyone in the lab, everyone of you, one way or another, has given me
something special.
Dr. Anand Selvaraj (Anando), Ruth Gutierrez-Aguilar (Ruthita), Paulo Martins
(Brazilian guy), Stefano Fumagalli (Smoked Chikens), Massimiliano Olivieri (Uè
Uè Massimino), even if you are in a different Country, I will never forget the funny
moments spent togheter.
Gaetano Cecere, Carmela Passaro, Domenico Del Prete, Ivana Ferriol, quando
penso ad un vero amico mi spuntate in mente voi! La dimostrazione pratica del
significato di amicizia… Nei momenti più difficili della mia vita mi siete stati
vicini come dei fratelli! Vi voglio bene.
Ancora una volta… la mia famiglia… Mamma, Papà e Giuseppe, quello che sono
e che diventerò è stato e sarà soltanto merito vostro! Farete sempre parte dei miei
successi.
Last but not the least, Dr. Ginevra Botta, in questi anni ne abbiamo passate tante,
ci siamo persi per un istante e ci siamo ritrovati in un attimo… Mi dai la forza e
l’entusiasmo per andare avanti in questo lavoro… Insieme a te diventerò una
“stella”...

43
REFERENCES
Alessi DR, James SR, Downes CP, Holmes AB, Gaffney PR, Reese CB, Cohen P.
Characterization of a 3-phosphoinositide-dependent protein kinase which
phosphorylates and activates protein kinase B alpha. Curr. Biol. 1997; 7:261–269.
Arrandale, J.M., Gore-Willse, A., Rocks, S., Ren, J.M., Zhu, J., Davis, A.,
Livingston, J.N. & Rabin,D.U. Insulin signaling in mice expressing reduced levels
of Syp. J. Biol. Chem. 1996; 271:21353-21358.
Altshuler D, Hirschhorn JN, Klannemark M, Lindgren CM, Vohl MC, Nemesh J,
Lane CR, Schaffner SF, Bolk S, Brewer C, Tuomi T, Gaudet D, Hudson TJ, Daly
M, Groop L, Lander ES. The common PPARγ Pro12Ala polymorphism is
associated with decreased risk of type 2 diabetes. Nature Genet. 2000; 26:76–80.
Bergman R. N. & Ader, M. Free fatty acids and pathogenesis of type 2 diabetes
mellitus. Trends Endocrinol. Metab. 2000; 11:351–356.
Bergman R. N. New concepts in extracellular signaling for insulin action: the
single gateway hypothesis. Recent Prog. Horm. Res. 1997; 52:359–385.
Berthelsen J., Vandekerkhove J., Blasi F. Purification and characterization of
UEF3, a novel factor involved in the regulation of the urokinase and other AP-1
controlled promoters. J. Biol. Chem. 1996; 271:3822-3830.
Berthelsen J., Zappavigna V., Mavillo F., Blasi F. Prep1, a novel functional
partner of Pbx proteins. EMBO J. 1998; 17:1423-1433.
Berthelsen J., Kilstrup-Nielsen C., Blasi F., Mavillo F., Zappavigna V. The
subcellular lacalization of PBX1 and EXD proteins depends on nuclear import ans
export signals and is modulated by association with PREP1 and HTH. Gen. Dev.
1999; 13:946-953.
Boulton TG, Nye SH, Robbins DJ, Ip NY, Radziejewska E, Morgenbesser SD,
DePinho RA, Panayotatos N, Cobb MH, Yancopoulos GD. ERKs: a family of
protein-serine/threonine kinases that are activated and tyrosine phosphorylated in
response to insulin and NGF. Cell 1991; 65:663– 675.
Bousquet C, Delesque N, Lopez F, Saint-Laurent N, Estève JP, Bedecs K, Buscail
L, Vaysse N, Susini C. sst2 somatostatin receptor mediates negative regulation of
44
insulin receptor signaling through the tyrosine phosphatase SHP-1. J Biol. Chem.
1998; 273: 7099-7106.
Brendolan A., Ferretti E., Salsi V., Moses K., Quaggiù S., Blasi F., Cleary M.L.,
Selleri L. A Pbx1-dependent genetic and transcriptional network regulates spleen
ontogeny. Development 2005; 132:3113-3126.
Burglin T.R. Analysis of TALE superclass homeobox genes (MEIS, PBC, KNOX,
Iroquois, TGIF) reveals a novel domain conserved between plants and animals.
Nucleic Acids Res. 1997; 25:4173-4180.
Cross DA, Alessi DR, Vandenheede JR, McDowell HE, Hundal HS, Cohen P. The
inhibition of glycogen synthase kinase-3 by insulin or insulin-like growth factor 1
in the rat skeletal muscle cell line L6 is blocked by wortmannin, but not by
rapamycin: evidence that wortmannin blocks activation of the mitogen-activated
protein kinase pathway in L6 cells between Ras and Raf. Biochem. J. 1994;
303:21-27.
Diabetes Atlas 2006, 3rd ed., International Diabetes Federation, 2006.
Dubois MJ, Bergeron S, Kim HJ, Dombrowski L, Perreault M, Fournès B, Faure
R, Olivier M, Beauchemin N, Shulman GI, Siminovitch KA, Kim JK, Marette A.
The SHP-1 protein tyrosine phosphatase negatively modulates glucose
homeostasis. Nat. Med. 2006; 12:549-556.
Elchebly, M., Payette, P., Michaliszyn, E., Cromlish, W., Collins, S., Loy, A.L.,
Normandin, D., Cheng, A., Himms-Hagen, J., Chan, C.C., Ramachandran, C.,
Gresser, M.J., Tremblay, M.L. & Kennedy, B.P. Increased insulin sensitivity and
obesity resistance in mice lacking the protein tyrosine phosphatase-1B gene.
Science 1999; 283:1544-1548.
Featherstone M.. Hox proteins and their co-factors in transcriptional regulation.
Adv. Dev. Biol. Biochem. 2003; 13:1569-1799.
Feng, G.S. Shp-2 tyrosine phosphatase: signaling one cell or many. Exp. Cell Res.
1999; 253:47-54.
Ferretti E, Villaescusa JC, Di Rosa P, Fernandez-Diaz LC, Longobardi E, Mazzieri
R, Miccio A, Micali N, Selleri L, Ferrari G, Blasi F. Hypomorphic mutation of the
TALE gene Prep1 (pKnox1) causes a major reduction of Pbx and Meis proteins
and a pleiotropic embryonic phenotype. Mol. Cell. Biol. 2006; 26:5650-5662.

45
Frangioni, J.V., Beahm, P.H., Shifrin, V., Jost, C.A. & Neel, B.G. The
nontransmembrane tyrosine phosphatase PTP-1B localizes to the endoplasmic
reticulum via its 35 amino acid C-terminal sequence. Cell 1992; 68:545-560.
Goldstein, B.J., Bittner-Kowalczyk, A., White, M.F. & Harbeck,M. Tyrosine
dephosphorylation and deactivation of insulin receptor substrate-1 by protein-
tyrosine phosphatase 1B. Possible facilitation by the formation of a ternary
complex with the Grb2 adaptor protein. J. Biol. Chem. 2000; 275:4283-4289.
Goudet G., Delhalle S., Biemar F., Martial J.A., Peers B. Functional and
cooperative interactions between the homeodomain PDX1, Pbx, and Prep1 factors
on the somatostatin promoter. J. Biol. Chem. 1999; 274:4067-4073.
Gudmundsson J, Sulem P, Steinthorsdottir V, Bergthorsson JT, Thorleifsson G,
Manolescu A, Rafnar T, Gudbjartsson D, Agnarsson BA, Baker A, Sigurdsson A,
Benediktsdottir KR, Jakobsdottir M, Blondal T, Stacey SN, Helgason A,
Gunnarsdottir S, Olafsdottir A, Kristinsson KT, Birgisdottir B, Ghosh S,
Thorlacius S, Magnusdottir D, Stefansdottir G, Kristjansson K, Bagger Y,
Wilensky RL, Reilly MP, Morris AD, Kimber CH, Adeyemo A, Chen Y, Zhou J,
So WY, Tong PC, Ng MC, Hansen T, Andersen G, Borch-Johnsen K, Jorgensen
T, Tres A, Fuertes F, Ruiz-Echarri M, Asin L, Saez B, van Boven E, Klaver S,
Swinkels DW, Aben KK, Graif T, Cashy J, Suarez BK, van Vierssen Trip O,
Frigge ML, Ober C, Hofker MH, Wijmenga C, Christiansen C, Rader DJ, Palmer
CN, Rotimi C, Chan JC, Pedersen O, Sigurdsson G, Benediktsson R, Jonsson E,
Einarsson GV, Mayordomo JI, Catalona WJ, Kiemeney LA, Barkardottir RB,
Gulcher JR, Thorsteinsdottir U, Kong A, Stefansson K. Two variants on
chromosome 17 confer prostate cancer risk, and the one in TCF2 protects against
type 2 diabetes. Nature Genet. 2007; 39:977–983.
Herzig S., Fuzesi L., Knepel W. Heterodimeric Pbx-Prep1 homeodomain protein
binding to the glucagon gene restricting transcription in a cell type dependent
manner. J. Biol. Chem. 2000; 275:27989-27999.
Kahn CR. Insulin action, diabetogenes, and the cause of type II diabetes. Diabetes
1994; 43:1066-1084.
Kim S.K., Selleri L., Lee J.S., Zhang A.Y., Gu X., Jacobs Y., Cleary M.L. Pbx1
inactivation disrupts pancreas development and in Ipf1 deficient mice promotes
diabetes mellitus. Nat. Genet. 2002; 30: 430-435.

46
Klaman, L.D., Boss, O., Peroni, O.D., Kim, J.K., Martino, J.L., Zabolotny, J.M.,
Moghal, N., Lubkin, M., Kim, Y.B., Sharpe, A.H., Stricker-Krongrad, A.,
Shulman, G.I., Neel, B.G. & Kahn, B.B. Increased energy expenditure, decreased
adiposity, and tissue-specific insulin sensitivity in protein-tyrosine phospha- tase
1B-deficient mice. Mol. Cell. Biol. 2000; 20:5479-5489.
Kuhne, M.R., Zhao, Z., Rowles, J., Lavan, B.E., Shen, S.H., Fischer, E.H. &
Lienhard, G.E. Dephosphorylation of insulin receptor substrate 1 by the tyrosine
phosphatase PTP2C. J. Biol. Chem. 1994; 269:15833-15837.
Lietzke SE, Bose S, Cronin T, Klarlund J, Chawla A, Czech MP, Lambright DG.
Structural basis of 3-phosphoinositide recognition by pleckstrin homology
domains. Mol. Cell. 2000; 6:385–394.
Maegawa H, Hasegawa M, Sugai S, Obata T, Ugi S, Morino K, Egawa K, Fujita
T, Sakamoto T, Nishio Y, Kojima H, Haneda M, Yasuda H, Kikkawa R,
Kashiwagi A. Expression of a dominant negative SHP-2 in transgenic mice
induces insulin resistance. J. Biol. Chem. 1999; 274:30236–30243.
Michael MD, Kulkarni RN, Postic C, Previs SF, Shulman GI, Magnuson MA,
Kahn CR. Loss of insulin signaling in hepatocytes leads to severe insulin
resistance and progressive hepatic dysfunction. Mol. Cell. 2000; 6:87-97.
Moens CB, Selleri L. Hox cofactors in vertebrate development. Dev. Biol. 2006;
291:193-206.
Myers MG Jr, Backer JM, Sun XJ, Shoelson S, Hu P, Schlessinger J, Yoakim M,
Schaffhausen B, White MF. IRS-1 activates phosphatidylinositol 38-kinase by
associating with src homology 2 domains of p85. Proc Natl Acad Sci USA 1992;
89:10350–10354.
Nakae J., Park, B.C. & Accili, D. Insulin stimulates phosphorylation of the
forkhead transcription factor FKHR on serine 253 through a Wortmannin-sensitive
pathway. J. Biol. Chem. 1999; 274:15982–15985.
Newgard, C. B., Brady, M. J., O’Doherty, R. M. & Saltiel, A. R. Organizing
glucose disposal: emerging roles of the glycogen targeting subunits of protein
phosphatase-1. Diabetes 2000; 49: 1967–1977.
Nielsen EM, Hansen L, Carstensen B, Echwald SM, Drivsholm T, Glumer C,
Thorsteinsson B, Borch-Johnsen K, Hansen T, Pedersen O. The E23K variant of

47
Kir6.2 associates with impaired post-OGTT serum insulin response and increased
risk of type 2 diabetes. Diabetes 2003; 52:573-577.
Nourse J., Mellentin J.D., Galili N., Wilkinson J., Stambridge E., Smith S.D.,
Cleary M.L. Chromosomal traslocation t(1;19) results in synthesis of a homeobox
fusion mRNA that codes for a potential chimeric transcription factor. Cell 1990;
60:535-545.
Owen KR, McCarthy MI. Genetics of type 2 diabetes. Curr. Op. Gen. Dev. 2007;
17:239–244.
Oriente F, Fernandez Diaz LC, Miele C, Iovino S, Mori S, Diaz VM, Troncone G,
Cassese A, Formisano P, Blasi F, Beguinot F. Prep1 deficiency induces protection
from diabetes and increased insulin sensitivity through a p160-mediated
mechanism. Mol. Cell. Biol. 2008; 28:5634-5645.
Patti ME, Kahn CR. The insulin receptor-a critical link in glucose homeostasis and
insulin action. J. Basic Clin. Physiol. Pharmacol. 1998; 9:89–109.
Pessin JE, Saltiel AR. Signaling pathways in insulin action: molecular targets of
insulin resistance. J. Cli. Invest. 2000; 106:165–169.
Pickup JC, Williams G, editors.Textbook of Diabetes: selected chapters. 3rd ed.
Oxford: Blackwell Publishing, 2005.
Pilkis, S. J. & Granner, D. K. Molecular physiology of the regulation of hepatic
gluconeogenesis and glycolysis. Annu. Rev. Physiol. 1992; 54:885–909.
Piper D.E., Batchelor A.H., Chang C. P., Cleary M. L., Wolberg C. Structure of
HoxB1-Pbx heterodimer bound to DNA: role of the exapaptide and a fourth
homeodomain helix in complex formation. Cell 1999; 96:587-597.
Saltiel AR, Kahn CR. Insulin signalling and the regulation of glucose and
lipidmetabolism. Nature 2001; 414:799-806.
Sandhu MS, Weedon MN, Fawcett KA, Wasson J, Debenham SL, Daly A, Lango
H, Frayling TM, Neumann RJ, Sherva R, Blech I, Pharoah PD, Palmer CN,
Kimber C, Tavendale R, Morris AD, McCarthy MI, Walker M, Hitman G, Glaser
B, Permutt MA, Hattersley AT, Wareham NJ, Barroso I. Common variants in
WFS1 confer risk of type 2 diabetes. Nature Genet. 2007; 39:951–953.
48
Saxton, T.M., Henkemeyer, M., Gasca, S., Shen, R., Rossi, D.J., Shalaby, F.,
Feng,G.S.&Pawson, T. Abnormalmesoderm patterning in mouse embryos mutant
for the SH2 tyrosine phosphatase Shp-2. EMBO J. 1997; 16:2352-2364.
Selleri L., Depew M.J., Jacobs Y., Chanda S.K., Tsang K.Y., Cheah K.S.,
Rubenstein J.L., O’Gorman S., Cleary M. Requirement for Pbx1 in skeletal
patterning and programming chondrocyte proliferation and differentiation.
Development 2001; 128:3543-3557.
Shepherd PR, Nave BT, Siddle K. Insulin stimulation of glycogen synthesisand
glycogen synthase activity is blocked by wortmannin and rapamycin in 3T3-L1
adipocytes: evidence for the involvement of phosphoinositide 3-kinase and p70
ribosomal protein-S6 kinase. Biochem. J. 1995; 305:25–28.
Standaert ML, Galloway L, Karnam P, Bandyopadhyay G, Moscat J, Farese RV.
Protein kinase C-δ as a downstream effector of phosphatidylinositol 3- kinase
during insulin stimulation in rat adipocytes. Potential role in glucose transport. J.
Biol. Chem. 1997; 272:30075–30082.
Sutherland, C., O’Brien, R. M. & Granner, D. K. New connections in the
regulation of PEPCK gene expression by insulin. Phil. Trans. R. Soc. Lond. 1996;
351:191–199.
Uchida T, Matozaki T, Noguchi T, Yamao T, Horita K, Suzuki T, Fujioka Y,
Sakamoto C, Kasuga M. Insulin stimulates the phosphorylation of Tyr538 and the
catalytic activity of PTP1C, a protein tyrosine phosphatase with Src homology-2
domains. J. Biol. Chem. 1994; 269:12220-12228.
White MF. The IRS-signalling system: a network of docking proteins that mediate
insulin action. Mol Cell Biochem 1998; 182:3–11.
Yoon JC, Puigserver P, Chen G, Donovan J, Wu Z, Rhee J, Adelmant G, Stafford
J, Kahn CR, Granner DK, Newgard CB, Spiegelman BM. Control of hepatic
gluconeogenesis through the transcriptional coactivator PGC-1. Nature 2001;
413:131-8.
Phorbol Esters Induce Intracellular Accumulation of theAnti-apoptotic Protein PED/PEA-15 by PreventingUbiquitinylation and Proteasomal Degradation*
Received for publication, August 31, 2006, and in revised form, December 21, 2006 Published, JBC Papers in Press, January 16, 2007, DOI 10.1074/jbc.M608359200
Anna Perfetti, Francesco Oriente, Salvatore Iovino, A. Teresa Alberobello, Alessia P. M. Barbagallo,Iolanda Esposito, Francesca Fiory, Raffaele Teperino, Paola Ungaro, Claudia Miele, Pietro Formisano1,and Francesco BeguinotFrom the Dipartimento di Biologia e Patologia cellulare e Molecolare (DBPCM) and Istituto di Endocrinologia ed OncologiaSperimentale del Consiglio Nazionale delle Ricerche, Federico II University of Naples, Via Pansini 5, 80131 Naples, Italy
Phosphoprotein enriched in diabetes/phosphoprotein en-riched in astrocytes (PED/PEA)-15 is an anti-apoptotic proteinwhose expression is increased in several cancer cells and follow-ing experimental skin carcinogenesis. Exposure of untrans-fected C5N keratinocytes and transfected HEK293 cells tophorbol esters (12-O-tetradecanoylphorbol-13-acetate (TPA))increased PED/PEA-15 cellular content and enhanced itsphosphorylation at serine 116 in a time-dependent fashion.Ser-116 3 Gly (PEDS116G) but not Ser-1043 Gly (PEDS104G)substitution almost completely abolished TPA regulation ofPED/PEA-15 expression. TPA effect was also prevented by anti-sense inhibition of protein kinase C (PKC)-� and by the expres-sion of a dominant-negative PKC-� mutant cDNA in HEK293cells. Similar to long term TPA treatment, overexpression ofwild-type PKC-� increased cellular content and phosphoryla-tion of WT-PED/PEA-15 and PEDS104G but not of PEDS116G.These events were accompanied by the activation of Ca2�-cal-modulin kinase (CaMK) II and prevented by the CaMK blocker,KN-93. At variance, the proteasome inhibitor lactacystin mim-icked TPA action on PED/PEA-15 intracellular accumulationand reverted the effects of PKC-� and CaMK inhibition. More-over, we show that PED/PEA-15 bound ubiquitin in intact cells.PED/PEA-15 ubiquitinylation was reduced by TPA and PKC-�overexpression and increased by KN-93 and PKC-� block. Fur-thermore, in HEK293 cells expressing PEDS116G, TPA failed toprevent ubiquitin-dependent degradation of the protein.Accordingly, in the same cells, TPA-mediated protection fromapoptosis was blunted. Taken together, our results indicate thatTPA increasesPED/PEA-15 expression at thepost-translationallevel by inducing phosphorylation at serine 116 and preventingubiquitinylation and proteosomal degradation.
Cancer cells feature both excessive proliferation and aban-donment of the ability to die (1, 2). Thus, alterations of genesinvolved in the control of apoptosis have been implicated in anumber of human malignancies. In certain lymphomas, forexample, cell death is blocked by excessive production of theanti-apoptotic factor Bcl-2 (2). Similarly, some tumors preventapoptosis by up-regulating the expression of anti-apoptoticdeath effector domain (DED)2-containing proteins, which, inturn, inhibit Fas from conveying signals to the deathmachinery(3).Phosphoprotein enriched in diabetes/phosphoprotein
enriched in astrocytes (PED/PEA)-15 is a DED-containing pro-tein originally identified in astrocytes as a protein kinase C(PKC) substrate (4–6) and found overexpressed in insulin tar-get tissues of patients with type 2 diabetes (7). Raised PED/PEA-15 levels have also been detected in several human tumorcell lines (7–9). A growing body of evidence indicates thatincreased PED/PEA-15 expression may provide a mechanismto escape cell death upon a number of pro-apoptotic stimuli(10–14).Moreover, in transgenicmice, overexpression of PED/PEA-15 enhances the susceptibility to develop experimentallyinduced skin tumors (15). The molecular mechanism of PED/PEA-15 anti-apoptotic action has been extensively investi-gated. In several cell types, PED/PEA-15 blocks Fas- and tumornecrosis factor-�-induced apoptosis by competing with itsDEDwith the interaction between FADD and caspase 8 (10). Inaddition, in several cell lines of human glioma, PED/PEA-15inhibits tumor necrosis factor-related apoptosis-inducingligand (TRAIL)-induced apoptosis, thereby generating resist-ance to this anti-neoplastic agent (9). At variance with otheranti-apoptotic proteins inhibiting caspase 8 activation viaFADD trapping (3), PED/PEA-15 overexpression also preventsapoptosis induced by growth factors deprivation, UV exposure,and osmotic stimuli (11, 13).Besides the anti-apoptotic function, a role for PED/PEA-15
in restraining cell proliferation has been proposed (16–20). It* This work was supported by Grant LSHM-CT-2004-512013 from the Euro-
pean Community FP6 EUGENE2, grants from the Associazione Italiana perla Ricerca sul Cancro (AIRC) (to F. B. and P. F.) and the Ministerodell’Universita e della Ricerca Scientifica Grant PRIN (to F. B. and P. F.) andGrant FIRB RBNE0155LB (to F. B.), and by a grant from Telethon – Italy. Thecosts of publication of this article were defrayed in part by the payment ofpage charges. This article must therefore be hereby marked “advertise-ment” in accordance with 18 U.S.C. Section 1734 solely to indicate this fact.
1 To whom correspondence should be addressed. Dipartimento di Biologia ePatologia Cellulare e Molecolare, Universita di Napoli “Federico II,” Via S.Pansini 5, 80131 Naples, Italy. Tel.: 39-081-7463608; Fax: 39-081-7463235;E-mail: [email protected].
2 The abbreviations used are: DED, death effector domain; PED/PEA, phos-phoprotein enriched in diabetes/phosphoprotein enriched in astrocytes;TPA, 12-O-tetradecanoylphorbol-13-acetate; PKB, protein kinase B; PKC,protein kinase C; CaMK, calmodulin kinase; FADD, Fas-associated deathdomain; HA, hemagglutinin; DMEM, Dulbecco’s modified Eagle’s medium;RT, reverse transcription; PBS, phosphate-buffered saline; Ab, antibody;ASO, antisense oligonucleotides; DN, dominant-negative; WT, wild type;SO, scrambled.
THE JOURNAL OF BIOLOGICAL CHEMISTRY VOL. 282, NO. 12, pp. 8648 –8657, March 23, 2007© 2007 by The American Society for Biochemistry and Molecular Biology, Inc. Printed in the U.S.A.
8648 JOURNAL OF BIOLOGICAL CHEMISTRY VOLUME 282 • NUMBER 12 • MARCH 23, 2007
at UN
IVE
RS
ITA
DI N
AP
OLI on January 28, 2008
ww
w.jbc.org
Dow
nloaded from
has been described that PED/PEA-15 directly binds extracellu-lar signal-regulated kinase 2 (ERK2) and RSK2 and preventstheir nuclear translocation and transduction of biologicaleffects (16–19). Together with the anti-apoptotic effect, thisaction may expand cellular senescence (20).PED/PEA-15 is a phosphorylated protein (4, 5). It has
recently been shown that PED/PEA-15 phosphorylation at spe-cific sites controls the ability of the protein to form complexeswith specific intracellular interactors (21). PED/PEA-15 serinephosphorylation has also been shown to enhance protein sta-bility (22). Several kinases were evidenced to phosphorylatePED/PEA-15 at specific serines. Ser-104 represents the maintarget for PKC phosphorylation (4, 5, 23), whereas Ser-116 hasbeen shown to be a target site for both Ca2�-calmodulin kinase(CaMK) II (23) and protein kinase B (PKB)/Akt (22). However,the precise function of these phosphorylation sites in control-ling PED/PEA-15 expression is currently unknown. Recent evi-dence indicates that abnormal accumulation of PED/PEA-15maylead to derangement of cell growth andmetabolism (15, 24, 25).In this study, we have shown that phorbol esters, which are
tumor promoters and inhibitors of insulin action, up-regulatePED/PEA-15 expression by inhibiting its ubiquitinylation andproteasomal targeting. This effect involves activation ofCaMKII and subsequent phosphorylation of PED/PEA-15 atSer-116. PKC-� activity is required for phorbol ester-inducedactivation of CaMKII and for the regulation of PED/PEA-15degradation.
EXPERIMENTAL PROCEDURES
Materials—Media, sera, and antibiotics for cell culture andthe Lipofectamine reagent were purchased from Invitrogen(Paisley, UK). Rabbit polyclonal PKC-�, PKC-�, PKC-�, PKC-�,and phospho-PKC antibodies were from Santa Cruz Biotech-nology (Santa Cruz, CA). PED/PEA-15, p-Ser-104PED, andp-Ser-116PEDand antibodies have been previously reported (7,22). Mouse monoclonal polyubiquitinylated protein antibodies(FK1) were from Biomol International. Mouse monoclonal HAantibody were from Roche Applied Science. PhosphorothioatePKC-�, PKC-�, PKC-�, PKC-� antisense and scrambled con-trol oligonucleotides have been previously described (26–28)and were synthesized by PRIMM (Milan, Italy). PKC-� wild-type and dominant-negative constructs were kindly providedbyDr.M. S.Marber (St. ThomasHospital, London,UK) andDr.S.Gutkind (NCI, National Institutes of Health, Bethesda, MD),respectively. SDS-PAGE reagents were purchased from Bio-Rad. Western blotting and ECL reagents and radiochemicalswere from Amersham Biosciences. All other reagents werefrom Sigma.Plasmid Preparation, Cell Culture, and Transfection—The
PEDS104G andPEDS116Gmutant cDNAswere prepared by usingpcDNAIIIPEDY1 cDNA (pcDNAIII containing His6-Myc-tagged PED/PEA-15) as template with the site-directedmutagenesis kit by Promega according to the manufacturer’sinstructions. Stable expression of the mutants and wild-typePEDY1 cDNAs in HEK293 cells (293PEDY1) was achieved asreported in Condorelli et al. (11). The cells were cultured inDulbecco’s modified Eagle’s medium (DMEM) supplementedwith 10% fetal calf serum, 100 IU of penicillin/ml, 100 IU of
streptomycin/ml, and 2% L-glutamine in a humidified CO2incubator. Transient transfection of phosphorothioate oligo-nucleotides and plasmid DNA in HEK293 cells was accom-plished by using the Lipofectamine method according to themanufacturer’s instructions. Briefly, the cells were cultured in60-mm-diameter dishes and incubated for 24 h in serum-freeDMEM supplemented with 3 �g of cDNA and 15 �l of Lipo-fectamine reagent. An equal volume of DMEM supplementedwith 20% fetal calf serum was then added for 5 h followed byreplacement with DMEM supplemented with 10% serum for24 h before the assays.Western Blot Analysis—ForWestern blotting, cells were sol-
ubilized in lysis buffer (50mMHEPES (pH 7.5), 150mMNaCl, 4mM EDTA, 10 mM Na4PO7, 2 mM Na3VO4, 100 mM NaF, 10%glycerol, 1%TritonX-100, 1mMphenylmethylsulfonyl fluoride,100mg of aprotinin/ml, 1mM leupeptin) for 60min at 4 °C. Celllysates were clarified at 5,000 � g for 15 min. Solubilized pro-teins were then separated by SDS-PAGE and transferred onto0.45-�m-pore size Immobilon-P membranes (Millipore, Bed-ford, MA). Upon incubation with the primary (PED, etc.) anti-body and secondary antibodies, immunoreactive bands weredetected by ECL according to the manufacturer’s instructions.Real-time RT-PCR Analysis—Total cellular RNA was iso-
lated from C5N cells by the use of RNeasy kit (Qiagen) accord-ing to the manufacturer’s instructions. For real-time RT-PCR analysis, 1 �g of cell RNA was reverse-transcribed usingSuperScript II reverse transcriptase (Invitrogen). PCR reactionmixes were analyzed using SYBRGreenmix (Invitrogen). Reac-tions were performed using Platinum SYBRGreen quantitativePCR Super-UDG using an iCycler IQmulticolor real-time PCRdetection system (Bio-Rad). All reactions were performed intriplicate, and �-actin was used as an internal standard. Primersequences used were as follows: PED/PEA-15, forward, 5�-TTCCCGCTGTTCCCTTAGG-3�, and PED/PEA-15, reverse5�-TCTGGCTCATCCGCATCC-3�.Immunoprecipitation of PED/PEA-15—Cells grown in
100-mmPetri disheswere treated as indicated andwashed oncewith ice-cold PBS and solubilized in lysis buffer for 2 h at 4 °C.Then, lysates were clarified by centrifugation at 5,000� g for 20min. 500 �g of protein lysates was immunoprecipitated withMyc or PED antibodies for 16 h. The precipitates were incu-bated with protein G-Sepharose beads at 4 °C for 1 h with shak-ing. Beads were precipitated by centrifugation at 1,000� g for 5min at 4 °C and washed five times with ice-cold washing buffer.After the final wash, the pellets were resuspended in 30�l of 1�SDS electrophoresis buffer and heated to 95 °C for 5 min priorto protein separation by 15% SDS-PAGE.Western blot analysiswas performed as described above.Purification of Ubiquitin-PED/PEA-15 Conjugates—Cellular
ubiquitinylation assay was performed as described by Musti etal. (29). Briefly, 24 h after transfection, cells expressing His-tagged-PED/PEA-15 (PED/PEA-15Y1) and HA-ubiquitin wereharvested in 2ml of 6M guanidium-HCl, 0.1 MNa2HPO4/NaH2PO4 (pH 8) plus 5 mM imidazole/100-mm dish and sonicatedwith a Branson micro-tipped sonifier for 30 s to reduce viscos-ity. Lysatesweremixed on a rotatorwith 0.2ml (settled volume)of Ni2�-nitrilotriacetic acid-agarose (Qiagen) for 4 h at roomtemperature. The slurry was applied to a Bio-Rad Econo-Col-
Regulation of PED/PEA-15 Ubiquitinylation
MARCH 23, 2007 • VOLUME 282 • NUMBER 12 JOURNAL OF BIOLOGICAL CHEMISTRY 8649
at UN
IVE
RS
ITA
DI N
AP
OLI on January 28, 2008
ww
w.jbc.org
Dow
nloaded from
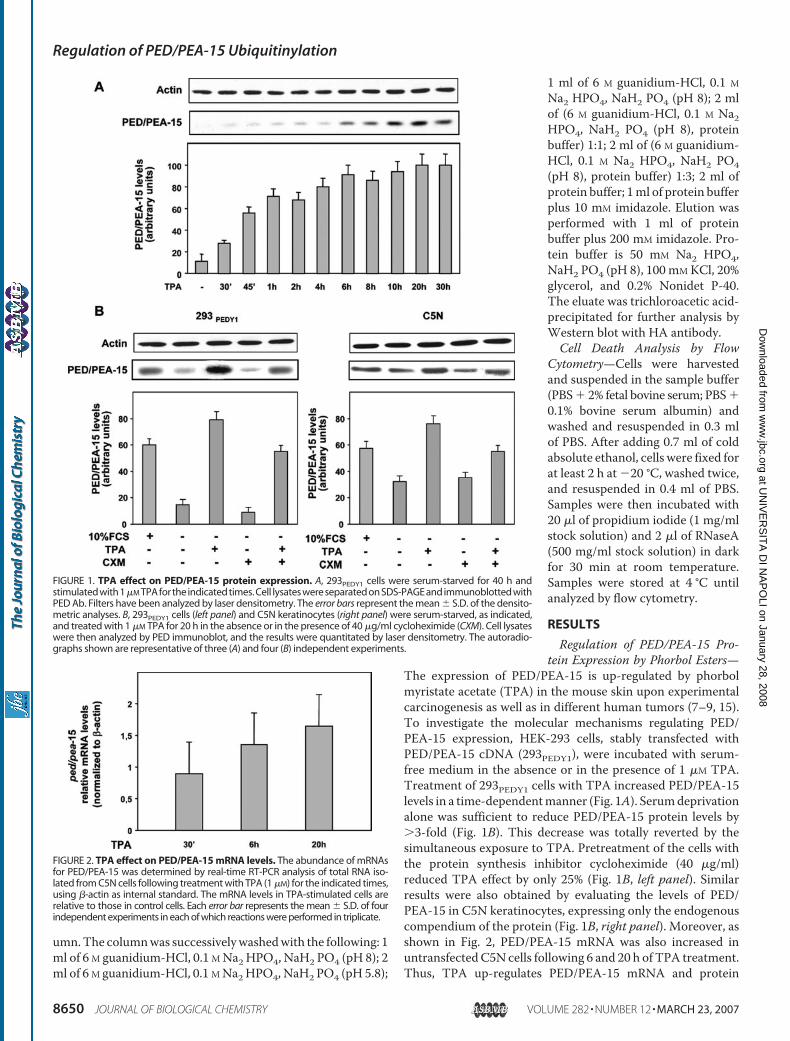
umn.The columnwas successivelywashedwith the following: 1ml of 6 M guanidium-HCl, 0.1 MNa2HPO4, NaH2 PO4 (pH 8); 2ml of 6 M guanidium-HCl, 0.1 MNa2HPO4, NaH2 PO4 (pH 5.8);
1 ml of 6 M guanidium-HCl, 0.1 MNa2 HPO4, NaH2 PO4 (pH 8); 2 mlof (6 M guanidium-HCl, 0.1 M Na2HPO4, NaH2 PO4 (pH 8), proteinbuffer) 1:1; 2 ml of (6 M guanidium-HCl, 0.1 M Na2 HPO4, NaH2 PO4(pH 8), protein buffer) 1:3; 2 ml ofprotein buffer; 1ml of protein bufferplus 10 mM imidazole. Elution wasperformed with 1 ml of proteinbuffer plus 200 mM imidazole. Pro-tein buffer is 50 mM Na2 HPO4,NaH2 PO4 (pH 8), 100 mMKCl, 20%glycerol, and 0.2% Nonidet P-40.The eluate was trichloroacetic acid-precipitated for further analysis byWestern blot with HA antibody.Cell Death Analysis by Flow
Cytometry—Cells were harvestedand suspended in the sample buffer(PBS� 2% fetal bovine serum; PBS�0.1% bovine serum albumin) andwashed and resuspended in 0.3 mlof PBS. After adding 0.7 ml of coldabsolute ethanol, cells were fixed forat least 2 h at �20 °C, washed twice,and resuspended in 0.4 ml of PBS.Samples were then incubated with20 �l of propidium iodide (1 mg/mlstock solution) and 2 �l of RNaseA(500 mg/ml stock solution) in darkfor 30 min at room temperature.Samples were stored at 4 °C untilanalyzed by flow cytometry.
RESULTS
Regulation of PED/PEA-15 Pro-tein Expression by Phorbol Esters—
The expression of PED/PEA-15 is up-regulated by phorbolmyristate acetate (TPA) in the mouse skin upon experimentalcarcinogenesis as well as in different human tumors (7–9, 15).To investigate the molecular mechanisms regulating PED/PEA-15 expression, HEK-293 cells, stably transfected withPED/PEA-15 cDNA (293PEDY1), were incubated with serum-free medium in the absence or in the presence of 1 �M TPA.Treatment of 293PEDY1 cells with TPA increased PED/PEA-15levels in a time-dependentmanner (Fig. 1A). Serumdeprivationalone was sufficient to reduce PED/PEA-15 protein levels by�3-fold (Fig. 1B). This decrease was totally reverted by thesimultaneous exposure to TPA. Pretreatment of the cells withthe protein synthesis inhibitor cycloheximide (40 �g/ml)reduced TPA effect by only 25% (Fig. 1B, left panel). Similarresults were also obtained by evaluating the levels of PED/PEA-15 in C5N keratinocytes, expressing only the endogenouscompendium of the protein (Fig. 1B, right panel). Moreover, asshown in Fig. 2, PED/PEA-15 mRNA was also increased inuntransfectedC5N cells following 6 and 20 h of TPA treatment.Thus, TPA up-regulates PED/PEA-15 mRNA and protein
FIGURE 1. TPA effect on PED/PEA-15 protein expression. A, 293PEDY1 cells were serum-starved for 40 h andstimulated with 1�M TPA for the indicated times. Cell lysates were separated on SDS-PAGE and immunoblotted withPED Ab. Filters have been analyzed by laser densitometry. The error bars represent the mean � S.D. of the densito-metric analyses. B, 293PEDY1 cells (left panel) and C5N keratinocytes (right panel) were serum-starved, as indicated,and treated with 1 �M TPA for 20 h in the absence or in the presence of 40 �g/ml cycloheximide (CXM). Cell lysateswere then analyzed by PED immunoblot, and the results were quantitated by laser densitometry. The autoradio-graphs shown are representative of three (A) and four (B) independent experiments.
FIGURE 2. TPA effect on PED/PEA-15 mRNA levels. The abundance of mRNAsfor PED/PEA-15 was determined by real-time RT-PCR analysis of total RNA iso-lated from C5N cells following treatment with TPA (1 �M) for the indicated times,using �-actin as internal standard. The mRNA levels in TPA-stimulated cells arerelative to those in control cells. Each error bar represents the mean � S.D. of fourindependent experiments in each of which reactions were performed in triplicate.
Regulation of PED/PEA-15 Ubiquitinylation
8650 JOURNAL OF BIOLOGICAL CHEMISTRY VOLUME 282 • NUMBER 12 • MARCH 23, 2007
at UN
IVE
RS
ITA
DI N
AP
OLI on January 28, 2008
ww
w.jbc.org
Dow
nloaded from
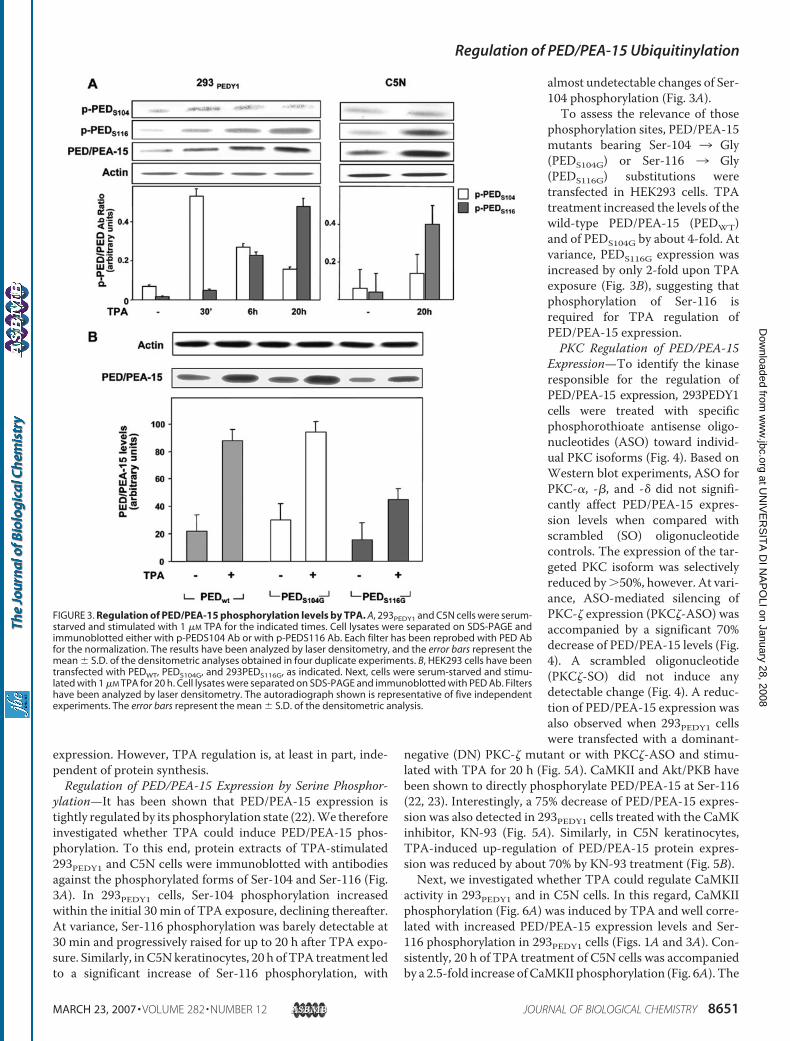
expression. However, TPA regulation is, at least in part, inde-pendent of protein synthesis.Regulation of PED/PEA-15 Expression by Serine Phosphor-
ylation—It has been shown that PED/PEA-15 expression istightly regulated by its phosphorylation state (22).We thereforeinvestigated whether TPA could induce PED/PEA-15 phos-phorylation. To this end, protein extracts of TPA-stimulated293PEDY1 and C5N cells were immunoblotted with antibodiesagainst the phosphorylated forms of Ser-104 and Ser-116 (Fig.3A). In 293PEDY1 cells, Ser-104 phosphorylation increasedwithin the initial 30 min of TPA exposure, declining thereafter.At variance, Ser-116 phosphorylation was barely detectable at30 min and progressively raised for up to 20 h after TPA expo-sure. Similarly, inC5Nkeratinocytes, 20 h of TPA treatment ledto a significant increase of Ser-116 phosphorylation, with
almost undetectable changes of Ser-104 phosphorylation (Fig. 3A).To assess the relevance of those
phosphorylation sites, PED/PEA-15mutants bearing Ser-104 3 Gly(PEDS104G) or Ser-116 3 Gly(PEDS116G) substitutions weretransfected in HEK293 cells. TPAtreatment increased the levels of thewild-type PED/PEA-15 (PEDWT)and of PEDS104G by about 4-fold. Atvariance, PEDS116G expression wasincreased by only 2-fold upon TPAexposure (Fig. 3B), suggesting thatphosphorylation of Ser-116 isrequired for TPA regulation ofPED/PEA-15 expression.PKC Regulation of PED/PEA-15
Expression—To identify the kinaseresponsible for the regulation ofPED/PEA-15 expression, 293PEDY1cells were treated with specificphosphorothioate antisense oligo-nucleotides (ASO) toward individ-ual PKC isoforms (Fig. 4). Based onWestern blot experiments, ASO forPKC-�, -�, and -� did not signifi-cantly affect PED/PEA-15 expres-sion levels when compared withscrambled (SO) oligonucleotidecontrols. The expression of the tar-geted PKC isoform was selectivelyreduced by�50%, however. At vari-ance, ASO-mediated silencing ofPKC-� expression (PKC�-ASO) wasaccompanied by a significant 70%decrease of PED/PEA-15 levels (Fig.4). A scrambled oligonucleotide(PKC�-SO) did not induce anydetectable change (Fig. 4). A reduc-tion of PED/PEA-15 expression wasalso observed when 293PEDY1 cellswere transfected with a dominant-
negative (DN) PKC-� mutant or with PKC�-ASO and stimu-lated with TPA for 20 h (Fig. 5A). CaMKII and Akt/PKB havebeen shown to directly phosphorylate PED/PEA-15 at Ser-116(22, 23). Interestingly, a 75% decrease of PED/PEA-15 expres-sion was also detected in 293PEDY1 cells treated with the CaMKinhibitor, KN-93 (Fig. 5A). Similarly, in C5N keratinocytes,TPA-induced up-regulation of PED/PEA-15 protein expres-sion was reduced by about 70% by KN-93 treatment (Fig. 5B).Next, we investigated whether TPA could regulate CaMKII
activity in 293PEDY1 and in C5N cells. In this regard, CaMKIIphosphorylation (Fig. 6A) was induced by TPA and well corre-lated with increased PED/PEA-15 expression levels and Ser-116 phosphorylation in 293PEDY1 cells (Figs. 1A and 3A). Con-sistently, 20 h of TPA treatment of C5N cells was accompaniedby a 2.5-fold increase ofCaMKII phosphorylation (Fig. 6A). The
FIGURE 3. Regulation of PED/PEA-15 phosphorylation levels by TPA. A, 293PEDY1 and C5N cells were serum-starved and stimulated with 1 �M TPA for the indicated times. Cell lysates were separated on SDS-PAGE andimmunoblotted either with p-PEDS104 Ab or with p-PEDS116 Ab. Each filter has been reprobed with PED Abfor the normalization. The results have been analyzed by laser densitometry, and the error bars represent themean � S.D. of the densitometric analyses obtained in four duplicate experiments. B, HEK293 cells have beentransfected with PEDWT, PEDS104G, and 293PEDS116G, as indicated. Next, cells were serum-starved and stimu-lated with 1 �M TPA for 20 h. Cell lysates were separated on SDS-PAGE and immunoblotted with PED Ab. Filtershave been analyzed by laser densitometry. The autoradiograph shown is representative of five independentexperiments. The error bars represent the mean � S.D. of the densitometric analysis.
Regulation of PED/PEA-15 Ubiquitinylation
MARCH 23, 2007 • VOLUME 282 • NUMBER 12 JOURNAL OF BIOLOGICAL CHEMISTRY 8651
at UN
IVE
RS
ITA
DI N
AP
OLI on January 28, 2008
ww
w.jbc.org
Dow
nloaded from
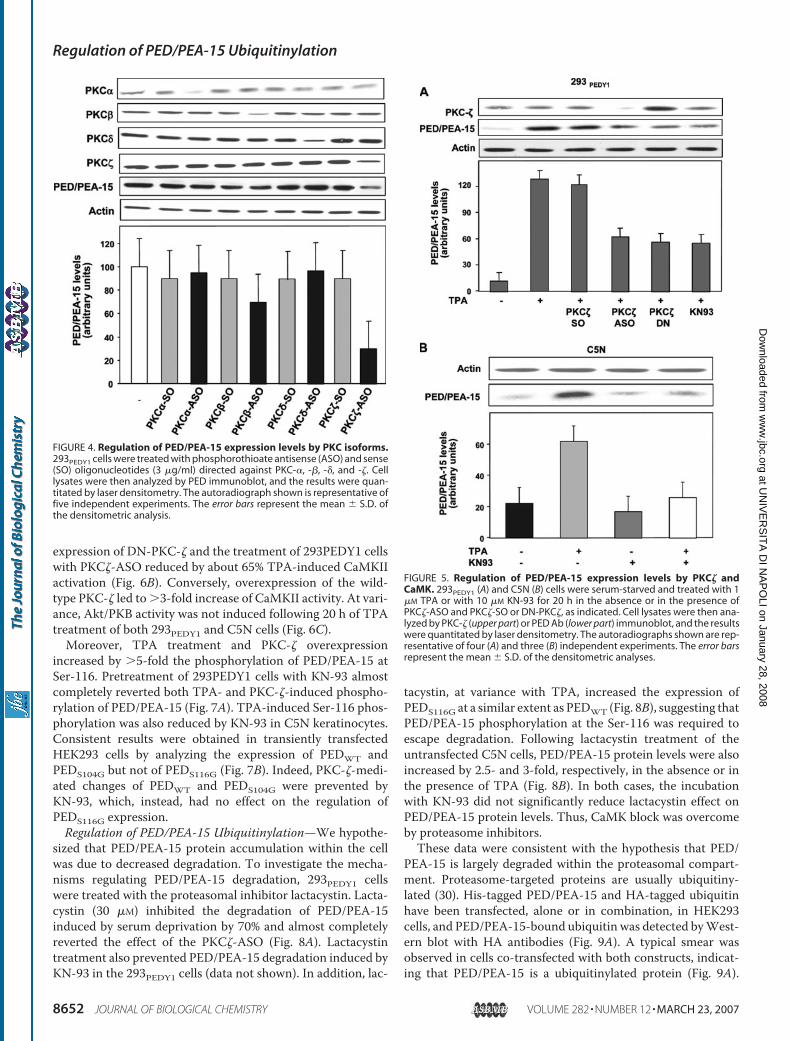
expression of DN-PKC-� and the treatment of 293PEDY1 cellswith PKC�-ASO reduced by about 65% TPA-induced CaMKIIactivation (Fig. 6B). Conversely, overexpression of the wild-type PKC-� led to �3-fold increase of CaMKII activity. At vari-ance, Akt/PKB activity was not induced following 20 h of TPAtreatment of both 293PEDY1 and C5N cells (Fig. 6C).Moreover, TPA treatment and PKC-� overexpression
increased by �5-fold the phosphorylation of PED/PEA-15 atSer-116. Pretreatment of 293PEDY1 cells with KN-93 almostcompletely reverted both TPA- and PKC-�-induced phospho-rylation of PED/PEA-15 (Fig. 7A). TPA-induced Ser-116 phos-phorylation was also reduced by KN-93 in C5N keratinocytes.Consistent results were obtained in transiently transfectedHEK293 cells by analyzing the expression of PEDWT andPEDS104G but not of PEDS116G (Fig. 7B). Indeed, PKC-�-medi-ated changes of PEDWT and PEDS104G were prevented byKN-93, which, instead, had no effect on the regulation ofPEDS116G expression.Regulation of PED/PEA-15 Ubiquitinylation—We hypothe-
sized that PED/PEA-15 protein accumulation within the cellwas due to decreased degradation. To investigate the mecha-nisms regulating PED/PEA-15 degradation, 293PEDY1 cellswere treated with the proteasomal inhibitor lactacystin. Lacta-cystin (30 �M) inhibited the degradation of PED/PEA-15induced by serum deprivation by 70% and almost completelyreverted the effect of the PKC�-ASO (Fig. 8A). Lactacystintreatment also prevented PED/PEA-15 degradation induced byKN-93 in the 293PEDY1 cells (data not shown). In addition, lac-
tacystin, at variance with TPA, increased the expression ofPEDS116G at a similar extent as PEDWT (Fig. 8B), suggesting thatPED/PEA-15 phosphorylation at the Ser-116 was required toescape degradation. Following lactacystin treatment of theuntransfected C5N cells, PED/PEA-15 protein levels were alsoincreased by 2.5- and 3-fold, respectively, in the absence or inthe presence of TPA (Fig. 8B). In both cases, the incubationwith KN-93 did not significantly reduce lactacystin effect onPED/PEA-15 protein levels. Thus, CaMK block was overcomeby proteasome inhibitors.These data were consistent with the hypothesis that PED/
PEA-15 is largely degraded within the proteasomal compart-ment. Proteasome-targeted proteins are usually ubiquitiny-lated (30). His-tagged PED/PEA-15 and HA-tagged ubiquitinhave been transfected, alone or in combination, in HEK293cells, and PED/PEA-15-bound ubiquitin was detected byWest-ern blot with HA antibodies (Fig. 9A). A typical smear wasobserved in cells co-transfected with both constructs, indicat-ing that PED/PEA-15 is a ubiquitinylated protein (Fig. 9A).
FIGURE 4. Regulation of PED/PEA-15 expression levels by PKC isoforms.293PEDY1 cells were treated with phosphorothioate antisense (ASO) and sense(SO) oligonucleotides (3 �g/ml) directed against PKC-�, -�, -�, and -�. Celllysates were then analyzed by PED immunoblot, and the results were quan-titated by laser densitometry. The autoradiograph shown is representative offive independent experiments. The error bars represent the mean � S.D. ofthe densitometric analysis.
FIGURE 5. Regulation of PED/PEA-15 expression levels by PKC� andCaMK. 293PEDY1 (A) and C5N (B) cells were serum-starved and treated with 1�M TPA or with 10 �M KN-93 for 20 h in the absence or in the presence ofPKC�-ASO and PKC�-SO or DN-PKC�, as indicated. Cell lysates were then ana-lyzed by PKC-� (upper part) or PED Ab (lower part) immunoblot, and the resultswere quantitated by laser densitometry. The autoradiographs shown are rep-resentative of four (A) and three (B) independent experiments. The error barsrepresent the mean � S.D. of the densitometric analyses.
Regulation of PED/PEA-15 Ubiquitinylation
8652 JOURNAL OF BIOLOGICAL CHEMISTRY VOLUME 282 • NUMBER 12 • MARCH 23, 2007
at UN
IVE
RS
ITA
DI N
AP
OLI on January 28, 2008
ww
w.jbc.org
Dow
nloaded from
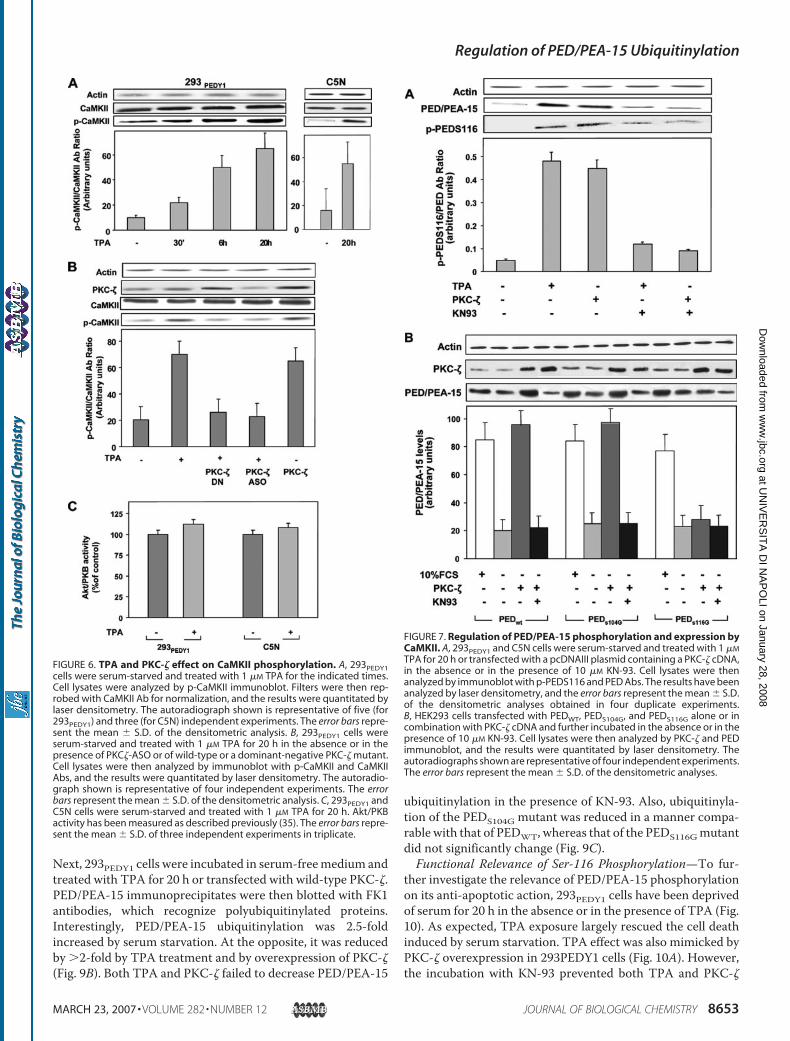
Next, 293PEDY1 cells were incubated in serum-freemedium andtreated with TPA for 20 h or transfected with wild-type PKC-�.PED/PEA-15 immunoprecipitates were then blotted with FK1antibodies, which recognize polyubiquitinylated proteins.Interestingly, PED/PEA-15 ubiquitinylation was 2.5-foldincreased by serum starvation. At the opposite, it was reducedby �2-fold by TPA treatment and by overexpression of PKC-�(Fig. 9B). Both TPA and PKC-� failed to decrease PED/PEA-15
ubiquitinylation in the presence of KN-93. Also, ubiquitinyla-tion of the PEDS104G mutant was reduced in a manner compa-rable with that of PEDWT, whereas that of the PEDS116Gmutantdid not significantly change (Fig. 9C).Functional Relevance of Ser-116 Phosphorylation—To fur-
ther investigate the relevance of PED/PEA-15 phosphorylationon its anti-apoptotic action, 293PEDY1 cells have been deprivedof serum for 20 h in the absence or in the presence of TPA (Fig.10). As expected, TPA exposure largely rescued the cell deathinduced by serum starvation. TPA effect was also mimicked byPKC-� overexpression in 293PEDY1 cells (Fig. 10A). However,the incubation with KN-93 prevented both TPA and PKC-�
FIGURE 6. TPA and PKC-� effect on CaMKII phosphorylation. A, 293PEDY1cells were serum-starved and treated with 1 �M TPA for the indicated times.Cell lysates were analyzed by p-CaMKII immunoblot. Filters were then rep-robed with CaMKII Ab for normalization, and the results were quantitated bylaser densitometry. The autoradiograph shown is representative of five (for293PEDY1) and three (for C5N) independent experiments. The error bars repre-sent the mean � S.D. of the densitometric analysis. B, 293PEDY1 cells wereserum-starved and treated with 1 �M TPA for 20 h in the absence or in thepresence of PKC�-ASO or of wild-type or a dominant-negative PKC-� mutant.Cell lysates were then analyzed by immunoblot with p-CaMKII and CaMKIIAbs, and the results were quantitated by laser densitometry. The autoradio-graph shown is representative of four independent experiments. The errorbars represent the mean � S.D. of the densitometric analysis. C, 293PEDY1 andC5N cells were serum-starved and treated with 1 �M TPA for 20 h. Akt/PKBactivity has been measured as described previously (35). The error bars repre-sent the mean � S.D. of three independent experiments in triplicate.
FIGURE 7. Regulation of PED/PEA-15 phosphorylation and expression byCaMKII. A, 293PEDY1 and C5N cells were serum-starved and treated with 1 �M
TPA for 20 h or transfected with a pcDNAIII plasmid containing a PKC-� cDNA,in the absence or in the presence of 10 �M KN-93. Cell lysates were thenanalyzed by immunoblot with p-PEDS116 and PED Abs. The results have beenanalyzed by laser densitometry, and the error bars represent the mean � S.D.of the densitometric analyses obtained in four duplicate experiments.B, HEK293 cells transfected with PEDWT, PEDS104G, and PEDS116G alone or incombination with PKC-� cDNA and further incubated in the absence or in thepresence of 10 �M KN-93. Cell lysates were then analyzed by PKC-� and PEDimmunoblot, and the results were quantitated by laser densitometry. Theautoradiographs shown are representative of four independent experiments.The error bars represent the mean � S.D. of the densitometric analyses.
Regulation of PED/PEA-15 Ubiquitinylation
MARCH 23, 2007 • VOLUME 282 • NUMBER 12 JOURNAL OF BIOLOGICAL CHEMISTRY 8653
at UN
IVE
RS
ITA
DI N
AP
OLI on January 28, 2008
ww
w.jbc.org
Dow
nloaded from
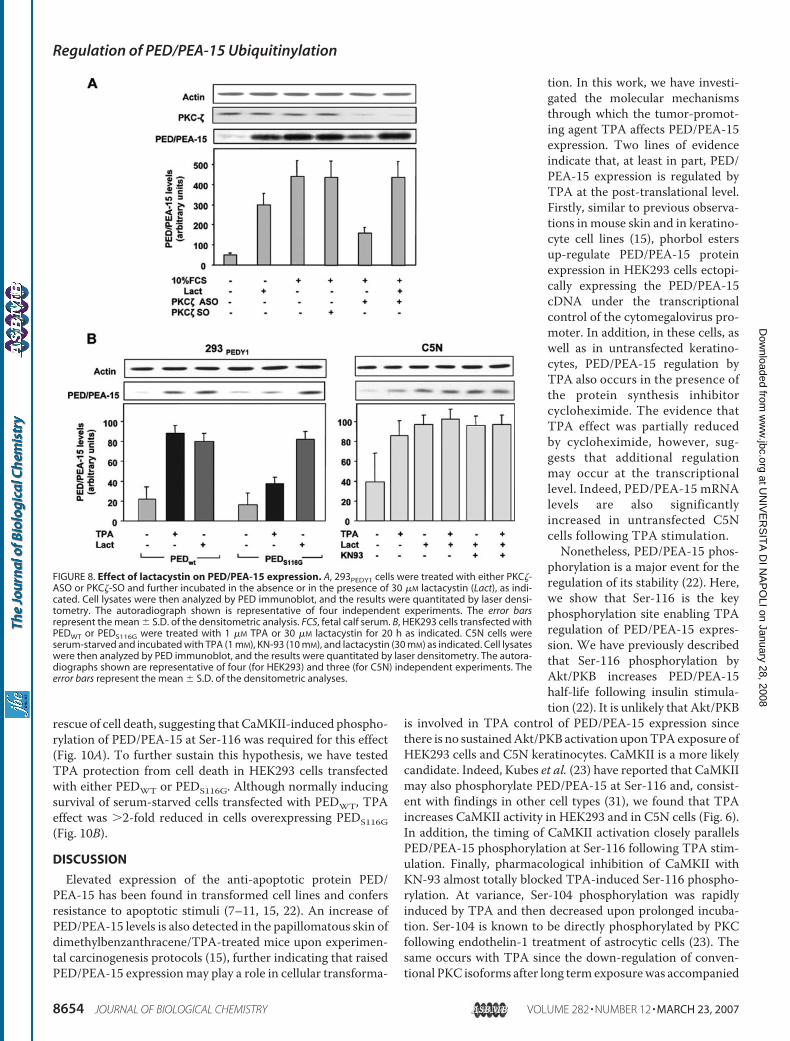
rescue of cell death, suggesting that CaMKII-induced phospho-rylation of PED/PEA-15 at Ser-116 was required for this effect(Fig. 10A). To further sustain this hypothesis, we have testedTPA protection from cell death in HEK293 cells transfectedwith either PEDWT or PEDS116G. Although normally inducingsurvival of serum-starved cells transfected with PEDWT, TPAeffect was �2-fold reduced in cells overexpressing PEDS116G(Fig. 10B).
DISCUSSION
Elevated expression of the anti-apoptotic protein PED/PEA-15 has been found in transformed cell lines and confersresistance to apoptotic stimuli (7–11, 15, 22). An increase ofPED/PEA-15 levels is also detected in the papillomatous skin ofdimethylbenzanthracene/TPA-treated mice upon experimen-tal carcinogenesis protocols (15), further indicating that raisedPED/PEA-15 expressionmay play a role in cellular transforma-
tion. In this work, we have investi-gated the molecular mechanismsthrough which the tumor-promot-ing agent TPA affects PED/PEA-15expression. Two lines of evidenceindicate that, at least in part, PED/PEA-15 expression is regulated byTPA at the post-translational level.Firstly, similar to previous observa-tions in mouse skin and in keratino-cyte cell lines (15), phorbol estersup-regulate PED/PEA-15 proteinexpression in HEK293 cells ectopi-cally expressing the PED/PEA-15cDNA under the transcriptionalcontrol of the cytomegalovirus pro-moter. In addition, in these cells, aswell as in untransfected keratino-cytes, PED/PEA-15 regulation byTPA also occurs in the presence ofthe protein synthesis inhibitorcycloheximide. The evidence thatTPA effect was partially reducedby cycloheximide, however, sug-gests that additional regulationmay occur at the transcriptionallevel. Indeed, PED/PEA-15 mRNAlevels are also significantlyincreased in untransfected C5Ncells following TPA stimulation.Nonetheless, PED/PEA-15 phos-
phorylation is a major event for theregulation of its stability (22). Here,we show that Ser-116 is the keyphosphorylation site enabling TPAregulation of PED/PEA-15 expres-sion. We have previously describedthat Ser-116 phosphorylation byAkt/PKB increases PED/PEA-15half-life following insulin stimula-tion (22). It is unlikely that Akt/PKB
is involved in TPA control of PED/PEA-15 expression sincethere is no sustainedAkt/PKB activation uponTPAexposure ofHEK293 cells and C5N keratinocytes. CaMKII is a more likelycandidate. Indeed, Kubes et al. (23) have reported that CaMKIImay also phosphorylate PED/PEA-15 at Ser-116 and, consist-ent with findings in other cell types (31), we found that TPAincreases CaMKII activity in HEK293 and in C5N cells (Fig. 6).In addition, the timing of CaMKII activation closely parallelsPED/PEA-15 phosphorylation at Ser-116 following TPA stim-ulation. Finally, pharmacological inhibition of CaMKII withKN-93 almost totally blocked TPA-induced Ser-116 phospho-rylation. At variance, Ser-104 phosphorylation was rapidlyinduced by TPA and then decreased upon prolonged incuba-tion. Ser-104 is known to be directly phosphorylated by PKCfollowing endothelin-1 treatment of astrocytic cells (23). Thesame occurs with TPA since the down-regulation of conven-tional PKC isoforms after long termexposurewas accompanied
FIGURE 8. Effect of lactacystin on PED/PEA-15 expression. A, 293PEDY1 cells were treated with either PKC�-ASO or PKC�-SO and further incubated in the absence or in the presence of 30 �M lactacystin (Lact), as indi-cated. Cell lysates were then analyzed by PED immunoblot, and the results were quantitated by laser densi-tometry. The autoradiograph shown is representative of four independent experiments. The error barsrepresent the mean � S.D. of the densitometric analysis. FCS, fetal calf serum. B, HEK293 cells transfected withPEDWT or PEDS116G were treated with 1 �M TPA or 30 �M lactacystin for 20 h as indicated. C5N cells wereserum-starved and incubated with TPA (1 mM), KN-93 (10 mM), and lactacystin (30 mM) as indicated. Cell lysateswere then analyzed by PED immunoblot, and the results were quantitated by laser densitometry. The autora-diographs shown are representative of four (for HEK293) and three (for C5N) independent experiments. Theerror bars represent the mean � S.D. of the densitometric analyses.
Regulation of PED/PEA-15 Ubiquitinylation
8654 JOURNAL OF BIOLOGICAL CHEMISTRY VOLUME 282 • NUMBER 12 • MARCH 23, 2007
at UN
IVE
RS
ITA
DI N
AP
OLI on January 28, 2008
ww
w.jbc.org
Dow
nloaded from
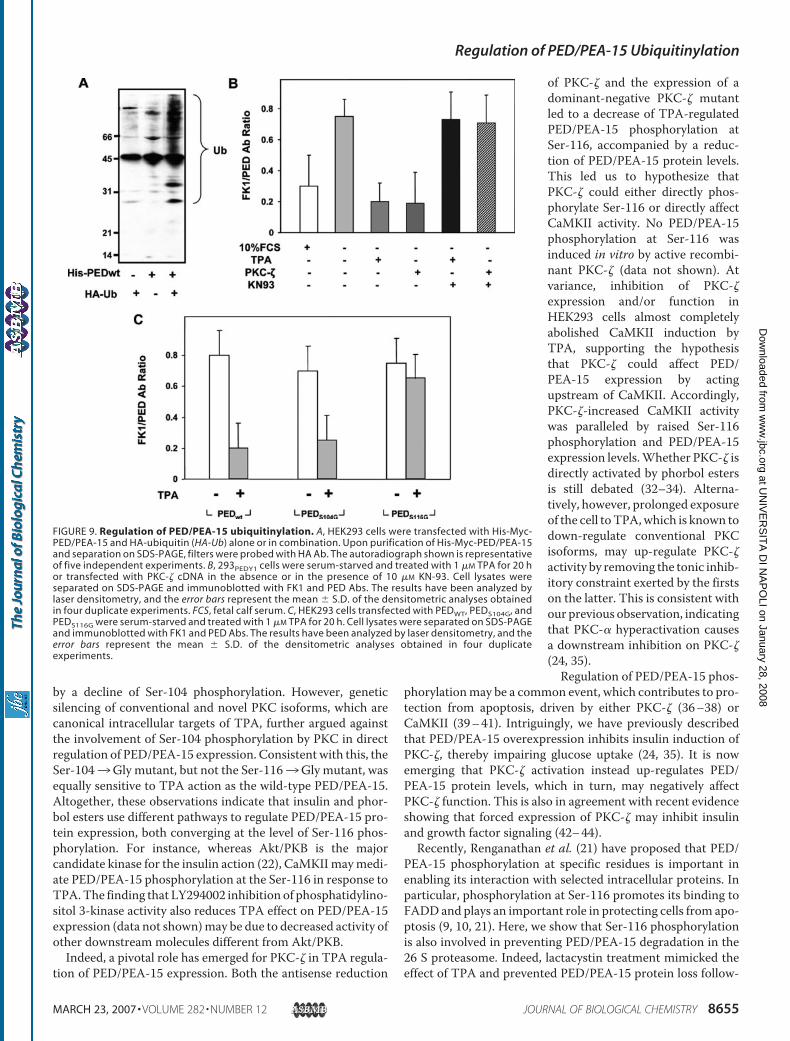
by a decline of Ser-104 phosphorylation. However, geneticsilencing of conventional and novel PKC isoforms, which arecanonical intracellular targets of TPA, further argued againstthe involvement of Ser-104 phosphorylation by PKC in directregulation of PED/PEA-15 expression. Consistent with this, theSer-1043Gly mutant, but not the Ser-1163Gly mutant, wasequally sensitive to TPA action as the wild-type PED/PEA-15.Altogether, these observations indicate that insulin and phor-bol esters use different pathways to regulate PED/PEA-15 pro-tein expression, both converging at the level of Ser-116 phos-phorylation. For instance, whereas Akt/PKB is the majorcandidate kinase for the insulin action (22), CaMKIImaymedi-ate PED/PEA-15 phosphorylation at the Ser-116 in response toTPA.The finding that LY294002 inhibition of phosphatidylino-sitol 3-kinase activity also reduces TPA effect on PED/PEA-15expression (data not shown)may be due to decreased activity ofother downstream molecules different from Akt/PKB.Indeed, a pivotal role has emerged for PKC-� in TPA regula-
tion of PED/PEA-15 expression. Both the antisense reduction
of PKC-� and the expression of adominant-negative PKC-� mutantled to a decrease of TPA-regulatedPED/PEA-15 phosphorylation atSer-116, accompanied by a reduc-tion of PED/PEA-15 protein levels.This led us to hypothesize thatPKC-� could either directly phos-phorylate Ser-116 or directly affectCaMKII activity. No PED/PEA-15phosphorylation at Ser-116 wasinduced in vitro by active recombi-nant PKC-� (data not shown). Atvariance, inhibition of PKC-�expression and/or function inHEK293 cells almost completelyabolished CaMKII induction byTPA, supporting the hypothesisthat PKC-� could affect PED/PEA-15 expression by actingupstream of CaMKII. Accordingly,PKC-�-increased CaMKII activitywas paralleled by raised Ser-116phosphorylation and PED/PEA-15expression levels.Whether PKC-� isdirectly activated by phorbol estersis still debated (32–34). Alterna-tively, however, prolonged exposureof the cell toTPA,which is known todown-regulate conventional PKCisoforms, may up-regulate PKC-�activity by removing the tonic inhib-itory constraint exerted by the firstson the latter. This is consistent withour previous observation, indicatingthat PKC-� hyperactivation causesa downstream inhibition on PKC-�(24, 35).Regulation of PED/PEA-15 phos-
phorylationmay be a common event, which contributes to pro-tection from apoptosis, driven by either PKC-� (36–38) orCaMKII (39–41). Intriguingly, we have previously describedthat PED/PEA-15 overexpression inhibits insulin induction ofPKC-�, thereby impairing glucose uptake (24, 35). It is nowemerging that PKC-� activation instead up-regulates PED/PEA-15 protein levels, which in turn, may negatively affectPKC-� function. This is also in agreement with recent evidenceshowing that forced expression of PKC-� may inhibit insulinand growth factor signaling (42–44).Recently, Renganathan et al. (21) have proposed that PED/
PEA-15 phosphorylation at specific residues is important inenabling its interaction with selected intracellular proteins. Inparticular, phosphorylation at Ser-116 promotes its binding toFADDand plays an important role in protecting cells from apo-ptosis (9, 10, 21). Here, we show that Ser-116 phosphorylationis also involved in preventing PED/PEA-15 degradation in the26 S proteasome. Indeed, lactacystin treatment mimicked theeffect of TPA and prevented PED/PEA-15 protein loss follow-
FIGURE 9. Regulation of PED/PEA-15 ubiquitinylation. A, HEK293 cells were transfected with His-Myc-PED/PEA-15 and HA-ubiquitin (HA-Ub) alone or in combination. Upon purification of His-Myc-PED/PEA-15and separation on SDS-PAGE, filters were probed with HA Ab. The autoradiograph shown is representativeof five independent experiments. B, 293PEDY1 cells were serum-starved and treated with 1 �M TPA for 20 hor transfected with PKC-� cDNA in the absence or in the presence of 10 �M KN-93. Cell lysates wereseparated on SDS-PAGE and immunoblotted with FK1 and PED Abs. The results have been analyzed bylaser densitometry, and the error bars represent the mean � S.D. of the densitometric analyses obtainedin four duplicate experiments. FCS, fetal calf serum. C, HEK293 cells transfected with PEDWT, PEDS104G, andPEDS116G were serum-starved and treated with 1 �M TPA for 20 h. Cell lysates were separated on SDS-PAGEand immunoblotted with FK1 and PED Abs. The results have been analyzed by laser densitometry, and theerror bars represent the mean � S.D. of the densitometric analyses obtained in four duplicateexperiments.
Regulation of PED/PEA-15 Ubiquitinylation
MARCH 23, 2007 • VOLUME 282 • NUMBER 12 JOURNAL OF BIOLOGICAL CHEMISTRY 8655
at UN
IVE
RS
ITA
DI N
AP
OLI on January 28, 2008
ww
w.jbc.org
Dow
nloaded from
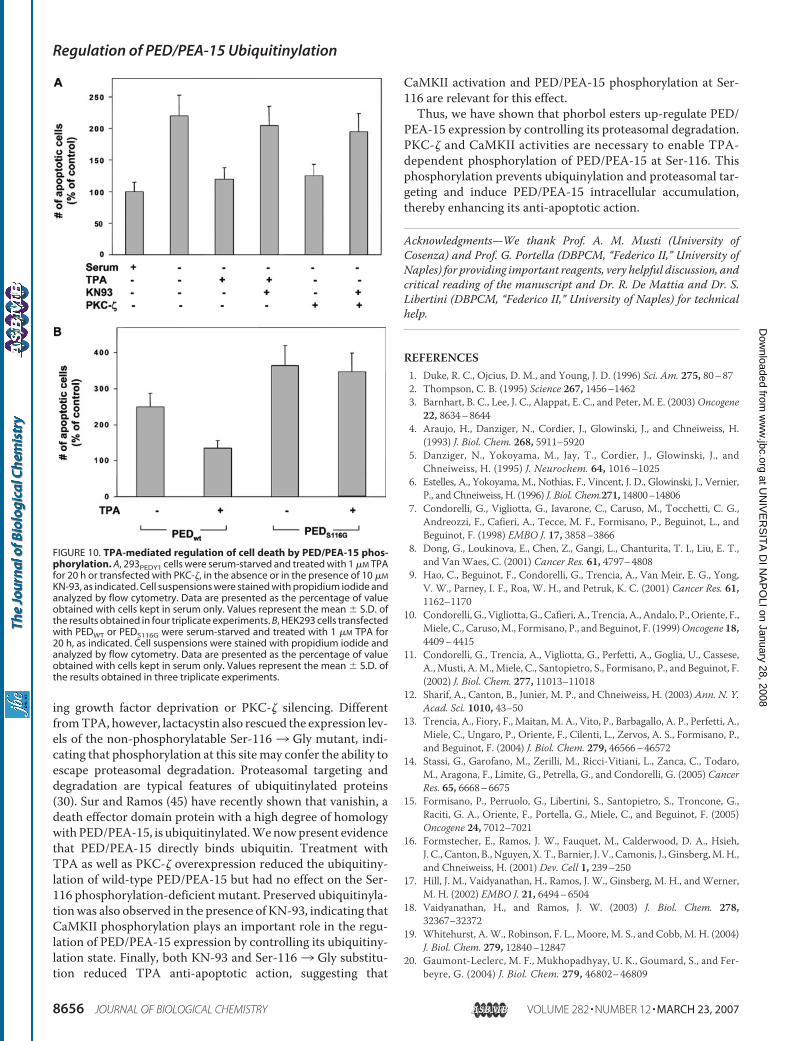
ing growth factor deprivation or PKC-� silencing. DifferentfromTPA, however, lactacystin also rescued the expression lev-els of the non-phosphorylatable Ser-116 3 Gly mutant, indi-cating that phosphorylation at this sitemay confer the ability toescape proteasomal degradation. Proteasomal targeting anddegradation are typical features of ubiquitinylated proteins(30). Sur and Ramos (45) have recently shown that vanishin, adeath effector domain protein with a high degree of homologywithPED/PEA-15, is ubiquitinylated.Wenowpresent evidencethat PED/PEA-15 directly binds ubiquitin. Treatment withTPA as well as PKC-� overexpression reduced the ubiquitiny-lation of wild-type PED/PEA-15 but had no effect on the Ser-116 phosphorylation-deficient mutant. Preserved ubiquitinyla-tionwas also observed in the presence of KN-93, indicating thatCaMKII phosphorylation plays an important role in the regu-lation of PED/PEA-15 expression by controlling its ubiquitiny-lation state. Finally, both KN-93 and Ser-1163 Gly substitu-tion reduced TPA anti-apoptotic action, suggesting that
CaMKII activation and PED/PEA-15 phosphorylation at Ser-116 are relevant for this effect.Thus, we have shown that phorbol esters up-regulate PED/
PEA-15 expression by controlling its proteasomal degradation.PKC-� and CaMKII activities are necessary to enable TPA-dependent phosphorylation of PED/PEA-15 at Ser-116. Thisphosphorylation prevents ubiquinylation and proteasomal tar-geting and induce PED/PEA-15 intracellular accumulation,thereby enhancing its anti-apoptotic action.
Acknowledgments—We thank Prof. A. M. Musti (University ofCosenza) and Prof. G. Portella (DBPCM, “Federico II,” University ofNaples) for providing important reagents, very helpful discussion, andcritical reading of the manuscript and Dr. R. De Mattia and Dr. S.Libertini (DBPCM, “Federico II,” University of Naples) for technicalhelp.
REFERENCES1. Duke, R. C., Ojcius, D. M., and Young, J. D. (1996) Sci. Am. 275, 80–872. Thompson, C. B. (1995) Science 267, 1456–14623. Barnhart, B. C., Lee, J. C., Alappat, E. C., and Peter, M. E. (2003)Oncogene
22, 8634–86444. Araujo, H., Danziger, N., Cordier, J., Glowinski, J., and Chneiweiss, H.
(1993) J. Biol. Chem. 268, 5911–59205. Danziger, N., Yokoyama, M., Jay, T., Cordier, J., Glowinski, J., and
Chneiweiss, H. (1995) J. Neurochem. 64, 1016–10256. Estelles, A., Yokoyama, M., Nothias, F., Vincent, J. D., Glowinski, J., Vernier,
P., and Chneiweiss, H. (1996) J. Biol. Chem.271, 14800–148067. Condorelli, G., Vigliotta, G., Iavarone, C., Caruso, M., Tocchetti, C. G.,
Andreozzi, F., Cafieri, A., Tecce, M. F., Formisano, P., Beguinot, L., andBeguinot, F. (1998) EMBO J. 17, 3858–3866
8. Dong, G., Loukinova, E., Chen, Z., Gangi, L., Chanturita, T. I., Liu, E. T.,and Van Waes, C. (2001) Cancer Res. 61, 4797–4808
9. Hao, C., Beguinot, F., Condorelli, G., Trencia, A., Van Meir, E. G., Yong,V. W., Parney, I. F., Roa, W. H., and Petruk, K. C. (2001) Cancer Res. 61,1162–1170
10. Condorelli, G., Vigliotta,G., Cafieri, A., Trencia, A., Andalo, P.,Oriente, F.,Miele, C., Caruso,M., Formisano, P., and Beguinot, F. (1999)Oncogene 18,4409–4415
11. Condorelli, G., Trencia, A., Vigliotta, G., Perfetti, A., Goglia, U., Cassese,A.,Musti, A.M.,Miele, C., Santopietro, S., Formisano, P., and Beguinot, F.(2002) J. Biol. Chem. 277, 11013–11018
12. Sharif, A., Canton, B., Junier, M. P., and Chneiweiss, H. (2003) Ann. N. Y.Acad. Sci. 1010, 43–50
13. Trencia, A., Fiory, F., Maitan, M. A., Vito, P., Barbagallo, A. P., Perfetti, A.,Miele, C., Ungaro, P., Oriente, F., Cilenti, L., Zervos, A. S., Formisano, P.,and Beguinot, F. (2004) J. Biol. Chem. 279, 46566–46572
14. Stassi, G., Garofano, M., Zerilli, M., Ricci-Vitiani, L., Zanca, C., Todaro,M., Aragona, F., Limite, G., Petrella, G., and Condorelli, G. (2005) CancerRes. 65, 6668–6675
15. Formisano, P., Perruolo, G., Libertini, S., Santopietro, S., Troncone, G.,Raciti, G. A., Oriente, F., Portella, G., Miele, C., and Beguinot, F. (2005)Oncogene 24, 7012–7021
16. Formstecher, E., Ramos, J. W., Fauquet, M., Calderwood, D. A., Hsieh,J. C., Canton, B., Nguyen, X. T., Barnier, J. V., Camonis, J., Ginsberg,M.H.,and Chneiweiss, H. (2001) Dev. Cell 1, 239–250
17. Hill, J. M., Vaidyanathan, H., Ramos, J. W., Ginsberg, M. H., andWerner,M. H. (2002) EMBO J. 21, 6494–6504
18. Vaidyanathan, H., and Ramos, J. W. (2003) J. Biol. Chem. 278,32367–32372
19. Whitehurst, A.W., Robinson, F. L., Moore, M. S., and Cobb, M. H. (2004)J. Biol. Chem. 279, 12840–12847
20. Gaumont-Leclerc, M. F., Mukhopadhyay, U. K., Goumard, S., and Fer-beyre, G. (2004) J. Biol. Chem. 279, 46802–46809
FIGURE 10. TPA-mediated regulation of cell death by PED/PEA-15 phos-phorylation. A, 293PEDY1 cells were serum-starved and treated with 1 �M TPAfor 20 h or transfected with PKC-�, in the absence or in the presence of 10 �M
KN-93, as indicated. Cell suspensions were stained with propidium iodide andanalyzed by flow cytometry. Data are presented as the percentage of valueobtained with cells kept in serum only. Values represent the mean � S.D. ofthe results obtained in four triplicate experiments. B, HEK293 cells transfectedwith PEDWT or PEDS116G were serum-starved and treated with 1 �M TPA for20 h, as indicated. Cell suspensions were stained with propidium iodide andanalyzed by flow cytometry. Data are presented as the percentage of valueobtained with cells kept in serum only. Values represent the mean � S.D. ofthe results obtained in three triplicate experiments.
Regulation of PED/PEA-15 Ubiquitinylation
8656 JOURNAL OF BIOLOGICAL CHEMISTRY VOLUME 282 • NUMBER 12 • MARCH 23, 2007
at UN
IVE
RS
ITA
DI N
AP
OLI on January 28, 2008
ww
w.jbc.org
Dow
nloaded from
21. Renganathan, H., Vaidyanathan, H., Knapinska, A., and Ramos, J. W.(2005) Biochem. J. 390, 729–735
22. Trencia, A., Perfetti, A., Cassese, A., Vigliotta, G., Miele, C., Oriente, F.,Santopietro, S., Giacco, F., Condorelli, G., Formisano, P., and Beguinot, F.(2003)Mol. Cell Biol. 23, 4511–4521
23. Kubes, M., Cordier, J., Glowinski, J., Girault, J. A., and Chneiweiss, H.(1998) J. Neurochem. 71, 1307–1314
24. Vigliotta, G., Miele, C., Santopietro, S., Portella, G., Perfetti, A., Maitan,M. A., Cassese, A., Oriente, F., Trencia, A., Fiory, F., Romano, C., Tiveron,C., Tatangelo, L., Troncone, G., Formisano, P., and Beguinot, F. (2004)Mol. Cell Biol. 24, 5005–5015
25. Sharif, A., Renault, F., Beuvon, F., Castellanos, R., Canton, B., Barbeito, L.,Junier, M. P., and Chneiweiss, H. (2004) Neuroscience 126, 263–275
26. Formisano, P., Oriente, F., Fiory, F., Caruso, M., Miele, C., Maitan, M. A.,Andreozzi, F., Vigliotta, G., Condorelli, G., and Beguinot, F. (2000) Mol.Cell Biol. 20, 6323–6333
27. Caruso, M., Maitan, M. A., Bifulco, G., Miele, C., Vigliotta, G., Oriente, F.,Formisano, P., and Beguinot, F. (2001) J. Biol. Chem. 276, 45088–45097
28. Oriente, F., Formisano, P., Miele, C., Fiory, F., Maitan, M. A., Vigliotta, G.,Trencia, A., Santopietro, S., Caruso,M., VanObberghen, E., and Beguinot,F. (2001) J. Biol. Chem. 276, 37109–37119
29. Musti, A. M., Treier, M., and Bohmann, D. (1997) Science 275, 400–40230. Ciechanover, A. (2005)Mol. Cell Biol. 6, 79–8731. Hughes, K., Edin, S., Antonsson, A., and Grundstrom, T. (2001) J. Biol.
Chem. 276, 36008–3601332. Ways, D. K., Cook, P. P.,Webster, C., and Parker, P. J. (1992) J. Biol. Chem.
267, 4799–4805
33. Kim, S. J., Chang, Y. Y., Kang, S. S., andChun, J. S. (1997)Biochem. Biophys.Res. Commun. 237, 336–339
34. Hirai, T., and Chida, K. (2003) J Biochem. (Tokyo) 133, 1–7; CorrectionJ. Biochem. (Tokyo) 133, 395
35. Condorelli, G., Vigliotta, G., Trencia, A.,Maitan,M.A., Caruso,M.,Miele,C., Oriente, F., Santopietro, S., Formisano, P., and Beguinot, F. (2001)Diabetes 50, 1244–1252
36. Spitaler, M.,Wiesenhofer, B., Biedermann, V., Seppi, T., Zimmermann, J.,Grunicke, H., and Hofmann, J. (1999) Anticancer Res. 19, 3969–3976
37. de Thonel, A., Bettaieb, A., Jean, C., Laurent, G., and Quillet-Mary, A.(2001) Blood 98, 3770–3777
38. Leroy, I., de Thonel, A., Laurent, G., and Quillet-Mary, A. (2005) CellSignal. 17, 1149–1157
39. Tombes, R.M., Grant, S.,Westin, E. H., andKrystal, G. (1995)Cell GrowthDiffer. 6, 1063–1070
40. Yang, B. F., Xiao, C., Roa,W.H., Krammer, P. H., andHao, C. (2003) J. Biol.Chem. 278, 7043–7050
41. Xiao, C., Yang, B. F., Song, J. H., Schulman, H., Li, L., and Hao, C. (2005)Exp. Cell Res. 304, 244–255
42. Liu, Y. F., Paz, K., Herschkovitz, A., Alt, A., Tennenbaum, T., Sampson,S. R., Ohba, M., Kuroki, T., LeRoith, D., and Zick, Y. (2001) J. Biol. Chem.276, 14459–14465
43. Liu, Y. F., Herschkovitz, A., Boura-Halfon, S., Ronen, D., Paz, K., Leroith,D., and Zick, Y. (2004)Mol. Cell Biol. 24, 9668–9681
44. Zick, Y. (2005) Sci. STKE. 2005 25, 26845. Sur, R., and Ramos, J. W. (2005) Biochem. J. 387, 315–324
Regulation of PED/PEA-15 Ubiquitinylation
MARCH 23, 2007 • VOLUME 282 • NUMBER 12 JOURNAL OF BIOLOGICAL CHEMISTRY 8657
at UN
IVE
RS
ITA
DI N
AP
OLI on January 28, 2008
ww
w.jbc.org
Dow
nloaded from

MOLECULAR AND CELLULAR BIOLOGY, Sept. 2008, p. 5634–5645 Vol. 28, No. 180270-7306/08/$08.00�0 doi:10.1128/MCB.00117-08Copyright © 2008, American Society for Microbiology. All Rights Reserved.
Prep1 Deficiency Induces Protection from Diabetes and IncreasedInsulin Sensitivity through a p160-Mediated Mechanism�
Francesco Oriente,1 Luis Cesar Fernandez Diaz,3 Claudia Miele,1 Salvatore Iovino,1 Silvia Mori,3Victor Manuel Diaz,4 Giancarlo Troncone,2 Angela Cassese,1 Pietro Formisano,1
Francesco Blasi,3,4 and Francesco Beguinot1*Dipartimento di Biologia e Patologia Cellulare e Molecolare & Istituto di Endocrinologia ed Oncologia Sperimentale del CNR,
Universita degli Studi di Napoli Federico II, Naples, Italy1; Dipartimento di Scienze Biomorfologiche e Funzionali,Universita degli Studi di Napoli Federico II, Naples, Italy2; IFOM (FIRC Institute of Molecular Oncology),
via Adamello 16, 20134 Milan, Italy3; and Universita Vita Salute San Raffaele,via Olgettina 60, 20132 Milan, Italy4
Received 22 January 2008/Returned for modification 8 March 2008/Accepted 4 July 2008
We have examined glucose homeostasis in mice hypomorphic for the homeotic transcription factor genePrep1. Prep1-hypomorphic (Prep1i/i) mice exhibit an absolute reduction in circulating insulin levels but normalglucose tolerance. In addition, these mice exhibit protection from streptozotocin-induced diabetes and en-hanced insulin sensitivity with improved glucose uptake and insulin-dependent glucose disposal by skeletalmuscle. This muscle phenotype does not depend on reduced expression of the known Prep1 transcriptionpartner, Pbx1. Instead, in Prep1i/i muscle, we find normal Pbx1 but reduced levels of the recently identifiednovel Prep1 interactor p160. Consistent with this reduction, we find a muscle-selective increase in mRNA andprotein levels of PGC-1�, accompanied by enhanced expression of the GLUT4 transporter, responsible forinsulin-stimulated glucose uptake in muscle. Indeed, using L6 skeletal muscle cells, we induced the oppositeeffects by overexpressing Prep1 or p160, but not Pbx1. In vivo skeletal muscle delivery of p160 cDNA in Prep1i/i
mice also reverses the molecular phenotype. Finally, we show that Prep1 controls the stability of the p160protein. We conclude that Prep1 controls insulin sensitivity through the p160-GLUT4 pathway.
Prep1 is an homeodomain transcription factor belonging tothe MEINOX subfamily of the TALE (three amino acid loopextension) proteins (32). Prep1 forms DNA-independent di-meric complexes with all isoforms of the Pbx homeodomaintranscription factor, enhancing target specificity and regulatoryfunction (4, 6, 24, 36, 39).
Prep1 is an important gene in development: its downregula-tion in zebrafish and its deletion in mice induces embryoniclethality (9; L. C. Fernandez-Diaz and F. Blasi, unpublisheddata). Hypomorphic mice expressing about 2% of Prep1mRNA (Prep1i/i) have a leaky embryo-lethal phenotype withmajor anomalies in hematopoiesis, oculogenesis, and angio-genesis (15). About 25% of the homozygous Prep1i/i embryossurvive, and the mice are born and live a normal-length life.However, they show defects in T-cell development (38).
In all these systems, the reduction or the absence of Prep1 isaccompanied by a reduction of its Pbx partners (9, 15, 38). Thereduction in the mouse appears to be cell type and isoformspecific (15). Direct studies have shown that the reduction ofPbx expression is due largely to a posttranscriptional mecha-nism (15, 38), in particular to a decrease in the protein half-life.In fact, dimerization with Prep1 protects Pbx from proteaso-mal degradation (26).
Previous studies also demonstrated that the generation ofPbx-Prep heterodimers is necessary to enable nuclear localiza-
tion of Prep1 and to prevent nuclear export of Pbx (5, 20).Indeed, the balance of Prep and Pbx has been shown to befunctionally important both during embryogenesis and in adultlife (9, 15, 26, 46).
We recently discovered that p160 Myb-binding protein(p160) (44) is a new direct Prep1-interacting protein that com-petes with Pbx1 for Prep1 binding (11). Thus, Prep1 functionsmay depend on not only its interaction with Pbx but also thatwith p160. The role of the Prep1-p160 interaction, however, isstill unknown. Interestingly, p160 is a repressor of the regulatorof glucose and energy metabolism, PPAR-gamma coactiva-tor-1� (PGC-1�) (13).
The importance of Pbx and Hox protein interaction in glu-cose homeostasis, pancreatic cell proliferation, and pancreasdevelopment has been studied. Transgenic mice expressing Pbxinteraction-defective Pdx1 genes were used to investigate therequirements for Pdx1-Pbx complexes in pancreatic morpho-genesis, islet cell differentiation, and glucose homeostasis (12).In these studies, Pdx1-Pbx complexes were dispensable forglucose homeostasis and differentiation of stem cells into duc-tal, endocrine, and acinar lineages; however, they were essen-tial for expansion of these cell populations during develop-ment. Further studies of transheterozygous Pbx1�/� Pdx1�/�
mice revealed in vivo genetic interactions between Pbx1 andPdx1 that are essential for postnatal pancreatic function (22).Indeed, these mice developed age-dependent overt diabetesmellitus, while Pbx1�/� and Pdx1�/� mice showed only re-duced glucose tolerance. Mutations of Pdx1 protein cause di-abetes in both mice and humans (1, 18, 27, 43), suggesting thatPbx1 perturbation may also determine susceptibility to diabe-
* Corresponding author. Mailing address: Dipartimento di Biologiae Patologia Cellulare e Molecolare, Universita di Napoli Federico II,Via Sergio Pansini, 5, Naples 80131, Italy. Phone: 39 081 746 3248. Fax:39 081 746 3235. E-mail: [email protected].
� Published ahead of print on 21 July 2008.
5634
at BioC
hiomica N
apoli II on February 11, 2009
mcb.asm
.orgD
ownloaded from
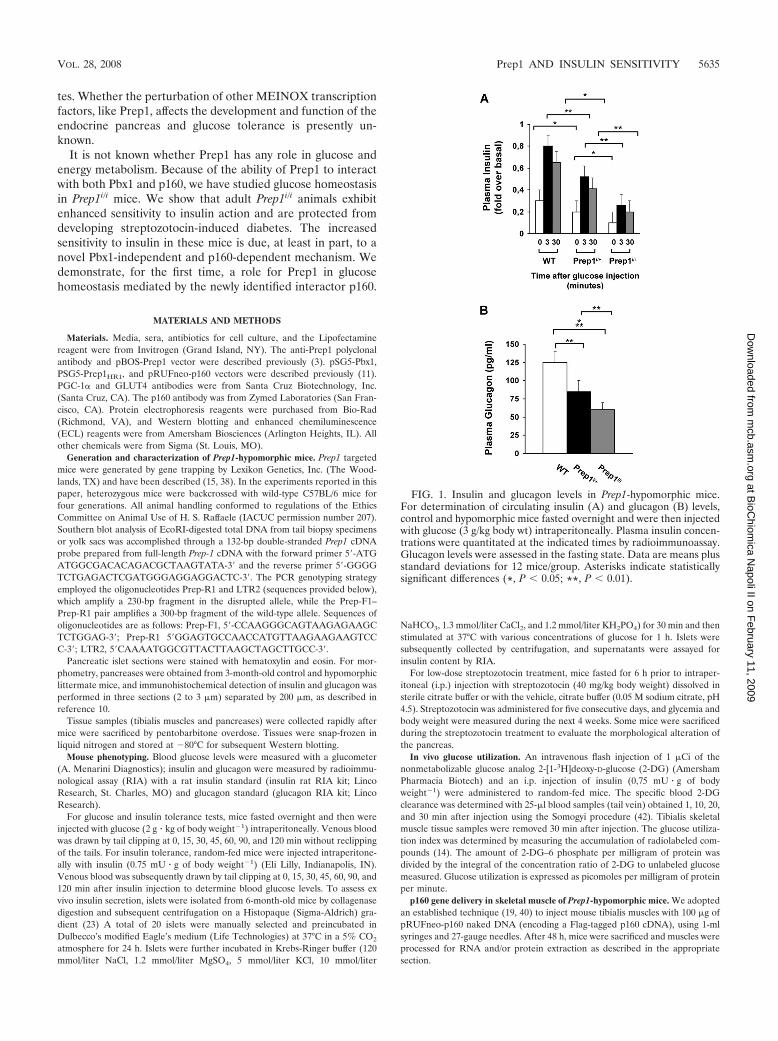
tes. Whether the perturbation of other MEINOX transcriptionfactors, like Prep1, affects the development and function of theendocrine pancreas and glucose tolerance is presently un-known.
It is not known whether Prep1 has any role in glucose andenergy metabolism. Because of the ability of Prep1 to interactwith both Pbx1 and p160, we have studied glucose homeostasisin Prep1i/i mice. We show that adult Prep1i/i animals exhibitenhanced sensitivity to insulin action and are protected fromdeveloping streptozotocin-induced diabetes. The increasedsensitivity to insulin in these mice is due, at least in part, to anovel Pbx1-independent and p160-dependent mechanism. Wedemonstrate, for the first time, a role for Prep1 in glucosehomeostasis mediated by the newly identified interactor p160.
MATERIALS AND METHODS
Materials. Media, sera, antibiotics for cell culture, and the Lipofectaminereagent were from Invitrogen (Grand Island, NY). The anti-Prep1 polyclonalantibody and pBOS-Prep1 vector were described previously (3). pSG5-Pbx1,PSG5-Prep1HR1, and pRUFneo-p160 vectors were described previously (11).PGC-1� and GLUT4 antibodies were from Santa Cruz Biotechnology, Inc.(Santa Cruz, CA). The p160 antibody was from Zymed Laboratories (San Fran-cisco, CA). Protein electrophoresis reagents were purchased from Bio-Rad(Richmond, VA), and Western blotting and enhanced chemiluminescence(ECL) reagents were from Amersham Biosciences (Arlington Heights, IL). Allother chemicals were from Sigma (St. Louis, MO).
Generation and characterization of Prep1-hypomorphic mice. Prep1 targetedmice were generated by gene trapping by Lexikon Genetics, Inc. (The Wood-lands, TX) and have been described (15, 38). In the experiments reported in thispaper, heterozygous mice were backcrossed with wild-type C57BL/6 mice forfour generations. All animal handling conformed to regulations of the EthicsCommittee on Animal Use of H. S. Raffaele (IACUC permission number 207).Southern blot analysis of EcoRI-digested total DNA from tail biopsy specimensor yolk sacs was accomplished through a 132-bp double-stranded Prep1 cDNAprobe prepared from full-length Prep-1 cDNA with the forward primer 5�-ATGATGGCGACACAGACGCTAAGTATA-3� and the reverse primer 5�-GGGGTCTGAGACTCGATGGGAGGAGGACTC-3�. The PCR genotyping strategyemployed the oligonucleotides Prep-R1 and LTR2 (sequences provided below),which amplify a 230-bp fragment in the disrupted allele, while the Prep-F1–Prep-R1 pair amplifies a 300-bp fragment of the wild-type allele. Sequences ofoligonucleotides are as follows: Prep-F1, 5�-CCAAGGGCAGTAAGAGAAGCTCTGGAG-3�; Prep-R1 5�GGAGTGCCAACCATGTTAAGAAGAAGTCCC-3�; LTR2, 5�CAAAATGGCGTTACTTAAGCTAGCTTGCC-3�.
Pancreatic islet sections were stained with hematoxylin and eosin. For mor-phometry, pancreases were obtained from 3-month-old control and hypomorphiclittermate mice, and immunohistochemical detection of insulin and glucagon wasperformed in three sections (2 to 3 �m) separated by 200 �m, as described inreference 10.
Tissue samples (tibialis muscles and pancreases) were collected rapidly aftermice were sacrificed by pentobarbitone overdose. Tissues were snap-frozen inliquid nitrogen and stored at �80°C for subsequent Western blotting.
Mouse phenotyping. Blood glucose levels were measured with a glucometer(A. Menarini Diagnostics); insulin and glucagon were measured by radioimmu-nological assay (RIA) with a rat insulin standard (insulin rat RIA kit; LincoResearch, St. Charles, MO) and glucagon standard (glucagon RIA kit; LincoResearch).
For glucose and insulin tolerance tests, mice fasted overnight and then wereinjected with glucose (2 g � kg of body weight�1) intraperitoneally. Venous bloodwas drawn by tail clipping at 0, 15, 30, 45, 60, 90, and 120 min without reclippingof the tails. For insulin tolerance, random-fed mice were injected intraperitone-ally with insulin (0.75 mU � g of body weight�1) (Eli Lilly, Indianapolis, IN).Venous blood was subsequently drawn by tail clipping at 0, 15, 30, 45, 60, 90, and120 min after insulin injection to determine blood glucose levels. To assess exvivo insulin secretion, islets were isolated from 6-month-old mice by collagenasedigestion and subsequent centrifugation on a Histopaque (Sigma-Aldrich) gra-dient (23) A total of 20 islets were manually selected and preincubated inDulbecco’s modified Eagle’s medium (Life Technologies) at 37°C in a 5% CO2
atmosphere for 24 h. Islets were further incubated in Krebs-Ringer buffer (120mmol/liter NaCl, 1.2 mmol/liter MgSO4, 5 mmol/liter KCl, 10 mmol/liter
NaHCO3, 1.3 mmol/liter CaCl2, and 1.2 mmol/liter KH2PO4) for 30 min and thenstimulated at 37°C with various concentrations of glucose for 1 h. Islets weresubsequently collected by centrifugation, and supernatants were assayed forinsulin content by RIA.
For low-dose streptozotocin treatment, mice fasted for 6 h prior to intraper-itoneal (i.p.) injection with streptozotocin (40 mg/kg body weight) dissolved insterile citrate buffer or with the vehicle, citrate buffer (0.05 M sodium citrate, pH4.5). Streptozotocin was administered for five consecutive days, and glycemia andbody weight were measured during the next 4 weeks. Some mice were sacrificedduring the streptozotocin treatment to evaluate the morphological alteration ofthe pancreas.
In vivo glucose utilization. An intravenous flash injection of 1 �Ci of thenonmetabolizable glucose analog 2-[1-3H]deoxy-D-glucose (2-DG) (AmershamPharmacia Biotech) and an i.p. injection of insulin (0,75 mU � g of bodyweight�1) were administered to random-fed mice. The specific blood 2-DGclearance was determined with 25-�l blood samples (tail vein) obtained 1, 10, 20,and 30 min after injection using the Somogyi procedure (42). Tibialis skeletalmuscle tissue samples were removed 30 min after injection. The glucose utiliza-tion index was determined by measuring the accumulation of radiolabeled com-pounds (14). The amount of 2-DG–6 phosphate per milligram of protein wasdivided by the integral of the concentration ratio of 2-DG to unlabeled glucosemeasured. Glucose utilization is expressed as picomoles per milligram of proteinper minute.
p160 gene delivery in skeletal muscle of Prep1-hypomorphic mice. We adoptedan established technique (19, 40) to inject mouse tibialis muscles with 100 �g ofpRUFneo-p160 naked DNA (encoding a Flag-tagged p160 cDNA), using 1-mlsyringes and 27-gauge needles. After 48 h, mice were sacrificed and muscles wereprocessed for RNA and/or protein extraction as described in the appropriatesection.
FIG. 1. Insulin and glucagon levels in Prep1-hypomorphic mice.For determination of circulating insulin (A) and glucagon (B) levels,control and hypomorphic mice fasted overnight and were then injectedwith glucose (3 g/kg body wt) intraperitoneally. Plasma insulin concen-trations were quantitated at the indicated times by radioimmunoassay.Glucagon levels were assessed in the fasting state. Data are means plusstandard deviations for 12 mice/group. Asterisks indicate statisticallysignificant differences (*, P � 0.05; **, P � 0.01).
VOL. 28, 2008 Prep1 AND INSULIN SENSITIVITY 5635
at BioC
hiomica N
apoli II on February 11, 2009
mcb.asm
.orgD
ownloaded from
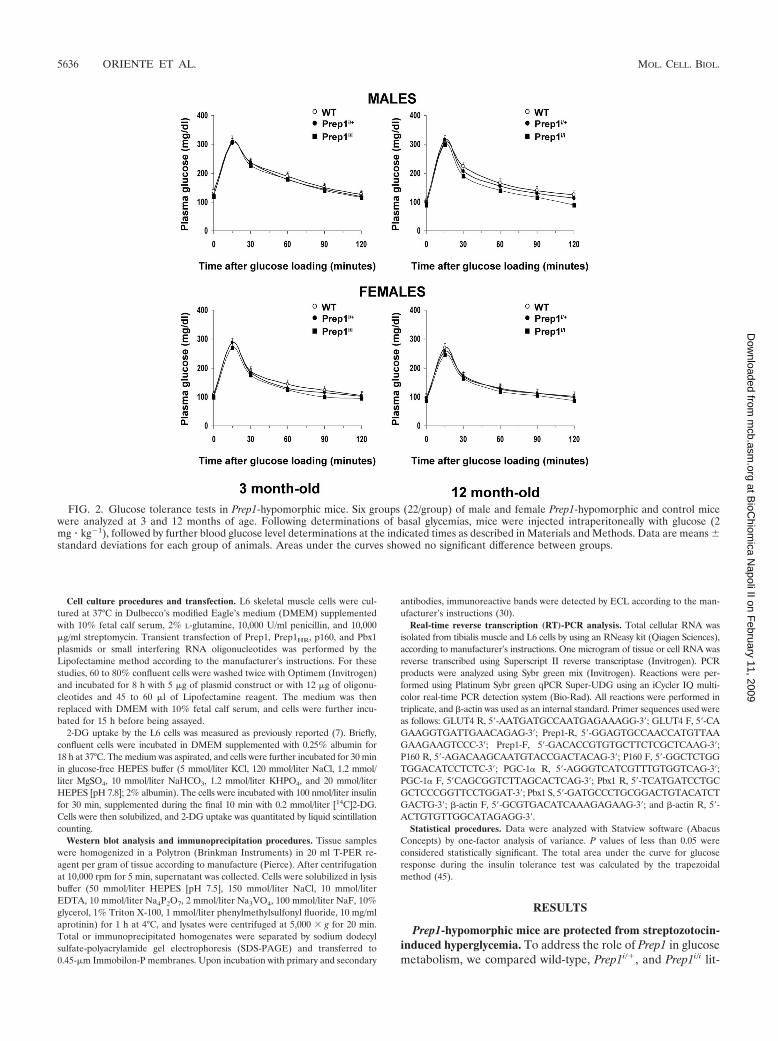
Cell culture procedures and transfection. L6 skeletal muscle cells were cul-tured at 37°C in Dulbecco’s modified Eagle’s medium (DMEM) supplementedwith 10% fetal calf serum, 2% L-glutamine, 10,000 U/ml penicillin, and 10,000�g/ml streptomycin. Transient transfection of Prep1, Prep1HR, p160, and Pbx1plasmids or small interfering RNA oligonucleotides was performed by theLipofectamine method according to the manufacturer’s instructions. For thesestudies, 60 to 80% confluent cells were washed twice with Optimem (Invitrogen)and incubated for 8 h with 5 �g of plasmid construct or with 12 �g of oligonu-cleotides and 45 to 60 �l of Lipofectamine reagent. The medium was thenreplaced with DMEM with 10% fetal calf serum, and cells were further incu-bated for 15 h before being assayed.
2-DG uptake by the L6 cells was measured as previously reported (7). Briefly,confluent cells were incubated in DMEM supplemented with 0.25% albumin for18 h at 37°C. The medium was aspirated, and cells were further incubated for 30 minin glucose-free HEPES buffer (5 mmol/liter KCl, 120 mmol/liter NaCl, 1.2 mmol/liter MgSO4, 10 mmol/liter NaHCO3, 1.2 mmol/liter KHPO4, and 20 mmol/literHEPES [pH 7.8]; 2% albumin). The cells were incubated with 100 nmol/liter insulinfor 30 min, supplemented during the final 10 min with 0.2 mmol/liter [14C]2-DG.Cells were then solubilized, and 2-DG uptake was quantitated by liquid scintillationcounting.
Western blot analysis and immunoprecipitation procedures. Tissue sampleswere homogenized in a Polytron (Brinkman Instruments) in 20 ml T-PER re-agent per gram of tissue according to manufacture (Pierce). After centrifugationat 10,000 rpm for 5 min, supernatant was collected. Cells were solubilized in lysisbuffer (50 mmol/liter HEPES [pH 7.5], 150 mmol/liter NaCl, 10 mmol/literEDTA, 10 mmol/liter Na4P2O7, 2 mmol/liter Na3VO4, 100 mmol/liter NaF, 10%glycerol, 1% Triton X-100, 1 mmol/liter phenylmethylsulfonyl fluoride, 10 mg/mlaprotinin) for 1 h at 4°C, and lysates were centrifuged at 5,000 � g for 20 min.Total or immunoprecipitated homogenates were separated by sodium dodecylsulfate-polyacrylamide gel electrophoresis (SDS-PAGE) and transferred to0.45-�m Immobilon-P membranes. Upon incubation with primary and secondary
antibodies, immunoreactive bands were detected by ECL according to the man-ufacturer’s instructions (30).
Real-time reverse transcription (RT)-PCR analysis. Total cellular RNA wasisolated from tibialis muscle and L6 cells by using an RNeasy kit (Qiagen Sciences),according to manufacturer’s instructions. One microgram of tissue or cell RNA wasreverse transcribed using Superscript II reverse transcriptase (Invitrogen). PCRproducts were analyzed using Sybr green mix (Invitrogen). Reactions were per-formed using Platinum Sybr green qPCR Super-UDG using an iCycler IQ multi-color real-time PCR detection system (Bio-Rad). All reactions were performed intriplicate, and �-actin was used as an internal standard. Primer sequences used wereas follows: GLUT4 R, 5�-AATGATGCCAATGAGAAAGG-3�; GLUT4 F, 5�-CAGAAGGTGATTGAACAGAG-3�; Prep1-R, 5�-GGAGTGCCAACCATGTTAAGAAGAAGTCCC-3�; Prep1-F, 5�-GACACCGTGTGCTTCTCGCTCAAG-3�;P160 R, 5�-AGACAAGCAATGTACCGACTACAG-3�; P160 F, 5�-GGCTCTGGTGGACATCCTCTC-3�; PGC-1� R, 5�-AGGGTCATCGTTTGTGGTCAG-3�;PGC-1� F, 5�CAGCGGTCTTAGCACTCAG-3�; Pbx1 R, 5�-TCATGATCCTGCGCTCCCGGTTCCTGGAT-3�; Pbx1 S, 5�-GATGCCCTGCGGACTGTACATCTGACTG-3�; �-actin F, 5�-GCGTGACATCAAAGAGAAG-3�; and �-actin R, 5�-ACTGTGTTGGCATAGAGG-3�.
Statistical procedures. Data were analyzed with Statview software (AbacusConcepts) by one-factor analysis of variance. P values of less than 0.05 wereconsidered statistically significant. The total area under the curve for glucoseresponse during the insulin tolerance test was calculated by the trapezoidalmethod (45).
RESULTS
Prep1-hypomorphic mice are protected from streptozotocin-induced hyperglycemia. To address the role of Prep1 in glucosemetabolism, we compared wild-type, Prep1i/�, and Prep1i/i lit-
FIG. 2. Glucose tolerance tests in Prep1-hypomorphic mice. Six groups (22/group) of male and female Prep1-hypomorphic and control micewere analyzed at 3 and 12 months of age. Following determinations of basal glycemias, mice were injected intraperitoneally with glucose (2mg � kg�1), followed by further blood glucose level determinations at the indicated times as described in Materials and Methods. Data are means standard deviations for each group of animals. Areas under the curves showed no significant difference between groups.
5636 ORIENTE ET AL. MOL. CELL. BIOL.
at BioC
hiomica N
apoli II on February 11, 2009
mcb.asm
.orgD
ownloaded from

termate mice. We observed a gene dosage-dependent reduc-tion in plasma insulin levels both under fasting conditions andupon glucose loading (Fig. 1A). As with insulin, circulatingglucagon levels were also depressed in the Prep1-hypomorphicmice (Fig. 1B).
In spite of the absolute reduction in the insulin levels, i.p.glucose loading indicated preserved glucose tolerance in boththe Prep1i/�and Prep1i/i mice, with no gender-related difference(Fig. 2). In addition, glucose tolerance remained normal in12-month-old hypomorphic mice, suggesting protection ofthese animals from developing glucose tolerance abnormali-ties. To analyze this hypothesis further, we targeted �-cellfunction in the Prep1-hypomorphic mice with low-dosage (40
mg/kg) streptozotocin administration. As shown in Fig. 3A,this treatment reduced fasting plasma insulin levels by almost40% in both Prep1i/� and wild-type littermates. By day 12 ofstreptozotocin treatment, the wild-type mice developed overthyperglycemia, accompanied by a 12% reduction in bodyweight (P � 0.05; Fig. 3B and C). In contrast, the Prep1i/� miceshowed twofold-smaller changes in plasma glucose levels withno significant weight loss. These data show that, despite theirabsolute hypoinsulinemia, Prep1i/� mice are protected fromstreptozotocin-induced diabetes. Similar experiments couldnot be performed on homozygous Prep1i/i mice because of theirfrailness.
Prep1 gene hypomorphism causes enhanced insulin sensi-tivity in glucose disposal. TUNEL (terminal deoxynucleotidyl-
FIG. 3. Effect of streptozotocin in Prep1-hypomorphic mice. Het-erozygous hypomorphic and control mice (12 mice/group) were sub-jected to daily i.p. administrations of either streptozotocin (40 mg/kg)or citrate buffer for five consecutive days as described in Materials andMethods. Fasting plasma insulin levels (A) and body weight (C) wereassessed both before and 12 days after the end of the treatment. Bloodglucose levels (B) were measured before and at the indicated timesafter streptozotocin administration. Data are means standard devi-ations of values obtained from each group of animals. Asterisks denotestatistically significant differences (*, P � 0.05; **, P � 0.01).
FIG. 4. Insulin action on glucose disposal in Prep1-hypomorphicmice. (A) Six-month-old Prep1-hypomorphic and control mice (23/group) were i.p. injected with insulin (0.75 mU/g body weight) followedby determinations of blood glucose levels at the indicated times. Dataare means SD for each group of mice. (B) Prep1i/� and control micewere subjected to intravenous flash injection of 1 �Ci of 2-DG and toi.p. injection of insulin (0.75 mU/g of body weight). Tibialis muscleswere removed after 30 min and snap-frozen in liquid nitrogen. 2-DGaccumulated in muscle tissue was quantitated as described in Materialsand Methods (B). Data are means plus standard deviations for 10mice/group. Asterisks denote statistically significant differences (*, P �0.05; ***, P � 0.001).
VOL. 28, 2008 Prep1 AND INSULIN SENSITIVITY 5637
at BioC
hiomica N
apoli II on February 11, 2009
mcb.asm
.orgD
ownloaded from
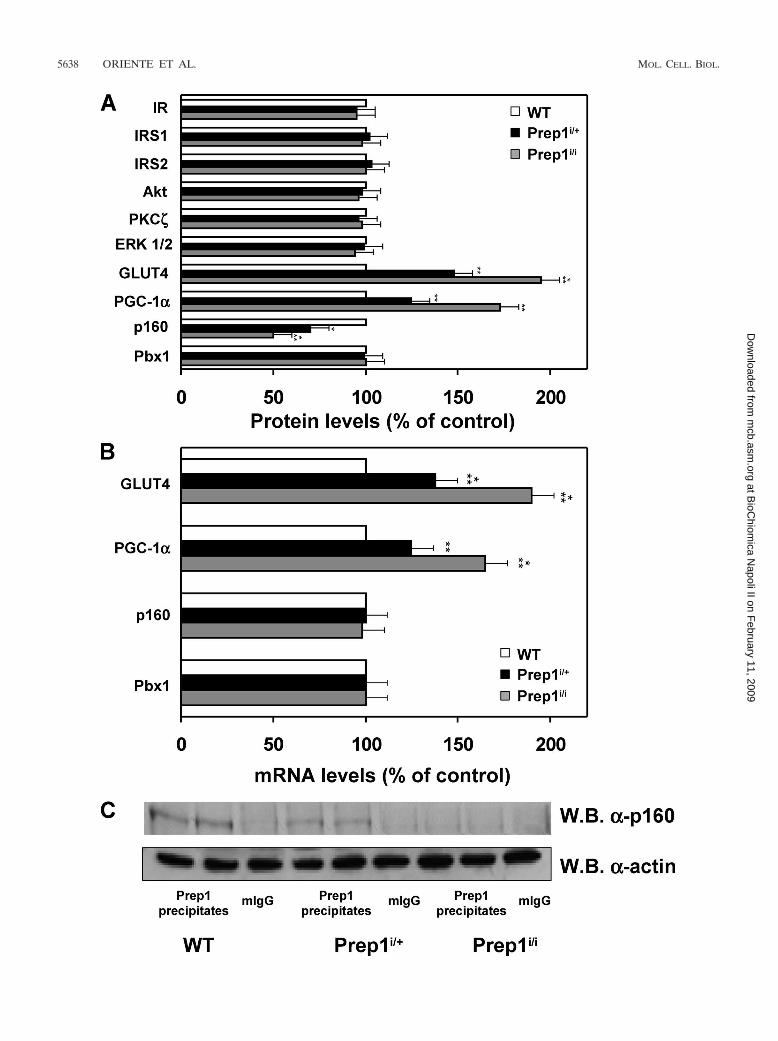
5638 ORIENTE ET AL. MOL. CELL. BIOL.
at BioC
hiomica N
apoli II on February 11, 2009
mcb.asm
.orgD
ownloaded from
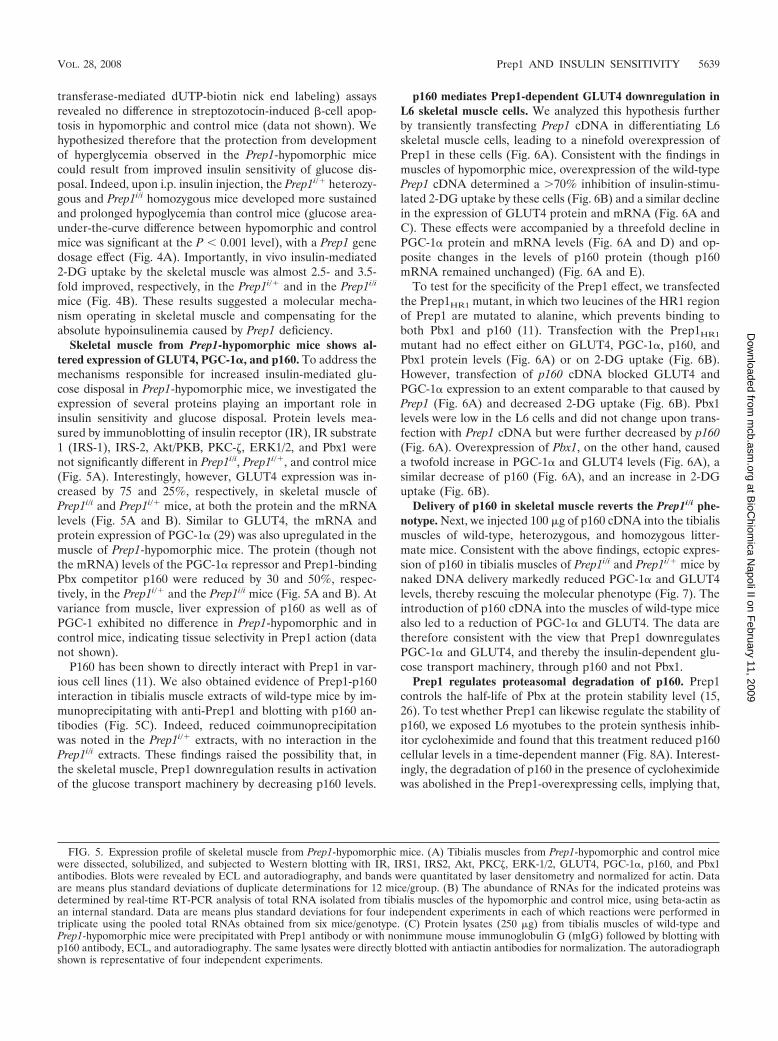
transferase-mediated dUTP-biotin nick end labeling) assaysrevealed no difference in streptozotocin-induced �-cell apop-tosis in hypomorphic and control mice (data not shown). Wehypothesized therefore that the protection from developmentof hyperglycemia observed in the Prep1-hypomorphic micecould result from improved insulin sensitivity of glucose dis-posal. Indeed, upon i.p. insulin injection, the Prep1i/� heterozy-gous and Prep1i/i homozygous mice developed more sustainedand prolonged hypoglycemia than control mice (glucose area-under-the-curve difference between hypomorphic and controlmice was significant at the P � 0.001 level), with a Prep1 genedosage effect (Fig. 4A). Importantly, in vivo insulin-mediated2-DG uptake by the skeletal muscle was almost 2.5- and 3.5-fold improved, respectively, in the Prep1i/� and in the Prep1i/i
mice (Fig. 4B). These results suggested a molecular mecha-nism operating in skeletal muscle and compensating for theabsolute hypoinsulinemia caused by Prep1 deficiency.
Skeletal muscle from Prep1-hypomorphic mice shows al-tered expression of GLUT4, PGC-1�, and p160. To address themechanisms responsible for increased insulin-mediated glu-cose disposal in Prep1-hypomorphic mice, we investigated theexpression of several proteins playing an important role ininsulin sensitivity and glucose disposal. Protein levels mea-sured by immunoblotting of insulin receptor (IR), IR substrate1 (IRS-1), IRS-2, Akt/PKB, PKC-, ERK1/2, and Pbx1 werenot significantly different in Prep1i/i, Prep1i/�, and control mice(Fig. 5A). Interestingly, however, GLUT4 expression was in-creased by 75 and 25%, respectively, in skeletal muscle ofPrep1i/i and Prep1i/� mice, at both the protein and the mRNAlevels (Fig. 5A and B). Similar to GLUT4, the mRNA andprotein expression of PGC-1� (29) was also upregulated in themuscle of Prep1-hypomorphic mice. The protein (though notthe mRNA) levels of the PGC-1� repressor and Prep1-bindingPbx competitor p160 were reduced by 30 and 50%, respec-tively, in the Prep1i/� and the Prep1i/i mice (Fig. 5A and B). Atvariance from muscle, liver expression of p160 as well as ofPGC-1 exhibited no difference in Prep1-hypomorphic and incontrol mice, indicating tissue selectivity in Prep1 action (datanot shown).
P160 has been shown to directly interact with Prep1 in var-ious cell lines (11). We also obtained evidence of Prep1-p160interaction in tibialis muscle extracts of wild-type mice by im-munoprecipitating with anti-Prep1 and blotting with p160 an-tibodies (Fig. 5C). Indeed, reduced coimmunoprecipitationwas noted in the Prep1i/� extracts, with no interaction in thePrep1i/i extracts. These findings raised the possibility that, inthe skeletal muscle, Prep1 downregulation results in activationof the glucose transport machinery by decreasing p160 levels.
p160 mediates Prep1-dependent GLUT4 downregulation inL6 skeletal muscle cells. We analyzed this hypothesis furtherby transiently transfecting Prep1 cDNA in differentiating L6skeletal muscle cells, leading to a ninefold overexpression ofPrep1 in these cells (Fig. 6A). Consistent with the findings inmuscles of hypomorphic mice, overexpression of the wild-typePrep1 cDNA determined a �70% inhibition of insulin-stimu-lated 2-DG uptake by these cells (Fig. 6B) and a similar declinein the expression of GLUT4 protein and mRNA (Fig. 6A andC). These effects were accompanied by a threefold decline inPGC-1� protein and mRNA levels (Fig. 6A and D) and op-posite changes in the levels of p160 protein (though p160mRNA remained unchanged) (Fig. 6A and E).
To test for the specificity of the Prep1 effect, we transfectedthe Prep1HR1 mutant, in which two leucines of the HR1 regionof Prep1 are mutated to alanine, which prevents binding toboth Pbx1 and p160 (11). Transfection with the Prep1HR1
mutant had no effect either on GLUT4, PGC-1�, p160, andPbx1 protein levels (Fig. 6A) or on 2-DG uptake (Fig. 6B).However, transfection of p160 cDNA blocked GLUT4 andPGC-1� expression to an extent comparable to that caused byPrep1 (Fig. 6A) and decreased 2-DG uptake (Fig. 6B). Pbx1levels were low in the L6 cells and did not change upon trans-fection with Prep1 cDNA but were further decreased by p160(Fig. 6A). Overexpression of Pbx1, on the other hand, causeda twofold increase in PGC-1� and GLUT4 levels (Fig. 6A), asimilar decrease of p160 (Fig. 6A), and an increase in 2-DGuptake (Fig. 6B).
Delivery of p160 in skeletal muscle reverts the Prep1i/i phe-notype. Next, we injected 100 �g of p160 cDNA into the tibialismuscles of wild-type, heterozygous, and homozygous litter-mate mice. Consistent with the above findings, ectopic expres-sion of p160 in tibialis muscles of Prep1i/i and Prep1i/� mice bynaked DNA delivery markedly reduced PGC-1� and GLUT4levels, thereby rescuing the molecular phenotype (Fig. 7). Theintroduction of p160 cDNA into the muscles of wild-type micealso led to a reduction of PGC-1� and GLUT4. The data aretherefore consistent with the view that Prep1 downregulatesPGC-1� and GLUT4, and thereby the insulin-dependent glu-cose transport machinery, through p160 and not Pbx1.
Prep1 regulates proteasomal degradation of p160. Prep1controls the half-life of Pbx at the protein stability level (15,26). To test whether Prep1 can likewise regulate the stability ofp160, we exposed L6 myotubes to the protein synthesis inhib-itor cycloheximide and found that this treatment reduced p160cellular levels in a time-dependent manner (Fig. 8A). Interest-ingly, the degradation of p160 in the presence of cycloheximidewas abolished in the Prep1-overexpressing cells, implying that,
FIG. 5. Expression profile of skeletal muscle from Prep1-hypomorphic mice. (A) Tibialis muscles from Prep1-hypomorphic and control micewere dissected, solubilized, and subjected to Western blotting with IR, IRS1, IRS2, Akt, PKC, ERK-1/2, GLUT4, PGC-1�, p160, and Pbx1antibodies. Blots were revealed by ECL and autoradiography, and bands were quantitated by laser densitometry and normalized for actin. Dataare means plus standard deviations of duplicate determinations for 12 mice/group. (B) The abundance of RNAs for the indicated proteins wasdetermined by real-time RT-PCR analysis of total RNA isolated from tibialis muscles of the hypomorphic and control mice, using beta-actin asan internal standard. Data are means plus standard deviations for four independent experiments in each of which reactions were performed intriplicate using the pooled total RNAs obtained from six mice/genotype. (C) Protein lysates (250 �g) from tibialis muscles of wild-type andPrep1-hypomorphic mice were precipitated with Prep1 antibody or with nonimmune mouse immunoglobulin G (mIgG) followed by blotting withp160 antibody, ECL, and autoradiography. The same lysates were directly blotted with antiactin antibodies for normalization. The autoradiographshown is representative of four independent experiments.
VOL. 28, 2008 Prep1 AND INSULIN SENSITIVITY 5639
at BioC
hiomica N
apoli II on February 11, 2009
mcb.asm
.orgD
ownloaded from

FIG. 6. Effect of Prep1 overexpression in L6 skeletal muscle cells. (A) L6 myotubes were transiently transfected with the Prep1, Prep1HR1mutant, p160, and Pbx1 cDNAs or with the empty vector (CTRL). Cells were solubilized, and lysates were analyzed by SDS-PAGE and subjectedto Western blotting with GLUT4, PGC-1, p160, and Pbx1 antibodies. As a control, filters were reblotted with actin antibodies. Bands were revealedby ECL and autoradiography. The autoradiograph shown is representative of five independent experiments. (B) L6 myotubes transfected with thePrep1, Prep1HR1 mutant, p160, and Pbx1 cDNAs or with the empty vector (CTRL) were exposed to 100 nM insulin, and 2-DG uptake was assayedas described in Materials and Methods. Data are means plus standard deviations from four independent experiments, each in duplicate. (C, D, andE) Levels of mRNAs encoding GLUT4, PGC-1�, and p160 in cells transfected with the Prep1, Prep1HR1 mutant, p160, and Pbx1 cDNAs werequantitated by real-time RT-PCR analysis, using beta-actin as an internal standard. Data are means plus standard deviations from fourindependent experiments.
5640 ORIENTE ET AL. MOL. CELL. BIOL.
at BioC
hiomica N
apoli II on February 11, 2009
mcb.asm
.orgD
ownloaded from
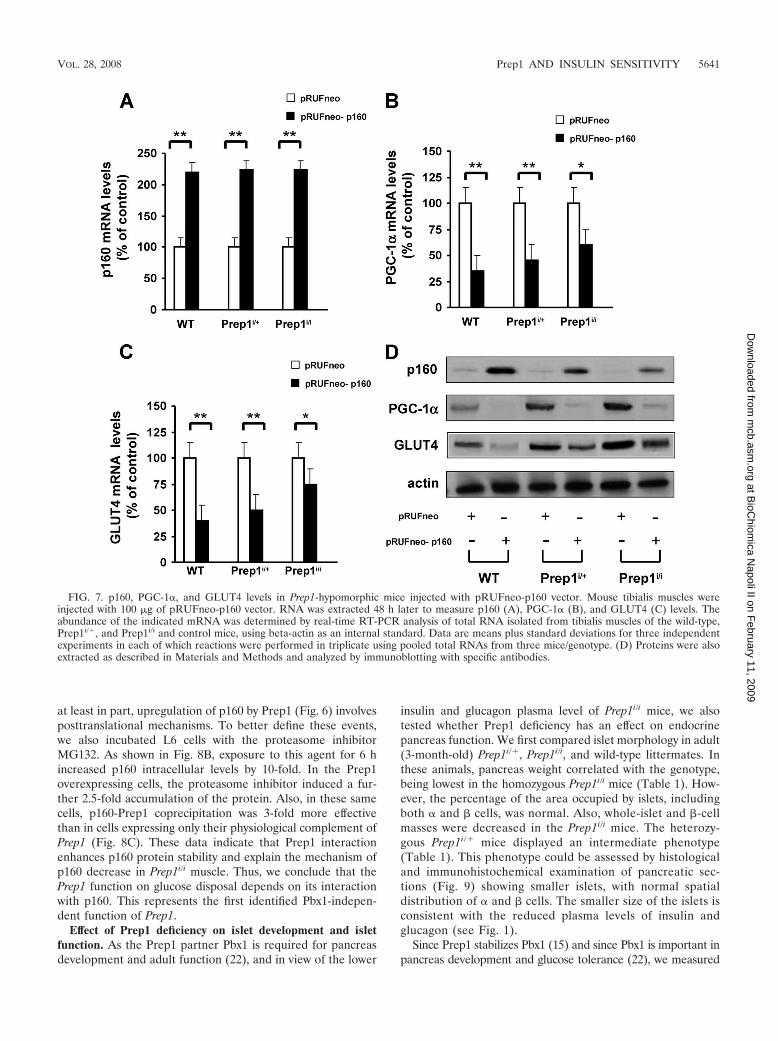
at least in part, upregulation of p160 by Prep1 (Fig. 6) involvesposttranslational mechanisms. To better define these events,we also incubated L6 cells with the proteasome inhibitorMG132. As shown in Fig. 8B, exposure to this agent for 6 hincreased p160 intracellular levels by 10-fold. In the Prep1overexpressing cells, the proteasome inhibitor induced a fur-ther 2.5-fold accumulation of the protein. Also, in these samecells, p160-Prep1 coprecipitation was 3-fold more effectivethan in cells expressing only their physiological complement ofPrep1 (Fig. 8C). These data indicate that Prep1 interactionenhances p160 protein stability and explain the mechanism ofp160 decrease in Prep1i/i muscle. Thus, we conclude that thePrep1 function on glucose disposal depends on its interactionwith p160. This represents the first identified Pbx1-indepen-dent function of Prep1.
Effect of Prep1 deficiency on islet development and isletfunction. As the Prep1 partner Pbx1 is required for pancreasdevelopment and adult function (22), and in view of the lower
insulin and glucagon plasma level of Prep1i/i mice, we alsotested whether Prep1 deficiency has an effect on endocrinepancreas function. We first compared islet morphology in adult(3-month-old) Prep1i/�, Prep1i/i, and wild-type littermates. Inthese animals, pancreas weight correlated with the genotype,being lowest in the homozygous Prep1i/i mice (Table 1). How-ever, the percentage of the area occupied by islets, includingboth � and � cells, was normal. Also, whole-islet and �-cellmasses were decreased in the Prep1i/i mice. The heterozy-gous Prep1i/� mice displayed an intermediate phenotype(Table 1). This phenotype could be assessed by histologicaland immunohistochemical examination of pancreatic sec-tions (Fig. 9) showing smaller islets, with normal spatialdistribution of � and � cells. The smaller size of the islets isconsistent with the reduced plasma levels of insulin andglucagon (see Fig. 1).
Since Prep1 stabilizes Pbx1 (15) and since Pbx1 is important inpancreas development and glucose tolerance (22), we measured
FIG. 7. p160, PGC-1�, and GLUT4 levels in Prep1-hypomorphic mice injected with pRUFneo-p160 vector. Mouse tibialis muscles wereinjected with 100 �g of pRUFneo-p160 vector. RNA was extracted 48 h later to measure p160 (A), PGC-1� (B), and GLUT4 (C) levels. Theabundance of the indicated mRNA was determined by real-time RT-PCR analysis of total RNA isolated from tibialis muscles of the wild-type,Prep1i/�, and Prep1i/i and control mice, using beta-actin as an internal standard. Data are means plus standard deviations for three independentexperiments in each of which reactions were performed in triplicate using pooled total RNAs from three mice/genotype. (D) Proteins were alsoextracted as described in Materials and Methods and analyzed by immunoblotting with specific antibodies.
VOL. 28, 2008 Prep1 AND INSULIN SENSITIVITY 5641
at BioC
hiomica N
apoli II on February 11, 2009
mcb.asm
.orgD
ownloaded from
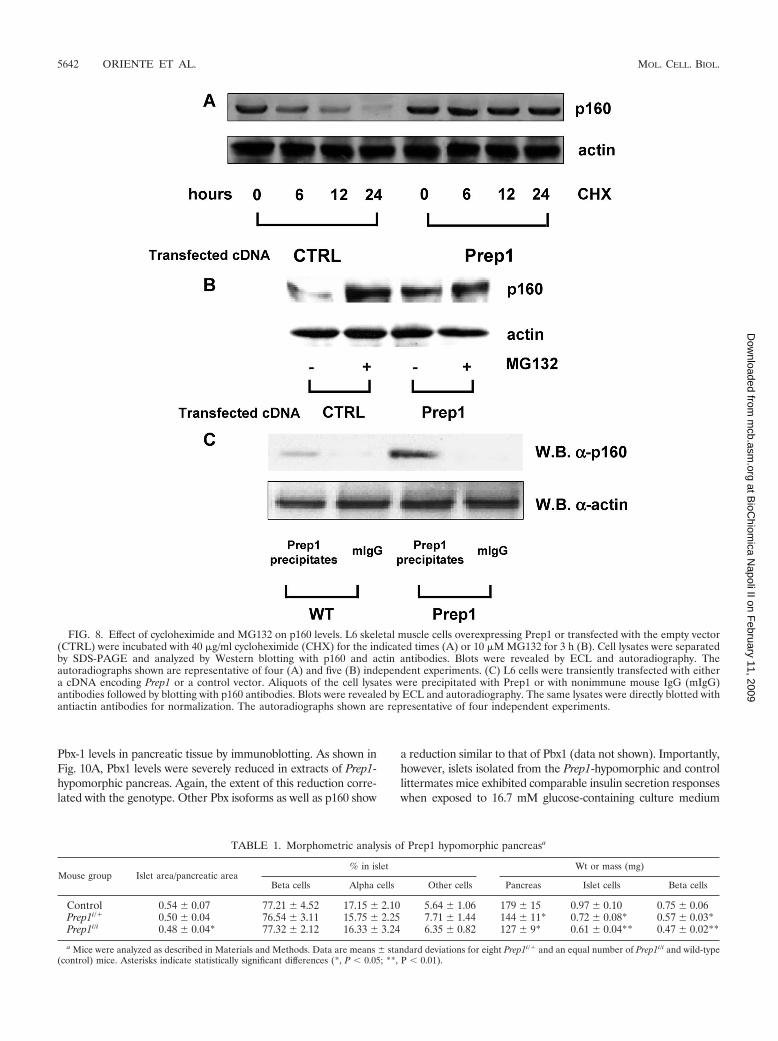
Pbx-1 levels in pancreatic tissue by immunoblotting. As shown inFig. 10A, Pbx1 levels were severely reduced in extracts of Prep1-hypomorphic pancreas. Again, the extent of this reduction corre-lated with the genotype. Other Pbx isoforms as well as p160 show
a reduction similar to that of Pbx1 (data not shown). Importantly,however, islets isolated from the Prep1-hypomorphic and controllittermates mice exhibited comparable insulin secretion responseswhen exposed to 16.7 mM glucose-containing culture medium
FIG. 8. Effect of cycloheximide and MG132 on p160 levels. L6 skeletal muscle cells overexpressing Prep1 or transfected with the empty vector(CTRL) were incubated with 40 �g/ml cycloheximide (CHX) for the indicated times (A) or 10 �M MG132 for 3 h (B). Cell lysates were separatedby SDS-PAGE and analyzed by Western blotting with p160 and actin antibodies. Blots were revealed by ECL and autoradiography. Theautoradiographs shown are representative of four (A) and five (B) independent experiments. (C) L6 cells were transiently transfected with eithera cDNA encoding Prep1 or a control vector. Aliquots of the cell lysates were precipitated with Prep1 or with nonimmune mouse IgG (mIgG)antibodies followed by blotting with p160 antibodies. Blots were revealed by ECL and autoradiography. The same lysates were directly blotted withantiactin antibodies for normalization. The autoradiographs shown are representative of four independent experiments.
TABLE 1. Morphometric analysis of Prep1 hypomorphic pancreasa
Mouse group Islet area/pancreatic area% in islet Wt or mass (mg)
Beta cells Alpha cells Other cells Pancreas Islet cells Beta cells
Control 0.54 0.07 77.21 4.52 17.15 2.10 5.64 1.06 179 15 0.97 0.10 0.75 0.06Prep1i/� 0.50 0.04 76.54 3.11 15.75 2.25 7.71 1.44 144 11* 0.72 0.08* 0.57 0.03*Prep1i/i 0.48 0.04* 77.32 2.12 16.33 3.24 6.35 0.82 127 9* 0.61 0.04** 0.47 0.02**
a Mice were analyzed as described in Materials and Methods. Data are means standard deviations for eight Prep1i/� and an equal number of Prep1i/i and wild-type(control) mice. Asterisks indicate statistically significant differences (*, P � 0.05; **, P � 0.01).
5642 ORIENTE ET AL. MOL. CELL. BIOL.
at BioC
hiomica N
apoli II on February 11, 2009
mcb.asm
.orgD
ownloaded from
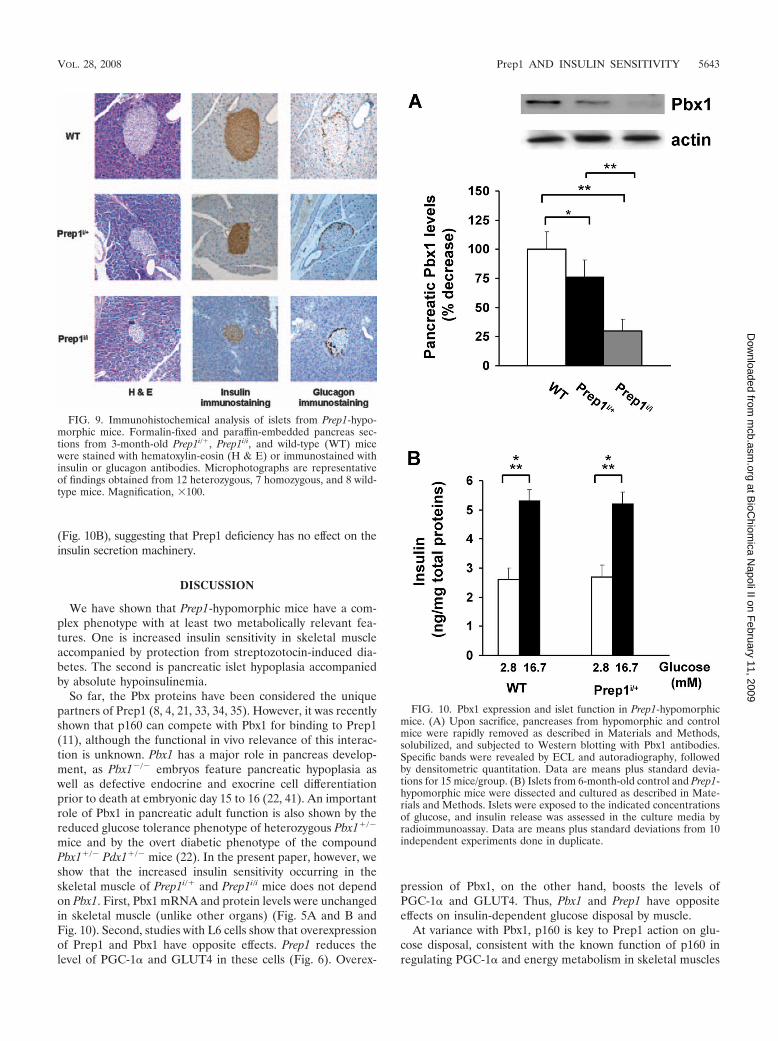
(Fig. 10B), suggesting that Prep1 deficiency has no effect on theinsulin secretion machinery.
DISCUSSION
We have shown that Prep1-hypomorphic mice have a com-plex phenotype with at least two metabolically relevant fea-tures. One is increased insulin sensitivity in skeletal muscleaccompanied by protection from streptozotocin-induced dia-betes. The second is pancreatic islet hypoplasia accompaniedby absolute hypoinsulinemia.
So far, the Pbx proteins have been considered the uniquepartners of Prep1 (8, 4, 21, 33, 34, 35). However, it was recentlyshown that p160 can compete with Pbx1 for binding to Prep1(11), although the functional in vivo relevance of this interac-tion is unknown. Pbx1 has a major role in pancreas develop-ment, as Pbx1�/� embryos feature pancreatic hypoplasia aswell as defective endocrine and exocrine cell differentiationprior to death at embryonic day 15 to 16 (22, 41). An importantrole of Pbx1 in pancreatic adult function is also shown by thereduced glucose tolerance phenotype of heterozygous Pbx1�/�
mice and by the overt diabetic phenotype of the compoundPbx1�/� Pdx1�/� mice (22). In the present paper, however, weshow that the increased insulin sensitivity occurring in theskeletal muscle of Prep1i/� and Prep1i/i mice does not dependon Pbx1. First, Pbx1 mRNA and protein levels were unchangedin skeletal muscle (unlike other organs) (Fig. 5A and B andFig. 10). Second, studies with L6 cells show that overexpressionof Prep1 and Pbx1 have opposite effects. Prep1 reduces thelevel of PGC-1� and GLUT4 in these cells (Fig. 6). Overex-
pression of Pbx1, on the other hand, boosts the levels ofPGC-1� and GLUT4. Thus, Pbx1 and Prep1 have oppositeeffects on insulin-dependent glucose disposal by muscle.
At variance with Pbx1, p160 is key to Prep1 action on glu-cose disposal, consistent with the known function of p160 inregulating PGC-1� and energy metabolism in skeletal muscles
FIG. 9. Immunohistochemical analysis of islets from Prep1-hypo-morphic mice. Formalin-fixed and paraffin-embedded pancreas sec-tions from 3-month-old Prep1i/�, Prep1i/i, and wild-type (WT) micewere stained with hematoxylin-eosin (H & E) or immunostained withinsulin or glucagon antibodies. Microphotographs are representativeof findings obtained from 12 heterozygous, 7 homozygous, and 8 wild-type mice. Magnification, �100.
FIG. 10. Pbx1 expression and islet function in Prep1-hypomorphicmice. (A) Upon sacrifice, pancreases from hypomorphic and controlmice were rapidly removed as described in Materials and Methods,solubilized, and subjected to Western blotting with Pbx1 antibodies.Specific bands were revealed by ECL and autoradiography, followedby densitometric quantitation. Data are means plus standard devia-tions for 15 mice/group. (B) Islets from 6-month-old control and Prep1-hypomorphic mice were dissected and cultured as described in Mate-rials and Methods. Islets were exposed to the indicated concentrationsof glucose, and insulin release was assessed in the culture media byradioimmunoassay. Data are means plus standard deviations from 10independent experiments done in duplicate.
VOL. 28, 2008 Prep1 AND INSULIN SENSITIVITY 5643
at BioC
hiomica N
apoli II on February 11, 2009
mcb.asm
.orgD
ownloaded from

(13). Indeed, we show that Prep1 increases the levels of p160in muscle cells (Fig. 6). Overexpression of p160 in the L6cells and direct delivery of a p160 cDNA in the muscle ofPrep1i/� and Prep1i/i mice mimic the effect of Prep1, decreasingPGC-1� and GLUT4 expression. No change of PGC-1�mRNA or protein was detected in the liver of the Prep1-hypomorphic mice (data not shown), suggesting that the inter-plays between these molecules are cell type selective. To-gether, these data are in agreement with several publishedpapers reporting a positive correlation between PGC-1� andGLUT4 in rodent (29) and human (2) muscle cells and inhumans in vivo (37) and may account for the enhanced insulinsensitivity in muscles of Prep1-hypomorphic mice (Fig. 6). Pre-vious work by Miura et al. demonstrated GLUT4 downregu-lation in transgenic mice overexpressing PGC-1� (31). How-ever, as suggested by those authors, a reduction in the lower-molecular-weight PGC-1� form might have caused thenegative correlation between PGC-1� and GLUT4 levels inthis model.
Cycloheximide experiments demonstrated that the regula-tion of the p160 expression by Prep1 was, at least in part,posttranslational. Furthermore, the stabilizing effect of MG132shows that p160 degradation involves the proteasome. In thepresence of excess Prep1, the proteasome inhibitor had a muchsmaller effect (Fig. 8), indicating that Prep1 interaction stabi-lizes p160 and induces p160 escape from proteasomal degra-dation.
The present results highlight a novel regulatory mechanismof insulin sensitivity occurring in the skeletal muscle upstreamof the p160/PGC-1� complex and operated by the balance ofp160 and Pbx1. When p160 exceeds Pbx1, it binds Prep1, isstabilized, and represses GLUT4 and insulin sensitivity. WhenPbx1 is present in excess, the reverse occurs. These regulatorymechanisms must be more complex, however, since one wouldotherwise expect that a decrease in Pbx1 would directly lead todecreased insulin sensitivity, which is not the case. Indeed,Pbx1�/� mice display a slightly improved insulin sensitivityaccompanied by early impairment of glucose tolerance (22).These mice differ from both the Prep1i/i and the Prep1i/� mice,which show a significant enhancement in insulin sensitivity andexhibit no tendency to develop abnormal glucose tolerance.Furthermore, Prep1-hypomorphic mice are protected fromstreptozotocin-induced diabetes in spite of their decreased�-cell mass and circulating insulin levels. Based on TUNELassays, this protection was independent of differences in strep-tozotocin-induced �-cell apoptosis between the hypomorphicand control mice (data not shown). The increase in the sensi-tivity to insulin action on glucose disposal and on glucoseuptake by the skeletal muscle, together with the reduced glu-cagon levels, may contribute to the stability of glucose toler-ance in the Prep1-hypomorphic mice.
Another important aspect of our work is that Prep1 andPbx1 have distinct roles in pancreas function in the adult.Indeed, Prep1 binds and stabilizes Pbx proteins in a cell-spe-cific manner (15, 26, 38, 46). Consistently, we show that thelevel of Pbx1 in Prep1i/i hypomorphic mice is decreased in theadult pancreas (Fig. 10A), though not in the skeletal muscle(Fig. 6). Therefore, the Prep1i/i animals were expected to dis-play a pancreatic phenotype similar to that of Pbx1�/� mice,i.e., disrupted architecture of the pancreatic islets and hypoin-
sulinemia (22). Surprisingly, Prep1-hypomorphic mice werefound to have normal islet architecture. However, they didshow islet hypoplasia, accompanied by significantly reducedabsolute insulin levels (both basal and postloading). Why thepancreatic phenotype of the Prep1i/i mice, which includes astrong reduction of Pbx1 pancreas expression (Fig. 10A), isdifferent from that of the Pbx1�/� heterozygous mice (22) isnot completely clear. The deficiency of Prep1 might have beencomplemented by the overexpression of other family members.This is unlikely, however, as no increase of Prep2 or Meisproteins is observed in Prep1i/i embryos (15). More simply, thereduction of Pbx1 in Prep1-hypomorphic mice may not beenough to generate the phenotype of the Pbx�/� mouse. It isalso possible that other TALE family members (e.g., one of theMeis genes) cooperate with Pbx1 in pancreas development andin functions where Prep1 is not involved. Finally, it is possiblethat the islet phenotype of the Prep1-hypomorphic mice isestablished as an adaptive response to their enhanced insulinsensitivity. Indeed, islets isolated from Prep1i/� mice exhibit anormal secretory response to glucose in culture (Fig. 10B). Adecreased �-cell mass in conditions of chronically improvedinsulin sensitivity has been previously observed in mice. Forinstance, pancreatic �-cell area is decreased in protein tyrosinephosphatase 1b-deficient mice owing to increased peripheralinsulin sensitivity and reduced insulin requirement (25).
The present results may have clinical relevance. In individ-uals with normal glucose tolerance, insulin sensitivity and se-cretion span a wide range and are determined by a number ofdifferent genes (16, 28). Variability in some of these genes isknown to provide an important contribution to major humandisorders, including type 2 diabetes (16, 17). For example,Pdx1 point mutations cause impaired insulin secretion and arare form of non-insulin-dependent diabetes formerly termedMODY4 (43). On the basis of the results of this study, Prep1might also be involved in the pathogenesis of these diseases.Whether genetic variability at the Prep1 locus affects insulinsensitivity in humans is an important issue presently underinvestigation in the laboratory.
ACKNOWLEDGMENTS
This work was supported, in part, by the European Community’sFP6 EUGENE2 (contract LSHM-CT-2004-512013) and FP7PREPROBEDIA (grant 201681), by an EFSD/Lilly grant, by theAssociazione Italiana per la Ricerca sul Cancro (AIRC), and by theMinistero dell’Universita e della Ricerca Scientifica (PRIN andFIRB RBNE0155LB). The financial support of Telethon—Italy isgratefully acknowledged. V. M. Diaz was a recipient of a MarieCurie Fellowship from the EU.
We are grateful to A. Zabatta for helping with the morphometricanalysis. The technical help of Salvatore Sequino is also acknowledged.
REFERENCES
1. Ahlgren, U., J. Jonsson, L. Jonsson, K. Simu, and H. Edlund. 1998. Beta-cell-specific inactivation of the mouse Ipf1/Pdx1 gene results in loss of thebeta-cell phenotype and maturity onset diabetes. Genes Dev. 12:1763–1768.
2. Al-Khalili, L., M. Forsgren, K. Kannisto, J. R. Zierath, F. Lonnqvist, and A.Krook. 2005. Enhanced insulin-stimulated glycogen synthesis in response toinsulin, metformin or rosiglitazone is associated with increased mRNA ex-pression of GLUT4 and peroxisomal proliferator activator receptor gammaco-activator 1. Diabetologia 48:1173–1179.
3. Berthelsen, J., V. Zappavigna, F. Mavilio, and F. Blasi. 1998a. Prep1, a novelfunctional partner of Pbx proteins. EMBO J. 17:1423–1433.
4. Berthelsen, J., V. Zappavigna, E. Ferretti, F. Mavilio, and F. Blasi. 1998b.The novel homeoprotein Prep1 modulates Pbx-Hox protein cooperativity.EMBO J. 17:1434–1445.
5644 ORIENTE ET AL. MOL. CELL. BIOL.
at BioC
hiomica N
apoli II on February 11, 2009
mcb.asm
.orgD
ownloaded from

5. Berthelsen, J., C. Kilstrup-Nielsen, F. Blasi, F. Mavilio, and V. Zappavigna.1999. The subcellular localization of PBX1 and EXD proteins depends onnuclear import and export signals and is modulated by association withPREP1 and HTH. Genes Dev. 13:946–953.
6. Calvo, K. R., P. Knoepfler, S. McGrath, and M. P. Kamps. 1999. An inhib-itory switch derepressed by pbx, hox, and Meis/Prep1 partners regulatesDNA-binding by pbx1 and E2a-pbx1 and is dispensable for myeloid immor-talization by E2a-pbx1. Oncogene 18:8033–8043.
7. Caruso, M., C. Miele, F. Oriente, A. Maitan, G. Bifulco, F. Andreozzi, G.Condorelli, P. Formisano, and F. Beguinot. 1999. In L6 skeletal muscle cells,glucose induces cytosolic translocation of protein kinase C-alpha and trans-activates the insulin receptor kinase. J. Biol. Chem. 274:28637–28644.
8. Chen, H., C. Dossier, Y. Nakamura, A. Lynn, A. Chakravarti, and S. E.Antonarakis. 1997. Cloning of a novel homeobox-containing gene,PKNOX1, and mapping to human chromosome 21q22.3. Genomics 41:193–200.
9. Deflorian, G., N. Tiso, E. Ferretti, D. Meyer, F. Blasi, M. Bortolussi, and F.Argenton. 2004. Prep1.1 has essential genetic functions in hindbrain devel-opment and cranial neural crest cell differentiation. Development 131:613–627.
10. Devedjian, J. C., M. George, A. Casellas, A. Pujol, J. Visa, M. Pelegrin, L.Gros, and F. Bosch. 2000. Transgenic mice overexpressing insulin-likegrowth factor-II in beta cells develop type 2 diabetes. J. Clin. Investig.105:731–740.
11. Diaz, V. M., S. Mori, E. Longobardi, G. Menendez, C. Ferrai, R. A. Keough,A. Bachi, and F. Blasi. 2007. p160 myb-binding-protein interacts with Prep1and inhibits its transcriptional activity. Mol. Cell. Biol. 27:7981–7990.
12. Dutta, S., M. Gannon, B. Peers, C. Wright, S. Bonner-Weir, and M. Mont-miny. 2001. PDX:PBX complexes are required for normal proliferation ofpancreatic cells during development. Proc. Natl. Acad. Sci. USA 98:1065–1070.
13. Fan, M., J. Rhee, J. St-Pierre, C. Handschin, P. Puigserver, J. Lin, S. Jaeger,H. Erdjument-Bromage, P. Tempst, and B. M. Spiegelman. 2004. Suppres-sion of mitochondrial respiration through recruitment of p160 myb bindingprotein to PGC-1�: modulation by p38 MAPK. Genes Dev. 18:278–289.
14. Ferre, P., A. Leturque, A. F. Burnol, L. Penicaud, and J. Girard. 1985. Amethod to quantify glucose utilization in vivo in skeletal muscle and whiteadipose tissue of the anaesthetized rat. Biochem. J. 228:103–110.
15. Ferretti, E., J. C. Villaescusa, P. Di Rosa, L. C. Fernandez-Diaz, E. Longobardi,R. Mazzieri, A. Miccio, N. Micali, L. Selleri, G. Ferrari, and F. Blasi. 2006.Hypomorphic mutation of the TALE gene Prep1 (pKnox1) causes a majorreduction of Pbx and Meis proteins and a pleiotropic embryonic phenotype.Mol. Cell. Biol. 26:5650–5662.
16. Freeman, H., and R. D. Cox. 2006. Type-2 diabetes: a cocktail of geneticdiscovery. Hum. Mol. Genet. 15:R202–209.
17. Freimer, N. B., and C. Sabatti. 2007. Variants in common diseases. Nature445:828–830.
18. Hani, E. H., J. Hager, A. Philippi, F. Demenais, P. Froguel, and N. Vionnet.1997. Mapping NIDDM susceptibility loci in French families: studies withmarkers in the region of NIDDM1 on chromosome 2q. Diabetes 46:1225–1226.
19. Horiki, M., E. Yamato, H. Ikegami, T. Ogihara, and J. Miyazaki. 2004.Needleless in vivo gene transfer into muscles by jet injection in combinationwith electroporation. J. Gene Med. 6:1134–1138.
20. Jaw, T. J., L. R. You, P. S. Knoepfler, L. C. Yao, C. Y. Pai, C. Y. Tang, L. P.Chang, J. Berthelsen, F. Blasi, M. P. Kamps, and Y. H. Sun. 2000. Directinteraction of two homeoproteins, homothorax and extradenticle, is essentialfor EXD nuclear localization and function. Mech. Dev. 91:279–291.
21. Kamps, M. P., C. Murre, X. H. Sun, and D. Baltimore. 1990. A new ho-meobox gene contributes the DNA binding domain of the t(1;19) transloca-tion protein in pre-B ALL. Cell 60:547–555.
22. Kim, S. K., L. Selleri, J. S. Lee, A. Y. Zhang, X. Gu, Y. Jacobs, and M. L.Cleary. 2002. Pbx1 inactivation disrupts pancreas development and in Ipf1deficient mice promotes diabetes mellitus. Nat. Genet. 30:430–435.
23. Kitamura, T., Y. Kido, S. Nef, J. Merenmies, L. F. Parada, and D. Accili.2001. Preserved pancreatic beta-cell development and function in mice lack-ing the insulin receptor-related receptor. Mol. Cell. Biol. 21:5624–5630.
24. Knoepfler, P. S., K. R. Calvo, H. Chen, S. E. Antonarakis, and M. P. Kamps.1997. Meis1 and pKnox1 bind DNA cooperatively with Pbx1 utilizing aninteraction surface disrupted in oncoprotein E2a-Pbx1. Proc. Natl. Acad. Sci.USA 94:14553–14558.
25. Kushner, J. A., F. G. Haj, L. D. Klaman, M. A. Dow, B. B. Kahn, B. G. Neel,and M. F. White. 2004. Islet-sparing effects of protein tyrosine phos-phatase-1b deficiency delays onset of diabetes in IRS2 knockout mice. Dia-betes 53:61–66.
26. Longobardi, E., and F. Blasi. 2003. Overexpression of PREP-1 in F9 terato-
carcinoma cells leads to a functionally relevant increase of PBX-2 by pre-venting its degradation. J. Biol. Chem. 278:39235–39241.
27. Macfarlane, W. M., T. M. Frayling, S. Ellard, J. C. Evans, L. I. Allen, M. P.Bulman, S. Ayres, M. Shepherd, P. Clark, A. Millward, A. Demaine, T.Wilkin, K. Docherty, and A. T. Hattersley. 1999. Missense mutations in theinsulin promoter factor-1 gene predispose to type 2 diabetes. J. Clin. Inves-tig. 104:R33–39.
28. Marchetti, P., S. Del Prato, R. Lupi, and S. Del Guerra. 2006. The pancreaticbeta-cell in human type 2 diabetes. Nutr. Metab. Cardiovasc. Dis. 16:S3–S6.
29. Michael, L. F., Z. Wu, R. B. Cheatham, P. Puigserver, G. Adelmant, J. J.Lehman, D. P. Kelly, and B. M. Spiegelman. 2001. Restoration of insulin-sensitive glucose transporter (GLUT4) gene expression in muscle cells by thetranscriptional coactivator PGC-1. Proc. Natl. Acad. Sci. USA 98:3820–3825.
30. Miele, C., M. Caruso, V. Calleja, R. Auricchio, F. Oriente, P. Formisano, G.Condorelli, A. Cafieri, D. Sawka-Verhelle, E. Van Obberghen, and F. Begui-not. 1999. Differential role of insulin receptor substrate (IRS)-1 and IRS-2 inL6 skeletal muscle cells expressing the Arg11523Gln insulin receptor.J. Biol. Chem. 274:3094–3102.
31. Miura, S., Y. Kai, M. Ono, and O. Ezaki. 2003. Overexpression of peroxi-some proliferator-activated receptor gamma coactivator-1� down-regulatesGLUT4 mRNA in skeletal muscles. J. Biol. Chem. 278:31385–31390.
32. Moens, C. B., and L. Selleri. 2006. Hox cofactors in vertebrate development.Dev. Biol. 291:193–206.
33. Monica, K., N. Galili, J. Nourse, D. Saltman, and M. L. Cleary. 1991. PBX2and PBX3, new homeobox genes with extensive homology to the humanproto-oncogene PBX1. Mol. Cell. Biol. 11:6149–6157.
34. Moskow, J. J., F. Bullrich, K. Huebner, I. O. Daar, and A. M. Buchberg.1995. Meis1, a PBX1-related homeobox gene involved in myeloid leukemiain BXH-2 mice. Mol. Cell. Biol. 15:5434–5443.
35. Nourse, J., J. D. Mellentin, N. Galili, J. Wilkinson, E. Stanbridge, S. D.Smith, and M. L. Cleary. 1990. Chromosomal translocation t(1;19) results insynthesis of a homeobox fusion mRNA that codes for a potential chimerictranscription factor. Cell 60:535–545.
36. Pai, C. Y., T. S. Kuo, T. J. Jaw, E. Kurant, C. T. Chen, D. A. Bessarab, A.Salzberg, and Y. H. Sun. 1998. The Homothorax homeoprotein activates thenuclear localization of another homeoprotein, extradenticle, and suppresseseye development in Drosophila. Genes Dev. 12:435–446.
37. Patti, M. E., A. J. Butte, S. Crunkhorn, K. Cusi, R. Berria, S. Kashyap, Y.Miyazaki, I. Kohane, M. Costello, R. Saccone, E. J. Landaker, A. B. Gold-fine, E. Mun, R. DeFronzo, J. Finlayson, C. R. Kahn, and L. J. Mandarino.2003. Coordinated reduction of genes of oxidative metabolism in humanswith insulin resistance and diabetes: potential role of PGC-1 and NRF1.Proc. Natl. Acad. Sci. USA 100:8466–8471.
38. Penkov, D., P. Di Rosa, L. Fernandez Diaz, V. Basso, E. Ferretti, F. Grassi,A. Mondino, and F. Blasi. 2005. Involvement of Prep1 in the �� T-cellreceptor T-lymphocytic potential of hematopoietic precursors. Mol. Cell.Biol. 25:10768–10781.
39. Rieckhof, G. E., F. Casares, H. D. Ryoo, M. Abu-Shaar, and R. S. Mann.1997. Nuclear translocation of extradenticle requires homothorax, whichencodes an extradenticle-related homeodomain protein. Cell 91:171–183.
40. Rizzuto, G., M. Cappelletti, D. Maione, R. Savino, D. Lazzaro, P. Costa, I.Mathiesen, R. Cortese, G. Ciliberto, R. Laufer, N. La Monica, and E.Fattori. 1999. Efficient and regulated erythropoietin production by nakedDNA injection and muscle electroporation. Proc. Natl. Acad. Sci. USA96:6417–6422.
41. Selleri, L., M. J. Depew, Y. Jacobs, S. K. Chanda, K. Y. Tsang, K. S. Cheah,J. L. Rubenstein, S. O’Gorman, and M. L. Cleary. 2001. Requirement forPbx1 in skeletal patterning and programming chondrocyte proliferation anddifferentiation. Development 128:3543–3557.
42. Somogyi, M. 1945. Determination of blood sugar. J. Biol. Chem. 160:69–73.43. Stoffers, D. A., J. Ferrer, W. L. Clarkem, and J. F. Habener. 1997. Early-
onset type-II diabetes mellitus (MODY4) linked to IPF1. Nat. Genet. 17:138–139.
44. Tavner, F. J., R. Simpson, S. Tashiro, D. Favier, N. A. Jenkins, D. J. Gilbert,N. J. Copeland, E. M. Macmillan, J. Lutwyche, R. A. Keough, S. Ishii, andT. J. Gonda. 1998. Molecular cloning reveals that the p160 Myb-bindingprotein is a novel, predominantly nucleolar protein which may play a role intransactivation by Myb. Mol. Cell. Biol. 18:989–1002.
45. Vigliotta, G., C. Miele, S. Santopietro, G. Portella, A. Perfetti, M. A. Maitan,A. Cassese, F. Oriente, A. Trencia, F. Fiory, C. Romano, C. Tiveron, L.Tatangelo, G. Troncone, P. Formisano, and F. Beguinot. 2004. Overexpres-sion of the ped/pea-15 gene causes diabetes by impairing glucose-stimulatedinsulin secretion in addition to insulin action. Mol. Cell. Biol. 24:5005–5015.
46. Waskiewicz, A. J., H. A. Rikhof, and C. B. Moens. 2002. Eliminating zebrafishpbx proteins reveals a hindbrain ground state. Dev. Cell 3:723–733.
VOL. 28, 2008 Prep1 AND INSULIN SENSITIVITY 5645
at BioC
hiomica N
apoli II on February 11, 2009
mcb.asm
.orgD
ownloaded from
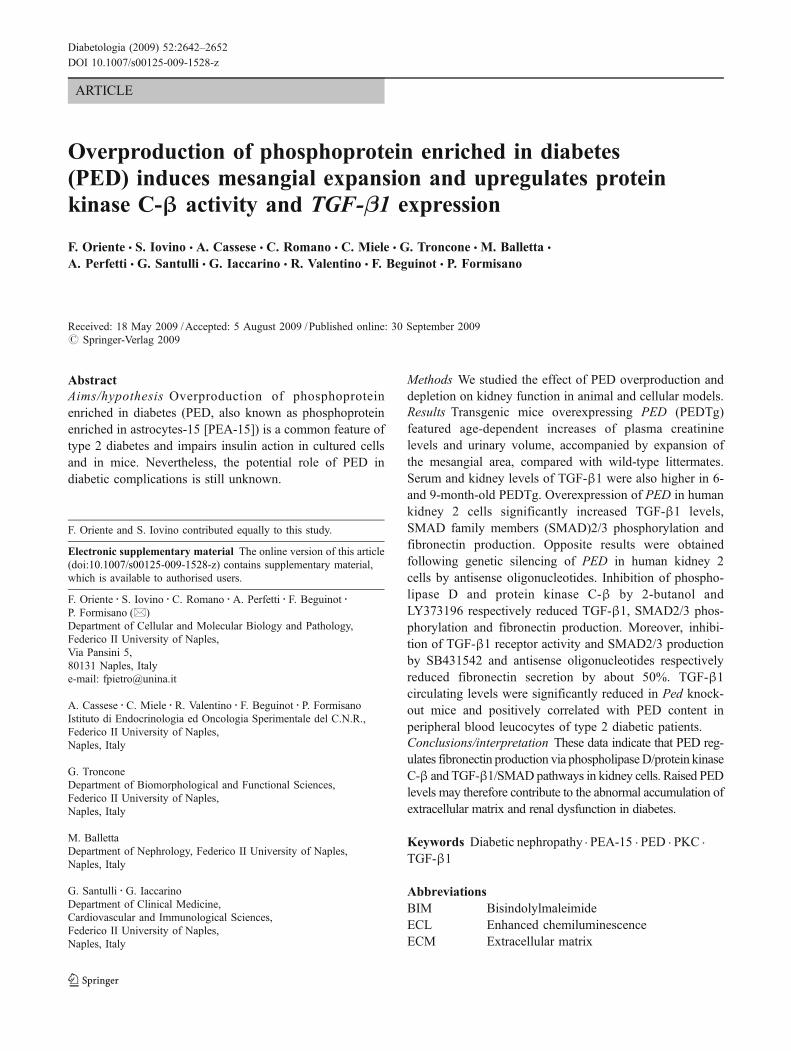
ARTICLE
Overproduction of phosphoprotein enriched in diabetes(PED) induces mesangial expansion and upregulates proteinkinase C-β activity and TGF-β1 expression
F. Oriente & S. Iovino & A. Cassese & C. Romano & C. Miele & G. Troncone & M. Balletta &
A. Perfetti & G. Santulli & G. Iaccarino & R. Valentino & F. Beguinot & P. Formisano
Received: 18 May 2009 /Accepted: 5 August 2009 /Published online: 30 September 2009# Springer-Verlag 2009
AbstractAims/hypothesis Overproduction of phosphoproteinenriched in diabetes (PED, also known as phosphoproteinenriched in astrocytes-15 [PEA-15]) is a common feature oftype 2 diabetes and impairs insulin action in cultured cellsand in mice. Nevertheless, the potential role of PED indiabetic complications is still unknown.
Methods We studied the effect of PED overproduction anddepletion on kidney function in animal and cellular models.Results Transgenic mice overexpressing PED (PEDTg)featured age-dependent increases of plasma creatininelevels and urinary volume, accompanied by expansion ofthe mesangial area, compared with wild-type littermates.Serum and kidney levels of TGF-β1 were also higher in 6-and 9-month-old PEDTg. Overexpression of PED in humankidney 2 cells significantly increased TGF-β1 levels,SMAD family members (SMAD)2/3 phosphorylation andfibronectin production. Opposite results were obtainedfollowing genetic silencing of PED in human kidney 2cells by antisense oligonucleotides. Inhibition of phospho-lipase D and protein kinase C-β by 2-butanol andLY373196 respectively reduced TGF-β1, SMAD2/3 phos-phorylation and fibronectin production. Moreover, inhibi-tion of TGF-β1 receptor activity and SMAD2/3 productionby SB431542 and antisense oligonucleotides respectivelyreduced fibronectin secretion by about 50%. TGF-β1circulating levels were significantly reduced in Ped knock-out mice and positively correlated with PED content inperipheral blood leucocytes of type 2 diabetic patients.Conclusions/interpretation These data indicate that PED reg-ulates fibronectin production via phospholipaseD/protein kinaseC-β and TGF-β1/SMADpathways in kidney cells. Raised PEDlevels may therefore contribute to the abnormal accumulation ofextracellular matrix and renal dysfunction in diabetes.
Keywords Diabetic nephropathy . PEA-15 . PED . PKC .
TGF-β1
AbbreviationsBIM BisindolylmaleimideECL Enhanced chemiluminescenceECM Extracellular matrix
F. Oriente and S. Iovino contributed equally to this study.
Electronic supplementary material The online version of this article(doi:10.1007/s00125-009-1528-z) contains supplementary material,which is available to authorised users.
F. Oriente : S. Iovino : C. Romano :A. Perfetti : F. Beguinot :P. Formisano (*)Department of Cellular and Molecular Biology and Pathology,Federico II University of Naples,Via Pansini 5,80131 Naples, Italye-mail: [email protected]
A. Cassese :C. Miele : R. Valentino : F. Beguinot : P. FormisanoIstituto di Endocrinologia ed Oncologia Sperimentale del C.N.R.,Federico II University of Naples,Naples, Italy
G. TronconeDepartment of Biomorphological and Functional Sciences,Federico II University of Naples,Naples, Italy
M. BallettaDepartment of Nephrology, Federico II University of Naples,Naples, Italy
G. Santulli :G. IaccarinoDepartment of Clinical Medicine,Cardiovascular and Immunological Sciences,Federico II University of Naples,Naples, Italy
Diabetologia (2009) 52:2642–2652DOI 10.1007/s00125-009-1528-z
HK2 cells Human kidney 2 cellsPBL Peripheral blood leucocytePED Phosphoprotein enriched in diabetes/
phosphoprotein enriched in astrocytes-15Ped-KO Ped/Pea-15 knockout micePEDTg Transgenic mice overexpressing PEDPKC Protein kinase CPLD Phospholipase DSMAD SMAD family member
Introduction
Diabetic nephropathy is a frequent complication of type 1and type 2 diabetes mellitus and is currently considered theleading cause of end-stage renal disease [1]. Whilethickening of the glomerular basement membrane, glomer-ular hypertrophy and mesangial expansion are well knownfeatures of diabetic nephropathy, the pathogenesis of thesealterations is not very clear yet. The DCCT, UK ProspectiveDiabetes Study (UKPDS) and Action in Diabetes andVascular Disease: Preterax and Diamicron MR ControlledEvaluation (ADVANCE) studies have shown the role ofhyperglycaemia as a causative factor in the developmentand the progression of diabetic nephropathy [2–5]. Never-theless, hyperglycaemia alone is clearly not sufficient toaccount for the heterogeneity and variability of the clinicalappearance of the disorder. Indeed, accumulating evidencepoints to critical genetic factors predisposing only a subsetof patients with diabetes to nephropathy [6–8].
Several studies have shown an important involvement ofgrowth factors and cytokines [9, 10]. In particular, the TGF-β1 is a key factor in experimental models of diabetickidney disease as well as in patients with diabeticnephropathy [11–15]. In fact, TGF-β1 levels are increasedin diabetic patients and high glucose levels upregulateexpression and bioactivity of TGF-β1 in almost all renalcell types [11, 12, 16, 17]. Upon binding to its receptor,TGF-β1 phosphorylates the receptor-regulated SMADfamily members (SMAD)2 and 3, which form oligomericcomplexes with the common SMAD (SMAD 4). Thesecomplexes then translocate into the nucleus, therebyregulating transcription of target genes, including thoseencoding type I and type IV collagen, laminin andfibronectin [14, 16, 18, 19].
Phosphoprotein enriched in diabetes (PED, also knownas phosphoprotein enriched in astrocytes-15 [PEA-15]) is ascaffold cytosolic protein originally identified as a majorastrocyte phosphoprotein and found to be widely present indifferent tissues [20, 21]. PED plays an important role inmitogenic and metabolic signalling [21–23]. Gene profilingstudies have shown that PED (also known as PEA15) is
commonly overexpressed in individuals with type 2diabetes [21, 24]. In cultured muscle and adipose cellsand in peripheral tissues from transgenic mice, forcedproduction of PED impairs insulin-stimulated GLUT4translocation and glucose transport, suggesting that PEDmay contribute to insulin resistance in type 2 diabetes [25].Further studies have shown that PED stabilises phospholi-pase D (PLD) [26] and induces activation of classicalprotein kinase C (PKC) isoforms, including PKCα andPKCβ [23, 27]. The induction of classical PKCs, in turn,inhibits insulin signalling, at least in skeletal muscle,adipose and liver cells [28–31]. Nevertheless, the role ofPED in diabetic complications is not known.
In the present work we addressed the question ofwhether PED overproduction determines abnormalities inkidney function and whether it may represent an initialdefect in the progression toward diabetic nephropathy.
Methods
Materials Media, sera, antibiotics for cell culture and thelipofectamine reagent were from Invitrogen (Grand Island,NY, USA). The anti-PED polyclonal rabbit antibody andpcDNA3PED vector have been previously described [21].pSMAD2/3 (Ser433/435), SMAD2, PKCα, PKCβ, fibro-nectin, laminin and collagen I and IV antibodies were fromSanta Cruz Biotechnology (Santa Cruz, CA, USA).SMAD3 was purchased from Calbiochem (San Diego,CA, USA). Phosphorothioate oligonucleotides antisensesequences used were as follows: SMAD2 AS: 5′-GCACGATGGACGACAT-3′; SMAD2 S: 5′-CAATGCGAGTACGCGA-3′; SMAD3 AS: 5′-GCAGGATGGACGACAT-3′;SMAD3 S: 5′-GGAGTCAGACTGACGA-3′; PED anti-sense oligonucleotides were as previously described [25].Protein electrophoresis reagents were purchased from Bio-Rad (Richmond, VA, USA), and western blotting andenhanced chemiluminescence (ECL) reagents from Amer-sham Biosciences (Arlington Heights, IL, USA). All otherchemicals were from Sigma Aldrich (St Louis, MO, USA).
Mouse phenotyping Generation of transgenic mice over-expressing PED (PEDTg) [25] and of Ped/Pea-15 knockoutmice (Ped-KO) bearing ubiquitous ablation of the gene [32]has been previously described. Homozygous Ped-KO wereused for the study. Both PEDTg and Ped-KO mice werefertile. Body weight of PEDTg was comparable to that ofwild-type littermates, while, as previously described [32],Ped-KO displayed a slightly lower body weight. Allprocedures described below were approved by the Institu-tional Animal Care and Utilisation Committee. Animalswere kept in a 12-h dark–light cycle and had free access tostandard diet. Mice chosen for experimentation were
Diabetologia (2009) 52:2642–2652 2643

randomly selected from each box of mice housed in groupsof three to four. Mice were habituated in individualmetabolism cages (Lenderking Caging Products, Millers-ville, MD, USA) for 24 h. Then, the following variableswere analysed: food intake (g/24 h), water intake (ml/24 h),urine volume excretion (ml/24 h), urine specific gravity,urine pH, urine glucose (mg/24 h) and albumin excretion(μg/24 h). The measurements of blood pressure and heartrate were performed partially modifying previously de-scribed methods [33]. Briefly, a 1.0-Fr polyimide pressurecatheter (SPR 1000/2; Millar Instruments, Houston, TX,USA) was inserted into the left carotid artery and advancedinto the ascending aorta of anaesthetised mice (2%isoflurane, 98% oxygen). Blood pressure and heart ratewere recorded for 15 min after suspending isofluraneadministration with an 8 channel recorder (Gould Instru-ments Systems, Cleveland, OH, USA). Data were analysedusing Powerlab and Chart 5 software (AD Instruments,Sydney, NSW, Australia).
Renal histology and morphometric analysis Kidney sec-tions were fixed by immersion in Carnoy solution followedby 4% buffered formaldehyde (vol./vol.) and embedded inparaffin. The fixed, embedded kidneys were cut into 2 μmsections and stained with periodic acid–Schiff’s reagent. Toquantify mesangial expansion, sections were coded andexamined by light microscopy by two observers unaware ofthe experimental protocol applied. According to previousreports [34, 35], measurement of the mesangial area of 30glomeruli randomly selected in each mouse by scanning ofthe outer cortex was performed with a computer-aidedmanipulator (KS-400; Carl Zeiss Vision, Munich, Germany)
Measurement of serum TGF-β1 and urine albumin Bloodsamples of mice were collected from the orbital sinus underanaesthesia. After centrifugation (800×g) of the bloodsamples, TGF-β1 levels in the supernatant fractions weremeasured using ELISA kits (R&D System, Minneapolis,MN, USA). The same kits were used to measure TGF-β1levels in the media of the cells. Samples of urine collectedthrough metabolism cages (five samples for each animal;ten animals/group) were briefly centrifuged at 500×g andthen albumin concentration was determined using ELISAkits (Bethyl Laboratories, Montgomery, TX, USA).
Tissue collection and primary mouse tubular kidney cellcultures Tissue samples (kidney) were collected rapidlyafter mice were killed by pentobarbitone overdose. Tissueswere snap-frozen in liquid nitrogen and stored at −80°C forsubsequent western blot analysis. Mouse tubular epithelialcells were isolated as previously described [36]. Cells weregrown until confluent (8 to 12 days) in RPMI 1640 mediumsupplemented with 20% fetal calf serum, 2% (wt/vol.) L-
glutamine, 20,000 units/ml penicillin, 20,000 μg/ml strep-tomycin at 37°C in 5% CO2.
Cell culture procedures and transfection Human kidney 2(HK2) proximal tubular cells were cultured in RPMI 1640medium (Invitrogen), containing 11.2 mmol/l glucose sup-plemented with 10% fetal calf serum, 2% (wt/vol.)L-glutamine, 10,000 units/ml penicillin, 10,000 μg/mlstreptomycin at 37°C in 5% (vol./vol.) CO2. Stabletransfection of PED cDNA and transient transfection ofantisense oligonucleotides [37] were performed by thelipofectamine method according to the manufacturer’s instruc-tions (Invitrogen). For these studies, 60 to 80% confluent cellswere washed twice with Optimem (Invitrogen) and incubatedfor 8 h with 5 μg of plasmid construct or antisenseoligonucleotides and 45 to 60 μl of lipofectamine reagent.The medium was then replaced with DMEM with 10% (vol./vol.) fetal calf serum and cells further incubated for 15 hbefore being assayed. Transfection efficiency for antisenseoligonucleotides was estimated as 45±10% by co-transfectionwith green fluorescent protein.
Tissue and cell lysates and immunoblotting Tissue sampleswere homogenised in a Polytron (Brinkman Instruments,Westbury, NY, USA) in 20 ml T-PER reagent (Pierce,Rockford, IL, USA) per gram of tissue according tomanufacturer’s instructions. After centrifugation at 5000×gfor 5 min, supernatant fraction was collected. Cells weresolubilised in lysis buffer (50 mmol/l HEPES, pH 7.5,150 mmol/l NaCl, 10 mmol/l EDTA, 10 mmol/l Na4P2O7,2 mmol/l Na3VO4, 100 mmol/l NaF, 10% (vol./vol.)glycerol, 1% (vol./vol.) Triton X-100, 1 mmol/l PMSF,10 mg/ml aprotinin) for 1 h at 4°C and lysates werecentrifuged at 5,000×g for 20 min. Total homogenates wereseparated by SDS-PAGE and transferred on to 0.45 μmImmobilon-P membranes as previously described [38].Upon incubation with primary and secondary antibodies,immunoreactive bands were detected by ECL according tothe manufacturer's instructions.
For peripheral blood leucocyte (PBL) separation, EDTA-treated whole-blood samples were first centrifuged for10 min at 300×g and the plasma removed. PBLs wereseparated using a 6% (vol./vol.) dextran gradient in filteredPBS, pH 7.4, as previously described [24], washed threetimes in PBS, counted and resuspended in 1 ml of PBS forsubsequent use.
Real-time RT-PCR analysis Total cellular RNA was isolat-ed from whole kidneys of wild-type and PEDTg mice usinga kit (RNeasy; Qiagen, Hilden, Germany) according tomanufacturer’s instructions. Tissue or cell RNA (1 μg) wasreverse-transcribed using Superscript II Reverse Transcrip-tase (Invitrogen). PCR reactions were analysed using
2644 Diabetologia (2009) 52:2642–2652
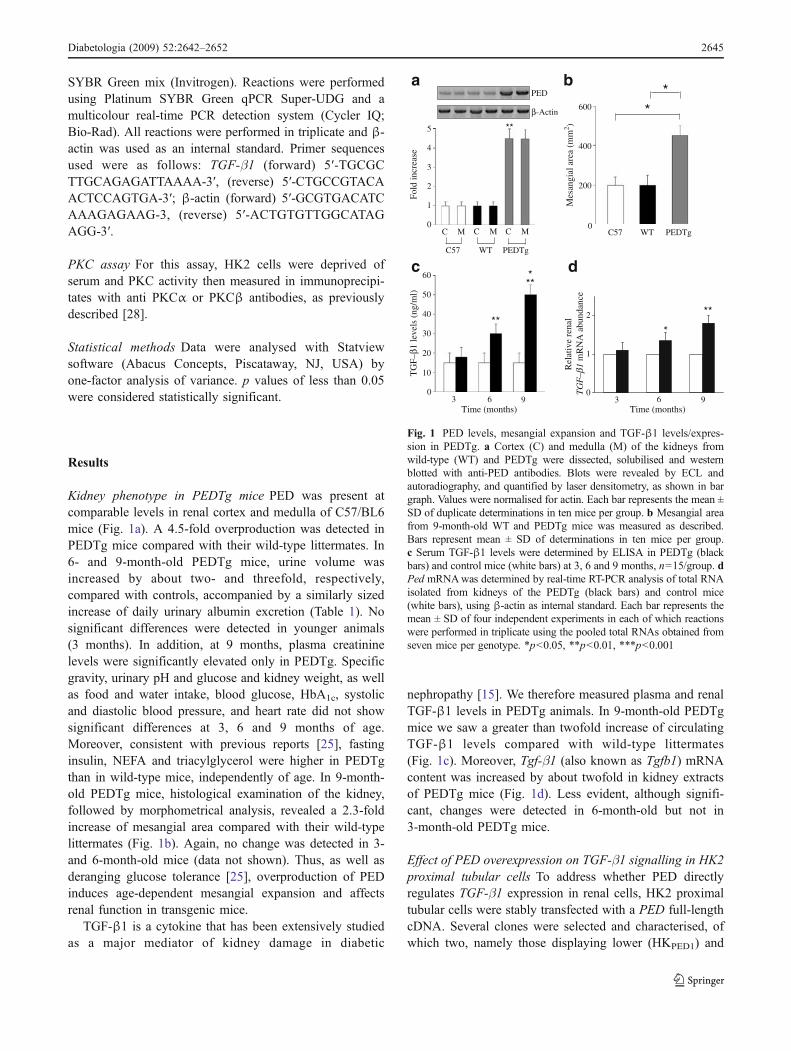
SYBR Green mix (Invitrogen). Reactions were performedusing Platinum SYBR Green qPCR Super-UDG and amulticolour real-time PCR detection system (Cycler IQ;Bio-Rad). All reactions were performed in triplicate and β-actin was used as an internal standard. Primer sequencesused were as follows: TGF-β1 (forward) 5′-TGCGCTTGCAGAGATTAAAA-3′, (reverse) 5′-CTGCCGTACAACTCCAGTGA-3′; β-actin (forward) 5′-GCGTGACATCAAAGAGAAG-3, (reverse) 5′-ACTGTGTTGGCATAGAGG-3′.
PKC assay For this assay, HK2 cells were deprived ofserum and PKC activity then measured in immunoprecipi-tates with anti PKCα or PKCβ antibodies, as previouslydescribed [28].
Statistical methods Data were analysed with Statviewsoftware (Abacus Concepts, Piscataway, NJ, USA) byone-factor analysis of variance. p values of less than 0.05were considered statistically significant.
Results
Kidney phenotype in PEDTg mice PED was present atcomparable levels in renal cortex and medulla of C57/BL6mice (Fig. 1a). A 4.5-fold overproduction was detected inPEDTg mice compared with their wild-type littermates. In6- and 9-month-old PEDTg mice, urine volume wasincreased by about two- and threefold, respectively,compared with controls, accompanied by a similarly sizedincrease of daily urinary albumin excretion (Table 1). Nosignificant differences were detected in younger animals(3 months). In addition, at 9 months, plasma creatininelevels were significantly elevated only in PEDTg. Specificgravity, urinary pH and glucose and kidney weight, as wellas food and water intake, blood glucose, HbA1c, systolicand diastolic blood pressure, and heart rate did not showsignificant differences at 3, 6 and 9 months of age.Moreover, consistent with previous reports [25], fastinginsulin, NEFA and triacylglycerol were higher in PEDTgthan in wild-type mice, independently of age. In 9-month-old PEDTg mice, histological examination of the kidney,followed by morphometrical analysis, revealed a 2.3-foldincrease of mesangial area compared with their wild-typelittermates (Fig. 1b). Again, no change was detected in 3-and 6-month-old mice (data not shown). Thus, as well asderanging glucose tolerance [25], overproduction of PEDinduces age-dependent mesangial expansion and affectsrenal function in transgenic mice.
TGF-β1 is a cytokine that has been extensively studiedas a major mediator of kidney damage in diabetic
nephropathy [15]. We therefore measured plasma and renalTGF-β1 levels in PEDTg animals. In 9-month-old PEDTgmice we saw a greater than twofold increase of circulatingTGF-β1 levels compared with wild-type littermates(Fig. 1c). Moreover, Tgf-β1 (also known as Tgfb1) mRNAcontent was increased by about twofold in kidney extractsof PEDTg mice (Fig. 1d). Less evident, although signifi-cant, changes were detected in 6-month-old but not in3-month-old PEDTg mice.
Effect of PED overexpression on TGF-β1 signalling in HK2proximal tubular cells To address whether PED directlyregulates TGF-β1 expression in renal cells, HK2 proximaltubular cells were stably transfected with a PED full-lengthcDNA. Several clones were selected and characterised, ofwhich two, namely those displaying lower (HKPED1) and
Mes
angi
al a
rea
(mm
2 )
WT PEDTg
*
C M C M
WT PEDTg
PED
β-Actin
Fold
incr
ease
**
a b
MC
C57
C57
*
TG
F–β1
leve
ls (
ng/m
l)3
c
**
***
6Time (months)
60
1
2
*
d
Time (months)
Rel
ativ
e re
nal
TG
F–β1
mR
NA
abu
ndan
ce
**
3 99
0
1
2
3
4
5
0
200
400
600
60
50
40
30
20
10
0
Fig. 1 PED levels, mesangial expansion and TGF-β1 levels/expres-sion in PEDTg. a Cortex (C) and medulla (M) of the kidneys fromwild-type (WT) and PEDTg were dissected, solubilised and westernblotted with anti-PED antibodies. Blots were revealed by ECL andautoradiography, and quantified by laser densitometry, as shown in bargraph. Values were normalised for actin. Each bar represents the mean ±SD of duplicate determinations in ten mice per group. b Mesangial areafrom 9-month-old WT and PEDTg mice was measured as described.Bars represent mean ± SD of determinations in ten mice per group.c Serum TGF-β1 levels were determined by ELISA in PEDTg (blackbars) and control mice (white bars) at 3, 6 and 9 months, n=15/group. dPed mRNAwas determined by real-time RT-PCR analysis of total RNAisolated from kidneys of the PEDTg (black bars) and control mice(white bars), using β-actin as internal standard. Each bar represents themean ± SD of four independent experiments in each of which reactionswere performed in triplicate using the pooled total RNAs obtained fromseven mice per genotype. *p<0.05, **p<0.01, ***p<0.001
Diabetologia (2009) 52:2642–2652 2645
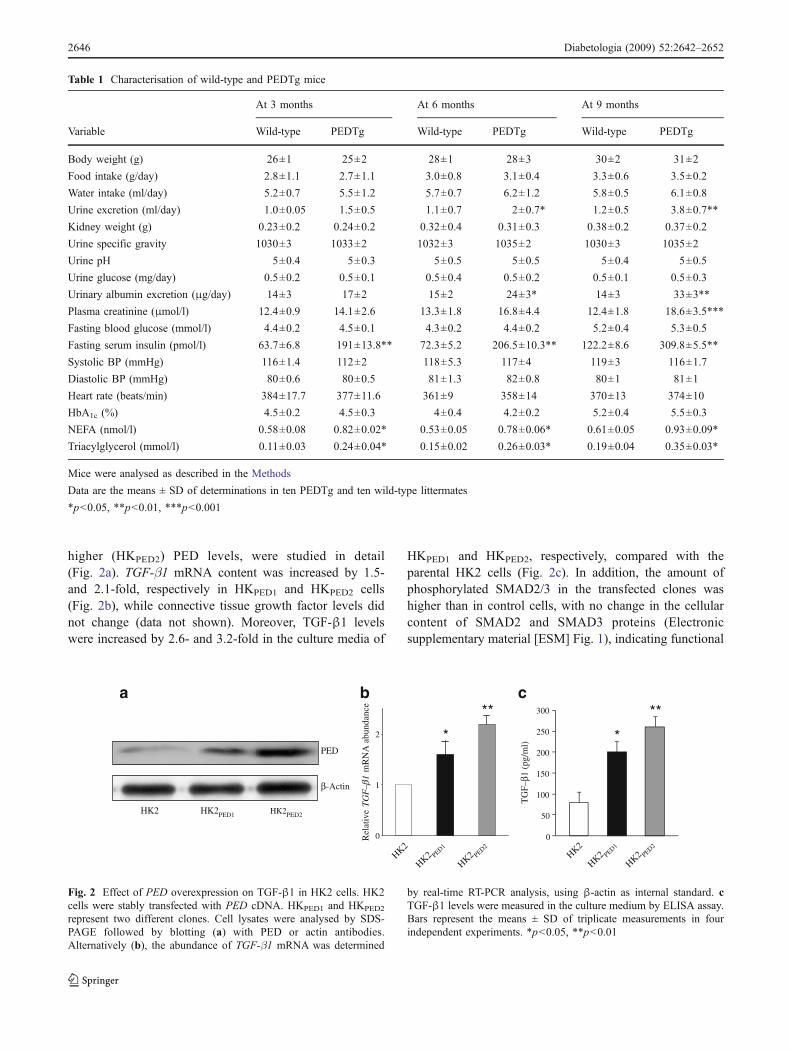
higher (HKPED2) PED levels, were studied in detail(Fig. 2a). TGF-β1 mRNA content was increased by 1.5-and 2.1-fold, respectively in HKPED1 and HKPED2 cells(Fig. 2b), while connective tissue growth factor levels didnot change (data not shown). Moreover, TGF-β1 levelswere increased by 2.6- and 3.2-fold in the culture media of
HKPED1 and HKPED2, respectively, compared with theparental HK2 cells (Fig. 2c). In addition, the amount ofphosphorylated SMAD2/3 in the transfected clones washigher than in control cells, with no change in the cellularcontent of SMAD2 and SMAD3 proteins (Electronicsupplementary material [ESM] Fig. 1), indicating functional
Table 1 Characterisation of wild-type and PEDTg mice
At 3 months At 6 months At 9 months
Variable Wild-type PEDTg Wild-type PEDTg Wild-type PEDTg
Body weight (g) 26±1 25±2 28±1 28±3 30±2 31±2
Food intake (g/day) 2.8±1.1 2.7±1.1 3.0±0.8 3.1±0.4 3.3±0.6 3.5±0.2
Water intake (ml/day) 5.2±0.7 5.5±1.2 5.7±0.7 6.2±1.2 5.8±0.5 6.1±0.8
Urine excretion (ml/day) 1.0±0.05 1.5±0.5 1.1±0.7 2±0.7* 1.2±0.5 3.8±0.7**
Kidney weight (g) 0.23±0.2 0.24±0.2 0.32±0.4 0.31±0.3 0.38±0.2 0.37±0.2
Urine specific gravity 1030±3 1033±2 1032±3 1035±2 1030±3 1035±2
Urine pH 5±0.4 5±0.3 5±0.5 5±0.5 5±0.4 5±0.5
Urine glucose (mg/day) 0.5±0.2 0.5±0.1 0.5±0.4 0.5±0.2 0.5±0.1 0.5±0.3
Urinary albumin excretion (μg/day) 14±3 17±2 15±2 24±3* 14±3 33±3**
Plasma creatinine (μmol/l) 12.4±0.9 14.1±2.6 13.3±1.8 16.8±4.4 12.4±1.8 18.6±3.5***
Fasting blood glucose (mmol/l) 4.4±0.2 4.5±0.1 4.3±0.2 4.4±0.2 5.2±0.4 5.3±0.5
Fasting serum insulin (pmol/l) 63.7±6.8 191±13.8** 72.3±5.2 206.5±10.3** 122.2±8.6 309.8±5.5**
Systolic BP (mmHg) 116±1.4 112±2 118±5.3 117±4 119±3 116±1.7
Diastolic BP (mmHg) 80±0.6 80±0.5 81±1.3 82±0.8 80±1 81±1
Heart rate (beats/min) 384±17.7 377±11.6 361±9 358±14 370±13 374±10
HbA1c (%) 4.5±0.2 4.5±0.3 4±0.4 4.2±0.2 5.2±0.4 5.5±0.3
NEFA (nmol/l) 0.58±0.08 0.82±0.02* 0.53±0.05 0.78±0.06* 0.61±0.05 0.93±0.09*
Triacylglycerol (mmol/l) 0.11±0.03 0.24±0.04* 0.15±0.02 0.26±0.03* 0.19±0.04 0.35±0.03*
Mice were analysed as described in the Methods
Data are the means ± SD of determinations in ten PEDTg and ten wild-type littermates
*p<0.05, **p<0.01, ***p<0.001
PED
a b c
0
50
100
150
200
250
300
*
β-Actin
TG
F–β1
(pg
/ml)
TG
F–β1
Rel
ativ
em
RN
A a
bund
ance **
0
1
2 *
**
HK2
HK2 PED1
HK2 PED2
HK2 HK2PED1 HK2PED2
HK2
HK2 PED1
HK2 PED2
Fig. 2 Effect of PED overexpression on TGF-β1 in HK2 cells. HK2cells were stably transfected with PED cDNA. HKPED1 and HKPED2
represent two different clones. Cell lysates were analysed by SDS-PAGE followed by blotting (a) with PED or actin antibodies.Alternatively (b), the abundance of TGF-β1 mRNA was determined
by real-time RT-PCR analysis, using β-actin as internal standard. cTGF-β1 levels were measured in the culture medium by ELISA assay.Bars represent the means ± SD of triplicate measurements in fourindependent experiments. *p<0.05, **p<0.01
2646 Diabetologia (2009) 52:2642–2652

activation of the TGF-β1 signalling pathway. Furthersupporting this hypothesis, treatment of HK2 cells with0.1 μmol/l SB431542, a TGF-β1 receptor kinase inhibitor,reduced SMAD2 and SMAD3 phosphorylation by 40%(Fig. 3a). A 50% decrease was observed in HKPED2 cells.Total SMAD2 and SMAD3 levels were unchanged follow-ing exposure of both cell types to SB431542 (Fig. 3a).Results consistent with the above were obtained in HKPED1
cells (data not shown).
Effect of PED overexpression on fibronectin production inHK2 cells TGF-β1 regulates the synthesis of key extracel-lular matrix proteins, including fibronectin, laminin, andcollagen I and IV [14, 16, 18, 19]. Thus, consistent with theaugmented TGF-β1 production, 1.5- and 1.9-fold increased
levels of fibronectin were detected, independently ofglucose concentration (5.0, 11.2 and 30.0 mmol/l), in themedia of HKPED1 and HKPED2, respectively, compared withcontrol cells (Fig. 3b). Slight, though not statisticallysignificant, increases of laminin and both collagen I andIV were also observed (data not shown).
We have previously shown that overproduction of PEDin cultured cells leads to activation of the PLD/PKCpathway [23, 27]. To study the possible involvement ofPLD and PKC as potential mediators of PED-inducedfibronectin production, wild-type and HKPED2 cells wereincubated for 15 min with the PLD inhibitor 2-butanol(0.3% vol./vol.) and with the classical PKC inhibitorbisindolylmaleimide (BIM) (100 nmol/l) or the specificPKCβ inhibitor LY379196 (50 nmol/l). At the concen-
pSMAD2/3
SMAD3
SMAD2
β-Actin
**
SM
AD
2/3
ph
osp
ho
ryla
tio
n
(% o
f co
ntr
ol)
HK2 HK2PED2
SB431542 – + – +
**
Fib
ron
ecti
n l
evel
s
(% o
f co
ntr
ol)
HK2 HK2PED2
2-But
BIM
LY379196
–
–
–
–
–
–
–
+
+
–
–
– – – –
–
–
–
+SB431542
**
**
**
**
†
–
–
–
–
–
–
–
+
+
–
–
– – – –
–
–
–
+
0
50
100
150
200
0
50
100
150
200
Fib
ron
ecti
n l
evel
s
(% o
f co
ntr
ol)
*
**
HK2PED1
HK2PED2HK2
*
0
25
125
100
75
50
155
150
200
++
WT PED Tg
**** **
**
†
Fib
ron
ecti
n l
evel
s
(% o
f co
ntr
ol)
0
50
100
150
200
250
2–But
BIM
LY379196
–
–
–
–
–
–
–
+
+
–
–
– – – –
–
–
–
+SB431542
–
–
–
–
–
–
–
+
+
–
–
– – – –
–
–
–
+
++
a b
c d
Fig. 3 Effect ofPED overexpres-sion and of PLD, PKC andTGF-β1 inhibition on fibronectinproduction in HK2 cells. a HK2and HK2PED2 cells were incubat-ed with SB431542 (0.1 μmol/l).Total SMAD and actin levels, andSMAD2/3 phosphorylation weremeasured as described. A repre-sentative autoradiograph of fourindependent experiments isshown, with densitometric analy-sis of pSMAD2/3:SMAD2 ratio,normalised for actin levels,in bar graph. Values are mean ±SD, **p<0.01. b Culture mediawith different glucose concentra-tions (white bars, 5 mmol/l; blackbars 11.2 mmol/l; grey bars,30 mmol/l) from control and Pedoverexpressing cells were col-lected and subjected to westernblot with fibronectin antibodies.Bands were quantified by laserdensitometry and normalised foractin of the corresponding cul-tured cells. Bars representmeans ± SD of three independentexperiments in triplicate.*p<0.05, **p<0.01. c Culturemedia from HK2 and HK2PED2cells or (d) from murine tubularepithelial cells isolated from wild-type (WT) and PEDTg mice werecollected, immunoblotted withfibronectin antibody. Bands werequantified by laser densitometryand normalised for actin of thecorresponding cultured cells. Barsrepresent the mean ± SD ofduplicate determinations in fiveindependent experiments.**p<0.01; †p<0.01 for differen-ces between HK2PED2 and HK2cells
Diabetologia (2009) 52:2642–2652 2647

trations used, these compounds did not inhibit PKCα(ESM Fig. 2a) and PKCβ (ESM Fig. 2b) activity inparental HK2 cells. HKPED2 cells displayed higher levelsof PLD (data not shown), PKCα (ESM Fig. 2a) and PKCβ(ESM Fig. 2b) activity. In these cells, PKCα activity wasunchanged by LY379196 and reduced by 30% and 35%following exposure to 2-butanol and BIM, respectively.PKCβ activity was decreased by 30%, 32% and 60%
following exposure to 2-butanol, BIM and LY379196respectively. Finally, no change of PKCα (ESM Fig. 2a)and PKCβ (ESM Fig. 2b) activity was induced bytreatment with SB431542, either in HK2 or in HKPED2
cells, indicating that TGF-β1 was not upstream to PKCactivation.
In parallel with the unmodified PKC activity, neitherPLD nor PKC inhibitors reduced fibronectin production bynative HK2 cells (Fig. 3c). In contrast, exposure of HKPED2
cells for 15 min to 0.3% 2-butanol, 100 nmol/l BIM and50 nmol/l LY379196 decreased fibronectin by 37%, 22%and 55%, respectively. A similar effect was also observedfollowing treatment with SB431542 for 15 min, whichreduced fibronectin levels by 40% in HKPED2 cells, withoutaffecting control cells (Fig. 3c). To confirm these data, wealso measured fibronectin production in primary culturesfrom the kidneys of wild-type and PEDTg mice. As shownin Fig. 3d, exposure to 2-butanol, BIM, LY379196 andSB431542, respectively reduced the levels of fibronectin by47%, 38%, 38% and 50% in PEDTg-derived cells only.Thus, these data indicate that PLD, PKCβ and TGF-β1signalling are required for regulation of fibronectin releaseby cells overexpressing PED.
0
50
100
150
200
HK2 HK2PED2
–
–
–
–
–
–
–
+
+
–
–
2-But
BIM
LY379196
–
–
–
–
–
–
–
+
+
–
–
TG
F-β
1 (
pg/m
l)
** **
**
†
+ +
a
SMAD2
SMAD3
pSMAD2/3
β-Actin
HK2 HK2PED2
2-But
BIM
LY379196
pS
MA
D /
SM
AD
2 r
atio
****
**
†
0
0.2
0.4
0.6
0.8
1.0
1.2
1.4
1.6
–
–
–
–
–
–
–
+
+
–
–
–
–
–
–
–
–
–
+
+
–
–
+ +
b
Fig. 4 Effect of PLD and PKC on TGF-β1 signalling in HK2 cellsoverexpressing PED. HK2 and HK2PED2 cells were incubated with 2-butanol (But), BIM, LY379196 or SB431542 for 15 min. a TGF-β1levels were measured in the culture media by ELISA assay. Barsrepresent means ± SD of triplicate measurements in four independentexperiments. b Cells were solubilised and lysates analysed by SDS-PAGE and western blotted with total Smad2 or Smad3, p-Smad2/3and actin antibodies. The autoradiograph shown is representative offour independent experiments. Densitometric analysis of pSMAD2/3:SMAD2 ratio is shown in bar graph, with values as mean ± SD. *p<0.05, **p<0.01; †p<0.05 for differences between HK2PED2 and HK2
PED-SC PED-AS
pSMAD2/3
SMAD3
SMAD2
PED-SC PED-AS
Fib
ron
ecti
n l
evel
s
(% o
f co
ntr
ol)
**
β-Actin
**
TG
F-β
1 (
pg/m
l)
PED-SC PED-AS
**
pS
MA
D /
SM
AD
2 r
atio
PED-SC
PED100
75
50
25
0
0
20
40
60
80
100
120
β-Actin
0
0.4
0.8
1.2
1.6
2.0
PED-AS
a b
c
d
Fig. 5 Role of PED depletion in TGF-β1 signalling. HK2 cells weretransiently transfected with PED antisense (PED-AS) or scrambled(PED-SC) oligonucleotides. a PED was detected by western blot, aspreviously described. The autoradiograph is representative of fourindependent experiments. b TGF-β1 was measured by ELISA. Barsrepresent means ± SD of duplicate measurements in four independentexperiments. c Total SMAD2 and SMAD3 levels, and SMAD2/3phosphorylation were detected by western blot, with densitometricanalysis (bar graph) of pSMAD2/3:SMAD2 ratio. Values are mean ±SD. d Fibronectin from the culture media of the cells was analysed bywestern blot and quantified by bar graph, mean ± SD of duplicatedeterminations in four independent experiments. **p<0.01
2648 Diabetologia (2009) 52:2642–2652
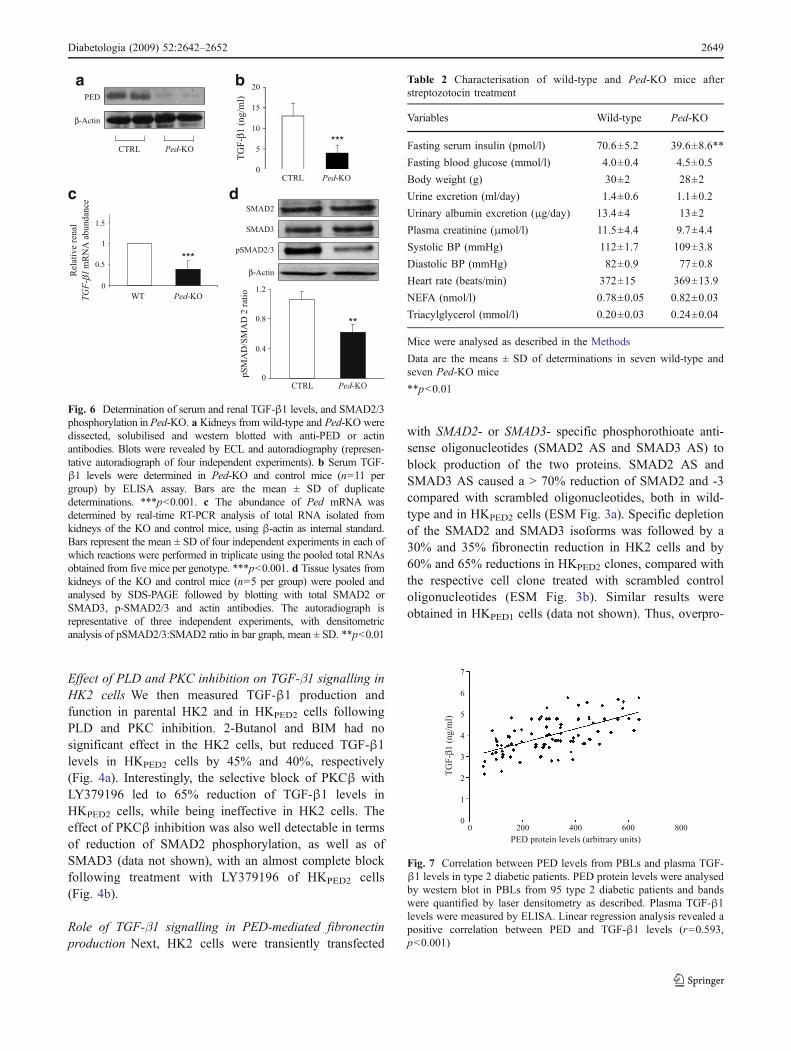
Effect of PLD and PKC inhibition on TGF-β1 signalling inHK2 cells We then measured TGF-β1 production andfunction in parental HK2 and in HKPED2 cells followingPLD and PKC inhibition. 2-Butanol and BIM had nosignificant effect in the HK2 cells, but reduced TGF-β1levels in HKPED2 cells by 45% and 40%, respectively(Fig. 4a). Interestingly, the selective block of PKCβ withLY379196 led to 65% reduction of TGF-β1 levels inHKPED2 cells, while being ineffective in HK2 cells. Theeffect of PKCβ inhibition was also well detectable in termsof reduction of SMAD2 phosphorylation, as well as ofSMAD3 (data not shown), with an almost complete blockfollowing treatment with LY379196 of HKPED2 cells(Fig. 4b).
Role of TGF-β1 signalling in PED-mediated fibronectinproduction Next, HK2 cells were transiently transfected
with SMAD2- or SMAD3- specific phosphorothioate anti-sense oligonucleotides (SMAD2 AS and SMAD3 AS) toblock production of the two proteins. SMAD2 AS andSMAD3 AS caused a > 70% reduction of SMAD2 and -3compared with scrambled oligonucleotides, both in wild-type and in HKPED2 cells (ESM Fig. 3a). Specific depletionof the SMAD2 and SMAD3 isoforms was followed by a30% and 35% fibronectin reduction in HK2 cells and by60% and 65% reductions in HKPED2 clones, compared withthe respective cell clone treated with scrambled controloligonucleotides (ESM Fig. 3b). Similar results wereobtained in HKPED1 cells (data not shown). Thus, overpro-
CTRL Ped-KO
PED
20
CTRL Ped-KO
TG
F-β
1 (
ng
/ml)
a b
β-Actin
d
***
c
SMAD3
SMAD2
β-Actin
pSMAD2/3
CTRL Ped-KO
**
pS
MA
D/S
MA
D 2
rat
io
0
0.4
0.8
1.2
Rel
ativ
e re
nal
0
0.5
1
1.5
WT Ped-KO
***
1m
RN
A a
bundan
ceTGF- β
15
10
5
0
Fig. 6 Determination of serum and renal TGF-β1 levels, and SMAD2/3phosphorylation in Ped-KO. a Kidneys from wild-type and Ped-KO weredissected, solubilised and western blotted with anti-PED or actinantibodies. Blots were revealed by ECL and autoradiography (represen-tative autoradiograph of four independent experiments). b Serum TGF-β1 levels were determined in Ped-KO and control mice (n=11 pergroup) by ELISA assay. Bars are the mean ± SD of duplicatedeterminations. ***p<0.001. c The abundance of Ped mRNA wasdetermined by real-time RT-PCR analysis of total RNA isolated fromkidneys of the KO and control mice, using β-actin as internal standard.Bars represent the mean ± SD of four independent experiments in each ofwhich reactions were performed in triplicate using the pooled total RNAsobtained from five mice per genotype. ***p<0.001. d Tissue lysates fromkidneys of the KO and control mice (n=5 per group) were pooled andanalysed by SDS-PAGE followed by blotting with total SMAD2 orSMAD3, p-SMAD2/3 and actin antibodies. The autoradiograph isrepresentative of three independent experiments, with densitometricanalysis of pSMAD2/3:SMAD2 ratio in bar graph, mean ± SD. **p<0.01
Table 2 Characterisation of wild-type and Ped-KO mice afterstreptozotocin treatment
Variables Wild-type Ped-KO
Fasting serum insulin (pmol/l) 70.6±5.2 39.6±8.6**
Fasting blood glucose (mmol/l) 4.0±0.4 4.5±0.5
Body weight (g) 30±2 28±2
Urine excretion (ml/day) 1.4±0.6 1.1±0.2
Urinary albumin excretion (μg/day) 13.4±4 13±2
Plasma creatinine (μmol/l) 11.5±4.4 9.7±4.4
Systolic BP (mmHg) 112±1.7 109±3.8
Diastolic BP (mmHg) 82±0.9 77±0.8
Heart rate (beats/min) 372±15 369±13.9
NEFA (nmol/l) 0.78±0.05 0.82±0.03
Triacylglycerol (mmol/l) 0.20±0.03 0.24±0.04
Mice were analysed as described in the Methods
Data are the means ± SD of determinations in seven wild-type andseven Ped-KO mice
**p<0.01
TG
F-β
1 (
ng
/ml)
PED protein levels (arbitrary units)
00
1
200 400 600 800
2
3
4
5
6
7
Fig. 7 Correlation between PED levels from PBLs and plasma TGF-β1 levels in type 2 diabetic patients. PED protein levels were analysedby western blot in PBLs from 95 type 2 diabetic patients and bandswere quantified by laser densitometry as described. Plasma TGF-β1levels were measured by ELISA. Linear regression analysis revealed apositive correlation between PED and TGF-β1 levels (r=0.593,p<0.001)
Diabetologia (2009) 52:2642–2652 2649
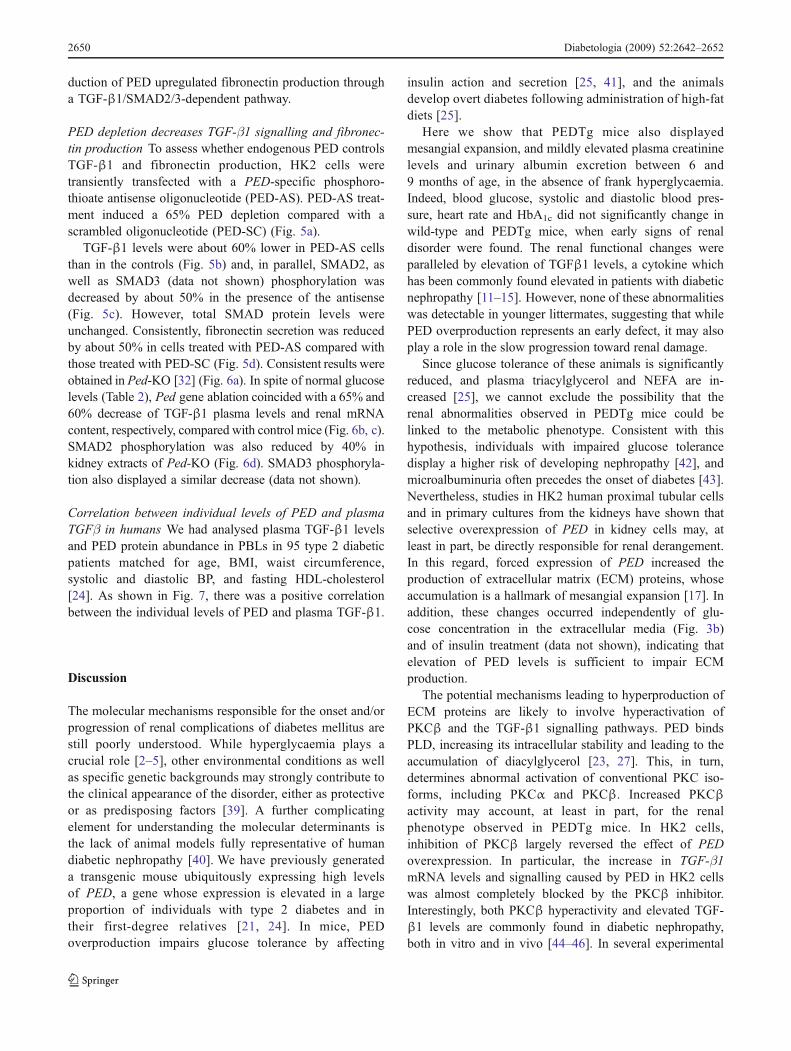
duction of PED upregulated fibronectin production througha TGF-β1/SMAD2/3-dependent pathway.
PED depletion decreases TGF-β1 signalling and fibronec-tin production To assess whether endogenous PED controlsTGF-β1 and fibronectin production, HK2 cells weretransiently transfected with a PED-specific phosphoro-thioate antisense oligonucleotide (PED-AS). PED-AS treat-ment induced a 65% PED depletion compared with ascrambled oligonucleotide (PED-SC) (Fig. 5a).
TGF-β1 levels were about 60% lower in PED-AS cellsthan in the controls (Fig. 5b) and, in parallel, SMAD2, aswell as SMAD3 (data not shown) phosphorylation wasdecreased by about 50% in the presence of the antisense(Fig. 5c). However, total SMAD protein levels wereunchanged. Consistently, fibronectin secretion was reducedby about 50% in cells treated with PED-AS compared withthose treated with PED-SC (Fig. 5d). Consistent results wereobtained in Ped-KO [32] (Fig. 6a). In spite of normal glucoselevels (Table 2), Ped gene ablation coincided with a 65% and60% decrease of TGF-β1 plasma levels and renal mRNAcontent, respectively, compared with control mice (Fig. 6b, c).SMAD2 phosphorylation was also reduced by 40% inkidney extracts of Ped-KO (Fig. 6d). SMAD3 phosphoryla-tion also displayed a similar decrease (data not shown).
Correlation between individual levels of PED and plasmaTGFβ in humans We had analysed plasma TGF-β1 levelsand PED protein abundance in PBLs in 95 type 2 diabeticpatients matched for age, BMI, waist circumference,systolic and diastolic BP, and fasting HDL-cholesterol[24]. As shown in Fig. 7, there was a positive correlationbetween the individual levels of PED and plasma TGF-β1.
Discussion
The molecular mechanisms responsible for the onset and/orprogression of renal complications of diabetes mellitus arestill poorly understood. While hyperglycaemia plays acrucial role [2–5], other environmental conditions as wellas specific genetic backgrounds may strongly contribute tothe clinical appearance of the disorder, either as protectiveor as predisposing factors [39]. A further complicatingelement for understanding the molecular determinants isthe lack of animal models fully representative of humandiabetic nephropathy [40]. We have previously generateda transgenic mouse ubiquitously expressing high levelsof PED, a gene whose expression is elevated in a largeproportion of individuals with type 2 diabetes and intheir first-degree relatives [21, 24]. In mice, PEDoverproduction impairs glucose tolerance by affecting
insulin action and secretion [25, 41], and the animalsdevelop overt diabetes following administration of high-fatdiets [25].
Here we show that PEDTg mice also displayedmesangial expansion, and mildly elevated plasma creatininelevels and urinary albumin excretion between 6 and9 months of age, in the absence of frank hyperglycaemia.Indeed, blood glucose, systolic and diastolic blood pres-sure, heart rate and HbA1c did not significantly change inwild-type and PEDTg mice, when early signs of renaldisorder were found. The renal functional changes wereparalleled by elevation of TGFβ1 levels, a cytokine whichhas been commonly found elevated in patients with diabeticnephropathy [11–15]. However, none of these abnormalitieswas detectable in younger littermates, suggesting that whilePED overproduction represents an early defect, it may alsoplay a role in the slow progression toward renal damage.
Since glucose tolerance of these animals is significantlyreduced, and plasma triacylglycerol and NEFA are in-creased [25], we cannot exclude the possibility that therenal abnormalities observed in PEDTg mice could belinked to the metabolic phenotype. Consistent with thishypothesis, individuals with impaired glucose tolerancedisplay a higher risk of developing nephropathy [42], andmicroalbuminuria often precedes the onset of diabetes [43].Nevertheless, studies in HK2 human proximal tubular cellsand in primary cultures from the kidneys have shown thatselective overexpression of PED in kidney cells may, atleast in part, be directly responsible for renal derangement.In this regard, forced expression of PED increased theproduction of extracellular matrix (ECM) proteins, whoseaccumulation is a hallmark of mesangial expansion [17]. Inaddition, these changes occurred independently of glu-cose concentration in the extracellular media (Fig. 3b)and of insulin treatment (data not shown), indicating thatelevation of PED levels is sufficient to impair ECMproduction.
The potential mechanisms leading to hyperproduction ofECM proteins are likely to involve hyperactivation ofPKCβ and the TGF-β1 signalling pathways. PED bindsPLD, increasing its intracellular stability and leading to theaccumulation of diacylglycerol [23, 27]. This, in turn,determines abnormal activation of conventional PKC iso-forms, including PKCα and PKCβ. Increased PKCβactivity may account, at least in part, for the renalphenotype observed in PEDTg mice. In HK2 cells,inhibition of PKCβ largely reversed the effect of PEDoverexpression. In particular, the increase in TGF-β1mRNA levels and signalling caused by PED in HK2 cellswas almost completely blocked by the PKCβ inhibitor.Interestingly, both PKCβ hyperactivity and elevated TGF-β1 levels are commonly found in diabetic nephropathy,both in vitro and in vivo [44–46]. In several experimental
2650 Diabetologia (2009) 52:2642–2652

and clinical studies, inhibition of PKC (LY333531) hasbeen shown to delay or halt the progression of diabeticcomplications [47]. Part of the beneficial effect of PKCinhibition is due to the consequent downregulation of TGF-β1 [48]. Consistently, higher circulating levels of TGF-β1have been detected in PEDTg mice and are paralleled byincreased Tgf-β1 mRNA content in kidney extracts.However, the question of whether other cell types contrib-ute to the increase of TGF-β1 content in the bloodstream iscurrently not resolved and under investigation in ourlaboratory.
Inhibition of PLD and PKCβ, as well as of TGF-β1receptor activity, or genetic silencing of SMAD2 andSMAD3 decreased production of fibronectin. Thus, PEDoverexpression may lead to increased PKCβ activity, whichenhances expression of TGF-β1, which in turn upregulatesfibronectin production. Further support of this hypothesiswas seen in the fact that inhibition of PED by antisenseoligonucleotides in HK2 cells was paralleled by reducedPKCβ activity and TGF-β1 expression and signalling, aswell as by decreased fibronectin production. Similarly toPED-depleted cells, kidney and total TGF-β1 levels andPKCβ activity were reduced in animals bearing thecomplete ablation of Ped gene, indicating a cause–effectrelationship.
It remains unknown whether PED overproduction isinvolved in diabetic nephropathy in humans. However, ina cohort of patients with type 2 diabetes [24], we found apositive correlation between levels of PED measured inPBLs and plasma TGFβ1 levels. It could therefore beinferred that high expression levels of PED deranges renalfunction in a subset of diabetic individuals, therebyfacilitating the onset and/or progression of diabeticnephropathy.
The mechanism leading to the increase of PED cellularlevels are only partially known and may be due to alteredtranscriptional control [49] or to post-translational modifi-cations [50]. The contribution of genetic variations andepigenetic modifications is currently under investigation inour laboratory.
Thus, high expression levels of PED determine anincrease of PKCβ activity and of TGF-β1 expression incellular and animal models, as well as in humans. Theytherefore may represent an early abnormality, contributingto the derangement of ECM deposition and to progressiontoward nephropathy.
Acknowledgements This study was supported by the EuropeanCommunity’s FP6 EUGENE2 (LSHM-CT-2004-512013) and PRE-POBEDIA (201681) projects, the European Foundation for the Studyof Diabetes and grants from the Associazione Italiana per la Ricercasul Cancro (AIRC) and the Ministero dell’Università e della RicercaScientifica (PRIN and FIRB). The financial support of Telethon–Italyis also gratefully acknowledged.
Duality of interest The authors declare that there is no duality ofinterest associated with this manuscript.
References
1. Wolf G (2004) New insights into the pathophysiology of diabeticnephropathy: from haemodynamics to molecular pathology. Eur JClin Invest 34:785–796
2. The Diabetes Control and Complications Trial Research Group(1993) The effect of intensive treatment of diabetes on thedevelopment and progression of long-term complications ininsulin-dependent diabetes mellitus. The Diabetes Control andComplications Trial Research Group. N Engl J Med 329:977–986
3. UK Prospective Diabetes Study (UKPDS) Group (1998) Intensiveblood-glucose control with sulphonylureas or insulin comparedwith conventional treatment and risk of complications in patientswith type 2 diabetes (UKPDS 33). UK Prospective Diabetes Study(UKPDS) Group. Lancet 352:837–853
4. Members of the ADVANCE collaborative group (2008) Intensiveblood glucose control and vascular outcomes in patients with type2 diabetes. N Engl J Med 358:2560–2572
5. Bilous R (2008) Microvascular disease: what does the UKPDS tellus about diabetic nephropathy? Diabet Med 25(Suppl 2):25–29
6. Fogarty DG, Hanna LS, Wantman M, Warram JH, Krolewski AS,Rich SS (2000) Segregation analysis of urinary albumin excretionin families with type 2 diabetes. Diabetes 49:1057–1063
7. Imperatore G, Knowler WC, Pettitt DJ, Kobes S, Bennett PH,Hanson RL (2000) Segregation analysis of diabetic nephropathyin Pima Indians. Diabetes 49:1049–1056
8. Boright AP, Paterson AD, Mirea L et al (2005) Genetic variationat the ACE gene is associated with persistent microalbuminuriaand severe nephropathy in type 1 diabetes: the DCCT/EDICGenetics Study. Diabetes 54:1238–1244
9. Flyvbjerg A (2000) Putative pathophysiological role of growthfactors and cytokines in experimental diabetic kidney disease.Diabetologia 43:1205–1223
10. Wolf G (2003) Growth factors and the development of diabeticnephropathy. Curr Diab Rep 3:485–490
11. Azar ST, Salti I, Zantout MS, Major S (2000) Alteration in plasmatransforming growth factor β in normoalbuminuric type 1 andtype 2 diabetic patients. J Clin Endocrinol Metab 85:4680–4682
12. Pfeiffer A, Middleberg-Bisping K, Drewes C, Schatz H (1996)Elevated plasma levels of transforming growth factor β-1 inNIDDM. Diabetes Care 18:1113–1117
13. Ziyadeh FN (2004)Mediators of diabetic renal disease the case for TGF-beta as the major mediator. J Am Soc Nephrol 15(Suppl 1):S55–S57
14. WangW, Koka V, Lan HY (2005) Transforming growth factor-betaand Smad signalling in kidney diseases. Nephrology 10:48–56
15. Sharma K, Ziyadeh FN (1995) Hyperglycemia and diabetickidney disease. The case for transforming growth factor-beta asa key mediator. Diabetes 44:1139–1146
16. Ha H, Yu MR, Lee HB (2001) High glucose-induced PKCactivation mediates TGF-beta 1 and fibronectin synthesis byperitoneal mesothelial cells. Kidney Int 59:463–470
17. Bloomgarden ZT (2005) Diabetic nephropathy. Diabetes Care28:745–751
18. Cheng J, Grande JP (2002) Transforming growth factor-betasignal transduction and progressive renal disease. Exp Biol Med227:943–956
19. Ten Dijke P, Hill CS (2004) New insights into TGF-beta-Smadsignalling. Trends Biochem Sci 29:265–273
20. Araujo H, Danziger N, Cordier J, Glowinski J, Chneiweiss H(1993) Characterization of PEA-15 a major substrate for proteinkinase C in astrocytes. J Biol Chem 268:5911–5920
Diabetologia (2009) 52:2642–2652 2651

21. Condorelli G, Vigliotta G, Iavarone C et al (1998) PED/PEA-15gene controls glucose transport and is overexpressed in type 2diabetes mellitus. EMBO J 7:3858–3866
22. Condorelli G, Trencia A, Vigliotta G et al (2002) Multiple membersof the mitogen-activated protein kinase family are necessary for PED/PEA-15 anti-apoptotic function. J Biol Chem 277:11013–11018
23. Condorelli G, Vigliotta G, Trencia A et al (2001) Protein kinase C(PKC)- α activation inhibits PKC- ζ and mediates the action ofPED/PEA-15 on glucose transport in the L6 skeletal muscle cells.Diabetes 50:1244–1252
24. Valentino R, Lupoli G, Raciti GA et al (2006) The PEA15 gene isoverexpressed and related to insulin resistance in healthy first-degree relatives of patients with type 2 diabetes. Diabetologia49:3058–3066
25. Vigliotta G, Miele C, Santopietro S et al (2004) Overexpression ofthe ped/pea-15 gene causes diabetes by impairing glucose-stimulated insulin secretion in addition to insulin action. Mol CellBiol 24:5005–5015
26. Zhang Y, Redina O, Altshuller YM et al (2000) Regulation ofexpression of phospholipase D1 and D2 by PEA-15, a novelprotein that interacts with them. J Biol Chem 275:35224–35232
27. Viparelli F, Cassese A, Doti N et al (2008) Targeting of PED/PEA-15 molecular interaction with phospholipase D1 enhances insulinsensitivity in skeletal muscle cells. J Biol Chem 283:21769–21778
28. Caruso M, Miele C, Oriente F et al (1999) In L6 skeletal musclecells, glucose induces cytosolic translocation of protein kinase Calfa and transactivates the insulin receptor kinase. J Biol Chem274:28637–28644
29. Li Y, Soos TJ, Li X et al (2004) Protein kinase C theta inhibitsinsulin signaling by phosphorylating IRS1 at Ser(1101). J BiolChem 27:45304–45307
30. Ishizuka T, Kajita K, Natsume Y et al (2004) Protein kinase C(PKC) beta modulates serine phosphorylation of insulin receptorsubstrate-1 (IRS-1)—effect of overexpression of PKCbeta oninsulin signal transduction. Endocr Res 30:287–299
31. Nakajima K, Yamauchi K, Shigematsu S et al (2000) Selectiveattenuation of metabolic branch of insulin receptor down-signaling by high glucose in a hepatoma cell line HepG2 cells. JBiol Chem 275:20880–20886
32. Kitsberg D, Formstecher E, Fauquet M et al (1999) Knock-out ofthe neural death effector domain protein PEA-15 demonstratesthat its expression protects astrocytes from TNFalpha-inducedapoptosis. J Neurosci 19:8244–8251
33. Ciccarelli M, Santulli G, Campanile A et al (2008) Endothelialalpha1-adrenoreceptors regulate neoangiogenesis. Br J Pharmacol153:936–946
34. Kasahara M, Mukoyama M, Sugawara A et al (2000) Amelioratedglomerular injury in mice overexpressing brain natriuretic peptidewith renal ablation. J Am Soc Nephrol 11:1691–1701
35. Ziyadeh FN, Hoffman BB, Han DC et al (2000) Long-termprevention of renal insufficiency, excess matrix gene expression,and glomerular mesangial matrix expansion by treatment withmonoclonal antitransforming growth factor-beta antibody in db/dbdiabetic mice. Proc Natl Acad Sci U S A 97:8015–8020
36. Terryn S, Jouret F, Vandenabeele F et al (2007) A primary cultureof mouse proximal tubular cells, established on collagen-coatedmembranes. Am J Physiol Renal Physiol 293:F476–F485
37. Hao C, Beguinot F, Condorelli G et al (2001) Induction andintracellular regulation of tumor necrosis factor-related apoptosis-inducing ligand (TRAIL) mediated apoptosis in human malignantglioma cells. Cancer Res 61:1162–1170
38. Miele C, Caruso M, Calleja V et al (1999) Differential role ofinsulin receptor substrate (IRS)-1 and IRS-2 in L6 skeletal musclecells expressing the Arg1152 → Gln insulin receptor. J Biol Chem274:3094–3102
39. Granier C, Makni K, Molina L, Jardin-Watelet B, Ayadi H,Jarraya F (2008) Gene and protein markers of diabetic nephrop-athy. Nephrol Dial Transplant 23:792–799
40. Breyer MD, Böttinger E, Brosius FC 3rd et al (2004) AMDCC.Mouse models of diabetic nephropathy. J Am Soc Nephrol16:27–45
41. Miele C, Raciti GA, Cassese A et al (2007) PED/PEA-15 regulatesglucose-induced insulin secretion by restraining potassium channelexpression in pancreatic beta-cells. Diabetes 56:622–633
42. Singleton JR, Smith AG, Russell JW, Feldman EL (2003)Microvascular complications of impaired glucose tolerance.Diabetes 52:2867–2873
43. Mykkanen L, Haffner SM, Kuusisto J, Pyorala K, Laakso M(1994) Microalbuminuria precedes the development of NIDDM.Diabetes 43:552–557
44. Koya D, Jirousek MR, Lin YW, Ishii H, Kuboki K, King GL(1997) Characterization of protein kinase C beta isoformactivation on the gene expression of transforming growth factor-beta, extracellular matrix components, and prostanoids in theglomeruli of diabetic rats. J Clin Invest 100:115–126
45. Meier M, Park JK, Overheu D et al (2007) Deletion of proteinkinase C-beta isoform in vivo reduces renal hypertrophy but notalbuminuria in the streptozotocin-induced diabetic mouse model.Diabetes 56:346–354
46. Kelly DJ, Zhang Y, Hepper C et al (2003) Protein kinase C betainhibition attenuates the progression of experimental diabetic nephrop-athy in the presence of continued hypertension. Diabetes 52:512–518
47. Das Evcimen N, King GL (2007) The role of protein kinase Cactivation and the vascular complications of diabetes. PharmacolRes 55:498–510
48. Koya D, Haneda M, Nakagawa H et al (2000) Amelioration ofaccelerated diabetic mesangial expansion by treatment with aPKCbeta inhibitor in diabetic db/db mice, a rodent model for type2 diabetes. FASEB J 14:439–447
49. Ungaro P, Teperino R, Mirra P et al (2008) Molecular cloning andcharacterization of the human PED/PEA-15 gene promoter revealantagonistic regulation by hepatocyte nuclear factor 4alpha andchicken ovalbumin upstream promoter transcription factor II. JBiol Chem 283:30970–30979
50. Perfetti A, Oriente F, Iovino S et al (2007) Phorbol esters induceintracellular accumulation of the anti-apoptotic protein PED/PEA-15 by preventing ubiquitinylation and proteasomal degradation. JBiol Chem 282:8648–8657
2652 Diabetologia (2009) 52:2642–2652