Embed Size (px)
Citation preview

To be global leader in integrated
energy business through sustainable
growth, knowledge excellence and
exemplary governance practices.
Corporate Presentation
Enhancing Energy Security of India
1
February 2013

VL
3a
3b
1
2
3
2
Oil & gas industry global perspective
Energy pursuits: India’s perspectives
Plans – Medium-term
Agenda
ONGC: the Energy Anchor of India
Long-term strategy

3
World fuel basket: BP
Fossil fuel to remain dominant fuel. Gas consumption to
increase more than oil or coal.
BP Energy Outlook 2030
0
500
1,000
1,500
2,000
2,500
3,000
3,500
4,000
4,500
5,000
2010 2015 2020 2025 2030
Mto
e
Oil Gas Coal Nuclear Hydro Other Renewables
BP
Share of oil, gas and coal in global fuel basket to converge

4
Oil & Gas: Global perspective
Oil & gas industry in unprecedented dynamism
1 Technology & innovation made possible to scale – inaccessible,
hard to visualize, uneconomical frontiers and unconventional.
2 Frontiers become ‘Hot Spots’ – Deep & ultra deep waters,
Arctic, unconventional
3 Existing assets get new life – sincere efforts to improve
recovery factor – however, tertiary recovery still to take place.
4 Unconventional, the game changers, imbalances the static of
industry. We move forward but look back for consolidation.

5
5 Peak nosedives – industry pumping more. Much has already
come – more to come.
Oil & Gas: Global perspective
80
81
82
83
84
85
86
87
88
89
mb
pd
Liquids supply Refinery intake
Extra liquid coming from: Unconventional sources – USA & Canada,
OPEC countries cranked up production, Iraq rebuilding its capacity, Saudi
Arabia till recently added ~ 1 mbpd.

6
6 New gas discoveries brings complexities to market.
7 Oil market delinked from the fundamentals. Any and every
reason influence market.
8 High oil price regime – accepted fact.
9 Resource nationalism gets momentum.
Oil & Gas: Global perspective

7
Energy pursuits:
India’s perspective
8
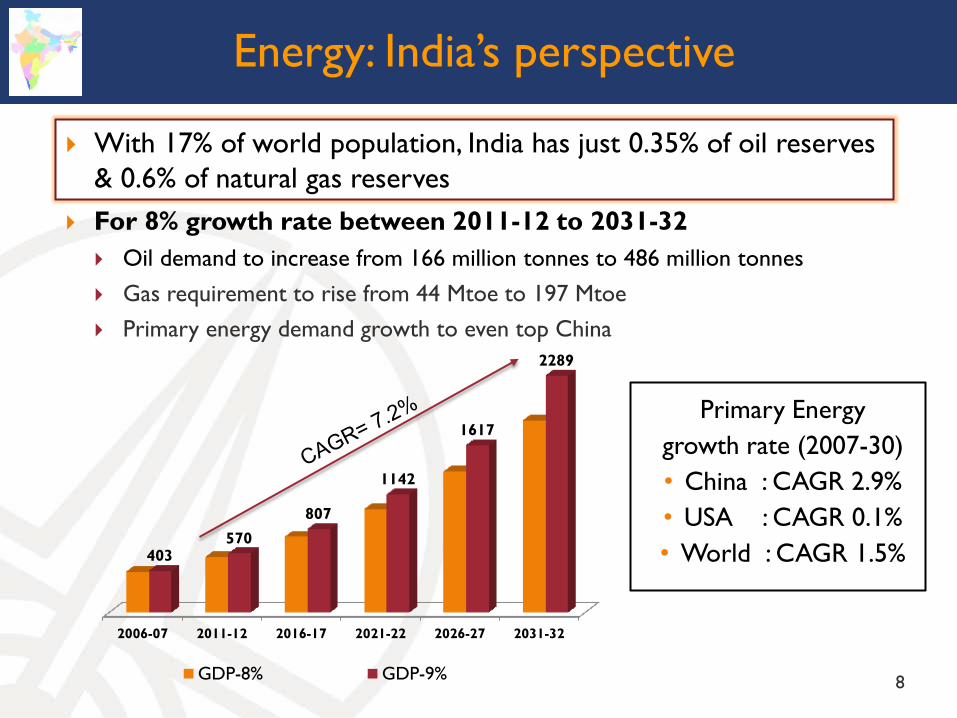
Energy: India’s perspective
With 17% of world population, India has just 0.35% of oil reserves
& 0.6% of natural gas reserves
2006-07 2011-12 2016-17 2021-22 2026-27 2031-32
403 570
807
1142
1617
2289
GDP-8% GDP-9%
For 8% growth rate between 2011-12 to 2031-32
Oil demand to increase from 166 million tonnes to 486 million tonnes
Gas requirement to rise from 44 Mtoe to 197 Mtoe
Primary energy demand growth to even top China
Primary Energy
growth rate (2007-30)
• China : CAGR 2.9%
• USA : CAGR 0.1%
• World : CAGR 1.5%

9
The positive: technology & capital intensive exploration of
unexplored sedimentary basins.
3.5 btoe in-place volume discovered in last 11 years with 380
hydrocarbon discoveries
India the 5th largest importer of LNG after – Japan, South Korea,
UK, & Spain; accounts for 5.5% of the total trade.
LNG re-gasification capacity expected to be more than 50
MMTPA by 2016-17 with a supply of 198 mmscmd.
India to have more than 31,000 Km of gas pipeline by 2017; 14,000
Km of pipeline infrastructure under implementation.
Energy: India’s perspective

Energy: 12th Plan (2012-17)
Renewable
Proposed addition of 29,800 MW renewable energy
Wind (1500 MW), Hydro (2,100 MW), Solar (10,000 MW) & Bio (2,700 MW)
India attractive
destination for clean
energy investment
India the 6th largest clean investment
destination
Attracted US$ 10.2 billion of investment in
2011 for clean energy; 54% more than 2010
Wind attracted US$ 4.6 billion of investment
Conventional
Oil production 216 MMT; Gas production 187.12 BCM
11

12
Price volatility
Crude oil price (Indian basket) to remain volatile. Double whammy –
international price & unstable exchange range.
Indian Basket (US$/bbl)
Despite that Govt. has been
able to make available
petroleum products at
affordable cost
FY'11 FY'12 FY'13 Mar'12 Apr'12 May'12 Jun'12 Jul'12 Aug'12 Sep'12 Oct'12Nov'1
2Dec'12
Crude prices 85.09 111.89 109.1 123.61 118.04 108.13 94.51 100.34 110.07 111.83 109.79 107.82 106.85
Xchange rate 47.99 54.94 50.40 51.78 54.39 57.22 55.35 55.99 53.65 53.10 54.78 54.65
85
112 109
124
118
108
95
100
110 112 110
108 107
40.00
43.00
46.00
49.00
52.00
55.00
58.00
61.00
60
70
80
90
100
110
120
130
US
$ v
s R
s. X
ch
an
ge r
ate
Cru
de o
il p
rice (
US
$/b
bl)

13
FY'04 FY'05 FY'06 FY'07 FY'08 FY'09 FY'10 FY'11 FY'12FY'13(9M)
Govt. 11,500 24,121 35,290 71,292 26,000 41,001 83,500 79,603
OMCs 6,156 14,199 14,500 4,759 16,126 5,621 6,891 40
Upstream 3,118 5,947 14,000 20,507 25,708 32,943 14,430 30,297 55,001 45,251
0
20,000
40,000
60,000
80,000
100,000
120,000
140,000
160,000
` C
rore
Though Govt. shared 54% of the total subsidy; upstream companies like
ONGC shared 30% of it; investment for new capacities under pressure.
Subsidy sharing FY’04 to FY’13
A transparent mechanism becomes imperative
` Crore ONGC
FY'04 2,690
FY'05 4,104
FY'06 11,958
FY'07 17,025
FY'08 22,000
FY'09 28,226
FY'10 11,554
FY'11 24,892
FY'12 44,466
FY'13 (9M) 37,108
Total 204,023
Investments under pressure

What we need to do?
14

15
Huge potential
Out of 26 Indian sedimentary basins only 7
are producing.
Total prognosticated resource: 205 billion
barrels of O+OEG,
68 billion barrels has been established as in-
place volume.
Out of total 3.14 million sq. km
sedimentary area, only Wells explored: 22 %
Exploration initiated: 44%
Poorly explored: 12%
Unexplored: 22%
Huge exploration potential exists in India and converting these exploration potential
into a producible proposition remains huge task and challenge.
Technology intensive exploration imperative; exploration to be incentivized

16
Estimated potential:
• Coal Bed Methane (CBM) > 450 tcf.
• Underground Coal Gasification (UCG) ~
6,900 tcf of gas
• Gas hydrates ~ 142 bcm
• Shale gas > 65 tcf.
Huge potential
Potential Shale Gas basins
USGS estimates 63tcf of Shale gas resources in India
Unconventional also have huge potential. Enabling regulatory regime,
incentives and cooperation can only make the way forward.
However, our engagement in tapping these
unconventional resources is at very
preliminary stages. We need to expedite
our endeavours.
Integrations of endeavours – the
mantra! Why not we have
Integrated Energy Policy?

17
Renewable
Renewable energy the future; compliments
sustainable development.
Renewable estimated potential:
Total potential: 89,760 MW.
• Wind power: 49,132 MW
• Small hydro-power: 15,385 MW
• Biomass: 17,538 MW
• Bagasse-based cogeneration in sugar
mills: 5,000 MW
In addition,
• National Solar Mission: 20,000 MW
• Nuclear energy:21,540 MW

18
The way forward
Huge investments; battery of advanced technologies; new partnerships; spreading of
risks; economies of scale; efficiency & efficacy; talent pool, etc. – becomes imperative
Energy security and energy economics need to go hand-in-hand
Invest big in technology
Focus on energy efficiency improvement
Expedite efforts on renewable
“Localized” planning to improve energy availability
Creating Strategic Reserves
Renewed Diplomacy
Strengthening the Regulatory institutions
Redefining the role of the government

19
ONGC
committed for
Energy Security
of India

VL
20
Medium-term
Exploration Conversion of nomination PEL to ML
Development/
re-development
Development of 37 fields through 13 projects
Rolling re-development of major fields
Unconventional
& alternate CBM, UCG, Shale gas and alternates.
Integration Commissioning of on going projects – OPaL,
OMPL, OTPC, SEZs

VL
21
Development
Presently 13 projects under implementation to monetize 37 fields
C-Series
B-22 Cluster
B-193 Cluster
North Tapti
D-1 (additional)
Cluster-7
BHE & BH-35
WO-16-Cluster
SB-14 field
B-127 Cluster
C-26 cluster
B-46 Cluster
G-1 & GS-15
C-22, C-24, C-39-1, C-39-A
B-22A, BS-13A, B-149A
B-193A, B-23AA, B-127A, B-
178A, B-179A
North Tapti
D-1
B-192-1, B-192,5, B-192-8,
WO-24
BHE & BH-35
WO-5, WO-15, WO-16, B-
119/121
SB-14
B-127, B-157, B-55-5
C-26, C-23, B-12-1
B-46, B-48, B-105, B-188
G-1 & GS-15
Monetizi
ng
> 2
80 m
toe r
ese
rves
Investment:
> Rs. 31,000 Crore
Production:
Oil : ~ 40 MMT
Gas : ~ 64 BCM
Starting from FY’13 all the
fields to be on stream by 2014

VL
22
Monetizing discoveries
KG offshore discoveries: G-1, G-2, G-4, Vashista, S-1 & G-4-6
KG-DWN-98/2 discoveries: appraisal on progress to be
completed by Nov’13
Mahanadi discoveries: appraisal on progress to be completed
by Dec’12
Daman offshore: development advanced by 4 years. Substantial
gas potential.
Fie
lds u
nd
er d
evelo
pm
en
t

VL
23
Unconventional in focus
ONGC first to establish Shale gas presence in India. Planning to explore
Cambay, Cauvery, Bengal basins - alliance with ConocoPhillips
Operating 4 CBM blocks. Incidental production started in 2010. Planned
investment Rs. 50,000 million. Production to increase to 6 mmscmd by 2010.
Beyond hydrocarbons:
• Kinetic hydro power generation
• Uranium exploration
• Geothermal energy
• Thermo-chemical reactor
• Offshore wind farm

VL
24
Value-chain integration
ONGC Petro-additions Ltd. - world-class one of the biggest
Petrochemical Plants in Asia (1.1 MMTPA ethylene Cracker &
Polymer plant). ONGC equity (26%). Investment Rs. 21,396 Crore.
Completion FY’14.
ONGC Mangalore Petrochemicals Ltd. - Aromatic
Petrochemical Complex - Paraxylene (0.92 MMTPA) & Benzene
(0.27 MMTPA). ONGC equity (46%). Investment Rs. 5,750 Crore.
Completion Q4, FY’13.
ONGC Tripura Power Company Ltd. - 726.6 MW
(2x363.3MW) gas based CCPP at Palatana in Tripura to monetize
idle gas. ONGC equity (50%). Investment Rs. 3,429 Crore. Unit 1
synchronized on 22nd Oct’12. Power generation started.
Perspective Plan
2030 Seeking new horizons
25
…. blue print for brighter future

VL Seeking new horizons
26
PP2030
Aspirations
Fold production growth in E&P
Fold growth in Revenue & EBITDA
Fold growth in Market cap
Verticals for Non-E&P business
Fold growth in international E&P production

VL Seeking new horizons
27
PP2030
1. Grow overseas E&P to source 60
mmtoe/year of O+OEG by 2030
2. Secure alliance for new resource types
3. Unlock 450+ mmtoe from domestic YTF
(yet-to-find) reserves
4. Accelerate 300-400 mmtoe of (re)-
developments
5. Build non-E&P business to 30% of group
revenue
Shaping
Moves

VL Seeking new horizons
28
PP2030
1. Sustained production growth 4-5%
2. > 130 mmtoe production in 2030 (50%
international)
3. 1,300 mmtoe proved reserves
4. 6.5 GW alternate energy, 9 MMTPA
LNG
5. Full downstream value capture in
petrochemicals
ONGC
2030

VL Seeking new horizons
29
Shaping move-1
Grow overseas E&P to source 60 mmtoe/year of O+OEG by 2030
4-5 Global activity hubs
All resource types of interest
• Conventional
• Shale oil/gas
• Heavy oil
LNG, mid-stream & other
ventures also on target

VL Seeking new horizons
30
OVL’s maiden venture in historic ‘Azerbaijan’
2.7213% participating interest in the Azeri, Chirag and the deepwater
portion of Guneshli fields (ACG)
2.36% interest in the Baku-Tbilisi-Ceyhan ('BTC') pipeline
ACG is the largest oil field in the
Azerbaijan sector of the Caspian basin.
Average daily production ~ 700,000 bpd
of crude oil
1,768-km BTC Pipeline: one of the
main export routes for Caspian crude
oil. Capacity: ~ 1.0 million bpd
Shaping move-1

VL Seeking new horizons
31
OVL in Kazakhstan: signs agreement with ConocoPhillips for 8.40%
Participating Interest (PI) in Kashagan Field,
Investment: US$ 5.5 billion
Annual production upside ~ 1 MMT for
25 years
The world’s largest development
project
Kashagan oilfield in western
Kazakhstan
Consortium: Eni, Total, Shell,
ExxonMobil, OVL & KazMunaiGaz
Shaping move-1

VL Seeking new horizons
32
OVL discovers oil in CPO-5 block in llanos basin of Colombia
Kamal-1X well spudded on October 29,
2012 and drilled up to the target depth of
10,500 feet. The first of the two objects,
in the interval 9643-9649 feet, produced
oil varying in rate from 120 bopd to 300
bopd.
Shaping move-1
VL Seeking new horizons
33
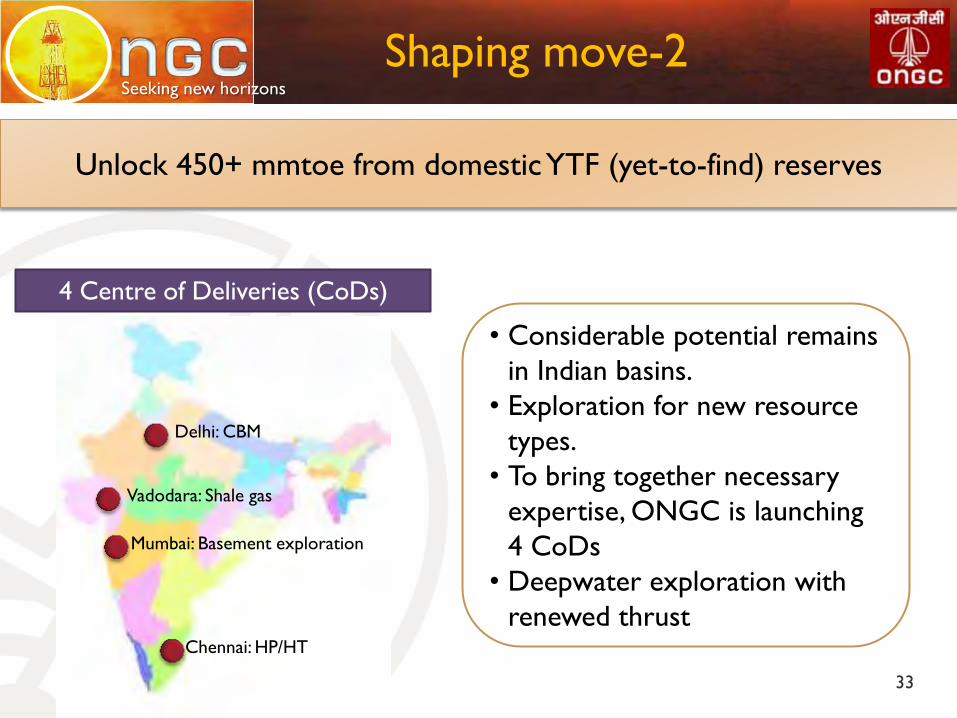
Shaping move-2
Unlock 450+ mmtoe from domestic YTF (yet-to-find) reserves
4 Centre of Deliveries (CoDs)
Delhi: CBM
Vadodara: Shale gas
Mumbai: Basement exploration
Chennai: HP/HT
• Considerable potential remains
in Indian basins.
• Exploration for new resource
types.
• To bring together necessary
expertise, ONGC is launching
4 CoDs
• Deepwater exploration with
renewed thrust

VL Seeking new horizons
34
Shaping move-3
• Yet-to-develop discoveries &
future redevelopment of
existing fields to add more
than 300 mmtoe of production
by 2030.
• 10 fields identified for priority
accelerated development.
• A rigorous stage gate process
for project evaluation and
monitoring.
Accelerate 300-400 mmtoe of (re)-developments

VL Seeking new horizons
35
Shaping move-4
Secure alliance for new resource types
Alliance with Conoco Phillip in Mar’12
for Deepwater & Shale gas
Alliances
MOU with CNPC for cooperation in
hydrocarbon sector in June’12
MOU with Ecopetrol for jointly
studying the fan-belt traps of Cachar
Region in India & for cooperation in
developing EOR/IOR technologies
MOU with CNPC on 18th June’12

VL Seeking new horizons
36
Shaping move-5
Investments will include:
• Further expansion in petrochemicals
at MRPL
• LNG re-gasification,
• Commercialization of stranded gas
• Capacity in alternative energy –
Solar, wind, Nuclear, etc.
ONGC to selectively invest in
the non-E&P sector, leveraging
integration benefits from its
existing portfolio and its
balance sheet for competitive
advantage.
Build non-E&P business to 30% of group revenue

VL Seeking new horizons
37
PP2030
1. Strengthen OVL processes & technical
systems
2. Continued regulatory engagement on
prices & policy
3. Strengthen staffing & capabilities in focus
areas
4. Improve services delivery under new
operating model
5. Align R&D with 2030 technology
priorities
Supporting
Initiatives

VL Seeking new horizons
38
PP2030
Investment > Rs. 11,00,000 Crore during 2013-2030
`Crore
51,000
Prior to IX Plan
22,700
11,00,000
PP-2030
74,000
170,000
IX Plan X Plan
XI Plan
XI1 Plan
2,65,000

VL Seeking new horizons
39
Thank you