Embed Size (px)
Citation preview
To : All Shareholders
The Board of Directors of United Overseas Insurance Limited wishes to make the following announcement:
1.
9 Months 9 Months Incr/ 3rd Qtr 3rd Qtr Incr/2013 2012 (Decr) 2013 2012 (Decr)
(Restated)* (Restated)* $'000 $'000 % $'000 $'000 %
(a) Gross premium written 87,994 84,611 4.0 24,346 21,440 13.6
Net earned premium 32,982 34,724 (5.0) 10,898 10,627 2.6 Less/(Add) :Net claims incurred 14,024 13,701 2.4 4,062 4,924 (17.5) Net commissions (1,034) (854) 21.1 262 786 (66.7) Management expenses : Staff cost 4,617 4,590 0.6 1,498 1,588 (5.7) Rental expenses 890 606 46.9 306 202 51.5 Depreciation 78 99 (21.2) 25 33 (24.2) Foreign exchange loss 78 43 81.4 34 5 NM Other operating expenses 2,130 2,032 4.8 784 843 (7.0) Underwriting profit 12,199 14,507 (15.9) 3,927 2,246 74.8
Gross dividends from investments 4,459 3,803 17.2 1,537 1,234 24.6 Interest income from investments 4,650 4,257 9.2 1,463 1,567 (6.6) Interest on fixed deposits and bank balances 63 59 6.8 20 18 11.1 Amortisation of Investments 20 18 11.1 7 6 16.7 Miscellaneous income 25 15 66.7 2 5 (60.0) Net fair value (losses)/gains on financial derivatives - realised (1,601) 1,247 (228.4) (1,229) 1,423 (186.4) Net fair value gains on financial derivatives - unrealised 581 998 (41.8) 1,503 135 NMNet gains on disposal of available-for-sale investments 4,597 5,329 (13.7) 1,315 1,601 (17.9) (Less)/Add :Management expenses not charged to insurance revenue account: Management fees (705) (568) 24.1 (236) (209) 12.9 Other operating expenses (381) (229) 66.4 (180) (52) 246.2 Exchange gains/(losses) 1,462 (1,883) (177.6) (379) (1,179) (67.9) Non-underwriting income 13,170 13,046 1.0 3,823 4,549 (16.0)
Profit before tax 25,369 27,553 (7.9) 7,750 6,795 14.1 Tax expense (4,046) (4,476) (9.6) (1,228) (1,106) 11.0
Profit from continuing operations, net of tax 21,323 23,077 (7.6) 6,522 5,689 14.6
(Loss)/profit from discontinued operation, net of tax (104) 170 (161.2) (13) 152 (108.6)
Profit attributable to: Equity holders of the Company 21,219 23,247 (8.7) 6,509 5,841 11.4 Note : NM = Not Meaningful
* Restated due to cessation of operation of Hong Kong subsidiary with effect from 1 September 2012.
Group
Unaudited income statement for the nine months/third quarter ended 30 September 2013
1

1.
9 Months 9 Months Incr/ 3rd Qtr 3rd Qtr Incr/2013 2012 (Decr) 2013 2012 (Decr)
(Restated)* (Restated)* % %
(b) Annualised earnings per share from continuing operations: Basic and diluted (cents) 46.5 50.3 (7.6) 42.7 37.2 14.8
(c) Annualised earnings per share : Basic and diluted (cents) 46.3 50.7 (8.7) 42.6 38.2 11.5
2.
9 Months 9 Months Incr/ 3rd Qtr 3rd Qtr Incr/ 2013 2012 (Decr) 2013 2012 (Decr)
(Restated)* (Restated)* $'000 $'000 % $'000 $'000 %
Net profit 21,219 23,247 (8.7) 6,509 5,841 11.4
Other comprehensive income :
Foreign currency translation difference 201 (424) (147.4) (34) (268) (87.3)
Net (losses)/gains on available-for-sale investments (6,059) 12,206 (149.6) 3,460 8,202 (57.8)
Income tax relating to available-for-sale investments 1,039 (2,068) (150.2) (580) (1,391) (58.3) Other comprehensive income for the nine months/3rd quarter ended 30 September, net of tax (4,819) 9,714 (149.6) 2,846 6,543 (56.5)
Total comprehensive income for the nine months/3rd Quarter ended 30 September 16,400 32,961 (50.2) 9,355 12,384 (24.5)
Attributable to: Total comprehensive income from continuing operations, net of tax 16,303 33,215 (50.9) 9,402 12,500 (24.8)
Total comprehensive income from discontinued operation, net of tax 97 (254) (138.2) (47) (116) (59.5)
Total comprehensive income attributable to Equity holders of the Company 16,400 32,961 (50.2) 9,355 12,384 (24.5)
* Restated due to cessation of operation of Hong Kong subsidiary with effect from 1 September 2012.
Unaudited income statement for the nine months/third quarter ended 30 September 2013 (continued)
Group
Unaudited statement of comprehensive income
Group
for the nine months/third quarter ended 30 September 2013
2

3.
Group Company30-Sep-13 31-Dec-12 30-Sep-13 31-Dec-12 $'000 $'000 $'000 $'000
(a) Share capital - Issued & fully paid 91,733 91,733 91,733 91,733 Reserves 176,491 170,487 174,157 168,250
268,224 262,220 265,890 259,983
LiabilitiesInsurance creditors 21,239 12,981 21,240 12,981 Non-trade creditors & accrued liabilities 4,005 2,893 4,005 2,893 Amount owing to related companies 803 1,088 8,067 1,088 Tax payable 6,747 9,647 6,747 9,647 Deferred tax liabilities 2,532 3,571 2,532 3,571 Deferred acquisition cost - reinsurers' share 10,375 9,043 10,375 9,043 Gross technical balances - Reserve for unexpired risks 69,994 60,521 69,994 60,521 - Reserve for outstanding claims 142,928 140,003 142,928 140,003
258,623 239,747 265,888 239,747
Liabilities of discontinued operation - 1,830 - -
526,847 503,797 531,778 499,730
AssetsBank balances and fixed deposits 69,655 35,611 69,655 35,611 Insurance debtor 17,625 11,194 17,625 11,194 Non-trade debtors and accrued interest receivable 2,302 3,389 2,302 3,389 Amount owing by related companies - - - 49 Derivative financial assets 627 46 627 46 Associated company 1 1 1 1 Available-for-sale investments 305,467 321,271 305,467 321,271 Unsecured term loan 13 13 13 13 Fixed assets 250 299 250 299 Deferred acquisition cost - gross 8,620 7,260 8,620 7,260 Reinsurers' share of technical balances - Reserve for unexpired risks 42,506 35,764 42,506 35,764 - Reserve for outstanding claims 79,772 79,893 79,772 79,893
526,838 494,741 526,838 494,790
Investment in subsidiary - - 4,940 4,940 Assets of discontinued operation 9 9,056 - -
526,847 503,797 531,778 499,730
(b) Net asset value per share (S$) 4.39 4.29 4.35 4.25
Number of shares issued ('000) 61,155 61,155 61,155 61,155
Unaudited statement of financial position
3

4.
Available- Foreign for-sale currency Reserve of
Share General investment translation Retained discontinued capital reserve reserve reserve profits operation Total $'000 $'000 $'000 $'000 $'000 $'000 $'000
Balance at 1 January 2013 91,733 22,880 16,437 - 132,939 (1,769) 262,220
Profit net of tax - - - - 21,219 - 21,219 Other comprehensive income for the nine months ended 30 September - - (5,020) - - 201 (4,819) Total comprehensive income for the nine months ended 30 September - - (5,020) - 21,219 201 16,400
Dividend for Year 2012 - - - - (8,561) - (8,561) Dividend for Year 2013 - - - - (1,835) (1,835)
Balance at 30 September 2013 91,733 22,880 11,417 - 143,762 (1,568) 268,224
Balance at 1 January 2012 91,733 22,880 2,784 (1,329) 112,943 - 229,011
Profit net of tax - - - - 23,247 - 23,247 Other comprehensive income for the nine months ended 30 September - - 10,138 (424) - - 9,714 Total comprehensive income for the nine months ended 30 September - - 10,138 (424) 23,247 - 32,961
Dividend for Year 2011 - - - - (7,339) - (7,339) Dividend for Year 2012 - - - - (1,834) (1,834)
Balance at 30 September 2012 91,733 22,880 12,922 (1,753) 127,017 - 252,799
Balance at 1 July 2013 91,733 22,880 8,537 - 139,088 (1,534) 260,704
Profit net of tax - - - - 6,509 - 6,509 Other comprehensive income for the quarter ended 30 September - - 2,880 - - (34) 2,846 Total comprehensive income for the quarter ended 30 September - - 2,880 - 6,509 (34) 9,355
Dividend for Year 2013 - - - - (1,835) - (1,835)
Balance at 30 September 2013 91,733 22,880 11,417 - 143,762 (1,568) 268,224
Balance at 1 July 2012 91,733 22,880 6,111 (1,485) 123,010 - 242,249
Profit net of tax - - - - 5,841 - 5,841 Other comprehensive income for the quarter ended 30 September - - 6,811 (268) - - 6,543 Total comprehensive income for the quarter ended 30 September - - 6,811 (268) 5,841 - 12,384
Dividend for Year 2012 - - - - (1,834) - (1,834)
Balance at 30 September 2012 91,733 22,880 12,922 (1,753) 127,017 - 252,799
Unaudited Group statement of changes in equity
4

5.Available- for-sale
Share General investment Retainedcapital reserve reserve profits Total
$'000 $'000 $'000 $'000 $'000
Balance at 1 January 2013 91,733 22,880 16,437 128,933 259,983
Profit net of tax - - - 21,323 21,323 Other comprehensive income for the nine months ended 30 September - - (5,020) - (5,020) Total comprehensive income for the nine months ended 30 September - - (5,020) 21,323 16,303
Dividend for Year 2012 - - - (8,561) (8,561) Dividend for Year 2013 - - - (1,835) (1,835)
Balance at 30 September 2013 91,733 22,880 11,417 139,860 265,890
Balance at 1 January 2012 91,733 22,880 2,784 108,983 226,380
Profit net of tax - - - 23,077 23,077 Other comprehensive income for the nine months ended 30 September - - 10,138 - 10,138 Total comprehensive income for the nine months ended 30 September - - 10,138 23,077 33,215
Dividend for Year 2011 - - - (7,339) (7,339) Dividend for Year 2012 - - - (1,834) (1,834)
Balance at 30 September 2012 91,733 22,880 12,922 122,887 250,422
Balance at 1 July 2013 91,733 22,880 8,537 135,173 258,323
Profit net of tax - - - 6,522 6,522 Other comprehensive income for the quarter ended 30 September - - 2,880 - 2,880 Total comprehensive income for the quarter ended 30 September - - 2,880 6,522 9,402
Dividend for Year 2013 - - - (1,835) (1,835)
Balance at 30 September 2013 91,733 22,880 11,417 139,860 265,890
Balance at 1 July 2012 91,733 22,880 6,111 119,032 239,756
Profit net of tax - - - 5,689 5,689 Other comprehensive income for the quarter ended 30 September - - 6,811 - 6,811 Total comprehensive income for the quarter ended 30 September - - 6,811 5,689 12,500
Dividend for Year 2012 - - - (1,834) (1,834)
Balance at 30 September 2012 91,733 22,880 12,922 122,887 250,422
Unaudited Company statement of changes in equity
5
6.
9 Months 9 Months 3rd Qtr 3rd Qtr 2013 2012 2013 2012 $'000 $'000 $'000 $'000
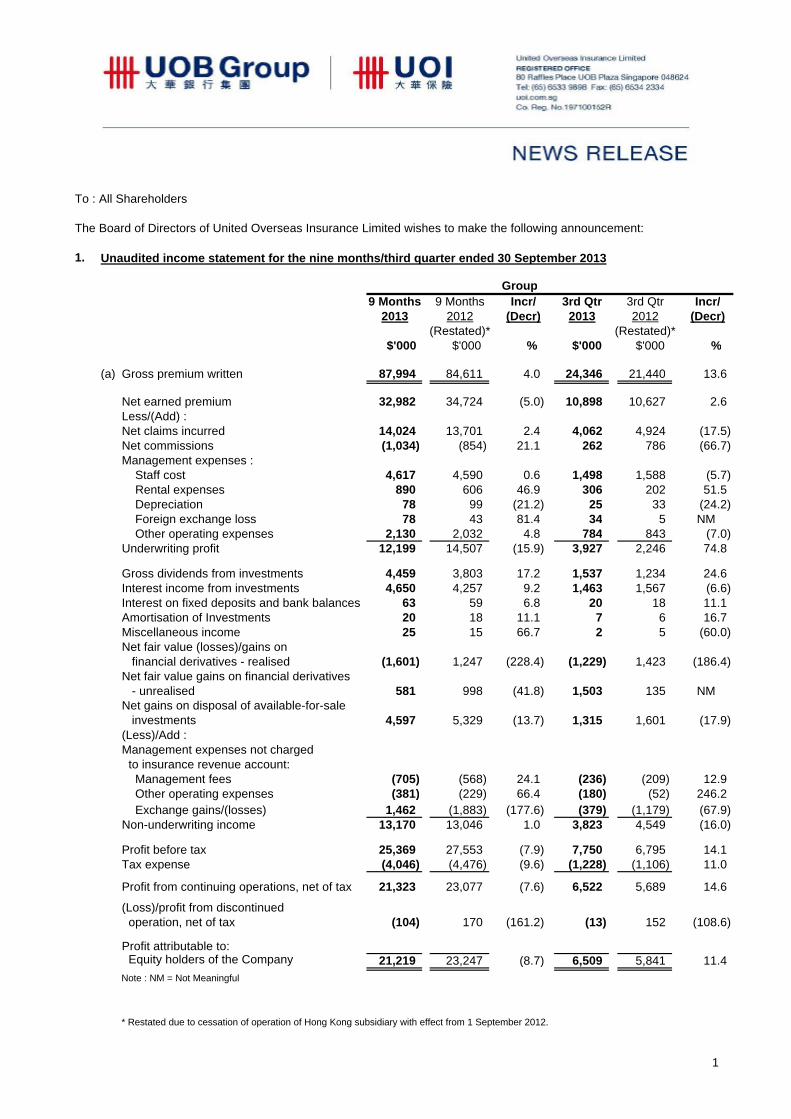
Cash flows from operating activitiesProfit before tax from continuing operations 25,369 27,553 7,750 6,795 (Loss)/profit before tax from discontinued opeation (104) 177 (13) 155
25,265 27,730 7,737 6,950
Adjustments for: Foreign currency difference on reserve for unexpired risks (net of deferred acquisition cost) - (3) - (2) Foreign currency difference on provision for outstanding claims - (6) - (4) Movement in net reserve for unexpired risks 2,619 (48) (111) (823) Movement in net deferred acquisition costs (28) - (185) - Movement in net outstanding claims 2,953 3,480 1,205 1,566 Net fair value gains on financial derivatives - unrealised (581) (998) (1,503) (135) Depreciation 78 99 25 33 Net gains on available-for-sale investments (4,597) (5,329) (1,315) (1,601) Amortisation of Investments (20) (18) (7) (6) Gross dividends from investments (4,459) (3,803) (1,537) (1,234) Interest income from investments (4,650) (4,257) (1,463) (1,567) Interest on fixed deposits and bank balances (63) (59) (20) (18) Exchange differences (1,667) 2,301 218 1,473 Operating profit before working capital change 14,850 19,089 3,044 4,632
Changes in working capital: Trade and other receivables (5,276) (5,451) 3,355 5,545 Trade and other payables 8,927 8,362 (3,447) (4,420) Amount owing to related companies (285) (479) 73 (2) Cash generated from operations 18,216 21,521 3,025 5,755 Tax paid (6,946) (1,137) (3,476) (487) Net cash flows from/(used in) operating activities 11,270 20,384 (451) 5,268
Cash flows from investing activities Proceeds from sale of available-for-sale investments 123,379 105,663 71,606 25,471 Purchase of available-for-sale investments (107,350) (112,569) (42,348) (43,851) Purchase of fixed assets (29) (23) (26) (6) Maturity of/(placement in) long-term fixed deposits 2,985 3,292 (2,013) 3,499 Unsecured term loans - 3 - 3 Gross dividends from investments 4,459 3,803 1,537 1,234 Interest income from investments 4,650 4,257 1,463 1,567 Interest on fixed deposits and bank balances 63 59 20 18 Net cash flows from/(used in) investing activities 28,157 4,485 30,239 (12,065)
Cash flow from financing activityDividend paid (10,396) (9,173) (1,835) (1,834) Cash flow used in financing activity (10,396) (9,173) (1,835) (1,834)
Translation difference on foreign subsidiary company 201 (424) (34) (268) Net increase/(decrease) in cash and cash equivalents 29,232 15,272 27,919 (8,899) Cash and cash equivalents at beginning of period 36,024 29,853 37,337 53,860 Effects of exchange rate changes on cash and cash equivalents - (439) - (275) Cash and cash equivalents at end of period 65,256 44,686 65,256 44,686
GroupUnaudited statement of cash flows
6

6.
For the purpose of the statement of cash flows, cash and cash equivalents comprise the following at theend of the year :
9 Months 9 Months 2013 2012$'000 $'000
Cash and cash equivalents - continuing operations 65,256 36,974 - discontinued operation - 7,712
65,256 44,686
9 Months 9 Months 2013 2012$'000 $'000
Cash and bank balances 15,072 9,465 Fixed deposits placement less than 3 months 50,184 35,221 Cash and cash equivalents 65,256 44,686 Fixed deposits placement more than 3 months 4,399 2,370
69,655 47,056
Group
Bank balances and fixed deposits in the statement of financial position comprise the following :
Group
Unaudited statement of cash flows (continued)
7
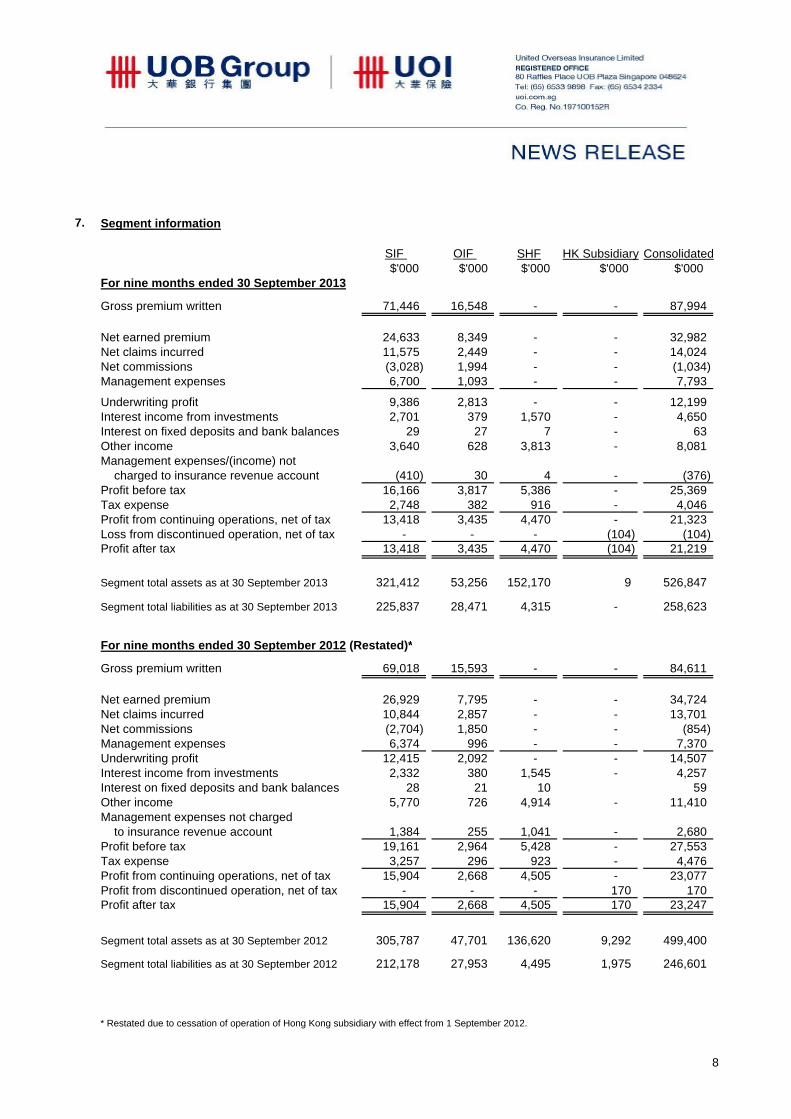
7.
SIF OIF SHF HK Subsidiary Consolidated $'000 $'000 $'000 $'000 $'000
For nine months ended 30 September 2013
Gross premium written 71,446 16,548 - - 87,994
Net earned premium 24,633 8,349 - - 32,982 Net claims incurred 11,575 2,449 - - 14,024 Net commissions (3,028) 1,994 - - (1,034) Management expenses 6,700 1,093 - - 7,793
Underwriting profit 9,386 2,813 - - 12,199 Interest income from investments 2,701 379 1,570 - 4,650 Interest on fixed deposits and bank balances 29 27 7 - 63 Other income 3,640 628 3,813 - 8,081 Management expenses/(income) not charged to insurance revenue account (410) 30 4 - (376) Profit before tax 16,166 3,817 5,386 - 25,369 Tax expense 2,748 382 916 - 4,046 Profit from continuing operations, net of tax 13,418 3,435 4,470 - 21,323 Loss from discontinued operation, net of tax - - - (104) (104) Profit after tax 13,418 3,435 4,470 (104) 21,219
Segment total assets as at 30 September 2013 321,412 53,256 152,170 9 526,847
Segment total liabilities as at 30 September 2013 225,837 28,471 4,315 - 258,623
For nine months ended 30 September 2012 (Restated)*
Gross premium written 69,018 15,593 - - 84,611
Net earned premium 26,929 7,795 - - 34,724 Net claims incurred 10,844 2,857 - - 13,701 Net commissions (2,704) 1,850 - - (854) Management expenses 6,374 996 - - 7,370 Underwriting profit 12,415 2,092 - - 14,507 Interest income from investments 2,332 380 1,545 - 4,257 Interest on fixed deposits and bank balances 28 21 10 59 Other income 5,770 726 4,914 - 11,410 Management expenses not charged to insurance revenue account 1,384 255 1,041 - 2,680 Profit before tax 19,161 2,964 5,428 - 27,553 Tax expense 3,257 296 923 - 4,476 Profit from continuing operations, net of tax 15,904 2,668 4,505 - 23,077 Profit from discontinued operation, net of tax - - - 170 170 Profit after tax 15,904 2,668 4,505 170 23,247
Segment total assets as at 30 September 2012 305,787 47,701 136,620 9,292 499,400
Segment total liabilities as at 30 September 2012 212,178 27,953 4,495 1,975 246,601
* Restated due to cessation of operation of Hong Kong subsidiary with effect from 1 September 2012.
Segment information
8

7.
SIF OIF SHF HK Subsidiary Consolidated $'000 $'000 $'000 $'000 $'000
3 months ended 30 September 2013
Gross premium written 20,494 3,852 - - 24,346
Net earned premium 8,388 2,510 - - 10,898 Net claims incurred 3,764 298 - - 4,062 Net commissions (421) 683 - - 262 Management expenses 2,093 554 - - 2,647
Underwriting profit 2,952 975 - - 3,927 Interest income from investments 840 118 505 - 1,463 Interest on fixed deposits and bank balances 9 8 3 - 20 Other income 1,342 229 1,564 - 3,135 Management expenses/(income) not charged to insurance revenue account 347 51 397 - 795 Profit before tax 4,796 1,279 1,675 - 7,750 Tax expense 815 128 285 - 1,228 Profit from continuing operations, net of tax 3,981 1,151 1,390 - 6,522 Loss from discontinued operation, net of tax - - - (13) (13) Profit after tax 3,981 1,151 1,390 (13) 6,509
Segment total assets as at 30 September 2013 321,412 53,256 152,170 9 526,847
Segment total liabilities as at 30 September 2013 225,837 28,471 4,315 - 258,623
3 months ended 30 September 2012 (Restated)*
Gross premium written 18,053 3,387 - - 21,440
Net earned premium 8,623 2,004 - - 10,627 Net claims incurred 4,176 748 - - 4,924 Net commissions 388 398 - - 786 Management expenses 2,168 503 - - 2,671 Underwriting profit 1,891 355 - - 2,246 Interest income from investments 867 139 561 - 1,567 Interest on fixed deposits and bank balances 10 6 2 18 Other income 2,373 322 1,709 - 4,404 Management expenses not charged to insurance revenue account 757 128 555 - 1,440 Profit before tax 4,384 694 1,717 - 6,795 Tax expense 745 69 292 - 1,106 Profit from continuing operations, net of tax 3,639 625 1,425 - 5,689 Profit from discontinued operation, net of tax - - - 152 152 Profit after tax 3,639 625 1,425 152 5,841
Segment total assets as at 30 September 2012 305,787 47,701 136,620 9,292 499,400
Segment total liabilities as at 30 September 2012 212,178 27,953 4,495 1,975 246,601
* Restated due to cessation of operation of Hong Kong subsidiary with effect from 1 September 2012.
Segment information (continued)
9

7.
Information about major external customer
Geographical information
9 Months 9 Months 9 Months 9 Months2013 2012 2013 2012
(Restated)*$'000 $'000 $'000 $'000
Singapore 64,667 62,412 250 303 Asean 10,330 10,419 - - Others 4,875 3,686 - -
79,872 76,517 250 303
3rd Qtr 3rd Qtr 3rd Qtr 3rd Qtr2013 2012 2013 2012
(Restated)*$'000 $'000 $'000 $'000
Singapore 19,776 18,127 250 303 Asean 1,712 2,270 - - Others 1,886 875 - -
23,374 21,272 250 303
* Restated due to cessation of operation of Hong Kong subsidiary with effect from 1 September 2012.
The segment information has been prepared in accordance with the Group's accounting policy and SingaporeFinancial Reporting Standards (FRS).
The Group's non-current assets presented above consist of fixed assets only.
For the nine months/third quarter ended 30 September 2013 and the corresponding period last year, the Groupdid not have any external customer whose premium income exceeded 10% of the Group’s total revenue.
Geographical information of the Group’s revenue derived from external customers based on location of insurancerisks and non-current assets are as follows:
Revenue
Revenue
Non-current assets as at
Non-current assets as at
The Group is principally engaged in the business of underwriting general insurance. With different operatingsegments, its businesses are segregated into separate fund accounts in accordance with the requirements of theSingapore Insurance Act (Chapter 142).
As required under the Singapore Insurance Act, the Company has established and maintained a SingaporeInsurance Fund (SIF) for insurance business relating to Singapore policies and an Offshore Insurance Fund (OIF)for insurance business relating to offshore policies. Shareholders' Fund (SHF) relates to the Company'sinvestment activities of its non-insurance funds.
The HK Subsidiary refers to the Company's wholly-owned subsidiary, UOB Insurance (H.K.) Limited, incorporatedin Hong Kong S.A.R., which had ceased operation with effect from 1 September 2012. On 15 March 2013, theHong Kong Insurance Authority approved the Hong Kong Subsidiary's application to withdraw its authorisationunder the Hong Kong Insurance Companies Ordinance. The Company is in the process of members' voluntarywinding up and liquidators were appointed on 2 September 2013.
Segment information (continued)
10
8.
9 9 9M13/ 3rd 3rd 3Q13/$'000 Months Months 9M12 Quarter Quarter 3Q12
2013 2012 % 2013 2012 %(Restated)* (Restated)*
Gross premium written 87,994 84,611 + 4.0 24,346 21,440 +13.6
Underwriting profit 12,199 14,507 -15.9 3,927 2,246 +74.8
Non-underwriting Income 13,170 13,046 + 1.0 3,823 4,549 -16.0
Profit before tax 25,369 27,553 - 7.9 7,750 6,795 +14.1
*
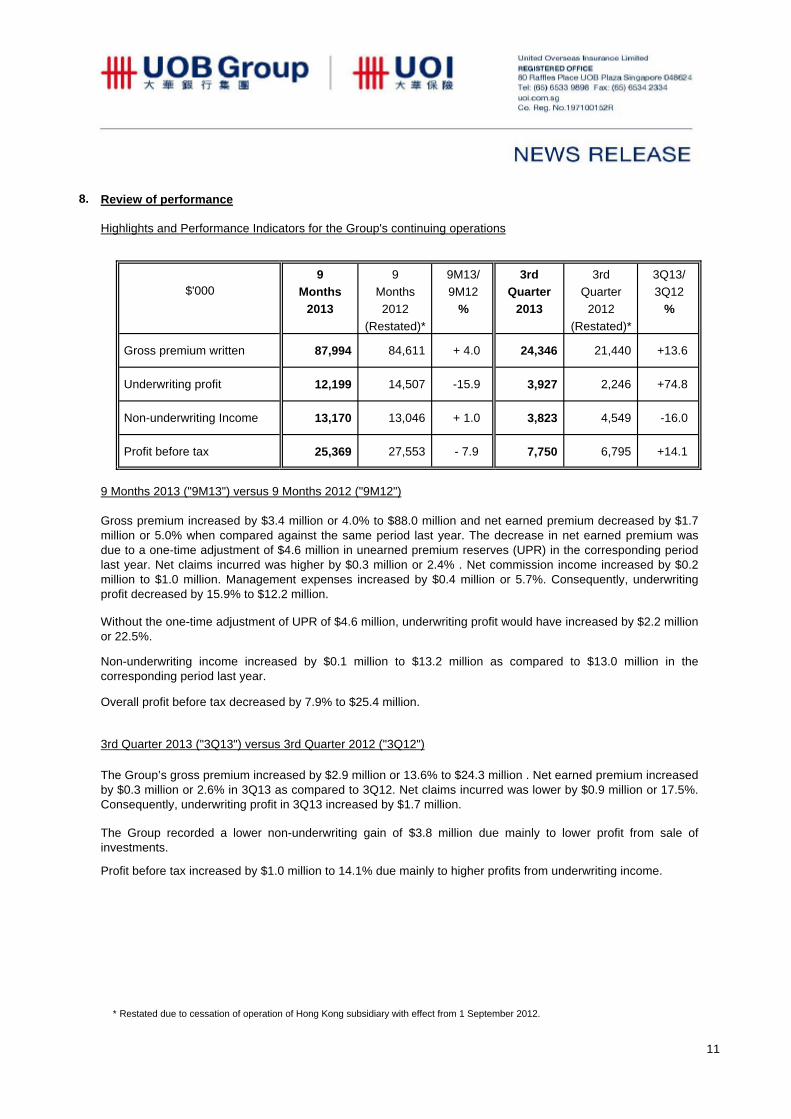
Review of performance
Highlights and Performance Indicators for the Group's continuing operations
Gross premium increased by $3.4 million or 4.0% to $88.0 million and net earned premium decreased by $1.7million or 5.0% when compared against the same period last year. The decrease in net earned premium wasdue to a one-time adjustment of $4.6 million in unearned premium reserves (UPR) in the corresponding periodlast year. Net claims incurred was higher by $0.3 million or 2.4% . Net commission income increased by $0.2million to $1.0 million. Management expenses increased by $0.4 million or 5.7%. Consequently, underwritingprofit decreased by 15.9% to $12.2 million.
The Group’s gross premium increased by $2.9 million or 13.6% to $24.3 million . Net earned premium increasedby $0.3 million or 2.6% in 3Q13 as compared to 3Q12. Net claims incurred was lower by $0.9 million or 17.5%.Consequently, underwriting profit in 3Q13 increased by $1.7 million.
Non-underwriting income increased by $0.1 million to $13.2 million as compared to $13.0 million in thecorresponding period last year.
Overall profit before tax decreased by 7.9% to $25.4 million.
9 Months 2013 ("9M13") versus 9 Months 2012 ("9M12")
Without the one-time adjustment of UPR of $4.6 million, underwriting profit would have increased by $2.2 millionor 22.5%.
3rd Quarter 2013 ("3Q13") versus 3rd Quarter 2012 ("3Q12")
Profit before tax increased by $1.0 million to 14.1% due mainly to higher profits from underwriting income.
The Group recorded a lower non-underwriting gain of $3.8 million due mainly to lower profit from sale ofinvestments.
Restated due to cessation of operation of Hong Kong subsidiary with effect from 1 September 2012.
11

9.
10.
11.
12.
13.
14.
BY ORDER OF THE BOARD
THERESA SIM KWEE SOIKASSISTANT SECRETARY
Dated this 30th October 2013
Prospects for the next reporting period and the next 12 months
Accounting policy
Dividend
Borrowings, contingent liabilities and loan capital
Operating environment will remain challenging in view of continued uncertainties globally and intensifyingcompetition in the general insurance industry. Higher operating costs and higher claims from Work InjuryCompensation Insurance after legislative changes last year will continue to squeeze underwriting margin. TheCompany's proven prudential underwriting policy will however ensure sustainability of underwriting profitability ata credible level.
The Group has maintained strong liquidity for its business operations and has no borrowings, contingentliabilities and loan capital as at 30 September 2013 (30 September 2012: nil).
The financial statements, expressed in Singapore dollars are prepared in accordance with Singapore FinancialReporting Standards (FRS). The accounting policies and computation methods adopted in the financialstatements for the nine months ended 30 September 2013 are the same as those adopted in the precedingyear.
No dividend has been declared for the third quarter ended 30 September 2013.
Given the uncertain economic outlook globally, investment income will likely remain volatile.
Confirmation by directors
The Board of Directors of the Company hereby confirm that, to the best of their knowledge, nothing has come toits attention which may render the unaudited group financial results for the nine months ended 30 September2013 to be false or misleading.
Interested person transactions
The Company has not obtained a general mandate from shareholders for interested person transactions.
12


![[incr Widgets]docs/external/tcl/itcl/tutorials/iwidgets-a4.pdf · Creation of an [incr Widgets] mega-widget is exactly like that of a standard Tk widget: you invoke the class name](https://img.pdfslide.us/doc/110x75/5ed1814451d1407b5a2e7997/incr-widgets-docsexternaltclitcltutorialsiwidgets-a4pdf-creation-of-an.jpg)


![with [incr Tcl] Building Mega-Widgets with [incr Tk]docs/external/tcl/itcl/tutorials/itclitk-a4.pdf · 0:Object-Oriented Programming with [incr Tcl] 0:Building Mega-Widgets with [incr](https://img.pdfslide.us/doc/110x75/5aa5b6187f8b9ab4788d821f/with-incr-tcl-building-mega-widgets-with-incr-tk-docsexternaltclitcltutorialsitclitk-a4pdf0object-oriented.jpg)


![[incr Insight] - Brown University](https://img.pdfslide.us/doc/110x75/61ebb6e3f12ced0d471cf90d/incr-insight-brown-university.jpg)