Embed Size (px)
Citation preview
TMB Bank Plc.
To be the most advocated bank in Thailand
Investor Presentation - TMB 5-Year Plan
Contents
➢ Aspiration & Strategy
➢ TMB Journey
➢ TMB 5-Year Plan
➢ Make THE Difference Story
Appendix
2018 Financial Targets
2
TMB Aspiration & Strategy
Ripple out Make THE Difference philosophy
3
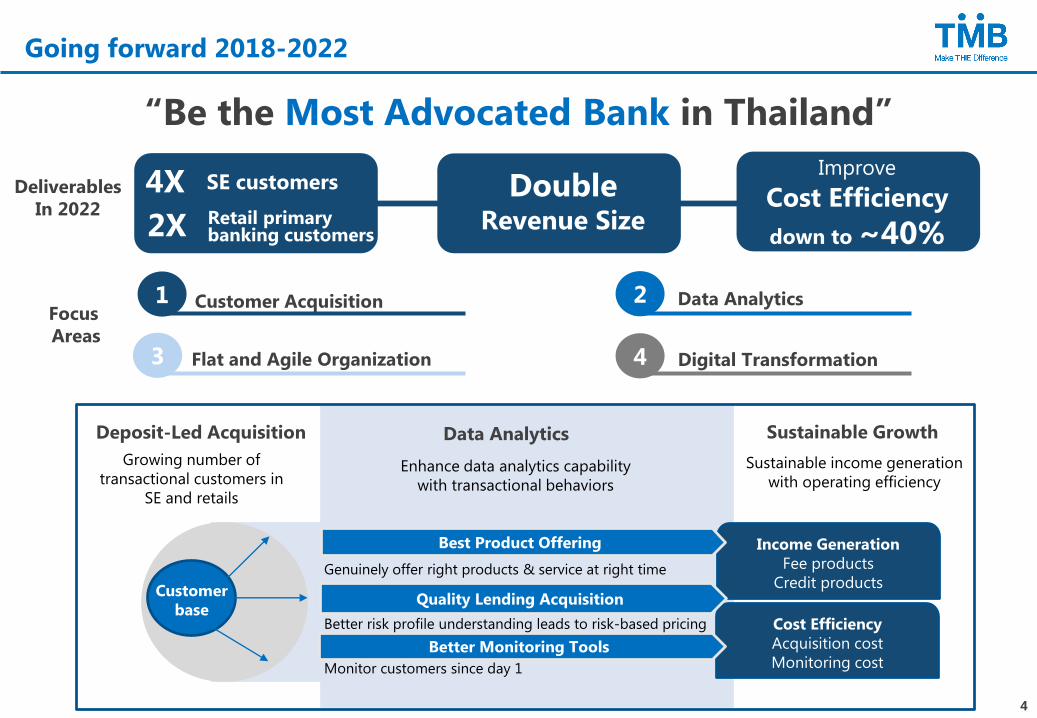
Going forward 2018-2022
Deposit-Led Acquisition
Enhance data analytics capability
with transactional behaviors
Growing number of
transactional customers in
SE and retails
Data Analytics
Income Generation
Fee products
Credit products
Cost Efficiency
Acquisition cost
Monitoring cost
Quality Lending Acquisition
Best Product Offering
Better Monitoring Tools
Sustainable Growth
Customer
base
Genuinely offer right products & service at right time
Better risk profile understanding leads to risk-based pricing
Monitor customers since day 1
Sustainable income generation
with operating efficiency
“Be the Most Advocated Bank in Thailand”
1 Data Analytics2Customer Acquisition
Flat and Agile Organization3 4 Digital Transformation
Focus
Areas
4X DoubleRevenue Size
Improve
Cost Efficiency
down to ~40% 2X
SE customers
Retail primary banking customers
Deliverables
In 2022
4
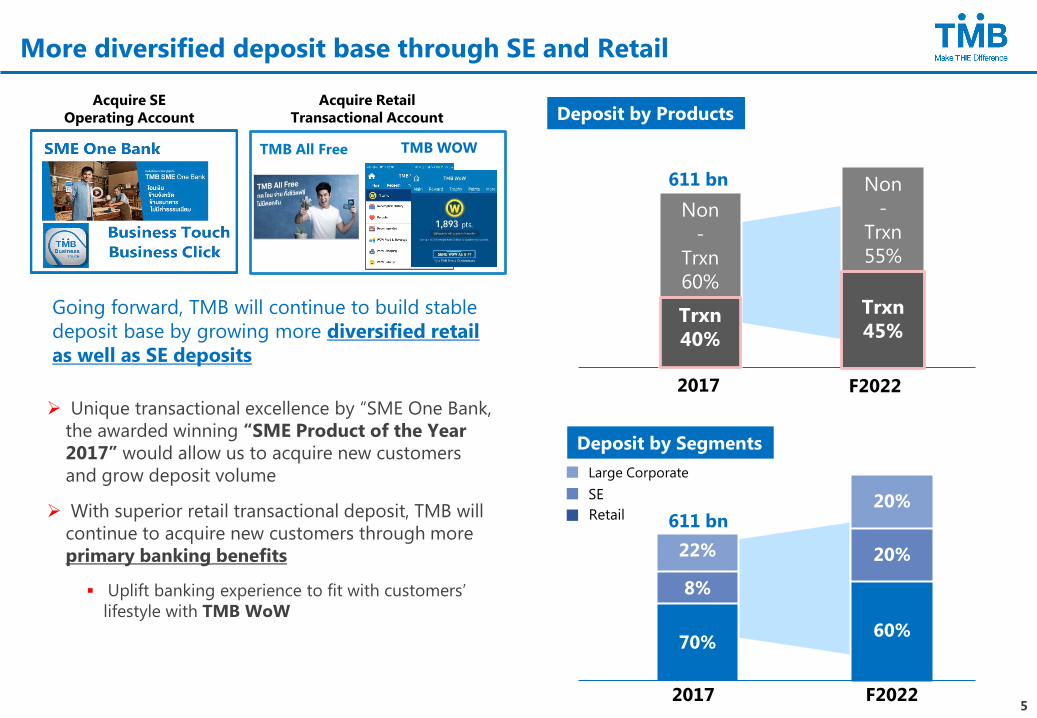
More diversified deposit base through SE and Retail
20%
20%
60%
22%
8%
70%
Deposit by Segments
F20222017
SE
Retail
Large Corporate
611 bn
F20222017
Deposit by Products
Non
-
Trxn
55%
Trxn
45%
Non
-
Trxn
60%
Trxn
40%
611 bn
Acquire SE
Operating Account
➢ Unique transactional excellence by “SME One Bank,
the awarded winning “SME Product of the Year
2017” would allow us to acquire new customers
and grow deposit volume
➢ With superior retail transactional deposit, TMB will
continue to acquire new customers through more
primary banking benefits
▪ Uplift banking experience to fit with customers’
lifestyle with TMB WoW
TMB All Free
Acquire Retail
Transactional Account
TMB WOW
Going forward, TMB will continue to build stable
deposit base by growing more diversified retail
as well as SE deposits
5
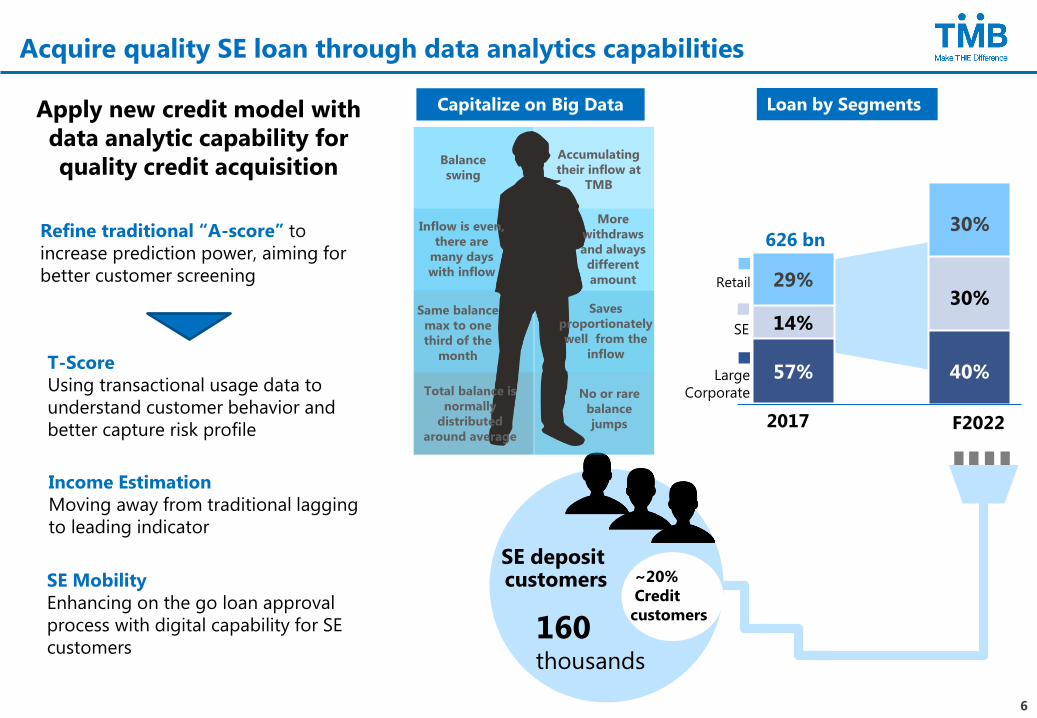
Acquire quality SE loan through data analytics capabilities
Apply new credit model with
data analytic capability for
quality credit acquisition
Loan by Segments
F20222017
SE
Large
Corporate
Retail
626 bn30%
30%
40%
29%
14%
57%
160thousands
SE deposit customers ~20%
Credit
customers
Capitalize on Big Data
T-Score
Using transactional usage data to
understand customer behavior and
better capture risk profile
Income Estimation
Moving away from traditional lagging
to leading indicator
SE Mobility
Enhancing on the go loan approval
process with digital capability for SE
customers
Refine traditional “A-score” to
increase prediction power, aiming for
better customer screening
Accumulating
their inflow at
TMB
Balance
swing
More
withdraws
and always
different
amount
Inflow is even,
there are
many days
with inflow
Saves
proportionately
well from the
inflow
Same balance
max to one
third of the
month
Total balance is
normally
distributed
around average
No or rare
balance
jumps
6
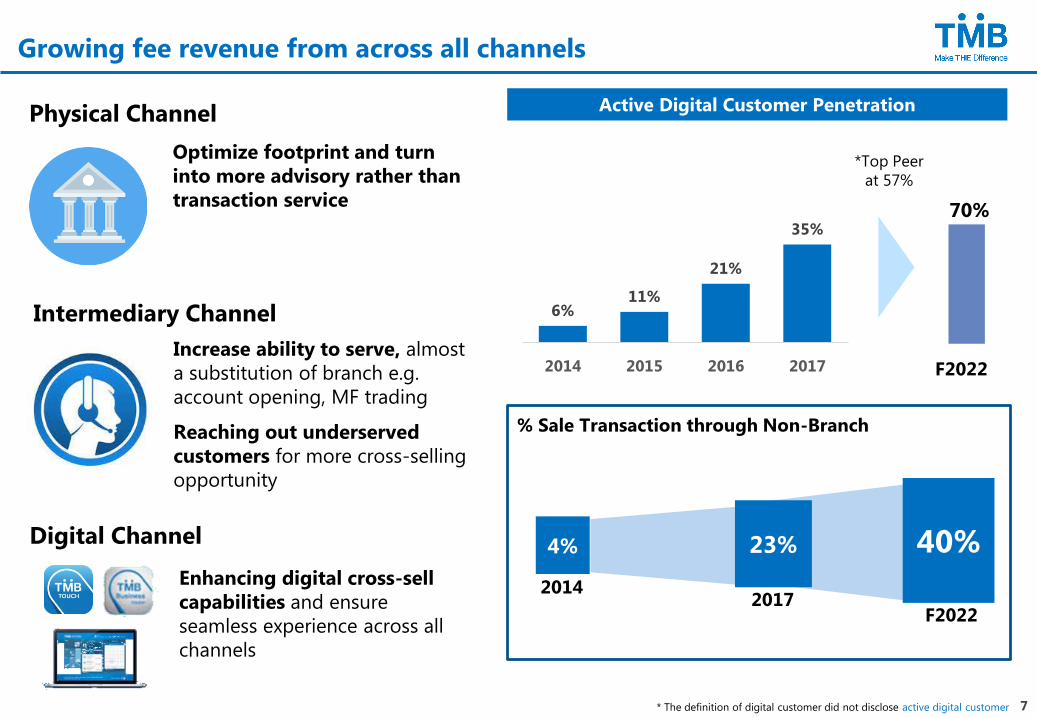
Growing fee revenue from across all channels
Active Digital Customer Penetration
70%
% Sale Transaction through Non-Branch
4% 40%
F2022
*Top Peer
at 57%
Optimize footprint and turn
into more advisory rather than
transaction service
Increase ability to serve, almost
a substitution of branch e.g.
account opening, MF trading
Reaching out underserved
customers for more cross-selling
opportunity
Physical Channel
Intermediary Channel
Digital Channel 23%
20142017
F2022
Enhancing digital cross-sell
capabilities and ensure
seamless experience across all
channels
6%11%
21%
35%
2014 2015 2016 2017
* The definition of digital customer did not disclose active digital customer 7
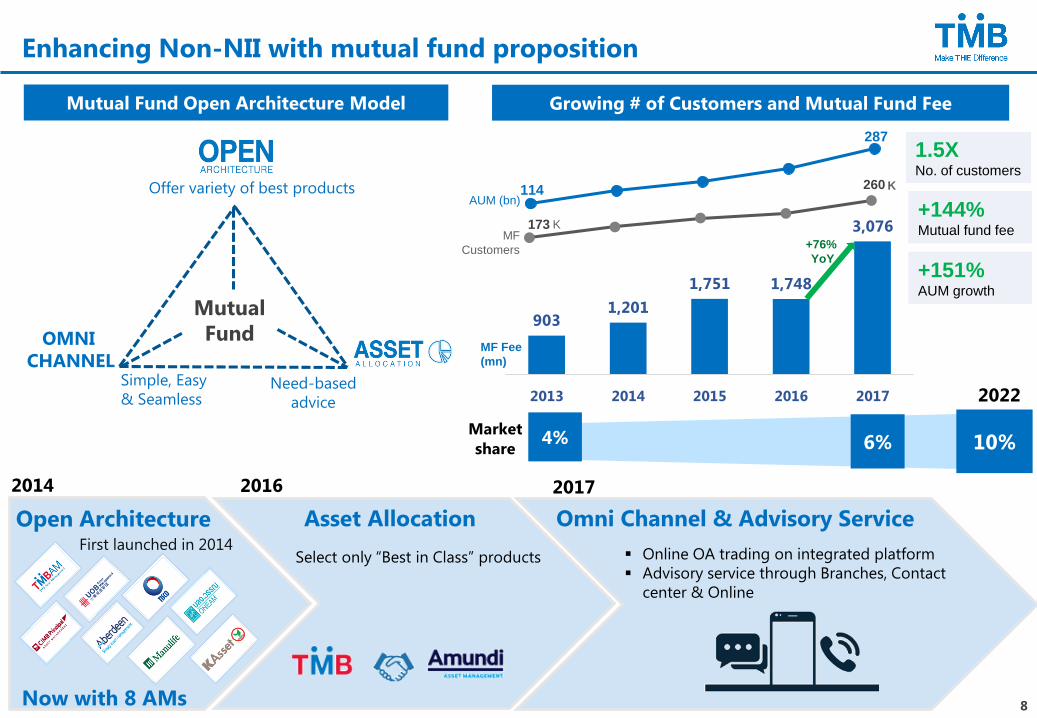
Enhancing Non-NII with mutual fund proposition
Market
share
Growing # of Customers and Mutual Fund Fee
4% 6% 10%
Open Architecture
2022
2014 2016 2017
Asset Allocation
Select only “Best in Class” productsFirst launched in 2014
Omni Channel & Advisory Service
▪ Online OA trading on integrated platform
▪ Advisory service through Branches, Contact
center & Online
Mutual Fund Open Architecture Model
OMNI
CHANNEL
Offer variety of best products
Need-based
advice
Simple, Easy
& Seamless
Now with 8 AMs
Mutual
Fund
1.5XNo. of customers
+144% Mutual fund fee 173
260
9031,201
1,751 1,748
3,076
2013 2014 2015 2016 2017
+76%
YoY
MF Fee
(mn)
AUM (bn)
MF
Customers
+151% AUM growth
K
K114
287
8
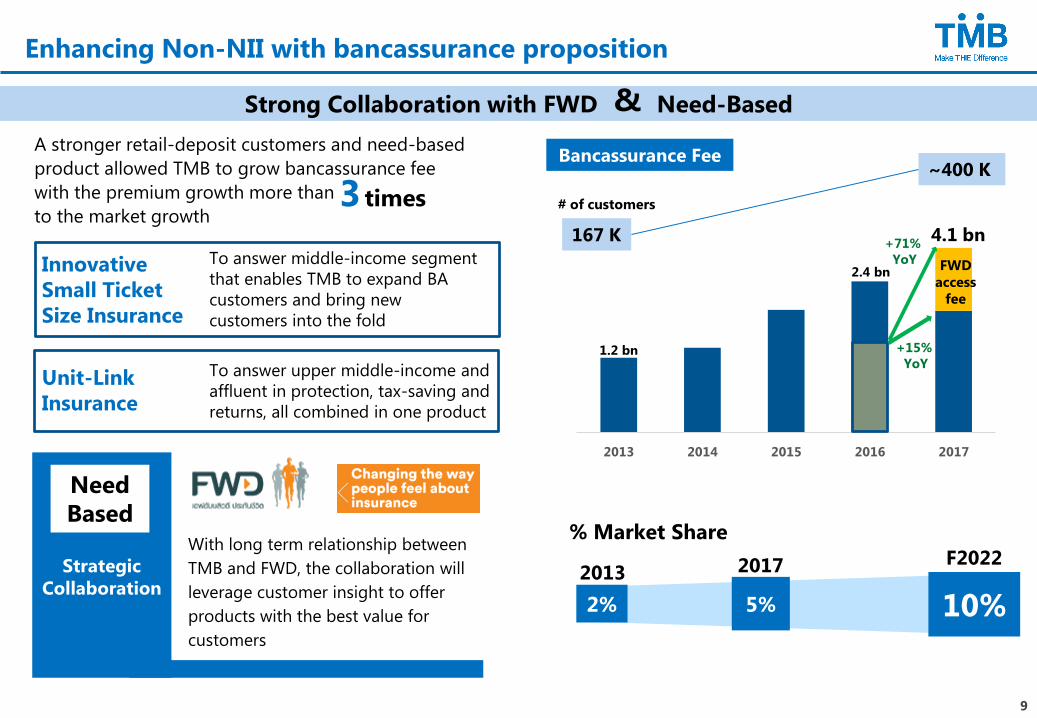
Strategic
Collaboration
Enhancing Non-NII with bancassurance proposition
A stronger retail-deposit customers and need-based
product allowed TMB to grow bancassurance fee
with the premium growth more than
to the market growth
% Market Share
5% 10%
2017 F2022
2%
2013
With long term relationship between
TMB and FWD, the collaboration will
leverage customer insight to offer
products with the best value for
customers
Strong Collaboration with FWD Need-Based&
3 times
Need
Based
Innovative
Small Ticket
Size Insurance
To answer middle-income segment
that enables TMB to expand BA
customers and bring new
customers into the fold
Unit-Link
Insurance
To answer upper middle-income and
affluent in protection, tax-saving and
returns, all combined in one product
1.2 bn
2013 2014 2015 2016 2017
+15%
YoY
+71%
YoY
4.1 bn
Bancassurance Fee
FWD
access
fee
167 K
~400 K
# of customers
2.4 bn
9
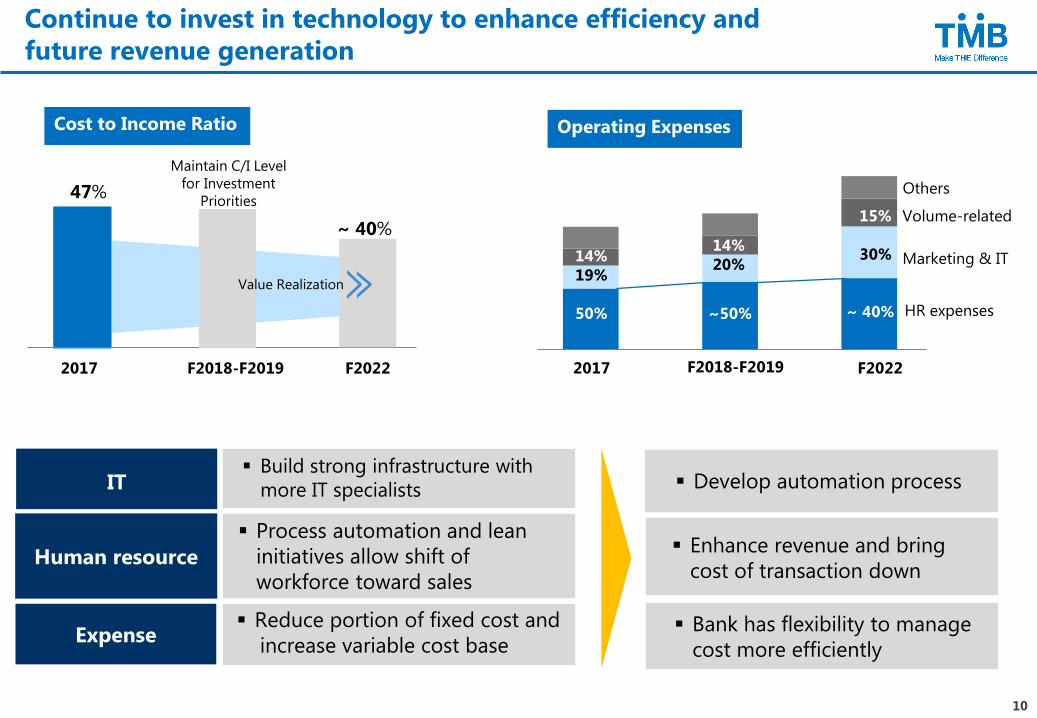
Continue to invest in technology to enhance efficiency and
future revenue generation
F2018-F2019 F2022
Maintain C/I Level
for Investment
Priorities
Cost to Income Ratio
~ 40%
47%
2017
IT▪ Build strong infrastructure with
more IT specialists ▪ Develop automation process
Human resource
▪ Process automation and lean
initiatives allow shift of
workforce toward sales
F2018-F2019 F20222017
HR expenses
Marketing & IT
Others
Operating Expenses
14%
19%
50%
14%
20%
~50%
15%
30%
~ 40%
Expense▪ Reduce portion of fixed cost and
increase variable cost base▪ Bank has flexibility to manage
cost more efficiently
Value Realization
▪ Enhance revenue and bring
cost of transaction down
Volume-related
10
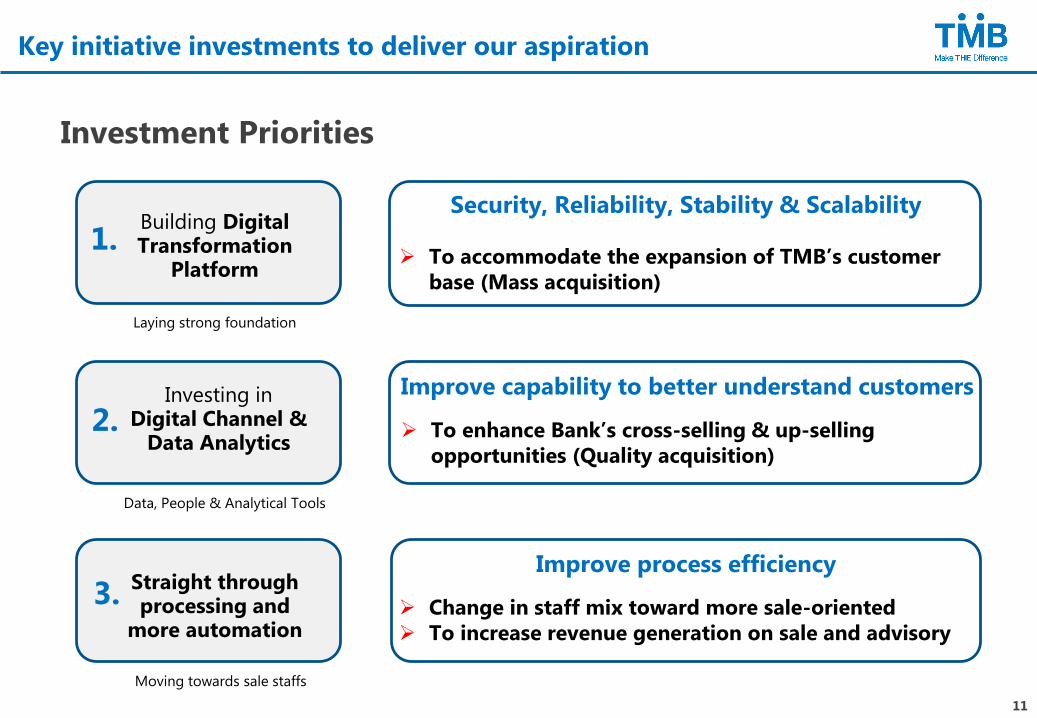
Key initiative investments to deliver our aspiration
Investment Priorities
Building Digital Transformation
Platform
1.
Investing in Digital Channel &
Data Analytics2.
3. Straight through processing and
more automation
Moving towards sale staffs
Data, People & Analytical Tools
Laying strong foundation
➢ To accommodate the expansion of TMB’s customer
base (Mass acquisition)
➢ To enhance Bank’s cross-selling & up-selling
opportunities (Quality acquisition)
Improve capability to better understand customers
Improve process efficiency
Security, Reliability, Stability & Scalability
➢ Change in staff mix toward more sale-oriented
➢ To increase revenue generation on sale and advisory
11
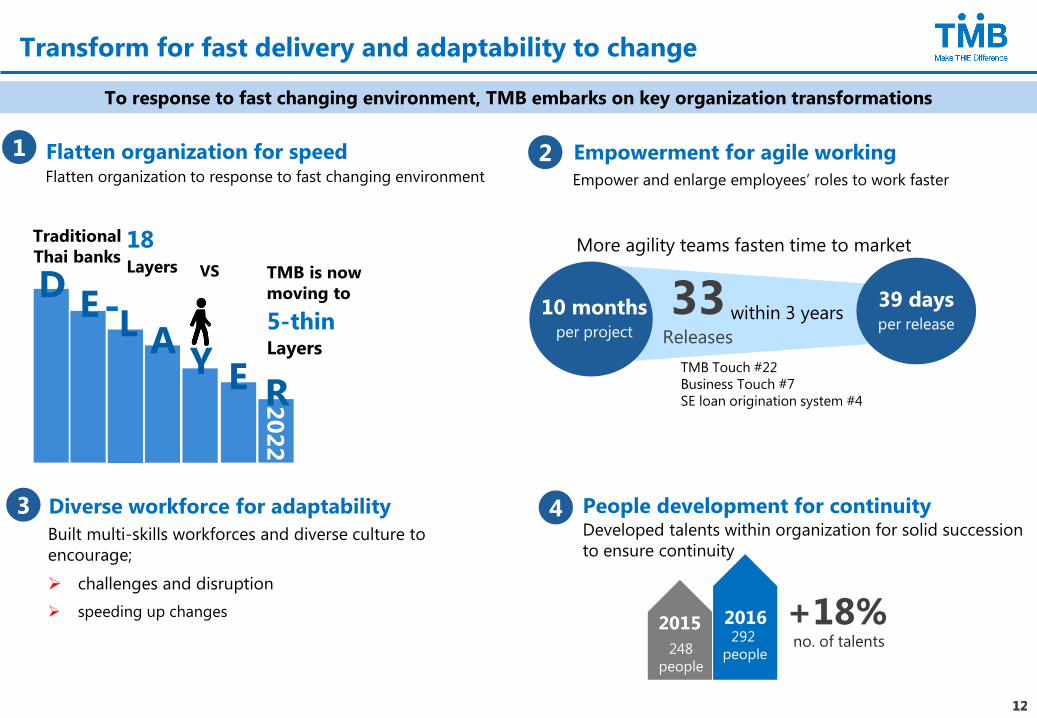
Transform for fast delivery and adaptability to change
Traditional
Thai banks18 Layers
5-thinLayers
39 days per release
10 monthsper project
Flatten organization for speed
33Releases
within 3 years
To response to fast changing environment, TMB embarks on key organization transformations
Built multi-skills workforces and diverse culture to
encourage;
➢ challenges and disruption
➢ speeding up changes
Developed talents within organization for solid succession
to ensure continuity
292
people
DE
L AY E
20
22
R
no. of talents
TMB Touch #22
Business Touch #7
SE loan origination system #4
Empowerment for agile working
VS
Diverse workforce for adaptability
More agility teams fasten time to market
People development for continuity
+18%2016292
people
2015
248
people
1 2
3 4
TMB is now
moving to
-
Empower and enlarge employees’ roles to work fasterFlatten organization to response to fast changing environment
1212
TMB’S TRANSFORMATION JOURNEY
Grow customer base
Improve income generation both NII and Non-NII
Lower cost to income through lean initiatives
Grow quality profit
Strengthen financial position and capital base
13
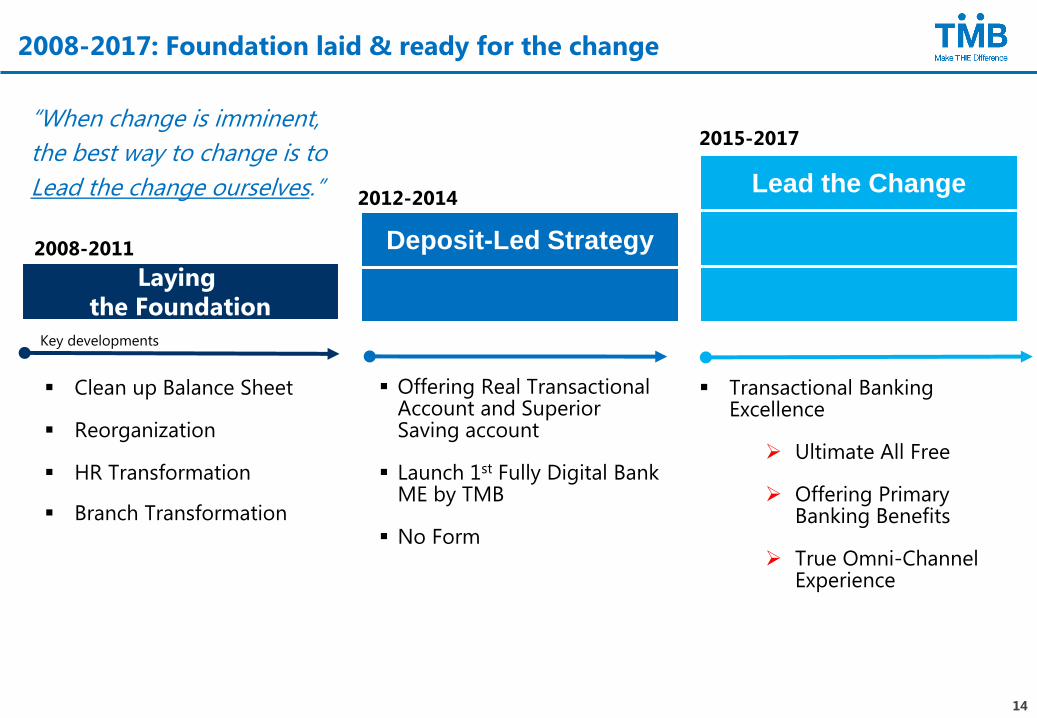
2008-2017: Foundation laid & ready for the change
2008-2011 Deposit-Led Strategy
Lead the Change
Laying the Foundation
2012-2014
2015-2017
▪ Offering Real Transactional Account and Superior Saving account
▪ Launch 1st Fully Digital Bank ME by TMB
▪ No Form
▪ Transactional Banking Excellence
➢ Ultimate All Free
➢ Offering Primary Banking Benefits
➢ True Omni-Channel Experience
Key developments
“When change is imminent,
the best way to change is to
Lead the change ourselves.”
▪ Clean up Balance Sheet
▪ Reorganization
▪ HR Transformation
▪ Branch Transformation
14
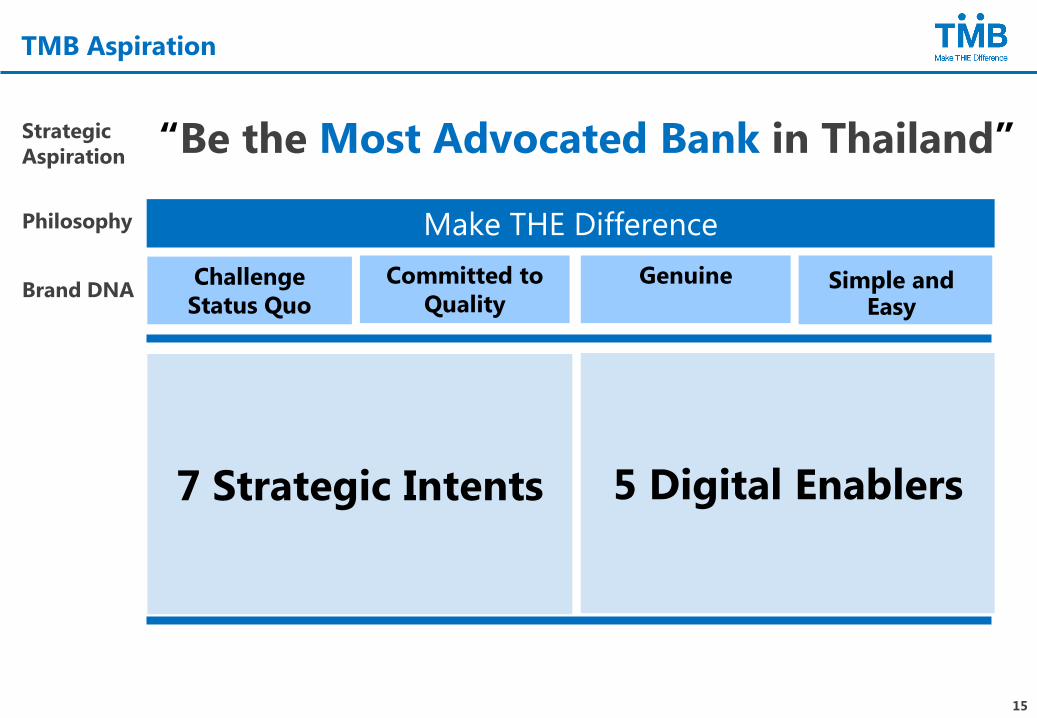
TMB Aspiration
“Be the Most Advocated Bank in Thailand”
Challenge
Status Quo
Committed to
Quality
GenuineBrand DNA
Make THE DifferencePhilosophy
Strategic
Aspiration
7 Strategic Intents
Simple and Easy
5 Digital Enablers
15
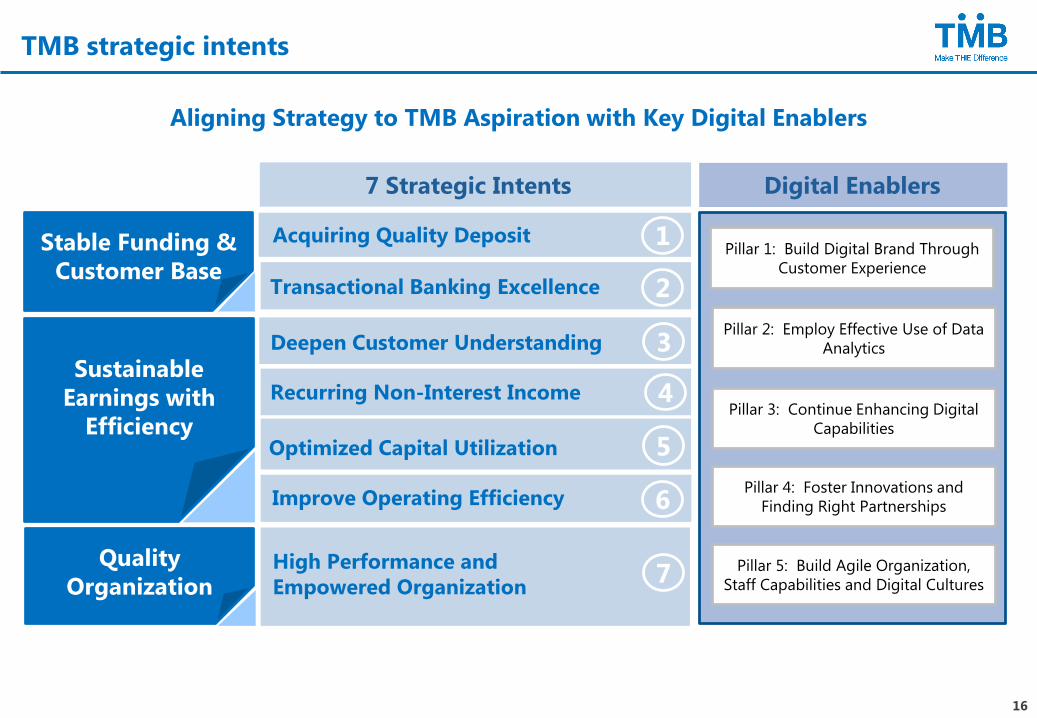
TMB strategic intents
Acquiring Quality DepositPillar 1: Build Digital Brand Through
Customer Experience
Stable Funding &
Customer BaseTransactional Banking Excellence
Sustainable
Earnings with
Efficiency
Recurring Non-Interest Income
Optimized Capital Utilization
Improve Operating Efficiency
Quality
Organization
7 Strategic Intents
Deepen Customer Understanding
High Performance and
Empowered Organization
1
2
3
4
5
6
7
Digital Enablers
Pillar 2: Employ Effective Use of Data
Analytics
Pillar 3: Continue Enhancing Digital
Capabilities
Pillar 4: Foster Innovations and
Finding Right Partnerships
Pillar 5: Build Agile Organization,
Staff Capabilities and Digital Cultures
Aligning Strategy to TMB Aspiration with Key Digital Enablers
16
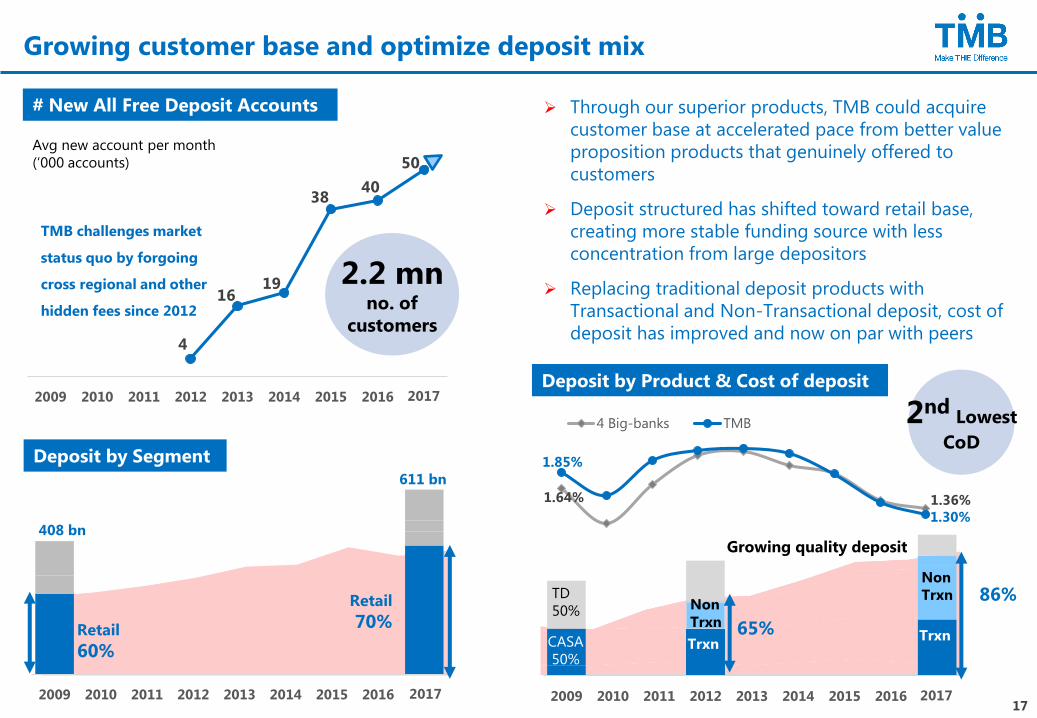
4
1619
3840
50
2009 2010 2011 2012 2013 2014 2015 2016 9M17
2009 2010 2011 2012 2013 2014 2015 2016 9M17
Growing customer base and optimize deposit mix
1.64% 1.36%
1.85%
1.30%
4 Big-banks TMB
Growing quality deposit
CASA
50%
TD
50%
Trxn
Non
Trxn
Deposit by Product & Cost of deposit
# New All Free Deposit Accounts
Avg new account per month
(‘000 accounts)
Trxn
Non
Trxn 65%
86%
2.2 mnno. of
customers
2nd Lowest
CoD
TMB challenges market
status quo by forgoing
cross regional and other
hidden fees since 2012
➢ Through our superior products, TMB could acquire
customer base at accelerated pace from better value
proposition products that genuinely offered to
customers
➢ Deposit structured has shifted toward retail base,
creating more stable funding source with less
concentration from large depositors
➢ Replacing traditional deposit products with
Transactional and Non-Transactional deposit, cost of
deposit has improved and now on par with peers
2017
20172009 2010 2011 2012 2013 2014 2015 2016 9M17
611 bn
Deposit by Segment
408 bn
Retail
60%
Retail
70%
201717
2009 2010 2011 2012 2013 2014 2015 2016 9M17
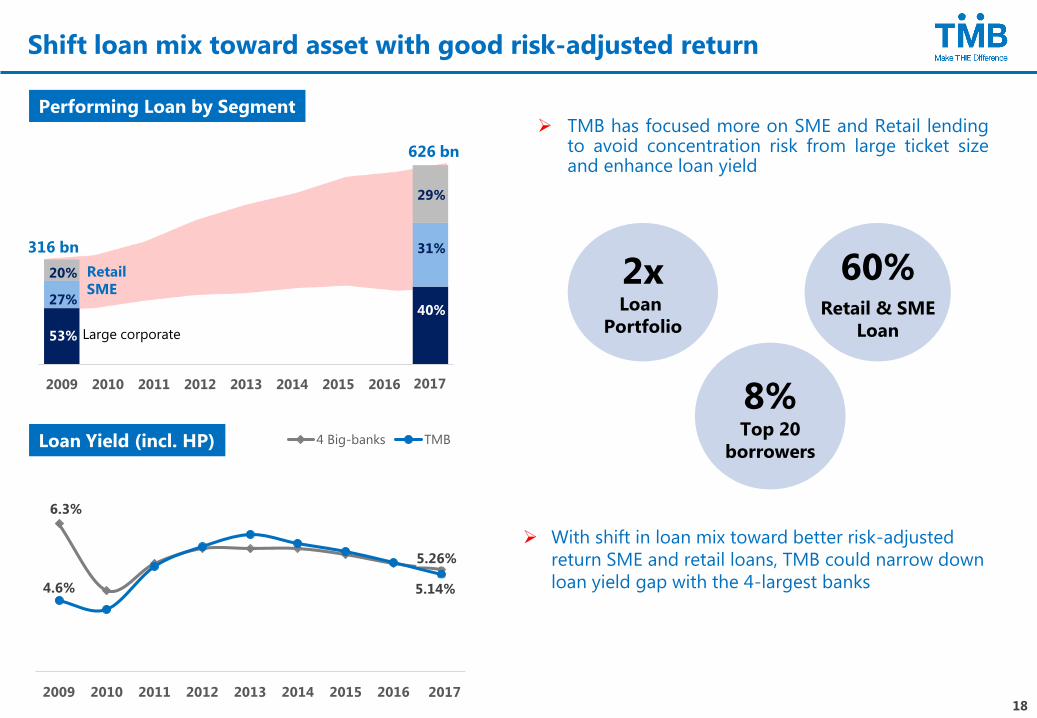
20%
27%
53%
316 bn
626 bn
6.3%
5.26%
4.6% 5.14%
2009 2010 2011 2012 2013 2014 2015 2016 9M17
4 Big-banks TMB
Large corporate
Retail
SME
Performing Loan by Segment
Shift loan mix toward asset with good risk-adjusted return
29%
31%
40%
2xLoan
Portfolio
60%Retail & SME
Loan
Loan Yield (incl. HP)
➢ TMB has focused more on SME and Retail lending to avoid concentration risk from large ticket size and enhance loan yield
➢ With shift in loan mix toward better risk-adjusted
return SME and retail loans, TMB could narrow down
loan yield gap with the 4-largest banks
8%Top 20
borrowers
2017
201718
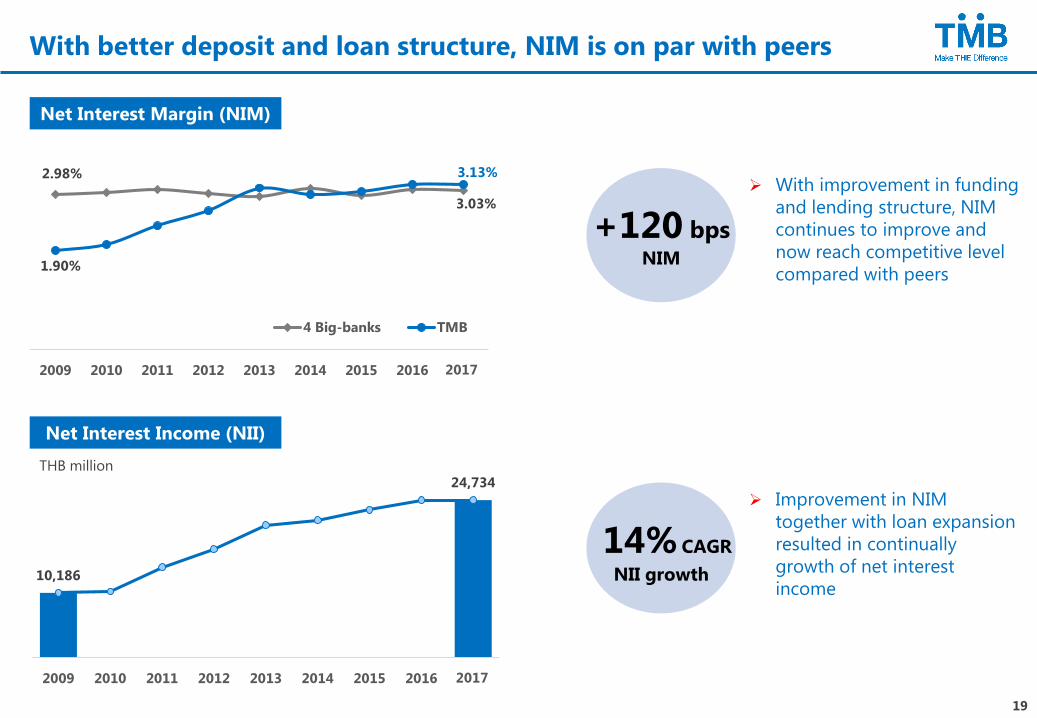
With better deposit and loan structure, NIM is on par with peers
2.98%
3.03%
1.90%
3.13%
2009 2010 2011 2012 2013 2014 2015 2016 9M17
4 Big-banks TMB
10,186
24,734
2009 2010 2011 2012 2013 2014 2015 2016
THB million
Net Interest Income (NII)
+120 bpsNIM
14% CAGR
NII growth
Net Interest Margin (NIM)
➢ With improvement in funding
and lending structure, NIM
continues to improve and
now reach competitive level
compared with peers
➢ Improvement in NIM
together with loan expansion
resulted in continually
growth of net interest
income
2017
2017
19
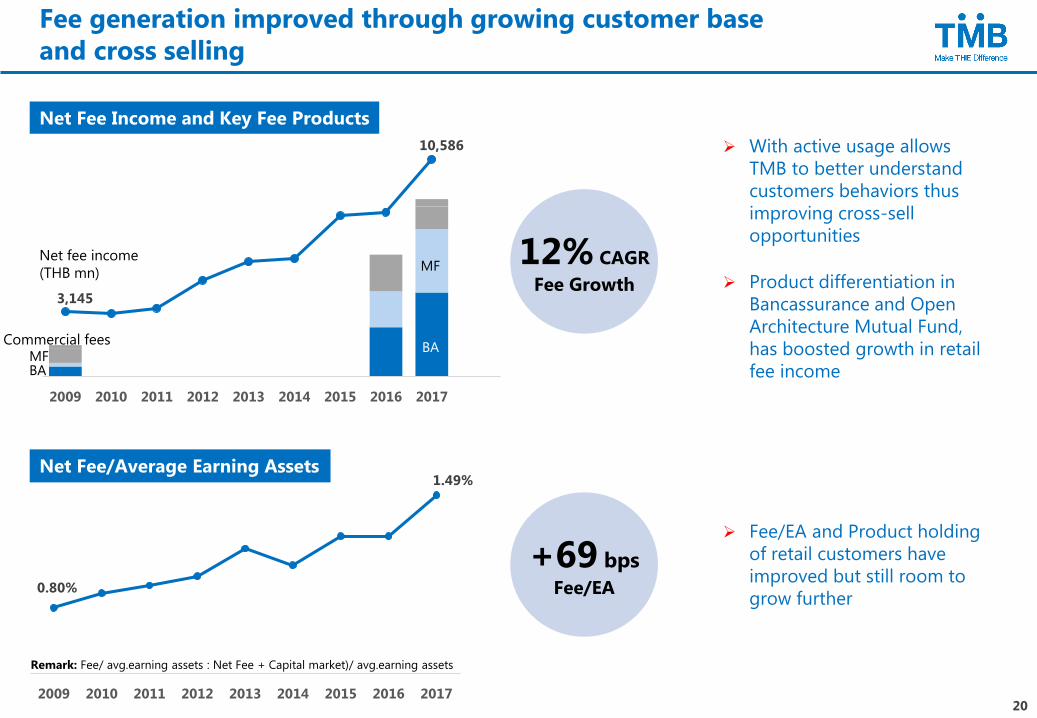
Fee generation improved through growing customer base
and cross selling
3,145
10,586
2009 2010 2011 2012 2013 2014 2015 2016 2017
BAMF
Commercial fees
Net Fee Income and Key Fee Products
Net fee income
(THB mn)
0.80%
1.49%
2009 2010 2011 2012 2013 2014 2015 2016 2017
Net Fee/Average Earning Assets
Remark: Fee/ avg.earning assets : Net Fee + Capital market)/ avg.earning assets
MF
BA
12% CAGR
Fee Growth
+69 bps
Fee/EA
➢ With active usage allows
TMB to better understand
customers behaviors thus
improving cross-sell
opportunities
➢ Product differentiation in
Bancassurance and Open
Architecture Mutual Fund,
has boosted growth in retail
fee income
➢ Fee/EA and Product holding
of retail customers have
improved but still room to
grow further
20
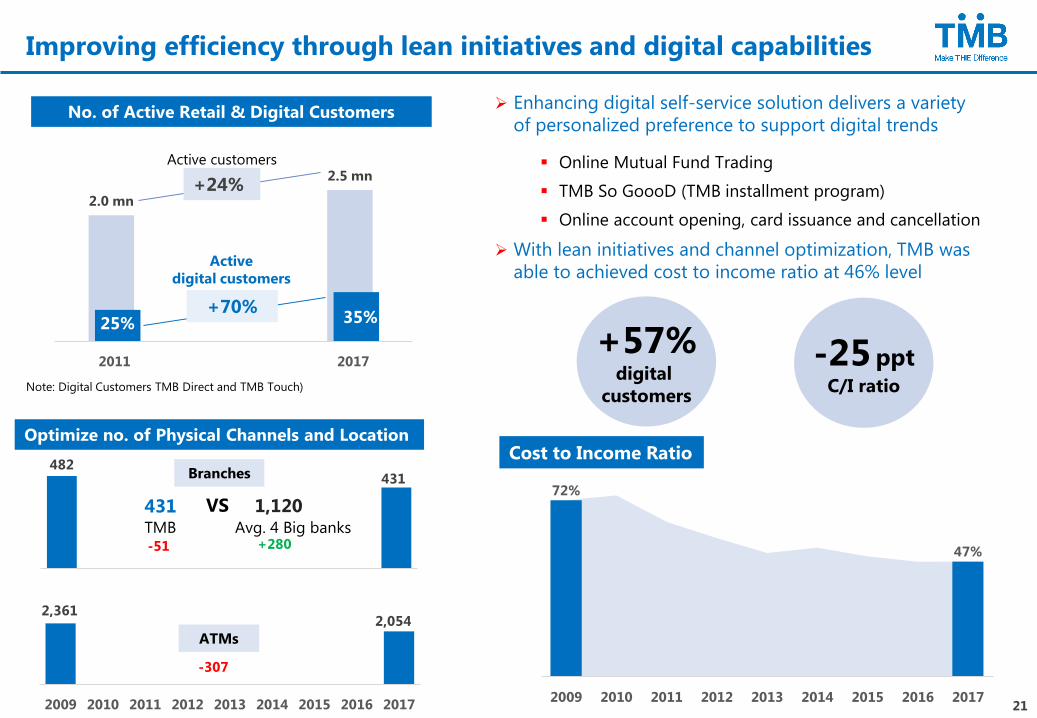
2,361 2,054
2009 2010 2011 2012 2013 2014 2015 2016 2017
-25 pptC/I ratio
+57%digital
customers
482431
2009 2010 2011 2012 2013 2014 2015 2016 9M17
431 1,120
2.0 mn
2.5 mn
2011 2017
➢ Enhancing digital self-service solution delivers a variety
of personalized preference to support digital trends
▪ Online Mutual Fund Trading
▪ TMB So GoooD (TMB installment program)
▪ Online account opening, card issuance and cancellation
➢ With lean initiatives and channel optimization, TMB was
able to achieved cost to income ratio at 46% level
Branches
ATMs
No. of Active Retail & Digital Customers
TMB
72%
47%
2009 2010 2011 2012 2013 2014 2015 2016 2017
35%25%
Improving efficiency through lean initiatives and digital capabilities
Active customers
Active
digital customers
+24%
+70%
Cost to Income RatioOptimize no. of Physical Channels and Location
VSAvg. 4 Big banks
+280-51
Note: Digital Customers TMB Direct and TMB Touch)
-307
21
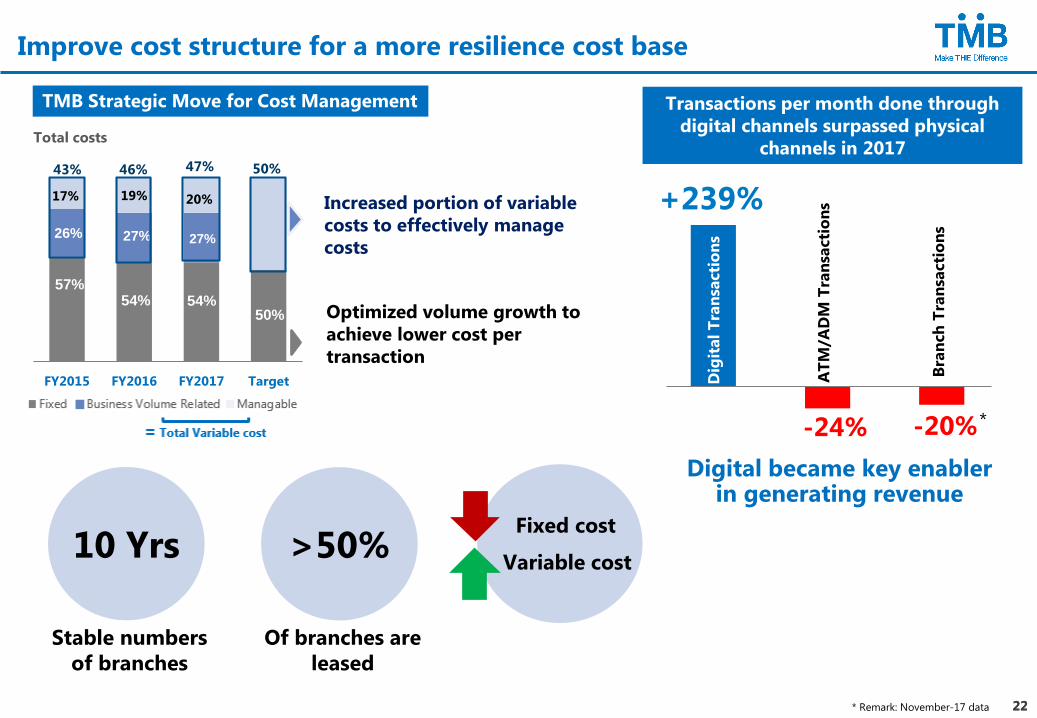
Improve cost structure for a more resilience cost base
TMB Strategic Move for Cost Management
Optimized volume growth to
achieve lower cost per
transaction
Increased portion of variable
costs to effectively manage
costs
FY2015 FY2016 FY2017 Target
Total costs
57%
26%
54%
27%
54%
27%
50%
17% 19% 20%
43% 46% 47% 50%
Transactions per month done through
digital channels surpassed physical
channels in 2017
Digital became key enabler in generating revenue
Dig
ital T
ran
sacti
on
s
+239%
Bra
nch
Tra
nsa
cti
on
s
AT
M/A
DM
Tra
nsa
cti
on
s
-24% -20%
10 Yrs
Stable numbers
of branches
>50%
Of branches are
leased
Fixed cost
Variable cost
*
* Remark: November-17 data 2222
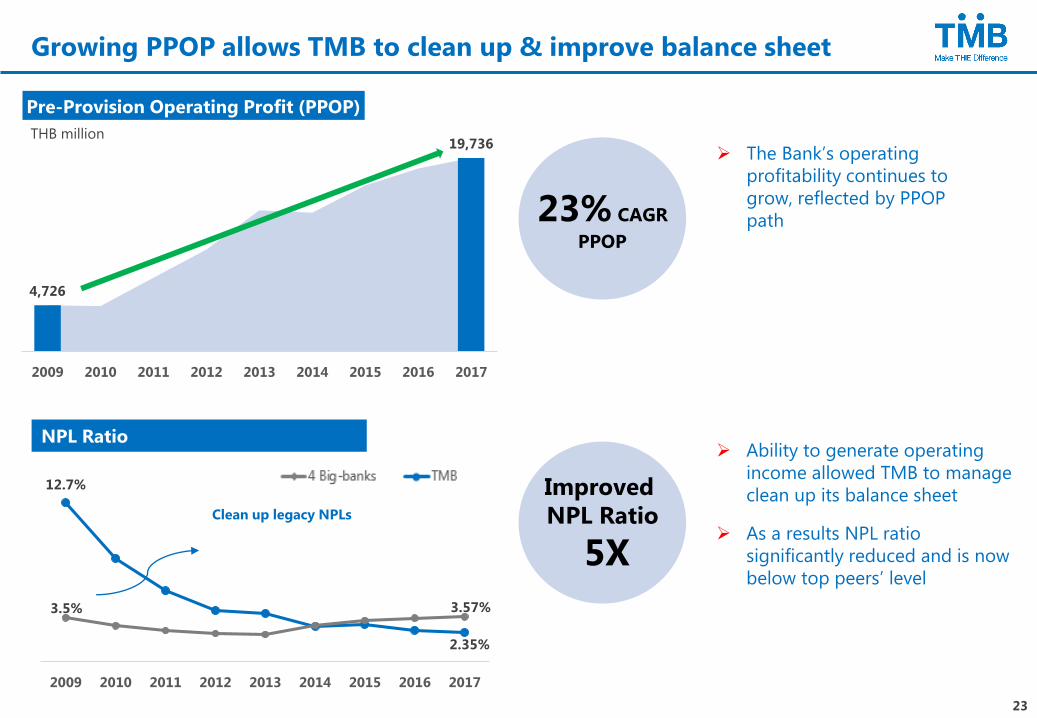
4,726
19,736
2009 2010 2011 2012 2013 2014 2015 2016 2017
Pre-Provision Operating Profit (PPOP)
THB million
12.7%
2.35%
3.5% 3.57%
2009 2010 2011 2012 2013 2014 2015 2016 2017
Growing PPOP allows TMB to clean up & improve balance sheet
➢ The Bank’s operating
profitability continues to
grow, reflected by PPOP
path
NPL Ratio
Clean up legacy NPLs
➢ Ability to generate operating
income allowed TMB to manage
clean up its balance sheet
➢ As a results NPL ratio
significantly reduced and is now
below top peers’ level
23% CAGR
PPOP
Improved
NPL Ratio
5X
23
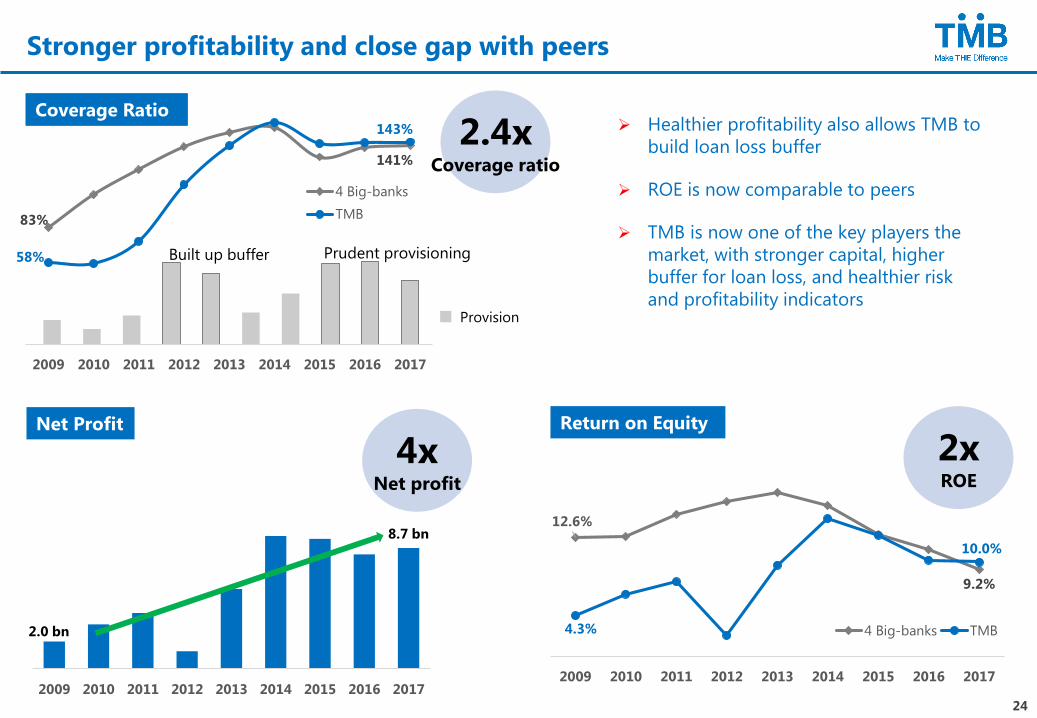
12.6%
9.2%
4.3%
10.0%
2009 2010 2011 2012 2013 2014 2015 2016 2017
4 Big-banks TMB
Stronger profitability and close gap with peers
2.0 bn
8.7 bn
2009 2010 2011 2012 2013 2014 2015 2016 2017
➢ Healthier profitability also allows TMB to
build loan loss buffer
➢ ROE is now comparable to peers
➢ TMB is now one of the key players the
market, with stronger capital, higher
buffer for loan loss, and healthier risk
and profitability indicators
Net Profit
Coverage Ratio
Return on Equity
4xNet profit
2.4xCoverage ratio
2xROE
Coverage Ratio
Built up buffer Prudent provisioning
Provision
83%
141%
58%
143%
2009 2010 2011 2012 2013 2014 2015 2016 2017
4 Big-banks
TMB
24
-100000
0
100000
200000
300000
400000
500000
600000
0
20000
40000
60000
80000
100000
120000
140000
2009 2010 2011 2012 2013 2014 2015 2016 2017
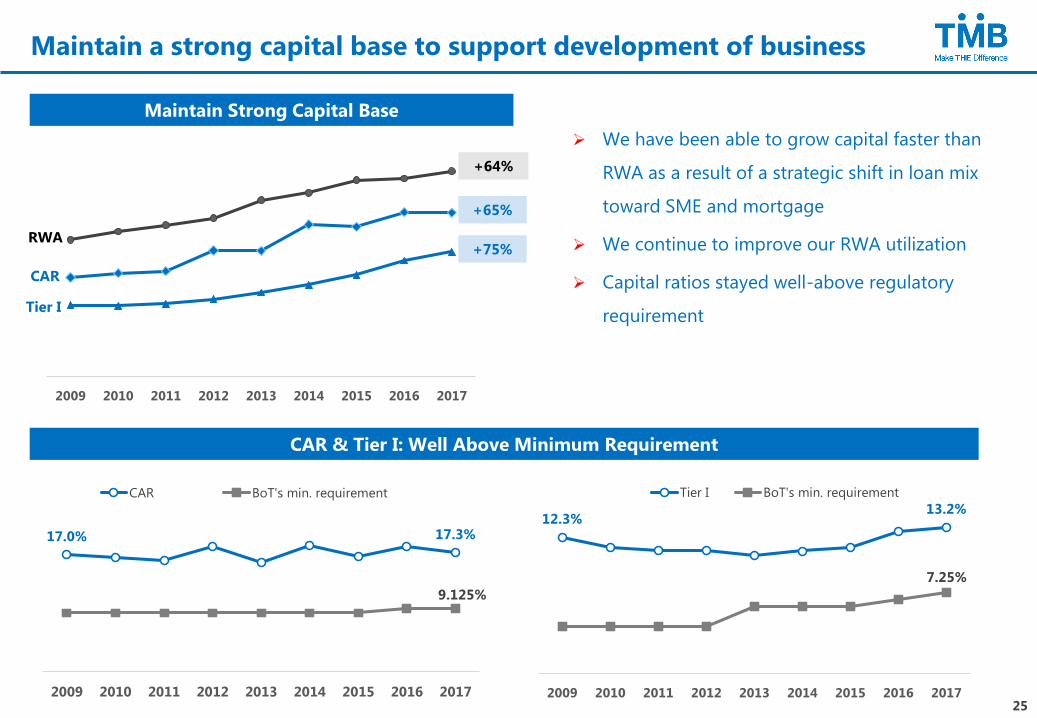
Maintain a strong capital base to support development of business
➢ We have been able to grow capital faster than
RWA as a result of a strategic shift in loan mix
toward SME and mortgage
➢ We continue to improve our RWA utilization
➢ Capital ratios stayed well-above regulatory
requirement
17.0% 17.3%
9.125%
2009 2010 2011 2012 2013 2014 2015 2016 2017
CAR BoT's min. requirement
12.3%13.2%
7.25%
2009 2010 2011 2012 2013 2014 2015 2016 2017
Tier I BoT's min. requirement
Maintain Strong Capital Base
RWA
CAR
Tier I
+75%
+65%
+64%
CAR & Tier I: Well Above Minimum Requirement
25
WE MAKE THE DIFFERENCE
People
Customers
Society
26
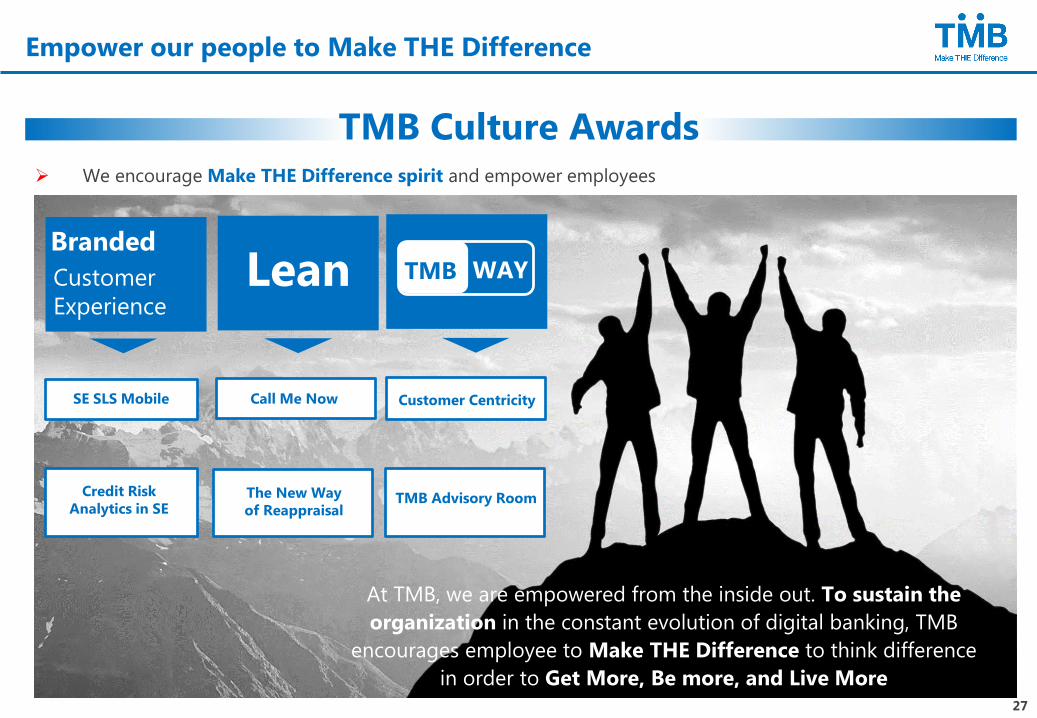
Empower our people to Make THE Difference
TMB Culture Awards➢ We encourage Make THE Difference spirit and empower employees
Branded
Customer
Experience
Lean TMB WAY
At TMB, we are empowered from the inside out. To sustain the
organization in the constant evolution of digital banking, TMB
encourages employee to Make THE Difference to think difference
in order to Get More, Be more, and Live More
SE SLS Mobile
Credit Risk
Analytics in SEThe New Way
of Reappraisal
Call Me Now Customer Centricity
TMB Advisory Room
27
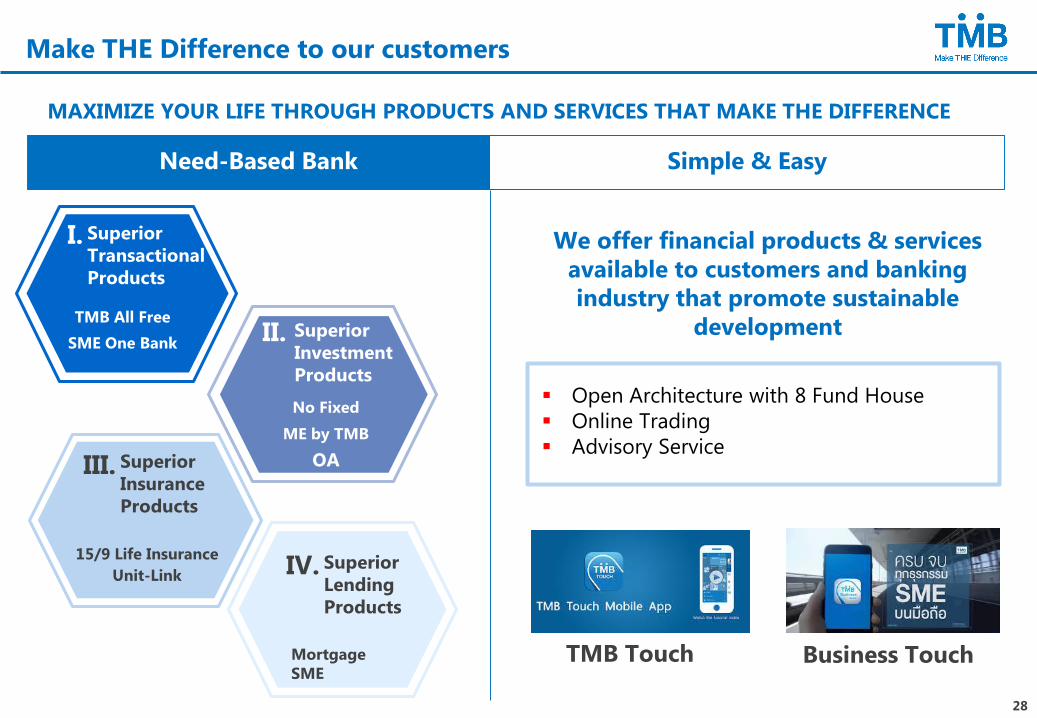
We offer financial products & services
available to customers and banking
industry that promote sustainable
development
Make THE Difference to our customers
Simple & EasyNeed-Based Bank
I.
II.
MAXIMIZE YOUR LIFE THROUGH PRODUCTS AND SERVICES THAT MAKE THE DIFFERENCE
Superior
Insurance
Products
III.
15/9 Life Insurance
Unit-Link
Superior
Transactional
Products
TMB All Free
SME One BankSuperior
Investment
Products
No Fixed
ME by TMB
OA
▪ Open Architecture with 8 Fund House
▪ Online Trading
▪ Advisory Service
Business TouchTMB Touch
Superior
Lending
Products
IV.
Mortgage
SME
28
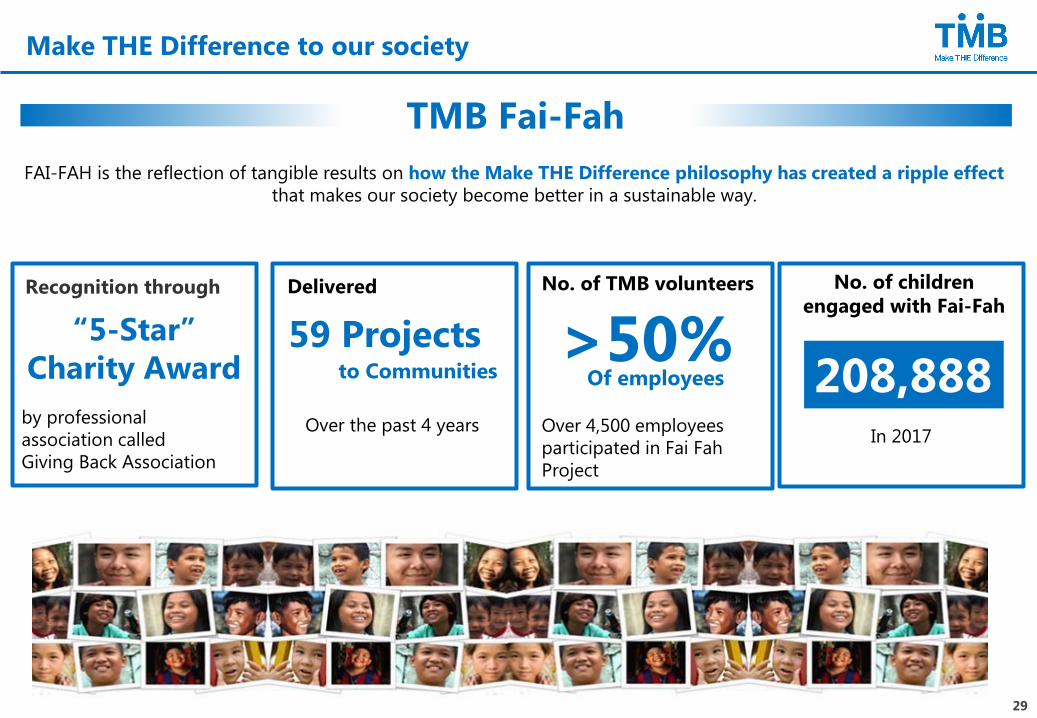
Make THE Difference to our society
TMB Fai-Fah
>50% Delivered
Over the past 4 years
Recognition through
Over 4,500 employees
participated in Fai Fah
Project
No. of TMB volunteers
to Communities Of employees
“5-Star”
Charity Award
by professional
association called
Giving Back Association
208,888
No. of children
engaged with Fai-Fah
59 Projects
In 2017
FAI-FAH is the reflection of tangible results on how the Make THE Difference philosophy has created a ripple effect
that makes our society become better in a sustainable way.
29
APPENDIX
30
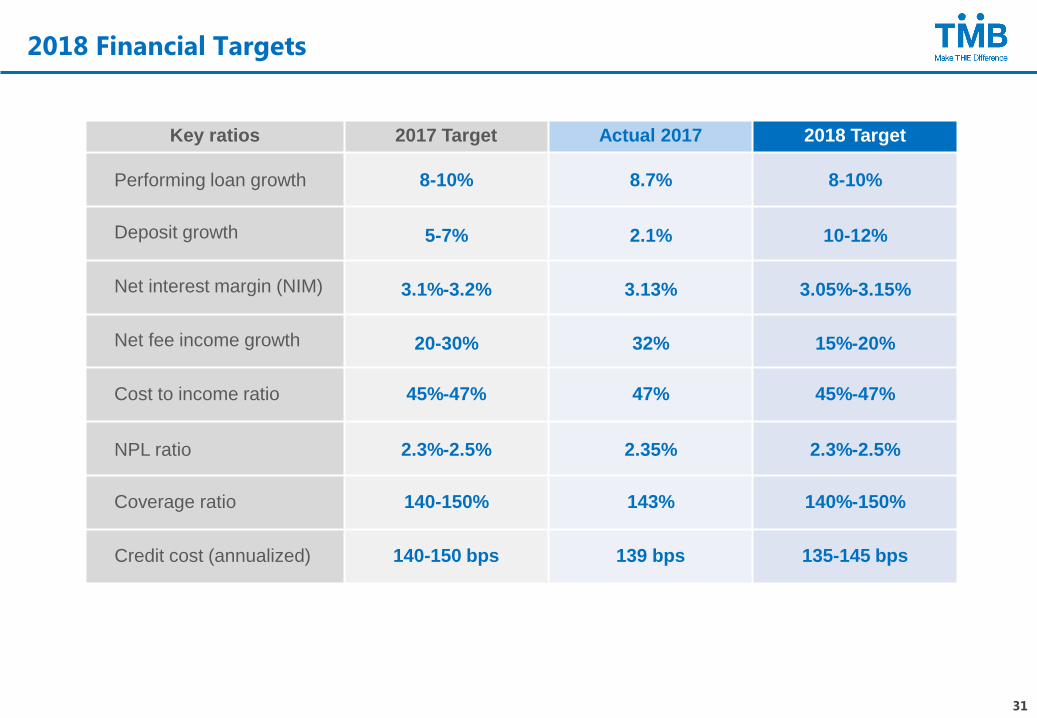
2018 Financial Targets
Key ratios 2017 Target Actual 2017 2018 Target
Performing loan growth 8-10% 8.7% 8-10%
Deposit growth 5-7% 2.1% 10-12%
Net interest margin (NIM) 3.1%-3.2% 3.13% 3.05%-3.15%
Net fee income growth 20-30% 32% 15%-20%
Cost to income ratio 45%-47% 47% 45%-47%
NPL ratio 2.3%-2.5% 2.35% 2.3%-2.5%
Coverage ratio 140-150% 143% 140%-150%
Credit cost (annualized) 140-150 bps 139 bps 135-145 bps
31
TMB Bank Public Company Limited
3000 Phahonyothin Road
Chatuchak Bangkok
10900
TMB Website : www.tmbbank.com
IR Webpage : www.tmbbank.com/ir
Important Disclaimer
This presentation contains some information from other sources, that TMB Bank Public Company Limited does not make any representations regarding the
use, validity, accuracy, or reliability of, or the results of the use of information, data but not limited to, all text, and images (“the Content”) on this
presentation. Some content may contain forward looking statements, that based on management’s view upon the information currently available to us.
These statement are subject to certain risks and uncertainties that could cause the actual results materially differed from what had been previously stated.
The materials in this presentation shall not, and are not intended to, constitute or contain an offer to sell or the solicitation of an offer to buy, any securities
of TMB Bank Public Company Limited.


![TMB Bank Plc. · Analysts & Investors Presentation. July 2009 [2] 2Q09 results review](https://img.pdfslide.us/doc/110x75/5f4bf2267c11ae244b2a3039/tmb-bank-plc-analysts-investors-presentation-july-2009-2-2q09-results.jpg)