Embed Size (px)
Citation preview

Título artículo / Títol article:
Investigation of cannabis biomarkers and
transformation products in waters by liquid
chromatography coupled to time of flight and triple
quadrupole mass spectrometry
Autores / Autors
Boix Sales, Clara ; Ibáñez Martínez, María ; Bijlsma,
Lubertus ; Sancho Llopis, Juan Vicente ; Hernández
Hernández, Félix
Revista:
Chemosphere Vol. 99, 2014
Versión / Versió:
Preprint del autor
Cita bibliográfica / Cita
bibliogràfica (ISO 690):
BOIX, Clara, et al. Investigation of cannabis biomarkers and transformation products in waters by liquid chromatography coupled to time of flight and triple quadrupole mass spectrometry. Chemosphere, 2014, vol. 99, p. 64-71.
url Repositori UJI:
http://hdl.handle.net/10234/123283

1/41
INVESTIGATION OF CANNABIS BIOMARKERS AND 1
TRANSFORMATION PRODUCTS IN WATERS BY LIQUID 2
CHROMATOGRAPHY COUPLED TO TIME OF FLIGHT AND TRIPLE 3
QUADRUPOLE MASS SPECTROMETRY 4
5
Clara Boix, María Ibáñez, Lubertus Bijlsma, Juan V. Sancho, Félix Hernández* 6
7
Research Institute for Pesticides and Water, University Jaume I, Avda. Sos Baynat, E-12071 8
Castellón, Spain. 9
* Corresponding author [email protected], Tel +34 964 387366, Fax +34 964 387368 10
11

2/41
ABSTRACT 12
11-nor-9-carboxy-Δ9-tetrahydrocannabinol (THC-COOH) is commonly selected as biomarker 13
for the investigation of cannabis consumption through wastewater analysis. The removal 14
efficiency of THC-COOH in wastewater treatment plants (WWTPs) has been reported to vary 15
between 31-98%. Accordingly, possible transformation products (TPs) of this metabolite 16
might be formed during treatment processes or in receiving surface water under 17
environmental conditions. In this work, surface water was spiked with THC-COOH and 18
subjected to hydrolysis, chlorination and photo-degradation (both ultraviolet and simulated 19
sunlight) experiments under laboratory-controlled conditions. One hydrolysis, eight 20
chlorination, three ultraviolet photo-degradation and seven sunlight photo-degradation TPs 21
were tentatively identified by liquid chromatography coupled to quadrupole time-of-flight 22
mass spectrometer (LC-QTOF MS). In a subsequent step, THC-COOH and the identified TPs 23
were searched in wastewater samples using LC coupled to tandem mass spectrometry (LC-24
MS/MS) with triple quadrupole. THC-COOH was found in all influent and effluent 25
wastewater samples analyzed, although at significant lower concentrations in the effluent 26
samples. The removal efficiency of WWTP under study was approximately 86%. 27
Furthermore, THC-COOH was also investigated in several surface waters, and it was detected 28
in 50% of the samples analyzed. Regarding TPs, none were found in influent wastewater, 29
while one hydrolysis and five photo-degradation (simulated sunlight) TPs were detected in 30
effluent and surface waters. The most detected compound, resulting from sunlight photo-31
degradation, was found in 60% of surface waters analyzed. This fact illustrates the importance 32
of investigating these TPs in the aquatic environment. 33
Graphical Abstract (GA) 34
35
36

3/41
Keywords 37
Cannabis biomarkers; wastewater; surface water; removal efficiency; 38
transformation/degradation products; time-of-flight mass spectrometry; triple quadrupole 39
mass spectrometry. 40
41
42
43
44
45
46
47
48
49
50
51
52
53
54
55
56
57

4/41
1. INTRODUCTION 58
Cannabis is the most widely used illicit drug in Europe (EMCDDA 2010). Its 59
psychoactive compound, Δ9-tetrahydrocannabinol (THC), is extensively metabolized leading 60
to low excretion rates as unchanged compound (Postigo, et al., 2010). 11-nor-9-carboxy-Δ9-61
tetrahydrocannabinol (THC-COOH) and its glucuronide are the main metabolites of cannabis 62
in urine (Skopp and Pötsch, 2004; Weinmann, et al., 2001). This fact has led researchers to 63
select THC-COOH as biomarker to estimate cannabis consumption from wastewater analysis 64
(Lai, et al., 2011; van Nuijs, et al., 2011) and also in environmental studies (Berset, et al., 65
2010; Bijlsma, et al., 2009; Boleda, et al., 2009; Vazquez-Roig, et al., 2010). 66
THC-COOH enters wastewater treatment plants (WWTPs) after the consumption of 67
cannabis. There are several treatment processes that may be performed inside the WWTPs. 68
While primary and secondary treatments are applied in most WWTPs, only some of them use 69
additional processes, such as ozonation, ultraviolet light (UV) or chlorination (EPA 2004). 70
During these treatments, THC-COOH can be removed and/or transformed into different 71
transformation products (TPs) that may be released in receiving surface water (SW). 72
Therefore, the detection and confirmation of cannabinoids in aqueous samples is important 73
from an environmental perspective (Boleda, et al., 2009; Vazquez-Roig, et al., 2010). 74
It is common to report lower concentrations of THC-COOH in effluent wastewater 75
(EWW) than in influent wastewater (IWW) (Bijlsma, et al., 2009; Bijlsma, et al., 2012; 76
Boleda, et al., 2007; Castiglioni, et al., 2006; Postigo, et al., 2010). From these data, it may 77
imply that THC-COOH is partially eliminated in WWTPs. Different percentages of THC-78
COOH removal efficiency have been reported in the literature, ranging between 31-98% 79
(Bijlsma, et al., 2012; Boleda, et al., 2009; Postigo, et al., 2010). Moreover, some papers 80
reported the detection of this metabolite in surface water at low levels (Boleda, et al., 2007; 81
Postigo, et al., 2010; Vazquez-Roig, et al., 2010). It may be expected that different TPs are 82

5/41
generated by transformation/degradation processes in WWTPs but also under environmental 83
conditions in the aquatic ecosystem. The ecotoxic, mutagenic and other potential effects of 84
TPs are mostly unknown and need to be investigated (Fatta-Kassinos, et al., 2011). Only 85
limited data shows that some TPs are as hazardous, or even more so, than the parent 86
compound, producing negative effects on humans and wildlife (Farré, et al., 2008; Fatta-87
Kassinos, et al., 2011; Gosetti, et al., 2013; Kern, et al., 2009). For these reasons, it is 88
important to investigate the possible presence of THC-COOH TPs in the environment due to 89
the wide consumption of cannabis around the world. 90
The analytical determination of THC-COOH in waters is mostly based on liquid 91
chromatography (LC) coupled to tandem mass spectrometry (MS/MS), a robust and well-92
established technique for the sensitive determination of illicit drugs in the aquatic 93
environment (Bijlsma, et al., 2009; Boleda, et al., 2007; Castiglioni, et al., 2006; Postigo, et 94
al., 2010; Thomas, et al., 2012). High resolution mass spectrometry (HRMS) instruments, 95
such as Orbitrap (Bijlsma, et al., 2013b; Kern, et al., 2009; Wick, et al., 2011) and Time-of-96
Flight (TOF) (Bijlsma, et al., 2013a; Ibáñez, et al., 2004; Ibáñez, et al., 2011; Quintana, et al., 97
2010), are advanced analytical tools for the tentative identification and elucidation of TPs, 98
thanks to the sensitive accurate-mass full-spectrum acquisition provided by these analyzers. In 99
addition, hybrid analyzers, such as (Q)TOF MS, allow data acquisition under MSE mode 100
(Boix, et al., 2013; Hernández, et al., 2011), obtaining simultaneously the accurate masses of 101
both (de)protonated molecules and the fragment ions in a single injection. This is highly 102
useful for identification/elucidation purposes. 103
The objective of this paper is to perform an investigation on THC-COOH as cannabis 104
biomarker in waters and on the formation of possible TPs, using LC-(Q)TOF MS under MSE 105
acquisition mode. For this purpose, laboratory controlled degradation experiments 106
(hydrolysis, chlorination and photo-degradation) were first carried out trying to tentatively 107

6/41
identify and elucidate the formed TPs using LC-(Q)TOF-MS. In a second step, THC-COOH 108
and the TPs identified in the laboratory experiments were searched by LC-QqQ MS, in both 109
influent and effluent wastewaters, in order to investigate the effect of the treatment processes 110
on generating these TPs in the WWTPs. Several surface water samples were also analysed to 111
know whether the THC-COOH TPs are present in the aquatic environment. 112
113
2. METHODS 114
2.1. Reagents and chemicals 115
A reference standard of THC-COOH was purchased from the National Measurement 116
Institute (Pymble, Australia). A stock solution of 100 mg/L was prepared in methanol 117
(MeOH). A working solution (10 mg/L) was made by ten times diluting the stock solution 118
with MeOH. 119
HPLC-grade methanol (MeOH), acetronitrile (ACN), sodium hydroxide (NaOH, 99%) 120
and formic acid (FA, 98-100%) were acquired from Scharlau (Barcelona, Spain). A Milli-Q 121
ultra-pure water system from Millipore (Bedford, MA, USA) was used to obtain the HPLC 122
grade water. Leucine enkephalin, used as the lock mass (m/z 556.2771 in positive- and m/z 123
554.2615 in negative-ion mode) was purchased from Sigma-Aldrich. 124
Solid-phase extraction (SPE) cartridges (Oasis-HLB; 3 mL, 60 mg) were purchased from 125
Waters (Milford, MA, USA). 126
2.2. Instrumentation 127
2.2.1. LC-ESI-QTOF MS 128
An ultra-high-performance liquid chromatography (UHPLC) system (Waters Acquity, 129
Milford, MA, USA) was interfaced to a hybrid quadrupole orthogonal acceleration time-of-130
flight mass spectrometer (Q-TOF Premier, Waters Micromass, Manchester, UK) equipped 131

7/41
with an orthogonal Z-spray electrospray ionization interface (ESI) operating in both positive- 132
and negative-ion modes and controlled by MassLynx v 4.1 software. The chromatographic 133
separation was performed using an Acquity UPLC BEH C18 100 mm × 2.1 mm, 1.7 µm 134
particle size analytical column (Waters). The mobile phases used were A = H2O and B = 135
MeOH, both with 0.01% FA. The percentage of organic modifier (B) was changed linearly as 136
follows: 0 min, 10%; 9 min, 90%; 11 min, 90%; 11.1 min, 10%; 14 min, 10%. The flow rate 137
was 0.3 mL/min. The column and sample temperatures were kept at 40 °C and 5 ºC, 138
respectively. For MSE experiments, two acquisition functions with different collision energies 139
were created: the low-energy (LE) function with a collision energy of 4 eV, and the high 140
energy (HE) function with a collision energy ramp ranging from 15 to 40 eV. The same cone 141
voltage (15 V) and collision energy ramp was used for additional MS/MS experiments. 142
Further details on instrument operating conditions can be found elsewhere (Boix, et al., 2013). 143
Data were processed using MetaboLynx XS software (within MassLynx). 144
2.2.2. LC-ESI-QqQ MS 145
An ultra-high-performance liquid chromatography system (Waters Acquity, Milford, MA, 146
USA) was interfaced to a triple quadrupole mass spectrometer (Xevo TQS, Waters 147
Micromass, Manchester, UK) equipped with an orthogonal Z-spray electrospray ionization 148
interface (ESI) operating in positive (3.0 kV) and negative (-2.0 kV) ion modes. The 149
chromatographic separation was obtained using the same analytical column and 150
chromatographic conditions as for QTOF analysis. Cone gas as well as desolvation gas was 151
nitrogen (Praxair, Valencia, Spain). The cone gas and the desolvation gas flows were set to 152
250 L/h and 1200 L/h, respectively. For operation in the MS/MS mode, collision gas was 153
argon 99.995% (Praxair, Madrid, Spain) with a pressure of 4 x 10⁻³ mbar in the collision cell 154
(0.15 mL/min). Source and desolvation temperatures were 150 °C and 650 °C, respectively. 155
Dwell times were automatically selected. 156
8/41
Data were processed using TargetLynx software (within MassLynx). 157
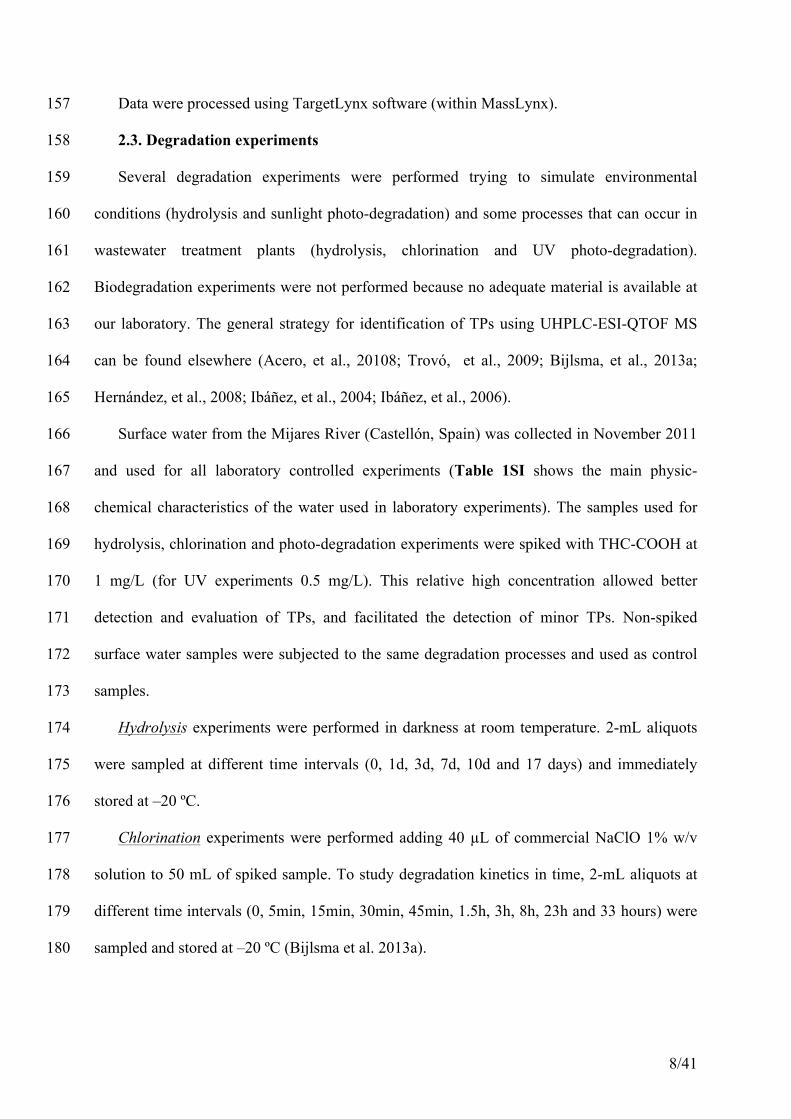
2.3. Degradation experiments 158
Several degradation experiments were performed trying to simulate environmental 159
conditions (hydrolysis and sunlight photo-degradation) and some processes that can occur in 160
wastewater treatment plants (hydrolysis, chlorination and UV photo-degradation). 161
Biodegradation experiments were not performed because no adequate material is available at 162
our laboratory. The general strategy for identification of TPs using UHPLC-ESI-QTOF MS 163
can be found elsewhere (Acero, et al., 20108; Trovó, et al., 2009; Bijlsma, et al., 2013a; 164
Hernández, et al., 2008; Ibáñez, et al., 2004; Ibáñez, et al., 2006). 165
Surface water from the Mijares River (Castellón, Spain) was collected in November 2011 166
and used for all laboratory controlled experiments (Table 1SI shows the main physic-167
chemical characteristics of the water used in laboratory experiments). The samples used for 168
hydrolysis, chlorination and photo-degradation experiments were spiked with THC-COOH at 169
1 mg/L (for UV experiments 0.5 mg/L). This relative high concentration allowed better 170
detection and evaluation of TPs, and facilitated the detection of minor TPs. Non-spiked 171
surface water samples were subjected to the same degradation processes and used as control 172
samples. 173
Hydrolysis experiments were performed in darkness at room temperature. 2-mL aliquots 174
were sampled at different time intervals (0, 1d, 3d, 7d, 10d and 17 days) and immediately 175
stored at –20 ºC. 176
Chlorination experiments were performed adding 40 µL of commercial NaClO 1% w/v 177
solution to 50 mL of spiked sample. To study degradation kinetics in time, 2-mL aliquots at 178
different time intervals (0, 5min, 15min, 30min, 45min, 1.5h, 3h, 8h, 23h and 33 hours) were 179
sampled and stored at –20 ºC (Bijlsma et al. 2013a). 180

9/41
Photo-degradation experiments were carried out under UV radiation and simulated 181
sunlight. UV radiation was performed using a mercury lamp with its main output at 254 nm. 182
The 250 mL surface water samples were kept in quartz glass vessels at a distance of ~15 cm 183
from the lamp. The experiment was carried out in a fume hood at room temperature over a 184
period of 72 h under constant stirring of the samples (0, 30min, 1.5h, 4h, 7h, 20h, 30h, 53h 185
and 72h). Sunlight was simulated using a solar simulation system (Suntest XLS+, Atlas MTT, 186
Linsengericht, Germany), equipped with a xenon arc lamp as radiation source and a solar light 187
filter allowing a wavelength in the range of 300 - 800 nm. The radiation intensity was set to 188
500 W/m2 and the light dose per hour of irradiation to 1.8 MJ/h. In this way, 90 irradiation 189
hours corresponds to 15 days of natural sun light (dose: 288 MJ/m2). The degradation was 190
performed using 250-mL closed quartz glass vessels and sample temperature was set to 25 ºC 191
in order to minimize sample evaporation and possible thermal transformation. Aliquots were 192
sampled after stirring of the water solution. During irradiation, 2-mL water samples were 193
taken at different time intervals (0, 30min, 2h, 8h, 20h, 30h, 50h and 80h) and immediately 194
stored at –20 ºC. In the photo-degradation experiments, evaporation of the samples was 195
observed and assessed by correcting the peak-areas as a function of the measured volume. 196
2.4. Data processing 197
MetaboLynx XS application manager (Micromass v 4.1) was used to process QTOF MS 198
data obtained from degradation studies. This software compares eXtracted Ion 199
Chromatograms (XICs) of a positive/degraded sample to a control sample for detecting, 200
identifying and reporting differential ions/chromatographic peaks which would correspond, in 201
principle, to transformation products (Boix, et al., 2013; Ibáñez, et al., 2006). 202
TargetLynx (also from Micromass v 4.1) was employed for automatically processing data 203
from triple quadrupole analysis. For confirmation of positive findings, the acquisition of two 204
selected reaction monitoring (SRM) transitions per compound together with the agreement in 205

10/41
both retention time and Q/q ratio deviation were required (Commission Decision 2002). 206
Reference Q/q ratios were obtained from TPs identified in degradation experiments as the 207
ratio between the most abundant transition (Q, quantitative) and the other/s measured 208
transition/s (q, confirmation) (Boix, et al., 2013). 209
2.5. Water samples 210
Ten 24-h composite wastewater samples (five IWW and five EWW) were collected from 211
a WWTP located in Castellón (Eastern Spain), which main characteristics are summarized in 212
Table 2SI. Ten grab surface samples were collected from four sites of Albufera Natural Park 213
of Valencia (Eastern Spain) and from six sites of two Dutch rivers (Rhine and Meuse). All 214
samples were taken from March to May in 2012, and immediately stored at –20 ºC. 215
2.6. Sample treatment 216
A SPE step was applied prior analysis to pre-concentrate the sample. SPE Oasis HLB 217
cartridges were conditioned with 3 mL MeOH and 3 mL Milli-Q water. After loading 50 mL 218
water sample (IWW were previously 4-fold diluted with Milli-Q water), cartridges were 219
vacuum dried for 5 min. Analytes were eluted with 5 mL MeOH. The extracts were 220
evaporated to dryness at 35 ºC under a gentle stream of nitrogen and reconstructed in 1 mL of 221
10:90 MeOH:H2O. UHPLC- MS/MS QqQ analyses were performed by injecting 50 µL of the 222
final extract into the system. 223
224
3. RESULTS AND DISCUSSION 225
3.1. Degradation experiments 226
3.1.1. Hydrolysis 227
Figure 1a shows the hydrolytic degradation of THC-COOH during 17 days in darkness at 228
room temperature. THC-COOH was transformed (around 20%) into TP 1H, which appeared 229
on the third day reaching its maximum concentration after 10 days. 230

11/41
Information on elemental composition, retention time, fragment ions, mass errors and 231
double bond equivalent (DBE) obtained for TP 1H is shown in Figure 1b. This TP was 232
detected in positive ionization mode, eluting at 8.92 min. Its elemental composition, 233
C20H27O4+, implies the loss of one methyl group from the THC-COOH molecule. The 234
demethylation could have occurred in two sites of the original structure: in ring B or in 235
aliphatic chain. The loss observed at 70.0783 Da might correspond to the aliphatic chain 236
(C5H10, +1.1 mDa). This would indicate that TP 1H structure would be more feasible if the 237
demethylation from THC-COOH occurred in the B ring (pos. 5). A possible structure of the 238
protonated molecule of this TP and structures of the fragment ions are shown in Figure 1c. 239
3.1.2. Chlorination 240
The study of THC-COOH TPs was performed using a chlorine concentration commonly 241
applied in a tertiary treatment in WWTP (0.8 mg/L) (Bijlsma, et al., 2013a). Under these 242
conditions THC-COOH was completely degraded after 5 min. Eight TPs were detected, four 243
being intermediate compounds and the other four showing higher persistence along the 244
experiment. As an example, Figure 2 illustrates the profiles for the seven TPs detected in 245
negative ionization mode 33 hours after the chlorination experiment. TP 3C showed the 246
highest absolute area followed by TP 1C, TP 2C and TP 4C, which were still all present in the 247
water sample after 33 h. On the contrary, three of these TPs (5C, 6C and 7C) might act as 248
intermediate compounds, as they were observed after 5 min of chlorination but quickly 249
disappeared to probably yield more persistent TPs. Regarding investigation of real-world 250
water samples, persistent TPs seem to be the most relevant compounds as they may be present 251
in EWW and/or SW with a possible negative impact in the environment. 252
In addition to the seven TPs detected in negative mode, there was another chlorination TP 253
(8C) observed under positive mode. This compound disappeared after 30 min of chlorination. 254

12/41
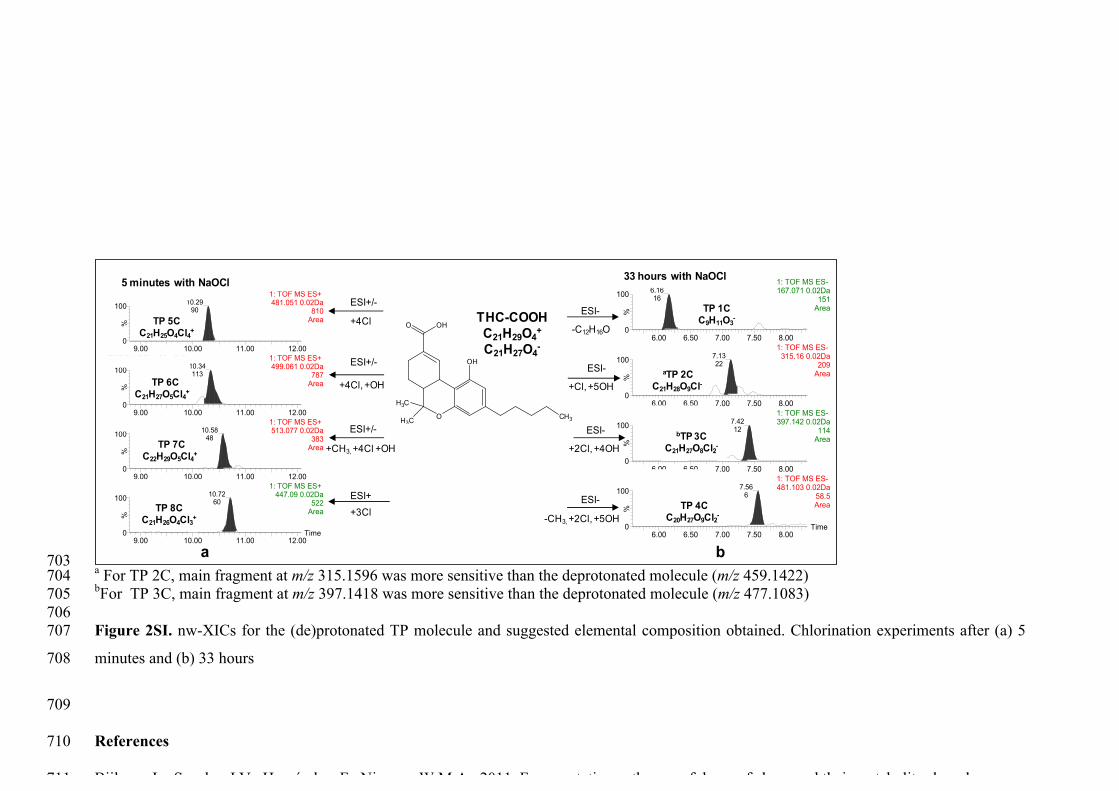
Figure 2SI shows the narrow mass window eXtracted Ion Chromatograms (nw-XICs, 255
0.02 Da mass window width) corresponding to the (de)protonated molecules obtained after 5 256
min (TPs 5C, 6C, 7C and 8C) and after 33 h (TPs 1C, 2C, 3C and 4C) of chlorination. Note 257
that for TPs 2C and 3C, the main fragments at m/z 315.1596 and 397.1418 are shown, as they 258
were more sensitive than the deprotonated molecule. Table 3SI summarizes the information 259
obtained for THC-COOH TPs formed after chlorination. Retention times and exact masses, 260
proposed elemental composition for the (de)protonated TPs and their fragment ions, mass 261
errors (mDa and ppm) and DBE are given. All chlorination TPs contained chlorine atoms, 262
except TP 1C, which was the result of oxidation from the original THC-COOH molecule, 263
consistent with the oxidant properties of NaClO. The number of chlorine atoms (between 1-4) 264
was assigned based on the isotopic pattern observed in the mass spectrum. 265
Figure 2SIa shows intermediate compounds TP 6C and TP 7C containing four chlorine 266
atoms, some of which could be replaced by hydroxyl groups [OH-] yielding the persistent TP 267
2C and TP 3C. Chemical structures could not be proposed for these compounds, as there were 268
too many possibilities to locate the positions of chlorine and hydroxyl groups. Additional 269
analytical techniques, such as NMR or H/D exchange, could be applied for obtaining extra 270
structural information. 271
3.1.3. Photo-degradation (UV) 272
Trying to simulate another tertiary treatment in WWTP, the ultraviolet photo-273
degradation of THC-COOH was studied. Figure 3 shows that THC-COOH was quickly 274
degraded after 30 minutes of UV exposure, yielding three TPs (TP 1PUV, 2PUV and 3PUV) 275
which also disappeared completely after 4 hours. These results illustrate that UV disinfection 276
process would be an effective removal treatment for THC-COOH in WWTPs. As previously 277
stated, persistent TPs seem to be the most relevant compounds from an environmental point 278
of view. For this reason, in some countries, e.g., Italy, chlorination is being progressively 279

13/41
abandoned because of its potential for generating unwanted TPs, and replaced by UV 280
irradiation (Antonelli, et al., 2008). 281
Among the three TPs found after photo-degradation experiments with UV, one was observed 282
in positive mode while the other two were in negative ionization mode. Elemental 283
compositions, retention times, fragment ions, mass errors and DBEs are summarized in Table 284
4SI. TP 1PUV (m/z 388.1760, C21H26NO6-, -1.0 mDa) and TP 2PUV (m/z 433.1611, 285
C21H25N2O8-, +0.2 mDa) eluted at 9.16 and 9.83 minutes, respectively. Their elemental 286
compositions differed in one and two nitro groups (NO2) from THC-COOH molecule, 287
respectively. The NO2 group could easily be introduced since the photo-degradation 288
experiments were performed in surface water from the Mijares River (Castellón province), 289
where relatively high nitrate concentrations are usual due to the wide use of fertilizers in this 290
agricultural area (Bijlsma, et al., 2013a; Hernández, et al., 2008; Wick, et al., 2011). Based on 291
fragmentation information, the nitration could have occurred on the benzene ring for the TP 292
1PUV (see fragment ion at m/z 208.0974, C11H14NO3-, Figure 3). For TP 2PUV further 293
information would be necessary to tentatively assign a chemical structure, as the fragment 294
ions available not provide enough information. The photo-degradation product TP 3PUV 295
showed less polarity than the two nitrated TPs, and eluted at 10.13 minutes. This TP was only 296
detected in positive ionization mode (m/z 329.1763). According to the accurate mass data 297
obtained, the elemental composition was assigned to C20H25O4+ (ΔmDa=+0.2), which would 298
result from the loss of CH4 from the THC-COOH molecule. The neutral losses observed in 299
HE mass spectrum (m/z 28.0313 C2H4 and m/z 70.0783 C5H10, Figure 3), would imply a 300
demethylation and dehydrogenation in B ring (pos. 5) instead of the aliphatic ring of THC-301
COOH. The structures proposed for ultraviolet TPs are shown in Figure 3. 302
3.1.4. Photo-degradation (Sunlight simulation) 303
14/41
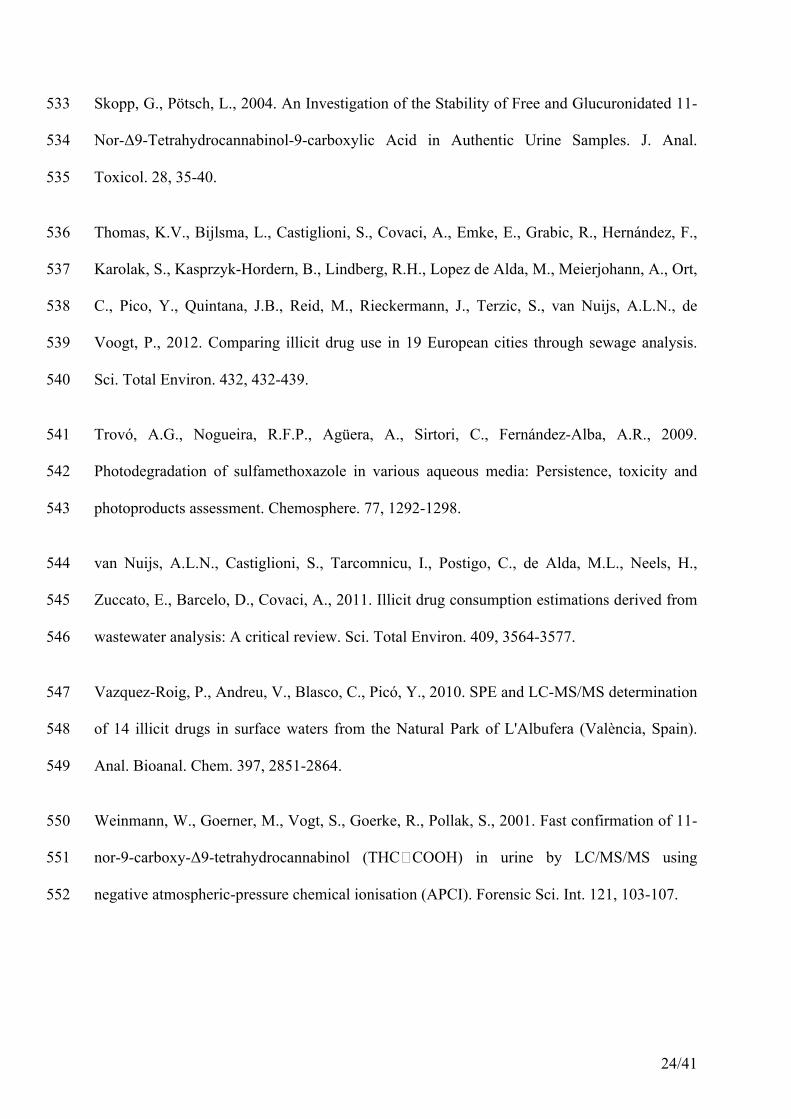
Laboratory experiments simulating natural sun light were also performed in order to 304
investigate the possible degradation of THC-COOH in water under environmental conditions. 305
Seven TPs were detected in this case. Figure 4 shows the degradation rate of the TPs detected 306
in negative ionization mode. As can be seen, THC-COOH was completely degraded after 50 h 307
of irradiation by simulation suntest reactor (equivalent to 8 days of natural sun irradiation). 308
Six TPs were formed, although some of them started to decrease in abundance after 50 h. The 309
most abundant TP, in terms of absolute area, was the TP 1PS which presented its maximum 310
abundance after 45 h of photo-degradation. This TP might suffer a hydrogenation to form the 311
TP 2PS which was still present after 75 h. Similar hydrogenation was observed for TPs 3PS 312
and 4PS. TP 3PS started to increase in abundance after 30 h, just when TP 4PS started to 313
decrease. Finally, TP 5PS and TP 6PS also showed significant maximum intensities, ~300 and 314
~150 a.u., respectively, after 20 h (Figure 4). 315
Another TP was observed only under positive mode. TP 7PS, appeared at 50 h, showing 316
its maximum after 80 h. 317
It is important to consider these sunlight photo-degradation TPs when investigating the 318
presence of cannabis derivatives in the aquatic environment, as they might be present in 319
environmental waters exposed to solar radiation. 320
Different reactions, such as hydroxylation, demethylation, methylation, or a combination 321
of them, would explain the formation of the seven photo-degraded sunlight TPs. Their 322
elemental compositions, retention times, ionization modes, accurate masses, fragment ions, 323
mass errors and DBEs are shown in Table 5SI. TP 1PS (m/z 185.0814, C9H13O4-) could have 324
suffered a hydrogenation to form TP 2PS (m/z 187.0970, C9H15O4-). The chemical structure of 325
both TPs would correspond to the A ring of THC-COOH, see Figure 4. The main fragment 326
ions at m/z 141.0921 (C8H13O2-) and m/z 143.1069 (C8H15O2
-) for TP 1PS and TP 2PS, 327
respectively, indicate a typical loss (CO2) from a carboxylic acid group. Similar 328

15/41
hydrogenation was observed in another two photo-degradation products: TP 4PS (8.06 min, 329
C20H26O6) and TP 3PS (7.45 min, C20H28O6). As Figure 4 shows, both TPs were detected in 330
negative as well as positive ion modes. Their chemical structures differ from the THC-COOH 331
molecule in two hydroxylations on the benzene ring plus one demethylation on 332
cyclohexanoate ring. TP 5PS and TP 6PS were photo-degradation TPs sharing the same exact 333
mass but eluting at different retention times (8.64 and 8.80 min, respectively). They were 334
detected in positive (m/z 377.1964) and negative (m/z 375.1808) ionization modes too. The 335
chemical structure (C21H28O6) of these isomers might be the result of a double hydroxylation 336
of THC-COOH. However, the positions of the hydroxyl groups were difficult to predict with 337
the information available on fragment ions. 338
To the authors´ best knowledge, these cannabis TPs have not yet been reported in 339
scientific literature. 340
3.2. Analysis of real-world samples 341
Five effluent and five influent wastewaters were analyzed by LC-(ESI)-MS/MS (QqQ). 342
Sample treatment consisted of pre-concentration by SPE with Oasis HLB, which has been 343
widely used in the analysis of many different organic pollutants with a wide polarity range. 344
The LC conditions were the same as used in the degradation experiments, in order to obtain 345
comparable retention times. Nineteen TPs and the metabolite THC-COOH were included as 346
target analytes in the method (Table 6SI). For each compound, two SRM transitions were 347
selected based on fragment ions observed by QTOF MS in the degradation experiments. All 348
compounds measured under electrospray positive and negative ionization mode were 349
determined simultaneously in just one injection. In some particular cases, a pseudo-transition 350
was included, i.e. for TPs 1C, 1PS and 2PS, as only one fragment ion (or additional fragment 351
ions of low intensity) was observed in QTOF mass spectra. For the reliable identification of 352
the compounds detected in the samples, the compliance of retention time and Q/q ratios 353

16/41
within maximum tolerances allowed was required (Commission Decision 2002). As reference 354
standards of TPs were unavailable, the sample vial obtained in the degradation experiments 355
with the highest concentration of analyte was used instead. The use of Q/q ratios for 356
confirmation was problematic for some TPs, as the value was above 10, which means that the 357
second product ion had very low abundance, making the use of the second transition less 358
useful. This was reflected in the analysis of some samples as indicated bellow. 359
In addition to wastewater samples, several surface waters collected from Spain and The 360
Netherlands were also analysed. 361
A summary of the positive findings in IWW, EWW and SW is shown in Table 1. THC-362
COOH was detected in all IWW (mean concentration 56 ng/L) and also in EWW, although at 363
a significantly lower levels (mean concentration 8 ng/L). This is in agreement with the 364
literature, as this major cannabis metabolite is frequently detected in IWW as a result of the 365
wide cannabis consumption (Thomas, et al., 2012; Bijlsma, et al., 2012; Boleda, et al., 2007; 366
Postigo, et al., 2010). The presence of this metabolite in EWW suggests that a partial removal 367
takes place in the WWTPs. No TPs were found in influent wastewater, which might be 368
explained by the fact that still not any treatment has been applied for contaminants removal. 369
However, several TPs were detected in effluent wastewaters. The hydrolysis TP 1H and five 370
sunlight photo-degradation TPs (2PS, 3PS, 4PS, 6PS and 7PS) were detected in effluent 371
samples (between 40-80% of positive samples). These TPs were detected using the most 372
abundant transition (Q); however, the second transition was not clearly observed, surely due 373
to low concentration levels of these TPs in the samples. In relation to surface water, the major 374
metabolite THC-COOH was found in 5 out of 10 the samples analyzed (the four samples 375
collected from Spain and one sample from The Netherlands). It must be noticed that the 376
Spanish samples were collected in an area (Albufera lake) very close to Valencia. This can 377
explain the presence of this metabolite in all the samples analysed. 378

17/41
Regarding cannabis TPs, five of these compounds were detected and confirmed in several 379
surface samples: the hydrolysis TP 1H and four sunlight photo-degradation TPs (1PS, 2PS, 380
5PS and 6PS). The most frequent compound was TP 1PS (m/z 185) which was found in 6 out 381
of 10 surface waters analyzed. However, its identity could not be fully confirmed in 2 samples 382
as Q/q ratio deviation exceeded the maximum tolerance allowed (±30% for ion ratios between 383
5-10) (Commission Decision 2002). A similar situation was observed for TP 2PS (m/z 187), 384
which was detected in 4 samples. It must be noticed that a pseudo MS/MS transition was used 385
for TPs 1PS and 2PS; this would make confirmation using Q/q ratios more troublesome, due 386
to the lower specificity of these transitions (i.e. the same precursor and product ion selected). 387
In order to illustrate the confirmation of positive findings, Figure 5 shows LC-MS/MS 388
chromatograms for TP 1H detected in a surface water sample from Spain; and for TPs 1PS, 389
2PS, 5PS and 6PS detected in a surface water sample from The Netherlands. As can be seen, 390
experimental Q/q ratios were within or close to the maximum deviations and Rt were in 391
agreement with the reference compounds. This allowed us to confirm the identity of the 392
compounds detected, with only the exception of TP 2PS. As previously stated, this might be 393
due to the poor selectivity of the pseudo-SRM transitions used for this compound making the 394
presence of interfering compounds more likely. It is worth noting that non-compliance of Q/q 395
ratio might lead to false negatives in the case that a matrix-interferent was sharing one of the 396
transitions, thereby producing ion intensity ratios different than expected. 397
398
4. CONCLUSIONS 399
This work reports the behaviour of THC-COOH, the major urinary metabolite of 400
cannabis, subjected to hydrolysis, chlorination and photo-degradation (sunlight and UV) 401
experiments under controlled conditions at the laboratory. 402

18/41
Altogether, nineteen THC-COOH TPs (one hydrolysis, eight chlorination, three UV and 403
seven sunlight photo-degradation) were identified by LC-QTOF MS. To the best of our 404
knowledge, most of these TPs have not been reported in the scientific literature yet. 405
The results from laboratory degradation suggest that UV treatment could be an effective 406
way for removal of THC-COOH in WWTPs, better than chlorination, which generates 407
unwanted TPs. 408
Analysis of wastewater samples (five IWW and five EWW) and surface waters has 409
allowed us to estimate the removal efficiency of the WWTPs under study as well as to 410
evaluate the presence of cannabis TPs in the aquatic environment. The metabolite THC-411
COOH was detected in all IWW and EWW samples analysed, and a removal efficiency of 412
around 86% was estimated. Regarding TPs, none of them were found in influent wastewater, 413
while one hydrolysis and five sunlight photo-degradation TPs were found in effluent 414
wastewaters. In surface waters, THC-COOH was detected in 50% of samples analyzed. The 415
most detected compound (60% of samples) was the sunlight photo-degradation TP 1PS with 416
m/z 185.0814. 417
The results obtained in the present paper illustrate the importance of investigating TPs in 418
the aquatic environment. Some of the TPs reported in this article, particularly those resulting 419
from sunlight photo-degradation, would need to be investigated in more detail to have a 420
realistic overview of cannabinoids impact in the aquatic environment. Reference standards 421
would be required to unequivocally confirm the identity of these compounds, and to develop 422
analytical methodologies able to accurately quantify their concentration levels in waters. 423
424
425
426

19/41
ACKNOWLEDGEMENTS 427
The authors are very grateful to Monique van der Aa (National Institute for Public Health and 428
the Environment RIVM) and Yolanda Picó (Environmental and Food Safety Research Group, 429
Faculty of Pharmacy, University of Valencia) for sampling surface water samples; and to 430
Serveis Centrals d’Instrumentació Científica (SCIC) of University Jaume I for letting us use 431
the mass spectrometers. The financial support of the Spanish Ministry of Education and 432
Science (Ref CTQ2009-12347) and of Generalitat Valenciana (Research Group of Excellence 433
PROMETEO/2009/054; Collaborative Research on Environment and Food Safety, 434
ISIC/2012/016) is acknowledged. 435
436
437
438
439
440
441
442
443
444
445
446
447

20/41
References 448
Acero, J.L., Benítez, F.J., Real, F.J., González, M., 2008. Chlorination of organophosphorus 449
pesticides in natural waters. J. Hazard. Mater. 153, 320-328. 450
Antonelli, M., Mezzanotte, V., Nurizzo, C., 2008. Wastewater disinfection by UV irradiation: 451
Short and long-term efficiency. Environ. Eng. Sci. 25, 363-373. 452
Berset, J.-., Brenneisen, R., Mathieu, C., 2010. Analysis of llicit and illicit drugs in waste, 453
surface and lake water samples using large volume direct injection high performance liquid 454
chromatography - Electrospray tandem mass spectrometry (HPLC-MS/MS). Chemosphere. 455
81, 859-866. 456
Bijlsma, L., Boix, C., Niessen, W.M.A., Ibáñez, M., Sancho, J.V., Hernández, F., 2013a. 457
Investigation of degradation products of cocaine and benzoylecgonine in the aquatic 458
environment. Sci. Total Environ. 443, 200-208. 459
Bijlsma, L., Emke, E., Hernández, F., de Voogt, P., 2013b. Performance of the linear ion trap 460
Orbitrap mass analyzer for qualitative and quantitative analysis of drugs of abuse and relevant 461
metabolites in sewage water. Anal. Chim. Acta. 768, 102-110. 462
Bijlsma, L., Emke, E., Hernández, F., De Voogt, P., 2012. Investigation of drugs of abuse and 463
relevant metabolites in Dutch sewage water by liquid chromatography coupled to high 464
resolution mass spectrometry. Chemosphere. 89, 1399-1406. 465
Bijlsma, L., Sancho, J.V., Pitarch, E., Ibáñez, M., Hernández, F., 2009. Simultaneous ultra-466
high-pressure liquid chromatography-tandem mass spectrometry determination of 467
amphetamine and amphetamine-like stimulants, cocaine and its metabolites, and a cannabis 468
metabolite in surface water and urban wastewater. J. Chromatogr. A. 1216, 3078-3089. 469

21/41
Boix, C., Ibáñez, M., Sancho, J.V., Niessen, W.M.A., Hernández, F., 2013 Investigating the 470
presence of omeprazole in waters by liquid chromatography coupled to low and high 471
resolution mass spectrometry (i): Degradation experiments. J. Mass Spectrom. DOI 472
10.1002/jms.3260. 473
Boleda, M.R., Galceran, M.T., Ventura, F., 2009. Monitoring of opiates, cannabinoids and 474
their metabolites in wastewater, surface water and finished water in Catalonia, Spain. Water 475
Res. 43, 1126-1136. 476
Boleda, M.R., Galceran, M.T., Ventura, F., 2007. Trace determination of cannabinoids and 477
opiates in wastewater and surface waters by ultra-performance liquid chromatography-tandem 478
mass spectrometry. J. Chromatogr. A. 1175, 38-48. 479
Castiglioni, S., Zuccato, E., Crisci, E., Chiabrando, C., Fanelli, R., Bagnati, R., 2006. 480
Identification and measurement of illicit drugs and their metabolites in urban wastewater by 481
liquid chromatography-tandem mass spectrometry. Anal. Chem. 78, 8421-8429. 482
EPA. Washington, DC (2004). "Primer for Municipal Waste water Treatment systems." 483
Document no. EPA 832-R-04-0012 484
European Monitoring Centre for Drugs and Drug Addiction. The state of the drugs problem in 485
Europe. EMCDDA Annual Report. 2010 Available from URL:http://www.emcdda.europa.eu/ 486
(accessed January 2012) 487
Commission Decision 2002/657/CE of 12 August 2002, Implementing Council Directive 488
96/23/EC Concerning the Performance of Analytical Methods of Interpretation of 489
Results. 490

22/41
Farré, M.l., Pérez, S., Kantiani, L., Barceló, D., 2008. Fate and toxicity of emerging 491
pollutants, their metabolites and transformation products in the aquatic environment. TrAC 492
Trends Anal. Chem. 27, 991-1007. 493
Fatta-Kassinos, D., Vasquez, M.I., Kümmerer, K., 2011. Transformation products of 494
pharmaceuticals in surface waters and wastewater formed during photolysis and advanced 495
oxidation processes - Degradation, elucidation of byproducts and assessment of their 496
biological potency. Chemosphere. 85, 693-709. 497
Fatta-Kassinos, D., Meric, S., Nikolaou, A., 2011. Pharmaceutical residues in environmental 498
waters and wastewater: Current state of knowledge and future research. Anal. Bioanal. Chem. 499
399, 251-275. 500
Gosetti, F., Mazzucco, E., Gennaro, M.C., Marengo, E., 2013. The challenge of non-target 501
uhplc/ms analysis for the dentification of emerging contaminants in water. Environmental 502
Chemistry for a Sustainable World, submitted for publication. 503
Hernández, F., Bijlsma, L., Sancho, J.V., Díaz, R., Ibáñez, M., 2011. Rapid wide-scope 504
screening of drugs of abuse, prescription drugs with potential for abuse and their metabolites 505
in influent and effluent urban wastewater by ultrahigh pressure liquid chromatography-506
quadrupole-time-of-flight-mass spectrometry. Anal. Chim. Acta. 684, 87-97. 507
Hernández, F., Ibáñez, M., Pozo, Ó.J., Sancho, J.V., 2008. Investigating the presence of 508
pesticide transformation products in water by using liquid chromatography-mass spectrometry 509
with different mass analyzers. J. Mass Spectrom. 43, 173-184. 510

23/41
Ibáñez, M., Sancho, J.V., Pozo, O.J., Hernández, F., 2011. Use of quadrupole time-of-flight 511
mass spectrometry to determine proposed structures of transformation products of the 512
herbicide bromacil after water chlorination. Rapid Commun. Mass Spectrom. 25, 3103-3113. 513
Ibáñez, M., Sancho, J.V., Pozo, Ó.J., Hernández, F., 2006. Use of liquid chromatography 514
quadrupole time-of-flight mass spectrometry in the elucidation of transformation products and 515
metabolites of pesticides. Diazinon as a case study. Anal. Bioanal. Chem. 384, 448-457. 516
Ibáñez, M., Sancho, J.V., Pozo, Ó.J., Hernández, F., 2004. Use of Quadrupole Time-of-Flight 517
Mass Spectrometry in Environmental Analysis: Elucidation of Transformation Products of 518
Triazine Herbicides in Water after UV Exposure. Anal. Chem. 76, 1328-1335. 519
Kern, S., Fenner, K., Singer, H.P., Schwarzenbach, R.P., Hollender, J., 2009. Identification of 520
transformation products of organic contaminants in natural waters by computer-aided 521
prediction and high-resolution mass spectrometry. Environ. Sci. Technol. 43, 7039-7046. 522
Lai, F.Y., Ort, C., Gartner, C., Carter, S., Prichard, J., Kirkbride, P., Bruno, R., Hall, W., 523
Eaglesham, G., Mueller, J.F., 2011. Refining the estimation of illicit drug consumptions from 524
wastewater analysis: Co-analysis of prescription pharmaceuticals and uncertainty assessment. 525
Water Res. 45, 4437-4448. 526
Postigo, C., López de Alda, M.J., Barceló, D., 2010. Drugs of abuse and their metabolites in 527
the Ebro River basin: Occurrence in sewage and surface water, sewage treatment plants 528
removal efficiency, and collective drug usage estimation. Environ. Int. 36, 75-84. 529
Quintana, J.B., Rodil, R., López-Mahía, P., Muniategui-Lorenzo, S., Prada-Rodríguez, D., 530
2010. Investigating the chlorination of acidic pharmaceuticals and by-product formation aided 531
by an experimental design methodology. Water Res. 44, 243-255. 532
24/41
Skopp, G., Pötsch, L., 2004. An Investigation of the Stability of Free and Glucuronidated 11-533
Nor-Δ9-Tetrahydrocannabinol-9-carboxylic Acid in Authentic Urine Samples. J. Anal. 534
Toxicol. 28, 35-40. 535
Thomas, K.V., Bijlsma, L., Castiglioni, S., Covaci, A., Emke, E., Grabic, R., Hernández, F., 536
Karolak, S., Kasprzyk-Hordern, B., Lindberg, R.H., Lopez de Alda, M., Meierjohann, A., Ort, 537
C., Pico, Y., Quintana, J.B., Reid, M., Rieckermann, J., Terzic, S., van Nuijs, A.L.N., de 538
Voogt, P., 2012. Comparing illicit drug use in 19 European cities through sewage analysis. 539
Sci. Total Environ. 432, 432-439. 540
Trovó, A.G., Nogueira, R.F.P., Agüera, A., Sirtori, C., Fernández-Alba, A.R., 2009. 541
Photodegradation of sulfamethoxazole in various aqueous media: Persistence, toxicity and 542
photoproducts assessment. Chemosphere. 77, 1292-1298. 543
van Nuijs, A.L.N., Castiglioni, S., Tarcomnicu, I., Postigo, C., de Alda, M.L., Neels, H., 544
Zuccato, E., Barcelo, D., Covaci, A., 2011. Illicit drug consumption estimations derived from 545
wastewater analysis: A critical review. Sci. Total Environ. 409, 3564-3577. 546
Vazquez-Roig, P., Andreu, V., Blasco, C., Picó, Y., 2010. SPE and LC-MS/MS determination 547
of 14 illicit drugs in surface waters from the Natural Park of L'Albufera (València, Spain). 548
Anal. Bioanal. Chem. 397, 2851-2864. 549
Weinmann, W., Goerner, M., Vogt, S., Goerke, R., Pollak, S., 2001. Fast confirmation of 11-550
nor-9-carboxy-Δ9-tetrahydrocannabinol (THC�COOH) in urine by LC/MS/MS using 551
negative atmospheric-pressure chemical ionisation (APCI). Forensic Sci. Int. 121, 103-107. 552

25/41
Wick, A., Wagner, M., Ternes, T.A., 2011. Elucidation of the transformation pathway of the 553
opium alkaloid codeine in biological wastewater treatment. Environ. Sci. Technol. 45, 3374-554
3385. 555
556
557

26/41
FIGURE CAPTIONS 558
Graphical Abstract (GA). Schematic overview for THC-COOH presence and behaviour in 559
WWTPs and in the environment 560
Figure 1. (a) Degradation of THC-COOH under hydrolysis conditions and TP formed, (b) 561
Elemental composition, retention time, fragments ions, mass errors and DBE. (c) Proposed 562
structures for TP 1H and for its fragment ions 563
Figure 2. Degradation curves for TPs obtained after THC-COOH chlorination experiments 564
(QTOF under ESI negative ionization mode) 565
Figure 3. Degradation curves for TPs 1PUV, 2PUV and 3PUV, detected in positive and 566
negative ion mode, and proposed structures. Ultraviolet photo-degradation experiments 567
Figure 4. TPs identified after THC-COOH sunlight photo-degradation experiments (QTOF 568
under ESI negative ionization mode) 569
Figure 5. LC- MS/MS QqQ chromatograms for (a) TP 1H in Spanish surface water; (b) TP 570
1PS, (c) TP 2PS and (d) TP 5PS and 6PS detected in The Netherlands surface water 571
572 573

27/41
Graphical abstract 574
575
576
577
THCConsumption
Metabolism
Urinary and renal excretion mainlyas THC-COOH
WWTP
Primarytreatment
Primarytreatment
Secondarytreatment
Primarytreatment
Secondarytreatment
Tertiarytreatment
Hydrolysis TPs
HydrolysisBiodegradation TPs
HydrolysisBiodegradation
ChlorinationUV TPs
Environment
THC-COOHHydrolysis
BiodegradationChlorination
UV and SunlightTPs
IWW
EWW
SWO
OH
H3C
OHO
H3C
THC-COOHC21H28O4
A
B C1234
5

28/41
578 Figure 1 579
580
581
CompoundRet. time (min)
Ionization mode
Exact Mass(m/z)
Elementalcomposition
MassError(mDa)
MassError(ppm)
DBE
TP 1H 331.1909 C20H27O4+ 1.5 4.5 7.5
8.92 min 313.1804 C20H25O3+ -0.3 -1.0 8.5
ESI+ 243.1021 C15H15O3+ -1.9 -7.8 8.5
231.1385 C15H19O2+ 1.8 7.8 6.5
175.0759 C11H11O2+ 0.5 2.8 6.5
O
OH
H3C
OHO
H3CO
OH
H3C
OHO
O
OH
H3C
THC-COOH TP 1H
O
OH
H3C
O
O
OH
H3C
O
OH
H3C
O
m/z: 231.1385
m/z: 243.1021
m/z: 175.0759
m/z: 313.1804
a
c
TP 1Hm/z: 331.1909
C20H27O4+
b
Frag
men
t ion
s
THC-COOHm/z: 345.2066
C21H29O4+
+ +
A
B C12
345
A
B C12
345
Loss ofm/z 70.0783
0
5
10
15
20
25
0
200
400
600
800
1000
1200
1400
0 1 3 7 10 17
Abs
olut
are
a TP
Abs
olut
are
a TH
C-C
OO
H
Hydrolysis time (Days)

29/41
582 583 a For TP 2C, main fragment at m/z 315.1596 was more sensitive than the deprotonated molecule (m/z 459.1422) 584 b For TP 3C, main fragment at m/z 397.1418 was more sensitive than the deprotonated molecule (m/z 477.1083) 585 Figure 2 586
587
588
0
5
10
15
20
25
30
35
40
0 5 10 15 20 25 30 35Degradation time (h)
Abso
lute
are
aTP 1CTP 2CTP 3CTP 4CTP 5CTP 6CTP 7C
0
5
10
15
20
25
0 0.5 1 1.5 2 2.5 3Degradation time (h)
Abso
lute
are
a
ab

30/41
589 Figure 3 590
591
592
593
0
100
200
300
400
500
0 1 2 3 4 5Degradation time (h)
Are
a
THC-COOH
ESI-
ESI+
TP 1PUVC21H26NO6
-
O
OH2
COOH
TP 3PUVC20H25O4
+
O
COOH
OH NO2
NO2
TP 2PUVC21H25N2O8
-
O
O
COOH
Fragment ionm/z 208.0974C11H14NO3
- NO2
Loss of m/z 70.0783Loss ofm/z 28.0313
31/41
594 a For TTPs 5-6PS, detection of its main fragment at m/z 331.1909 was more sensitive than the deprotonated molecule at m/z 375.1808 595
Figure 4 596
597
O
OH
CH3
OHO
OH
CO OH
OH
O
OH
C
O OH
OH
OH
TP 3-4PSC20H25O6
-
C20H27O6-TP 1-2PS
C9H13O4-
C9H15O4-
aTP 5-6PSC21H278O6
0
100
200
300
400
500
600
0 10 20 30 40 50 60 70 80Degradation Time (Hours)
Absolute area
THC-‐COOHTP 1PSTP 2PSTP 3PSTP 4PSTP 5PSTP 6PS
OH
OH

32/41
598 Figure 5 599
600 601 602 603 604 605 606
SW12, Heel lateraalkanaal, Maas
Time5.60 5.80 6.00
%0
100
5.60 5.80 6.00
%
0
1005.86123036
5.8635443
PP1W
Time8.70 8.80 8.90
%
0
100
8.70 8.80 8.90
%
0
1008.7919420
8.791047
SW12, Heel lateraalkanaal, Maas
Time6.90 7.00 7.10 7.20
%
0
100
6.90 7.00 7.10 7.20
%
0
1006.99180675
6.99128772
SW12, Heel lateraalkanaal, Maas
Time8.60 8.70 8.80 8.90 9.00
%
0
100
8.60 8.70 8.80 8.90 9.00
%
0
1008.853826
8.691665
8.842253
8.691186
1HESI+
331.2>175.1
331.2>231.1
1PSESI-
185.1>185.0
185.1>141.1
2PSESI-
187.1>187.1
187.1>143.1
ESI+377.2>313.2
377.2>285.2
Q
q
Q
q
Q
q
Q
q
(Q/q)ref=16.4(Q/q)sample=18.6Dev=+13%
(Q/q)ref=1.5(Q/q)sample=1.4/1.7Dev=-7/+13%
(Q/q)ref=5.2(Q/q)sample=3.5Dev=-33%
(Q/q)ref=7.8(Q/q)sample=1.40Dev=-82%
(a) (b) (c) (d)
6PS5PS

33/41
Table 1. Main cannabis metabolite (THC-COOH) and TPs detected in IWW, EWW and SW 607 samples by LC-MS/MS 608 609
Number of positive findings
IWW (n=5)
EWW (n=5)
SW (n=10)
THC-COOH (ESI-/+) 5 5 5 TP 1H (ESI+) - 3a 1 TP 1PS (ESI-) - - 6b TP 2PS (ESI-) - 4 4b TP 3PS (ESI-) - 3 - TP 4PS (ESI-) - 2 8 TP 5PS (ESI+) - - 1 TP 6PS (ESI+) - 2 1 TP 7PS (ESI+) - 3 - a : underlined, the number of samples where only one transition was observed 610 b: Q/q ratio deviation >50% 611 612
613 614 615 616 617

34/41
SUPPLEMENTARY INFORMATION 618 619
THC-COOH is reported in positive (m/z 345.2066) and negative (m/z 343.1909) 620
ionization modes. The Figure 1SI shows its HE mass spectra and the main fragment ions. In 621
positive ionization mode, the most intense fragment ion at m/z 299.2001 corresponds to the 622
loss of formic acid. The other fragments have been justified in our previous works about 623
fragmentation (Bijlsma, et al., 2011). Regarding negative acquisition mode, four low-intense 624
fragment ions were observed. The ion at m/z 299 corresponds to the CO2 loss. The fragment 625
ion at m/z 191.1082 (C12H15O2-, +1.0 mDa) corresponds to the positive 193.1229 (C12H17O2
+, 626
0.3 mDa). Other fragments ions observed in negative mode at m/z 245.1559 (C16H21O2-, +1.7 627
mDa) and m/z 179.1084 (C11H15O2-, +1.2 mDa) are illustrated in Figure 1SI. 628
629 Figure 1SI. QTOF HE spectra of THC-COOH in (a) positive and (b) negative ionization 630 mode; fragment ion structures proposed by MassFragment 631
632 633
SW Riu Millars 500ppb THCCOOH (T0min) FORTIFICAT
m/z170 180 190 200 210 220 230 240 250 260 270 280 290 300 310 320 330 340 350
%
0
100THCl0056 762 (9.812) Cm (759:766-(721:758+771:827)) 2: TOF MS ES-
6.23e3343.1919
299.2011
297.1675245.1559
191.1082
300.2071
301.2133
344.1953
345.2003
SW Riu Millars 500ppb THCCOOH (T0min) FORTIFICAT
m/z170 180 190 200 210 220 230 240 250 260 270 280 290 300 310 320 330 340 350
%
0
100THCl0049 761 (9.800) Cm (759:766-(751:758+768:784)) 2: TOF MS ES+
3.84e3345.2065
299.2001
193.1232
187.0767229.1243217.1247 257.1479
327.1941
300.2062 328.1992346.2110
-H2O
ESI+
ESI-
C12H11O2+
(+0.8 mDa)C12H17O2
+
(+0.3 mDa)
C15H17O2+
(+1.4 mDa)C17H21O2
+
(-6.3 mDa)
C20H27O2+
(-1.0 mDa)
C20H27O2-
(0.0 mDa)
C16H21O2-
(+1.7 mDa)
C12H15O2-
(+1.0 mDa)C11H15O2-
(+1.2 mDa)
179.1084
-CO2
-HCOOH
a
b
4x
THC-COOHC21H29O4
+
[M+H]+ 345.2066(-0.1 mDa)
THC-COOHC21H27O4
-
[M-H]- 343.1909(+1.0 mDa)

35/41
Table 1SI. Characteristics of the surface water used in the degradation experiments 634
Characteristics Values Temperature (ºC, in situ) 15.1 pH (in situ) 8.5 Conductivity (µS/cm, in situ) 810.7 Hardness (expressed as ppm CaCO3) 316.8 Alkalinity (expressed as ppm HCO3
-) 131.6 Chlorides (expressed as ppm Cl-) 44.2 Nitrates (expressed as ppm NO3
-) 3.8 Phosphate (expressed as ppm PO4
3-) 2.8 Organic matter (expressed as ppm O2) 2.2 Sulphates (expressed as ppm SO4
2-) 218.7
635
636 637
638 639
640 641
642 643
644 645
646 647
648 649
650 651
652 653
654 655
656 657
658

36/41
Table 2SI. Some characteristics of the Castellon WWTP 659
Castellon WWTP Population served 32,000 Origin urban and mixed urban and industrial Average flow rate (m3/d) 8250 EWW samples Treatment a 3 samples Primary step, biological 1 sample Primary step, biological, removal Chlorination 1 sample Primary step, biological, removal UV
a Primary step: physical treatment (inc. grit removal). Secondary step: biological treatment 660 (activated sludge). Tertiary step: removal by chlorination or ultraviolet treatment. 661 662
663
664 665
666 667
668 669
670 671
672 673 674
675 676
677 678
679 680
681 682
683 684
37/41
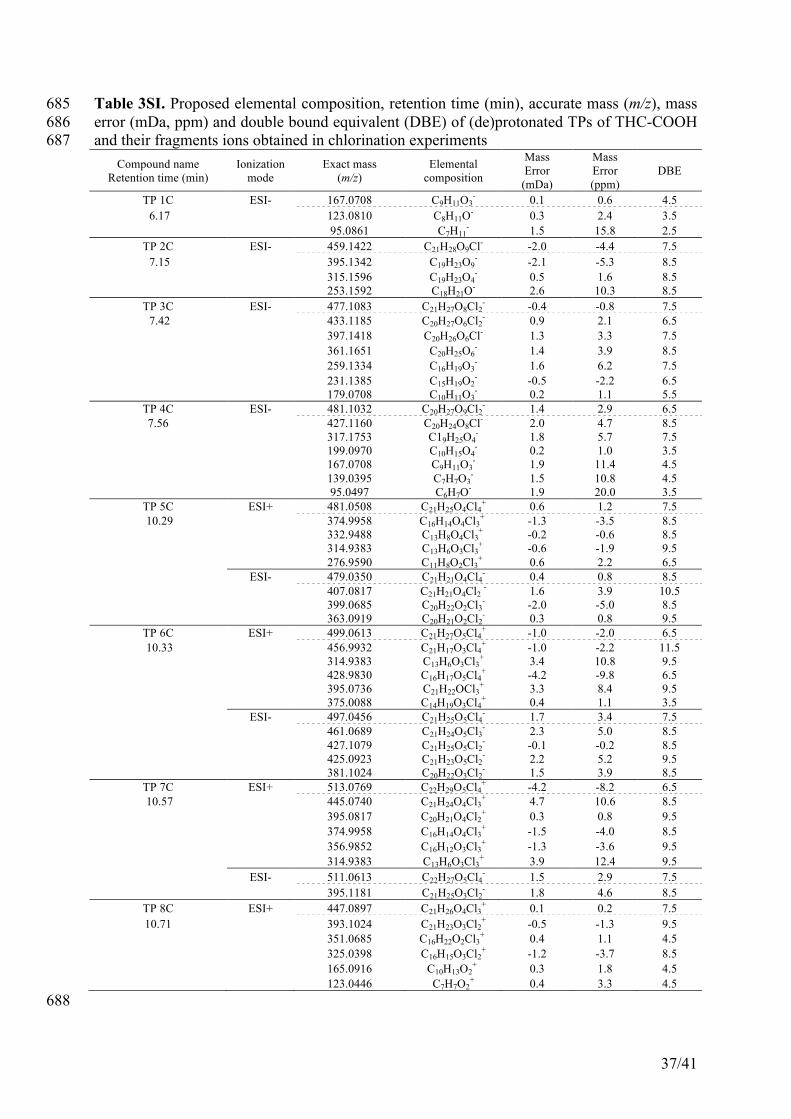
Table 3SI. Proposed elemental composition, retention time (min), accurate mass (m/z), mass 685 error (mDa, ppm) and double bound equivalent (DBE) of (de)protonated TPs of THC-COOH 686 and their fragments ions obtained in chlorination experiments 687
Compound name Retention time (min)
Ionization mode
Exact mass (m/z)
Elemental composition
Mass Error
(mDa)
Mass Error (ppm)
DBE
TP 1C ESI- 167.0708 C9H11O3- 0.1 0.6 4.5
6.17 123.0810 C8H11O- 0.3 2.4 3.5 95.0861 C7H11
- 1.5 15.8 2.5 TP 2C ESI- 459.1422 C21H28O9Cl- -2.0 -4.4 7.5 7.15 395.1342 C19H23O9
- -2.1 -5.3 8.5 315.1596 C19H23O4
- 0.5 1.6 8.5 253.1592 C18H21O- 2.6 10.3 8.5
TP 3C ESI- 477.1083 C21H27O8Cl2- -0.4 -0.8 7.5
7.42 433.1185 C20H27O6Cl2- 0.9 2.1 6.5
397.1418 C20H26O6Cl- 1.3 3.3 7.5 361.1651 C20H25O6
- 1.4 3.9 8.5 259.1334 C16H19O3
- 1.6 6.2 7.5 231.1385 C15H19O2
- -0.5 -2.2 6.5 179.0708 C10H11O3
- 0.2 1.1 5.5 TP 4C ESI- 481.1032 C20H27O9Cl2
- 1.4 2.9 6.5 7.56 427.1160 C20H24O8Cl- 2.0 4.7 8.5
317.1753 C19H25O4- 1.8 5.7 7.5
199.0970 C10H15O4- 0.2 1.0 3.5
167.0708 C9H11O3- 1.9 11.4 4.5
139.0395 C7H7O3- 1.5 10.8 4.5
95.0497 C6H7O- 1.9 20.0 3.5 TP 5C ESI+ 481.0508 C21H25O4Cl4
+ 0.6 1.2 7.5 10.29 374.9958 C16H14O4Cl3
+ -1.3 -3.5 8.5 332.9488 C13H8O4Cl3
+ -0.2 -0.6 8.5
314.9383 C13H6O3Cl3+
-0.6 -1.9 9.5 276.9590 C11H8O2Cl3
+ 0.6 2.2 6.5 ESI- 479.0350 C21H21O4Cl4
- 0.4 0.8 8.5 407.0817 C21H21O4Cl2 - 1.6 3.9 10.5 399.0685 C20H22O2Cl3
- -2.0 -5.0 8.5 363.0919 C20H21O2Cl2
- 0.3 0.8 9.5 TP 6C ESI+ 499.0613 C21H27O5Cl4
+ -1.0 -2.0 6.5 10.33 456.9932 C21H17O3Cl4
+ -1.0 -2.2 11.5 314.9383 C13H6O3Cl3
+ 3.4 10.8 9.5 428.9830 C16H17O5Cl4
+ -4.2 -9.8 6.5 395.0736 C21H22OCl3
+ 3.3 8.4 9.5 375.0088 C14H19O3Cl4
+ 0.4 1.1 3.5 ESI- 497.0456 C21H25O5Cl4
- 1.7 3.4 7.5 461.0689 C21H24O5Cl3
- 2.3 5.0 8.5 427.1079 C21H25O5Cl2
- -0.1 -0.2 8.5 425.0923 C21H23O5Cl2
- 2.2 5.2 9.5 381.1024 C20H22O3Cl2
- 1.5 3.9 8.5 TP 7C ESI+ 513.0769 C22H29O5Cl4
+ -4.2 -8.2 6.5 10.57 445.0740 C21H24O4Cl3
+ 4.7 10.6 8.5 395.0817 C20H21O4Cl2
+ 0.3 0.8 9.5 374.9958 C16H14O4Cl3
+ -1.5 -4.0 8.5 356.9852 C16H12O3Cl3
+ -1.3 -3.6 9.5 314.9383 C13H6O3Cl3
+ 3.9 12.4 9.5 ESI- 511.0613 C22H27O5Cl4
- 1.5 2.9 7.5 395.1181 C21H25O3Cl2
- 1.8 4.6 8.5 TP 8C ESI+ 447.0897 C21H26O4Cl3
+ 0.1 0.2 7.5 10.71 393.1024 C21H23O3Cl2
+ -0.5 -1.3 9.5 351.0685 C16H22O2Cl3
+ 0.4 1.1 4.5 325.0398 C16H15O3Cl2
+ -1.2 -3.7 8.5 165.0916 C10H13O2
+ 0.3 1.8 4.5 123.0446 C7H7O2
+ 0.4 3.3 4.5 688
38/41
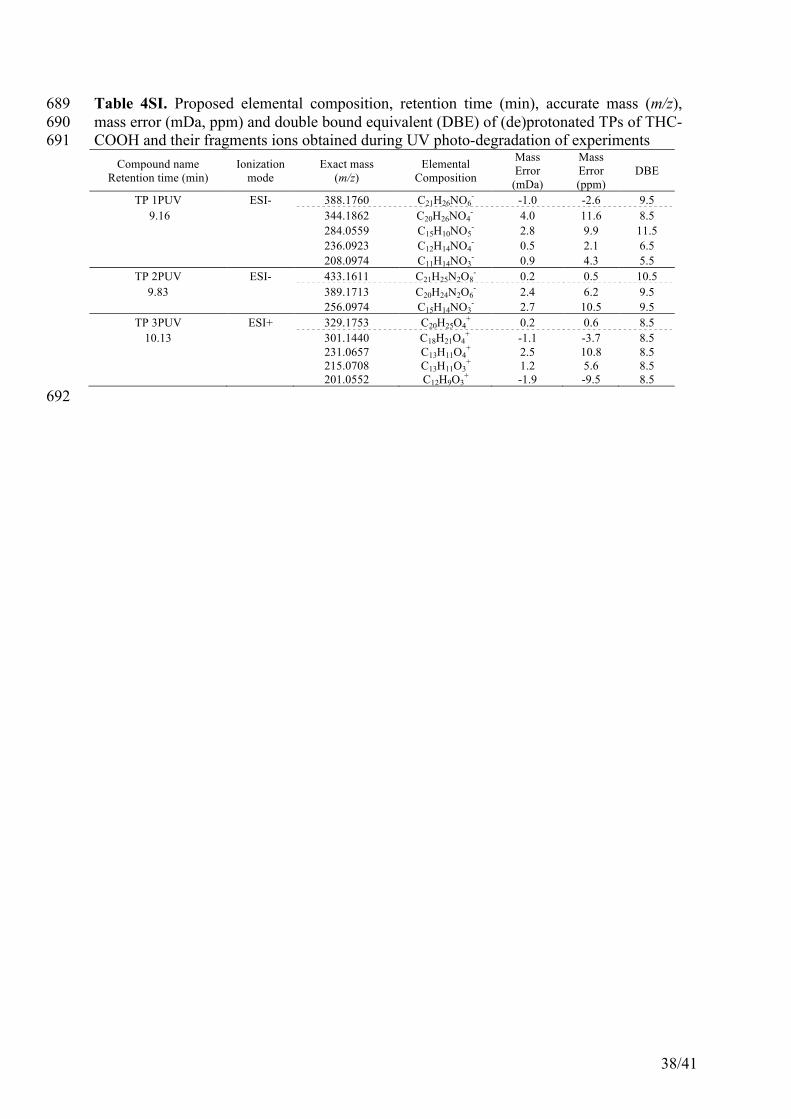
Table 4SI. Proposed elemental composition, retention time (min), accurate mass (m/z), 689 mass error (mDa, ppm) and double bound equivalent (DBE) of (de)protonated TPs of THC-690 COOH and their fragments ions obtained during UV photo-degradation of experiments 691
Compound name Retention time (min)
Ionization mode
Exact mass (m/z)
Elemental Composition
Mass Error
(mDa)
Mass Error (ppm)
DBE
TP 1PUV ESI- 388.1760 C21H26NO6- -1.0 -2.6 9.5
9.16 344.1862 C20H26NO4- 4.0 11.6 8.5
284.0559 C15H10NO5- 2.8 9.9 11.5
236.0923 C12H14NO4- 0.5 2.1 6.5
208.0974 C11H14NO3- 0.9 4.3 5.5
TP 2PUV ESI- 433.1611 C21H25N2O8- 0.2 0.5 10.5
9.83 389.1713 C20H24N2O6- 2.4 6.2 9.5
256.0974 C15H14NO3- 2.7 10.5 9.5
TP 3PUV ESI+ 329.1753 C20H25O4+ 0.2 0.6 8.5
10.13 301.1440 C18H21O4+
-1.1 -3.7 8.5 231.0657 C13H11O4
+ 2.5 10.8 8.5 215.0708 C13H11O3
+ 1.2 5.6 8.5 201.0552 C12H9O3
+ -1.9 -9.5 8.5 692

39/41
Table 5SI. Proposed elemental composition, retention time (min), accurate mass (m/z), mass 693 error (mDa, ppm) and double bound equivalent (DBE) of (de)protonated TPs of THC-COOH 694 and their fragments ions obtained during sunlight photo-degradation experiments 695
Compound name Retention time (min)
Ionization mode
Exact mass (m/z)
Elemental composition
Mass Error
(mDa)
Mass Error (ppm)
DBE
TP 1PS ESI- 185.0814 C9H13O4- -0.9 -4.9 3.5
5.83 371.1706 C18H27O8- 1.1 3.0 5.5
141.0921 C8H13O2- -0.5 -3.5 2.5
TP 2PS ESI- 187.0970 C9H15O4- -1.4 -7.5 2.5
6.52 375.2019 C18H31O8- 1.8 4.8 3.5
169.0865 C9H11O3- 2.2 13.0 3.5
143.1069 C8H15O2- 0.3 2.1 1.5
125.0966 C8H11O- 2.4 19.2 2.5 TP 3PS ESI+ 365.1964 C20H29O6
+ 0.5 1.4 6.5 7.45 347.1858 C20H27O5
+ 0.8 2.3 7.5 329.1753 C20H25O4
+ 1.8 5.5 8.5 319.1910 C19H27O4
+ 2.0 6.3 6.5 301.1804 C19H25O3
+ 0.6 2.0 7.5 283.1698 C19H23O2
+ 1.1 3.9 8.5 213.1279 C15H17O+ -0.9 -4.2 7.5 199.1123 C14H15O+ -1.7 -8.5 7.5 ESI- 363.1808 C20H27O6
- 0.5 1.4 7.5 319.1909 C19H27O4
- -0.3 -0.9 6.5 275.2011 C18H27O2
- 1.7 6.2 5.5 223.0970 C12H15O4
- -3.7 -16.6 5.5 191.1072 C12H15O2
- 0.2 1.0 5.5 TP 4PS ESI+ 363.1808 C20H27O6
+ 1.6 4.4 7.5 8.06 265.1076 C14H17O5
+ 0.4 1.5 6.5 247.0970 C14H15O4
+ 0.4 1.6 7.5 229.0865 C14H13O3
+ -0.3 -1.3 8.5 205.0865 C12H13O3
+ -1.7 -8.3 6.5 187.0759 C12H11O2
+ -1.2 -6.4 7.5 179.1072 C11H15O2
+ -1.2 -6.7 4.5 159.0810 C11H11O+ -1.2 -7.5 6.5 99.0810 C6H11O+ 0.0 0.0 1.5 ESI- 361.1651 C20H25O6
- 1.2 3.3 8.5 343.1545 C20H23O5
- 2.5 7.3 8.5 299.1647 C19H23O3
- -0.7 -2.3 8.5 243.0657 C14H11O4
- -7.7 -31.7 9.5 221.0814 C12H13O4
- 0.6 2.7 6.5 177.0916 C11H13O2
- 1.0 5.6 5.5 139.0759 C8H11O2
- -5.7 -41.0 3.5 119.0497 C8H8O- -7.7 -64.7 1.5
TP 5-6PS ESI+ 377.1964 C21H29O6+ -1.4 -3.7 7.5
8.64 - 8.80 359.1858 C21H27O5+
-0.3 -0.8 8.5 331.1909 C20H27O4
+ 0.2 0.6 7.5
313.1804 C20H25O3+ -1.0 -3.2 8.5
285.1855 C19H25O2+ -1.7 -6.0 7.5
243.1385 C16H19O2+ -1.5 -6.2 7.5
ESI- 375.1808 C21H27O6- 2.2 5.9 8.5
331.1909 C20H27O4- -2.5 -7.5 7.5
287.2011 C19H27O2- -4.8 -16.7 6.5
161.0603 C10H9O2- -7.3 -45.3 6.5
TP 7PS ESI+ 395.2070 C21H31O7+ 0.2 0.5 6.5
8.56 377.1964 C21H29O6+ 3.2 8.5 7.5
359.1858 C21H27O5+ -1.6 -4.5 8.5
331.1910 C20H27O4+ 0.1 0.3 7.5
313.1804 C20H25O3+ 0.9 2.9 8.5
285.1855 C19H25O2+ -0.4 -1.4 7.5
243.1385 C16H19O2+ 0.2 0.8 8.5
187.6759 C12H11O2+ 1.1 5.9 7.5

40/41
Table 6SI. MS/MS parameters selected for analysis of TTPs by QqQ MS 696 Ionization Retention Parent Product CEa Product aCE Ion ratio
mode time (min) compound ion 1(Q) (eV) ion 2 (q) (eV) Q/q
THC-COOH ESI + 9.86 345.0 327.3 15 299.3 20 1.6
ESI - 343.2 299.2 20 245.2 20 19.8b
Hydrolysis TP 1H ESI + 8.80 331.2 175.1 20 231.1 20 16.4
Chlorination TP 1C ESI - 6.17 167.1 167.1c 5 95.1 20 25.1
TP 2C ESI - 6.43 395.1 315.2 20 253.2 20 2.6
TP 3C ESI - 7.80 477.1 361.2 20 231.1 20 8.8
TP 4C ESI - 7.75 481.1 199.1 20 427.1 20 >100
TP 5C ESI + 10.40 481.1 277.0 20 315.0 20 1.7
ESI - 479.0 399.1 20 363.1 20 1.0
TP 6C ESI + 10.30 499.0 375.0 20 395.1 20 2.8
ESI - 497.0 461.1 20 381.1 20 0.8
TP 7C ESI + 10.68 513.1 375.0 20 395.1 20 10.7
ESI - 511.1 395.1 20 375.0 20 2.7
TP 8C ESI + 10.71 447.1 393.1 20 123.0 20 1.2
Photo-degradation UV
TP 1PUV ESI - 9.16 388.1 236.1 20 284.1 20 -
TP 2PUV ESI - 9.83 433.2 389.2 20 256.1 20 -
TP 3PUV ESI + 10.13 329.2 231.1 20 215.1 20 -
Photo-degradation Sunlight
TP 1PS ESI - 5.84 185.1 185.1c 10 141.1 20 5.2
TP 2PS ESI - 6.68 187.1 187.1c 10 143.1 20 7.8
TP 3PS ESI + 7.53 365.2 283.2 20 301.2 20 3.8
ESI - 363.2 319.2 20 275.2 20 1.5
TP 4PS ESI + 8.18 363.1 247.1 20 265.1 20 4.3
ESI - 361.2 177.1 20 221.1 20 2.3
TP 5PS ESI + 8.68 377.2 313.2 20 285.2 20 1.5
ESI - 331.2 287.2 20 161.1 20 90.9
TP 6PS ESI + 8.84 377.2 313.2 20 285.2 20 1.5
ESI - 331.2 287.2 20 161.1 20 68.4
TP 7PS ESI + 8.64 395.2 313.2 20 285.1 20 58.0 a CE: collision energy 697 b Underlined ion ratios are above 10. These transitions are difficult to observe in the samples due to the 698
low abundance of the product ion 2. In these cases, compliance of Q/q ratio in the samples is rather 699 problematic 700 c Pseudo MS/MS transition 701 b Fo702
41/41
703 a For TP 2C, main fragment at m/z 315.1596 was more sensitive than the deprotonated molecule (m/z 459.1422) 704 bFor TP 3C, main fragment at m/z 397.1418 was more sensitive than the deprotonated molecule (m/z 477.1083) 705 706 Figure 2SI. nw-XICs for the (de)protonated TP molecule and suggested elemental composition obtained. Chlorination experiments after (a) 5 707
minutes and (b) 33 hours 708
709
References 710
Bijlsma, L., Sancho, J.V., Hernández, F., Niessen, W.M.A., 2011. Fragmentation pathways of drugs of abuse and their metabolites based on 711 QTOF MS/MS and MSE accurate-mass spectra. J. Mass Spectrom. 46, 865-875. 712
713
SW 1ppm THCCOOH (T_33 hores) 200uL NaOCl (1%)
Time6.00 6.50 7.00 7.50 8.00
%
0
100
6.00 6.50 7.00 7.50 8.00
%
0
100
6.00 6.50 7.00 7.50 8.00
%
0
100
6.00 6.50 7.00 7.50 8.00
%
0
100THCl0135 Sm (Mn, 2x3) 1: TOF MS ES-
167.071 0.02Da151
Area
6.1616
THCl0135 Sm (Mn, 2x3) 1: TOF MS ES- 315.16 0.02Da
209Area
7.1322
THCl0135 Sm (Mn, 2x3) 1: TOF MS ES- 397.142 0.02Da
114Area
7.4212
THCl0135 Sm (Mn, 2x3) 1: TOF MS ES- 481.103 0.02Da
58.5Area
7.566
SW 1ppm THCCOOH (T_5min) 400uL NaOCl (1%)
Time9.00 10.00 11.00 12.00
%
0
100
9.00 10.00 11.00 12.00
%
0
100
9.00 10.00 11.00 12.00
%
0
100
9.00 10.00 11.00 12.00
%
0
100THCl0118 Sm (Mn, 2x3) 1: TOF MS ES+
481.051 0.02Da810
Area
10.2990
THCl0118 Sm (Mn, 2x3) 1: TOF MS ES+ 499.061 0.02Da
787Area
10.34113
THCl0118 Sm (Mn, 2x3) 1: TOF MS ES+ 513.077 0.02Da
383Area
10.5848
THCl0118 Sm (Mn, 2x3) 1: TOF MS ES+ 447.09 0.02Da
522Area
10.7260
O CH3
O OH
OH
H3C
H3C
TP 1CC9H11O3
-
aTP 2CC21H28O9Cl-
TP 4CC20H27O9Cl2-
TP 5CC21H25O4Cl4+
TP 6CC21H27O5Cl4+
TP 7CC22H29O5Cl4+
TP 8CC21H26O4Cl3+
THC-COOHC21H29O4
+
C21H27O4-
ESI-
ESI-
ESI-ESI+
ESI+/-
ESI+/-
ESI+/-
+Cl, +5OH
bTP 3CC21H27O8Cl2-
-CH3, +2Cl, +5OH
+2Cl, +4OH
+4Cl
+CH3, +4Cl +OH
+3Cl
33 hours with NaOCl 5 minutes with NaOCl
-C12H16O
+4Cl, +OH
ESI-
a b


![Título artículo / Títol article - COnnecting REpositories · Título artículo / Títol article: ... [5, 6]. “Design intent” is the reasoning behind decisions related to particular](https://img.pdfslide.us/doc/110x75/5e5b7b1601a9590dd52b3338/ttulo-artculo-ttol-article-connecting-repositories-ttulo-artculo-.jpg)