Embed Size (px)
Citation preview
TITLE: ACCOUNTING FOR GROWTH IN POST-SOVIET RUSSI A
AUTHORS : DANIEL BERKOWITZ and DAVID N. DEJONGUniversity of Pittsburgh
THE NATIONAL COUNCIL FO REURASIAN AND EAST EUROPEAN RESEARC H
TITLE VIII PROGRAM
1755 Massachusetts Avenue, N .W .Washington, D .C . 20036
LEGAL NOTICE
The Government of the District of Columbia has certified an amendment of th eArticles of Incorporation of the National Council for Soviet and East EuropeanResearch changing the name of the Corporation to THE NATIONAL COUNCIL FOREURASIAN AND EAST EUROPEAN RESEARCH, effective on June 9, 1997. Grants,contracts and all other legal engagements of and with the Corporation made unde rits former name are unaffected and remain in force unless/until modified in writin gby the parties thereto .
PROJECT INFORMATION : 1
CONTRACTOR :
PRINCIPAL INVESTIGATOR :
COUNCIL CONTRACT NUMBER :
DATE :
COPYRIGHT INFORMATION
Individual researchers retain the copyright on their work products derived from researc hfunded by contract with the National Council for Eurasian and East European Research .However, the Council and the United States Government have the right to duplicate an ddisseminate, in written and electronic form, this Report submitted to the Council under thisContract, as follows : Such dissemination may be made by the Council solely (a) for its owninternal use, and (b) to the United States Government (1) for its own internal use ; (2) forfurther dissemination to domestic, international and foreign governments, entities an dindividuals to serve official United States Government purposes ; and (3) for dissemination inaccordance with the Freedom of Information Act or other law or policy of the United State sGovernment granting the public rights of access to documents held by the United State sGovernment . Neither the Council, nor the United States Government, nor any recipient of thi sReport by reason of such dissemination, may use this Report for commercial sale .
1 The work leading to this report was supported in part by contract funds provided by the Nationa lCouncil for Eurasian and East European Research, made available by the U. S. Department of State under TitleVIII (the Soviet-Eastern European Research and Training Act of 1983, as amended) . The analysis andinterpretations contained in the report are those of the author(s) .
University of Pittsburg h
Daniel Berkowit z
811-1 2
January 30, 1998

CONTENTS
Abstract 1
Introduction 2
The Model and Data 4
Empirical Results 6
Robustness 9
Conclusion 1 1
References 1 2
Appendix 1 4
Table 1 1 9
Figure 1 20
Figure 2 21


Accounting for Growth in Post-Soviet Russia
Daniel Berkowitz and David N . DeJong1
Department of Economics; University of Pittsburgh ; Pittsburgh, PA 1526 0
dmberk+@pitt .edu; dejong+@,pitt .edu
Abstract
In pursuit of its transition from a command to a market economy, post-Soviet Russia ha s
witnessed enormous regional differences in economic growth rates . Moreover, the economic
reforms implemented under this transition, while initiated at the federal level, have also differe d
markedly across regions, as regional governments have had considerable discretion over th e
implementation of reform policies in their jurisdictions . We exploit these differences in analyzin g
whether regional differences in reform policies can account for regional differences in growt h
rates, and conclude that to a considerable degree, they can. Most notably, we find that re gional -
government privatization initiatives and regional-government initiatives to gain control over thei r
capital stock (e .g . plants, equipment, machinery and social infrastructure) have had a significan t
impact on the formation of new legal enterprises, which in turn has had a significant impact o n
economic growth .
' Acknowledgments : We thank Anders Aslund, Eduard Baranov, Gleb Bylov, Lev Freinkman, Yelen aBorisovna Frolova, Clifford Gaddy, Evgeny Gavrilenkov, Timothy Heleniak, Alastair McAuley , Randi Susa nRyterman and especially Nina Chebotarieva for their help with the data used in this study . We also thank, fo rmany useful discussions Patty Beeson, Olivier Blanchard, Martha de Melo, Richard Ericson, Roger Gordon . Joh nHam, Hide Ichimura, Peter Murrell, Thomas Rawski, Jean-Francois Richard . Thomas Richardson, Andre iShleifer, Lara Shore-Sheppard, Rick Tannery, and Werner Troesken . We are particularly grateful to Steve nHusted and Alexei Lavrov for their input . Berkowitz is indebted to the National Council for Soviet and Eas tEuropean Studies for financial support under contracts #807-09 and #811-12 and to the University Center fo rInternational Studies and the Center for Russian and East European Studies at the University of Pittsburgh . DeJonggratefully acknowledges financial support provided by the NSF under grant SBR- 9422828 . The usual caveatapplies .
1


Accounting for Growth in Post-Soviet Russia
Daniel Berkowitz and David N. DeJong
1 . Introduction
In pursuit of its transition from a command to a market economy, post-Soviet Russia ha s
witnessed enormous regional differences in economic growth rates . During the period 1993 :IV
through 1996 :IV, average annual growth rates in real per capita income ranged from -22 percent
to 17 .3 percent across the 47 regions examined in this study . The average annual growth rat e
across these regions was negative 6 .7 percent, with a standard deviation 7 .6 percent .' Figure l a
illustrates this disparity by plotting annual growth rates against real per capita income measured i n
1993 :IV; the correlation between these initial conditions and subsequent growth rates is a modes t
23 percent, and the wide range of combinations of these variables is striking .
Over this same period, the economic reforms implemented under Russia's transition, whil e
initiated at the federal level, have also differed markedly across regions : regional governments have ha d
considerable discretion over the implementation of reform policies in their districts, and have pursued a
wide range of policy packages . For example, the Nizhni Novgorod oblast rapidly privatized it s
enterprises and shops during this period, but had a mediocre record in relaxing price controls ; the
opposite was true in the Tomsk oblast . And, while the Republic of Tatarstan bargained aggressivel y
with federal authorities to gain control over the capital stock within its territory (e .g. plants, machinery ,
equipment and social infrastructure), it moved slowly on price liberalization and privatization . We
exploit these differences in analyzing whether regional differences in reform policies can account fo r
regional differences in growth rates, and conclude that to a considerable degree, they can . Most
notably, we find that regional-government privatization initiatives and regional-government initiatives t o
gain control over their capital stock (referred to hereafter as control initiatives) have had a significan t
impact on the formation of new legal enterprises, which in turn has had a significant impact (bot h
statistically and economically) on economic growth .
We reach this conclusion by specifying and estimating a baseline structural model in whic h
regional economic growth is a function of initial real per capita income levels, industrial characteristics ,
employment in the defense industry (which, as shown by Gaddy (1996), remained relatively stable
during this turbulent transitional period) and new-legal-enterprise formation .' In turn, the establishment
of new enterprises is modeled as a function of initial income levels and a group of regional-governmen t
policy variables that includes measures of privatization, price liberalization, control initiatives, and ta x
'The data we analyze are introduced in Section 2 . and are described in detail in the appendix . Theaverage annual growth rate of real aggregate per capita income in Russia during this period was -2 .32 percent.
' New legal enterprises come from two sources : startups, and privatized state enterprises . A singl eprivatized state enterprise often generates multiple new legal enterprises via spin-offs .
2

rates .
Our motivation in adopting our baseline model comes from empirical work by Berg (1994) ,
Benacek (1995), Johnson and Loveman (1995), Aslund (1997), and Frye and Shleifer (1997) ;
theoretical work on new enterprises by Kornai (1992), Murrell and Wang (1993), McMillan (1996) ,
Blanchard (1997), Blanchard and Kremer (1997), and Berkowitz and Cooper (1997) ; and theoretica l
work on decentralization in transition economies by Shleifer and Vishny (1993) and Berkowitz and L i
(1997) . The empirical work, consisting primarily of survey information and anecdotal evidence, suggest s
that the rapid development of new legal enterprises has contributed significantly to Poland's economi c
success .
The theoretical work on new enterprises predicts that new enterprises enhance growth becaus e
they are more efficient and more responsive to demand than state enterprises and privatized-former-
-state enterprises . In addition, by providing expanded employment opportunities, new enterprises better
enable politicians to implement efficiency reforms (such as hardening state-sector budget constraints )
that reduce state-sector employment without losing the political support of their constituenc y
(Blanchard (1997)) . 4
Finally, the theoretical work on decentralization predicts that new-enterprise formation an d
production is enhanced when regional governments have significant control over their capital stocks . '
Pre-transition, regional governments in Russia had little control over their capital stocks, as majo r
enterprises were under the jurisdiction of the federal government and its ministries . During th e
transition, lower levels of government (provincial, city, township, etc .) competed with each other, th e
federation, enterprise managers, ministerial officials and financial groups for control over majo r
enterprises because they provided key sources of tax revenue, employment and public goods an d
services . Because decentralization has been rapid and chaotic, federal governments, regulatory organ s
and the different regional governments have often had overlapping claims to cash flows, outputs an d
resources of the same enterprises . Since it is difficult for these many agencies to coordinate policy, th e
resulting tax and regulatory system has in many cases become non-transparent and burdensome, thu s
discouraging investment and encouraging enterprises to evade formal tax and regulatory obligation s
(Hendley et al . (1997) and Ickes et al . (1997)) . However, those regional governments that gained
substantial control over their capital stocks are in theory better-positioned to develop tax and regulatory
environments that encourage the development of new enterprises .
Our baseline model provides empirical support for these theoretical predictions : as noted above ,
regional control initiatives, along with privatization initiatives, have had a significant impact on th e
4 Other theoretical work regarding new enterprises, notably by Aghion, Blanchard and Burgess (1994) ,
and Friedman and Johnson (1995), predicts that the rapid development of new private enterprises may have a mor elimited impact on economic growth . These competing predictions are testable within the framework of our model .
' Stoner-Weiss (1997) makes this point for the effectiveness of political action in Russia .
3

formation of new legal enterprises, which in turn have had a significant impact on economic growth .
This baseline model restricts the impact of economic reforms on growth to be indirect, channele d
exclusively through a direct impact on the development of new legal enterprises . Implicit in thi s
specification is the notion that the reform initiatives we measure have had a negligible impact on growt h
through their impact on the productivity of existing enterprises, both private and state-owned . We find
no evidence against this restriction in the data we analyze . We also find no evidence against th e
exclusion of economic growth as an explanatory variable for new-legal-enterprise development .
Moreover, we find no evidence of simultaneity between growth and new-legal-enterprise development ,
suggesting the absence of feedback between these variables, and a negligible joint impact on thes e
variables of variables not included in our analysis . Finally, we find our main results to be robust to a
wide range of alternative specifications of our baseline model, and to alternative measures of th e
variables examined in our study .
Recent empirical work on transition in the Former Soviet Union and Eastern Europe ha s
analyzed explanations for the enormous divergence in economic growth across national boundaries .
Several studies have emphasized the importance of stabilization (see Aslund, Boone and Johnso n
(1996) ; de Melo, Denizer and Gelb (1996) ; Fisher, Sahay and Vegh (1996) ; Sachs and Warner (1996)
and Sachs (1997)) and other liberalization policies (see de Melo and Gelb (1996) and Selowsky and
Martin (1997)) . Other studies have emphasized pre-transition initial conditions (Blanchard and Kreme r
(1997)) ; De Melo, Denizer, Gelb and Tenev (1997)) . Finally, Johnson, Kaufmann and Shleifer (1997 )
have emphasized the role of public finances and corruption. To our knowledge, our study is the firs t
formal attempt to analyze connections between subnational policies, initial conditions and economi c
growth within a nation .
In outlining our findings, we first introduce the baseline model and briefly describe our data . We
then present our estimates of the model, investigate their robustness and conclude with a brief summary .
2 . The Model and Data
The baseline model we consider is a simple structural relationship in which regional economic -
reform policies are modeled as having an impact on the growth of real per capita income only throug h
their influence on the establishment of new legal enterprises . Growth is also modeled as depending o n
initial income levels, regional industrial characteristics, and regional employment in the defense industry .
We have data on three types of regionally initiated economic-reform policies : privatization, price-
liberalization, and control initiatives . We quantify privatization initiatives using two separate variables :
an index of the extent of overall small-scale privatization within the region ; and a measure of the share
of privatized enterprises that were previously operated by city level governments (as opposed to th e
provincial or federal government) . We use indexes to quantify regional price-liberalization and contro l
initiatives. In addition, we have data on average regional tax rates, which we include as a potentia l
4

explanatory variable for new-legal-enterprise formation .
While we have time-varying data on growth, tax rates, and privatization initiatives, we lac
k time-varying measures of the remaining variables; hence we are restricted to a cross-sectional analysis . (The
time-varying data are combined by simple averaging .) The baseline cross-sectional regression model w e
analyze is as follows :
Definitions of the variables are as follows (as noted above, detailed definitions, alternative measures ,
and sources of these variables are provided in the appendix) :
GROWTH: average annual growth rate of real per capita income, 1993 :IV - 1996:IV;
INITIAL :
ratio of per capita money income to the cost of a bundle of 19 basic food goods .
1993 :IV;
IO: value added of tradable-goods sectors in 1985 per employed worker, net of labor costs,
calculated using world market prices ;
DEFENSE: number of workers employed in the defense industry in 1985 per thousand employe d
workers, as measured by Gaddy (1996) ;
NEWENT :
number of new legal enterprises (as proxied by the number of legally registered smal l
privately owned enterprises) per thousand inhabitants as of January 1, 1996 ;
TPRIV :
index measuring the speed of regionally initiated (small-scale) privatization as of July 1 ,
1996, measured on a uniform scale of 1 (fastest), 0 .8, . . ., 0 .2 (slowest) ;
LPRIV :
the share of privatizations during 1993, 1994 and 1995 that were initiated by the loca l
(as opposed to provincial and federal) government ;
PRICE : index measuring the extent of regionally initiated price liberalization based on a capital-
-city level survey of a 73-good food basket conducted in October 1995, measured on a
uniform scale of I (most liberal) to 1/47 (most regulated) ;
CONTROL : an index compiled in January 1995 of regional-government control of its capital, base d
on the share of buildings, equipment, machinery and social infrastructure valued a t
internal prices that is owned by the region . The other potential owners are federa l
authorities, private companies (including foreigners), non-profit organizations, and
citizens; the index is measured on a uniform scale of I (best), 0 .8, . . ., 0 .2 (worst) ;
TAX :
average regional tax rate, measured by regional revenues net of transfers divided by
annual overall money income. This measure is based on money income and budgetary
revenue data for 1994 and 1995 .
The variables INITIAL, IO and DEFENSE are included in (1) to capture initial conditions that

may have independent effects on GROWTH . INITIAL obviously characterizes the initial prosperity o f
the region. IO is meant to characterize the basic industrial structure of the region prior to transition : a
high value indicates the regional presence of relatively competitive industries (e .g., oil and gas
production) . A priori, we expected this variable to be positively associated with GROWTH . Finally,
given Gaddy's (1996) study, we expected DEFENSE to have a positive impact on GROWTH, given th e
relative stability of this industry in an otherwise turbulent economic environment .
With the exception of TAX, the policy variables were constructed to be increasing in the degree
of liberalization they entail, thus we expected each of these variables to have a positive impact o n
NEWENT . Higher values for TAX of course reflect higher regional tax burdens, thus we expected thi s
variable to have a negative impact on NEWENT . Finally, given the theoretical work cited above, w e
expected NEWENT to have a positive impact on GROWTH, but GROWTH to have no significan t
impact on NEWENT .
Figure 2a illustrates the baseline model given expected signs on the model coefficients . The
segment GROWTH shows that the growth rate, ceteris paribus, is increasing in NEWENT; the
segment NEWENT shows that, ceteris paribus, new-legal-enterprise formation is independent o f
growth. The two segments uniquely intersect and determine the number of new enterprises and th e
growth rate (point A). Figure 2b illustrates the impact of an increase in TPRIV, which increase s
NEWENT, and hence GROWTH : the economy moves from point A to point B . Improvements in th e
other policy variables (i .e, an increase in LPRIV, PRICE and CONTROL, and a decrease in TAX) hav e
the same qualitative effect . Finally, Figure 2c shows that a higher value of INITIAL translates int o
higher values of both NEWENT and GROWTH : the economy moves from point A to point C .
There are two important exclusion restrictions embodied in the baseline model . First, the policy
variables are excluded from the growth equation : their impact is restricted to be indirect, comin g
exclusively through their influence on NEWENT . Second, GROWTH is excluded from the NEWEN T
equation . We now turn to our analysis of the baseline model . We then evaluate the empirical validity of
these restrictions, and examine the robustness of our results to several additional modifications of th e
baseline model .
3. Empirical Result s
Our empirical evaluation of the baseline model was conducted using standard regressio n
analysis . Given concerns regarding potential simultaneity between growth and new enterpris e
formation, we estimated the model initially using two-stage least squares (2SLS) . In the first stage, we
regressed NEWENT on each of the variables included in (2), as well as IO and DEFENSE, and the n
used the instrumented version of NEWENT in estimating (1) . An indication of the quality of thes e
instruments is given in Table 1, which reports correlations between the variables included in the baselin e
model .
6

With the exception of LPRIV, the economic-reform variables included in (2) have highe r
degrees of correlation with NEWENT than with GROWTH. Also, the reform variables are quite
weakly correlated amongst themselves, supporting our observation that the regional government s
included in our sample have implemented markedly different reform packages . Taken together, these
correlation patterns suggest that the potential explanatory power of the reform variables for NEWEN T
is quite good. Moreover, the high correlation between NEWENT and GROWTH (0 .628) also bode s
well for the baseline model (a scatter plot of NEWENT and GROWTH is presented in Figure lb) .
The results of our 2SLS regressions are as follows :
Dependent Variable: NEWENT R2 :
0 .507 Rbar2 : 0.403
Explanatory Variables Coefficient t statistic p value
Constant -6.02 -2 .07 0 .045
INITIAL 1 .54 3 .87 0 .000
TPRIV 4.14 2.79 0 .008
LPRIV 4 .73 1 .84 0.074
PRICE 1 .04 0.88 0.38 5
CONTROL 2 .72 2 .01 0.05 1
TAX -0 .05 -0 .66 0.51 0
IO -0.001 -0 .02 0.98 1
DEFENSE 0.002 0 .09 0 .93 3
Dependent Variable : GROWTH
Explanatory Variables Coefficient t statistic p value
Constant -17.302 -4.611 0.000
INITIAL 0.461 0.309 0.759
IO 0.052 0.831 0.41 1
DEFENSE 0.133 1 .927 0.06 1
NEWENT 1 .300 2 .074 0 .044
Following this regression, we reestimated the GROWTH equation using OLS, and tested th e
equivalence of the 2SLS and OLS regression coefficients using Hausman's (1978) specification test .
This enabled us to check for simultaneity between GROWTH and NEWENT, either due to feedback o r
the omission of variables that have a joint impact on GROWTH and NEWENT . We obtained a tes t
statistic of 1 .30; the asymptotic distribution of this statistic is x2(5), implying a p value of 0 .94. We
also tested the equivalence of the 2SLS and OLS coefficients on NEWENT exclusively . This also
7
yielded a test statistic of 1 .30; the asymptotic distribution of this statistic is χ2(1), implying a p value o f
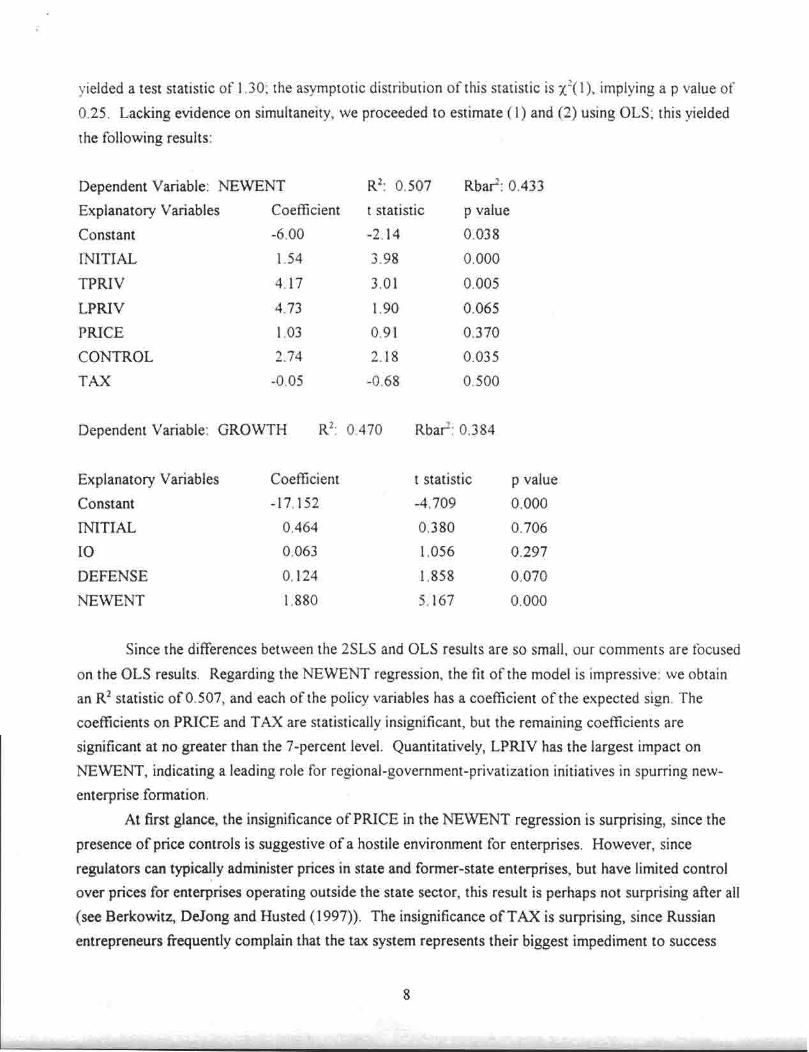
0 .25 . Lacking evidence on simultaneity, we proceeded to estimate (1) and (2) using OLS ; this yielde d
the following results :
Dependent Variable: NEWENT R 2 :
0 .507 Rbar2: 0 .43 3
Explanatory Variables Coefficient t statistic p value
Constant -6.00 -2.14 0.03 8
INITIAL 1 .54 3 .98 0.000
TPRIV 4.17 3 .01 0.005
LPRIV 4 .73 1 .90 0.065
PRICE 1 .03 0.91 0.370
CONTROL 2 .74 2 .18 0.03 5
TAX -0 .05 -0.68 0 .500
Dependent Variable : GROWTH
R2 : 0 .470 Rbar2: 0 .384
Explanatory Variables Coefficient t statistic p value
Constant -17 .152 -4.709 0.000
INITIAL 0 .464 0.380 0 .706
IO 0 .063 1 .056 0 .297
DEFENSE 0 .124 1 .858 0 .070
NEWENT 1 .880 5 .167 0 .000
Since the differences between the 2SLS and OLS results are so small, our comments are focuse d
on the OLS results . Regarding the NEWENT regression, the fit of the model is impressive : we obtain
an R 2 statistic of 0 .507, and each of the policy variables has a coefficient of the expected sign . The
coefficients on PRICE and TAX are statistically insignificant, but the remaining coefficients are
significant at no greater than the 7-percent level . Quantitatively, LPRIV has the largest impact o n
NEWENT, indicating a leading role for regional-government-privatization initiatives in spurring new -
enterprise formation .
At first glance, the insignificance of PRICE in the NEWENT regression is surprising, since th e
presence of price controls is suggestive of a hostile environment for enterprises . However, sinc e
regulators can typically administer prices in state and former-state enterprises, but have limited contro l
over prices for enterprises operating outside the state sector, this result is perhaps not surprising after al l
(see Berkowitz, DeJong and Husted (1997)) . The insignificance of TAX is surprising, since Russian
entrepreneurs frequently complain that the tax system represents their biggest impediment to succes s
8

(see Hendley et al . (1997)) . However, much of this burden is in the form of unreported payment s
demanded by cash-strapped or corrupt government officials (see Frye and Shleifer (1997)) ; the fact that
these payments are not captured in our official budgetary data may account for the insignificance of ou r
measure .
To the extent that CONTROL is a good proxy for a regional government's ability to conduct a n
independent tax policy, the significance of control supports the theoretical work of Shleifer and Vishn y
(1993) and Berkowitz and Li (1997) . When a chaotic decentralization of power results in a de fact o
system in which different levels of government have overlapping control over the same enterprise s
(which are the critical source of tax revenue), predatory behavior among competing tax authorities ca n
result, thus retarding the entry and development of new legal enterprises . Another possible reason for
the significance of CONTROL is that a substantial component of controlled capital stocks is socia l
infrastructure (which includes roads, sewers, bridges, ports and communications facilities) . A regiona l
government that enjoys well-defined control rights has an incentive to maintain or improve its socia l
infrastructure : doing so enables enterprises to operate more efficiently, thus strengthening its regiona l
tax base . This incentive is weakened as the number of agencies with overlapping control right s
increases, since the incremental tax revenue from investment in social infrastructure is typically shared i n
an uncoordinated fashion among competing agencies . Unfortunately, there is no way to determine from
the data the proportion of the capital stock that is comprised by social infrastructure in our measure o f
CONTROL (the other significant component of our measure is state enterprises, which have no obviou s
positive benefits for NEWENT) . Despite the impurity of our measure, it nevertheless has impressive
explanatory power .
Regarding the GROWTH regression, the fit of the model is also quite good : here, we obtain a n
R2 statistic of 0.47 . Surprisingly, neither INITIAL nor 1O have statistically significant coefficients ;
however, the coefficients on DEFENSE and NEWENT are significant both statistically an d
quantitatively. Our estimates indicate that the additional employment in the defense industry of on e
worker per thousand total employed workers corresponds with an additional annual growth rate o f
0.124 percent across regions . And remarkably, the addition of a single new enterprise per thousan d
total inhabitants corresponds with an additional annual growth rate of 1 .88 percent across regions .
4. Robustness
The robustness of the results obtained for the baseline model was evaluated along a variety o f
dimensions . Most importantly, we wished to determine the validity of our exclusion of the polic y
reform variables in the GROWTH equation, and our exclusion of GROWTH in the NEWENT equation .
In so doing, we found no evidence against either restriction . We tested the former exclusion in a variety
of ways . First, using OLS, we regressed GROWTH on the entire set of variables analyzed in this study,
and tested the joint exclusion of the policy reform variables using an F test ; the p value obtained from
9

this test was 0 .21 (the coefficient on NEWENT in this regression was 2 .02, and the t statistic was 5 .0) .
Next, we conducted a sequence of exclusion-restriction tests using 2SLS . This involved modifying th e
GROWTH equation (1) to include all but one of the policy variables, with the remaining variabl e
serving as the lone instrument for NEWENT in (2) . We estimated each of the five possible versions of
this modification of the model (one for each policy variable), and tested the joint exclusion of the polic y
variables included in the GROWTH equation. The smallest p value we obtained among the fiv e
resulting F tests was 0 .34. To test the latter restriction, we estimated a version of the NEWEN T
equation (2) that was modified to include GROWTH as an explanatory variable . Using IO and
DEFENSE as instruments for GROWTH, we estimated this modification of (2) using 2SLS ; the
coefficient on GROWTH we obtained was 0 .01, with a corresponding t statistic of 0 .08 .
The next robustness check we considered involved excluding the insignificant policy variable s
(PRICE and TAX) from the analysis . The primary reason for doing so was to increase the potentia l
power of the exclusion tests just described by increasing degrees of freedom in our regressions . This
modification had virtually no impact on the results obtained using the baseline model, but did reduce th e
p values obtained in the exclusion-restrictions tests, as we expected . Notably, using LPRIV as the lone
instrument for NEWENT, we obtained a p value of 0 .12 in testing the exclusion of TPRIV an d
CONTROL in the modified GROWTH equation . This near rejection is in part attributable to the fac t
that LPRIV is not a particularly good instrument for NEWENT, since its correlation with GROWT H
(0.338) is higher than its correlation with NEWENT (0 .323) . (The p values obtained using TPRIV an d
CONTROL as the lone instruments were 0.17 and 0 .19 .) But even in using LPRIV as the lon e
instrument for NEWENT, we continued to find that NEWENT has a significant impact on GROWTH ,
both economically and statistically : the 2SLS estimate of the coefficient on NEWENT in this case was
3 .68, with a corresponding t statistic of 2 .5 .
We next considered the impact on our results of three modifications of our measure o f
NEWENT . The first modification was motivated by the scatter plot of NEWENT and GROWTH i n
Figure lb : of the five fastest growers in our sample, three localities had the highest values of NEWENT :
Moscow City, St . Petersburg City, and Tyumen oblast . To determine the overall impact of these thre e
localities on our results, we repeated our analysis of the baseline model given their exclusion from ou r
sample; their exclusion had a surprisingly small impact on our results . In particular, our estimate of th e
coefficient on NEWENT in this case is 1 .67, with a corresponding t statistic of 2 .16 : NEWENT
continues to have a significant impact on GROWTH, both statistically and quantitatively . Moreover,
the coefficients on LPRIV, TPRIV and CONTROL continue to be significant in the NEWEN T
equation.
The second modification involved measuring NEWENT as the number of employed workers i n
new enterprises per thousand employed workers (as opposed to the number of new small-scal e
enterprises per thousand inhabitants) . This measure exhibits substantially less correlation wit h
10
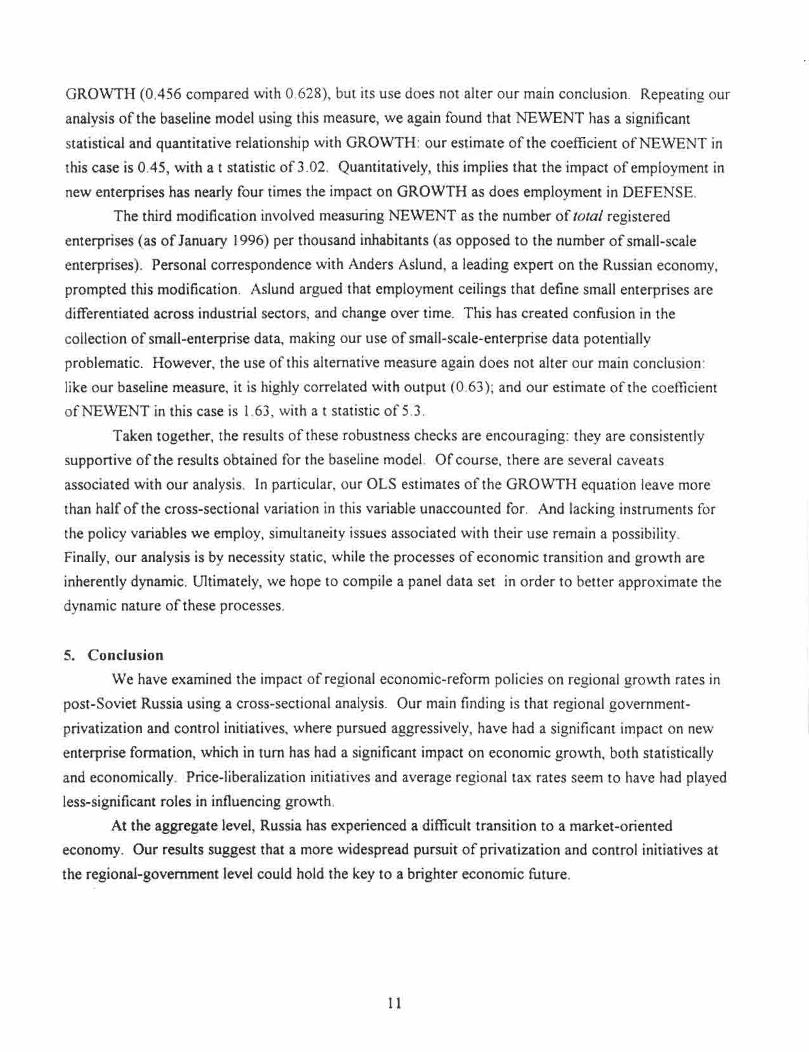
GROWTH (0 .456 compared with 0.628), but its use does not alter our main conclusion . Repeating our
analysis of the baseline model using this measure, we again found that NEWENT has a significant
statistical and quantitative relationship with GROWTH : our estimate of the coefficient of NEWENT i n
this case is 0 .45, with a t statistic of 3 .02 . Quantitatively, this implies that the impact of employment i n
new enterprises has nearly four times the impact on GROWTH as does employment in DEFENSE .
The third modification involved measuring NEWENT as the number of total registered
enterprises (as of January 1996) per thousand inhabitants (as opposed to the number of small-scal e
enterprises) . Personal correspondence with Anders Aslund, a leading expert on the Russian economy ,
prompted this modification . Aslund argued that employment ceilings that define small enterprises ar e
differentiated across industrial sectors, and change over time . This has created confusion in th e
collection of small-enterprise data, making our use of small-scale-enterprise data potentiall y
problematic. However, the use of this alternative measure again does not alter our main conclusion :
like our baseline measure, it is highly correlated with output (0 .63); and our estimate of the coefficien t
of NEWENT in this case is 1 .63, with a t statistic of 5 .3 .
Taken together, the results of these robustness checks are encouraging : they are consistently
supportive of the results obtained for the baseline model . Of course, there are several caveats
associated with our analysis . In particular, our OLS estimates of the GROWTH equation leave more
than half of the cross-sectional variation in this variable unaccounted for . And lacking instruments fo r
the policy variables we employ, simultaneity issues associated with their use remain a possibility .
Finally, our analysis is by necessity static, while the processes of economic transition and growth ar e
inherently dynamic . Ultimately, we hope to compile a panel data set in order to better approximate th e
dynamic nature of these processes .
5 . Conclusio n
We have examined the impact of regional economic-reform policies on regional growth rates i n
post-Soviet Russia using a cross-sectional analysis . Our main finding is that regional government -
privatization and control initiatives, where pursued aggressively, have had a significant impact on ne w
enterprise formation, which in turn has had a significant impact on economic growth, both statistically
and economically . Price-liberalization initiatives and average regional tax rates seem to have had played
less-significant roles in influencing growth .
At the aggregate level, Russia has experienced a difficult transition to a market-oriente d
economy. Our results suggest that a more widespread pursuit of privatization and control initiatives a t
the regional-government level could hold the key to a brighter economic future .
11

REFERENCE S
Aghion, Phillipe, Olivier Blanchard. and Robin Burgess (1994), "The Behavior of State Enterprises in Eastern Europe .
pre-Privatization", European Economic Review 38 : 1327-49 .
Aslund. Anders, Peter Boone and Simon Johnson (1996), "How to Stablilize : Lessons from Post-Communist Countries - .
Brookings Papers on Economic Activity 1 : 217-313 .
Aslund, Anders (1997), "Observations on the Development of Small Private Enterprises in Russia", Post-Sovie t
Geography and Economics 38: 191-206 .
Benacek, Vladimir (1995), "Small Enterprise and Private Entrepreneurship During Transition", Eastern Europea n
Economics, March/April, 33 : 38-75 .
Berg, Andrew (1994), "Does Macroeconomic Reform Cause Structural Adjustments? Lessons from Poland", Journal of
Comparative Economics. 18 : 376-409 .
Berkowitz, Daniel M. and David J . Cooper (1997), "Startups and Transition", William Davidson Institute Working Paper ,
University of Michigan, October.
Berkowitz, Daniel M., David N . DeJong and Steven Husted (1997), "Transition in Russia : It's Happening", Willia m
Davidson Institute Working Paper. University of Michigan, February .
Berkowitz, Daniel M ., and Wei Li (1997), "Decentralization in Transition Economies : A Tragedy of the Commons? "
William Davidson Institute Working Paper . University of Michigan . September .
Blanchard, Olivier (1997), The Economics of Post-Communist Transition . Oxford University Press : London .
Blanchard, Olivier ., and Michael Kremer, (1997), "Disorganization", William Davidson Institute, Working paper an d
forthcoming, the Quarterly Journal of Economics .
de Melo, Martha and Alan Gelb, (1996) "A Comparative Analysis of Twenty-eight Transition Economies in Europe an d
Asia", Post-Soviet Geography and Economics 37 : 265-85 .
de Melo, Martha, Cevdet Denizer and Alan Gelb (1996), "Patterns of Transition from Plan to Market" . World Ban k
Economic Review, September 10(3) : 397-424 .
de Melo, Martha, Cevdet Denizer, Alan Gelb and Stoyan Tenev (1997), "Circumstance and Choice : The Role of Initial
Conditions and Policies in Transition Economies", unpublished paper, the World Bank, August .
European Union's TACIS Program (1996a), Analysis of Tendencies of Russia's Regions : Development in 1992-1995 .
Contract BIS/95/321/057, Moscow . March .
European Union's TACIS Program (1996b), Analysis of Tendencies of Russia's Regions' Development in 1992-1995 :
Typology of regions . conclusions and recommendations . BIS/95/321/057, Moscow, September .
Fisher, Stanley, Ratna Sahay, and Alan Gelb (1996) . "Economies in Transition : The Beginnings o fGrowth", American
Economic Review, May (Papers and Proceedings), 86(2) : 229-33 .
Friedman . Eric .J ., and Simon Johnson (1995), "Complementarities and Optimal Reform", unpublished manuscript ,
Duke University .
Gaddy, Clifford (1996), The Price of the Past, Brookings Institute : Washington, DC .
Goskomstat Rossii (1994a, 1995a, 1996a), Rossiyskiy Statisticheskii Yezhegodnik . Goskomstat Rossii : Moscow .
Goskomstat Rossii (1993, 1994b, 1995b, 1997), Sotsial'noe Ekonomicheskoye Polozhenie Rossii . Goskomstat Rossii :
Moscow .
Goskomstat Rossii (1994c, 1995c, 1996c), Tseny v Rossii . Goskomstat Rossii : Moscow .
Goskomstat Rossii (1996d), Uroven' Zhizni Nasileniya Rossii . Goskomstat Rossii : Moscow.
Hausman, Jerry (1978), "Specification Tests in Econometrics " , Econometrica 46 : 1251-1272 .
Hendley, Kathryn, Barry W . Ickes, Peter Murrell and Randi Ryterman (1997), "Observations on the Use of Law by
Russian Enterprises", Post-Soviet Affairs, 13(1) : 19-41 .
12

Ickes, Barry W., Peter Murrell and Randi Ryterman (1997), "End of the Tunnel? The Effects of Financial Stabilization i n
Russia" , Post-Soviet Affairs 13 (2) : 105-33 .
Johnson, Simon and Gary Loveman (1995), Starting Over After Communism : Entrepreneurship and Economi c
Renewal. Harvard Business School Press : Cambridge ,
Johnson. Simon, Daniel Kaufmann and Andrei Shleifer (1997), "The Unofficial Economy in Transition", forthcomin gin Brookings Papers on Economic Activity .
Keen, Michael and Alastair McAuley (1996), Fiscal Policy and Fiscal Federalism in Russia, Final Report, Prepared for th e
DGXXI of the European Commission under Contract XXI/95/CB-2028, October ,
Kornai, Janos (1992), The Socialist System : The Political Economy of Communism . Princeton University Press : Princeton .
Lavrov . Alexei, (1996), Economic Policies of the Subjects of the Russian Federation, World Bank (Moscow) report .
McMillan, John (1996), "Markets in Transition", in David M . Kreps and Kenneth Wallis, editors . Advances in
Economics and Econometrics : Theory and Applications. Cambridge University Press : Cambridge ,
Murrell, Peter and Yijang Wang (1993), "When Privatization Should be Delayed : The Effect of Communist Legacies o n
Organizational and Institutional Reforms", Journal ofComparative Economics, 17 : 385-406 .
Sachs, Jeffrey D. and Andrew M . Warner (1996), "Achieving Rapid Growth in The Transition Economies of Centra l
Europe", Stockholm Institute of East European Economics, Working Paper 116, November .
Sachs, Jeffrey D, (1997), "The Transition at Mid Decade",American Economic Review, May (Papers and Proceedings) ,
86(2) : 128-33 .
Selowsky, Marcelo and Ricardo Martin (1997), "Policy Performance and Output Growth in Transition Economies" ,
American Economic Review, May (Papers and Proceedings), 87(2) : 349-53 .
Senik-Leygonie, Claudia and Gordon Hughes (1992), Industrial Profitability and Trade Among the Former Sovie t
Republics, Economic Policy (15), October : 354-386 .
Shleifer, Andrei and Robert Vishny (1993), "Corruption", Quarterly Journal of Economics, 108 : 599-618 .
Stoner-Weiss, Kathryn (1997), Local Heroes: Political Exchange and Government Performance in Provincial Russia.
Princeton University Press : Princeton .
13

Appendix
In order to measure regional income growth, reform policies, and initial conditions, we hav e
collected a data set that includes capital cities and their provinces taken from all eleven of Russia' s
geographic territories . Price-liberalization and purchasing-power measures are collected at the cit y
level ; all other data are collected at the provincial (i .e,, oblast, republic or krai) level . Since we wished
to use both city level and provincial data, we limited the sample to forty-five provinces in which th e
capital city comprises at least thirty percent of the total provincial population, We also included th e
cities of Moscow and St . Petersburg, which themselves comprise entire provinces . Throughout thi s
appendix and the text, the 47 data units we analyze are referred to as regions . The capital city ,
province, and geographic territory for each region are as follows :
Capital City
Petrozavodsk
Murmansk
St . Petersburg Cit y
Kaliningra d
Novgorod
Bryansk
Ivarovo
Kaluga
Kostroma
Moscow City
Oryo l
Ryazan
Smolens k
Tula
Yaroslav l
Yoshkar
Saransk
Cheboksary
Kirov
Nizhniy Novgorod
Voronezh
Kursk
Lipetsk
Kazan
Astrakhan
Oryol oblast
Ryazan oblas t
Smolensk oblast
Tula oblast
Yaroslavl oblast
Mariy-El Republic
Volga-Vyatka
Mordovian Republic
Chuvash Republi c
Kirov oblast
Nizhniy Novgorod oblast
Voronezh oblast
Central Black-Eart h
Kursk oblas t
Lipetsk oblast
Tatarstan oblast
Volga Region
Astrakhan oblast
Province
Geographic Territory
Karelian Republic
Northern
Murmansk oblast
Northwestern
Kaliningrad oblas t
Novgorod oblas t
Bryansk oblast
Central
Ivanovo oblas t
Kaluga oblast
Kostroma oblast
14

Volgograd
Penza
Samara
Saratov
Ulyanovsk
Maykop
Nalchik
Vladikavkaz
Izhevsk
Kurgan
Perm
Yekaterinburg
Chelyabins k
Novosibirsk
Omsk
Tomsk
Tyumen
Ulan Ude
Vladivostock
Khabarovsk
Petropavlovsk-Kamchatk a
Magadan
Volgograd oblast
Penza oblast
Samara oblast
Saratov oblas t
Ulyanovsk oblast
Adygey Republic
North Caucasus
Kabardin Balkar Republi c
North Osetian Republic
Udmurt Republic
Urals
Kurgan oblas t
Perm oblast
Sverdlovsk
Chelyabinsk oblas t
Novosibirsk oblast
Western Siberia
Omsk oblast
Tomsk oblast
Tyumen oblas t
Buryat Republic
Eastern Siberia
Primorski Kray
Far Eas t
Khabarovsk Kra y
Kamchatka oblast
Magadan oblast
In the text, we used real per capita income data to measure growth in the standard of livin g
(GROWTH) . Specifically, growth is the annualized average growth rate of per capita province-leve l
money income, deflated by the province-level consumer price index measured between 1993 :IV and
1996:IV, An alternative measure that we did not use in the text is the growth in per capita foo d
purchasing power of money income . This is the average annualized growth rate of per capita mone y
income, divided by the average cost of a basket of 19 basic food goods . 6 The cost of the basket i s
collected from surveys conducted in the capital cities, The measure of growth used in the text and thi s
alternative measure are highly correlated : 0 .776 . This indicates that the standard of living in the capita l
city is representative of the province . Our results are robust to the use of this alternative measure o f
6 Data on both measures of growth are reported on a monthly, quarterly and average annual basis inGoskomstat Rossii (1993), (1994b,c), (1995b,c), (1996a,b,c,d) and (1997) ,
15

growth . '
To measure the initial standard of living in 1993 :IV (INITIAL), we divided nominal per capit a
income by the cost of the basket of 19 basic food goods in 1993 :IV. This allowed us to normaliz e
money income, taking into account the large differences in nominal prices and incomes across Russia .
We did not use regional CPI indexes to deflate money income, as they are not comparable acros s
regions .
A region's initial production potential (IO) is measured using data taken from Gaddy (1996) ,
who reported labor shares employed in various industrial sectors and the defense industry within eac h
region in 1985 . We multiplied these shares by the industry's value added, net of labor cost s
(intermediate shadow-profit rate), and summed the resulting products to compute IO, Thes e
intermediate shadow-profit rates use world-market prices and Soviet input-output tables, and wer e
computed by Senik-Leygonie and Hughes (1992) . It is worth noting that the oil and gas industries hav e
the highest value added, while food processing has the lowest (indeed, negative) value added. Our
measure of defense (DEFENSE) is simply the ratio of workers employed in the defense industry, pe r
thousand employed workers in the region .
In order to measure the development of new enterprises within a region (NEWENT), we use d
published data on the number of small registered private enterprises per thousand inhabitants in th e
region. These data are available for January 1, 1996 (Goskomstat Rossii (1996a)) . As noted in the
text, our statistical results are robust to the use of two alternative measures: the number of employe d
workers in private small enterprises per thousand employed workers, and the total number of registere d
enterprises per thousand inhabitants . Regarding the latter, Aslund (1997) shows that in 1995, roughl y
90 percent of full-time employment in the small-enterprise sector appeared in the most highly privatize d
Russian sectors : industry, construction, trade and commerce . In personal correspondence, Aslund
noted that small private enterprises capture the multiplier effect of privatization since they include spin -
offs and smaller independent units emanating from privatized state enterprises and start-ups . However ,
Aslund also argued that ceilings on employment that define small enterprises are differentiated acros s
sectors and change over time . This has created some confusion in data collection, so that small -
enterprise statistics are potentially problematic . Aslund suggested the use of total registered enterprise s
as a proxy for new economic activity . These figures include private small enterprises ; they reflect new
' Another standard-of-living measure available from Goskomstat and is per capita province-level moneyincome, divided by the province-level cost of a subsistence-goods basket . We view this measure as unreliable fo rthe following reasons . Yelena Borisovna Frolova, chief of the standards-of-living division of the Russian statistica loffice (Goskomstat) indicated to us in an interview that the components of the subsistence basket vary acrossregions in a way that is not transparent, Also, in interviews with Alastair McAuley, a leading expert on standard sof living in transition economies, we have learned that federal transfers that flow to a specific province increase a sthe subsistence basket becomes more expensive, Many regional officials collect data for constructing the cost of asubsistence basket, and thus have a strong incentive to overstate costs ,
16
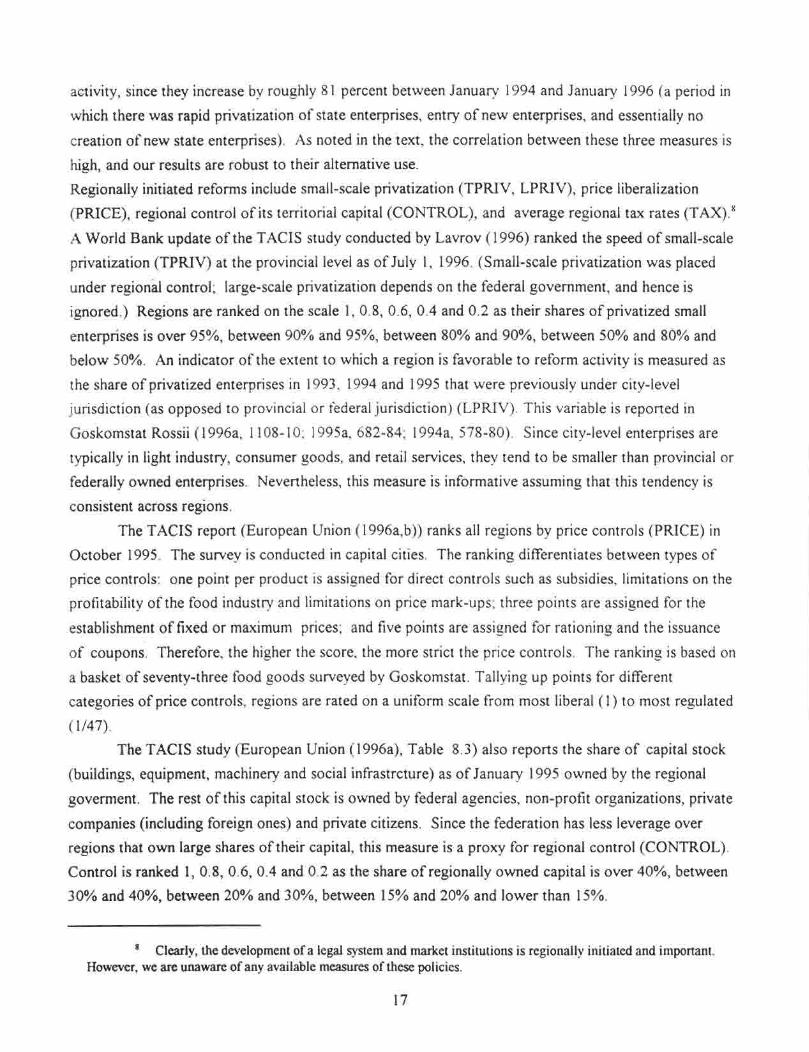
activity, since they increase by roughly 81 percent between January 1994 and January 1996 (a period i n
which there was rapid privatization of state enterprises, entry of new enterprises, and essentially n o
creation of new state enterprises) . As noted in the text, the correlation between these three measures i s
high, and our results are robust to their alternative use ,
Regionally initiated reforms include small-scale privatization (TPRIV, LPRIV), price liberalizatio n
(PRICE), regional control of its territorial capital (CONTROL), and average regional tax rates (TAX) . '
A World Bank update of the TACIS study conducted by Lavrov (1996) ranked the speed of small-scal e
privatization (TPRIV) at the provincial level as of July 1, 1996 . (Small-scale privatization was placed
under regional control ; large-scale privatization depends on the federal government, and hence i s
ignored .) Regions are ranked on the scale 1, 0 .8, 0 .6, 0 .4 and 0 .2 as their shares of privatized smal l
enterprises is over 95%, between 90% and 95%, between 80% and 90%, between 50% and 80% an d
below 50% . An indicator of the extent to which a region is favorable to reform activity is measured a s
the share of privatized enterprises in 1993, 1994 and 1995 that were previously under city-leve l
jurisdiction (as opposed to provincial or federal jurisdiction) (LPRIV) . This variable is reported i n
Goskomstat Rossii (1996a, 1108-10 ; 1995a, 682-84 ; 1994a, 578-80). Since city-level enterprises ar e
typically in light industry, consumer goods, and retail services, they tend to be smaller than provincial o r
federally owned enterprises. Nevertheless, this measure is informative assuming that this tendency i s
consistent across regions ,
The TACIS report (European Union (1996a,b)) ranks all regions by price controls (PRICE) in
October 1995 . The survey is conducted in capital cities, The ranking differentiates between types o f
price controls : one point per product is assigned for direct controls such as subsidies, limitations on the
profitability of the food industry and limitations on price mark-ups ; three points are assigned for th e
establishment of fixed or maximum prices ; and five points are assigned for rationing and the issuanc e
of coupons . Therefore, the higher the score, the more strict the price controls . The ranking is based o n
a basket of seventy-three food goods surveyed by Goskomstat . Tallying up points for differen t
categories of price controls, regions are rated on a uniform scale from most liberal (1) to most regulate d
(1/47) .
The TACIS study (European Union (1996a), Table 8 .3) also reports the share of capital stoc k
(buildings, equipment, machinery and social infrastrcture) as of January 1995 owned by the regiona l
goverment . The rest of this capital stock is owned by federal agencies, non-profit organizations, privat e
companies (including foreign ones) and private citizens, Since the federation has less leverage ove r
regions that own large shares of their capital, this measure is a proxy for regional control (CONTROL) .
Control is ranked 1, 0,8, 0 .6, 0 .4 and 0.2 as the share of regionally owned capital is over 40%, betwee n
30% and 40%, between 20% and 30%, between 15% and 20% and lower than 15% ,
a Clearly, the development of a legal system and market institutions is regionally initiated and important ,However, we are unaware of any available measures of these policies ,
17

Regional average tax rates are measured using budgetary data collected in 1994 and 1995 fro m
the Russian Ministry of Finance by Alexei Lavrov (see Keen and McAuley (1996)) . Ideally, we would
compute the marginal tax rate for enterprise activity within the region : we lack the data to do this .
However, we can compute average tax rates by deducting federal transfers from overall revenue, an d
then dividing the remainder by money income . This measure does not include unreported payments t o
corrupt and cash-strapped governments, It also ignores krisha (payments to protection groups) .
18
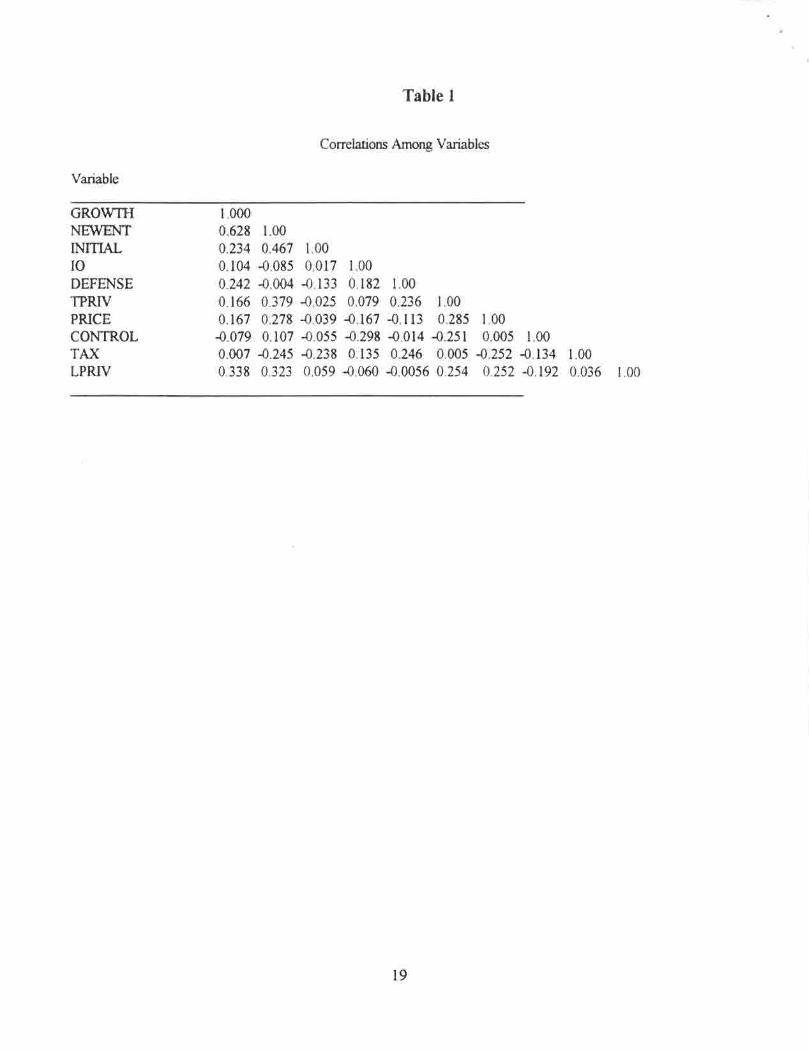
Table 1
Correlations Among Variable s
Variable
GROWTH 1 .000NEWENT 0.628 1 .00INITIAL 0.234 0.467 1 .00IO 0.104 -0 .085 0.017 1 .00DEFENSE 0,242 -0 .004 -0,133 0 .182 1,00TPRIV 0.166 0.379 -0 .025 0.079 0.236 1,00PRICE 0 .167 0.278 -0.039 -0 .167 -0 .113 0.285 1 .00CONTROL -0 .079 0 .107 -0 .055 -0 .298 -0 .014 -0 .251 0 .005 1 .00TAX 0 .007 -0 .245 -0 .238 0 .135 0 .246 0.005 -0 .252 -0.134 1 .00LPRIV 0 .338 0.323 0.059 -0 .060 -0 .0056 0.254 0 .252 -0 .192 0.036 1 .00
1 9

20
Figure 1

figure 2
21


![[William DeJong-Lambert] the Cold War Politics of](https://img.pdfslide.us/doc/110x75/5695cf101a28ab9b028c7149/william-dejong-lambert-the-cold-war-politics-of.jpg)