Embed Size (px)
Citation preview
Human Movement Science 3 (1984) 51-76
North-Holland
51
KINEMATIC AND KINETIC PATTERNS IN HUMAN GAIT: VARIABILITY AND COMPENSATING EFFECTS
David A. WINTER *
urlt1w-s1t): of Warerloo, Canada
Winter, D. A., 1984. Kinematic and kinetic patterns in human gait: variability and compensating effects. Human Movement Science 3, 51-76.
In the presence of fairly well defined kinematic patterns in human walking there was considerable
variability at the kinetic level. Intra-subject variability of joint moment patterns over the stride
period was high at the knee and hip, but low at the ankle and in a recently defined total limb
pattern, called support moment. A similar profile of variability was evident for inter-subject trials
at slow, natural and fast cadences, with the percentage variability at the knee and hip decreasing as
cadence increases. These moment of force patterns were not random, but were highly correlated.
Such a finding points to compensating mechanisms by the biarticulate muscles crossing these
joints. Also shown was the fact that these compensating patterns were highly predictable from link
segment theory.
1. Introduction
In the assessment of motor patterns of walking the joint kinetics are fundamental to the understanding of that movement and are extremely powerful in the diagnosis of pathological gait. The moments of force represent the net effect of all agonist and antagonist activity, and can therefore be considered as the final desired motor pattern at that joint. Both the clinical and basic researcher are interested in these motor patterns and if sufficient analyses are available the following questions can now be posed:
(1) How do these patterns alter with cadence changes?
* Author’s address: D.A. Winter, Dept. of Kinesiology. University of Waterloo, Waterloo, Ont.,
Canada N2L 3Gl.
0167-9457/84/$3.00 0 1984, Elsevier Science Publishers B.V. (North-Holland)
(2) Is there evidence of a consistent synergistic pattern across the joints of the lower limb during stance and swing?
(3) How variable are these patterns across the normal population?
The purpose of this paper is to present answers to the above questions using data from a normal population supplemented by case study examples of pathologies.
2. Literature review
In the large volume of literature of gait analyses the number of studies that have addressed the reaction forces and moments of force have been quite limited (Winter 1980). Since 1980 only a few additional case histories have been added (Boccardi et al. 1981). This is unfortunate because it is at the kinetic level we can see the cau.se of the movement rather than at the kinematic level at which scores of papers have described the final effect of all these forces. Because of the complex interaction of the link segment system it is almost impossible to infer from the kinematics alone as to what forces are acting to cause the observed pattern. This was demonstrated in a case study reported by Winter (1980) in which a knee replacement patient had a dominant knee flexor moment during the entire stance period yet still walked with a stiff knee. In the presence of this flexibility at individual joints there was still a consistent total pattern of support during stance by all three of the joints of the lower limb. The total extensor pattern, called the support moment, was defined (Winter 1980) as:
Ms=Ma+Mk+Mh (0
where: Ma, Mk and Mh are the moments of force at the ankle, knee and hip, and are positive for extension and negative for flexion. The polarities of Ma and Mh have been reversed from the original formula, which was written to satisfy the polarity conventions of link segment mechanics, rather than functional convention. MS was found on all subjects and patients to be positive during stance and negative during swing. This consistent total extensor pattern also means that there can be considerable inconsistency in the moment patterns of the three joints, and, in actual fact, this is regularly demonstrated. From a link
D.A. Wtnter / Kinenzut~c and kinettc patterns in hums guit 53
segment mechanics point-of-view we know that a consistent kinematic pattern at the knee and ankle during stance does not guarantee a consistent motor pattern at each of the joints of the support limb. Theoretically, during single support there are an infinite number of joint moments of force that could result in exactly the same ankle and knee angle histories.
3. Theory and methodology
3. I. General
Data for this paper have been collected over the past six years in the Gait Laboratory in the Department of Kinesiology at the University of Waterloo. Details of the data collection, processing and analysis appear in previous publications (Winter 1980, 1983a), and yields the kinematic and kinetic patterns over the stride period. The moments of force at the ankle, knee and hip, were calculated using equations developed by Bresler and Frankel (1950).
The analyses presented here are confined to the sagittal plane, or, more correctly, to the plane of progression. It is recognized that by neglecting the medial-lateral movement certain errors will result. There will be no error in the moments of force as calculated, they will be a true representation of the moments in the plane of progression. How- ever, if bone-on-bone forces were to be analysed, there could be significant errors generated by muscles acting in the medio-lateral plane. This is especially true at the hip joint during single support when abductor muscle forces would add to the already existing compressive forces of the hip flexors and extensors. However, since articulating forces were not part of the analyses reported here a 3-D analysis was not necessary.
Other methodological short-cuts were not done, however. Some researchers have used a quasi-static approach to the analysis of joint reaction forces and joint moments of forces. Such an approach ignores the inertial forces of the segments of the limb. During stance the error of this approach is negligible for the foot (because the mass acceleration products for the foot are small), but become noticeable at the knee and significant at the hip (Wells 1981) especially at weight acceptance and push-off.
3.2. Within-subject triuls
One subject underwent 9 repeat trials spaced over three days so that measures of within-subject variability might be obtained. for each walking trial the subject was asked to “walk her natural cadence” as she walked along the walkway over the force plate as she was tracked by a 16mm tine camera. No metrome or other timing device was used for the repeat trials. Ensemble average patterns over the stride period were obtained for three sets of variables:
(i) joint angles - ankle, knee and hip; (ii) ground reaction forces - horizontal and vertical; (iii) joint moments of force and support moment.
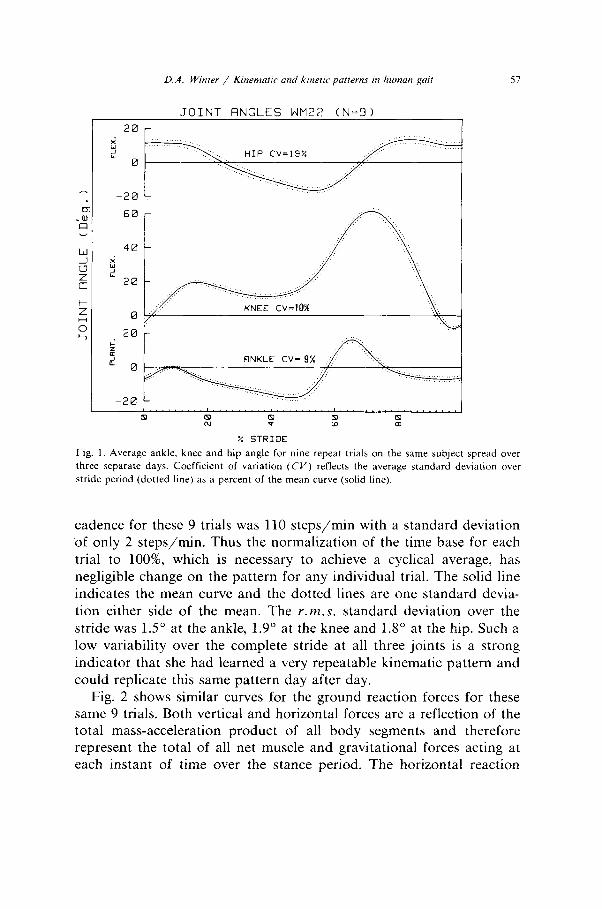
The ensemble average for any given variable was derived as follows. Firstly, the stride period for each of the 9 trials was set to 100%. At each 2% interval from heel contact to heel contact an average and standard deviation of the 9 trials on each of the three variables was calculated. The ensemble average for this subject’s joint angles are presented in fig. 1, the ground reaction force patterns appear in fig. 2 and the moment of force profiles are plotted in fig. 3.
3.3. Between-subjects and cadence related trials
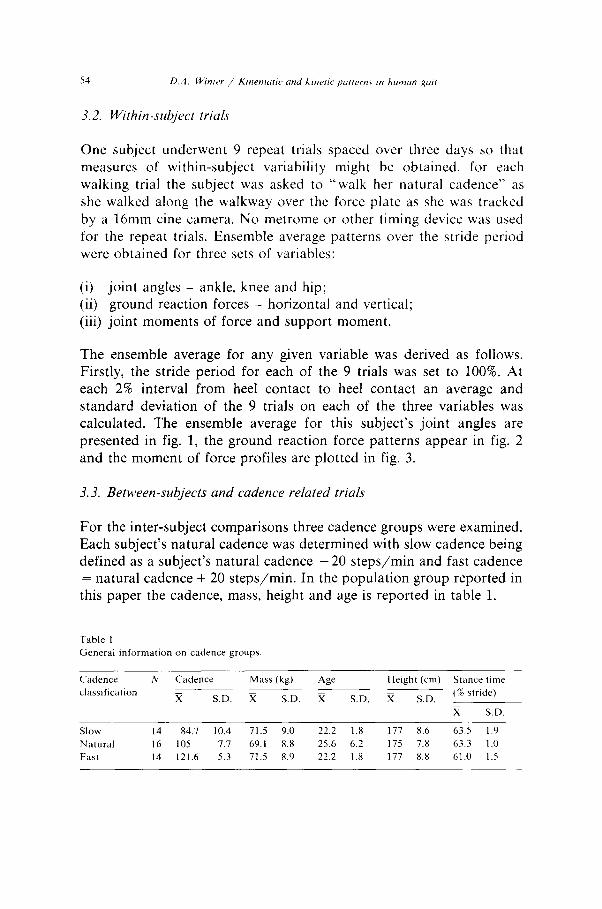
For the inter-subject comparisons three cadence groups were examined. Each subject’s natural cadence was determined with slow cadence being defined as a subject’s natural cadence -20 steps/min and fast cadence = natural cadence + 20 steps/min. In the population group reported in this paper the cadence, mass, height and age is reported in table 1.
Table 1
General information on cadence groups
Cadence N Cadence Mass (kg) Age Height (cm) Stance time
classification x SD. x SD. X S.D. X SD.
(B stride)
x S.D.
SIOW 14 84.7 10.4 71.5 9.0 22.2 1.8 177 8.6 63.5 1.9
Natural 16 105 7.7 69.1 X.8 25.6 6.2 175 7.8 63.3 1.0
Fast 14 121.6 5.3 71.5 8.9 22.2 1.8 177 8.8 61.0 1.5
D.A. Winter / Ktmmutrc cmd ktnetic patterns in human gait 55
Prior to calculating the average kinetic patterns for each cadence group two normalizations were required. The first normalization was to make the stance time = loo%, and to set the stance period = 62%. For the natural cadence group this meant a linear adjustment of all data over stance and compressing it from a time base of 63.3% to 62%. For the slow cadence group it was necessary to reduce it from 63.5% to 62% and for the fast cadence group the stance period was increased from 61.0% to 62%. These minor adjustments in the time base were necessary to emphasize the similar timing in the patterns especially prior to toe-off. The second normalization was required to reduce the inter-sub- ject variability that results when ensemble average profiles are calcu- lated over the stride period. Averaging the moment of force patterns (Nm) resulted in tremendous variability. Two techniques were at- tempted. Normalizing to the maximum support moment, as was done previously in jogging (Winter 1983a), reduced the variability but was not as effective as dividing the moment of force by body mass. Thus an ensemble average pattern (Nm/kg) was calculated for each subject within each cadence group, the average was calculated at each 2% interval over the stride period. At each of these intervals the standard deviation was also calculated. The moment patterns at each joint plus the total support moment pattern were plotted (figs. 4, 5, 6) along with a band of kl S.D.
3.4. Variability measures - intra and inter subject trials
As a measure of total variability in any of these ensemble average patterns a coefficient of variation (CV) was calculated = root mean square of standard deviation of the moment over stride period t mean of absolute moment of force over stride period.
(2)
where: N is the number of intervals over the stride, M, is the amplitude of the normalized moment of force (Nm/kg) at the i th interval, and u, is the standard deviation of M, at the i th interval.
Thus CV represents the r.m.s. width of the standard deviation “band” expressed as a percent of the magnitude of the signal pattern itself.
The CV scores for each joint moment profile do not tell us whether the variability is merely random biological perturbations, or whether there is some correlation between what is happening at one joint with the motor patterns at other joints. One way of determining this is to calculate the covariance between the individual joint moment patterns and the total support moment pattern. If the moment of force patterns are completely independent then the predicted variance in the support moment should be the sum of the variances in each joint moment pattern, or
where the subscripts s, a, k and h represent the support, ankle, knee and hip, respectively. However, we actually have an estimate of the variance in the support moment, 6x = r.m.s. S.D. of Ms. The dif- ference, a, - es,, is an estimate of the total covariance amongst the three joint moment patterns. If a, > 6s then the experimental results show that there is a correlation between the three moments as a result of a cancellation (i.e., a subject increased his flexor moment at one joint while at the same time increased his extensor moments at one or both of the other joints). If a, < 6s then the reverse correlation is indicated. To ascertain where most of the correlation occurs a further analysis was undertaken to partition the covariance and this was done by computing u,‘s for paired summations of the hip + knee, and ankle + knee mo- ments of force. Then, to calculate the covariance between the hip and knee patterns, ehk we use the formula:
-2 uhtk
where: t!ii+ k is the average variance of the sum of the hip and knee moment patterns across the same subject or cadence group. Similar formulae apply for the knee + ankle.
4. Results and discussion
4.1. Within-subject variability - kinemutics and kinetics
Fig. 1 presents the joint angle plots as obtained from the tine film of one subject with 9 trials walking at her natural cadence. The average
D.A. Winter / Kinematrc and krnetrt patterns m human gad 57
JOINT RNGLES WM22 (N=9) 1
0
20
; 2
0
-20
7’ ‘.
,’ .‘: : :
Fig. 1. Average ankle, knee and hip angle for nine repeat trials on the same subject spread over three separate days. Coefficient of variation (CV) reflects the average standard deviation over
stride period (dotted line) as a percent of the mean curve (solid line).
cadence for these 9 trials was 110 steps/mm with a standard deviation of only 2 steps/min. Thus the normalization of the time base for each trial to loo%, which is necessary to achieve a cyclical average, has negligible change on the pattern for any individual trial. The solid line indicates the mean curve and the dotted lines are one standard devia- tion either side of the mean. The r.m.s. standard deviation over the stride was 1.5” at the ankle, 1.9” at the knee and 1.8” at the hip. Such a low variability over the complete stride at all three joints is a strong indicator that she had learned a very repeatable kinematic pattern and could replicate this same pattern day after day.
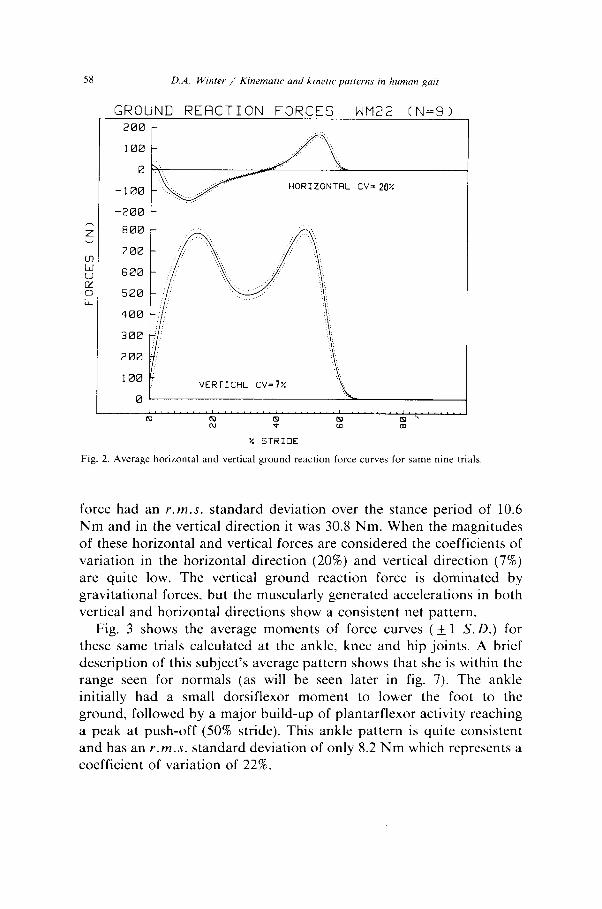
Fig. 2 shows similar curves for the ground reaction forces for these same 9 trials. Both vertical and horizontal forces are a reflection of the total mass-acceleration product of all body segments and therefore represent the total of all net muscle and gravitational forces acting at each instant of time over the stance period. The horizontal reaction
58 D.A. Wtnter / Kinemattc and krnerrc patterns m human pit
GROUND REACTION FORCES WM22 (N=9) 200 -
100 -
HORIZONTAL CV=2W
VERTICRL CV-7%
0’
Fig. 2. Average horizontal and vertical ground reaction force curves for same nine trials
force had an r.m.s. standard deviation over the stance period of 10.6 Nm and in the vertical direction it was 30.8 Nm. When the magnitudes of these horizontal and vertical forces are considered the coefficients of variation in the horizontal direction (20%) and vertical direction (7%) are quite low. The vertical ground reaction force is dominated by gravitational forces, but the muscularly generated accelerations in both vertical and horizontal directions show a consistent net pattern.
Fig. 3 shows the average moments of force curves ( !c 1 S.D.) for these same trials calculated at the ankle, knee and hip joints. A brief description of this subject’s average pattern shows that she is within the range seen for normals (as will be seen later in fig. 7). The ankle initially had a small dorsiflexor moment to lower the foot to the ground, followed by a major build-up of plantarflexor activity reaching a peak at push-off (50% stride). This ankle pattern is quite consistent and has an r.m.s. standard deviation of only 8.2 Nm which represents a coefficient of variation of 22%.
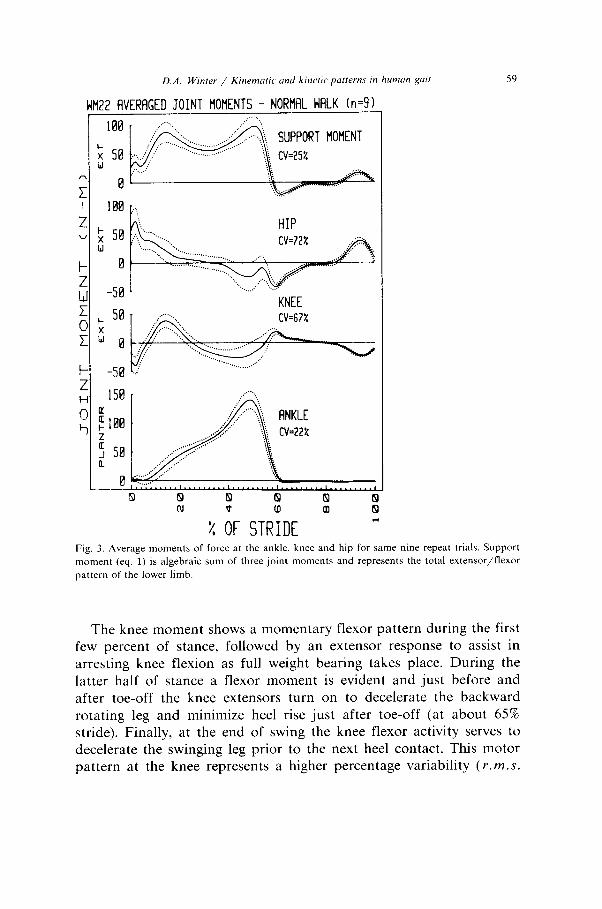
D.A. W/nrer / Kir~emuric and kinerr parterns rn human guir 59
WM22 FIVERAGED JOINT IIOMENTS - NOR/ML WRLK (n=9) I . . . . . .
KNEE CV=67%
Fig. 3. Average moments of force at the ankle, knee and hip for same nine repeat trials. Support
moment (eq. 1) is algebraic sum of three joint moments and represents the total extensor/flexor
pattern of the lower limb.
The knee moment shows a momentary flexor pattern during the first few percent of stance, followed by an extensor response to assist in arresting knee flexion as full weight bearing takes place. During the latter half of stance a flexor moment is evident and just before and after toe-off the knee extensors turn on to decelerate the backward rotating leg and minimize heel rise just after toe-off (at about 65% stride). Finally, at the end of swing the knee flexor activity serves to decelerate the swinging leg prior to the next heel contact. This motor pattern at the knee represents a higher percentage variability ( Y.WZ.S.
60 D.A. Winter / Kinemnrrc and kinetrc potrerns rn human go/r
S.D. = 10.2 Nm and a coefficient of variation of 67%) than at the ankle, especially during the time of push-off. The much larger CVat the knee compared with the ankle is partially due to a larger absolute variability but more so because the average magnitude of the knee moment is considerably less than that generated at the ankle. Such variability is likely higher at the knee because of the large number of biarticulate muscles crossing that joint.
The hip patterns demonstrate that this subject has an extensor motor pattern for the first half of stance which assists in keeping the knee from collapsing and also decelerates the forward rotating trunk. During the latter half of stance the hip flexors serve to decelerate the backward rotating thigh and then reverse it and cause its forward rotation prior to swing through of the lower limb. This forward rotating flexor moment continues well into swing and is followed by an extensor burst to decelerate the forward swinging thigh. The highest variability is seen in this hip motor pattern (mean S.D. = 13.2 Nm, CV = 72%) and this appears to be due to the number of biarticular muscles crossing the hip joint.
Finally, in the support moment we see the net extensor/flexor pattern of the total lower limb. During stance there is a major total extensor pattern which reverses rapidly to a small flexor pattern during early swing and back to extensor as the limb is extended prior to heel contact. The variability in the support moment is quite low (CV = 25%) which strongly indicates that the total extensor/flexor pattern at all three joints of the lower limb is quite reproduceable in spite of large individual variations, especially at the knee and hip joints.
A summary of what we now see for this one subject regarding how robot-like here motor patterns are reveals the following. All the kine- matic patterns (fig. 1) and the total kinetic patterns (fig. 2 plus the support moment in fig. 3) are quite repeatable. However, the individual joint motor patterns (fig. 3) especially at the hip and knee, are quite variable and presumably a measure of the flexibility of the individual muscles as they adapt to produce the same kinematic pattern. This adaption demonstrates the fine motor tuning that takes place over strides in order to correct for minor deviations from the desired kinematic pattern. For example, on one stride the trunk may be leaning 1” or 2” too far forward, thus the hip extensors increase during the stance period to correct the error. Because the upper part of the body represents 2/3 mass of the body the hip extensors, including the
D.A. Wlnter / Klnematrc und kinettc putterns in human gait 61
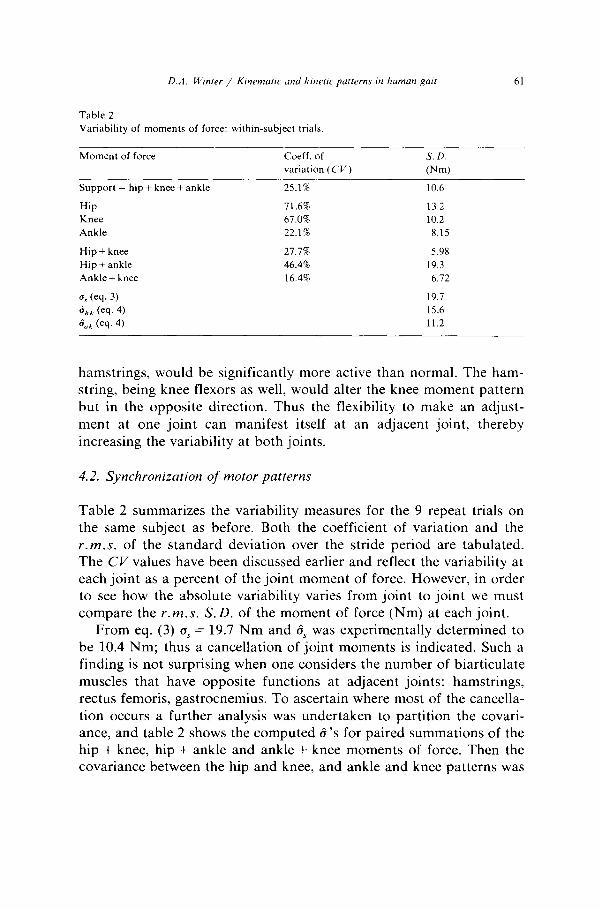
Table 2
Variability of moments of force: within-subject trials
Moment of force Coeff. of
variation (CV)
S. D.
Pm)
Support = hip + knee + ankle
Hip
Knee
Ankle
Hip + knee
Hip + ankle
Ankle + knee
cv (eq. 3)
s,, (eq. 4)
& (eq. 4)
25.1% 10.6
71.6% 13.2
67.0% 10.2
22.1% 8.15
27.7% 5.98
46.4% 19.3
16.4% 6.72
19.7
15.6
11.2
hamstrings, would be significantly more active than normal. The ham- string, being knee flexors as well, would alter the knee moment pattern but in the opposite direction. Thus the flexibility to make an adjust- ment at one joint can manifest itself at an adjacent joint, thereby increasing the variability at both joints.
4.2. Synchronization of motor patterns
Table 2 summarizes the variability measures for the 9 repeat trials on the same subject as before. Both the coefficient of variation and the r.m.s. of the standard deviation over the stride period are tabulated. The CL’ values have been discussed earlier and reflect the variability at each joint as a percent of the joint moment of force. However, in order to see how the absolute variability varies from joint to joint we must compare the r.m.s. S.D. of the moment of force (Nm) at each joint.
From eq. (3) a, = 19.7 Nm and 15~ was experimentally determined to be 10.4 Nm; thus a cancellation of joint moments is indicated. Such a finding is not surprising when one considers the number of biarticulate muscles that have opposite functions at adjacent joints: hamstrings, rectus femoris, gastrocnemius. To ascertain where most of the cancella- tion occurs a further analysis was undertaken to partition the covari- ante, and table 2 shows the computed 8’s for paired summations of the hip + knee, hip + ankle and ankle + knee moments of force. Then the covariance between the hip and knee, and ankle and knee patterns was
62 D.A. Wincer / Kinema/ic and kinetic patterns in humun goit
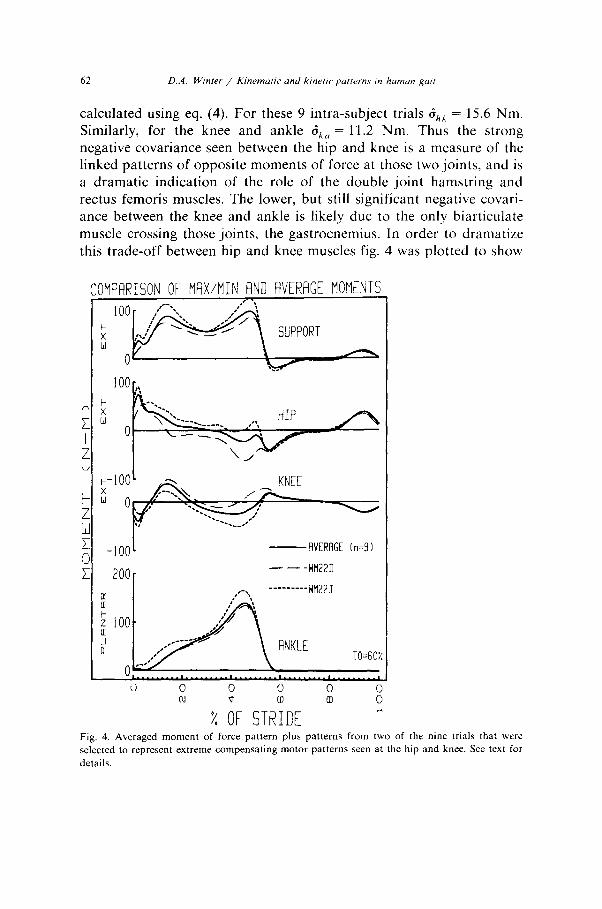
calculated using eq. (4). For these 9 intra-subject trials SAX = 15.6 Nm. Similarly, for the knee and ankle d,, = 11.2 Nm. Thus the strong negative covariance seen between the hip and knee is a measure of the linked patterns of opposite moments of force at those two joints, and is a dramatic indication of the role of the double joint hamstring and rectus femoris muscles. The lower, but still significant negative covari- ante between the knee and ankle is likely due to the only biarticulate muscle crossing those joints, the gastrocnemius. In order to dramatize this trade-off between hip and knee muscles fig. 4 was plotted to show
3MPHRISON OF MAX/MIN AND AVERAGE MOMENTS
-1001
200r
-flVERAGE (n=9)
- - -Wfl22D
Fig. 4. Averaged moment of force pattern plus patterns from two of the nine trials that were selected to represent extreme compensating motor patterns seen at the hip and knee. See text for
details.
D.A. W~nrer / Kinenwtrc and krnerrc patterns ITI human gorr 63
two extreme strides from this subject whose kinematic patterns were quite consistent. The average moment of force curves for these nine trials (solid line) is the same as shown in fig. 3 and two extreme trials (WM22D and WM22J) are labelled. Trial WM22D had a hip pattern
, _ i 100
l- 7 I
')
5
j
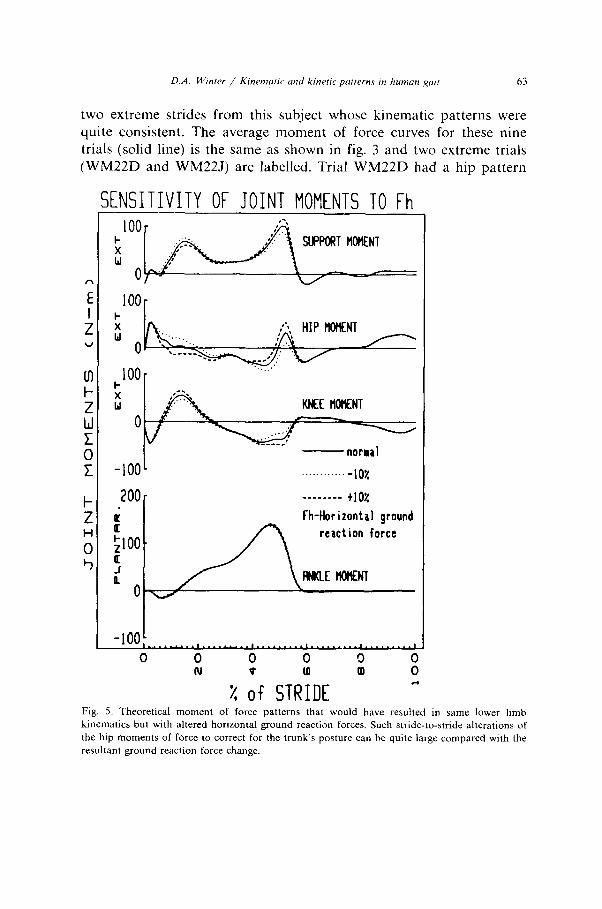
SENSITIVITY OF JOINT MOMENTS TO Fh
KNEE WENT
-normal
. . . . . . . -10%
fh-Horizontal ground
reaction force
RULE HolENT
X of STRIDE 4 Fig. 5. Theoretical moment of force patterns that would have resulted in same lower limb kinematics but with altered horizontal ground reaction forces. Such stride-to-stride alterations of the hip moments of force to correct for the trunk’s posture can be quite large compared with the
resultant ground reaction force change.
64 D.A. Winter / Kinematic und krnetrc patterns ,n humutl gort
that was biased and predominantly flexor during stance while WM22J was extensor. The opposite was true at the knee: WM22D was mainly extensor and WM22J had a dominant flexor pattern. Thus we could conclude that WM22D trial was accomplished with rectus femoris dominant and for WM22J trial the hamstrings prevailed. As indicated in the opening comments of this paper the trade-off that has just been described falls well within theoretical prediction. This is now demon- strated quite readily if we re-analyse one of the trials with identical lower limb kinematics but with slightly altered ground reaction forces. Although this is a form of sensitivity analysis it also serves to demon- strate how a subject could maintain identical limb kinematics but with different moment of force patterns. In effect, we can answer the question “could the subject walk the same way (kinematically) but with an entirely different combination of muscle force patterns at each joint?“. The answer is, yes.
Fig. 5 shows the result of such an analysis. The solid lines plot the actual moments of force, the dotted line was when the horizontal ground reaction force was decreased lo%, and dashed line shows what motor patterns would have caused a 10% increase in the horizontal reaction force pattern. As can be seen there are insignificant changes in ankle moments, small changes in knee moments and significant hip moment changes. Thus we can conclude that an alteration in the hip moment pattern (mainly to correct for the position of the trunk) combined with compensating changes at the knee and ankle could yield identical ankle and knee angle patterns. Note that the ground reaction force changed only lo%, but the average hip moment changed more than 40% of its mean value. Thus it is not surprising that relatively low variability seen in this subject’s ground reaction forces and in her joint kinematics were the result of fairly large variations in the hip and knee motor patterns. From a practical point of view it is worth a note of caution that gait disorders analysed solely with joint kinematic data could never lead to definitive conclusions regarding underlying motor disfunction.
A final comment should be made concerning the fact that the data from only one subject was presented in this paper. The cost in time and money for each complete biomechanical analysis is quite high so only 9 trials on one subject were attempted. Thus these variability measures are to be interpreted as a first indicator of the results that might be expected if similar analyses were performed on additional subjects.
D.A. Winrer / Kmemtrric and kinetrc putterns in human gait 65
4.3. Between-subjects variability
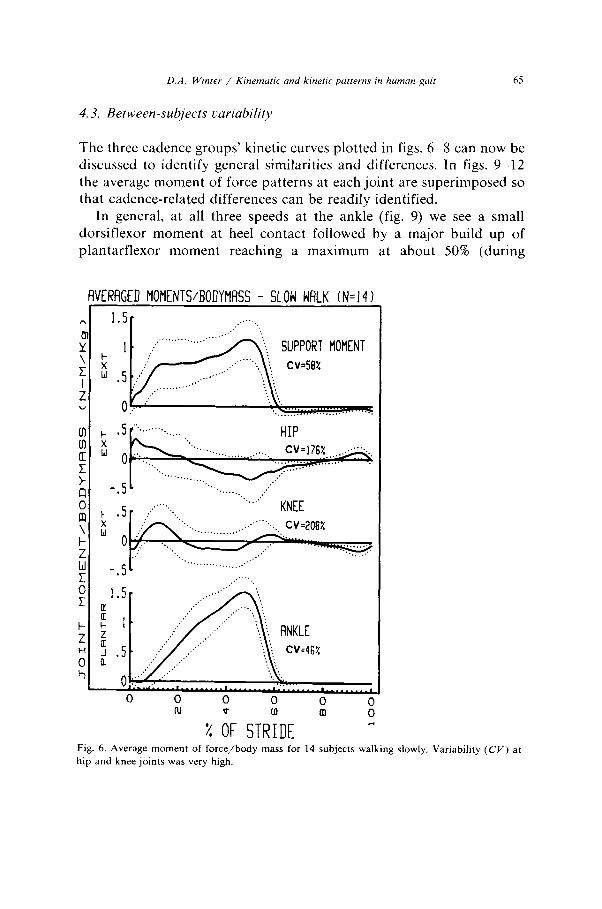
The three cadence groups’ kinetic curves plotted in figs. 6-8 can now be discussed to identify general similarities and differences. In figs. 9-12 the average moment of force patterns at each joint are superimposed so that cadence-related differences can be readily identified.
In general, at all three speeds at the ankle (fig. 9) we see a small dorsiflexor moment at heel contact followed by a major build up of plantarflexor moment reaching a maximum at about 50% (during
AVERflGED MOMENTSBODYMASS - SLOW WALK (N=141
m 1.5[ ,....“_,
-..,,.: /““.~ .,,. KNEE
1. -
W _. 5 ... ._. . . ..._..._.._..,,.. ..,..’
El 1.5
;.“._
1 : I I
,;,.~ ,..‘., :
_:’ .’ ‘, :
Fig. 6. Average moment of force/body mass for 14 subjects walking slowly. Variability (CV) at
hip and knee joints was very high.
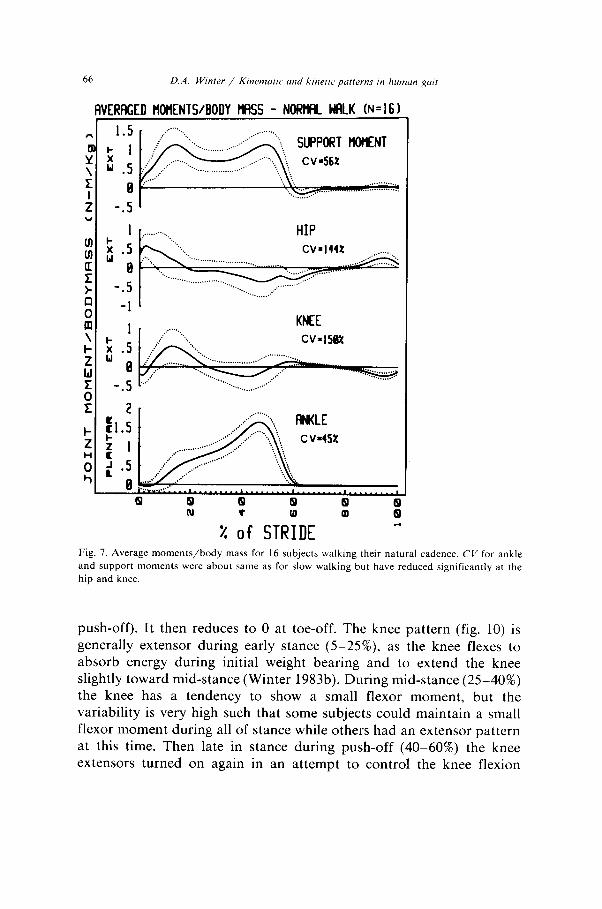
VERAGED llOHENTS/BODY HflSS - NORrmL WFlLK (N=161
I.5
ti * w .5
e -.5
I I- x .5
IA 0
-.5 -I
I I- x .5 IA e -.5
2 $5
f ’ i .5
8
KNEE
Fig. 7. Average moments/body mass for 16 subjects walking their natural cadence. CV for ankle
and support moments were about same as for slow walking but have reduced significantly at the
hip and knee.
push-off). It then reduces to 0 at toe-off. The knee pattern (fig. 10) is generally extensor during early stance (5525%), as the knee flexes to absorb energy during initial weight bearing and to extend the knee slightly toward mid-stance (Winter 1983b). During mid-stance (25-40%) the knee has a tendency to show a small flexor moment, but the variability is very high such that some subjects could maintain a small flexor moment during all of stance while others had an extensor pattern at this time. Then late in stance during push-off (40-60%) the knee extensors turned on again in an attempt to control the knee flexion
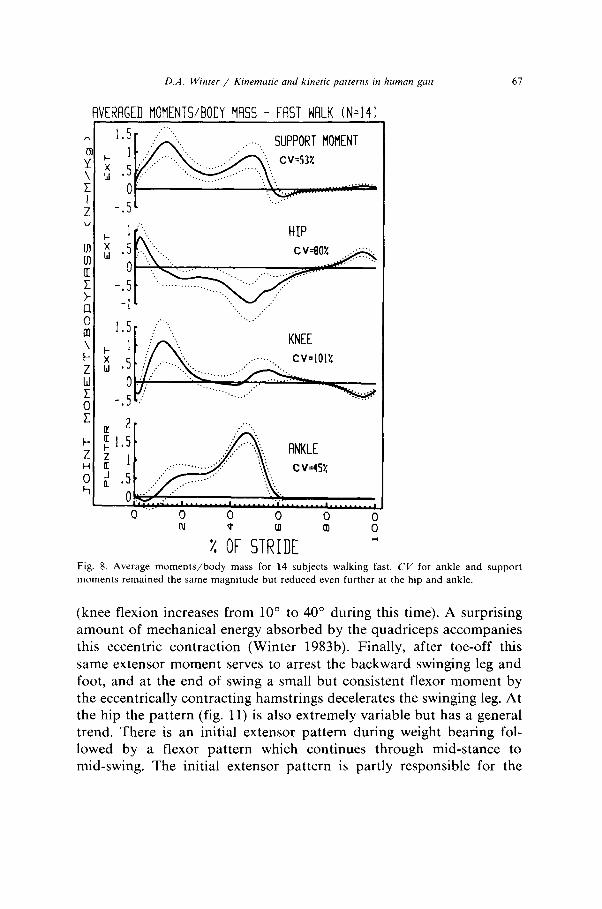
D.A. W/nter / Kinemmrc and ktnetic patterns ,n human gait 67
AVERAGED MOMENTSBODY MASS - FAST WALK (N=141 I
N m 0
-
Fig. 8. Average moments/body mass for 14 subjects walking fast. CV for ankle and support
moments remained the same magnitude but reduced even further at the hip and ankle.
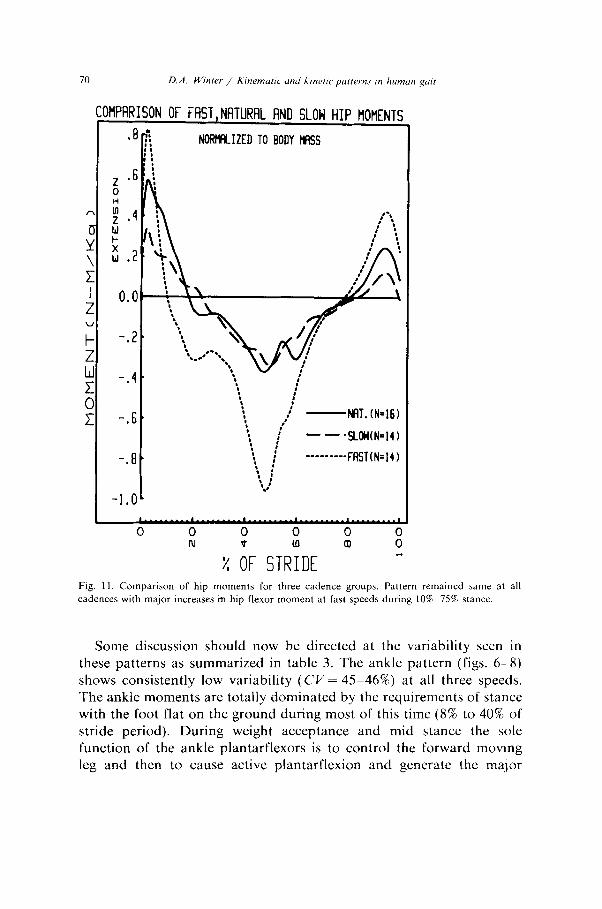
(knee flexion increases from 10” to 40” during this time). A surprising amount of mechanical energy absorbed by the quadriceps accompanies this eccentric contraction (Winter 1983b). Finally, after toe-off this same extensor moment serves to arrest the backward swinging leg and foot, and at the end of swing a small but consistent flexor moment by the eccentrically contracting hamstrings decelerates the swinging leg. At the hip the pattern (fig. 11) is also extremely variable but has a general trend. There is an initial extensor pattern during weight bearing fol- lowed by a flexor pattern which continues through mid-stance to mid-swing. The initial extensor pattern is partly responsible for the
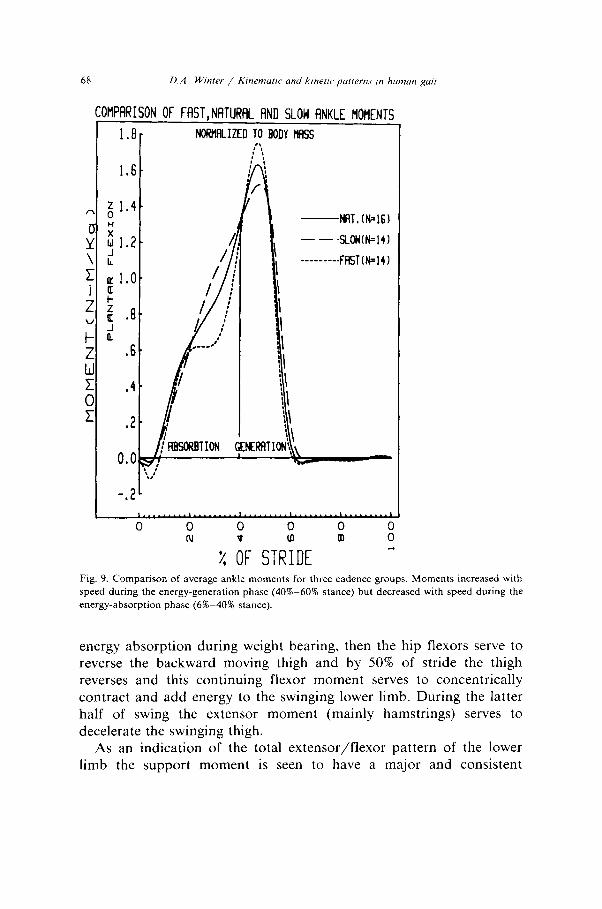
68 D.A. Winter / K~nemutic and krnetrc, putterns ,n hunwl RN,,
DMPARISON OF FAST,NATURAL AND SLOW flNKLE HOMENTS
1.8. NORHFILIZED TO BODY H&S
1.6.
; 1.4.
i -NF1T. (N=lS)
w 1.2. - - sLOHM=141
i ---------fRST(N=l4)
u 1.0. F g .8-
Ii .6.
.4 -
.2 -
2
Fig. 9. Comparison of average ankle moments for three cadence groups. Moments increased with speed during the energy-generation phase (40%-60% stance) but decreased with speed during the
energy-absorption phase (62-4055 stance).
energy absorption during weight bearing, then the hip flexors serve to reverse the backward moving thigh and by 50% of stride the thigh reverses and this continuing flexor moment serves to concentrically contract and add energy to the swinging lower limb. During the latter half of swing the extensor moment (mainly hamstrings) serves to decelerate the swinging thigh.
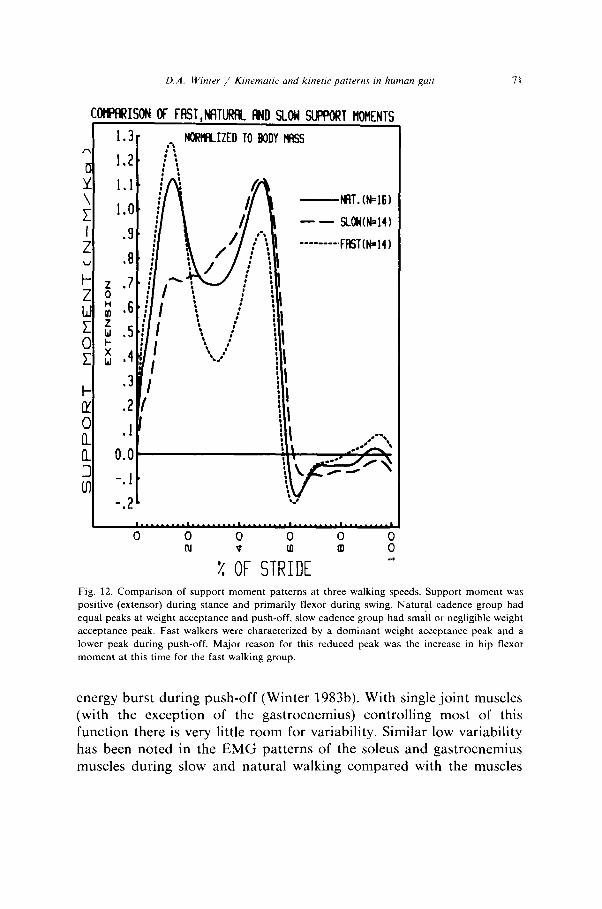
As an indication of the total extensor/flexor pattern of the lower limb the support moment is seen to have a major and consistent
D.A. Winter / Kinemarrc and k/m-f/c putterns ,n human gair 69
:i :'
NORHflLIZED TO BODY ms
: : :' ; : : : ; : : : : : i
: -NRT.(N=l6)
: ! : : - --SLOM(N=14)
i : ----.Ffl6T(N=l4)
COMPARISON OF FAST, NATURAL FIND SLOW KNEE MOMENTS
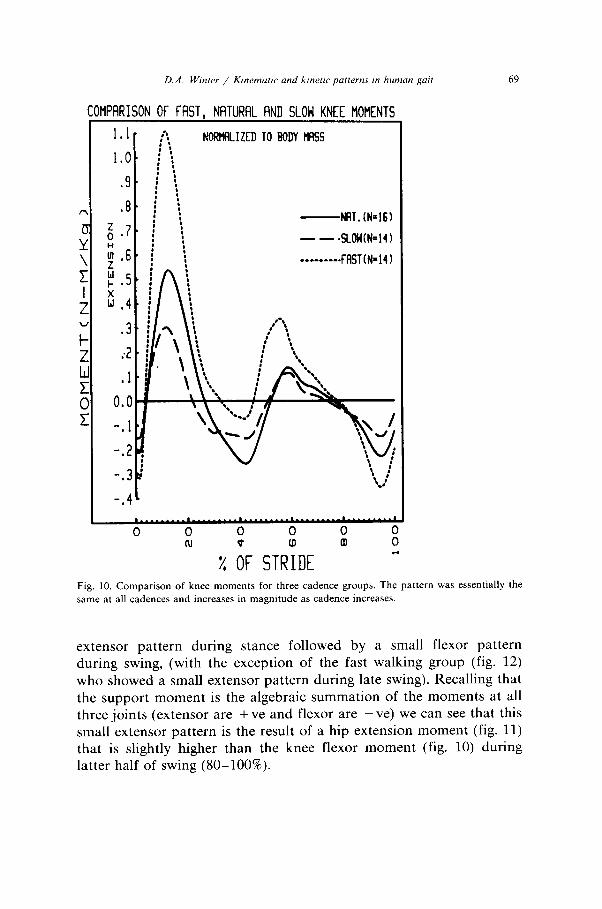
Fig. 10. Comparison of knee moments for three cadence groups. The pattern was essentially the
same at all cadences and increases in magnitude as cadence increases.
extensor pattern during stance followed by a small flexor pattern during swing, (with the exception of the fast walking group (fig. 12) who showed a small extensor pattern during late swing). Recalling that the support moment is the algebraic summation of the moments at all three joints (extensor are + ve and flexor are - ve) we can see that this small extensor pattern is the result of a hip extension moment (fig. 11) that is slightly higher than the knee flexor moment (fig. 10) during latter half of swing (SO-100%).
COtlPRRISON OF FRST,NATURAL AND SLOW HIP MOMENTS
NOt?M_IZED TO BODY MSS
-NI~T. (N=16)
- - *SLOH(N=I4)
--------.fflST(N=]j)
Fig. 11. Comparison of hip moments for three cadence groups. Pattern remained same at all cadences with major increases in hip flexor moment at fast speeds during 10%75% stance.
Some discussion should now be directed at the variability seen in these patterns as summarized in table 3. The ankle pattern (figs. 6-8) shows consistently low variability (CV= 45-46%) at all three speeds. The ankle moments are totally dominated by the requirements of stance with the foot flat on the ground during most of this time (8% to 40% of stride period). During weight acceptance and mid stance the sole function of the ankle plantarflexors is to control the forward moving leg and then to cause active plantarflexion and generate the major
D.A. Win/w / K~nrmrrtic and klnetlc puttems m human gut 71
-t+lT.Wl6)
-- sLow(N=l4)
--------miTW141
Fig. 12. Comparison of support moment patterns at three walking speeds. Support moment was
positive (extensor) during stance and primarily flexor during swing. Natural cadence group had
equal peaks at weight acceptance and push-off, slow cadence group had small or negligible weight
acceptance peak. Fast walkers were characterized by a dominant weight acceptance peak and a
lower peak during push-off. Major reason for this reduced peak was the increase in hip flexor
moment at this time for the fast walking group.
energy burst during push-off (Winter 1983b). With single joint muscles (with the exception of the gastrocnemius) controlling most of this function there is very little room for variability. Similar low variability has been noted in the EMG patterns of the soleus and gastrocnemius muscles during slow and natural walking compared with the muscles
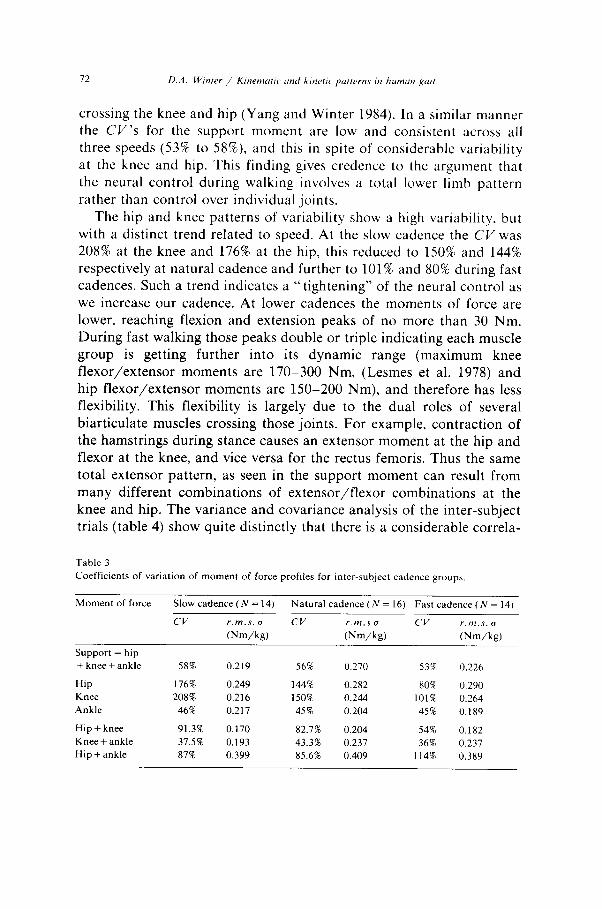
crossing the knee and hip (Yang and Winter 1984). In a similar manner the CV’s for the support moment are low and consistent across all three speeds (53% to 58%), and this in spite of considerable variability at the knee and hip. This finding gives credence to the argument that the neural control during walking involves a total lower limb pattern rather than control over individual joints.
The hip and knee patterns of variability show a high variability, but with a distinct trend related to speed. At the slow cadence the CV was 208% at the knee and 176% at the hip, this reduced to 150% and 144% respectively at natural cadence and further to 101% and 80% during fast cadences. Such a trend indicates a “tightening” of the neural control as we increase our cadence. At lower cadences the moments of force are lower, reaching flexion and extension peaks of no more than 30 Nm. During fast walking those peaks double or triple indicating each muscle group is getting further into its dynamic range (maximum knee flexor/extensor moments are 170-300 Nm, (Lesmes et al. 1978) and hip flexor/extensor moments are 150-200 Nm), and therefore has less flexibility. This flexibility is largely due to the dual roles of several biarticulate muscles crossing those joints. For example, contraction of the hamstrings during stance causes an extensor moment at the hip and flexor at the knee, and vice versa for the rectus femoris. Thus the same total extensor pattern, as seen in the support moment can result from many different combinations of extensor/flexor combinations at the knee and hip. The variance and covariance analysis of the inter-subject trials (table 4) show quite distinctly that there is a considerable correla-
Table 3
Coefficients of variation of moment of force profiles for inter-subject cadence groups.
Moment of force Slow cadence (N = 14) Natural cadence (N = 16) Fast cadence (N = 14)
cv T.M.S. cl cv r.m.s 0 cv r.m.s. Ll
(Nm/kg) @m/kg) (Nm/kg)
Support = hip
+ knee + ankle
Hip
Knee
Ankle
Hip + knee
Knee + ankle Hip + ankle
58% 0.219 56% 0.270 53% 0.226
176% 0.249 144% 0.282 80% 0.290
208% 0.216 150% 0.244 101% 0.264
46% 0.217 45% 0.204 45% 0.189
91.3% 0.170 82.7% 0.204 54% 0.182
37.5% 0.193 43.3% 0.237 36% 0.237
87% 0.399 85.6% 0.409 114% 0.389
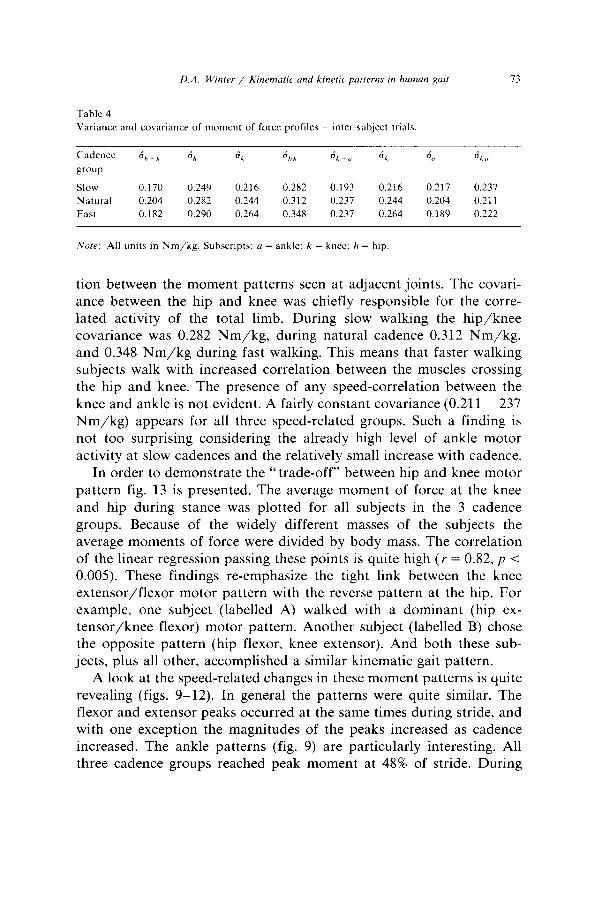
D.A. Winter / Kinemutrc and krnetlc putterns tn human put 73
Table 4
Variance and covariance of moment of force profiles - inter-subject trials.
Slow 0.170 0.249 0.216 0.282 0.193 0.216
Natural 0.204 0.282 0.244 0.312 0.237 0.244
Fast 0.182 0.290 0.264 0.348 0.237 0.264
Note: All units in Nm/kg. Subscripts: a = ankle: k = knee: h = hip.
0.217 0.237
0.204 0.211
0.189 0.222
tion between the moment patterns seen at adjacent joints. The covari- ante between the hip and knee was chiefly responsible for the corre- lated activity of the total limb. During slow walking the hip/knee covariance was 0.282 Nm/kg, during natural cadence 0.312 Nm/kg, and 0.348 Nm/kg during fast walking. This means that faster walking subjects walk with increased correlation between the muscles crossing the hip and knee. The presence of any speed-correlation between the knee and ankle is not evident. A fairly constant covariance (0.211 - 237 Nm/kg) appears for all three speed-related groups. Such a finding is not too surprising considering the already high level of ankle motor activity at slow cadences and the relatively small increase with cadence.
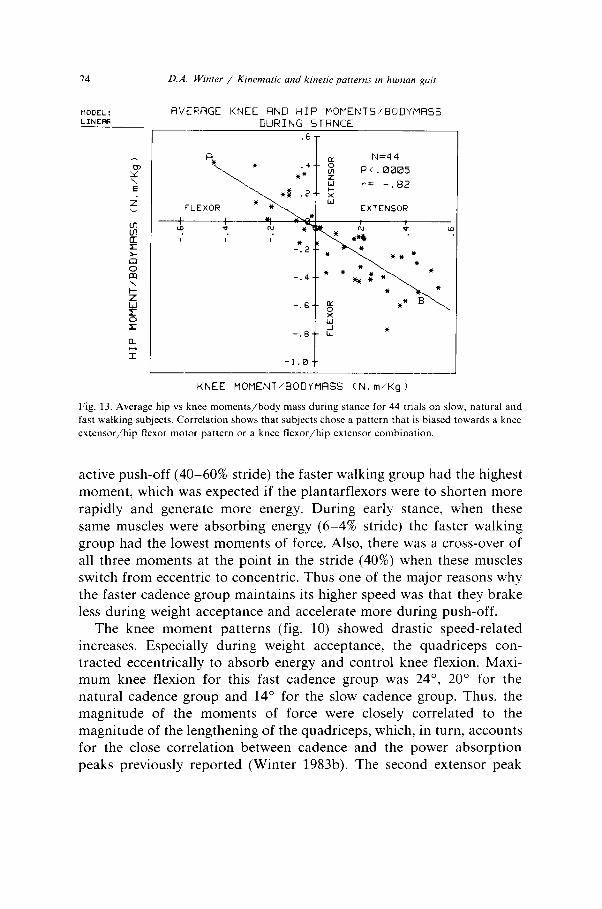
In order to demonstrate the “trade-off” between hip and knee motor pattern fig. 13 is presented. The average moment of force at the knee and hip during stance was plotted for all subjects in the 3 cadence groups. Because of the widely different masses of the subjects the average moments of force were divided by body mass. The correlation of the linear regression passing these points is quite high (Y = 0.82, p < 0.005). These findings re-emphasize the tight link between the knee extensor/flexor motor pattern with the reverse pattern at the hip. For example, one subject (labelled A) walked with a dominant (hip ex- tensor/knee flexor) motor pattern. Another subject (labelled B) chose the opposite pattern (hip flexor, knee extensor). And both these sub- jects, plus all other, accomplished a similar kinematic gait pattern.
A look at the speed-related changes in these moment patterns is quite revealing (figs. 9-12). In general the patterns were quite similar. The flexor and extensor peaks occurred at the same times during stride, and with one exception the magnitudes of the peaks increased as cadence increased. The ankle patterns (fig. 9) are particularly interesting. All three cadence groups reached peak moment at 48% of stride. During
D.A. Wmter / Kinematic and kinetic patterns ,n human pit
AVERAGE KNEE FIND HIP MOMENTS/BODYMRSS
DURING STRNCE
PC.0005
r= -.82
EXTENSOR
J
KNEE MOMENT/BODYMASS (N, m/Kg 1
Fig. 13. Average hip vs knee moments/body mass during stance for 44 trials on slow. natural and
fast walking subjects. Correlation shows that subjects chose a pattern that is biased towards a knee
extensor/hip flexor motor pattern or a knee flexor/hip extensor combination.
active push-off (40-60% stride) the faster walking group had the highest moment, which was expected if the plantarflexors were to shorten more rapidly and generate more energy. During early stance, when these same muscles were absorbing energy (6-4% stride) the faster walking group had the lowest moments of force. Also, there was a cross-over of all three moments at the point in the stride (40%) when these muscles switch from eccentric to concentric. Thus one of the major reasons why the faster cadence group maintains its higher speed was that they brake less during weight acceptance and accelerate more during push-off.
The knee moment patterns (fig. 10) showed drastic speed-related increases. Especially during weight acceptance, the quadriceps con- tracted eccentrically to absorb energy and control knee flexion. Maxi- mum knee flexion for this fast cadence group was 24”, 20” for the natural cadence group and 14” for the slow cadence group. Thus, the magnitude of the moments of force were closely correlated to the magnitude of the lengthening of the quadriceps, which, in turn, accounts for the close correlation between cadence and the power absorption peaks previously reported (Winter 1983b). The second extensor peak
D.A. Wtnter / Kinemattc and kinetic patterns rn human gart 75
occurred in later stance into early swing (45575% stride) and served to control knee flexion that begins at 40% and continues through toe-off (60%) to its maximum at 70% of stride. Finally, during late swing the moments of force were directly related to the requirements of the flexors to absorb kinetic energy of the faster swinging leg and foot.
The hip moment patterns (fig. 11) demonstrated the importance of the hip extensors as energy absorbers immediately after heel contact. The faster cadence group’s extensor activity was high and lasted only 10% of stride while the slower group showed considerably lower activity but lasting to 23% of the stride period. During the balance of stance and well into swing the hip flexors were dominant, with the fast cadence group having high activity. It appears that this flexor motor pattern was required to decelerate the backward rotating thigh (lo-SO% stance) and then reverse it and accelerate it forward (50&80% stance). Finally, at the end of swing the extensors contracted proportionally to absorb kinetic energy from the thigh prior to heel contact.
5. Conclusions
(1) Within-subject variability in kinematics and ground reaction forces was quite low, whereas the moment of force patterns at the hip and knee were highly variable. This high variability was supported by evidence to demonstrate that a wide range of moment of force patterns at the knee and hip could result in identical joint angle patterns during stance phase of walking.
(2) The basic shape of the moment of force patterns for slow to fast cadences was basically the same over the stride period and increased in magnitude as cadence increased. The only exception occurred at the ankle when the eccentrically contracting plantarflexors (during weight acceptance and mid-stance) were least active for the faster cadence group and most active for the slow cadence group.
(3) The variability of the moment of force patterns at the knee and hip decreases as speed increases, the ankle moments show constant and low variability at all cadences.
(4) At all cadences the total extensor/flexor pattern of the lower limb (called support moment) was consistent and has low variability.
(5) A considerable component of the variability across the normal population at all cadences was not random, but shows a high degree
76 D.A. Winter / Kimmatic and kinetic patterns m human gait
of covariance, especially between the hip and knee patterns. These correlated patterns demonstrated the anatomical links due to the biarticulate muscles crossing these joints.
References
Boccardi, S., A. Pedotti, R. Rodano and G.C. Santambrogio, 1981. Evaluation of muscular
moments at the lower limb joints by an on-line processing of kinematic data and ground
reaction. Journal of Biomechanics 14, 35-45.
Bresler, B. and J.P. Frankel, 1950. The forces and moments in the leg during level walking.
Transactions American Society of Mechanical Engineers 72, 27-36.
Lesmes, G.R., D.L. Costill, E.F. Coyle and W.J. Fink, 1978. Muscle strength and power changes
during maximal isokinetic training. Medicine and Science in Sports 10, 266-269.
Wells, R.P., 1981. The projection of the ground reaction force as a predictor of internal joint
moments. Bulletin of Prosthetics Research BPRlO-35, 15-19.
Winter, D.A., 1980. Overall principle of lower limb support during stance phase of gait. Journal of
Biomechanics 13, 923-927.
Winter, D.A., 1983a. Moments of force and mechanical power in jogging. Journal of Biomechanics
16, 91-97.
Winter, D.A., 1983b. Energy generation and absorption at the ankle and knee during fast. natural
and slow cadences. Clinical Orthopaedics and Related Research 175, 147-154.
Yang, J.F. and D.A. Winter, 1984. EMG amplitude normalization methods: on improving its
sensitivity as a diagnostic tool in gait analysis. Archives of Physical medicine and Rehabilita-
tion. (In press.)