Embed Size (px)
Citation preview

Xraise Outreach for CLASSE 161 Synchrotron Drive, Wilson Lab, Cornell University, Ithaca, NY 14853
xraise.classe.cornell.edu
Title: Seeing Math: An Introduction to Graphing
Initial Version Revision:
7 September 2008 10 September 2011
Authors: Jim Overhiser, Dwight “Buzz” Putnam
Appropriate Level: High School Physics
Abstract: A series of guided activities that will illustrate various mathematical relationships seen in a standard physics course of study. Students will collect data and use EXCEL to create scatter graphs.
Time Required: 120 minutes lab period
NY Standards Met: STANDARD 1 M1.1 Use algebraic or geometric representations to describe and compare data.
Represent physics quantities in graphical form
Construct graphs of real-world data (scatter plots, line or curve best-fit)
M2.1 Use deductive reasoning to construct and evaluate conjectures and arguments, recognizing that patterns and relationships in mathematics assist them in arriving at these conjectures and arguments
Interpret graphs to determine the mathematical relationship between the variables.
M3.1 Apply algebraic and geometric concepts and skills to the solution of problems.
Explain the physical relevance of properties of a graphical representation of real-world data, e.g. slope, intercepts, area under the curve
STANDARD 2. 1.1 Understand and use the more advanced features of word procession, spreadsheets, and database software.
Special Notes: This activity assumes student access to computer with graphing and data base software installed.

Page 2
Teacher Section – Seeing Math: An Introduction to Graphing
Behavioral Objectives: Upon completion of this lab activity, students should be able to:
Construct a labeled scatter graph using Microsoft EXCEL.
Describe the mathematical relationship shown by a trend line on a graph. Class Time Required:
120 minutes Teacher Preparation Time:
Minimal. Setting out materials and background reading. Tips for the Teacher:
Check all meters and batteries prior to lab.
Study material defect information.
Students need access to computers with graphing and data base software installed. Assumed Prior Knowledge of Students:
Independent vs dependent variable in data Background Information for Teacher: This activity is an introductory activity for a general High School Physics class and applies math skills. The physics content is very light and not significant to the performance and understanding in this activity.

Page 1
Materials – Seeing Math: An Introduction to Graphing
Seeing Math: An Introduction to Graphing
Quantity Items
Station 1
1 Vernier LabQuest
1 Vernier Magnetic Field Sensor
1 Magnet (cylindrical works best)
1 Metric ruler
Station 2
1 Spring
1 Test tube clamp
1 Mass set with hook
1 Small ring stand (provided by teacher)
1 Meter stick (provided by teacher)
Station 3
1 50-g mass
1 100-g mass
1 200-g mass
1 500-g mass
1 Protractor
1 String
1 Stop watch
1 Hook clamp
1 Small ring stand (provided by teacher)
1 Meter stick (provided by teacher)
Station 4
1 Vernier LabQuest
1 Vernier Go-Motion Detector
Station 5
1 Vernier LabQuest
1 Vernier Go-Motion Detector
1 Large coffee filter
1 2-meter stick (provided by teacher)

Page 1 Student Section – Seeing Math: An Introduction to Graphing
Station 1: Magnetic field meter Materials:
Magnet
LabQuest or computer with Logger Pro software installed
Vernier Magnetic field tester
Metric ruler
Directions:
Record the magnetic field strength (Place the magnet right next to the probe at 1 cm mark to begin and record the field strength. NOTE: Record the absolute value for the magnetic field numbers ( i.e. ignore the negative sign.)
Repeat the step increasing the distance by 1 cm up to 10 centimeters
Graph the data of magnetic field strength vs distance using EXCEL
Add a “Power” trendline to the graph and the equation
Answer related questions on the student sheet.

Page 2 Student Section – Seeing Math: An Introduction to Graphing
Station 2: Spring force Materials:
Mass set with pan
Spring
Meter stick
Small ring stand with test tube clamp
Directions:
Add mass to the suspended spring as indicated in the chart to the right.
Record the amount of stretch with each additional mass added.
Record your data on the student sheet
Graph the data using EXCEL
Add a “Linear” trendline to the graph and the equation
Answer related questions on the student sheet.
Force (grams)
50
100
150
200
250
300
350
400
450
500
Measure from here

Page 3 Student Section – Seeing Math: An Introduction to Graphing
Station 3: Pendulum Materials:
50-g mass
100-g mass
200-g mass
500-g mass
protractor
Meter stick
Small ring stand with hook clamp
String
Stop watch
Directions:
Using the materials listed, use the pendulum to create a data set that shows a direct linear relationship (x α y). Variables that you can measure:
Mass
String length
Starting angle
Time of a period
Answer related questions on the student sheet.
Station 4: Go-Motion®
?
? Make a graph that
looks like this!

Page 4 Student Section – Seeing Math: An Introduction to Graphing
Materials:
Vernier Go-Motion sensor
LabQuest or computer with Logger Pro software installed
Directions:
Describe the motion illustrated on the following plots. Record on Student Sheet
a. d.
b. e.
c. f. Use the Go-Motion detector and the computer to test your answers.
Velocity
-
+
0 Time
Velocity
-
+
0
Time
Distance
Time
Distance
Time
Distance
Time
Distance
Time

Page 5 Student Section – Seeing Math: An Introduction to Graphing
Station 5: Constant Velocity Materials:
Vernier Go-Motion Detector
Large coffee filters
LabQuest or computer with Logger Pro software installed
2-m stick Directions:
Place the Go-Motion detector on the floor.
Position a large coffee filter 1.5-m and directly above the motion detector.
Start the data collecting in Logger Pro and drop the filter. (You must land on the screen on the motion detector - - repeat the activity until this occurs.)
Highlight the region on the graph representing the start to the stop point for the falling filter. This will also highlight the data for the start and stop.
On the data table for this activity, record the Distance vs Time data on the Student Data sheet (Record data for every 1/10th of a second).
Graph the data using EXCEL and determine the constant velocity (cm/second) of this filter using the linear trend-line and show equation function.
Answer the related questions on the Student Sheet.
1.5 meters
Go-Motion

Page 1 Student Answer Sheets – Seeing Math: An Introduction to Graphing
SEEING MATH: AN INTRODUCTION TO GRAPHING Pre-lab questions
Name ________________________________________________ 1. Identify the variables in the slope formula. (y = mx + b)
a. y= b. m= c. x= d. b=
2. Slope is a derived formula. Explain what this means.
3. Explain what this means. ( X Y) 4. Plot the following data on the graph to the right or using EXCEL 5. What is the relationship between Time and Distance in this data?
6. Determine the slope of this graph.
7. What does this slope value represent relative to the data?
Time (s) Distance (m)
0 0
1 10
2 20
3 30
4 40
5 50
6 60
7 70
8 80
Distance
Time
Page 2 Student Answer Sheets – Seeing Math: An Introduction to Graphing
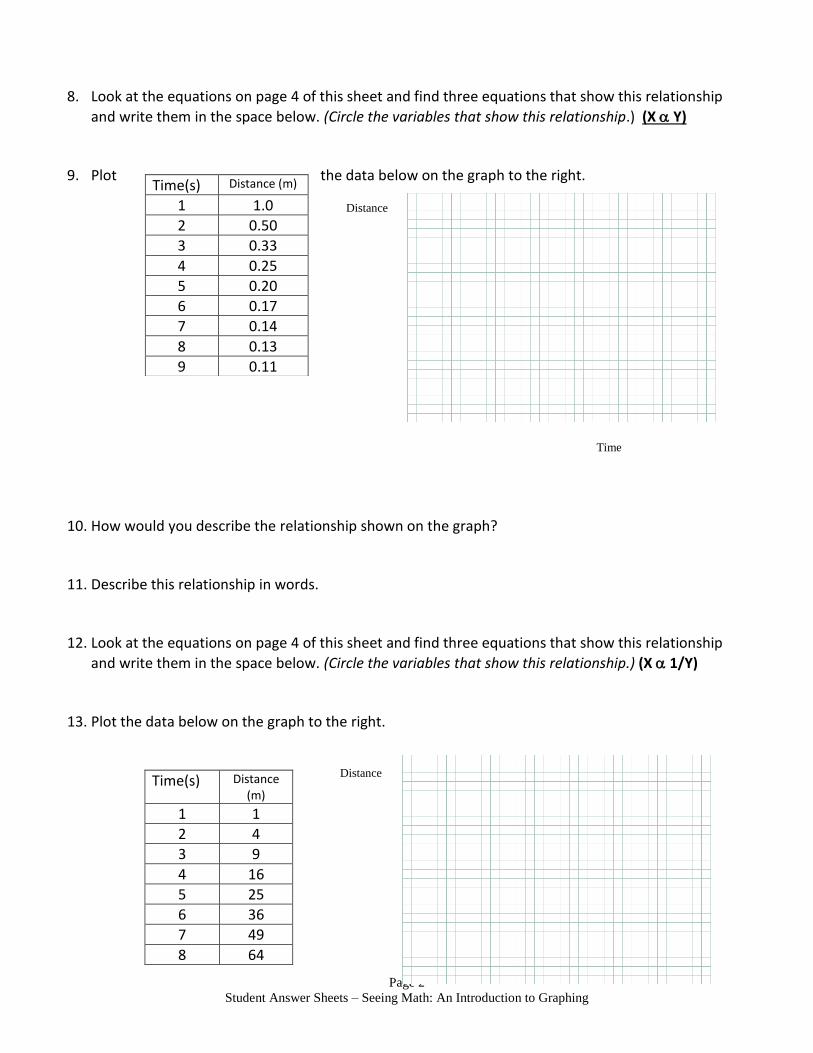
8. Look at the equations on page 4 of this sheet and find three equations that show this relationship
and write them in the space below. (Circle the variables that show this relationship.) (X Y) 9. Plot the data below on the graph to the right. 10. How would you describe the relationship shown on the graph?
11. Describe this relationship in words.
12. Look at the equations on page 4 of this sheet and find three equations that show this relationship
and write them in the space below. (Circle the variables that show this relationship.) (X 1/Y)
13. Plot the data below on the graph to the right.
Time(s) Distance (m)
1 1
2 4
3 9
4 16
5 25
6 36
7 49
8 64
Time(s) Distance (m)
1 1.0
2 0.50
3 0.33
4 0.25
5 0.20
6 0.17
7 0.14
8 0.13
9 0.11
Distance
Time
Distance

Page 3 Student Answer Sheets – Seeing Math: An Introduction to Graphing
9 81
14. Mathematically describe the relationship between Y and X.
15. Describe the relationship in words.
16. Look at the equations on page 3 of this sheet and find three equations that show this relationship
and write them in the space below. (Circle the variables that show this relationship.) (X 1/Y2)
17. Plot the data below on the graph to the right.
Time(s) Distance (m)
1 1.0
2 0.25
3 0.11
4 0.06
5 0.04
6 0.03
7 0.02
8 0.015
9 0.012
18. How would you describe the relationship shown on the graph?
19. Study the following equation. Circle the variables that, if plotted, would show the same trend as you graphed in # 15.
KE = 1/2 mv2
20. Look at the equations in the right margin on the following page and find three equations that show the same trend as you graphed in # 15 and write them in the space below. (Circle the variables that
show this relationship.) (x α 1/y2)
Time
Distance
Time

Page 4 Student Answer Sheets – Seeing Math: An Introduction to Graphing
21. In the following questions, two variables from a common physics equation are listed. Determine the relationship between these variables in the equation and label the appropriate axis and fill-in the basic shape of the plot that shows this relationship.
a. a and m in F = ma b. x and F in Fs = kx c. r2 and F in d. x2 and PEs in

Page 5 Student Answer Sheets – Seeing Math: An Introduction to Graphing
SEEING MATH: AN INTRODUCTION TO GRAPHING Lab Questions
Name ________________________________________________ Purpose:
Develop knowledge of graphs as a tool for representing physical relationships
Relate graphical representation of data to mathematical relationships. Station 1: Magnetic field meter 1. Data: 2. In your own words, describe the relationship between the magnetic field intensity and the distance
based on your experience and the graphical information. 3. According to the equation given for the plot, what is the relationship between Intensity and Distance
for this activity? 4. The relationship between Intensity and distance for this activity is non-linear. What does this mean? 5. RESEARCH: Find another physics concept that has similar relationship to this activity. Explain in the
space below, the similarity between the concepts.
Distance (cm)
Magnetic Intensity (|mT|)
1
2
3
4
5
6
7
8
9
10
Record absolute values

Page 6 Student Answer Sheets – Seeing Math: An Introduction to Graphing
Station 2: Spring force
6. Data: 7. In your own words, describe the relationship between the force and the spring stretch based on
your experience and the graphical information. 8. According to the equation given for the plot, what is the relationship between force and the
spring stretch for this activity? 9. The relationship between force and the spring stretch for this activity is linear. What does this
mean? 10. What is the equation given for this line? __________________________ 11. What is the slope of this line? _____________________________ 12. If you were given a stiffer spring, what would happen to the plot on this graph?
Station 3: Pendulum
13. Describe the activity that created the linear relationship for the pendulum.
Force (grams) Stretch (cm)
50
100
150
200
250
300
350
400
450
500
Page 7 Student Answer Sheets – Seeing Math: An Introduction to Graphing
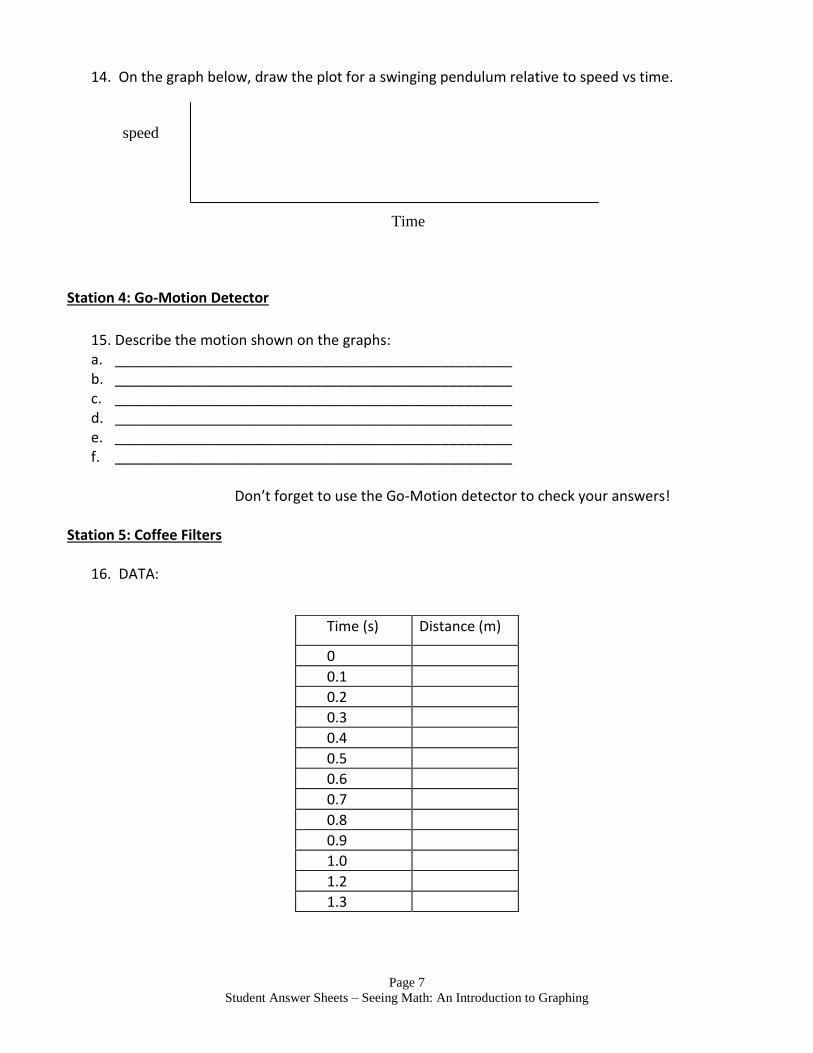
14. On the graph below, draw the plot for a swinging pendulum relative to speed vs time.
Station 4: Go-Motion Detector
15. Describe the motion shown on the graphs: a. __________________________________________________ b. __________________________________________________ c. __________________________________________________ d. __________________________________________________ e. __________________________________________________ f. __________________________________________________
Don’t forget to use the Go-Motion detector to check your answers!
Station 5: Coffee Filters
16. DATA:
Time (s) Distance (m)
0
0.1
0.2
0.3
0.4
0.5
0.6
0.7
0.8
0.9
1.0
1.2
1.3
speed
Time

Page 8 Student Answer Sheets – Seeing Math: An Introduction to Graphing
17. Using the linear graph you made from the coffee filter drop, using the graphing program, determine the slope of the part of the drop where the velocity was constant.
18. Determine the constant velocity of the plot area you determined in question 17.