Embed Size (px)
DESCRIPTION
Math and Graphing Notes. Chapter 1. Precision. The precision of a number describes the degree of exactness of the measurement. - PowerPoint PPT Presentation
Citation preview
Math and Graphing Notes
Chapter 1
Precision
The precision of a number describes the degree of exactness of the measurement. Ex. A beaker of water is placed on a
triple beam balance and is measured to have a mass of 421.5 grams. The same beaker is placed on an electronic balance and the mass is given as 421.5211 grams. Both numbers are correct, but the second number is more precise.
Accuracy
For a measurement to be accurate, the value must be very close to the “real” value. Ex. The teacher has already measured
the mass of a wooden block to be 11.2 grams. If a student were to measure the same block and return a mass of 11.3 grams, we would say that the student had a very accurate measurement.
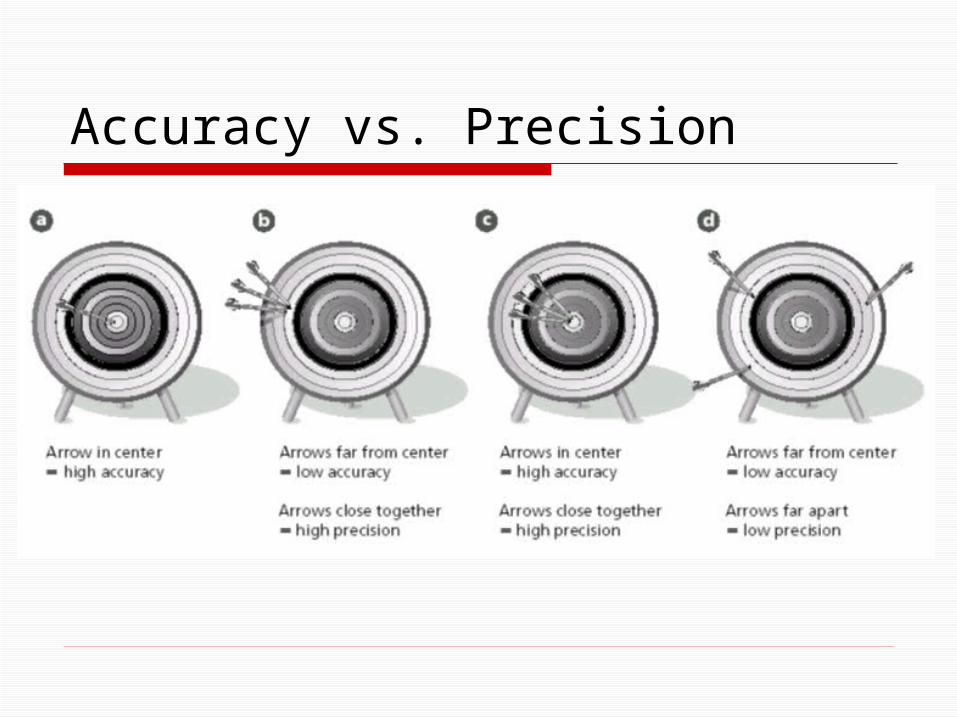
Accuracy vs. Precision
Significant Figures
All measurements that are made are subject to some uncertainty. Some scales that you weigh objects on
might read to 1 decimal place while others might be more precise and measure to 3 decimal places
When doing math with measurements, numbers cannot become more precise.
Determining Sig Figs
When given any number, there are rules that can be followed to determine how many digits within that number are “precision” digits, aka Sig Figs.
Determining Sig Figs
Let’s look a few examples:a. 1492b. 101c. 200d. 0.005e. 0.750f. 102.070
Determining Sig Figs
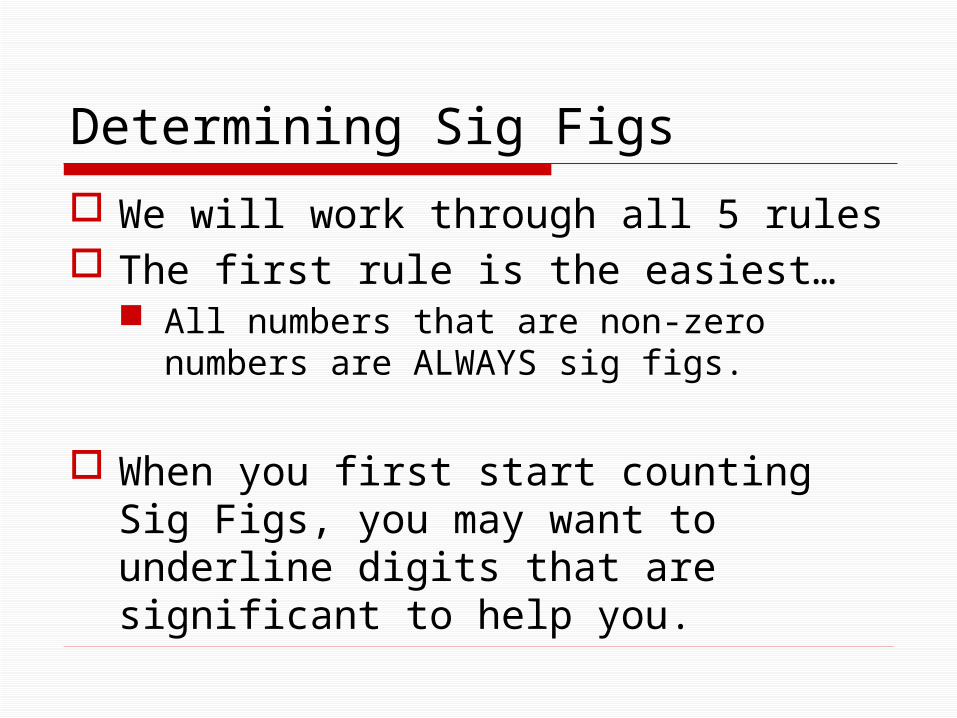
We will work through all 5 rules The first rule is the easiest…
All numbers that are non-zero numbers are ALWAYS sig figs.
When you first start counting Sig Figs, you may want to underline digits that are significant to help you.
Determining Sig Figs
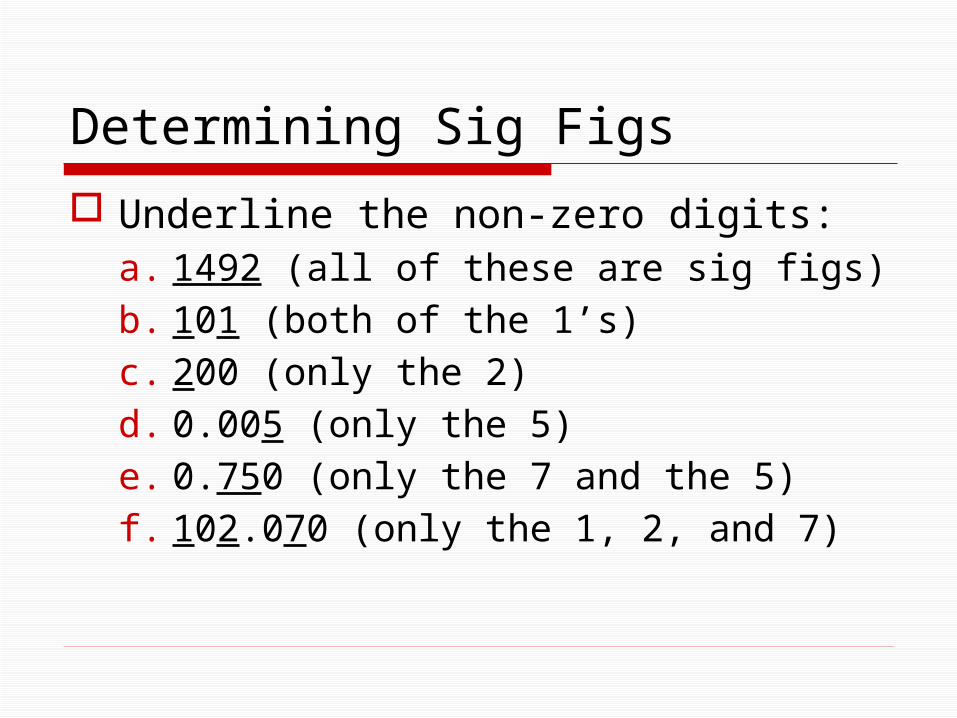
Underline the non-zero digits:a. 1492 (all of these are sig figs)b. 101 (both of the 1’s)c. 200 (only the 2)d. 0.005 (only the 5)e. 0.750 (only the 7 and the 5)f. 102.070 (only the 1, 2, and 7)
Determining Sig Figs
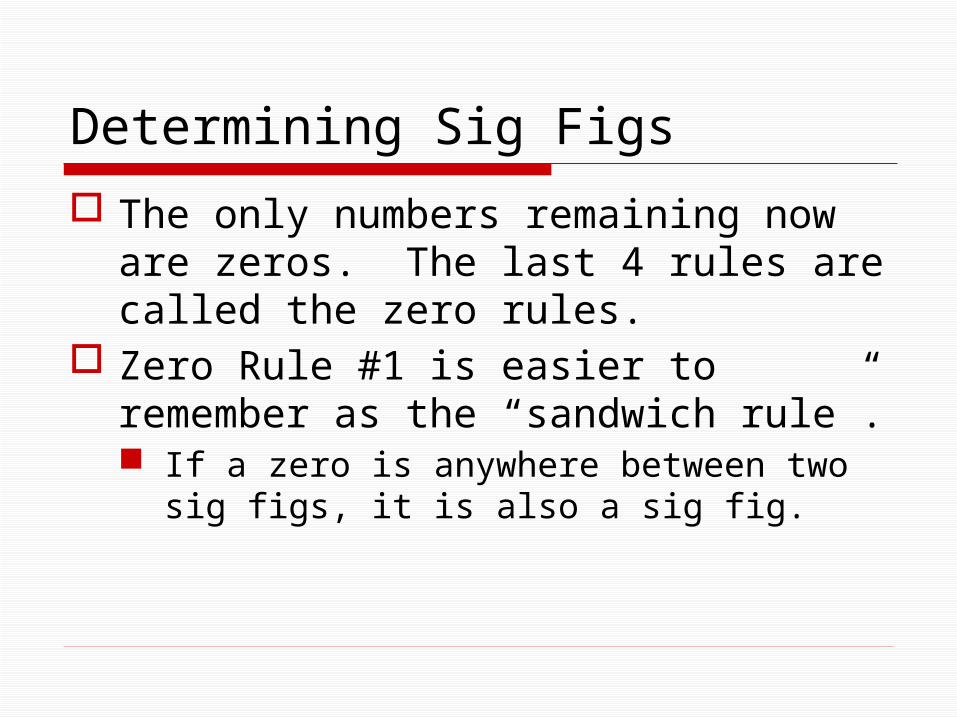
The only numbers remaining now are zeros. The last 4 rules are called the zero rules.
Zero Rule #1 is easier to remember as the “sandwich rule”. If a zero is anywhere between two sig
figs, it is also a sig fig.
Determining Sig Figs
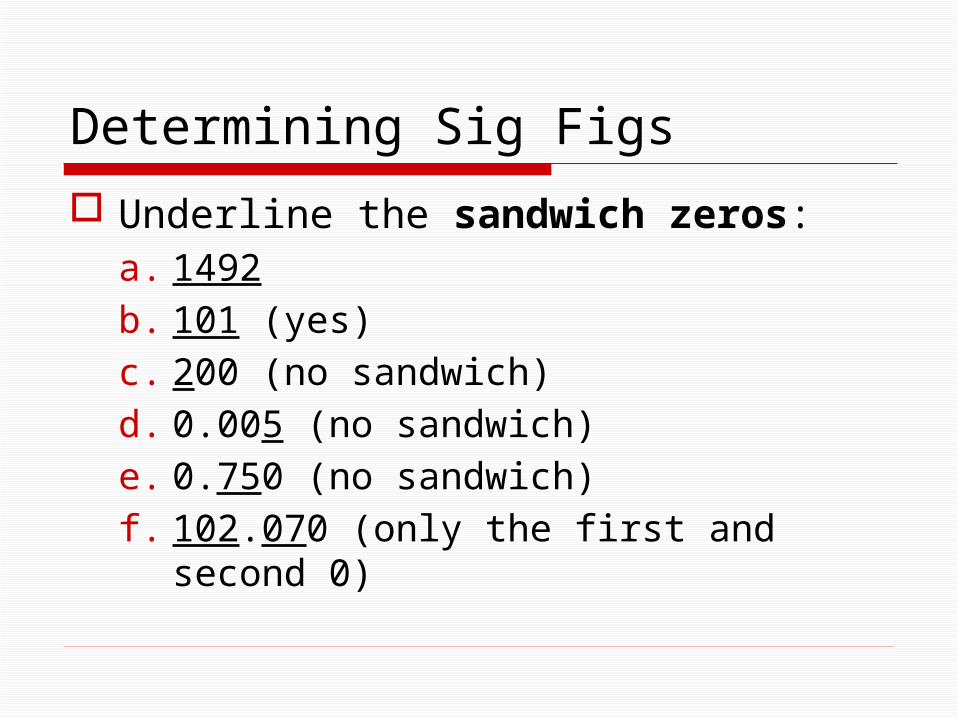
Underline the sandwich zeros:a. 1492b. 101 (yes)c. 200 (no sandwich)d. 0.005 (no sandwich)e. 0.750 (no sandwich)f. 102.070 (only the first and second 0)
Determining Sig Figs
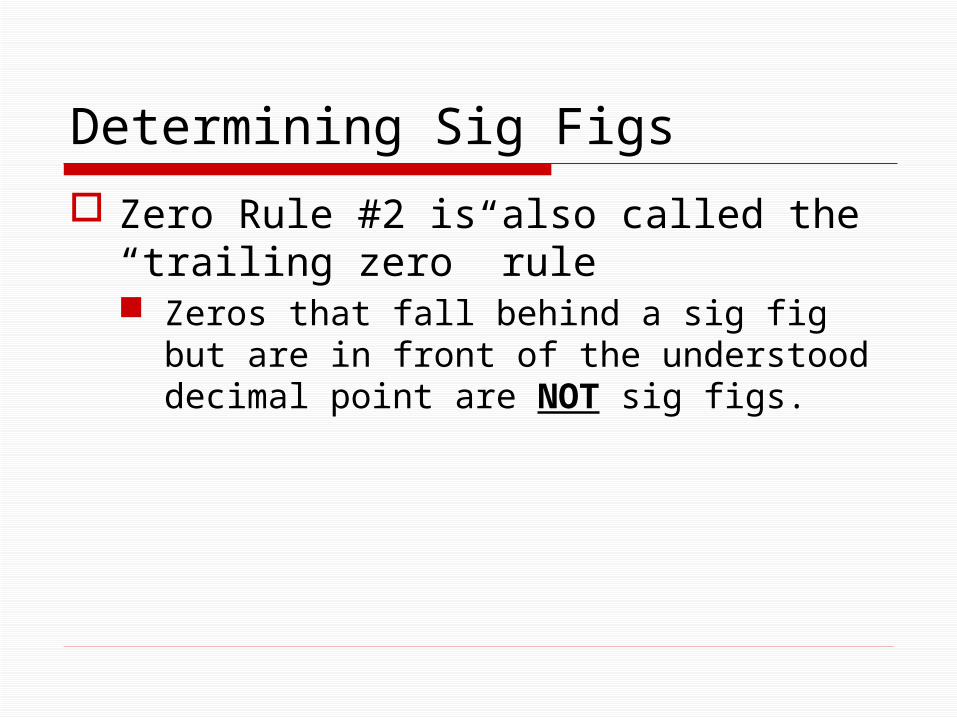
Zero Rule #2 is also called the “trailing zero” rule Zeros that fall behind a sig fig but are in
front of the understood decimal point are NOT sig figs.
Determining Sig Figs
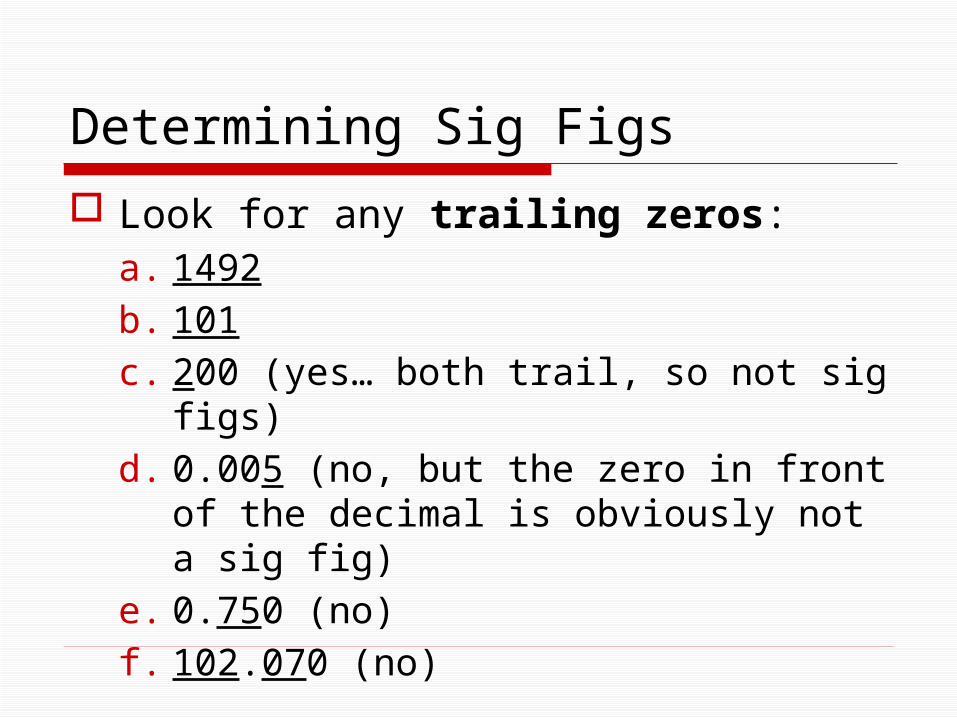
Look for any trailing zeros:a. 1492b. 101c. 200 (yes… both trail, so not sig figs)d. 0.005 (no, but the zero in front of the
decimal is obviously not a sig fig)e. 0.750 (no)f. 102.070 (no)
Determining Sig Figs
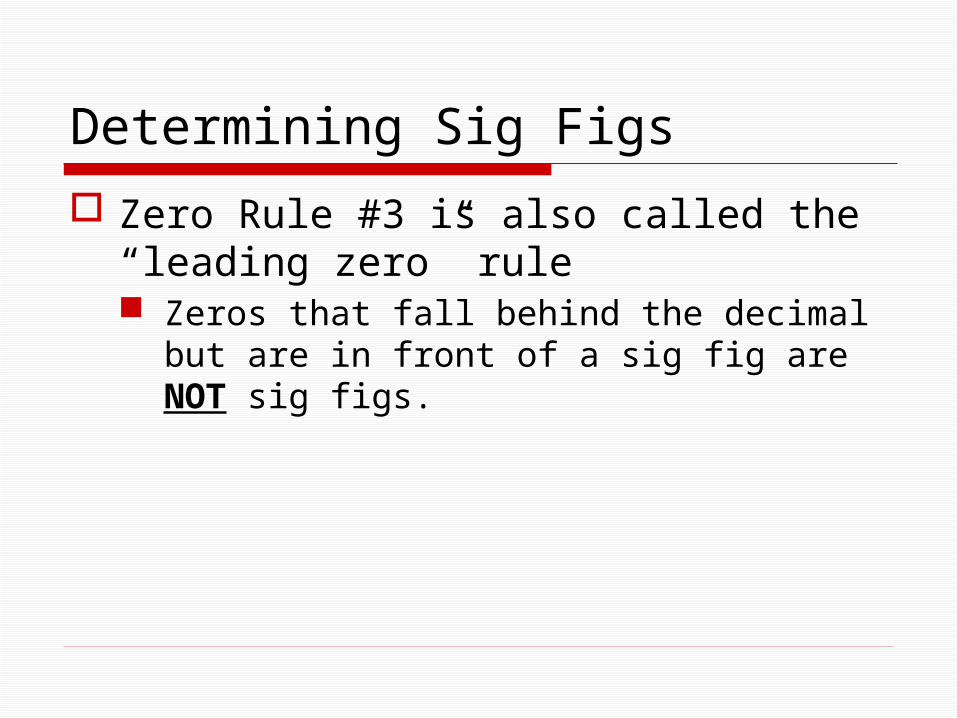
Zero Rule #3 is also called the “leading zero” rule Zeros that fall behind the decimal but
are in front of a sig fig are NOT sig figs.
Determining Sig Figs
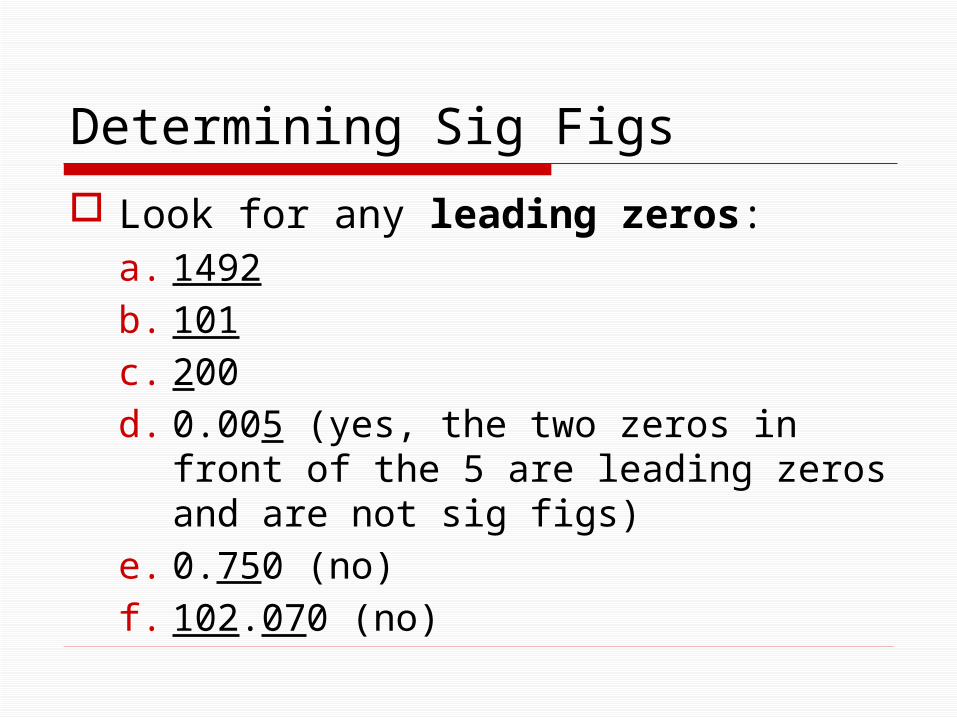
Look for any leading zeros:a. 1492b. 101c. 200d. 0.005 (yes, the two zeros in front of
the 5 are leading zeros and are not sig figs)
e. 0.750 (no)f. 102.070 (no)
Determining Sig Figs
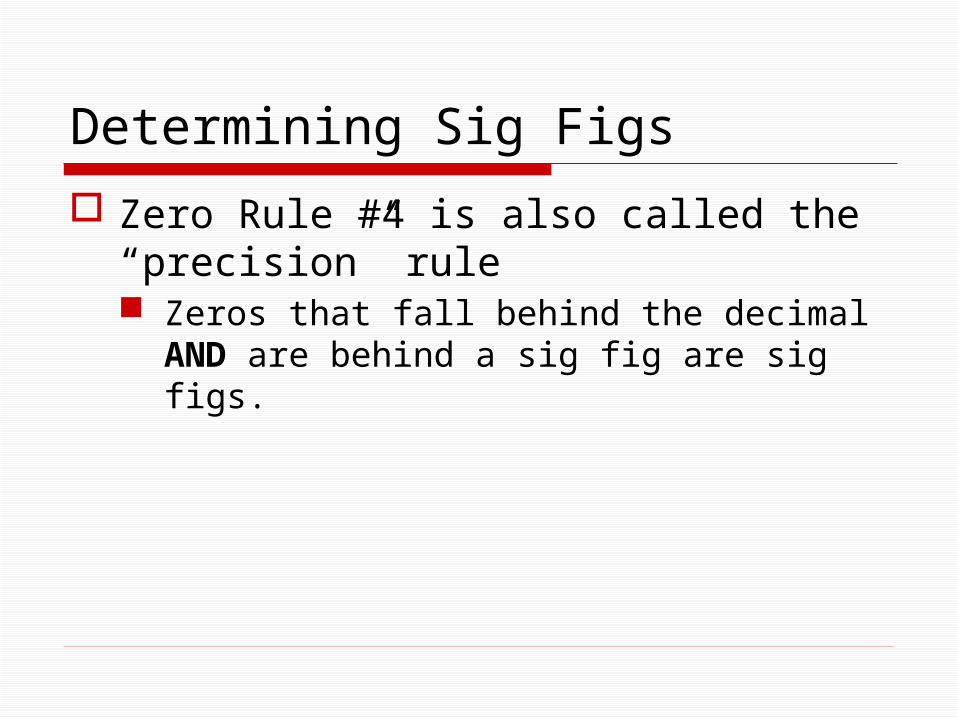
Zero Rule #4 is also called the “precision” rule Zeros that fall behind the decimal AND
are behind a sig fig are sig figs.
Determining Sig Figs
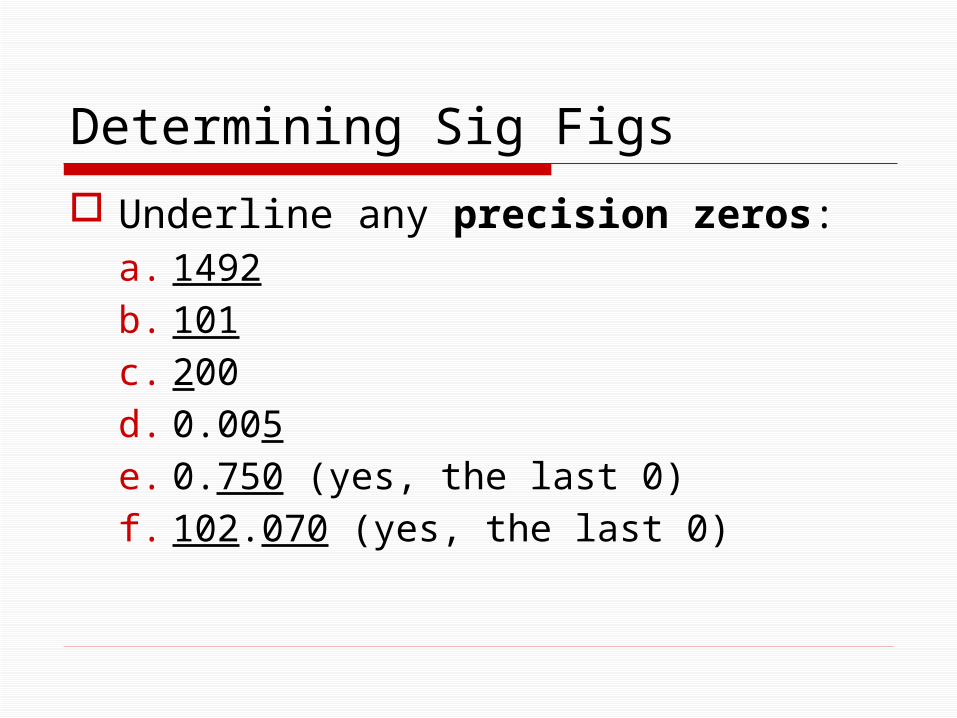
Underline any precision zeros:a. 1492b. 101c. 200d. 0.005e. 0.750 (yes, the last 0)f. 102.070 (yes, the last 0)
Determining Sig Figs
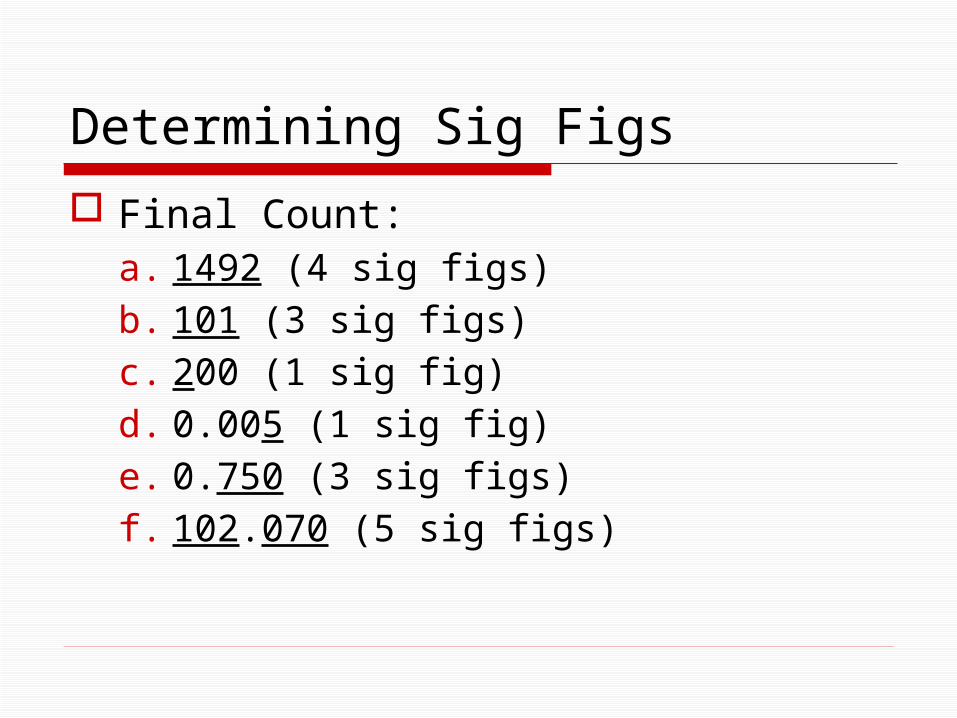
Final Count:a. 1492 (4 sig figs)b. 101 (3 sig figs)c. 200 (1 sig fig)d. 0.005 (1 sig fig)e. 0.750 (3 sig figs)f. 102.070 (5 sig figs)
Things to remember…
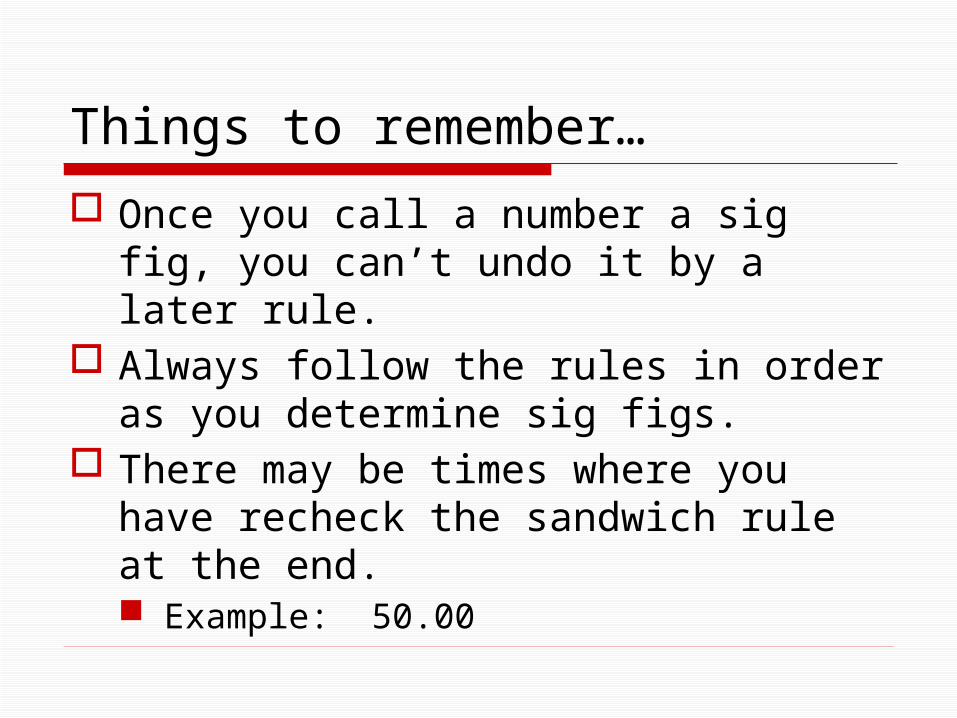
Once you call a number a sig fig, you can’t undo it by a later rule.
Always follow the rules in order as you determine sig figs.
There may be times where you have recheck the sandwich rule at the end. Example: 50.00
Scientific Notation
Many times in science we have to use very large numbers or very small numbers. In these times, it makes more sense to use a special notation rather than writing a number like 9,000,000,000,000 meters.
When using Scientific Notation, you must know how to count sig figs.
Scientific Notation
Luckily, most calculators can do this for you. But… in the event that you forget your calculator, everyone should know how to do this by hand.
After we review the “old-fashioned way”, I will demonstrate how to do this on the calculator.
Scientific Notation
Please copy down these 3 example numbers.a. 2603000b. 0.0000484c. 300000000
Please follow the rules and underline the sig figs in each number.
Scientific Notation
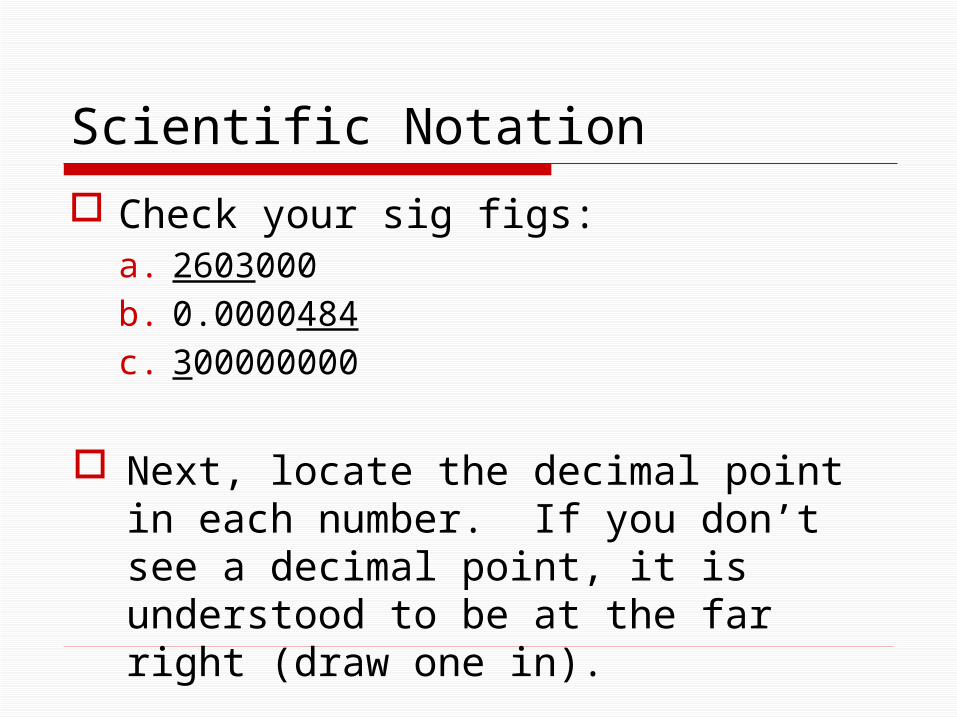
Check your sig figs:a. 2603000b. 0.0000484c. 300000000
Next, locate the decimal point in each number. If you don’t see a decimal point, it is understood to be at the far right (draw one in).
Scientific Notation
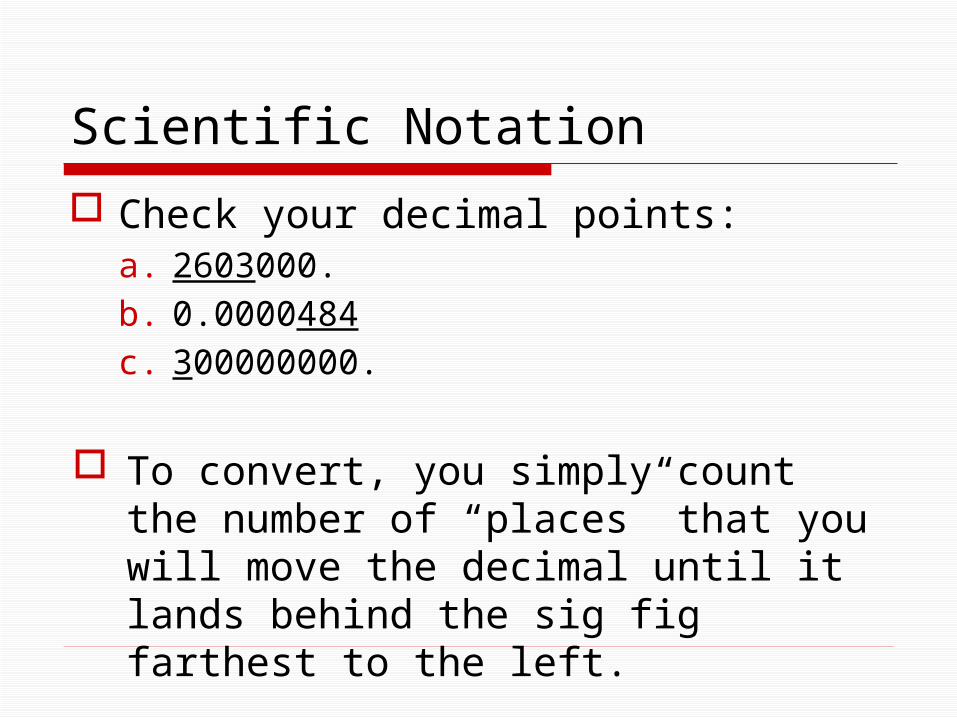
Check your decimal points:a. 2603000.b. 0.0000484c. 300000000.
To convert, you simply count the number of “places” that you will move the decimal until it lands behind the sig fig farthest to the left.

Scientific Notation
Check your decimal points:a. 2603000. (6 places)b. 0.0000484 (5 places)c. 300000000. (8 places)
Scientific Notation
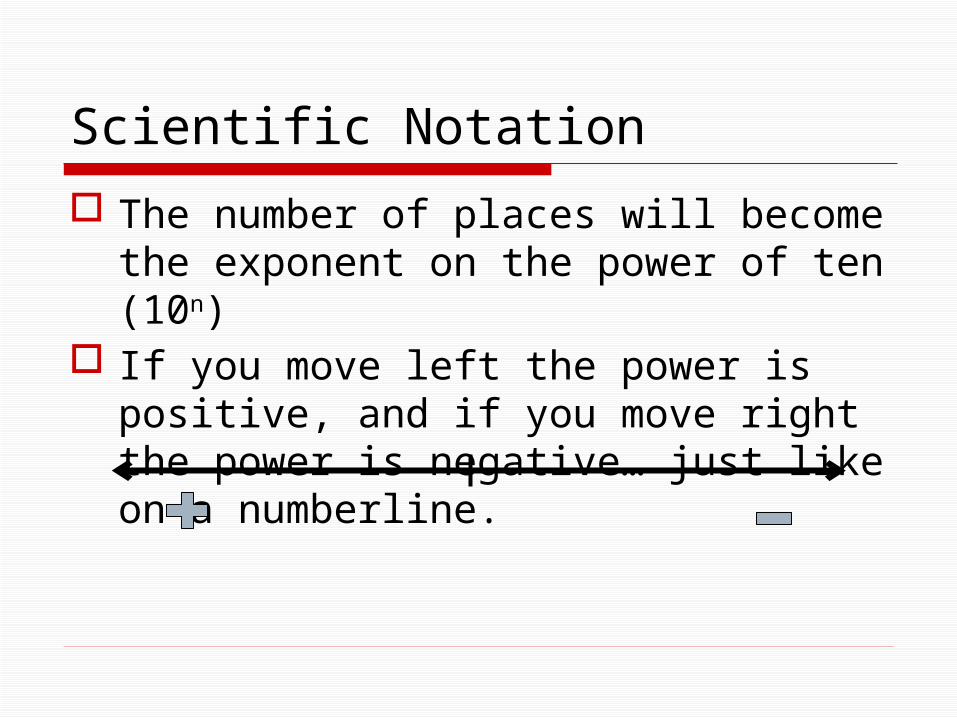
The number of places will become the exponent on the power of ten (10n)
If you move left the power is positive, and if you move right the power is negative… just like on a numberline.
Scientific Notation
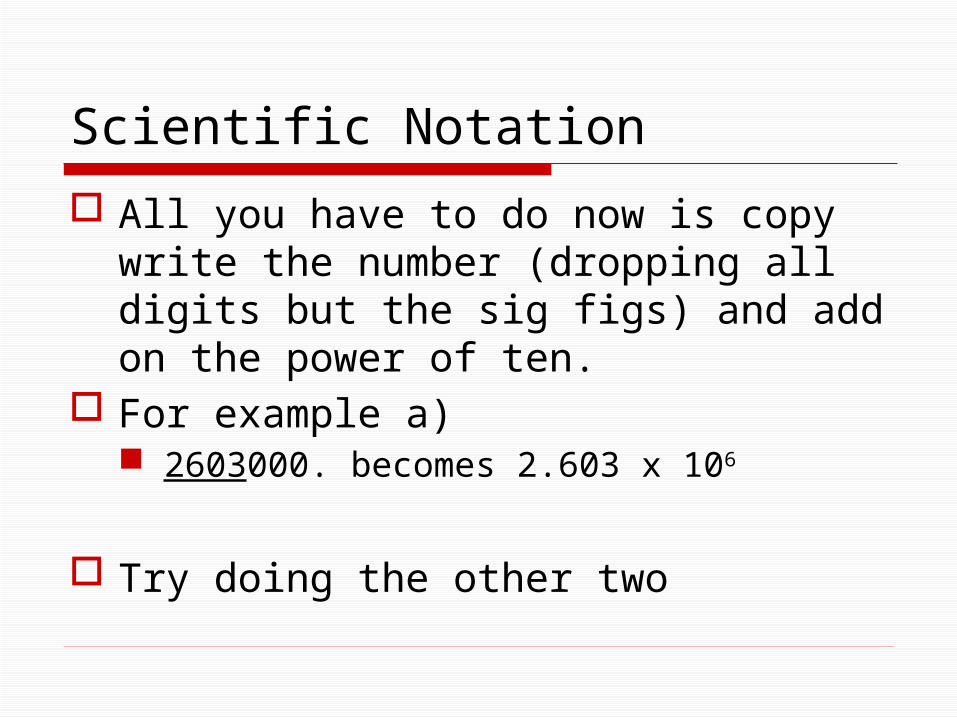
All you have to do now is copy write the number (dropping all digits but the sig figs) and add on the power of ten.
For example a) 2603000. becomes 2.603 x 10⁶
Try doing the other two
Scientific Notation
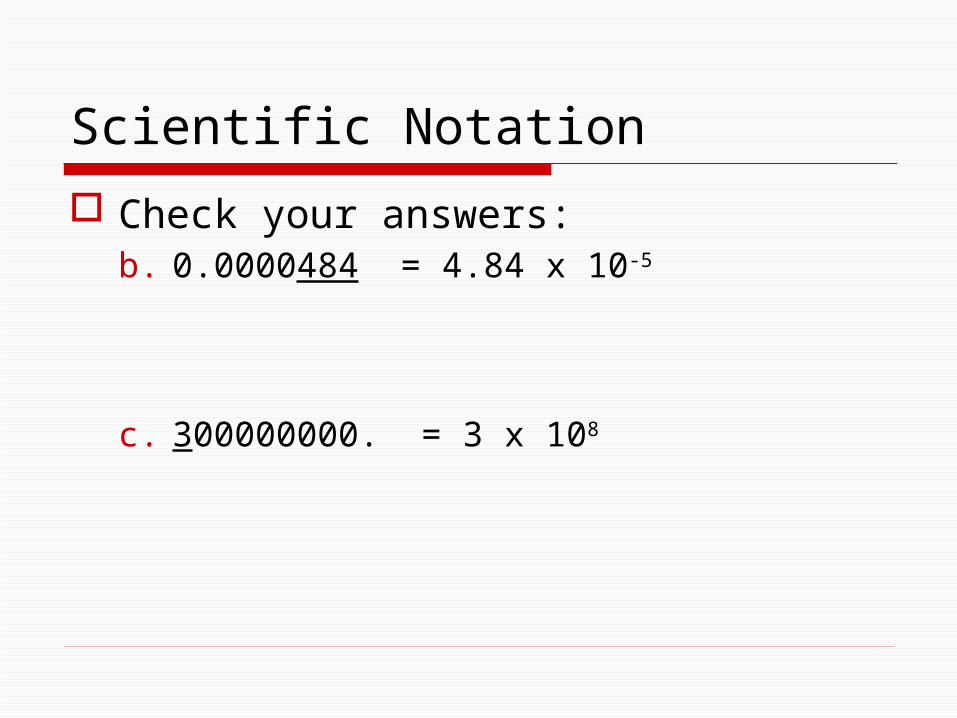
Check your answers:b. 0.0000484 = 4.84 x 10⁻⁵
c. 300000000. = 3 x 10⁸
Scientific Notation
Now, the easy way… Find a button (or above a button) on
your calculator with the letters SCI Press that button (or 2nd then that
button) to place your calculator in Scientific mode
Type any of our three examples and press enter.
Scientific Notation
So a calculator can tell you the scientific notation for any number… GREAT!
But what if I give you a question where the numbers are already in scientific notation and you have to use them mathematically…
How do you type them on the calculator?
Scientific Notation
Copy down the following question: (3.00 x 108) x (4.80 x 102) = ?
Before we go on, locate one of the following buttons on your calculator:
EE, x10n, or EXP
Scientific Notation
EE, x10n, or EXP These buttons allow you to enter a
number that is already in scientific mode.
To enter the first number, press this:( 3.00 EE 8 )
You will probably see that the calculator screen only shows one E… that’s ok… don’t press it twice!
Scientific Notation
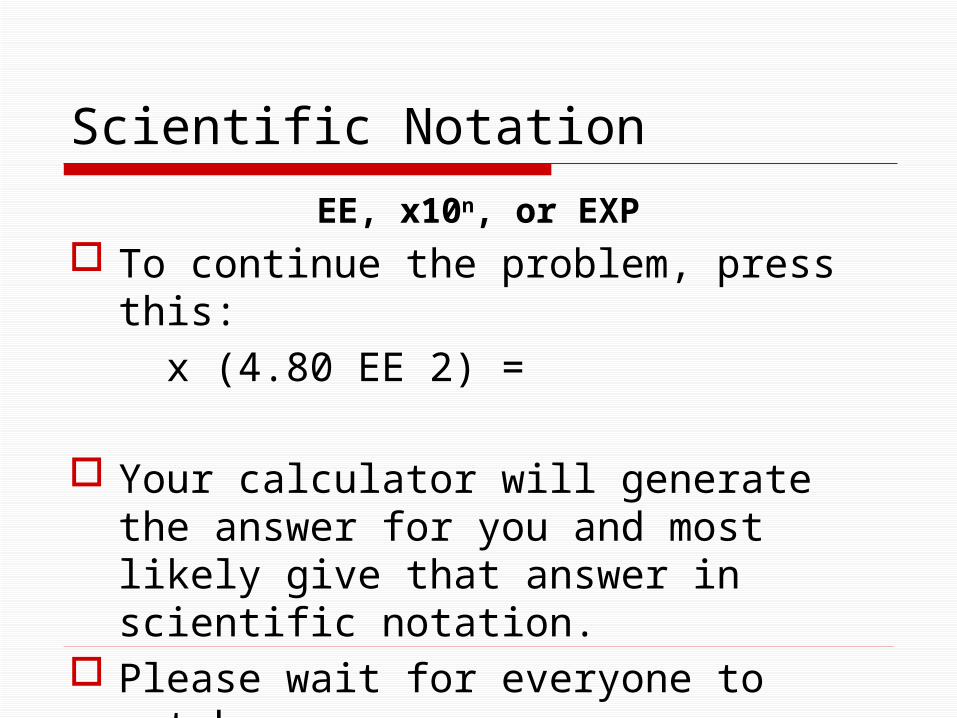
EE, x10n, or EXP To continue the problem, press this:
x (4.80 EE 2) =
Your calculator will generate the answer for you and most likely give that answer in scientific notation.
Please wait for everyone to catch up.
Scientific Notation
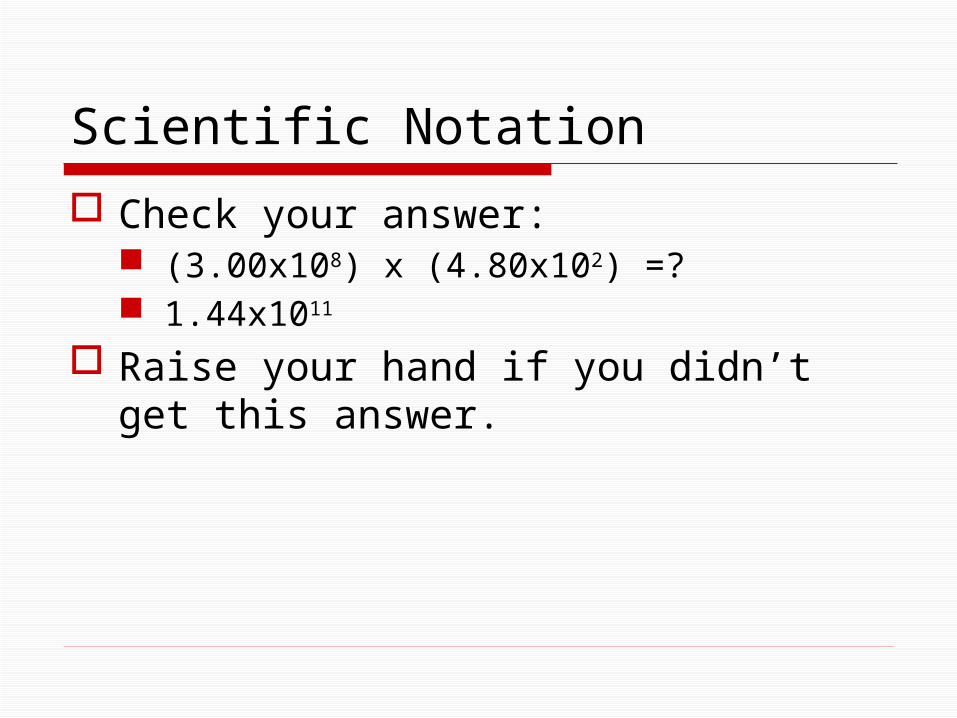
Check your answer: (3.00x108) x (4.80x102) =? 1.44x10¹¹
Raise your hand if you didn’t get this answer.
About your final answer…
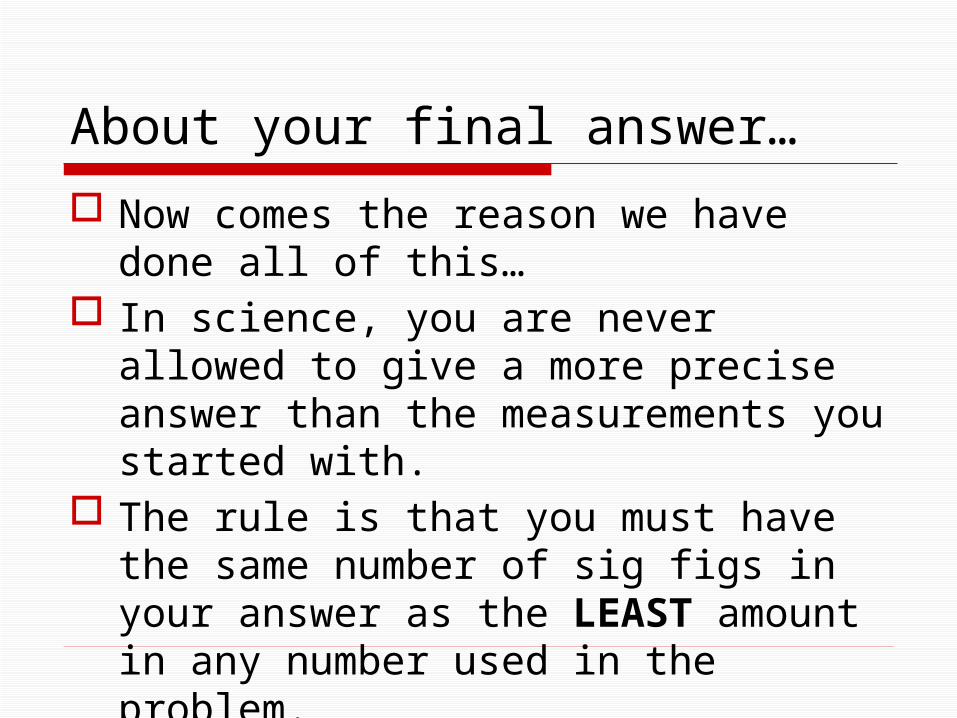
Now comes the reason we have done all of this…
In science, you are never allowed to give a more precise answer than the measurements you started with.
The rule is that you must have the same number of sig figs in your answer as the LEAST amount in any number used in the problem.
About your final answer…
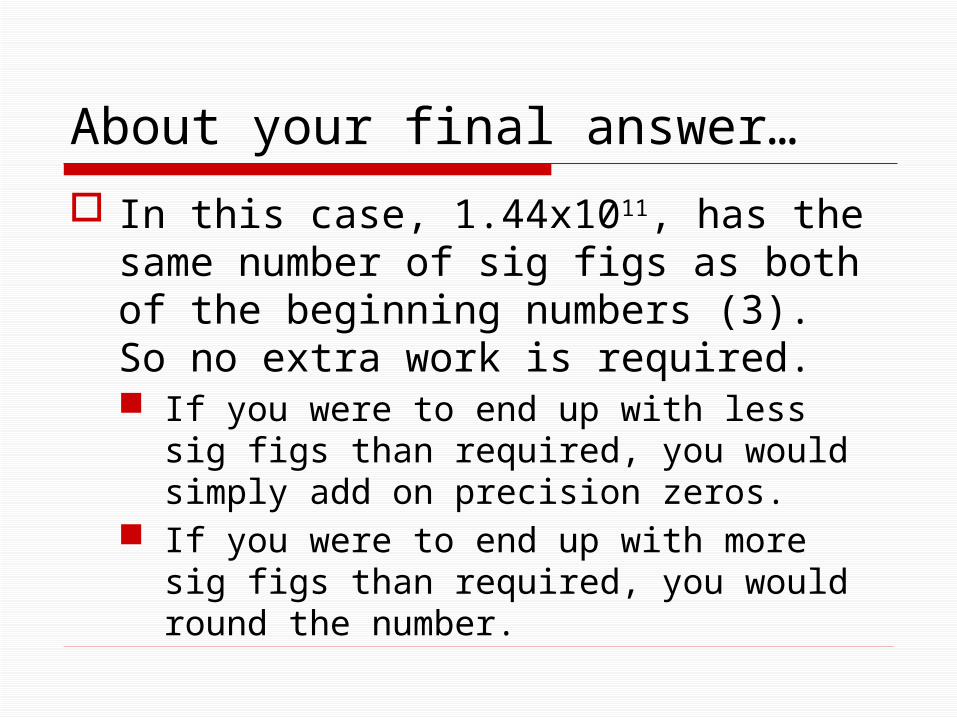
In this case, 1.44x10¹¹, has the same number of sig figs as both of the beginning numbers (3). So no extra work is required. If you were to end up with less sig figs
than required, you would simply add on precision zeros.
If you were to end up with more sig figs than required, you would round the number.
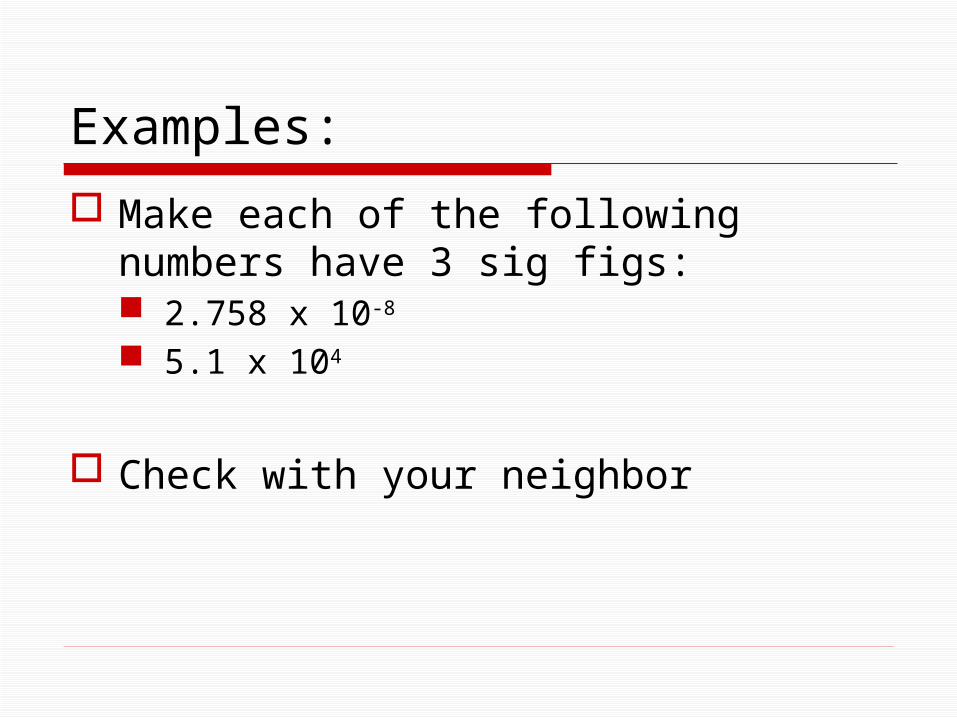
Examples:
Make each of the following numbers have 3 sig figs: 2.758 x 10⁻⁸ 5.1 x 10⁴
Check with your neighbor
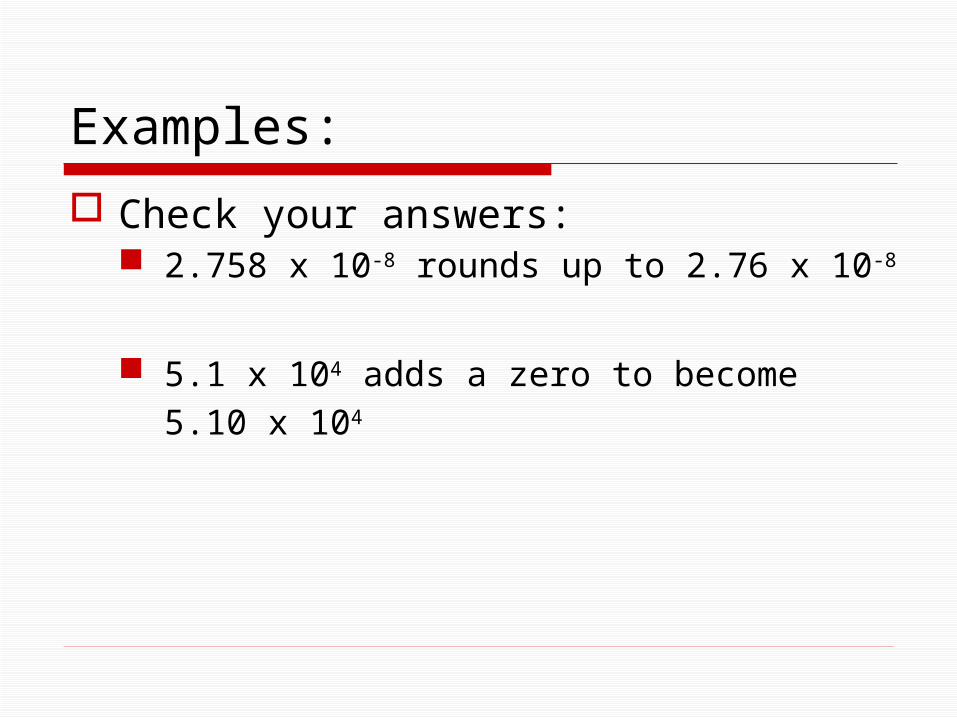
Examples:
Check your answers: 2.758 x 10⁻⁸ rounds up to 2.76 x 10⁻⁸
5.1 x 10⁴ adds a zero to become 5.10 x 10⁴
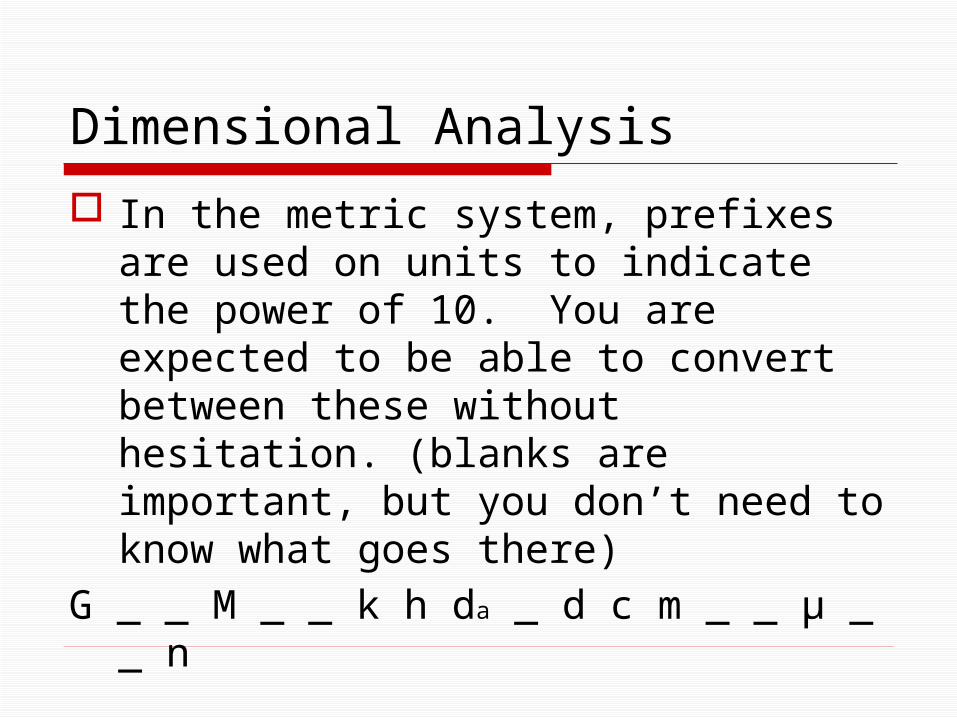
Dimensional Analysis
In the metric system, prefixes are used on units to indicate the power of 10. You are expected to be able to convert between these without hesitation. (blanks are important, but you don’t need to know what goes there)
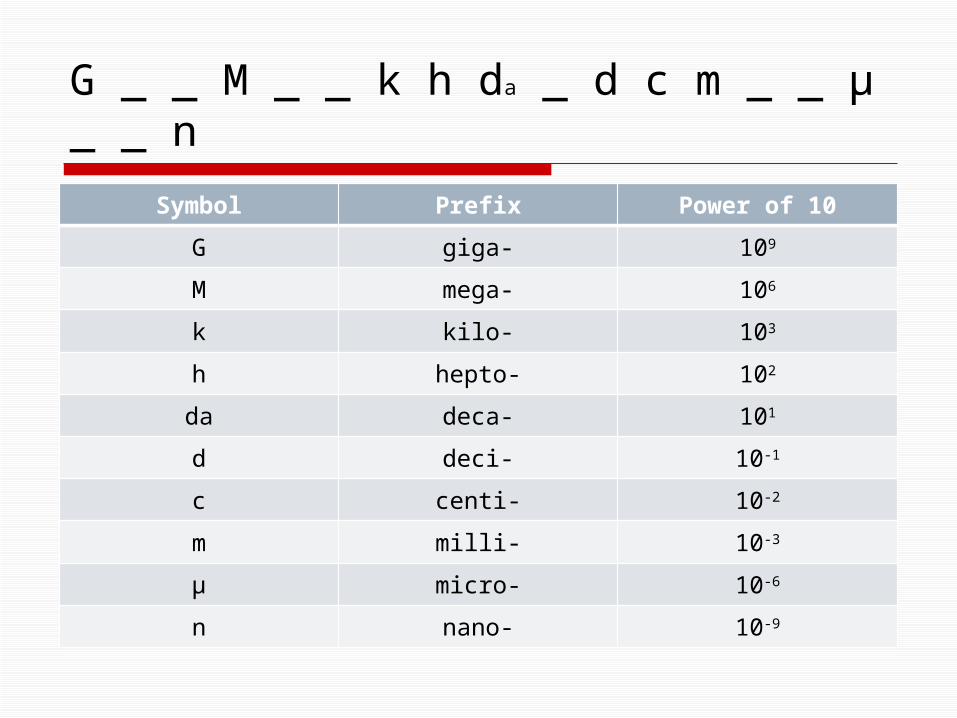
G _ _ M _ _ k h da _ d c m _ _ μ _ _ n
G _ _ M _ _ k h da _ d c m _ _ μ _ _ n
Symbol Prefix Power of 10
G giga- 109
M mega- 106
k kilo- 103
h hepto- 102
da deca- 101
d deci- 10-1
c centi- 10-2
m milli- 10-3
μ micro- 10-6
n nano- 10-9
Parts of a line graph:
Title Axis Labels Number Scale Data Points Line Legend/Key
Title of Graph
Placed above the top portion of the graph
Should be descriptive of what is being observed
Not necessary to use the word “graph” in the title
Axis Labels
Should have the independent variable on the x-axis and the dependent variable on the y-axis.
Both Labels should also include the unit of measurement in parentheses
Number Scale
Should be a pattern (counting by 2, 5, 10, etc)
Should allow the graph to take up as much space as possible on the available graph paper.
The scale usually starts at zero in the bottom left corner
Data Points
Should be large enough to see, but not much larger than the thickness of the line.
Placement must be very close to actual location for full credit.
Line
Unless instructed otherwise, the points should be connected from left to right (one at a time) using a ruler to make perfectly straight lines.
If there are multiple lines on a single graph, each line should have a different color to help distinguish it
Legend/Key A legend is only necessary if there are
multiple sets of data put on a single graph.
The legend should identify the data set and match it to the corresponding color used on the graph.
The usual placement for a legend is either to the right of the graph or below it.