Embed Size (px)
Citation preview

Title Regulatory Arbitrage and International Bank Flows
Author(s) Houston, JF; Lin, C; Ma, Y
Citation Journal of Finance, 2012, v. 67 n. 5, p. 1845-1895
Issued Date 2012
URL http://hdl.handle.net/10722/192342
Rights Creative Commons: Attribution 3.0 Hong Kong License

Electronic copy available at: http://ssrn.com/abstract=1525895
1
Regulatory Arbitrage and International Bank Flows*
Joel F. Houston, Chen Lin, Yue Ma
August 26, 2011
Forthcoming, Journal of Finance
ABSTRACT
We study whether cross-country differences in regulations have affected international bank flows. We find strong evidence that banks have transferred funds to markets with fewer regulations. This form of regulatory arbitrage suggests there may be a destructive “race to the bottom” in global regulations which restricts domestic regulators’ ability to limit bank risk-taking. However, we also find that the links between regulation differences and bank flows are significantly stronger if the recipient country is a developed country with strong property rights and creditor rights. This suggests that while differences in regulations have important influences, that without a strong institutional environment, lax regulations are not enough to encourage massive capital flows.
* Contact Information: Joel F. Houston, Department of Finance Insurance & Real Estate, Warrington College of Business Administration, University of Florida, PO BOX 117168, Gainesville, FL 32611-7168. (352) 302-7546, [email protected]; Chen Lin, Department of Finance, Chinese University of Hong Kong, [email protected]; Yue Ma, Department of Economics, Lingnan University, Hong Kong, [email protected]. We thank Campbell Harvey (the editor), an associate editor and the referee for their very constructive and helpful comments. We thank Thorsten Beck, Daniel Berkowitz, David Brown, Charles Calomiris, Murillo Campello, Olivier De Jonghe, Avinash Dixit, Andrew Filardo, Mark Flannery, Borja Larrain, Micah Officer, Frank Packer, Eswar Prasad, Jun Qian, Mike Ryngaert, Frank Song, Yihui Wang, Yuhai Xuan, Bernard Yeung, Haibin Zhu and participants of 2009 ICCFFI conference in Hong Kong, 2010 Asian Development Bank Institute-China Banking Regulatory Commission-IMF conference on Banking Regulation and Financial Stability in Beijing and seminar participants at Chinese University of Hong Kong, National University of Singapore, Peking University, Tsinghua University and Tulane University for helpful comments. We also thank Philip Wooldridge from the BIS for clarifying some important conceptual issues of the BIS data and offering useful comments on our research.

Electronic copy available at: http://ssrn.com/abstract=1525895
2
1. Introduction
The rapid increase in international banking and financial flows represents one of the most
remarkable developments in the world economy over the past decade. According to statistics from
the Bank for International Settlements (BIS),1 international banks’ foreign claims increased from 1.12
trillion dollars in 1987 to 34 trillion dollars in 2007, suggesting that the international banking system
is becoming a more important conduit for the transfer of capital across countries (McGuire and
Tarashev, 2008).
Despite the large level of international bank flows, and despite recent attempts to increase the
global coordination of bank regulation, much of the bank regulation and supervision remains national.
Given this environment, it is reasonable to presume that cross-country differences in banking
regulations may encourage the flow of bank capital from markets that are heavily regulated to those
markets that are less regulated. In one respect, this cross-country “regulatory competition” may enable
banks to effectively evade costly regulations, which improves capital market efficiency and enhances
global economic growth. Notwithstanding these potential benefits, there is a fear that this
“regulatory competition” should more appropriately be viewed as a form of “regulatory arbitrage” that
creates a “race to the bottom” which enables banks to circumvent prudent regulations and take
excessive risks (Barth, Caprio and Levine, 2006, p.68). Given the interconnected nature of the
financial markets and institutions, these types of regulatory arbitrage activities might expose all
jurisdictions to the influence of excessive risk taking.2
Not surprisingly, these issues have received renewed attention in the aftermath of the recent
financial crisis3. Moreover, the global crisis has spurred widespread calls for increased regulation and
has also led both academics and practitioners to reaffirm the need for global coordination in bank
1 The BIS monitors foreign claims held by banks from OECD countries vis-a`-vis the rest of the world .These claims represent banks’ financial claims extended on residents outside the country in which these banks are headquartered. The claims consist of financial assets such as loans, debt securities, properties, and equities, including equity participations in subsidiaries (BIS, 2003). 2 Reflecting these concerns about regulatory arbitrage, Acharya, Wachtel and Walter (2009, p.370) argue: “This will end up conferring substantial guarantees to the financial sector, giving rise to excessive leverage- and risk-taking incentives in spite of substantial regulation in each country.” Echoing these concerns, Naoyuki Shinohara, IMF's Deputy Managing Director, stated that:, “It is important to ensure a level playing field in regulation. Global coordination is needed to reap the benefits of global finance while minimizing the scope for regulatory arbitrage, which could be damaging to global financial stability". 3 Indeed, as Knight (2009) points out, financial firms tend to take advantage of the regulatory gaps by engaging in regulatory arbitrage during the pre-crisis credit cycle upswing from 2002 to 2007, which made the financial system much less robust to shocks.
3
regulation. 4 For instance, the Basel Cross Border Resolution Group issued a report and
recommendations on international coordination of bank regulation in March 2010 (BIS, 2010). IMF
also issued a proposal “Resolution of Cross Border Banks-a Proposed Framework for Enhanced
Coordination” in June 2010 (IMF, 2010). Despite the importance of these issues, to the best of our
knowledge, no existing study has comprehensively examined the regulatory arbitrage incentives
related to international bank flows.5 This historical omission is not altogether surprising because of
the lack of available detailed data regarding cross-country bank regulations. However, recent global
bank regulation surveys conducted by Barth, Caprio, and Levine (2004, 2006, 2008) help overcome
this data availability issue. Utilizing this survey data to measure cross-country differences in banking
regulations, our paper sets out to explore the extent to which regulatory arbitrage has taken place, and
if so, its impact on global lending.
To address this issue, we take an in-depth look at global bank flows from 26 source countries to
120 recipient countries over the past decade. In testing for regulatory arbitrage, we explore whether
differences in bank regulations have influenced the flow of bank capital across markets. Controlling
for a large number of economic, legal and institutional factors that are likely to influence
cross-country bank loans, we consider the effects of a wide range of banking regulations.
Our results strongly indicate that bank flows are positively related to the both the number of
activity restrictions and the stringency of capital regulation imposed on banks in their source country,
and negatively related to restrictions and regulations in the recipient country. Drilling further down,
we consider the effects of specific regulations including restrictions on whether banks may own
nonfinancial firms, the extent to which the bank supervisory authority is independent from the
government, the degree of audit and disclosure transparency and the degree of power exerted by the
supervisory authority. In each case, we find evidence that capital tends to flow from more restrictive
to less restrictive jurisdictions.
These results appear to be robust to various time periods and various specifications. While we
4 Morrison and White (2009) also address these issues in a theoretical context where they consider the costs and benefits of coordinated multinational regulation. 5 A much broader literature has examined the economic effects of cross-country differences in regulation and liberalization. See for example, La Porta, Lopez de Silanes, Shleifer and Vishny (1998), Bekaert, Harvey and Lundblad (2005), Barth, Caprio and Levine (2006), Laeven and Levine (2009) and Fernandes, Lei and Miller (2010)

4
consistently find a strong association between the regulatory environment and bank flows, there is
always the possibility of reverse causality where regulations endogenously respond to changes in
capital market flows. While these econometric problems are common throughout the literature and
difficult to complete eliminate (see Bekaert, Harvey and Lundblad (2005) for an excellent discussion
of these issues) we take a variety of steps to alleviate these concerns. In particular, we follow the
literature (e.g. Bekaert, Harvey and Lundblad, 2005; Bekaert, Harvey and Lundblad and Siegel, 2007)
and control for exogenous measures of growth opportunities in our regression models, we use the
fixed effect estimations to account for unobserved time-invariant country characteristics that may
influence international bank flows, we estimate a series of models using instrumental variables, and
we examine the effect of changes in bank regulations on changes of international bank flows. In
each case, the main findings are upheld.
Furthermore, looking beyond just capital market flows, we also explore whether differences in
regulations influence banks’ decisions to establish foreign operation. Using bank level data across
the 26 source countries6, we find strong evidence that regulatory gaps in activity restriction, capital
regulation, supervisory independence and strength, external audit, disclosure transparency and loan
classification exert significant impacts on banks’ foreign expansion decisions. Overall, the bank level
evidence strongly bolsters the findings that banks headquartered in more restrictive jurisdictions are
more likely to establish a branch or subsidiary in the countries with lighter regulations.
Put together, all of these findings suggest that a form of regulatory arbitrage is taking place, and
that banks tend to move funds to markets with fewer regulations7. More generally, our findings
indicate that global banking regulations and the coordination of regulations across different markets
have an important influence on the level of bank funding. On one level, it is not surprising that
banks would want to take steps to avoid regulations. However, there are countervailing reasons why
bank capital would not necessarily flock to low regulated markets, particularly if these countries do
not have strong institutional and legal environments. Indeed, there are reasons to believe that in
6 Using the Bankscope database, we compiled an original database on the operations of 301 large banks with headquarters in one of the 26 source countries covered in the BIS statistics, focusing on their foreign presence (i.e. branch or subsidiary) in 120 countries (i.e. the recipient countries in the BIS statistics) around the world. 7 There exist some other types of regulatory arbitrage activities. For instance, banks exploited credit transfer mechanisms through setting up off-balance-sheet asset-back commercial paper conduits (ABCP) and structured investment vehicles (SIVs) and increased their effective leverage (Acharya et al., 2009).

5
some circumstances strong regulations are prudent and may serve as a signal of quality and stability.8
To further disentangle these effects, we conduct a series of additional tests where we explore
whether the level of economic development and the legal and institutional environment influence the
degree of regulatory arbitrage. Here we find that cross-country differences in regulations have a
much more profound effect on bank flows if the recipient country has an advanced economy, strong
creditor rights, strong property rights and a high degree of information sharing among investors.
By confirming the importance of establishing a strong legal and institutional environment, these
findings mitigate concerns of a possible “race to the bottom”, to the extent they suggest that low
regulations in isolation are not enough to attract capital. More negatively, our results suggest that even
after controlling for these effects, banks do engage in a form of regulatory arbitrage. These actions
may undercut attempts to limit risk-taking in the aftermath of the current crisis, unless policymakers
are able to take the difficult steps to enhance the global coordination of banking regulations (Acharya,
Wachtel and Walter, 2009).
Overall, we believe our results make an important contribution to two related literatures. First,
our results contribute to the literature on international banking regulations (e.g. Barth, Caprio, and
Levine, 2004, 2006; 2008; Beck, Demirguc-Kunt and Levine, 2006; Beck, Levine and Levkov, 2010;
Houston, Lin, Lin, Ma, 2010; Laeven and Levine, 2009; Morrison, and White, 2009) by
demonstrating the importance that these regulations have on the flow of bank capital across borders.
To the extent our results highlight the need for regulatory coordination, we believe they also offer
some insights to policymakers and regulators looking to rebuild the global regulatory architecture
following the recent crisis. Second, our results add to the literature that has focused on the
determinants of global bank activities (e.g. Focarelli and Pozzlo, 2001; La Porta, Lopex-de-Silanes
and Shleifer, 2002; Buch, 2003; Mian, 2006; Sengupta, 2007; Dell’Ariccia and Marquez, 2010; Lin,
Ma, Malatesta, Xuan, 2011 a&b, Pang, Spint and Tice, 2010), by demonstrating the important effects
that global banking regulations have on capital market flows. In this regard, we also contribute to the
broader literature on the determinants of global capital flows (e.g. Gelos and Wei, 2005; Alfaro, 8 For example, in a different setting, Fernandes, Lei and Miller (2010) explored the impact of a recent change in SEC guidelines which made it easier for foreign firms to avoid US guidelines regarding investor protections and disclosure. They showed that foreign firms operating in countries with weak investor protections saw a significant decline in their stock prices following the regulatory change, whereas there was no significant change in countries with strong investor protections.
6
Kalemli-Ozcan and Volosovych, 2008; Papaioannou, 2009).The rest of the paper proceeds as follows:
Section 2 describes the data used and presents a wide range of summary statistics. Section 3 explore
the causes of global bank flows, and demonstrate the various channels in which regulatory systems in
different markets affect the flow of foreign bank capital. Section 4 considers the impacts of
regulatory difference across countries on bank foreign expansion decisions. Section 5 concludes.
2. Data and summary statistics
2.1. Data sources
Our study compiles data from four main sources:
(1) The International Banking Statistics published by the Bank for International Settlements (BIS)
provides data regarding the international flow of bank loans and portfolio investments from 26
primarily OECD source countries to 120 recipient countries on a quarterly basis since December 1983.
The BIS Consolidated/Nationality Banking Statistics publish foreign financial claims reported by
domestic bank head offices, including the exposures of their foreign affiliates (i.e. branches and
subsidiaries), and are collected on a worldwide consolidated basis after netting out inter-office
positions (BIS, 2003, p.55). These claims comprise financial assets such as loans, debt securities,
properties, and equities -- including equity participations in subsidiaries (BIS, 2003). The data are
published in Table 9B of the BIS Quarterly Review regularly under the title, “The consolidated
foreign claims of reporting banks”9.
This database provides comprehensive data on banks’ financial claims extended on residents
outside the country in which these banks are headquartered. It is important to stress that the bank’s
home country is determined by the reporting bank’s nationality not its geographic location. So, for
example, a loan issued by the US bank located in London to a British bank operating in London is
recorded in the database as a foreign loan, where the source country is the US and the recipient
country is the UK. However, a loan issued by the same US bank located in London to another US
bank located in New York is regarded as a domestic loan issued by the US bank and is therefore not
recorded in this database (for details, see Wooldridge, 2002).
(2) The Djankov, McLiesh, and Schleifer (DMS henceforth - 2007) and World Bank “Doing Business” 9 A more detailed discussion about the data can be found in the Data Appendix.

7
datasets provide information regarding creditor rights and information sharing measures in 129
countries during the past 30 years. More specifically, DMS (2007) dataset contains historical data on
creditor rights and information sharing across 120 countries over the period 1978-2003 and “Doing
Business” dataset contains more recent data updated annually.
(3) The Barth, Caprio, and Levine (BCL henceforth) (2004, 2006, 2008) dataset on bank regulation,
supervision and monitoring in more than 100 countries. The database is compiled from three
worldwide surveys of bank regulation and supervision among financial regulators. The original survey,
Survey I, was conducted in 117 countries in year 1998. The first update in 2003, Survey II,
characterized the regulatory situation at the end of 2002, and covered 152 countries. Survey III was
conducted in 2005 and 2006 and covered 142 countries. The surveys contain more than 300 questions
on various aspects such as capital regulation, entry regulation, activities restrictions, supervisory
power and independence, external governance and monitoring. Overall, the three surveys plot a very
detailed and comprehensive picture of global bank supervision and regulation over the past decade.
(4) The BankScope database provided by Bureau van Dijk and Fitch Ratings. The BankScope
database has comprehensive coverage in most countries and accounts for over 90% of all banking
assets in each country. Each bank report contains detailed balance sheet and income statement
totalling up to 200 data items and 36 pre-calculated financial ratios. Using the Bankscope database,
we compiled an original database on the operations of 301 large banks with headquarters in one of the
26 source countries covered in the BIS statistics, focusing on their foreign presence (i.e. branch or
subsidiary) in 120 countries (i.e. the recipient countries in the BIS statistics) around the world. Due to
the data availability on subsidiary and branch information, we focus on the most recent year in our
analysis. The bank level accounting information is also obtained from the database.
In addition to the four main datasets mentioned above, we utilize a variety of other data sources.
Specifically, we use the World Development Indicator (WDI, 2008) for macroeconomic control
variables such as GDP per capita, population, and area. The common language dummy variable that
equals one if the two countries share a common language or have former colonial relation is from
Rose (2004). The financial market development index is from the Database on Financial Development
and Structure constructed by Beck, Demirgüç-Kunt and Levine (2000) and it is updated regularly by
its authors. We also used the index of financial liberation that was constructed by Abiad,

8
Detragiache and Tressel (2010), and we followed the approach by Bekaert, Harvey, Lundblad and
Siegel (2007) to construct the country level exogenous growth opportunity measure.
Tables 1 and 2 summarize these data sources and provide brief descriptions and summary
statistics of the key variables. Below, we provide a quick overview of each of these key variables. A
more detailed description can be found in the Internet Appendix.
[Tables 1 and 2 here]
2.2. International Bank Flows
The international bank flow measure is the main dependent variable in our analysis. This variable
captures the bank capital inflows from banks located in source country s to all sectors of the economy
in recipient country r from year t-1 to t. As there is no flow measure in the BIS data, we construct a
bank flow measure by calculating the annual percentage change in total foreign claims for each
source-recipient combination. More specifically, our main dependent variable is defined as 100
times the log-difference of total foreign claims (FCsr) from source country s to recipient country r,
that is, 100*∆ln FCsr. After merging different databases and deleting the missing observations, our
sample covers international bank flow from 26 “source” countries10 to 120 “recipient” countries from
1996 to 2007. We construct the annual bank flow variable by using the stock data on December of
each year in the sample period to match the annual frequency of the other explanatory variables11. As
can be seen from Table 2, the sample mean of bank flow is 2.89, which suggests that the average bank
flows from the source country to the recipient country in our sample increase by 2.9% a year over the
sample period. The standard deviation of the bank flows is 11.32, suggesting a great variation in
international bank flow over time and across countries.
2.3. Bank regulation and Supervision
We use a set of variables from the three worldwide surveys conducted by Barth, Caprio and
Levine over the past decade (Barth, Caprio and Levine, 2006, 2008) to measure various aspects of
10 The 26 source countries/regions with available BIS bank flow data are: Australia, Austria, Belgium, Brazil, Canada, Chile, Denmark, Finland, France, Germany, Greece, Ireland, Italy, Japan, Mexico, Netherlands, Norway, Panama, Portugal, Spain, Sweden, Switzerland, Taiwan, Turkey, United Kingdom, and United States. 11 We reduce the impact of outliers by trimming the bank flows outside the range between -100% and +100%. That reduced our sample size by about 6%.

9
bank regulation and supervision across countries. These variables include two measures regarding
restrictions on activities (Activities Restrictiveness and Bank Own Non-financial Firms), and a
measure related to capital stringency (Capital Regulatory Index). We also use two variables to
measure the strength of external auditors and financial statement transparency (Strength of External
Audit and Financial Statement Transparency) two variables that are designed to measure the strength
and independence of bank supervisors (Official Supervisory Power and Supervisory Independence) as
well as a measure of the stringency in classifying loans that are in arrears (Loan Classification
Lenience). Since the data span over the past decade, we focus on the time period 1996-2007.
Specifically, the values of regulatory variables for the period of 1996 to 1999 are taken from the first
survey recorded in 1998/1999. The values of regulatory variables for the period of 2000 to 2003 are
taken from the second survey that assesses the state of regulation as of the end of 2002. The
regulatory measures for the period of 2004 to 2007 are taken from the third survey that was recorded
in 2005/2006. The detailed constructions and definitions of these variables can be found in Table 1.
2.4. Institutional Controls
Previous studies (e.g. Alfaro et al., 2008; Papaioannou, 2009) highlight the important of
institutional quality in driving the internal bank flows. We therefore control for the institutional
difference between source and recipient countries using three sets of institutional variables regarding
the level of creditor rights, information sharing and property rights.
We use the creditor rights index first established by La Porta, López-de-Silanes, Shleifer, and
Vishny (LLSV henceforth - 1998), as a measure of the powers of secured creditors in bankruptcy. The
index has been widely used in recent studies in finance literature (e.g. Houston et al., 2010; Acharya,
Amihud and Litov, 2011). The level of information sharing among creditors is also likely to have an
important influence on banks’ willingness to provide foreign capital. Based on the data available from
DMS (2007) and the World Bank “Doing Business” dataset, we construct a variable (Information
Sharing), which indicates the contents of the credit information sharing through a public registry or
private bureau. As a measure of property rights, we use the Legal Structure and Security of Property
Rights index from the World Economics Freedom report constructed by the Economic Freedom
Network. These institutional distance measures are panel data across 120 countries since the 1990s.

10
Once again, detailed constructions and definitions of these variables can be found in Table 1
2.5. Other Country Controls
We also include several country-level variables to control for differences in economic
development, institutions, and cultures across source-recipient country pairs. First, we control for the
contract enforcement in both the source country and recipient country. The contract enforcement
measures the average duration counted from the moment the plaintiff files the lawsuit in court until
the creditors obtain payments. The proxy variable was first developed by Djankov, La Porta,
Lopex-de-Silanes and Shleifer (2003), and have been updated in the World Bank’s “Doing
Business’ database. In addition, we include real GDP per capita in US dollar to capture the
economic development of the region/country. Third, we include the natural logarithm of population
and area to capture the size of the market. Fourth, we include the common language dummy variable,
which equals one if the two countries share a common language (Rose, 2004), to control for cultural
and language differences between source and recipient countries. Furthermore, we include two
variables to measure the banking sector structure in recipient countries. Banking Concentration is the
share of the five largest banks in total bank deposits. Government Bank Ownership is the fraction of
the banking system's assets in banks that are 50% or more owned by state government. State
controlled banking sector with high concentration might deter the foreign banks from entering the
market. Lastly, we also control for the geographical distance between the source and recipient
countries to capture potential impacts of geographical distance on bank flow. To alleviate the concern
that the empirical results are driven by some broader policy changes or the changes of growth
opportunities, we also control for country wide financial liberalization (Abiad, Detragiache, and
Tressel, 2010) and exogenous growth opportunities (Bekaert, Harvey and Lundblad, 2005, 2007) in a
smaller subsample.
There is a concern that international bank flows might respond to “permanent income” shocks
(e.g. productivity shocks) at the country level, and the institutions and regulations are partly shaped by
these shocks as well. If this is the case, the observed relation between regulation and international
bank flows might be spurious. To address this concern, we examined a correlation matrix of the key
independent variables. We found that the change of income is not significantly associated with the

11
changes of bank regulations and institutions, alleviating the concern of spurious correlation
coefficients. To further address this concern, we control for income effects in all the regression
analyses.12
3. Empirical Results: Regulatory Arbitrage and International Bank Flows
3.1. Regulation, Institution and Bank Inflows/Outflows
In this section, we empirically test for regulatory arbitrage, relying on the three worldwide
surveys conducted over the past decade by Barth, Caprio, and Levine (2006, 2008). Specifically, the
values of regulatory variables for the period of 1996 to 1999 are taken from the first survey recorded
in 1998/1999, the values of regulatory variables for the period of 2000 to 2003 are taken from the
second survey that assesses the state of regulation as of the end of 2002, and the regulatory measures
for the period of 2004 to 2007 are taken from the third survey that was recorded in 2005/200613. To
help understand the various factors that influence cross-country bank flows, we construct a series of
incremental tests. In these tests, we first isolate the factors influencing capital inflows into the
recipient countries, and then separately examine the factors that influence the level of outflows from
the source countries. In the subsequent sub-section, we will construct a gravity model that combines
these effects by exploring the specific connections between source and recipient countries.
To examine the relation between bank regulation in recipient countries and bank capital inflows,
we construct for each year, an aggregate bank inflow measure for each recipient country. We use
this aggregate bank inflow measure as the dependent variable and estimate the following regression:
𝐵𝐵𝐵𝐵𝐵𝐵𝐵𝐵 𝐼𝐼𝐵𝐵𝐼𝐼𝐼𝐼𝐼𝐼𝐼𝐼𝑟𝑟 ,𝑡𝑡 = 𝛼𝛼0 + 𝛼𝛼1𝑅𝑅𝑅𝑅𝑅𝑅𝑅𝑅𝐼𝐼𝐵𝐵𝑡𝑡𝑅𝑅𝐼𝐼𝐵𝐵𝑟𝑟 ,𝑡𝑡 + 𝛽𝛽1 𝐼𝐼𝐵𝐵𝐼𝐼𝑡𝑡𝑅𝑅𝑡𝑡𝑅𝑅𝑡𝑡𝑅𝑅𝐼𝐼𝐵𝐵𝐵𝐵𝐼𝐼 𝑄𝑄𝑅𝑅𝐵𝐵𝐼𝐼𝑅𝑅𝑡𝑡𝑄𝑄𝑟𝑟 ,𝑡𝑡 + 𝛾𝛾1𝑋𝑋𝑟𝑟 ,𝑡𝑡 + 𝜑𝜑𝑟𝑟 + 𝜇𝜇𝑡𝑡
+ 𝜀𝜀𝑟𝑟 ,𝑡𝑡 (1)
where r and t respectively indicate the recipient country and time (year). The dependent variable
Bank Flow is defined as 100 times the log-difference (from t-1 to t) of the aggregate total foreign
claims (FCsr) from the 26 source countries to recipient country r. The independent variables include 12 This complete correlation matrix is included in the accompanying Internet Appendix (Appendix Table 1). 13 We tried some alternative ways in assigning the values such as moving all the thresholds one year before or later and found the results quite robust. In addition, we also tried longer time period and found consistent results.

12
a number of bank regulation and institution variables from the recipient countries. The regulatory
variables include measures of activity restrictiveness, capital regulation, external audit, information
disclosure, and supervisory power and independence, the details of which were discussed in Section 2.
The institutional quality measures include the creditor rights index, the property rights index and the
information sharing variable. The vector X include standard controls such as GDP per capita,
population and the country’s land area. In addition, we also include recipient country (𝜑𝜑𝑟𝑟) fixed
effects and time fixed effect (𝜇𝜇𝑡𝑡). In addition, the heteroskedasticity-robust standard errors clustered
at the recipient country level are used in computing p -values. The estimated results from this model
are reported in columns (1) to (6) in Table 3A.
[Table 3A here]
The results suggest that less stringent bank regulations in the recipient country induce more bank
inflows. Looking more closely, we find that a higher level of activities restrictiveness in the recipient
country discourages bank inflows. Holding other things constant, a recipient country with the lowest
level of activity restriction in our sample is likely to attract 2.61% higher bank inflow (on an annual
basis) relative to the recipient country with the highest level of activity restrictiveness. A one unit
increase in Restriction on Bank Owning Nonfinancial Firms in the source country results in a decrease
the bank inflow growth by 0.86%. Considering the sample mean (2.89%) of the annual bank flow
growth rate, the effects are economically important.
Moreover, we find that more stringent capital regulations are negatively associated with bank
inflow growth in recipient countries. We also find that Strength of External Audit and Financial
Statement Transparency are negatively associated with bank inflows into the recipient countries. A
one standard deviation increase in Financial Statement Transparency index is associated with a
decrease in bank inflow growth rate by 1.23%. Considering the sample mean (2.89%) of the annual
bank flow growth rate, the effect is not trivial. Overall, the evidence suggests that higher information
disclosure standards and stronger external governance tend to deter bank capital inflows. In addition,
we find that the Independence of Supervisory Authority and Official Supervisory Power measures are
negatively associated with bank inflows. The presence of an independent supervisor, for instance, is
associated with a 1.25% decrease in bank inflow growth. The evidence suggests that bank capitals
tend to flow into countries with less independent and weaker supervisory authority. We also find that
13
loan classification leniency encourages bank inflows.
The measures of institutional quality also exert important influences on bank capital inflows. We
find that information sharing, creditor rights and property rights protection in recipient countries are
positively and significantly associated with bank capital inflows. For instance, a one standard
deviation increase in Creditor Rights is associated with a 6% increase in the annual growth rate of
bank inflows. Furthermore, we find better contract enforcement in the recipient country also helps
attract more bank inflows. Overall, the evidence indicates the importance of legal environment and
investor protection in determining international bank flows.
Arguably, the international bank flows could also be driven by other important macro factors
such as financial liberalization and growth opportunities. In order to alleviate the omitted variable
concern, we include two additional controls in our baseline regression models. The first index is from
a financial liberalization dataset compiled by Abiad, Destragiache and Tressel (2010). The index
contains various dimensions including credit controls and reserve requirements, interest rate
liberalization, entry barriers, capital account restrictions, privatization, and securities market policies
and supervision. The dataset covers 91 countries across the sample period 1973-2005. A higher value
indicates a higher degree of financial liberalization. The second index is a growth opportunity index,
that is constructed using the approaches outlined by Bekaert, Harvey and Lundblad (2005) and
Bekaert, Harvey, Lundblad and Siegel (2007). Intuitively, each country is viewed as a composition
of sectors each with time-varying growth opportunities, which are reflected in the P/E ratios (price to
earnings ratios) of global industry portfolios (Bekaert, Harvey and Lundblad, 2005). Following
Bekaert, Harvey and Lundblad (2005), an annual measure is constructed based on the 3-digit SIC
industry composition for each country and weighted by their output shares according to UNIDO
Industrial Statistics Database. As Bekaert, Harvey and Lundblad and Siegel (2007) point out, this
measure of exogenous growth helps address many of the endogeneity concerns in the cross country
finance and growth literature.
After including these two new controls, the sample size drops to 642 (columns 7). However, all
the main findings remain significant and robust. Moreover, we find that both Financial Liberalization
and Growth Opportunities are associated with a higher bank inflow growth rate. In column (8), we
re-estimate the regressions using weighted OLS regressions (the results are weighted by the size of the

14
recipient countries measured by GDP in USD). As can be seen from the table, the empirical results
remain highly robust.
Next we turn our attention to the factors that influence bank outflows. Here, we aggregate the
bank outflow data from each source country to 120 recipient countries in a specific year and construct
a source country/year aggregate bank outflow measure. We use this aggregate bank outflow measure
as the dependent variable and estimate the following regression:
𝐵𝐵𝐵𝐵𝐵𝐵𝐵𝐵 𝑂𝑂𝑅𝑅𝑡𝑡𝐼𝐼𝐼𝐼𝐼𝐼𝐼𝐼𝐼𝐼,𝑡𝑡 = 𝛼𝛼0 + 𝛼𝛼1𝑅𝑅𝑅𝑅𝑅𝑅𝑅𝑅𝐼𝐼𝐵𝐵𝑡𝑡𝑅𝑅𝐼𝐼𝐵𝐵𝐼𝐼,𝑡𝑡 + 𝛽𝛽1 𝐼𝐼𝐵𝐵𝐼𝐼𝑡𝑡𝑅𝑅𝑡𝑡𝑅𝑅𝑡𝑡𝑅𝑅𝐼𝐼𝐵𝐵𝐵𝐵𝐼𝐼 𝑄𝑄𝑅𝑅𝐵𝐵𝐼𝐼𝑅𝑅𝑡𝑡𝑄𝑄𝐼𝐼,𝑡𝑡 + 𝛾𝛾1𝑋𝑋𝐼𝐼,𝑡𝑡 + 𝜑𝜑𝐼𝐼 + 𝜇𝜇𝑡𝑡
+ 𝜀𝜀𝐼𝐼,𝑡𝑡 (2)
where s and t indicate the source country and time (year), respectively. The dependent variable Bank
Flow is defined as 100 times the log-difference (i.e. difference in log from t-1 to t) of aggregate total
foreign claims (FCsr) from a source country s to 120 recipient countries. The key independent
variables are the same measure of bank regulation, institutional quality and other controls used above,
but now we capture these measures from the source countries. We also include source country (𝜑𝜑𝐼𝐼)
fixed effects and time fixed effect (𝜇𝜇𝑡𝑡). In addition, the heteroskedasticity-robust standard errors
clustered at the source country level are used in computing p-values. The estimated results from this
model are reported in columns (1) to (6) in Table 3B. In column (7), we further include Financial
Liberalization and Growth Opportunities as additional control variables to address the potential
omitted variable concern. The sample size drops from 238 to 181. In column (8), we re-estimate the
regressions using source country size weighted OLS regressions and test the robustness of the results.
[Table 3B here]
As can be seen from the table, the results are highly consistent with our previous findings. Specifically,
we find that Overall Activities Restrictions and Restriction on Bank Owning Nonfinancial Firms are
associated with a higher growth rate of bank capital outflows. In other words, higher level of activities
restrictiveness in the source country encourages bank outflows. We also find that capital stringency,
financial statement transparency and the strength of external audit are all positively associated with
bank outflow growth. Likewise, we find that bank capital tends to flow from countries with more
independent and powerful supervisory authority to countries with less independent and weaker
supervisory authority. Moreover, loan classification leniency tends to discourage bank outflows.
The institutional quality also significantly affects bank capital outflows. The measures related to

15
information sharing, creditor rights and property rights protection in source countries are negatively
and significantly associated with bank capital outflows. Moreover, we find better contract
enforcement in the recipient country also helps reduce bank outflows. Overall, the evidence suggests
that higher institutional quality discourages bank outflows.
Next to get a more visual sense about the relation between regulation and bank inflows out
outflows, we constructed a series of non-parametric (kernel-weighted local polynomial smoothing)
plots of the relation between regulatory changes and the changes of bank inflow (outflow) growth in
recipient (source) countries. As Barth et al. (2008) point out, a large number of bank regulatory
changes have occurred in various countries over the past decade. In Appendix Figure 1, we follow
Barth et al. (2008) to make comparisons on bank activities restrictiveness in year 1999 (using Survey I)
and year 2006 (using Survey III). A change in a positive direction indicates a move towards greater
restrictiveness. As can be seen, most countries tightened restrictions during the past decades. The
activities restrictiveness in many developing countries such as Vietnam, Nicaragua, Dominica
Republic, and Costa Rica increased dramatically over the past decade. At the same time, restrictions
have eased in some countries such as Mexico, Belgium, Oman, and Romania14. Overall, among the
120 recipient countries in our sample, we find that 114 recipient countries/regions have changed at
least one type of regulations during the past decade. Among the 26 source countries in our sample, we
find that 21 countries/regions have changed at least one type of regulations during the past decade. In
Figure 1, we present the non-parametric plots with the changes in regulations of recipient countries on
the X-axis, and changes in bank inflow growth on the Y-axis. In Figure 2, we present the
non-parametric plots with the changes in regulations of source countries on the X-axis, and changes in
bank outflow growth on the Y-axis. We focus on the three survey years (1999, 2002, and 2005) to
measure the regulatory changes. To capture the potential lagged effects of regulatory changes, we use
bank flow data in years 2001, 2004, and 2007 data to measure the changes in bank flows.
[Figures 1 and 2 here]
These plots largely confirm our findings in the regression analyses. In Figure 1, we find a
negative relation between the changes in various dimensions of bank regulation (i.e. overall activities 14 There are also significant changes on other dimensions of regulation such as capital regulatory stringency, financial statement transparency, official supervisory power and loan classification leniency. Please see Barth et al. (2008) for detailed discussions and comparisons.

16
restrictiveness, restriction on banks own non-financial firms, capital regulatory stringency, strength of
external audit, financial statement transparency, independence of supervisory authority and official
supervisory power) and the changes of bank inflows. In Figure 2, we find a positive relation be
between the changes in various dimensions of bank regulation (i.e. overall activities restrictiveness,
restriction on banks own non-financial firms, capital regulatory stringency, strength of external audit,
financial statement transparency, independence of supervisory authority and official supervisory
power) and the changes of bank outflows. Moreover, we find a negative relation between the changes
in loan classification leniency and the changes of bank outflows. Taken together, these plots lend
credence to our regression findings, provide assurance that the results are not driven by a few outliers
and at the same time, perhaps provide a clearer picture of the links between regulations and capital
market flows.
3.2. Regulatory Arbitrage and International Bank Flows: Gravity Model
In this section, we combine the “push” and “pull” effects on international bank flows and
estimate the following standard “gravity” model with country and time fixed effects.
𝐵𝐵𝐵𝐵𝐵𝐵𝐵𝐵 𝐹𝐹𝐼𝐼𝐼𝐼𝐼𝐼𝐼𝐼,𝑟𝑟 ,𝑡𝑡 = 𝛼𝛼0 + 𝛼𝛼1𝑅𝑅𝑅𝑅𝑅𝑅𝑅𝑅𝐼𝐼𝐵𝐵𝑡𝑡𝑅𝑅𝐼𝐼𝐵𝐵𝐼𝐼,𝑡𝑡 + 𝛼𝛼2𝑅𝑅𝑅𝑅𝑅𝑅𝑅𝑅𝐼𝐼𝐵𝐵𝑡𝑡𝑅𝑅𝐼𝐼𝐵𝐵𝑟𝑟 ,𝑡𝑡 +
𝛽𝛽1𝐼𝐼𝐵𝐵𝐼𝐼𝑡𝑡𝑅𝑅𝑡𝑡𝑅𝑅𝑡𝑡𝑅𝑅𝐼𝐼𝐵𝐵𝐵𝐵𝐼𝐼 𝑄𝑄𝑅𝑅𝐵𝐵𝐼𝐼𝑅𝑅𝑡𝑡𝑄𝑄𝐼𝐼,𝑡𝑡 + 𝛽𝛽2 𝐼𝐼𝐵𝐵𝐼𝐼𝑡𝑡𝑅𝑅𝑡𝑡𝑅𝑅𝑡𝑡𝑅𝑅𝐼𝐼𝐵𝐵𝐵𝐵𝐼𝐼 𝑄𝑄𝑅𝑅𝐵𝐵𝐼𝐼𝑅𝑅𝑡𝑡𝑄𝑄𝑟𝑟 ,𝑡𝑡 + 𝛾𝛾1𝑋𝑋𝐼𝐼,𝑡𝑡 + 𝛾𝛾2𝑋𝑋𝑟𝑟 ,𝑡𝑡 +
𝜃𝜃1 𝐼𝐼𝐵𝐵�𝐷𝐷𝑅𝑅𝐼𝐼𝑡𝑡𝐵𝐵𝐵𝐵𝐷𝐷𝑅𝑅𝐼𝐼,𝑟𝑟� + 𝜃𝜃2𝐶𝐶𝐼𝐼𝐶𝐶𝐶𝐶𝐼𝐼𝐵𝐵 𝐿𝐿𝐵𝐵𝐵𝐵𝑅𝑅𝑅𝑅𝐵𝐵𝑅𝑅𝑅𝑅𝐼𝐼,𝑟𝑟 + η𝐼𝐼 + 𝜑𝜑𝑟𝑟 + 𝜇𝜇𝑡𝑡 + 𝜀𝜀𝐼𝐼,𝑟𝑟 ,𝑡𝑡 (3)
where s and r indicate the source and recipient country, respectively, and t indicates time (year). The
dependent variable Bank Flow is defined as 100 times the log-difference of the ratio of total foreign
claims (FCsr) from source country s to recipient country r, that is, 100*∆ln(FCsr). The key
independent variables are the same measures of the regulatory environment, institutional quality and
other controls used earlier but now we include these variables from both the source and recipient
countries. In addition, two other measures are now included. Potential information frictions and
transaction costs are captured by the logged distance between the source and recipient countries.
Common language is included to control for potential cultural and language differences between the
source and recipient countries. In addition, we also include source country (η𝐼𝐼) and recipient country
(𝜑𝜑𝑟𝑟) fixed effects to capture the time-invariant country-specific characteristics in the source and
recipient countries, respectively. The model also includes a time fixed effect (𝜇𝜇𝑡𝑡) In addition, the
17
heteroskedasticity-robust standard errors clustered at the recipient country level are used in computing
pt-values. The estimated results from this model are reported in columns (1) to (6) in Table 4. After
excluding the missing observations, the sample size is about 14,000 observations. In column (7), we
further include Financial Liberalization and Growth Opportunities as additional controls to address
the potential omitted variable concern. The sample size drops to 7923. In column (8), we employ the
panel generalized method of moments (GMM) estimator described in Bekaert, Harvey, and Lundblad
(2001) to accommodate heteroskedasticity both across countries and across time and correlation
between country residuals (Bekaert, Harvey and Lundblad, 2005) and test the robustness of the results.
As can be seen from the table, the empirical results remain highly robust to the GMM estimation.
[Table 4 here]
Table 4 provides strong evidence the bank capital flows from heavily regulated markets to those
markets that are more lightly regulated. Specifically, we find that a lower level of activities
restrictiveness in the recipient country induces more bank inflows while higher level of overall
activities restrictiveness in the source country encourages more bank capital outflows. Holding other
things constant, a recipient country with the lowest level of activity restriction in our sample is likely
to attract 2.25% higher bank inflow (on an annual basis) relative to the recipient country with the
highest level of activity restrictiveness. A one unit increase in Bank Owning Nonfinancial Firms in the
source country results in a 1.3% increase in bank outflow growth; a one unit increase in Bank Owning
Nonfinancial Firms in the recipient country decreases the bank inflow growth by 1.97%. Considering
the sample mean (2.89%) of the annual bank flow growth rate, the effects are economically important.
Regarding capital regulation, we find that capital regulatory stringency is positively associated
with bank outflow growth in source countries and negatively associated with bank inflow growth in
recipient countries. A one standard deviation increase (1.78) in the Capital Regulatory Index increases
the bank outflow growth by 1.05% in the source country and decrease the bank inflow growth by
0.77% in the recipient country. In short, the evidence indicates that bank capital tend to flow from
markets with more stringent capital regulation to the markets with lower capital regulatory stringency.
We also find that bank capital flows from countries with higher information disclosure standards
and stronger external audit to countries with weak disclosure and audit. Specifically, the Strength of
External Audit and Financial Statement Transparency are positively associated with bank outflows in

18
the source country and negatively associated with bank inflow in the recipient country. A one standard
deviation increase in Financial Statement Transparency in the source country results in a 1.6%
increase in bank outflow growth; a one standard deviation increase in Financial Statement
Transparency in the recipient country decrease the bank inflow growth by 0.93%. In some
specifications, however, the coefficients are marginally significant or insignificant.
With respect to bank supervision, we find that bank capitals flow from countries with more
independent and powerful supervisory authority to countries with less independent and weaker
supervisory authority. A one standard deviation increase in Official Supervisory Power in the source
country results in a 1.29% increase in bank outflow growth; a one standard deviation increase in
Official Supervisory Power in the recipient country decrease the bank inflow growth by 1.15%. We
also find that supervisor independence in the recipient country tends to discourage international bank
inflows while the effect of supervisor independence in the source country is only marginally
significant. A one unit increase in Supervisory Independence in the recipient country decreases the
bank inflow growth by 0.65%. Moreover, we find that bank capital tends to flow from countries with
stringent loan classification systems to countries with more lenient loan classification systems.
Overall, the empirical results show that banks do take advantage of regulatory gaps across countries
and that bank capital flows from markets that are heavily regulated to those markets with less activity
restrictions, lower stringency in capital regulation, weak external audit and disclosure transparency,
lower entry barriers, weak supervisory authority and lenient loan classification criteria.
Consistent with the literature, the institutional distance between source and recipient countries
exerts a very significant impact on international bank flows. On the one hand, we find that better
information sharing, stronger creditor rights protection and property rights protection in recipient
countries are associated with more bank capital inflows. On the other hand, we find that among the
source countries with better information sharing, stronger creditor rights protection and property
rights protection, there tends to be fewer bank capital outflows. Furthermore, we find better contract
enforcement in the recipient country also helps attract more bank inflows. However, concentrated and
state controlled local banking sector tends to deter the bank capitals from flowing into the recipient
countries. In column (7) and (8), we find that growth opportunities at source countries discourage
bank outflows while growth opportunities at recipient countries attract bank inflows.

19
We also perform three robustness tests. First, we consider various approaches for estimating the
standard errors in our panel data. Here we use the estimation approaches suggested by Petersen
(2009) to test the robustness of the results to the clustering by two dimensions. As Petersen (2009)
points out, in many cases, clustering by two dimensions help reduce biases in standard errors in panel
studies. Specifically, we test the robustness to clustering by recipient country and time, clustering by
source country and time, and clustering by recipient-source country pair and time and find the results
highly consistent to our main findings.
Second, we calculate for the key regulatory and institutional variables, the regulatory gaps
between each source and recipient country, and use these as alternative explanatory variables. The
results are very similar to those based on the gravity functions. Third, we examine the effects of
regulatory changes on international bank flow changes. Focusing on changes allows us to account for
unobservable time-invariant country specific characteristics that might influence both the level of
bank regulation and international bank flows. This approach also helps alleviate the endogeneity
concern (Lin et al., 2011). The details and the reported results for each of these tests can be found in
the accompanying Internet Appendix (Table 3 and 4).
3. 3. Instrumental Variable Analysis
The above results demonstrate that cross-country bank flows are strongly associated with the
regulatory and institutional environment of the source and recipient countries. While we argue that
these results are consistent with regulatory arbitrage, reverse causality remains a possibility – and
rather than being exogenous, the regulatory and institutional environment in a given country may
respond to changes in capital flows. Certainly, these are common concerns that are often cited in the
finance and growth literature. As pointed out by Bekaert, Harvey and Lundblad (2005), it is very
difficult to fully address this issue, but we have taken several steps to try to alleviate these concerns.
First, we follow Bekaert, Harvey and Lundblad (2005) and use the measure of exogenous growth
opportunities as an additional control to address the potential endogeneity issue. As Bekaert, Harvey,
Lundblad and Siegel (2007) point out, “Such a measure should prove useful in numerous empirical
studies seeking to avoid endogeneity problems”. In addition, we use the fixed effect estimations to
account for unobserved time-invariant country characteristics that may influence international bank

20
flows. To further ameliorate this concern, we provide a series of robustness tests using instrumental
variable analysis and change regressions. In this sub-section, we will present and discuss the empirical
results of instrumental variable analysis. We will discuss the change regression results in the
subsequent sub-section.
We first select the instrumental variables based on the theoretical and empirical work in the law,
institution and finance literature (Acemoglu and Johnson, 2005, Beck, Demirgüç-Kunt and Levine,
2003, Easterly and Levine, 1997). The literature highlights the important roles of geographical
endowment and ethnic fractionalization in shaping the political and financial institutions (Acemoglu
et al., 2001, Beck et al., 2003, Easterly and Levine, 1997). Beck et al. (2003, 2006) and Barth et al.
(2009) find strong evidence that geographical endowment and ethnic fractionalization exert
substantial impacts on the formation of financial regulation and institutions. We therefore follow Beck
et al. (2006) and use latitude and ethnic fractionalization as instrumental variables for the financial
regulation measures. Following Beck et al. (2006), we also include the percentage of years that the
country has been independent since 1776 as an additional IV because countries that gained their
independence earlier had more chance to adopt regulations more valuable to economic development.
Moreover, the literature has documented the possibility of “regulation contagion”. As
Demirgüç-Kunt and Detragiache (2002) point out, policymakers and regulators are influenced by the
choices of policymakers in other countries. As the policy or regulation become more widespread, it
becomes enshrined as fort of “universal best practice”, and countries are more likely to adopt it.
Furthermore, regulators or policymakers may learn more about the workings of the regulation from
those countries implementing the regulation. Therefore, regulators might modify their regulation after
observing regulatory changes in other countries. We follow Demirgüç-Kunt and Detragiache (2002)
and use the sample mean of the financial regulation measures at a specific year as additional
instruments to capture the dynamic trend of regulatory changes.
We also select the instrumental variables based on the supervisory structure and other
macroeconomic characteristics. First, we create a dummy variable (central bank regulator) which
equals one if the central bank is the bank regulator. As argued by Goodhart (2000), central banks care
more about macro-economic monetary and price stability, which rests on the basis of maintaining the
micro-level financial stability in the banking system. Therefore, central banks as the bank regulators

21
are more likely to adopt prudential regulations that will keep the systemic stability. We also use the
average experiences of a professional bank supervisor as an additional control. The data is obtained
from Barth et al., (2008). More experience bank supervisors are more likely to adopt the state-of-art
bank regulations that help address various issues in the banking system. Moreover, we use the Gini
coefficients as a measure of income inequality (past 5-year moving average) as an additional
instrumental variable. As pointed out by Beck, Levine and Levkov (2010), “an influential political
economy literature stresses that income distributional considerations, rather than efficiency
considerations, frequently exert the dominant influence on bank regulation”. As discussed above,
these variables are likely to affect the bank regulations. At the same time, these variables per se are
unlikely to exert a direct, first-order effect on the international bank flows. We therefore use them as
additional instrumental variables in our analysis15. The empirical results are presented in Table 5.
[Table 5 here]
As can be seen from Table 5, the empirical results are rather robust. The coefficients of regulation
and supervision variables in recipient countries remain positive and significant while the coefficients
for these variables in source countries remain negative and significant. The results strongly confirm
our finding that bank capital tends to flow from markets that are heavily regulated to those markets
that are lightly regulated. Other controls also yield qualitatively similar results.
Furthermore, the IV coefficients are somewhat larger than the OLS coefficients, indicating the
existence of potential measurement error in the original results, which would tend to “attenuate” the
coefficient estimate toward zero (Rajan and Subramanian, 2008; Barth et al., 2009). Following the
literature (e.g. Beck et al., 2006), we conduct two tests to assess the appropriateness of the instruments.
First, we employ the overidentifying tests, which assess whether the instrumental variables are
associated with the dependent variable beyond their effects through bank regulation and supervision
or the other explanatory variables. We report the p-value of the test of the overidentifying restrictions.
Failure to reject the null hypothesis implies a failure to reject the validity of the instruments. As can be
seen from Table 6, we cannot reject the null hypothesis that the instruments are valid in all model
15 We also considered some other potential instrumental variables including a measure of press freedom. In a country with greater press freedom, people are more likely to get access to all sorts of information and express their voice. As a consequence, a country with greater press freedom is more likely to adopt state-of-art and appropriate regulation schemes. The empirical results are highly robust to the inclusion of this potential instrumental variable.

22
specifications, suggesting that these instruments only exert an impact on international bank flows
through their effect on banking regulation and supervision. In addition, we conduct an F-test of the
excluded exogenous variables in the first-stage regressions. We reject the null hypothesis that the
instruments do not explain cross-sectional differences in bank regulation and supervision at the 1%
level in all model specifications. The p-values of the F-tests are reported in the last row of Table 6.
Similar to the claim made in Beck et al. (2006), we are not arguing that these variables are the best
instrumental variables. Instead, we hold that the instruments are reasonably exogenous and have
decent explanatory power in explaining the bank regulation and supervision measures.
3.4. Regulatory Arbitrage: Does Institutional Quality Matter?
Despite the above results, there are countervailing reasons why bank capital would not
necessarily flow to low regulated markets, particularly if these countries do not have strong
institutional and legal environments. Indeed, there are reasons to believe that in some circumstances
strong regulations may actually signal quality and stability, and therefore help attract capital inflows.
To further disentangle these effects and to better understand the economic context of regulatory
arbitrage activities, we conduct a series of additional tests to explore whether the level of economic
development and the legal and institutional environment influence the degree of regulatory arbitrage.
We split the sample based on time period, economic development and institutional quality (i.e.,
creditor rights, information sharing and property rights) and conduct regression analysis for each
sub-sample.
A country with an equal or above median institutional quality score is viewed as a country with
better institution. We then combine the above three individual institution quality indicators to obtain
an aggregate measure of the overall institution quality for each country. For each individual indicator,
we assign a value of one to a high quality country and zero to a low quality country. Then we sum the
scores of each country across the three indicators to obtain the overall measure of institution quality of
a country. The value of this aggregate measure goes from zero (lowest institution quality country) to
three (highest institution quality country). If the aggregate measure of a country is equal or above the
sample medium level, the country is defined as an overall high quality institution country. We then
split the sample based on the overall institutional quality measure. The empirical results are presented
23
in Table 6.
[Table 6 here]
The first cut in columns (1) and (2) corresponds to the different time periods. We find
regulatory arbitrage patterns in both sub-periods (1996-2001 and 2002-2007) though the effects are
somewhat stronger in the latter period. In columns (3) and (4), we find regulatory gaps exert
significant effects on bank flows to both developed countries and developing countries, however the
effects on bank flows to developed countries are much more profound. Perhaps, not surprisingly, these
results suggest that the incentives to engage in regulatory arbitrage are much stronger within the set of
developed countries. The next set of tests explore whether the main results vary depending on the
differences in the three measures of institutional quality (level of creditor rights, degree of information
sharing and property rights protection). In each case, countries with measures above the median
level are characterized as having high institutional quality, while those below the median are
characterized as having low quality. Looking at these results in columns (5) to (10), we find strong
evidence that cross-country differences in regulations have a much more profound effect on bank
flows if the recipient country has stronger creditor rights, stronger property rights and a high degree of
credit information sharing. Finally, we construct an overall measure of institutional quality by simply
summing the three individual measures (varying from 0 to 3 – where a measure of 3 indicates that the
country is above the median in terms of creditor rights protection, information sharing and property
rights protection). Using the overall institutional quality index (columns 11 and 12), we find that the
regulatory arbitrage effects are much stronger for the recipient countries with better institutional
quality.
While we have focused on how the regulatory, institutional and legal environment influence bank
flows, it is also worth considering whether these variable influence other aggregate key measures
related to global finance. For example, there is a large literature that looks at the determinants of the
current account – and with this in mind, we consider separately how our key variables influence the
current account.
Using the current account as a proxy for aggregate capital outflows, we find that overall activities
restrictiveness, restriction on whether banks can own non-financial firms, capital regulation stringency,
strength of external audit, financial statement transparency and independence of supervisory authority
24
are positively associated with aggregate capital outflows. Furthermore, we find that better institutional
quality (i.e. stronger creditor rights, property rights, better contract enforcement and information
sharing) are associated with lower degree of capital outflows. Overall, the empirical results are
highly consistent with our previous findings that used bank flows as the dependent variable. The
details of our estimating framework and the corresponding results are presented in the Internet
Appendix Table 5.
4. Empirical Results: Regulatory Arbitrage and International Bank Expansions
As discussed earlier, international banks may grow their foreign claims portfolio through two
channels: (1) establishing affiliates in different countries and extend claims locally through their
branches and subsidiaries in these countries, and (2) extending cross-border claims by financing and
booking the claims from outside the recipient or host countries. Arguably, the regulatory arbitrage
incentives have more of an effect on the first channel since the cross-border claims by the bank
headquarter are often subject to the regulation in the source country. In this section, we try to provide
more direct evidence about the regulatory arbitrage incentives and banks foreign expansion strategies
that require a physical presence aboard (i.e. subsidiary or branch). We obtain bank level data including
information on the bank foreign affiliates from Bankscope, which has comprehensive coverage in
most countries, and accounts for over 90% of all banking assets in each country. Following the
literature (e.g. Focarelli and Pozzolo, 2005), we compiled an original database on the operations of
301 large banks (total assets> $25 billion USD) with headquarters in one of the 26 source countries
covered in the BIS statistics, focusing on their foreign presence (i.e. branch or subsidiary) in 120
countries (i.e. the recipient countries in the BIS statistics) around the world. Information on branches
and foreign subsidiaries refers to year 200816. After dropping some missing observations, we obtain
more than 35,000 paired bank-country observations. To get some sense about the relation between the
presence of bank foreign affiliates and international bank flows, we check the country pairs where the
bank inflows are most out of the ordinary17 and find that the percentage of country pairs that the
16 The information is available in Bankscope only over the most recent years. 17 Specifically, we omit the eight pairs of bank supervision and regulation variables for both the source and recipient countries in equation 7 of Table 4 and run an additional regression with other controls. We then calculate the mean of the residuals for each source-recipient country pairs based on the regression results. We sort the residuals and focus on the country pairs with the top 5% of the largest positive residuals.

25
source country has banking affiliates in the recipient country is about 71%18. Moreover, there exist
significant regulatory gaps in the majority of these country pairs.
The empirical analysis broadly examines whether banks with headquarters in heavily
regulated countries are more likely to have a foreign subsidiary or branch in countries with fewer
supervisory and regulatory restrictions. To explore this issue, we estimate the following probit
model:
Pr(𝑌𝑌𝑅𝑅 ,𝐼𝐼,𝑟𝑟 = 1) = 𝐼𝐼(𝑅𝑅𝑅𝑅𝑅𝑅𝑅𝑅𝐼𝐼𝐵𝐵𝑡𝑡𝑅𝑅𝐼𝐼𝐵𝐵𝐼𝐼 ,𝑅𝑅𝑅𝑅𝑅𝑅𝑅𝑅𝐼𝐼𝐵𝐵𝑡𝑡𝑅𝑅𝐼𝐼𝐵𝐵𝑟𝑟 , 𝐼𝐼𝐵𝐵𝐼𝐼𝑡𝑡𝑅𝑅𝑡𝑡𝑅𝑅𝑡𝑡𝑅𝑅𝐼𝐼𝐵𝐵𝐵𝐵𝐼𝐼 𝑄𝑄𝑅𝑅𝐵𝐵𝐼𝐼𝑅𝑅𝑡𝑡𝑄𝑄𝐼𝐼 , 𝐼𝐼𝐵𝐵𝐼𝐼𝑡𝑡𝑅𝑅𝑡𝑡𝑅𝑅𝑡𝑡𝑅𝑅𝐼𝐼𝐵𝐵𝐵𝐵𝐼𝐼 𝑄𝑄𝑅𝑅𝐵𝐵𝐼𝐼𝑅𝑅𝑡𝑡𝑄𝑄𝑟𝑟 ,
𝐵𝐵𝐵𝐵𝐵𝐵𝐵𝐵 𝐶𝐶ℎ𝑟𝑟𝐵𝐵𝐷𝐷𝑡𝑡𝑅𝑅𝑟𝑟𝑅𝑅𝐼𝐼𝑡𝑡𝑅𝑅𝐷𝐷𝐼𝐼𝑅𝑅 ,𝐶𝐶𝐼𝐼𝑅𝑅𝐵𝐵𝑡𝑡𝑟𝑟𝑄𝑄 𝐶𝐶𝐼𝐼𝐵𝐵𝑡𝑡𝑟𝑟𝐼𝐼𝐼𝐼𝐼𝐼 , 𝐶𝐶𝐼𝐼𝑅𝑅𝐵𝐵𝑡𝑡𝑟𝑟𝑄𝑄 𝐶𝐶𝐼𝐼𝐵𝐵𝑡𝑡𝑟𝑟𝐼𝐼𝐼𝐼𝑟𝑟 , 𝐷𝐷𝑅𝑅𝐼𝐼𝑡𝑡𝐵𝐵𝐵𝐵𝐷𝐷𝑅𝑅𝐼𝐼,𝑟𝑟 ,𝐶𝐶𝐼𝐼𝐶𝐶𝐶𝐶𝐼𝐼𝐵𝐵 𝐿𝐿𝐵𝐵𝐵𝐵𝑅𝑅𝑅𝑅𝐵𝐵𝑅𝑅𝑅𝑅𝐼𝐼,𝑟𝑟)
(6)
where )(⋅f is the standard normal cumulative distribution (cdf) in the Probit model, which can be
expressed as ∫∞−
=Φ=z
dvvzzf )()()( φ , where )(⋅φ is the standard normal density.
𝑌𝑌𝑅𝑅 ,𝐼𝐼,𝑟𝑟 = 1 when the bank i of country s has foreign affiliates (subsidiaries or branches) in country r,
and zero otherwise (Foreign Presence). Alternatively, we define 𝑌𝑌𝑅𝑅 ,𝐼𝐼,𝑟𝑟 = 1 when the bank i of
country s has foreign subsidiaries in country r, and zero otherwise (Foreign Subsidiary). The foreign
subsidiaries are locally charted and independently capitalized so that it is clear that they only need to
operate under the host country’s regulation. Therefore, it might be a cleaner setting to test for
regulatory arbitrage incentives by focusing on the bank foreign subsidiaries. Following Focarelli and
Pozzolo (2005), subsidiaries refer to locally incorporated banks with the presence of foreign
ownership19. The empirical results are presented in Table 7. Columns (1) to (5) and (7) are estimated
using Foreign Subsidiary as the dependent variables, while column (6) is based uses Foreign Presence
as the dependent variable. In columns (7), we include growth opportunities and financial liberalization
18 For example, among these pairs, Portuguese banks have affiliates in Poland and Franc, and Japanese banks have affiliates in Italy, France and Philippines. Among these pairs, we also find that banks in Spain and Switzerland have affiliates in Germany, . Denmark banks have affiliates in U.K. and Lithuania, and U.S. banks have affiliates in Norway, Romania, Sweden and U.K .have affiliates in U.K. and Lithuania. U.S. banks have affiliates in Norway, Romania, Sweden and U.K. 19 In principle, one would like to find a minimum percent of equity interest needed to ensure the effective control powers in determining the bank’s activities. 50% share might be too stringent because the effective control definitely depends on the distribution of ownership (Focarelli and Pozzolo, 2005). We therefore follow Focarelli and Pozzolo (2005) and define foreign subsidiaries as all banks with a shareholder out of the country, without any participation threshold. We also test the robustness of the results using more stringent definition that a subsidiary refers to locally incorporated banks with the more than 50% foreign ownership. The empirical results are highly robust.

26
as additional control variables.
[Table 7 here]
As can be seen from Table 7, the empirical results are highly consistent with our previous
findings. Specifically, we find that banks in countries with more activities restrictions, stringent
capital regulations, higher disclosure requirements, strong external audit, powerful and independent
supervisor, and more stringent loan classification are more likely to expand abroad by establishing
subsidiaries and/or branches. Regarding the host country’s characteristics, we find that international
banks are more likely to set up subsidiaries or branches in countries with fewer activities restrictions,
less restrictive capital regulations, lower disclosure requirements, weak external audit and supervisor,
and lenient loan classifications. The empirical results are both statistically significant and
economically significant. For instance, a one standard deviation increase in Activities Restrictions in
the source country increases the likelihood of bank’s foreign expansion by about 6% (column 1) to
10% (column 7). In contrast, a one standard deviation increase in Activities Restrictions in the host
country decreases the likelihood of foreign bank’s presence by about 4% (column 1) to 8% (column 7).
A one unit increase in Bank Owning Nonfinancial Firms in the source country results in a 6% increase
in the likelihood of bank’s foreign expansion; a one unit increase in Bank Owning Nonfinancial Firms
in the recipient country decreases the likelihood of foreign bank’s presence by 5%. Considering the
sample mean (6%) of the foreign expansion tendency (Foreign Subsidiary Dummy), the effects are
economically important.
The other aspects of regulation and supervision also yield significant results. For instance, a one
standard deviation increase in Supervisory Power in the source country increases the likelihood of
bank’s foreign expansion by about 10% (column 6); while a one standard deviation increase in
Supervisory Power in the host country decreases the likelihood of foreign bank’s presence by about
12% (column 6). Regarding the market monitoring, a one standard deviation increase in Strength of
External Audit in the source country increases the likelihood of bank’s foreign expansion by about 7%
(column 6); a one standard deviation increase in Strength of External Audit in the recipient country
decrease the likelihood of foreign bank’s presence by 6%.
Moreover, we find that larger banks with higher net income are more likely to expand abroad.
Overall, the empirical results show that cross country regulatory differences play an important role in
27
the banks’ foreign expansion decisions.
To understand the effects more intuitively, we also do a simple matching analysis. First, for each
of the 26 source countries, we create dummy variable related to each of the eight supervision and
regulation measures used in our previous analysis. For each dummy variable, we assigned a value of
1 to countries which have a more stringent regulation relative to the sample median. We then
construct the overall regulation index as the sum of these eight dummy variables. Thus, this overall
measure ranges from 0 to 8 with a higher value indicating a higher level of bank regulation. We divide
26 source countries into two groups of high/low regulation according to the overall regulation index
of each country being above or below the medium level of the index.
Next, we divide all 301 banks from the 26 source countries into big/small or high
profitability/low profitability banks according to their size and net income relative to the respective
medians. This gives us a total of four cells. For the four cells, we conduct four t-tests to see within
each cell if banks located in highly regulated countries have more oversea subsidiaries than banks
located in less regulated countries. In three out of the four cells (except small and low profitability
banks), we find significant evidence that banks located in highly regulated countries tend to have
more oversea subsidiaries than banks located in less regulated countries20. The results bolster the
findings from our probit regression analysis.
5. Conclusion
In the aftermath of the recent financial crisis, there has been an ongoing discussion regarding
the need to change the regulatory architecture of the global financial system. Many have stressed the
need for more vigilant regulation, but a common concern is that financial institutions may be able to
avoid regulations by shifting their business to less regulated markets. This potential for regulatory
arbitrage may therefore increase the benefits of coordinating regulations across financial markets.
At the same time, there are benefits to allowing different regulations in different markets, which may
limit the need for coordination if the risk of regulatory arbitrage is minimal.
With these issues in mind, this paper has explored in detail how differences in bank
regulations have affected the flow of capital across markets over the past decade. Our results 20 The results are presented in Table 6 in the Internet Appendix.

28
suggest that there are important “push and pull” effects where controlling for other factors, capital is
more likely to flow from those markets with restrictive regulations to those markets that have fewer
and more relaxed restrictions on bank capital and bank investment opportunities. These results
confirm that a form of regulatory arbitrage is taking place where banks tend to transfer funds to limit
their regulatory tax. In one respect, these results suggest that one way a developing country can
attract foreign capital is by establishing fewer regulations. In a positive sense, this form of
cross-country competition may help put the brakes on any over- regulation of the global financial
sector. More negatively, these results lend support to the concerns raised by Acharya et. al. (2009)
regarding a global “race to the bottom” where capital flows to the least regulated environment. The
concern is that in an interconnected global environment we all bear the risk associated with banking
crises that arise due to insufficient regulation in any given market. These concerns are particularly
relevant in the context of the current financial crisis, and at the very least, our results reinforce the
need for global coordination in banking regulations.
At the same time, we hasten to add that our results do not necessarily suggest that there should be
always be complete coordination in banking regulations. Once can certainly argue that
cross-country differences in regulations can often promote innovation. Moreover, other differences
in the economic, legal and institutional environment may make it such that one size doesn’t fit all
when it comes to banking regulation. More practically, real-world political considerations often
limit regulators’ ability to coordinate effective regulations. 21 One possible solution is to start
international coordination among large developed economies since the regulatory arbitrage activities
tend to be more prevalent in these economies. In summary, while we think our results are instructive
and highlight the concerns regarding regulatory arbitrage, when it comes to the details regarding the
global coordination of banking regulations there is obviously a lot of room for future research.
21 See Lannoo (2009) for a good discussion of the challenges involved in coordinating regulations within the European Union in the aftermath of the recent financial crisis.
29
References Abiad, Abdul, Enrica Detragiache, and Thierry Tressel, 2010. A New Database of Financial Reforms, IMF Staff Papers 57, 281-302. Acemoglu, Daron, Simon Johnson and James A. Robinson, 2001, The colonial origins of comparative development: An empirical investigation, American Economic Review 91, 1369-1401. Acemoglu, Daron and Simon Johnson, 2005, Unbundling institutions, Journal of Political Economy 113, 5, 949-995. Acharya, Viral V., Paul Wachtel, and Ingro Walter, 2009. International Alignment of Financial Sector Regulation, in “Restoring Financial Stability: How to Repair a Failed System”, edited by Viral V. Acharya and Matthew Richardson, New York University Stern School of Business, John Wiley & Sons, March 2009. Acharya, Viral V., Yakov Amihud, and Lubomir Litov, 2011. Creditor Rights and Corporate Risk-Taking, Journal of Financial Economics 102, 150-166. Alfaro, Laura, Sebnem Kalemli-Ozcan, and Vadym Volosovych, 2008, Why Doesn't Capital Flow from Rich to Poor Countries? An Empirical Investigation, Review of Economics and Statistics 90, 347–368. Barth, James, Gerad Caprio, and Ross Levine, 2004, Bank regulation and supervision: What works best? Journal of Financial Intermediation 13, 205-248. Barth, James R, Gerard Caprio, and Ross Levine, 2006. Rethinking Bank Regulation: Till Angels Govern. Cambridge: Cambridge University Press. Barth, James R, Gerard Caprio, and Ross Levine, 2008. Bank Regulations Are Changing: For Better or Worse?. World Bank Policy Research Working Paper 4646, Beck, Thorsten, Asli Demirgüç-Kunt and Ross Levine, 2000. A New Database on Financial Development and Structure, World Bank Economic Review 14, 597-605. Beck, Thorsten, Asli Demirgüç-Kunt, and Ross Levine, 2003, Law, endowment and finance, Journal of Financial Economics 70, 137-181. Beck, Thorsten, Asli Demirgüç-Kunt, and Ross Levine, 2006, Bank supervision and corruption in lending, Journal of Monetary Economics 53, 2131-2163. Beck, Thorsten, Ross Levine and Alexey Levkov, 2010, Big Bad Banks? The Winners and Losers from Bank Deregulation in the United States, Journal of Finance 65, 1637-1667. Bekaert, Geert, Campbell R. Harvey, Christian Lundblad, 2001. Emerging equity markets and economic development, Journal of Development Economics 66, 465-504. Bekaert, Geert, Campbell R. Harvey, Christian Lundblad, 2005. Does financial liberalization spur growth? Journal of Financial Economics 77, 3-55. Bekaert, Geert, Campbell R. Harvey, Christian Lundblad, and Stephan Siegel, 2007. Global growth opportunities and market integration, Journal of Finance 62, 1081-1137.

30
BIS, 2003. Guide to International Banking Statistics. BIS Papers No. 16, Monetary and Economic Department, Bank for International Settlements, Basle, April. BIS, 2008a. The consolidated banking statistics: Foreign claims by nationality of reporting banks. Database on the website of the Bank for International Settlements: www.bis.org. BIS, 2008b. Guidelines to the international locational banking statistics, Monetary and Economic Department, Bank for International Settlements, Basle, December. BIS, 2010, Basel Committee on Banking Supervision – Report and Recommendations of the Cross-Border Bank Resolution Group. Buch, Claudia, 2003, Information or Regulation: What Drives the International Activities of Commercial Banks? Journal of Money, Credit, and Banking 35, 851-869. Dell’Ariccia, Giovanni, and Robert Marquez, 2010. Risk and the Corporate Structure of Banks, Journal of Finance, forthcoming. Demirgüç-Kunt, Asli, and Enrica Detragiache, 2002. Does deposit insurance increase banking system stability? An empirical investigation. Journal of Monetary Economics 49, 1373-1406. Djankov, Simeon, Rafael La Porta, Florencio Lopez-de-Silanes, and Andrei Shleifer. 2003 Courts. Quarterly Journal of Economics 118, 457-522. Djankov, S., C. McLeish, A. Shleifer, 2007. Private credit in 129 countries, Journal of Financial Economics 84, 299-329. Easterly, William, and Ross Levine. 1997. Africa's Growth Tragedy: Policies and Ethnic Divisions, Quarterly Journal of Economics 112(4), 1203-1250. Feldstein, Martin, and Charles Horioka, 1980. Domestic Savings and International Capital Flows, Economic Journal 90, 314-329. Fernandes, Nuno, Ugor Lei and Darius Mille, 2010. Escape from New York: The market impact of loosening disclosure requirements, Journal of Financial Economics 95, 129-147 Focarelli, Dario and Pozzolo, Alberto F., 2005. Where Do Banks Expand Abroad? An Empirical Analysis, Journal of Business 79, 2435-2463. Gelos, Gaston, and Shang-jin Wei, 2005, Transparency and International Portfolio Holdings, Journal of Finance 60, 2987-3020. Goodhardt, Charles, 2000, The organizational structure of banking supervision, BIS working paper. Houston, Joel, Chen Lin, Ping Lin and Yue Ma, 2010, Creditor Rights, Information Sharing and Bank Risk Taking, Journal of Financial Economics, 96, 485-512. International Monetary Fund (IMF) Staff Paper, 2010, Resolution of Cross-Border Banks – A Proposed Framework for Enhanced Coordination (Prepared by the Legal and Monetary and Capital Markets Departments, approved by Sean Hagan and José Viñals) Jappelli, Tullio, and Marco Pagano, 2002, Information sharing, lending and defaults: Cross-country evidence, Journal of Banking and Finance 26, 2017-2045.

31
King, Robert and Ross Levine, 1993. Finance and Growth: Schumpeter Might Be Right. Quarterly Journal of Economics, 717-738. Knight, Malcolm, 2009. Rebuilding the Global Architecture of Financial Regulation, Vice Chairman of Deutsche Bank Global Group, speech made at University of Chicago Booth School of Business, http://research.chicagobooth.edu/igm/events/speaker-series/2009-04-01.aspx Kraay, Aart, and Jaume Ventura, 2000. Current accounts in debtor and creditor countries. Quarterly Journal of Economics 115, 1137-1166. La Porta, R., Lopez de Silanes, F., Shleifer, A., Vishny, R., 1998, Law and finance, Journal of Political Economy 106, 1113-1155. La Porta, R., Lopez de Silanes, F., Shleifer, A., Vishny, R., 1999, The quality of government, Journal of Law, Economics, and Organization 15, 222-279. La Porta, R., Lopez de Silanes, F., Shleifer, A., 2002. Government ownership of banks, Journal of Finance 57, 265-301. Laeven, L. and Levine R., 2009. Bank governance, regulation and risk taking, Journal of Financial Economics 93, 259-275. Lannoo, Karel, 2009. The Road Ahead After De Larosière, Brussels: Center for Economic Policy Studies, Policy Brief No. 195. Levine, Ross and Sara Zervos, 1998. Stock Markets, Banks, and Economic Growth, American Economic Review 88, 537-558. Lin, Chen, Yue Ma, Paul Malatesta, Yuhai Xuan, 2011a. Ownership structure and the cost of corporate borrowing. Journal of Financial Economics 100, 1–23. Lin, Chen, Yue Ma, Paul Malatesta, Yuhai Xuan, 2011b. Corporate ownership structure and bank loan syndicate structure. Journal of Financial Economics, forthcoming. Lucas, Robert, 1990, Why doesn't Capital Flow from Rich to Poor Countries?, American Economic Review 80, 92–96. Marshall, Monty G., and Keith Jaggers, 2009. Polity IV Project, George Mason University and Center for Systemic Peace, www.systemicpeace.org/polity McGuire, Patrick, and Nikola Tarashev, 2008, Global monitoring with the BIS international banking statistics, BIS working papers, No 224. Mian, Atif, 2006, Distance constraints: The limits of foreign lending in poor economies, Journal of Finance 61, 1465-1505. Morrison, Alan D., and Lucy White, 2009, Level Playing Fields in International Financial Regulation, Journal of Finance 64, 1099-1142. Obstfeld, Maurice, and Kenneth Rogoff, 1995. The Intertemporal Approach to the Current Account, in Gene Grossman and Kenneth Rogoff (eds.) Handbook of International Economics, Amsterdam: Elsevier,

32
Pang, Jiaren, Spindt, Paul and Sheri Tice, 2010, Diversification and internal Information Sharing: Evidence from Financial Conglomeration, Working Paper, Tulane University. Papaioannou, Elias, 2009, What Drives International Financial Flows? Politics, Institutions and Other Determinants, Journal of Development Economics 88, 269-281. Petersen, Mitchell, 2009, Estimating Standard Errors in Finance Panel Data Sets: Comparing Approaches, Review of Financial Studies, 22 (1); 435-480. Prasad, Eswar, Raghuram Rajan and Arvind Subramanian, 2007, Foreign Capital and Economic Growth, Brookings Papers on Economic Activity, 153-209. Rajan, Raghuram, 2008, Global Imbalances or Why are the Poor Financing the Rich, De Economist 156, 3-24. Rajan, Raghuram and Arvind Subramanian, 2008, Aid and Growth: What does the Cross-Country Evidence Really Show?, Review of Economics and Statistics 90, 643-665. Rajan, Raghuram, and Luigi Zingales 1998. Financial dependence and growth, American Economic Review 88, 559-586. Rose, Andrew K., 2004. Do We Really Know That the WTO Increases Trade?. American Economic Review 94, 98-114. Sachs, Jeffrey, 1981. The Current Account and Macroeconomic Adjustment in the 1970s, Brookings Papers on Economic Activity 1, 201-268. Sengupta, Rajdeep, 2007, Foreign entry and bank competition, Journal of Financial Economics 84, 502-528. Stulz, Rene M. and Rohan Williamson, 2003, Culture, openness, and finance, Journal of Financial Economics 70, 313-349. Tesar, Linda, 1991. Savings, Investment and International Capital Flows, Journal of International Economics 31, 55-78. Wooldridge, Philip D., 2002. Uses of the BIS statistics: An introduction. BIS Quarterly Review, Bank for International Settlements, Basle, March.

33
Table 1. Variable definitions and data sources Variable Definition Original Sources
Bank flows
This variable captures the bank capital inflows from banks located in source country s to all sectors of the economy in recipient country r from year t-1 to t. Specifically, it is defined as 100 times the log difference (i.e. difference in log from t-1 to t) of total foreign claims (FCsr) from source country s to recipient country r, that is, 100*∆ln(FCsr). The definition of foreign claims is defined by the nationality of the headquarter of the reporting bank published in the consolidated banking statistics Table 9B in each issue of the BIS Quarterly Review.
Bank for International Settlements (BIS, 2008a)
Creditor rights
An index aggregating creditor rights. Specifically, it measures (1) whether there are restrictions imposed, such as creditors’ consent or minimum dividend, when a debtor files for reorganization (Restrictions on Reorganization); (2) whether secured creditors are able to gain possession of assets after the petition for reorganization is approved, that is, whether there is no automatic stay or asset freeze imposed by the court on creditor’s ability to seize collateral (No Automatic Stay); (3) whether secured creditors are ranked first in the distribution of proceeds of liquidating a bankrupt firm as opposed to other creditors such as government or workers (Secured Creditor Paid First); and (4) whether the incumbent management does not stay in control of the firm during the reorganization (No Management Stay). The index ranges between 0 and 4 and is constructed on yearly base.
La Porta et al. (1998), Djankov, et al (2007)
Depth of credit information
An index that measures the information contents of the credit information. A value of one is added to the index when a country’s information agencies have each of these characteristics: (1) both positive credit information (for example, loan amounts and pattern of on-time repayments) and negative information (for example, late payments, number and amount of defaults and bankruptcies) are distributed; (2) data on both firms and individual borrowers are distributed; (3) data from retailers, trade creditors, or utilities, as well as from financial institutions, are distributed; (4) more than 2 years of historical data are distributed; (5) data are collected on all loans of value above 1% of income per capita; and (6) laws provide for borrowers’ right to inspect their own data. The index ranges from 0 to 6, with higher values indicating the availability of more credit information, from either a public registry or a private bureau, to facilitate lending decisions. If a country has no public registry or private bureau in a specific year, the index takes on the value 0. If an information agency exists in a country, the index takes on the value in that year or the value in the earliest available year.
Djankov et al. (2007), World Bank “Doing Business” database
Top 5 bank concentration (all banks) The fraction of total assets held by the five largest banks in the country. Bankscope
Government bank ownership The fraction of the banking system's assets in the banks that are 50 percent or more owned by government. Barth et al. (2006,
2008)
Overall activities restrictions
The extent to which banks may engage in (a) underwriting, brokering and dealing in securities, and all aspects of the mutual fund industry, (b) insurance underwriting and selling, and (c) real estate investment, development, and management. Unrestricted=1: full range of activities can be conducted directly in the bank; Permitted=2: full range of activates can be conducted, but some or all must be conducted in subsidiaries; Restricted=3: less than full range of activities can be conducted in the bank or subsidiaries; and Prohibited=4: the activity cannot be conducted in either the bank or subsidiaries. Higher values indicate greater restrictiveness.
Barth et al. (2006, 2008)

34
Restriction on banks own nonfinancial firms
The extent to which banks may own and control nonfinancial firms (higher value means more restrictive). Unrestricted=1=a bank may own 100 percent of the equity in any nonfinancial firm; Permitted=2=a bank may own 100 percent of the equity of a nonfinancial firm, but ownership is limited based on a bank’s equity capital; Restricted=3=a bank can only acquire less than 100 percent of the equity in a nonfinancial firm; and Prohibited=4=a bank may not acquire any equity investment in a nonfinancial firm whatsoever.
Barth et al. (2006, 2008)
Independence of supervisory authority - Overall
The degree to which the supervisory authority is independent from the government and legally protected from the banking industry. The indicator is constructed based on the following three questions. 1. Are the supervisory bodies responsible or accountable to a) Prime Minister, b) the Finance Minister or other cabinet level official, c) a legislative body, such as parliament of congress (yes=1)? 2. Are the supervisors legally liable for their actions (i.e. if a supervisor takes actions against a bank, the supervisor cannot be sued) (No=1)? 3. Does the head of the supervisory agency (and other directors) have a fixed term and how long? (=1 if the term>=4). Higher value means a more independent supervisory agency.
Barth et al. (2006, 2008)
Official supervisory power
Principal component indicator of 14 dummy variables: 1.Does the supervisory agency have the right to meet with external auditors to discuss their report without the approval of the bank? 2.Are auditors required by law to communicate directly to the supervisory agency any presumed involvement of bank directors or senior managers in elicit activities, fraud, or insider abuse? 3. Can supervisors take legal action against external auditors for negligence? 4.Can the supervisory authority force a bank to change its internal organizational structure? 5. Are off-balance sheet items disclosed to supervisors? 6. Can the supervisory agency order the bank's directors or management to constitute provisions to cover actual or potential losses? 7. Can the supervisory agency suspend the directors' decision to distribute: a) Dividends? b) Bonuses? c) Management fees? 8. Can the supervisory agency legally declare-such that this declaration supersedes the rights of bank shareholders-that a bank is insolvent? 9. Does the Banking Law give authority to the supervisory agency to intervene that is, suspend some or all ownership rights-a problem bank? 10.Regarding bank restructuring and reorganization, can the supervisory agency or any other government agency do the following: a) Supersede shareholder rights? b) Remove and replace management? c) Remove and replace directors?
Barth et al. (2006, 2008)
Loan classification leniency
If there is a loan classification system, the actual minimum number of days beyond which a loan in arrears must be classified as substandard, then doubtful, and finally loss are summed. Higher values indicate less stringency.
Barth et al. (2006, 2008)
Capital regulatory index (total)
The sum of overall capital regulatory stringency and initial capital stringency, which measures whether certain funds may be used to initially capitalize a bank and whether they are officially verified. Higher values indicate greater stringency.
Barth et al. (2006, 2008)
Strength of external audit
The effectiveness of external audits of banks. It is an indicator developed based on the following questions (Yes=1, No=0) : 1. Is an external audit a compulsory obligation for banks? 2. Are specific requirements for the extent or nature of the audit spelled out? 3. Are auditors licensed or certified? 4. Do supervisors get a copy of the auditor's report? 5. Does the supervisory agency have the right to meet with external auditors to discuss their report without the approval of the bank? 6. Are auditors required by law to communicate directly to the supervisory agency
Barth et al. (2006, 2008)
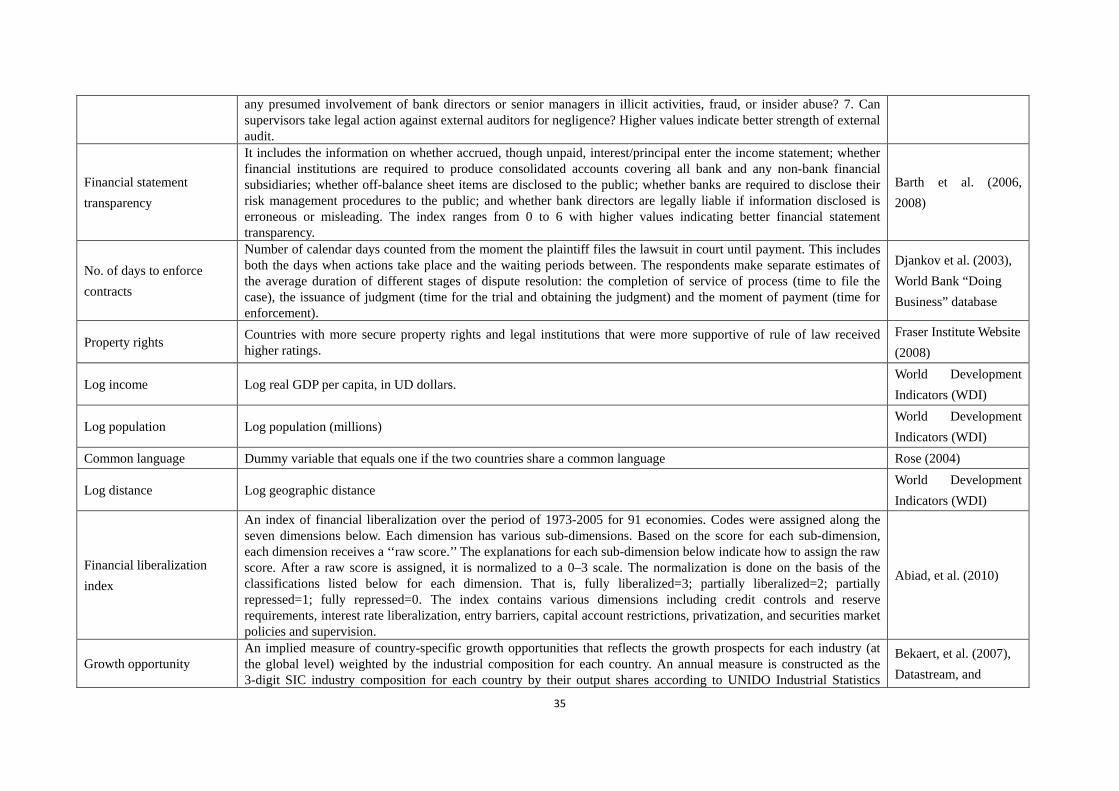
35
any presumed involvement of bank directors or senior managers in illicit activities, fraud, or insider abuse? 7. Can supervisors take legal action against external auditors for negligence? Higher values indicate better strength of external audit.
Financial statement transparency
It includes the information on whether accrued, though unpaid, interest/principal enter the income statement; whether financial institutions are required to produce consolidated accounts covering all bank and any non-bank financial subsidiaries; whether off-balance sheet items are disclosed to the public; whether banks are required to disclose their risk management procedures to the public; and whether bank directors are legally liable if information disclosed is erroneous or misleading. The index ranges from 0 to 6 with higher values indicating better financial statement transparency.
Barth et al. (2006, 2008)
No. of days to enforce contracts
Number of calendar days counted from the moment the plaintiff files the lawsuit in court until payment. This includes both the days when actions take place and the waiting periods between. The respondents make separate estimates of the average duration of different stages of dispute resolution: the completion of service of process (time to file the case), the issuance of judgment (time for the trial and obtaining the judgment) and the moment of payment (time for enforcement).
Djankov et al. (2003), World Bank “Doing Business” database
Property rights Countries with more secure property rights and legal institutions that were more supportive of rule of law received higher ratings.
Fraser Institute Website (2008)
Log income Log real GDP per capita, in UD dollars. World Development Indicators (WDI)
Log population Log population (millions) World Development Indicators (WDI)
Common language Dummy variable that equals one if the two countries share a common language Rose (2004)
Log distance Log geographic distance World Development Indicators (WDI)
Financial liberalization index
An index of financial liberalization over the period of 1973-2005 for 91 economies. Codes were assigned along the seven dimensions below. Each dimension has various sub-dimensions. Based on the score for each sub-dimension, each dimension receives a ‘‘raw score.’’ The explanations for each sub-dimension below indicate how to assign the raw score. After a raw score is assigned, it is normalized to a 0–3 scale. The normalization is done on the basis of the classifications listed below for each dimension. That is, fully liberalized=3; partially liberalized=2; partially repressed=1; fully repressed=0. The index contains various dimensions including credit controls and reserve requirements, interest rate liberalization, entry barriers, capital account restrictions, privatization, and securities market policies and supervision.
Abiad, et al. (2010)
Growth opportunity An implied measure of country-specific growth opportunities that reflects the growth prospects for each industry (at the global level) weighted by the industrial composition for each country. An annual measure is constructed as the 3-digit SIC industry composition for each country by their output shares according to UNIDO Industrial Statistics
Bekaert, et al. (2007), Datastream, and
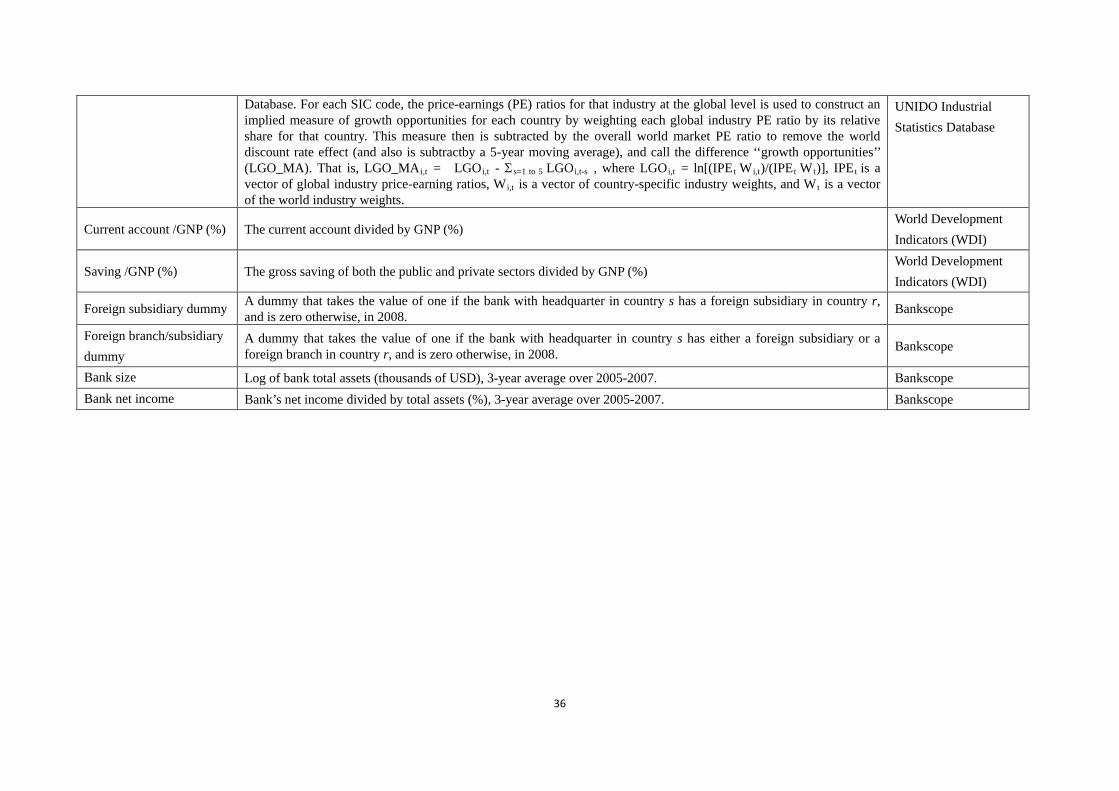
36
Database. For each SIC code, the price-earnings (PE) ratios for that industry at the global level is used to construct an implied measure of growth opportunities for each country by weighting each global industry PE ratio by its relative share for that country. This measure then is subtracted by the overall world market PE ratio to remove the world discount rate effect (and also is subtractby a 5-year moving average), and call the difference ‘‘growth opportunities’’ (LGO_MA). That is, LGO_MAi,t = LGOi,t - Σs=1 to 5 LGOi,t-s , where LGOi,t = ln[(IPEt Wi,t)/(IPEt Wt)], IPEt is a vector of global industry price-earning ratios, Wi,t is a vector of country-specific industry weights, and Wt is a vector of the world industry weights.
UNIDO Industrial Statistics Database
Current account /GNP (%) The current account divided by GNP (%) World Development Indicators (WDI)
Saving /GNP (%) The gross saving of both the public and private sectors divided by GNP (%) World Development Indicators (WDI)
Foreign subsidiary dummy A dummy that takes the value of one if the bank with headquarter in country s has a foreign subsidiary in country r, and is zero otherwise, in 2008. Bankscope
Foreign branch/subsidiary dummy
A dummy that takes the value of one if the bank with headquarter in country s has either a foreign subsidiary or a foreign branch in country r, and is zero otherwise, in 2008. Bankscope
Bank size Log of bank total assets (thousands of USD), 3-year average over 2005-2007. Bankscope Bank net income Bank’s net income divided by total assets (%), 3-year average over 2005-2007. Bankscope

37
Table 2. Summary statistics
Variable Mean Median Std.Dev. Min Max Obs No. of
countries Panel A: Bilateral relation variables
Bank flows 2.89 2.03 11.32 -99.97 99.98 24,233 120 Common language 0.14 0 0.35 0 1 2,065 120 Log distance 8.03 8.33 0.92 4.80 9.90 2,065 120 Panel B: Country level variables
Creditor rights 1.81 2 1.13 0 4 1368 120 Depth of credit information 3.06 3 2.21 0 6
120
Top 5 bank concentration 0.80 0.83 0.18 0.19 1 1368 120 Government bank ownership 0.20 0.12 0.24 0 0.94 1272 113 No. of days to enforce contracts (log) 6.39 6.24 5.65 4.79 7.29 1368 120 Property rights 5.37 5.30 1.77 1.43 9.62 1368 120 Log income 7.50 7.43 1.59 4.41 10.63 1368 120 Log population 2.66 2.39 1.35 0.47 7.19 1368 120 Financial liberalization index 15.31 15.25 3.73 3.75 21.00 792 86 Growth opportunity 0.01 0.01 0.09 -0.33 0.33 1059 92 Current account /GNP (%) -2.28 -2.65 8.20 -44.73 55.53 1,202 104 Saving /GNP (%) 19.72 18.83 9.07 0.41 58.36 1,202 104 Panel C: Regulatory variables
Overall activities restrictions 7.64 8 2.03 3 12 1272 113 Restriction on banks own nonfinancial firms 2.57 3 0.79 1 4 1272 113 Capital regulatory index (total) 6.00 6 1.78 1 10 1260 111 Independence of supervisory authority - overall 1.70 2 0.89 0 3 1236 109 Official Supervisory Power 11.16 11 2.44 4 16 1296 114 Loan classification leniency (log) 7.18 6.70 1.29 3.40 9.30 1296 114 Strength of external audit 5.19 6 1.19 2 7 1272 113 Financial statement transparency 4.01 5 0.97 1 6 1224 108 Panel D: Cross-section data for banks’ foreign affiliates
No. of banks
Bank level variables
Foreign subsidiary dummy 0.06 0 0.22 0 1 35,819 301 Foreign branch/subsidiary dummy 0.07 0 0.23 0 1 35,819 301 Bank size 18.67 18.44 1.27 17.04 21.62 35,819 301 Bank net income 0.91 0.76 0.93 -0.487 8.90 35,819 301
Note: For Panel A, B, and C, the sample period is 1996-2007. For Panel D, the sample is for 2007/8.

38
Table 3A. Regulatory arbitrage and aggregate bank inflows
1 2 3 4 5 6 7 8
Overall activities restrictions (recipient)
-0.29
-0.39 -0.55 -0.71
[0.015]**
[0.035]** [0.021]** [0.014]**
Restriction on banks own nonfin firms (recipient)
-0.86
-0.88
-1.26 -1.70
[0.029]**
[0.171] [0.281] [0.216]
capital regulatory index (recipient)
-0.20
-0.27 -0.31 -0.38
[0.086]*
[0.020]** [0.073]* [0.058]*
strength of external audit (recipient)
-0.83
-1.48 -1.81 -2.32
[0.054]*
[0.033]** [0.014]** [0.009]***
fin statement transparency (recipient)
-1.27
-0.95 -1.63 -1.98
[0.025]**
[0.073]* [0.057]* [0.045]**
Independence of Supervisory Authority (recipient)
-1.25 -1.33
-1.10 -0.85
[0.035]** [0.032]** [0.029]** [0.032]**
Official Supervisory Power (recipient)
-0.24 -0.23 -0.36 -0.47
[0.184] [0.074]* [0.025]** [0.020]**
Loan classification leniency (recipient)
0.69 0.59 0.51
[0.022]** [0.016]** [0.012]**
Creditor rights (recipient) 5.83 6.11 6.22 5.96 5.98 6.93 7.03 7.89
[0.063]* [0.033]** [0.032]** [0.073]* [0.034]** [0.027]** [0.032]** [0.025]**
Info sharing (recipient) 2.42 2.30 2.45 2.19 2.20 2.16 2.72 1.58
[0.028]** [0.081]* [0.026]** [0.091]* [0.032]** [0.085]* [0.067]* [0.088]*
No. of days to enforce contracts (recipient)
-0.11
-0.12 -0.10
[0.026]** [0.038]** [0.044]**
Property rights (recipient) 3.54 3.66 3.76 3.31 3.39 3.66 2.34 2.81
[0.014]** [0.027]** [0.022]** [0.052]* [0.064]* [0.033]** [0.028]** [0.021]**
Log income (recipient) 2.92 3.10 2.77 3.15 3.10 2.35 3.90 4.77
[0.082]* [0.018]** [0.063]* [0.012]** [0.024]** [0.089]* [0.075]* [0.056]*
Log population (recipient) 2.23 3.01 2.35 2.38 3.13 3.40 3.66 4.52
[0.303] [0.256] [0.239] [0.277] [0.239] [0.043]** [0.047]** [0.036]**
Fin liberalization (recipient)
0.81 0.97
[0.039]** [0.034]**
Growth opportunity (recipient)
1.76 2.06
[0.017]** [0.016]**
Sample period 1996-2007 1996-2005 Recipient country fixed effect yes yes yes yes yes yes yes yes Time fixed effect yes yes yes yes yes yes yes yes Observations 1,372 1,264 1,264 1,228 1,240 1,168 642 642 Adj. R-squared 0.15 0.16 0.16 0.16 0.17 0.18 0.38 0.43 No. of recipient countries 120 111 111 108 109 103 71 71
Note: The dependent variable is aggregate bank inflows to 120 recipient countries, which is defined as 100 times the log-difference of total foreign claims (FCr) of 26 source countries to recipient country r, that is, 100*∆ln(ΣsFCsr). The estimation is based on fixed effect OLS regressions. For column 8, it is based on GDP (in US $)-weighted OLS estimation. The country level banking regulatory variables are time varying and are based on three major surveys spanning almost over a decade by the World Bank (Barth, Caprio, and Levine, 2008). The values of regulatory variables for the period of 1996 to 1999 are taken from the first survey recorded in 1998/1999. Their values for the period of 2000 to 2003 are taken from the second survey that assesses the state of regulation as of the end of 2002. Their values for the period of 2004 to 2007 are taken from the third survey that was sought a characterization of the environment as of the end of 2005. Detailed variable definitions can be found in Table 1. Time fixed effects and recipient country specific effects are included in the regressions but not reported. P-values are computed by the heteroskedasticity-robust standard errors clustered for recipient countries and are presented in brackets. *, **, *** represent statistical significance at the 10%, 5% and 1% level respectively.

39
Table 3B. Regulatory arbitrage and aggregate bank outflows
1 2 3 4 5 6 7 8
Overall activities restrictions (source)
0.53
0.92 1.06 1.16
[0.025]**
[0.024]** [0.017]** [0.012]**
Restriction on banks own nonfin firms (source)
2.33
2.28
2.19 1.50
[0.087]*
[0.017]** [0.014]** [0.017]**
capital regulatory index (source)
0.28
0.41 0.65 0.78
[0.038]**
[0.097]* [0.076]* [0.057]*
strength of external audit (source)
0.85
0.74 1.27 1.72
[0.032]**
[0.218] [0.139] [0.113]
fin statement transparency (source)
2.62
2.74 2.45 2.91
[0.026]**
[0.030]** [0.026]** [0.021]**
Independence of Supervisory Authority (source)
1.05 1.41
1.89 1.26
[0.083]* [0.542] [0.389] [0.446]
Official Supervisory Power (source)
1.83 1.76 1.28 0.78
[0.131] [0.041]** [0.037]** [0.059]*
Loan classification leniency (source)
-0.44 -0.32 -0.25
[0.013]** [0.018]** [0.025]**
Creditor rights (source) -3.24 -3.86 -3.31 -2.95 -2.90 -2.89 -2.77 -3.09
[0.016]** [0.022]** [0.052]* [0.141] [0.113] [0.024]** [0.034]** [0.026]**
Info sharing (source) -1.55 -1.18 -1.56 -1.08 -0.84 -0.76 -0.97 -0.70
[0.028]** [0.030]** [0.028]** [0.030]** [0.173] [0.003]*** [0.015]** [0.0061]***
No. of days to enforce contracts (source)
0.21 0.19 0.22
[0.014]** [0.017]** [0.016]**
Property rights (source) -4.61 -4.26 -4.62 -4.36 -5.70 -4.79 -5.17 -6.51
[0.035]** [0.063]* [0.058]* [0.062]* [0.037]** [0.035]** [0.024]** [0.018]**
Log income (source) -1.02 -1.70 -1.56 -1.65 -1.74 -1.31 -1.82 -2.09
[0.333] [0.032]** [0.330] [0.281] [0.036]** [0.277] [0.145] [0.108]
Log population (source) -2.01 -2.68 -2.13 -1.85 -2.53 -2.73 -2.98 -1.71
[0.122] [0.031]** [0.120] [0.124] [0.081]* [0.146] [0.123] [0.149]
Fin liberalization (source)
0.42 0.34
[0.176] [0.228]
Growth opportunity (source)
-1.49 -1.26
[0.025]** [0.030]**
Sample period 1996-2007 1996-2005 Source country fixed effect yes yes yes yes yes yes yes yes Time fixed effect yes yes yes yes yes yes yes yes Observations 238 238 238 238 238 238 181 181 Adj. R-squared 0.30 0.31 0.32 0.30 0.32 0.36 0.37 0.41 No. of source countries 26 26 26 26 26 26 23 23
Note: The dependent variable is aggregate bank outflows from 26 source countries, which is defined as 100 times the log-difference of total foreign claims (FCs) of source country s to 120 recipient countries, that is, 100*∆ln(ΣrFCsr). The estimation is based on fixed effect OLS regressions. For column 8, it is based on GDP (in US $)-weighted OLS estimation. The country level banking regulatory variables are time varying and are based on three major surveys spanning almost over a decade by the World Bank (Barth, Caprio, and Levine, 2008). The values of regulatory variables for the period of 1996 to 1999 are taken from the first survey recorded in 1998/1999. Their values for the period of 2000 to 2003 are taken from the second survey that assesses the state of regulation as of the end of 2002. Their values for the period of 2004 to 2007 are taken from the third survey that was sought a characterization of the environment as of the end of 2005. Detailed variable definitions can be found in Table 1. Time fixed effects and source country specific effects are included in the regressions but not reported. P-values are computed by the heteroskedasticity-robust standard errors clustered for source countries and are presented in brackets. *, **, *** represent statistical significance at the 10%, 5% and 1% level respectively.

40
Table 4. Regulatory arbitrage and bank flows
1 2 3 4 5 6 7 8 Overall activities restrictions (source) 0.39 0.30 0.36 0.29
[0.014]** [0.005]*** [0.005]*** [0.007]*** Overall activities restrictions (recipient) -0.25 -0.32 -0.33 -0.27
[0.013]** [0.013]** [0.011]** [0.014]** Restriction on banks own nonfin firms (source) 1.30 1.56 1.52 1.22
[0.071]* [0.021]** [0.020]** [0.022]** Restriction on banks own nonfin firms (recipient) -1.97 -1.41 -1.42 -1.75
[0.014]** [0.149] [0.143] [0.116] capital regulatory index (source) 0.59 0.25 0.23 0.18
[0.027]** [0.081]* [0.078]* [0.103] capital regulatory index (recipient) -0.43 -0.35 -0.34 -0.25
[0.072]* [0.033]** [0.026]** [0.031]** strength of external audit (source) 0.72 0.52 0.70 0.61
[0.028]** [0.158] [0.153] [0.169] strength of external audit (recipient) -0.26 -0.47 -0.65 -0.53
[0.058]* [0.030]** [0.021]** [0.029]** fin statement transparency (source) 1.60 1.28 1.85 1.40
[0.035]** [0.027]** [0.020]** [0.026]** fin statement transparency (recipient) -0.96 -0.59 -0.56 -0.75
[0.022]** [0.064]* [0.062]* [0.036]** Independence of Supervisory Authority (source) 0.94 1.29 1.05 0.87
[0.060]* [0.140] [0.199] [0.254] Independence of Supervisory Authority (recipient) -0.71 -0.55 -0.83 -0.68
[0.040]** [0.040]** [0.030]** [0.034]** Official Supervisory Power (source) 0.46 0.61 0.66 0.57
[0.036]** [0.056]* [0.052]* [0.070]* Official Supervisory Power (recipient) -0.39 -0.35 -0.52 -0.65
[0.065]* [0.031]** [0.021]** [0.016]** Loan classification leniency (source) -0.26 -0.27 -0.22
[0.002]*** [0.004]*** [0.005]*** Loan classification leniency (recipient) 0.43 0.41 0.33
[0.037]** [0.033]** [0.039]** Creditor rights (source) -3.68 -3.74 -3.03 -2.74 -3.31 -2.68 -2.40 -1.83
[0.019]** [0.014]** [0.016]** [0.059]* [0.096]* [0.026]** [0.024]** [0.034]** Creditor rights (recipient) 4.69 4.56 3.94 4.18 4.59 3.39 3.65 2.94
[0.018]** [0.020]** [0.070]* [0.036]** [0.048]** [0.018]** [0.019]** [0.024]** Info sharing (source) -0.66 -0.67 -0.39 -0.74 -0.72 -0.46 -0.68 -0.55
[0.011]** [0.018]** [0.061]* [0.008]*** [0.011]** [0.045]** [0.040]** [0.063]* Info sharing (recipient) 0.85 1.11 1.01 1.15 0.93 1.12 1.17 1.26
[0.074]* [0.021]** [0.027]** [0.020]** [0.063]* [0.062]* [0.062]* [0.034]** No. of days to enforce contracts (recipient) 0.08 0.10 0.08
[0.030]** [0.040]** [0.057]* No. of days to enforce contracts (source) -0.14 -0.15 -0.12
[0.014]** [0.020]** [0.024]**

41
Top 5 bank concentration (recipient) -2.60 -3.64 -2.96
[0.092]* [0.062]* [0.075]* Government bank ownership (recipient) -1.09 -1.67 -1.37
[0.035]** [0.030]** [0.038]** Property rights (source) -2.34 -2.52 -2.55 -3.22 -2.29 -1.98 -2.44 -2.07
[0.035]** [0.068]* [0.063]* [0.024]** [0.114] [0.035]** [0.031]** [0.042]** Property rights (recipient) 1.68 1.91 1.96 1.95 2.22 2.50 1.86 1.65
[0.031]** [0.103] [0.040]** [0.108] [0.067]* [0.021]** [0.030]** [0.037]** Log income (source) -1.54 -1.09 -1.07 -1.72 -0.98 -1.27 -1.16 -0.93
[0.017]** [0.216] [0.170] [0.045]** [0.261] [0.252] [0.219] [0.294] Log income (recipient) 2.63 1.88 1.82 1.82 1.21 2.09 2.11 1.50
[0.050]* [0.027]** [0.030]** [0.031]** [0.079]* [0.051]* [0.071]* [0.091]* Log population (source) 3.75 2.80 2.20 2.48 2.16 1.34 1.60 1.29
[0.039]** [0.064]* [0.269] [0.041]** [0.108] [0.155] [0.193] [0.240] Log population (recipient) 2.01 1.67 1.79 1.42 1.35 2.83 2.48 2.03
[0.481] [0.104] [0.220] [0.318] [0.170] [0.030]** [0.032]** [0.040]** Common language 2.51 3.94 3.99 4.05 4.06 4.05 5.40 4.30
[0.061]* [0.068]* [0.079]* [0.179] [0.039]** [0.005]*** [0.007]*** [0.008]*** Log distance -1.56 -1.48 -1.85 -1.71 -1.66 -1.64 -1.38 -1.74
[0.072]* [0.122] [0.017]** [0.111] [0.012]** [0.184] [0.263] [0.258] Fin liberalization (source) 0.37 0.29
[0.162] [0.221] Fin liberalization (recipient) 0.52 0.42
[0.011]** [0.013]** Growth opportunity (source) -1.22 -1.41
[0.027]** [0.037]** Growth opportunity (recipient) 1.67 1.16
[0.029]** [0.035]** Sample period 1996-2007 1996-2005 Source country fixed effect yes yes yes yes yes yes yes yes Recipient country fixed effect yes yes yes yes yes yes yes yes Time fixed effect yes yes yes yes yes yes yes yes Observations 14,430 13,738 13,790 13,467 13,601 12,936 7,923 7,923 No. of source countries 26 26 26 26 26 26 23 23 No. of recipient countries 120 111 111 108 109 102 70 70 Adj. R-squared 0.17 0.18 0.16 0.17 0.18 0.19 0.19 -
Note: The dependent variable is bank flows, which is defined as 100 times the log-difference of total foreign claims (FCsr) from source country s to recipient country r, that is, 100*∆ln(FCsr). P-values are presented in brackets. The estimations are based on fixed effect OLS regressions for columns 1 to 7 and GMM for column 8. P-values for columns 1 to 7 are computed by the heteroskedasticity-robust standard errors clustered for recipient countries. The GMM estimator and its corresponding p-values of coefficients are based on weighting matrix II of Bekaert et al. (2001, p.477), which is an extended panel-data version of Newey and West (1987) robust covariance matrix that facilitates serial correlation, cross-country heteroskedasticity, and restricted SUR effects (i.e., the off-diagonal elements of the variance-covariance matrices are restricted to be identical). The lag length of the GMM estimator is chosen as 3 due to our limited 10-year sample period (Greene, 2008, p.643). The country level banking regulatory variables are time varying and are based on three major surveys spanning almost over a decade by the World Bank (Barth, Caprio, and Levine, 2008). The values of regulatory variables for the period of 1996 to 1999 are taken from the first survey recorded in 1998/1999. Their values for the period of 2000 to 2003 are taken from the second survey that assesses the state of regulation as of the end of 2002. Their values for the period of 2004 to 2007 are taken from the third survey that was sought a characterization of the environment as of the end of 2005. Detailed variable definitions can be found in Table 1. Time fixed effects, as well as source and recipient country specific effects are included in the regressions but not reported. *, **, *** represent statistical significance at the 10%, 5% and 1% level respectively.
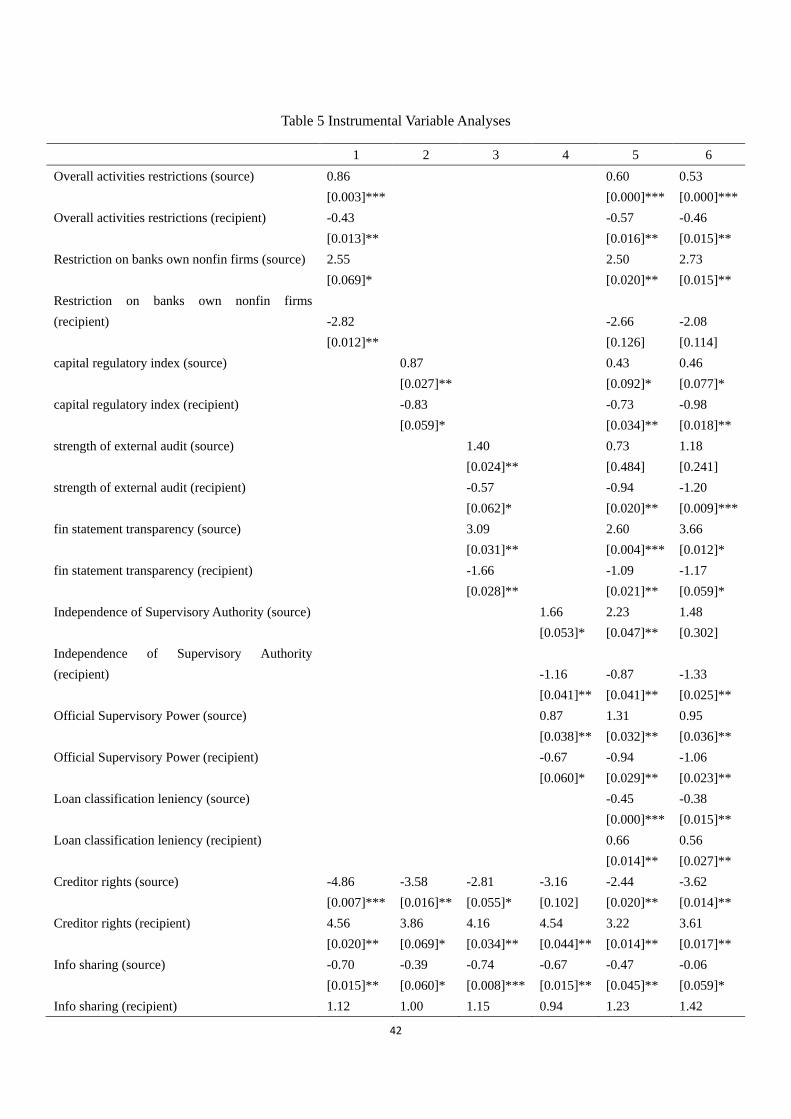
42
Table 5 Instrumental Variable Analyses
1 2 3 4 5 6
Overall activities restrictions (source) 0.86
0.60 0.53
[0.003]***
[0.000]*** [0.000]***
Overall activities restrictions (recipient) -0.43
-0.57 -0.46
[0.013]**
[0.016]** [0.015]**
Restriction on banks own nonfin firms (source) 2.55
2.50 2.73
[0.069]*
[0.020]** [0.015]**
Restriction on banks own nonfin firms (recipient) -2.82
-2.66 -2.08
[0.012]**
[0.126] [0.114]
capital regulatory index (source)
0.87
0.43 0.46
[0.027]**
[0.092]* [0.077]*
capital regulatory index (recipient)
-0.83
-0.73 -0.98
[0.059]*
[0.034]** [0.018]**
strength of external audit (source)
1.40
0.73 1.18
[0.024]**
[0.484] [0.241]
strength of external audit (recipient)
-0.57
-0.94 -1.20
[0.062]*
[0.020]** [0.009]***
fin statement transparency (source)
3.09
2.60 3.66
[0.031]**
[0.004]*** [0.012]*
fin statement transparency (recipient)
-1.66
-1.09 -1.17
[0.028]**
[0.021]** [0.059]*
Independence of Supervisory Authority (source)
1.66 2.23 1.48
[0.053]* [0.047]** [0.302]
Independence of Supervisory Authority (recipient)
-1.16 -0.87 -1.33
[0.041]** [0.041]** [0.025]**
Official Supervisory Power (source)
0.87 1.31 0.95
[0.038]** [0.032]** [0.036]**
Official Supervisory Power (recipient)
-0.67 -0.94 -1.06
[0.060]* [0.029]** [0.023]**
Loan classification leniency (source)
-0.45 -0.38
[0.000]*** [0.015]**
Loan classification leniency (recipient)
0.66 0.56
[0.014]** [0.027]**
Creditor rights (source) -4.86 -3.58 -2.81 -3.16 -2.44 -3.62
[0.007]*** [0.016]** [0.055]* [0.102] [0.020]** [0.014]**
Creditor rights (recipient) 4.56 3.86 4.16 4.54 3.22 3.61
[0.020]** [0.069]* [0.034]** [0.044]** [0.014]** [0.017]**
Info sharing (source) -0.70 -0.39 -0.74 -0.67 -0.47 -0.06
[0.015]** [0.060]* [0.008]*** [0.015]** [0.045]** [0.059]*
Info sharing (recipient) 1.12 1.00 1.15 0.94 1.23 1.42
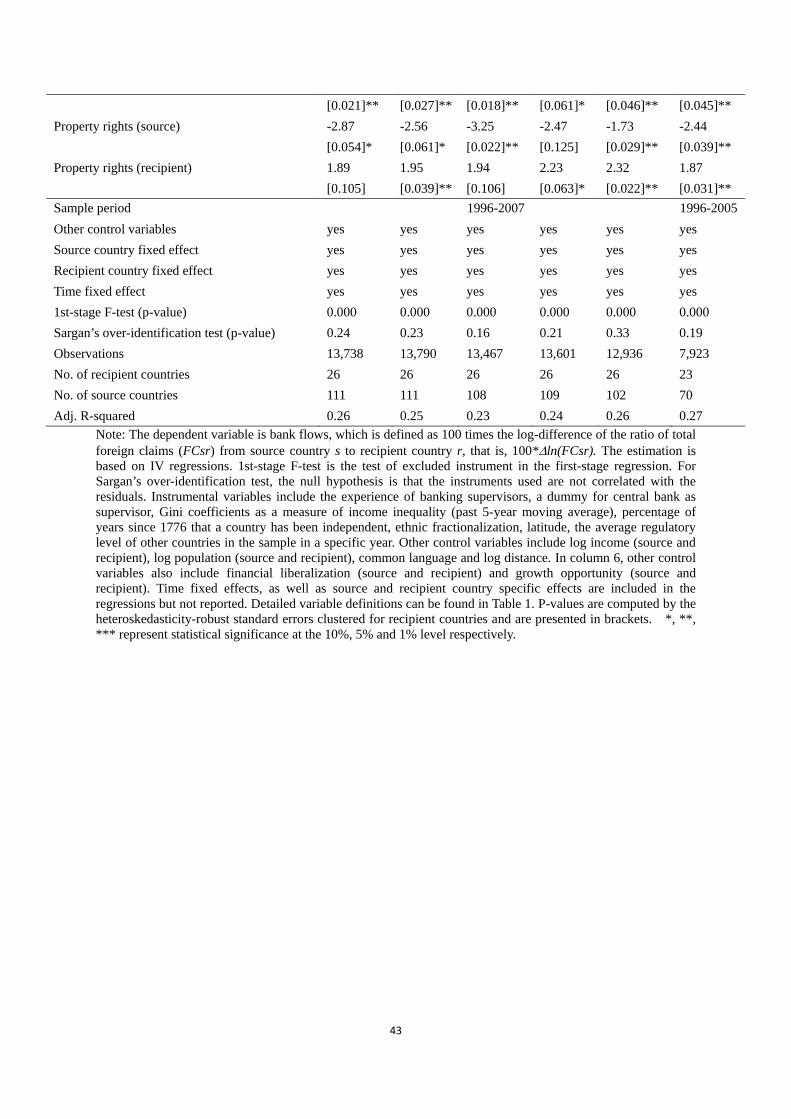
43
[0.021]** [0.027]** [0.018]** [0.061]* [0.046]** [0.045]**
Property rights (source) -2.87 -2.56 -3.25 -2.47 -1.73 -2.44
[0.054]* [0.061]* [0.022]** [0.125] [0.029]** [0.039]**
Property rights (recipient) 1.89 1.95 1.94 2.23 2.32 1.87
[0.105] [0.039]** [0.106] [0.063]* [0.022]** [0.031]**
Sample period 1996-2007 1996-2005 Other control variables yes yes yes yes yes yes Source country fixed effect yes yes yes yes yes yes Recipient country fixed effect yes yes yes yes yes yes Time fixed effect yes yes yes yes yes yes 1st-stage F-test (p-value) 0.000 0.000 0.000 0.000 0.000 0.000 Sargan’s over-identification test (p-value) 0.24 0.23 0.16 0.21 0.33 0.19 Observations 13,738 13,790 13,467 13,601 12,936 7,923 No. of recipient countries 26 26 26 26 26 23 No. of source countries 111 111 108 109 102 70 Adj. R-squared 0.26 0.25 0.23 0.24 0.26 0.27
Note: The dependent variable is bank flows, which is defined as 100 times the log-difference of the ratio of total foreign claims (FCsr) from source country s to recipient country r, that is, 100*∆ln(FCsr). The estimation is based on IV regressions. 1st-stage F-test is the test of excluded instrument in the first-stage regression. For Sargan’s over-identification test, the null hypothesis is that the instruments used are not correlated with the residuals. Instrumental variables include the experience of banking supervisors, a dummy for central bank as supervisor, Gini coefficients as a measure of income inequality (past 5-year moving average), percentage of years since 1776 that a country has been independent, ethnic fractionalization, latitude, the average regulatory level of other countries in the sample in a specific year. Other control variables include log income (source and recipient), log population (source and recipient), common language and log distance. In column 6, other control variables also include financial liberalization (source and recipient) and growth opportunity (source and recipient). Time fixed effects, as well as source and recipient country specific effects are included in the regressions but not reported. Detailed variable definitions can be found in Table 1. P-values are computed by the heteroskedasticity-robust standard errors clustered for recipient countries and are presented in brackets. *, **, *** represent statistical significance at the 10%, 5% and 1% level respectively.
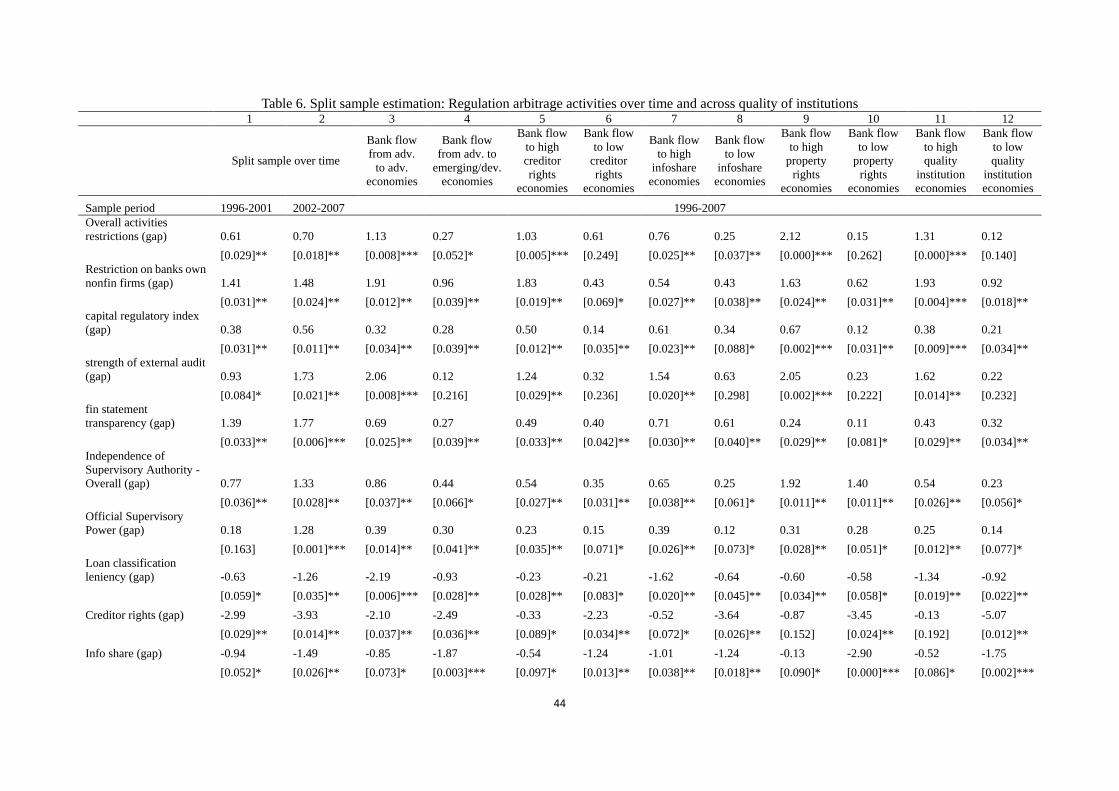
44
Table 6. Split sample estimation: Regulation arbitrage activities over time and across quality of institutions 1 2 3 4 5 6 7 8 9 10 11 12
Split sample over time
Bank flow from adv.
to adv. economies
Bank flow from adv. to
emerging/dev. economies
Bank flow to high creditor rights
economies
Bank flow to low
creditor rights
economies
Bank flow to high
infoshare economies
Bank flow to low
infoshare economies
Bank flow to high
property rights
economies
Bank flow to low
property rights
economies
Bank flow to high quality
institution economies
Bank flow to low quality
institution economies
Sample period 1996-2001 2002-2007 1996-2007 Overall activities restrictions (gap) 0.61 0.70 1.13 0.27 1.03 0.61 0.76 0.25 2.12 0.15 1.31 0.12
[0.029]** [0.018]** [0.008]*** [0.052]* [0.005]*** [0.249] [0.025]** [0.037]** [0.000]*** [0.262] [0.000]*** [0.140]
Restriction on banks own nonfin firms (gap) 1.41 1.48 1.91 0.96 1.83 0.43 0.54 0.43 1.63 0.62 1.93 0.92
[0.031]** [0.024]** [0.012]** [0.039]** [0.019]** [0.069]* [0.027]** [0.038]** [0.024]** [0.031]** [0.004]*** [0.018]**
capital regulatory index (gap) 0.38 0.56 0.32 0.28 0.50 0.14 0.61 0.34 0.67 0.12 0.38 0.21
[0.031]** [0.011]** [0.034]** [0.039]** [0.012]** [0.035]** [0.023]** [0.088]* [0.002]*** [0.031]** [0.009]*** [0.034]**
strength of external audit (gap) 0.93 1.73 2.06 0.12 1.24 0.32 1.54 0.63 2.05 0.23 1.62 0.22
[0.084]* [0.021]** [0.008]*** [0.216] [0.029]** [0.236] [0.020]** [0.298] [0.002]*** [0.222] [0.014]** [0.232]
fin statement transparency (gap) 1.39 1.77 0.69 0.27 0.49 0.40 0.71 0.61 0.24 0.11 0.43 0.32
[0.033]** [0.006]*** [0.025]** [0.039]** [0.033]** [0.042]** [0.030]** [0.040]** [0.029]** [0.081]* [0.029]** [0.034]**
Independence of Supervisory Authority - Overall (gap) 0.77 1.33 0.86 0.44 0.54 0.35 0.65 0.25 1.92 1.40 0.54 0.23
[0.036]** [0.028]** [0.037]** [0.066]* [0.027]** [0.031]** [0.038]** [0.061]* [0.011]** [0.011]** [0.026]** [0.056]*
Official Supervisory Power (gap) 0.18 1.28 0.39 0.30 0.23 0.15 0.39 0.12 0.31 0.28 0.25 0.14
[0.163] [0.001]*** [0.014]** [0.041]** [0.035]** [0.071]* [0.026]** [0.073]* [0.028]** [0.051]* [0.012]** [0.077]*
Loan classification leniency (gap) -0.63 -1.26 -2.19 -0.93 -0.23 -0.21 -1.62 -0.64 -0.60 -0.58 -1.34 -0.92
[0.059]* [0.035]** [0.006]*** [0.028]** [0.028]** [0.083]* [0.020]** [0.045]** [0.034]** [0.058]* [0.019]** [0.022]**
Creditor rights (gap) -2.99 -3.93 -2.10 -2.49 -0.33 -2.23 -0.52 -3.64 -0.87 -3.45 -0.13 -5.07
[0.029]** [0.014]** [0.037]** [0.036]** [0.089]* [0.034]** [0.072]* [0.026]** [0.152] [0.024]** [0.192] [0.012]**
Info share (gap) -0.94 -1.49 -0.85 -1.87 -0.54 -1.24 -1.01 -1.24 -0.13 -2.90 -0.52 -1.75
[0.052]* [0.026]** [0.073]* [0.003]*** [0.097]* [0.013]** [0.038]** [0.018]** [0.090]* [0.000]*** [0.086]* [0.002]***
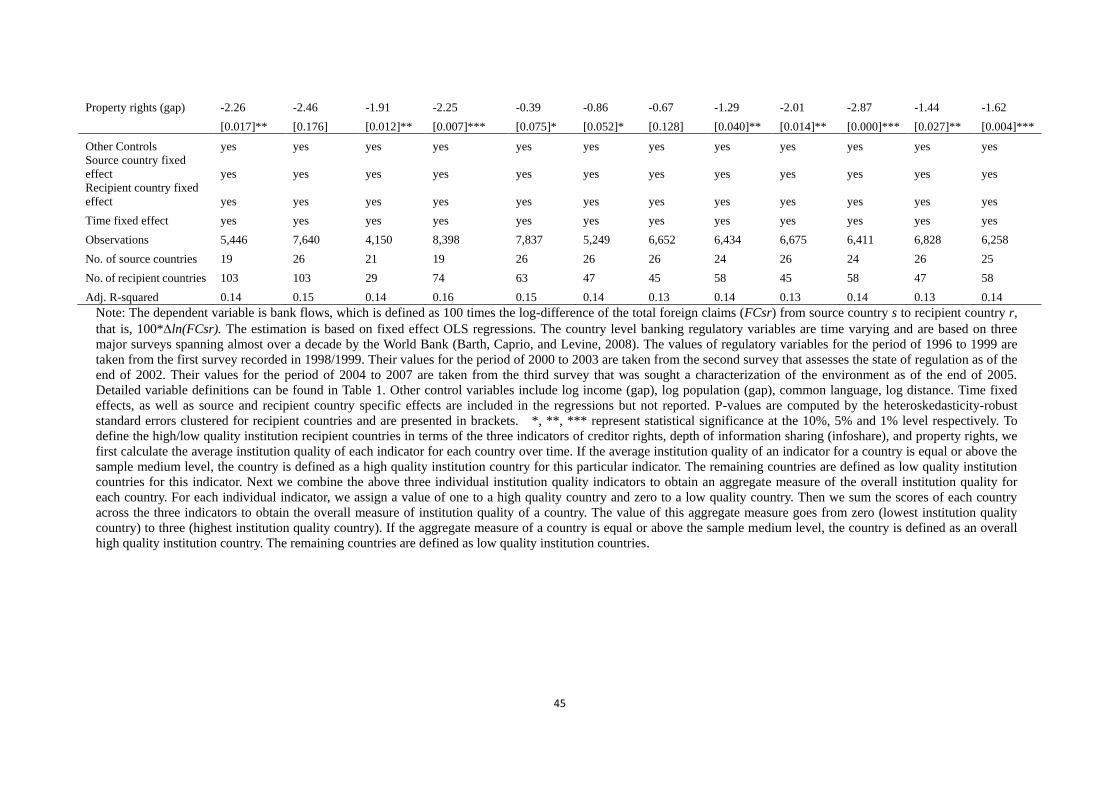
45
Property rights (gap) -2.26 -2.46 -1.91 -2.25 -0.39 -0.86 -0.67 -1.29 -2.01 -2.87 -1.44 -1.62
[0.017]** [0.176] [0.012]** [0.007]*** [0.075]* [0.052]* [0.128] [0.040]** [0.014]** [0.000]*** [0.027]** [0.004]***
Other Controls yes yes yes yes yes yes yes yes yes yes yes yes Source country fixed effect yes yes yes yes yes yes yes yes yes yes yes yes Recipient country fixed effect yes yes yes yes yes yes yes yes yes yes yes yes Time fixed effect yes yes yes yes yes yes yes yes yes yes yes yes Observations 5,446 7,640 4,150 8,398 7,837 5,249 6,652 6,434 6,675 6,411 6,828 6,258 No. of source countries 19 26 21 19 26 26 26 24 26 24 26 25 No. of recipient countries 103 103 29 74 63 47 45 58 45 58 47 58 Adj. R-squared 0.14 0.15 0.14 0.16 0.15 0.14 0.13 0.14 0.13 0.14 0.13 0.14
Note: The dependent variable is bank flows, which is defined as 100 times the log-difference of the total foreign claims (FCsr) from source country s to recipient country r, that is, 100*∆ln(FCsr). The estimation is based on fixed effect OLS regressions. The country level banking regulatory variables are time varying and are based on three major surveys spanning almost over a decade by the World Bank (Barth, Caprio, and Levine, 2008). The values of regulatory variables for the period of 1996 to 1999 are taken from the first survey recorded in 1998/1999. Their values for the period of 2000 to 2003 are taken from the second survey that assesses the state of regulation as of the end of 2002. Their values for the period of 2004 to 2007 are taken from the third survey that was sought a characterization of the environment as of the end of 2005. Detailed variable definitions can be found in Table 1. Other control variables include log income (gap), log population (gap), common language, log distance. Time fixed effects, as well as source and recipient country specific effects are included in the regressions but not reported. P-values are computed by the heteroskedasticity-robust standard errors clustered for recipient countries and are presented in brackets. *, **, *** represent statistical significance at the 10%, 5% and 1% level respectively. To define the high/low quality institution recipient countries in terms of the three indicators of creditor rights, depth of information sharing (infoshare), and property rights, we first calculate the average institution quality of each indicator for each country over time. If the average institution quality of an indicator for a country is equal or above the sample medium level, the country is defined as a high quality institution country for this particular indicator. The remaining countries are defined as low quality institution countries for this indicator. Next we combine the above three individual institution quality indicators to obtain an aggregate measure of the overall institution quality for each country. For each individual indicator, we assign a value of one to a high quality country and zero to a low quality country. Then we sum the scores of each country across the three indicators to obtain the overall measure of institution quality of a country. The value of this aggregate measure goes from zero (lowest institution quality country) to three (highest institution quality country). If the aggregate measure of a country is equal or above the sample medium level, the country is defined as an overall high quality institution country. The remaining countries are defined as low quality institution countries.

46
Table 7. Probit estimation: Bank’s foreign affiliates and regulatory arbitrage
1 2 3 4 5 6 7
Overall activities restrictions (source) 0.029 0.028 0.030 0.043 [0.067]* [0.031]** [0.012]** [0.023]** Overall activities restrictions (recipient) -0.018 -0.012 -0.014 -0.042 [0.027]** [0.019]** [0.023]** [0.014]** Restriction on banks own nonfin firms (source) 0.063 0.064 0.065 0.069
[0.024]** [0.037]** [0.074]* [0.031]** Restriction on banks own nonfin firms (recipient) -0.049 -0.041 -0.036 -0.049
[0.029]** [0.020]** [0.017]** [0.028]** Capital regulatory index (source) 0.027 0.027 0.021 0.049 [0.018]** [0.015]** [0.021]** [0.026]** Capital regulatory index (recipient) -0.011 -0.012 -0.014 -0.027 [0.014]** [0.016]** [0.029]** [0.012]** Strength of external audit (source) 0.040 0.044 0.053 0.056 [0.032]** [0.038]** [0.079] * [0.013]** Strength of external audit (recipient) -0.032 -0.031 -0.047 -0.048 [0.128] [0.025]** [0.031]** [0.026]** Fin statement transparency (source) 0.035 0.033 0.030 0.020 [0.011]** [0.030]** [0.029]** [0.015]** Fin statement transparency (recipient) -0.018 -0.024 -0.016 -0.032 [0.019]** [0.024]** [0.019]** [0.028]** Independence of supervisory authority (source) 0.057 0.046 0.051 0.049
[0.017]** [0.012]** [0.033]** [0.009]*** Independence of supervisory authority (recipient) -0.023 -0.025 -0.027 -0.029
[0.015]** [0.031]** [0.029]** [0.023]** Official supervisory power (source) 0.036 0.037 0.038 0.039 [0.011]** [0.019]** [0.053]* [0.011]** Official supervisory power (recipient) -0.028 -0.025 -0.020 -0.049 [0.051]* [0.016]** [0.014]** [0.031]** Loan classification leniency (source) -0.044 -0.041 -0.057 [0.060]* [0.035]** [0.038]** Loan classification leniency (recipient) 0.025 0.024 0.021 [0.030]** [0.058]* [0.013]** Government bank ownership (recipient) -0.361 -0.376 -0.355 [0.037]** [0.034]** [0.034]** Top 5 bank concentration (all banks) (recipient) -0.208 -0.234
[0.016]** [0.035]** Top 5 bank concentration (excl. foreign banks) (recipient) -0.287
[0.016]** Bank size 0.016 0.015 0.014 0.016 0.017 0.018 0.016
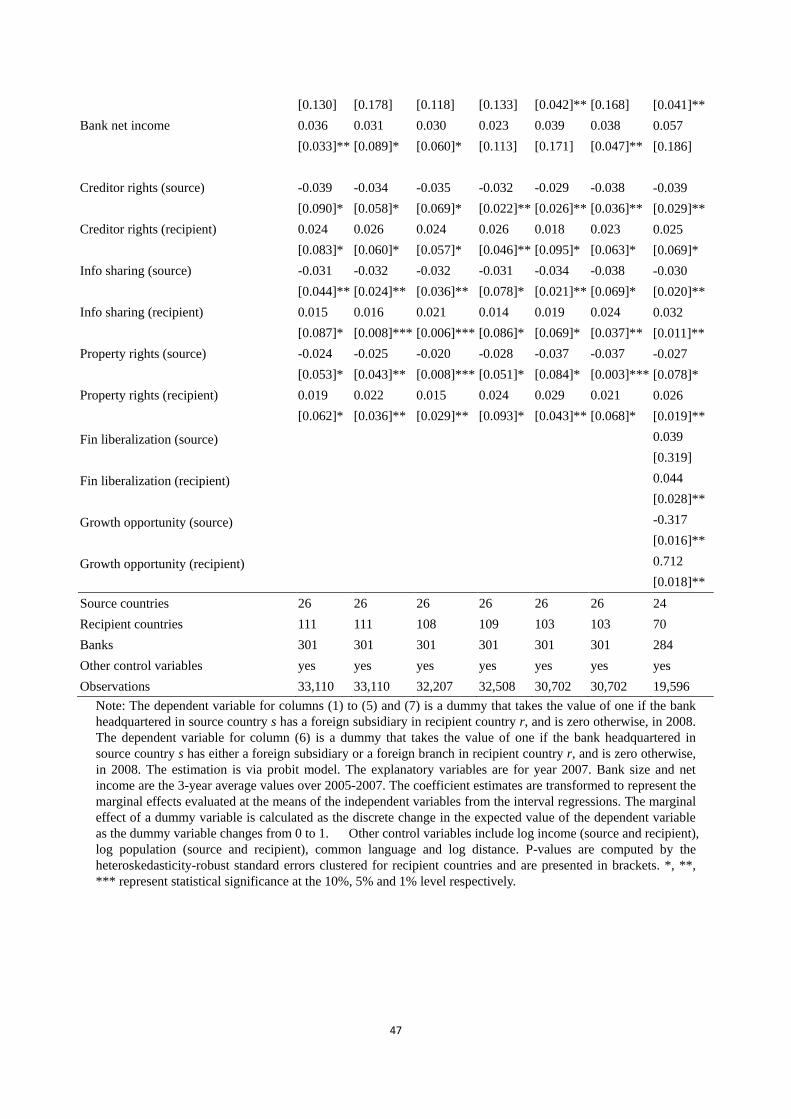
47
[0.130] [0.178] [0.118] [0.133] [0.042]** [0.168] [0.041]** Bank net income 0.036 0.031 0.030 0.023 0.039 0.038 0.057 [0.033]** [0.089]* [0.060]* [0.113] [0.171] [0.047]** [0.186] Creditor rights (source) -0.039 -0.034 -0.035 -0.032 -0.029 -0.038 -0.039 [0.090]* [0.058]* [0.069]* [0.022]** [0.026]** [0.036]** [0.029]** Creditor rights (recipient) 0.024 0.026 0.024 0.026 0.018 0.023 0.025 [0.083]* [0.060]* [0.057]* [0.046]** [0.095]* [0.063]* [0.069]* Info sharing (source) -0.031 -0.032 -0.032 -0.031 -0.034 -0.038 -0.030 [0.044]** [0.024]** [0.036]** [0.078]* [0.021]** [0.069]* [0.020]** Info sharing (recipient) 0.015 0.016 0.021 0.014 0.019 0.024 0.032 [0.087]* [0.008]*** [0.006]*** [0.086]* [0.069]* [0.037]** [0.011]** Property rights (source) -0.024 -0.025 -0.020 -0.028 -0.037 -0.037 -0.027 [0.053]* [0.043]** [0.008]*** [0.051]* [0.084]* [0.003]*** [0.078]* Property rights (recipient) 0.019 0.022 0.015 0.024 0.029 0.021 0.026 [0.062]* [0.036]** [0.029]** [0.093]* [0.043]** [0.068]* [0.019]**
Fin liberalization (source) 0.039
[0.319]
Fin liberalization (recipient) 0.044
[0.028]**
Growth opportunity (source) -0.317
[0.016]**
Growth opportunity (recipient) 0.712 [0.018]** Source countries 26 26 26 26 26 26 24 Recipient countries 111 111 108 109 103 103 70 Banks 301 301 301 301 301 301 284 Other control variables yes yes yes yes yes yes yes Observations 33,110 33,110 32,207 32,508 30,702 30,702 19,596
Note: The dependent variable for columns (1) to (5) and (7) is a dummy that takes the value of one if the bank headquartered in source country s has a foreign subsidiary in recipient country r, and is zero otherwise, in 2008. The dependent variable for column (6) is a dummy that takes the value of one if the bank headquartered in source country s has either a foreign subsidiary or a foreign branch in recipient country r, and is zero otherwise, in 2008. The estimation is via probit model. The explanatory variables are for year 2007. Bank size and net income are the 3-year average values over 2005-2007. The coefficient estimates are transformed to represent the marginal effects evaluated at the means of the independent variables from the interval regressions. The marginal effect of a dummy variable is calculated as the discrete change in the expected value of the dependent variable as the dummy variable changes from 0 to 1. Other control variables include log income (source and recipient), log population (source and recipient), common language and log distance. P-values are computed by the heteroskedasticity-robust standard errors clustered for recipient countries and are presented in brackets. *, **, *** represent statistical significance at the 10%, 5% and 1% level respectively.
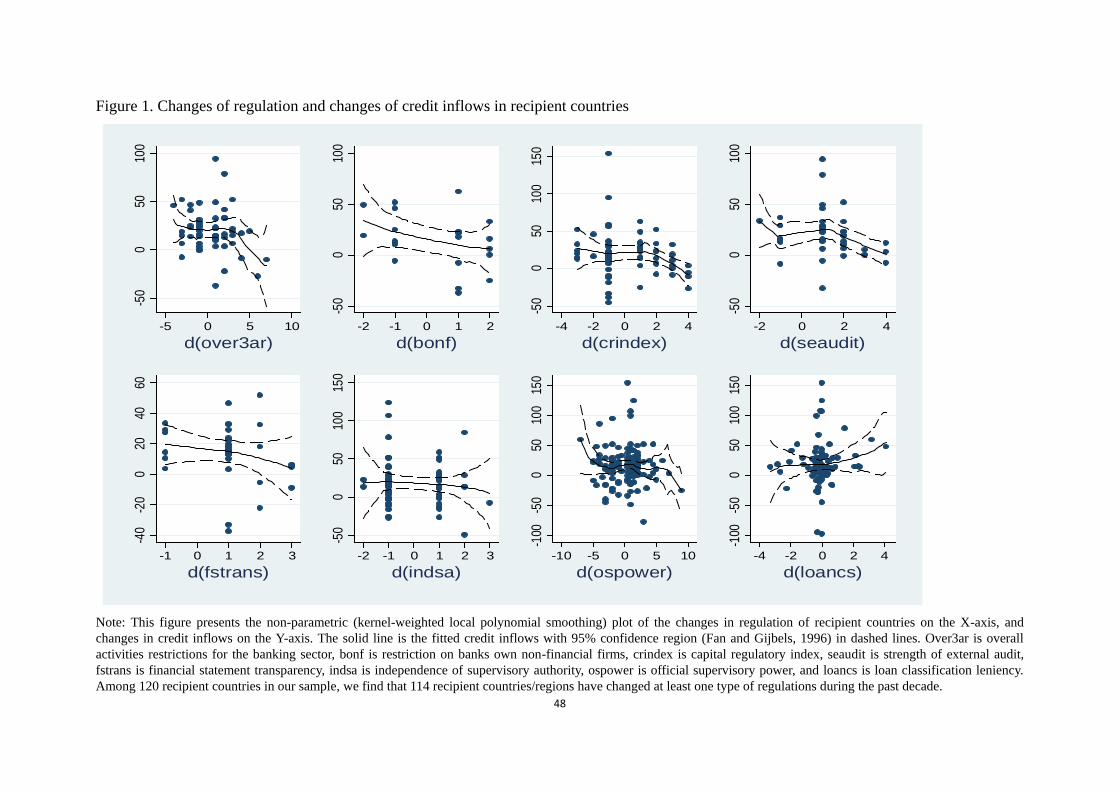
48
Figure 1. Changes of regulation and changes of credit inflows in recipient countries
Note: This figure presents the non-parametric (kernel-weighted local polynomial smoothing) plot of the changes in regulation of recipient countries on the X-axis, and changes in credit inflows on the Y-axis. The solid line is the fitted credit inflows with 95% confidence region (Fan and Gijbels, 1996) in dashed lines. Over3ar is overall activities restrictions for the banking sector, bonf is restriction on banks own non-financial firms, crindex is capital regulatory index, seaudit is strength of external audit, fstrans is financial statement transparency, indsa is independence of supervisory authority, ospower is official supervisory power, and loancs is loan classification leniency. Among 120 recipient countries in our sample, we find that 114 recipient countries/regions have changed at least one type of regulations during the past decade.
-50
050
100
-5 0 5 10d(over3ar)
-50
050
100
-2 -1 0 1 2d(bonf)
-50
050
100
150
-4 -2 0 2 4d(crindex)
-50
050
100
-2 0 2 4d(seaudit)
-40
-20
020
4060
-1 0 1 2 3d(fstrans)
-50
050
100
150
-2 -1 0 1 2 3d(indsa)
-100
-50
050
100
150
-10 -5 0 5 10d(ospower)
-100
-50
050
100
150
-4 -2 0 2 4d(loancs)

49
Fig 2. Changes of regulation and changes of credit outflows from source countries
Note: This figure presents the non-parametric (kernel-weighted local polynomial smoothing) plot of the changes in regulation of source countries on the X-axis, and changes in credit outflows on the Y-axis. The solid line is the fitted credit outflows with 95% confidence region (Fan and Gijbels, 1996) in dashed lines. Over3ar is overall activities restrictions for the banking sector, bonf is restriction on banks own non-financial firms, crindex is capital regulatory index, seaudit is strength of external audit, fstrans is financial statement transparency, indsa is independence of supervisory authority, ospower is official supervisory power, and loancs is loan classification leniency. Among 26 source countries in our sample, we find that 21 countries/regions have changed at least one type of regulations during the past decade.
-50
050
100
-2 -1 0 1 2d(over3ar)
050
100
150
-1 -.5 0 .5 1d(bonf)
-50
050
100
-4 -2 0 2 4d(crindex)
-100
-50
050
100
-1 0 1 2 3 4d(seaudit)
-20
020
4060
80
-1 -.5 0 .5 1d(fstrans)
020
4060
80
-2 -1 0 1 2d(indsa)
-50
050
100
150
-5 0 5d(ospower)
-100
-50
050
-3 -2 -1 0 1 2d(loancs)

1
Internet Appendix for “Regulatory Arbitrage and International
Bank Flows” *
Joel F. Houston, Chen Lin, Yue Ma
*Citation format: Joel F. Houston, Chen Lin and Yue Ma, 2011, Internet Appendix to “Regulatory Arbitrage and International Bank Flows,” Journal of Finance {vol #], pages [ ], http://www.afajof.org/IA/[year].asp. Please note: Wiley-Blackwell is not responsible for the content or functionality of any supporting information supplied by the authors. Any queries (other than missing material) should be directed to the authors of the article.
2
Data Appendix
Our main dependent variable used in this paper is the international bilateral bank flow from 26
primarily OECD source countries22 to 120 recipient countries23. The bilateral bank flow consists of
bank loans and portfolio investments aggregated from banks located in a source country to all sectors
of the economy in a recipient country. It is a panel dataset consists of bilateral country level data.
Our bank flow panel data is constructed from the banking sector bilateral stock data published in
the International Banking Statistics by the Bank for International Settlements (BIS). The BIS
Consolidated/Nationality Banking Statistics publish aggregate foreign financial claims reported by
domestic bank head offices, including the exposures of their foreign affiliates (i.e. branches and
subsidiaries), and are collected on a worldwide consolidated basis with inter-office positions being
netted out (BIS, 2003, p.55). These claims consist of financial assets such as loans, debt securities,
properties, and equities, including equity participations in subsidiaries (BIS, 2003). The data are
published in Table 9B of the BIS Quarterly Review on a quarterly basis since December 1983 under
the title “The consolidated foreign claims of reporting banks”. The data are in a matrix form with
different source country/recipient country combinations. The most recent cross sectional data can be
downloaded from http://www.bis.org/statistics/pcsv/panx9b.csv and the full historical data can be
downloaded from the BIS website: www.bis.org/statistics/hcsv/hanx9b.csv
This database provides comprehensive data on banks’ financial claims extended on residents
outside the country in which these banks are headquartered. It is important to stress that the bank’s
home country is determined by the reporting bank’s nationality not its geographic location. So, for
example, a loan issued by the US bank located in London to a British bank operating in London is
22 The 26 source countries/regions are: Australia, Austria, Belgium, Brazil, Canada, Chile, Denmark, Finland, France, Germany, Greece, Ireland, Italy, Japan, Mexico, Netherlands, Norway, Panama, Portugal, Spain, Sweden, Switzerland, Taiwan, Turkey, United Kingdom, and United States. 23 The 120 recipient countries/regions are: Albania, Algeria, Angola, Argentina, Armenia, Australia, Austria, Azerbaijan, Bangladesh, Belgium, Benin, Bolivia, Bosnia and Herzegovina, Botswana, Brazil, Bulgaria, Burkina Faso, Burundi, Cameroon, Canada, Central African Republic, Chad, Chile, China, Colombia, Dem. Rep. Congo, Rep. Congo, Costa Rica, Croatia, Czech Republic, Denmark, Dominican Republic, Ecuador, Egypt, El Salvador, Ethiopia, Finland, France, Georgia, Germany, Ghana, Greece, Guatemala, Haiti, Honduras, Hong Kong, Hungary, India, Indonesia, Iran, Ireland, Israel, Italy, Jamaica, Japan, Jordan, Kazakhstan, Kenya, Korea, Latvia, Lesotho, Lithuania, Macedonia, Madagascar, Malawi, Malaysia, Mali, Mauritania, Mexico, Moldova, Mongolia, Morocco, Mozambique, Namibia, Nepal, Netherlands, New Zealand, Nicaragua, Niger, Nigeria, Norway, Oman, Pakistan, Panama, Papua New Guinea, Paraguay, Peru, Philippines, Poland, Portugal, Romania, Russian Federation, Rwanda, Senegal, Sierra Leone, Singapore, Slovak Republic, Slovenia, South Africa, Spain, Sri Lanka, Sweden, Switzerland, Syria, Taiwan, Tanzania, Thailand, Togo, Tunisia, Turkey, Uganda, Ukraine, United Arab Emirates, United Kingdom, United States, Uruguay, Venezuela, Vietnam, Zambia, Zimbabwe.

3
recorded in the database as a foreign loan, where the source country is the US and the recipient
country is the UK. However, a loan issued by the same US bank located in London to another US
bank located in New York is regarded as a domestic loan issued by the US bank and is therefore not
recorded in this database (for details, see Wooldridge, 2002).
For instance, if there was a huge US flow to their branches located in the UK but a lot of that
flow was eventually headed towards emerging economies, the BIS data can actually capture the fact
that these are indeed US bank inflows, rather than the UK bank inflows, to emerging economies.
As there is no flow measure in the BIS data, we construct a bank flow measure by calculating the
annual difference of log total foreign claims for each bilateral source-recipient combination.
Specifically, our bank flow is defined as 100 times the log-difference of the ratio of total foreign
claims (FCsr) from source country s to recipient country r, that is, 100*∆ln(FCsr). We construct the
annual bank flow variable by using the stock data (FCsr) on December of each year in our sample
period of 1996-2007 to match the annual frequency of the other explanatory variables.

4
Figure 1: the change of overall activities restrictions across countries (1999 vs. 2006)
-5 0 5 10 15
VietnamPapua New Guinea
NicaraguaDominican Republic
MalawiCosta Rica
ChinaUganda
Taiwan, ChinaParaguay
KazakhstanIsrael
IndonesiaEcuador
ColombiaAzerbaijan
ZambiaPakistan
NigeriaJamaica
BangladeshArmeniaTunisia
Syrian Arab RepublicSlovak Republic
MozambiqueMadagascar
Bosnia and HerzegovinaZimbabwe
TogoTanzaniaSenegal
NigerNepal
NamibiaMali
Egypt, Arab Rep.Burkina Faso
BulgariaBenin
UruguayTurkey
RwandaMacedonia, FYR
GeorgiaCongo, Rep.
ChadCentral African Republic
CameroonAlbania
United Arab EmiratesUkraine
Sri LankaNorwayAlgeria
ThailandPeru
MoldovaHong Kong, China
Czech RepublicVenezuela, RB
SwitzerlandPortugalPanama
Korea, Rep.Hungary
FranceArgentina
SwedenSloveniaLithuania
KenyaItaly
HondurasGermany
FinlandDenmark
ChileCanada
BotswanaAustralia
SpainSouth Africa
SingaporeRussian Federation
New ZealandNetherlands
MalaysiaGuatemalaEl Salvador
BoliviaAustria
United KingdomPoland
MoroccoLesothoIreland
IndiaGreeceGhana
BurundiRomania
OmanBelgiumMexico
The regulation of the following countries has not been changed over 1999 to 2006: Brazil, Croatia, Japan, Jordan, Latvia, Philippines, and United States.

5
Internet Appendix Table 1: Correlation matrix of differenced variables
1 2 3 4 5 6 7 8 9 10 11 12 13
1 Δ Overall activities restrictions 1
2 Δ Restriction on banks own nonfin firms 0.11** 1
3 Δ capital regulatory index 0.05 0.09 1
4 Δ strength of external audit -0.09 0.01 0.21*** 1
5 Δ fin statement transparency -0.06 0.11** 0.09 0.23*** 1
6 Δ Independence of supervisory authority -0.01 0.00 -0.09 -0.07 0.09 1
7 Δ Official Supervisory Power 0.01 0.12** 0.03 0.22*** 0.20*** 0 1
8 Δ Loan classification leniency -0.11 -0.08 -0.01 -0.03 -0.01 0.08 -0.16*** 1
9 Δ Creditor rights 0.01 -0.12* 0.14** -0.02 0.06 -0.02 -0.01 -0.1 1
10 Δ Info share -0.19** -0.05 -0.01 0.12** 0.24*** 0.02 -0.01 0.25*** -0.06 1
11 Δ Property rights -0.20** -0.13** -0.01 0.03 -0.05 0.02 0.00 0.24*** 0.00 0.26*** 1
12 Δ Log income -0.03 -0.03 0.02 0.02 0.07 0.06 0.04 0.05 -0.04 0.05 0.06 1
13 Δ Log population -0.01 0.04 -0.03 0.01 0.06 -0.07 0.01 0.04 -0.05 0.04 0.00 0.12** 1
Note: This table examines the correlations among the changes of regulation and institution quality. The change of a variable is its difference between 2001 and 2004 and that between 2004 and 2007, that is, ∆xt, t=2004 and 2007. *, **, *** represent statistical significance at the 10%, 5% and 1% level respectively.

6
Internet Appendix Table 2. Regulatory arbitrage and bank flows: various clustering effects
1 2 3
Clustering by two dimensions By recipient country and time
By source country and time
By recipient-source country pair and time
Overall activities restrictions (source) 0.36 0.36 0.36
[0.009]*** [0.017]** [0.016]**
Overall activities restrictions (recipient) -0.33 -0.33 -0.33
[0.018]** [0.015]** [0.029]**
Restriction on banks own nonfin firms (source) 1.52 1.52 1.52
[0.029]** [0.023]** [0.028]**
Restriction on banks own nonfin firms (recipient) -1.42 -1.42 -1.42
[0.144] [0.112] [0.116]
capital regulatory index (source) 0.23 0.23 0.23
[0.123] [0.128] [0.124]
capital regulatory index (recipient) -0.34 -0.34 -0.34
[0.028]** [0.025]** [0.025]**
strength of external audit (source) 0.70 0.70 0.70
[0.250] [0.136] [0.254]
strength of external audit (recipient) -0.65 -0.65 -0.65
[0.033]** [0.032]** [0.030]**
fin statement transparency (source) 1.85 1.85 1.85
[0.027]** [0.030]** [0.027]**
fin statement transparency (recipient) -0.56 -0.56 -0.56
[0.059]* [0.047]** [0.055]*
Independence of Supervisory Authority (source) 1.05 1.05 1.05
[0.461] [0.462] [0.423]
Independence of Supervisory Authority (recipient) -0.83 -0.83 -0.83
[0.031]** [0.022]** [0.024]**
Official Supervisory Power (source) 0.66 0.66 0.66
[0.078]* [0.072]* [0.074]*
Official Supervisory Power (recipient) -0.52 -0.52 -0.52
[0.023]** [0.023]** [0.024]**
Loan classification leniency (source) -0.27 -0.27 -0.27
[0.020]** [0.011]** [0.015]**
Loan classification leniency (recipient) 0.41 0.41 0.41
[0.036]** [0.033]** [0.033]**
Creditor rights (source) -2.40 -2.40 -2.40
[0.018]** [0.012]** [0.019]**
Creditor rights (recipient) 3.65 3.65 3.65
[0.026]** [0.032]** [0.037]**
Info sharing (source) -0.68 -0.68 -0.68
[0.035]** [0.042]** [0.034]**
Info sharing (recipient) 1.17 1.17 1.17
[0.084]* [0.083]* [0.084]*
No. of days to enforce contracts (recipient) 0.10 0.10 0.10
[0.036]** [0.082]* [0.038]**
No. of days to enforce contracts (source) -0.15 -0.15 -0.15
[0.027]** [0.023]** [0.025]**
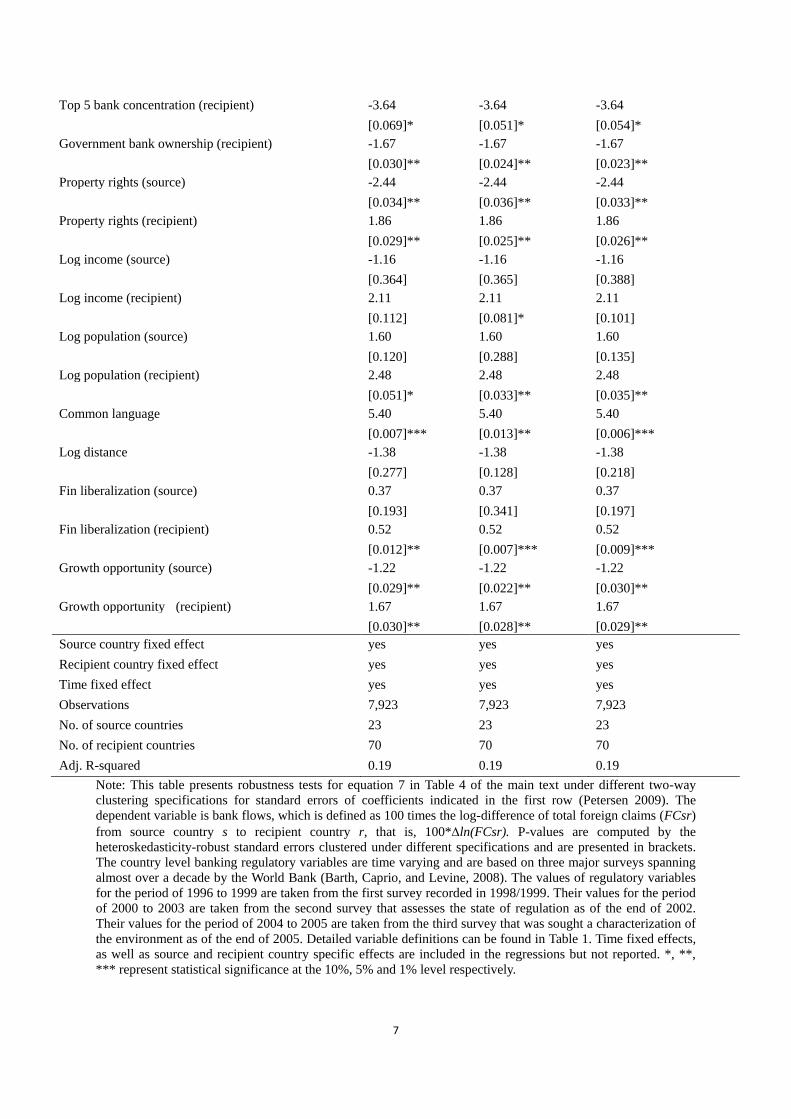
7
Top 5 bank concentration (recipient) -3.64 -3.64 -3.64
[0.069]* [0.051]* [0.054]*
Government bank ownership (recipient) -1.67 -1.67 -1.67
[0.030]** [0.024]** [0.023]**
Property rights (source) -2.44 -2.44 -2.44
[0.034]** [0.036]** [0.033]**
Property rights (recipient) 1.86 1.86 1.86
[0.029]** [0.025]** [0.026]**
Log income (source) -1.16 -1.16 -1.16
[0.364] [0.365] [0.388]
Log income (recipient) 2.11 2.11 2.11
[0.112] [0.081]* [0.101]
Log population (source) 1.60 1.60 1.60
[0.120] [0.288] [0.135]
Log population (recipient) 2.48 2.48 2.48
[0.051]* [0.033]** [0.035]**
Common language 5.40 5.40 5.40
[0.007]*** [0.013]** [0.006]***
Log distance -1.38 -1.38 -1.38
[0.277] [0.128] [0.218]
Fin liberalization (source) 0.37 0.37 0.37
[0.193] [0.341] [0.197]
Fin liberalization (recipient) 0.52 0.52 0.52
[0.012]** [0.007]*** [0.009]***
Growth opportunity (source) -1.22 -1.22 -1.22
[0.029]** [0.022]** [0.030]**
Growth opportunity (recipient) 1.67 1.67 1.67
[0.030]** [0.028]** [0.029]**
Source country fixed effect yes yes yes Recipient country fixed effect yes yes yes Time fixed effect yes yes yes Observations 7,923 7,923 7,923 No. of source countries 23 23 23 No. of recipient countries 70 70 70 Adj. R-squared 0.19 0.19 0.19
Note: This table presents robustness tests for equation 7 in Table 4 of the main text under different two-way clustering specifications for standard errors of coefficients indicated in the first row (Petersen 2009). The dependent variable is bank flows, which is defined as 100 times the log-difference of total foreign claims (FCsr) from source country s to recipient country r, that is, 100*∆ln(FCsr). P-values are computed by the heteroskedasticity-robust standard errors clustered under different specifications and are presented in brackets. The country level banking regulatory variables are time varying and are based on three major surveys spanning almost over a decade by the World Bank (Barth, Caprio, and Levine, 2008). The values of regulatory variables for the period of 1996 to 1999 are taken from the first survey recorded in 1998/1999. Their values for the period of 2000 to 2003 are taken from the second survey that assesses the state of regulation as of the end of 2002. Their values for the period of 2004 to 2005 are taken from the third survey that was sought a characterization of the environment as of the end of 2005. Detailed variable definitions can be found in Table 1. Time fixed effects, as well as source and recipient country specific effects are included in the regressions but not reported. *, **, *** represent statistical significance at the 10%, 5% and 1% level respectively.
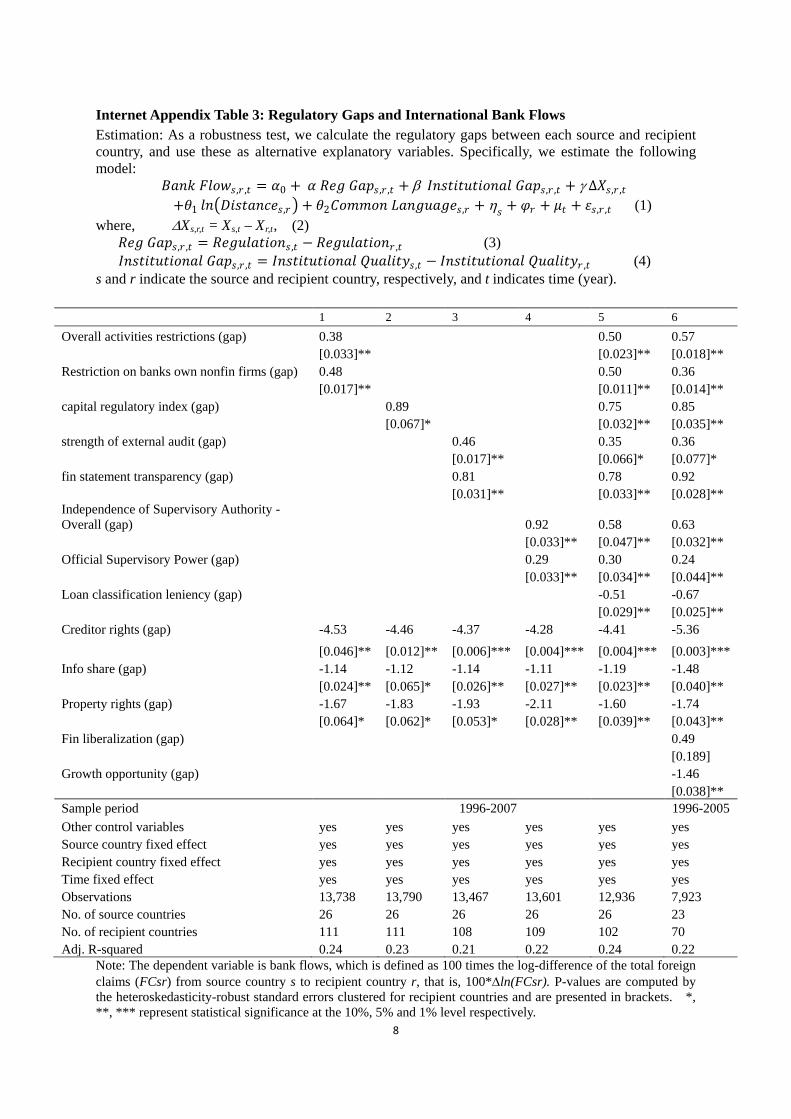
8
Internet Appendix Table 3: Regulatory Gaps and International Bank Flows Estimation: As a robustness test, we calculate the regulatory gaps between each source and recipient country, and use these as alternative explanatory variables. Specifically, we estimate the following model:
𝐵𝐵𝐵𝐵𝐵𝐵𝐵𝐵 𝐹𝐹𝐼𝐼𝐼𝐼𝐼𝐼𝐼𝐼,𝑟𝑟 ,𝑡𝑡 = 𝛼𝛼0 + 𝛼𝛼 𝑅𝑅𝑅𝑅𝑅𝑅 𝐺𝐺𝐵𝐵𝐺𝐺𝐼𝐼,𝑟𝑟 ,𝑡𝑡 + β 𝐼𝐼𝐵𝐵𝐼𝐼𝑡𝑡𝑅𝑅𝑡𝑡𝑅𝑅𝑡𝑡𝑅𝑅𝐼𝐼𝐵𝐵𝐵𝐵𝐼𝐼 𝐺𝐺𝐵𝐵𝐺𝐺𝐼𝐼,𝑟𝑟 ,𝑡𝑡 + γ ∆𝑋𝑋𝐼𝐼,𝑟𝑟 ,𝑡𝑡 +𝜃𝜃1 𝐼𝐼𝐵𝐵�𝐷𝐷𝑅𝑅𝐼𝐼𝑡𝑡𝐵𝐵𝐵𝐵𝐷𝐷𝑅𝑅𝐼𝐼,𝑟𝑟� + 𝜃𝜃2𝐶𝐶𝐼𝐼𝐶𝐶𝐶𝐶𝐼𝐼𝐵𝐵 𝐿𝐿𝐵𝐵𝐵𝐵𝑅𝑅𝑅𝑅𝐵𝐵𝑅𝑅𝑅𝑅𝐼𝐼,𝑟𝑟 + η𝐼𝐼 + 𝜑𝜑𝑟𝑟 + 𝜇𝜇𝑡𝑡 + 𝜀𝜀𝐼𝐼,𝑟𝑟 ,𝑡𝑡 (1) where, ∆Xs,r,t = Xs,t – Xr,t, (2)
𝑅𝑅𝑅𝑅𝑅𝑅 𝐺𝐺𝐵𝐵𝐺𝐺𝐼𝐼,𝑟𝑟 ,𝑡𝑡 = 𝑅𝑅𝑅𝑅𝑅𝑅𝑅𝑅𝐼𝐼𝐵𝐵𝑡𝑡𝑅𝑅𝐼𝐼𝐵𝐵𝐼𝐼,𝑡𝑡 − 𝑅𝑅𝑅𝑅𝑅𝑅𝑅𝑅𝐼𝐼𝐵𝐵𝑡𝑡𝑅𝑅𝐼𝐼𝐵𝐵𝑟𝑟 ,𝑡𝑡 (3) 𝐼𝐼𝐵𝐵𝐼𝐼𝑡𝑡𝑅𝑅𝑡𝑡𝑅𝑅𝑡𝑡𝑅𝑅𝐼𝐼𝐵𝐵𝐵𝐵𝐼𝐼 𝐺𝐺𝐵𝐵𝐺𝐺𝐼𝐼,𝑟𝑟 ,𝑡𝑡 = 𝐼𝐼𝐵𝐵𝐼𝐼𝑡𝑡𝑅𝑅𝑡𝑡𝑅𝑅𝑡𝑡𝑅𝑅𝐼𝐼𝐵𝐵𝐵𝐵𝐼𝐼 𝑄𝑄𝑅𝑅𝐵𝐵𝐼𝐼𝑅𝑅𝑡𝑡𝑄𝑄𝐼𝐼,𝑡𝑡 − 𝐼𝐼𝐵𝐵𝐼𝐼𝑡𝑡𝑅𝑅𝑡𝑡𝑅𝑅𝑡𝑡𝑅𝑅𝐼𝐼𝐵𝐵𝐵𝐵𝐼𝐼 𝑄𝑄𝑅𝑅𝐵𝐵𝐼𝐼𝑅𝑅𝑡𝑡𝑄𝑄𝑟𝑟 ,𝑡𝑡 (4) s and r indicate the source and recipient country, respectively, and t indicates time (year).
1 2 3 4 5 6
Overall activities restrictions (gap) 0.38
0.50 0.57
[0.033]**
[0.023]** [0.018]**
Restriction on banks own nonfin firms (gap) 0.48
0.50 0.36
[0.017]**
[0.011]** [0.014]**
capital regulatory index (gap) 0.89
0.75 0.85
[0.067]*
[0.032]** [0.035]**
strength of external audit (gap)
0.46
0.35 0.36
[0.017]**
[0.066]* [0.077]*
fin statement transparency (gap)
0.81
0.78 0.92
[0.031]**
[0.033]** [0.028]**
Independence of Supervisory Authority - Overall (gap)
0.92 0.58 0.63
[0.033]** [0.047]** [0.032]**
Official Supervisory Power (gap)
0.29 0.30 0.24
[0.033]** [0.034]** [0.044]**
Loan classification leniency (gap)
-0.51 -0.67
[0.029]** [0.025]**
Creditor rights (gap) -4.53 -4.46 -4.37 -4.28 -4.41 -5.36
[0.046]** [0.012]** [0.006]*** [0.004]*** [0.004]*** [0.003]***
Info share (gap) -1.14 -1.12 -1.14 -1.11 -1.19 -1.48
[0.024]** [0.065]* [0.026]** [0.027]** [0.023]** [0.040]**
Property rights (gap) -1.67 -1.83 -1.93 -2.11 -1.60 -1.74
[0.064]* [0.062]* [0.053]* [0.028]** [0.039]** [0.043]**
Fin liberalization (gap)
0.49
[0.189]
Growth opportunity (gap)
-1.46
[0.038]**
Sample period 1996-2007 1996-2005 Other control variables yes yes yes yes yes yes Source country fixed effect yes yes yes yes yes yes Recipient country fixed effect yes yes yes yes yes yes Time fixed effect yes yes yes yes yes yes Observations 13,738 13,790 13,467 13,601 12,936 7,923 No. of source countries 26 26 26 26 26 23 No. of recipient countries 111 111 108 109 102 70 Adj. R-squared 0.24 0.23 0.21 0.22 0.24 0.22
Note: The dependent variable is bank flows, which is defined as 100 times the log-difference of the total foreign claims (FCsr) from source country s to recipient country r, that is, 100*∆ln(FCsr). P-values are computed by the heteroskedasticity-robust standard errors clustered for recipient countries and are presented in brackets. *, **, *** represent statistical significance at the 10%, 5% and 1% level respectively.

9
Internet Appendix Table 4: Change Regressions Estimation: We examine the effects of regulatory changes on international bank flow changes. Focusing on changes allows us to account for unobservable time-invariant country specific characteristics that might influence both the level of bank regulation and international bank flows. This approach also helps alleviate the endogeneity concern (Lin et al., 2011).
The first differencing estimation relates to the time periods corresponding to the three surveys. Specifically, we examine how changes in the regulatory gap (between the source and recipient pairs) influence changes in bank flows. Instead of using the full ten years of data, we focus on the three survey years (1999, 2002, 2005) to measure the regulatory changes. To capture the potential lagged effects of regulatory changes, we use bank flow data in years 2001, 2004, and 2007 data to measure the changes in bank flows. The sample thus contains observations of two time series changes. The countries without regulatory changes are dropped from the estimation and the sample size drops to about 1730. Specifically, the estimation can be expressed as follows: ∆�𝐵𝐵𝐵𝐵𝐵𝐵𝐵𝐵 𝐹𝐹𝐼𝐼𝐼𝐼𝐼𝐼𝐼𝐼,𝑟𝑟 ,𝑡𝑡� = 𝛼𝛼0 + 𝛼𝛼 ∆𝑅𝑅𝑅𝑅𝑅𝑅 𝐺𝐺𝐵𝐵𝐺𝐺𝐼𝐼,𝑟𝑟 ,𝑡𝑡 + 𝛽𝛽 ∆𝐼𝐼𝐵𝐵𝐼𝐼𝑡𝑡𝑅𝑅𝑡𝑡𝑅𝑅𝑡𝑡𝑅𝑅𝐼𝐼𝐵𝐵𝐵𝐵𝐼𝐼 𝐺𝐺𝐵𝐵𝐺𝐺𝐼𝐼,𝑟𝑟 ,𝑡𝑡 + 𝛾𝛾1∆𝐼𝐼𝐵𝐵𝐷𝐷𝐼𝐼𝐶𝐶𝑅𝑅 𝐺𝐺𝐵𝐵𝐺𝐺𝐼𝐼,𝑟𝑟 ,𝑡𝑡
+ 𝛾𝛾2∆𝑃𝑃𝐼𝐼𝐺𝐺𝑅𝑅𝐼𝐼𝐵𝐵𝑡𝑡𝑅𝑅𝐼𝐼𝐵𝐵 𝐺𝐺𝐵𝐵𝐺𝐺𝐼𝐼,𝑟𝑟 ,𝑡𝑡 + 𝜇𝜇𝑡𝑡 + 𝜀𝜀𝐼𝐼,𝑟𝑟 ,𝑡𝑡 , for 𝑡𝑡 = 2 and 3 (5)
1 2 3 4 5 6
Δ Overall activities restrictions (gap) 0.46
0.43 0.51
[0.031]**
[0.035]** [0.031]**
Δ Restriction on banks own nonfin firms (gap) 0.75
0.62 0.48
[0.045]**
[0.041]** [0.053]*
Δ capital regulatory index (gap) 3.68
3.53 3.24
[0.015]**
[0.018]** [0.016]**
Δ strength of external audit (gap)
0.98
0.81 0.59
[0.034]**
[0.039]** [0.047]**
Δ fin statement transparency (gap)
1.12
1.10 1.15
[0.029]**
[0.037]** [0.052]*
Δ Independence of Supervisory Authority - Overall (gap)
2.78 2.81 3.00
[0.060]* [0.062]* [0.059]*
Δ Official Supervisory Power (gap)
0.15 0.34 0.46
[0.022]** [0.016]** [0.015]**
Δ Loan classification leniency (gap)
-0.36 -0.47
[0.028]** [0.016]**
Δ Creditor rights (gap) -3.08 -3.14 -3.02 -3.27 -2.81 -3.52
[0.013]** [0.019]** [0.075]* [0.020]** [0.026]** [0.020]**
Δ Info share (gap) -1.82 -2.04 -1.51 -2.42 -1.63 -1.49
[0.034]** [0.026]** [0.040]** [0.018]** [0.039]** [0.052]*
Δ Property rights (gap) -2.09 -2.06 -2.23 -2.06 -2.11 -1.53
[0.130] [0.039]** [0.053]* [0.044]** [0.038]** [0.047]**
Δ Log income (gap) -2.73 -2.73 -2.82 -2.60 -2.73 -3.14
[0.038]** [0.046]** [0.201] [0.083]* [0.075]* [0.063]*
Δ Log population (gap) 3.65 3.28 4.50 3.74 4.41 5.31
[0.143] [0.230] [0.111] [0.064]* [0.062]* [0.036]**
Δ Fin liberalization (gap)
0.15
[0.347]
Δ Growth opportunity (gap)
-0.34
[0.039]**
Observations 1,731 1,701 1,673 1,673 1,639 1,081 Adj. R-squared 0.19 0.16 0.16 0.17 0.14 0.18
Note: The regressions examine the effects of the changes of regulatory and institutional gaps on changes of bank inflows. The dependent variable is the difference of bank flows between 2001 and 2004 and that between 2004 and 2007, i.e., Δyt, t=2007 and 2004, where y is the bank flows defined as 100 times the log-difference of the ratio of total foreign claims (FCsr) from source country s to recipient country r, that is, 100*∆ln(FCsr). All explanatory variables are lagged two years changes in regulation gaps between source and recipient countries (i.e. difference of regulatory gaps between 1999 and 2002 and that between 2002 and 2005). P-values are computed by the heteroskedasticity-robust standard errors clustered for recipient countries and are presented in brackets. *, **, *** represent statistical significance at the 10%, 5% and 1% level respectively.

10
Internet Appendix Table 5: The current account analysis Estimation: Here we follow the traditional intertemporal approach to the current account (see, for example, a survey by Obstfeld and Rogoff (1995) on this research). It has been developed to address the Feldstein and Horioka (1980) saving-investment paradox of home bias in real investment (Sachs (1981)), and is related current “global savings glut” debate. We adopt a parsimonious version of this model documented in Tesar (1991) and Kraay and Ventura (2002). The traditional regression model is given as follows: (6)
CAit = α0 + α Sit + uit (6) where CAit and Sit are the current account/GNP and gross saving/GNP of country i respectively, α0 and α are parameters, and uit is residual. The parameters α provides a measure of the response of the current account to the changes in saving, which in turn, implies the amount of capital outflow from the country. We augment this simple model of the determinants of current account by a full set of key regulatory variables and other controls from our bank flow model as follows:
CAit = α0 + α Sit + β Regulationit + γ Controlit + uit (7) where Regulationit and Controlit are, respectively, a vector of regulatory variables and a vector of other control variables used in the previous bank flow analysis.
1 2 3 4 5 6 7
Saving/GNP (%) (source) 0.79 0.78 0.64 0.75 0.82 0.73 0.72
[0.006]*** [0.003]*** [0.003]*** [0.005]*** [0.009]*** [0.005]*** [0.004]***
Overall activities restrictions (source)
0.30
0.49 0.58
[0.016]**
[0.031]** [0.026]**
Restriction on banks own nonfin firms
(source)
1.41
1.31 1.16
[0.078]*
[0.014]** [0.008]***
capital regulatory index (source)
0.25
0.35 0.57
[0.035]**
[0.126] [0.072]*
strength of external audit (source)
0.74
0.63 1.15
[0.034]**
[0.243] [0.121]
fin statement transparency (source)
1.48
1.56 1.53
[0.018]**
[0.023]** [0.019]**
Independence of Supervisory Authority
(source)
0.53 0.71 0.96
[0.092]* [0.605] [0.454]
Official Supervisory Power (source)
0.96 0.91 0.81
[0.160] [0.057]* [0.028]**
Loan classification leniency (source)
-0.50 -0.36
[0.015]** [0.016]**
Creditor rights (source)
-3.32 -2.83 -2.55 -2.50 -2.47 -2.44
[0.025]** [0.154] [0.061]* [0.137] [0.032]** [0.041]**
Info sharing (source)
-1.73 -2.30 -1.56 -1.32 -1.13 -1.44
[0.026]** [0.017]** [0.019]** [0.113] [0.004]*** [0.017]**
No. of days to enforce contracts (source)
0.18 0.17
[0.015]** [0.023]**
Property rights (source)
-3.68 -4.90 -3.77 -3.98 -4.13 -4.51
[0.065]* [0.044]** [0.072]* [0.062]* [0.037]** [0.021]**

11
Fin liberalization (source)
0.51
[0.161]
Growth opportunity (source)
-1.32
[0.027]**
Sample period 1996-20007 1996-2005
Other control variables yes yes yes yes yes yes yes
Source country fixed effect yes yes yes yes yes yes yes
Observations 1,124 1,124 1,125 1,090 1,102 1,033 610
Adj. R-squared 0.81 0.84 0.83 0.83 0.82 0.84 0.85
No. of source countries 104 104 104 101 102 96 67
Note: The dependent variable is the current account/GNP (in %), which is a proxy for aggregate capital outflows from the source countries in the sample. The country level banking regulatory variables are time varying and are based on three major surveys spanning almost over a decade by the World Bank. Detailed variable definitions can be found in Table 1. Other control variables include log income (source) and log population (source). Time fixed effects and source country specific effects are included in the regressions but not reported. P-values are computed by the heteroskedasticity-robust standard errors clustered for source countries and are presented in brackets. *, **, *** represent statistical significance at the 10%, 5% and 1% level respectively.

12
Internet Appendix Table 6: Difference of number of foreign subsidiaries in highly regulated versus low regulation countries
1 2 3 4 5
Cell
High regulation countries
No. of obs
Low regulation countries
No. of
obs
Difference = (1)-(3)
1 Bank size below median & low profitability 1.31 23 1.26 42 0.05 2 Bank size below median & high profitability 3.68 41 1.98 44 1.71* 3 Bank size above median & low profitability 8.74 36 6.13 49 2.61** 4 Bank size above median & high profitability 9.41 34 6.25 32 3.16**
Note: This table test the difference of number of foreign subsidiaries in highly regulated versus low regulation countries according to the size and profitability of the banks. Bank size is measured by total assets and profitability is measured by net income divided by total assets. Both are three-year averages. *, **, *** represent statistical significance at the 10%, 5% and 1% level respectively. For the matching estimation: 1) For each of the 26 source countries, we create dummy variable related to each of the eight supervision and regulation measures used in our previous analysis. For each dummy variable, we assigned a value of 1 to countries which have a more stringent regulation relative to the sample median. We then construct the overall regulation index as the sum of these eight dummy variables. Thus, this overall measure ranges from 0 to 8 with a higher value indicating a higher level of bank regulation. We divide 26 source countries into two groups of high/low regulation according to the overall regulation index of each country being above or below the medium level of the index. 2) divide 26 source countries into two groups of high/low regulation according to the overall regulation index of each country being above or below the medium level of the index. 3) divide all 301 banks from the 26 source countries into big/small banks according to their size and high/low profitable banks according to their profitability in comparison to the respective medians. This gives us a total of 4 cells. 4) For the 4 cells, conduct four t-tests to see within each cell if banks located in highly regulated countries have more oversea subsidiaries than banks located in less regulated countries.