Embed Size (px)
Citation preview
Title: Prometheus unbound: Quality of government and institutionalised grand
corruption in public procurement
Author: Mihály Fazekas
College: Hughes Hall
Date: 31/01/2014
This dissertation is submitted for the degree of Doctor of Philosophy, University of
Cambridge, Department of Sociology.

Mihály Fazekas: Quality of government and institutionalised grand corruption in public procurement, PhD dissertation
1
Preface
This dissertation is the result of much joy as well as suffering. I owe my deepest thanks to all those who supported me in this endeavour, especially my wife Marie Licht and my close family back in Hungary. In addition, my colleagues and critical friends who closely followed the development of my research deserve my gratitude, first of all István János Tóth. My work greatly benefited from the rich scholarship of the field and the countless non-academics who expressed their opinion on corruption, state capacity, and good government.
I would also like to thank the funding bodies who contributed towards to goals of my research, especially the European Union and the Hungarian Government: TAMOP 4.2.2.B and ANTICORRP (Grant agreement no: 290529) for supporting database building.
This dissertation is the result of my own work and includes nothing which is the outcome of work done in collaboration with others except where specifically indicated in the text.

Mihály Fazekas: Quality of government and institutionalised grand corruption in public procurement, PhD dissertation
2
Statement of Length
This PhD dissertation does not exceed the 80,000 words limit set by the Department of Sociology.
Mihály Fazekas: Quality of government and institutionalised grand corruption in public procurement, PhD dissertation
3
Summary This PhD thesis looks at one of the most crucial determinants of state formation,
quality of institutions, and social equality: institutionalised grand corruption.
Institutionalised grand corruption denotes the particularistic allocation of public
resources, that is violating prior explicit rules in order to benefit a closed network
while denying access to all others. Emphasizing access to power and public
resources deviates from traditional definitions of corruption resting on individual
wrongdoing and abuse of power.
The thesis makes use of large amounts of administrative data describing public
procurement tenders on transaction level and links it to data on company ownership,
financial accounts, and political office of company owners. By using data mining
techniques it breaks away from standard, and arguably deficient, measures of quality
of institutions and corruption. It proposes a complex ‘blueprint’ for measuring
institutionalized grand corruption in the allocation of public resources and applies its
key elements to three Central and Eastern European countries: Czech Republic,
Hungary, and Slovakia. It is emphasized that these cases are only ‘pilot’
measurements, the blueprint is applicable to practically every high and middle
income country, data is typically going back in time for 6-8 years.
Using such a novel indicator set allows for an unprecedented detail of analysis.
Results highlight the role played by European Union Structural and Cohesion Funds
in increasing the prevalence of institutionalised grand corruption. This is due to at
least two factors, first, they provide additional public resources available for corrupt
rent extraction; second, they change the motivations for and controls of corruption. In
Czech Republic, Hungary, and Slovakia, the first effect increases the value of
particularistic resource allocation by up to 1.21% of GDP, while the second effect
decreases it by up to 0.03% of GDP. The latter effect is entirely driven by Slovakia;
in Czech Republic and Hungary even this effect increases particularism.
Mihály Fazekas: Quality of government and institutionalised grand corruption in public procurement, PhD dissertation
4
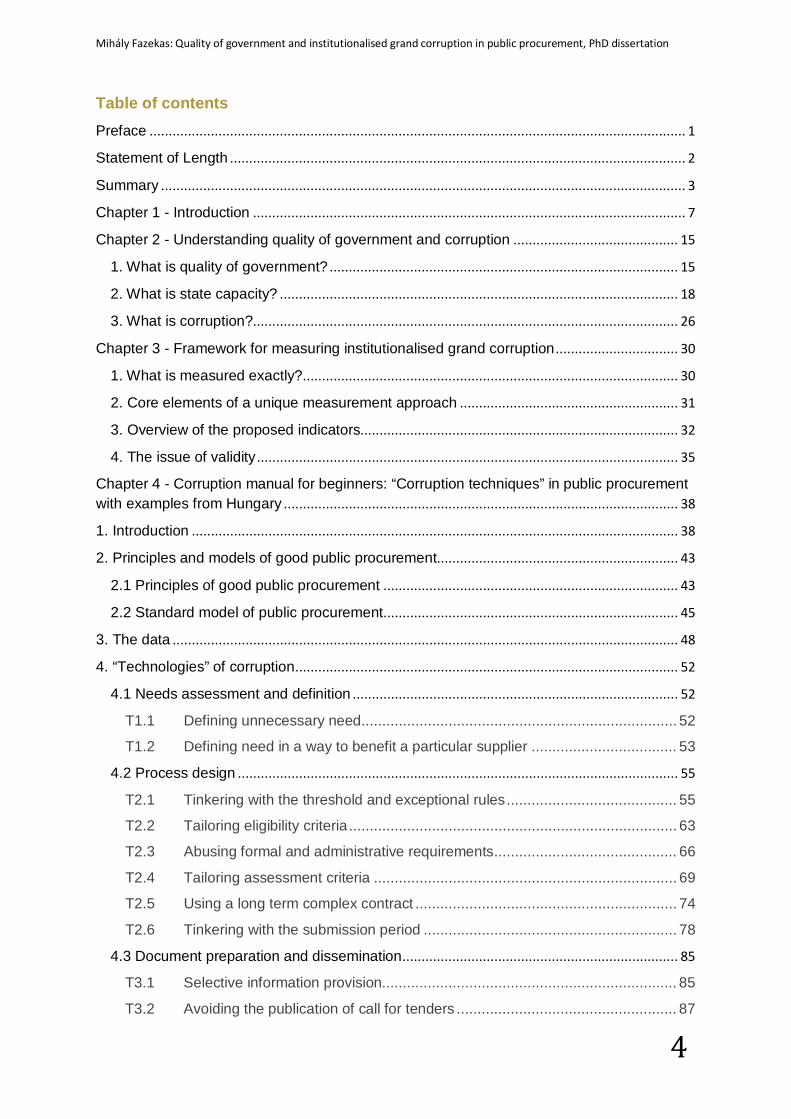
Table of contents Preface ............................................................................................................................................ 1
Statement of Length ....................................................................................................................... 2
Summary ......................................................................................................................................... 3
Chapter 1 - Introduction ................................................................................................................. 7
Chapter 2 - Understanding quality of government and corruption ........................................... 15
1. What is quality of government? ........................................................................................... 15
2. What is state capacity? ........................................................................................................ 18
3. What is corruption?............................................................................................................... 26
Chapter 3 - Framework for measuring institutionalised grand corruption ................................ 30
1. What is measured exactly? .................................................................................................. 30
2. Core elements of a unique measurement approach ......................................................... 31
3. Overview of the proposed indicators................................................................................... 32
4. The issue of validity .............................................................................................................. 35
Chapter 4 - Corruption manual for beginners: “Corruption techniques” in public procurement with examples from Hungary ....................................................................................................... 38
1. Introduction ............................................................................................................................... 38
2. Principles and models of good public procurement............................................................... 43
2.1 Principles of good public procurement ............................................................................. 43
2.2 Standard model of public procurement ............................................................................. 45
3. The data .................................................................................................................................... 48
4. “Technologies” of corruption .................................................................................................... 52
4.1 Needs assessment and definition ..................................................................................... 52
T1.1 Defining unnecessary need ............................................................................ 52
T1.2 Defining need in a way to benefit a particular supplier ................................... 53
4.2 Process design ................................................................................................................... 55
T2.1 Tinkering with the threshold and exceptional rules ......................................... 55
T2.2 Tailoring eligibility criteria ............................................................................... 63
T2.3 Abusing formal and administrative requirements ............................................ 66
T2.4 Tailoring assessment criteria ......................................................................... 69
T2.5 Using a long term complex contract ............................................................... 74
T2.6 Tinkering with the submission period ............................................................. 78
4.3 Document preparation and dissemination ........................................................................ 85
T3.1 Selective information provision....................................................................... 85
T3.2 Avoiding the publication of call for tenders ..................................................... 87
Mihály Fazekas: Quality of government and institutionalised grand corruption in public procurement, PhD dissertation
5
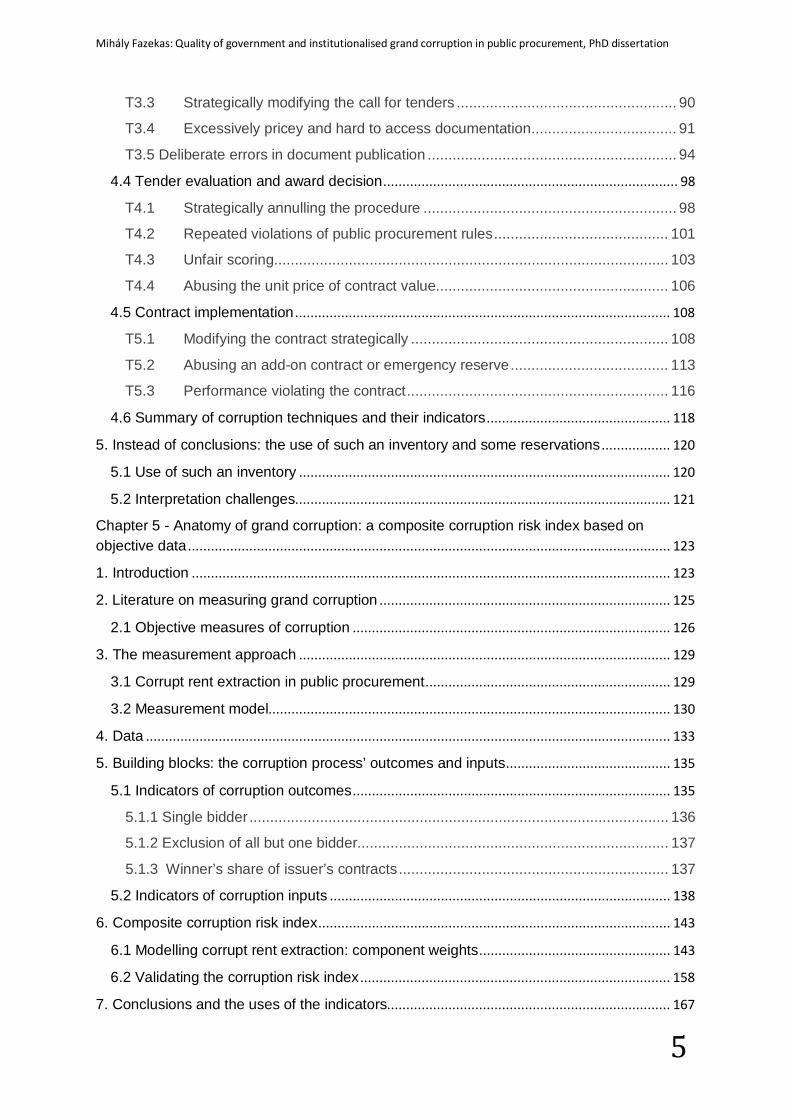
T3.3 Strategically modifying the call for tenders ..................................................... 90
T3.4 Excessively pricey and hard to access documentation ................................... 91
T3.5 Deliberate errors in document publication ............................................................ 94
4.4 Tender evaluation and award decision ............................................................................. 98
T4.1 Strategically annulling the procedure ............................................................. 98
T4.2 Repeated violations of public procurement rules .......................................... 101
T4.3 Unfair scoring............................................................................................... 103
T4.4 Abusing the unit price of contract value........................................................ 106
4.5 Contract implementation .................................................................................................. 108
T5.1 Modifying the contract strategically .............................................................. 108
T5.2 Abusing an add-on contract or emergency reserve ...................................... 113
T5.3 Performance violating the contract ............................................................... 116
4.6 Summary of corruption techniques and their indicators ................................................ 118
5. Instead of conclusions: the use of such an inventory and some reservations .................. 120
5.1 Use of such an inventory ................................................................................................. 120
5.2 Interpretation challenges.................................................................................................. 121
Chapter 5 - Anatomy of grand corruption: a composite corruption risk index based on objective data .............................................................................................................................. 123
1. Introduction ............................................................................................................................. 123
2. Literature on measuring grand corruption ............................................................................ 125
2.1 Objective measures of corruption ................................................................................... 126
3. The measurement approach ................................................................................................. 129
3.1 Corrupt rent extraction in public procurement ................................................................ 129
3.2 Measurement model......................................................................................................... 130
4. Data ......................................................................................................................................... 133
5. Building blocks: the corruption process’ outcomes and inputs ........................................... 135
5.1 Indicators of corruption outcomes ................................................................................... 135
5.1.1 Single bidder ..................................................................................................... 136
5.1.2 Exclusion of all but one bidder........................................................................... 137
5.1.3 Winner’s share of issuer’s contracts ................................................................. 137
5.2 Indicators of corruption inputs ......................................................................................... 138
6. Composite corruption risk index ............................................................................................ 143
6.1 Modelling corrupt rent extraction: component weights .................................................. 143
6.2 Validating the corruption risk index ................................................................................. 158
7. Conclusions and the uses of the indicators.......................................................................... 167
Mihály Fazekas: Quality of government and institutionalised grand corruption in public procurement, PhD dissertation
6
Chapter 6 - Are EU funds a corruption risk? The impact of EU funds on grand corruption in Central and Eastern Europe ...................................................................................................... 169
1. Introduction ............................................................................................................................. 169
2. Theory ..................................................................................................................................... 171
3. Data and variables ................................................................................................................. 175
3.1. Data sources .................................................................................................................... 175
3.2 Variables used in the analysis ......................................................................................... 177
3.2.1 EU funds use .................................................................................................... 177
3.2.2 Indicators of institutionalised grand corruption ................................................... 179
4. Corruption risks and particularistic allocation of EU funding .............................................. 190
4.1 Corruption risks of spending more .................................................................................. 190
4.2 Corruption risks of spending differently .......................................................................... 192
4.2.1 Corruption risks in EU and non-EU funded procurement procedures ................ 193
4.2.2 Components driving corruption risk differentials ................................................ 196
5. Conclusions and policy consequences................................................................................. 202
Appendices .................................................................................................................................. 205
Appendix 4A-examples of corruption techniques in the Hungarian media ............................ 205
Appendix 5A - Availability of public procurement data ............................................................ 209
Appendix 5B - Robustness checks ........................................................................................... 210
Appendix 5C – List of political offices considered for political connection measurement .... 216
Appendix 6A-Goodness of propensity score matching ........................................................... 217
Bibliography................................................................................................................................. 219
Mihály Fazekas: Quality of government and institutionalised grand corruption in public procurement, PhD dissertation
7
Chapter 1 - Introduction
Good governance in most countries of Central and Eastern Europe (CEE) seems to
be a long way off, especially given the lack of progress and numerous policy
reversals in the last few years. For example, to the surprise of many, Hungary turned
out to be a clear ‘frontrunner’ in terms of dismantling institutions of democratic
governance and the system of checks and balances. Probably less surprisingly,
Romania has made several attempts to weaken government accountability
mechanisms. While it is too early to determine the exact nature of such changes
throughout the region, it is already clear that the quality of government in CEE with
its high levels of corruption, state capture, and weak state capacity is a likely
contributing factor to low growth, high budget deficit, low quality of public services,
and low levels of trust in government (Lambsdorff, 2006a). In addition and
importantly for this analysis, systemic corruption is highly likely to distort the structure
of public sector spending conducted through public contracting (Mauro, 1998).
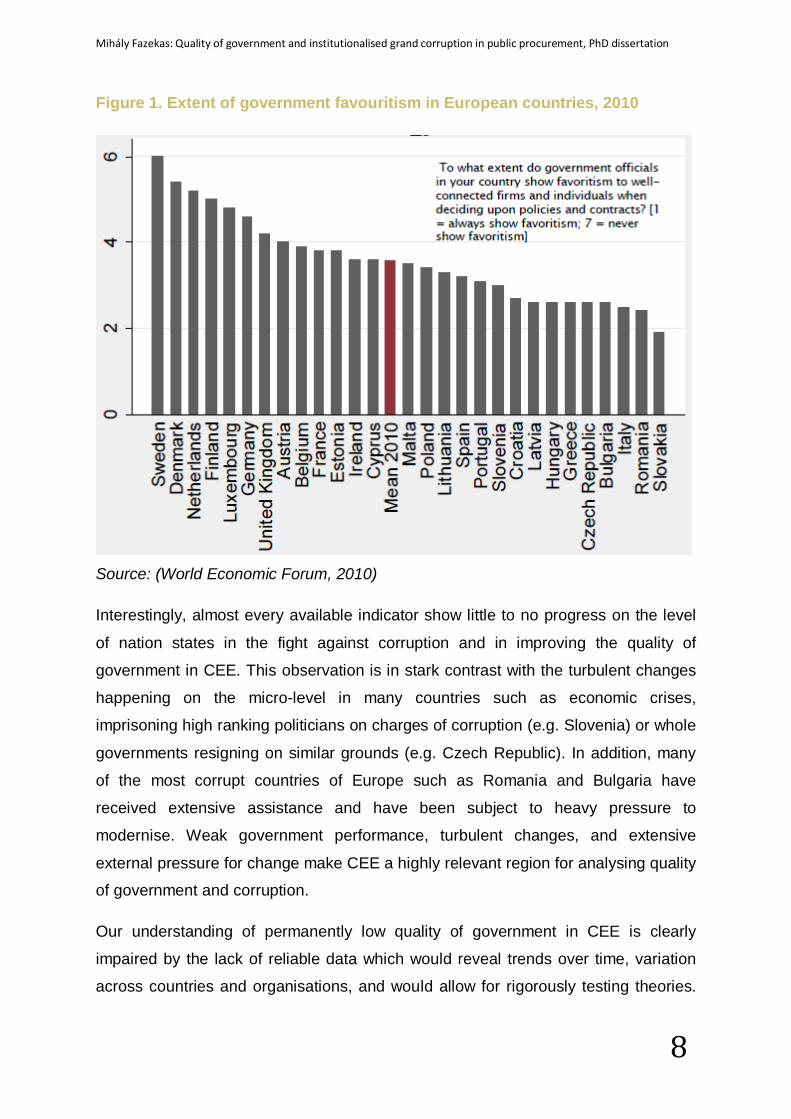
One indication of low quality of government, albeit an imperfect one, is the
perception that government favouritism is widespread in Europe, especially in CEE
(Figure 1). This is also met by corruption, broadly defined, being one of the primary
concerns of Europe’s citizens and policy makers (European Commission, 2011a).
Mihály Fazekas: Quality of government and institutionalised grand corruption in public procurement, PhD dissertation
8
Figure 1. Extent of government favouritism in European countries, 2010
Source: (World Economic Forum, 2010)
Interestingly, almost every available indicator show little to no progress on the level
of nation states in the fight against corruption and in improving the quality of
government in CEE. This observation is in stark contrast with the turbulent changes
happening on the micro-level in many countries such as economic crises,
imprisoning high ranking politicians on charges of corruption (e.g. Slovenia) or whole
governments resigning on similar grounds (e.g. Czech Republic). In addition, many
of the most corrupt countries of Europe such as Romania and Bulgaria have
received extensive assistance and have been subject to heavy pressure to
modernise. Weak government performance, turbulent changes, and extensive
external pressure for change make CEE a highly relevant region for analysing quality
of government and corruption.
Our understanding of permanently low quality of government in CEE is clearly
impaired by the lack of reliable data which would reveal trends over time, variation
across countries and organisations, and would allow for rigorously testing theories.
Mihály Fazekas: Quality of government and institutionalised grand corruption in public procurement, PhD dissertation
9
First, there is a great deal of perception-based indicators of typically low quality both
on corruption and quality of government (e.g. Kaufmann, Kraay, & Mastruzzi, 2007;
Kaufmann, Mastruzzi, & Kraay, 2010; Kurtz & Schrank, 2007a, 2007b). What is
common in perception-based indicators is that they are rather unreliable for gauging
levels precisely and tracking changes of the actual phenomena as they suffer from
perception biases and influences of the mass media. In addition, micro-level
variation such as inter-institutional differences are invisible for such measures, a
troubling shortcoming as many best practices arise at the micro level. Second, while
there are some indicators based on actual experiences with public services and
corruption either by public employees or citizens (Charron & Lapuente, 2011; e.g.
Meyer-Sahling, 2011; Olken, 2007; Reinikka & Svensson, 2004), these measures
are applicable only in selected fields and are costly to replicate across many
countries and many years. In addition, surveys are unable to inform us about
phenomena invisible for ordinary citizens (e.g. constructing highways with lower than
contracted quality showing its results only after years of use). Third, there is also
good qualitative evidence on corruption and state capture based on interviews and
qualitative case studies (Jancsics & Jávor, 2012; Szántó, Tóth, Varga, & Cserpes,
2010; Szántó & Tóth, 2008; Torsello, 2012) which are excellent for revealing the
micro-structure of the phenomena, but incapable of determining prevalence or trends
over time. Hence, there is a clear lack of reliable indicators both for policy makers
and researchers.
In order to advance our knowledge about quality of government and corruption, it is
necessary to rely on a range of indicators and especially to develop ‘objective’
measures which do not suffer from the usual shortcomings of perception and
experience surveys (Donchev & Ujhelyi, 2009; Morris, 2008). In addition, rigorous
theory testing also requires going beyond national level-indices as mapping micro-
mechanisms is the key to decipher higher level phenomena, especially in light of the
surprising contrast between stable macro indices and apparently dynamic micro-
level events. While there are a number of promising developments pointing at
objective measures, there is a long way to go in this direction (Sampford, Shacklock,
Connors, & Galtung, 2006). In order to arrive at a full and balanced repertoire of
empirical evidence, lessons can be drawn from other areas of research facing similar
challenges such as shadow economy research. Here, interview evidence and
Mihály Fazekas: Quality of government and institutionalised grand corruption in public procurement, PhD dissertation
10
perception- and experience-based population surveys are complemented by
analyses performed on administrative data pointing at phenomena not experienced
by most of the population or concealed by respondents (e.g. using electricity
consumption to estimate hidden income).
As most top-down approaches to measuring the quality of government and
corruption have by and large failed to deliver good enough indicators, the only
feasible route appears to be to construct new indices bottom-up. Hence,
understanding the technologies or strategies of corruption at the micro-level is the
precondition for developing objective indicators circumventing the actors’ efforts at
hiding their actions. By implication, this paper joins a small, but growing literature
using ‘objective’ indicators of the quality of government and corruption in general and
corruption in public procurement in particular.
In addition to the dire state of measurement, theoretical controversy and conceptual
confusion often contribute to the lack of sufficiently robust understanding of quality of
government and corruption. For example, a widely used set of measures come from
the World Bank’s World Governance Indicators (Kaufmann et al., 2010) which
doesn’t make it clear whether the assessment refers to the content of policies or the
process of making them (Kurtz & Schrank, 2007b). While it is possible to enact
inclusive and open economic policies through a non-inclusive process (think about
China for example) or the other way around, the two have widely different
consequences for democracy and social inclusion. Hence, if a new measurement is
to go beyond the state-of-the-art, it has to closely tie conceptual innovation to novel
measurement.
In order to start filling the above gaps, this PhD dissertation delivers new theoretical
and empirical insights on the issue of corruption which is arguably one of the key
aspects of the quality of government. While the broader context of quality of
institutions is also discussed, narrowing the focus only to corruption is necessary for
keeping the analysis tractable. Nevertheless, suggestions are also offered on how
this approach can be adapted to aspects of government quality other than corruption
such as administrative capacity.
This PhD dissertation pursues the following goals in the context of CEE countries in
2009-2012:
Mihály Fazekas: Quality of government and institutionalised grand corruption in public procurement, PhD dissertation
11
1. Developing a novel set of corruption indicators based on clear conceptual
foundations and using solely ‘objective’ data.
2. Assessing the validity of these novel indicators.
3. Describing the trajectory and structure of corruption across countries,
organisations, and over time.
4. Explaining the impact of development funding (i.e. EU funds) in CEE on
corruption.
As I will argue below, corruption is a diverse phenomenon and it is hardly possible to
arrive at a conceptually and empirically sound approach which would encompass all
of its forms and aspects. Instead, what appears to be more fruitful, both theoretically
and empirically, is to concentrate on one type of corruption affecting a distinct set of
government activities. Throughout this dissertation, the primary emphasis falls on
institutionalised grand corruption done in public in CEE. Looking specifically at public
procurement is ideal for my purposes both for scientific and practical reasons, while
it is emphasized that the approach is transferable to a range of other spending
areas:
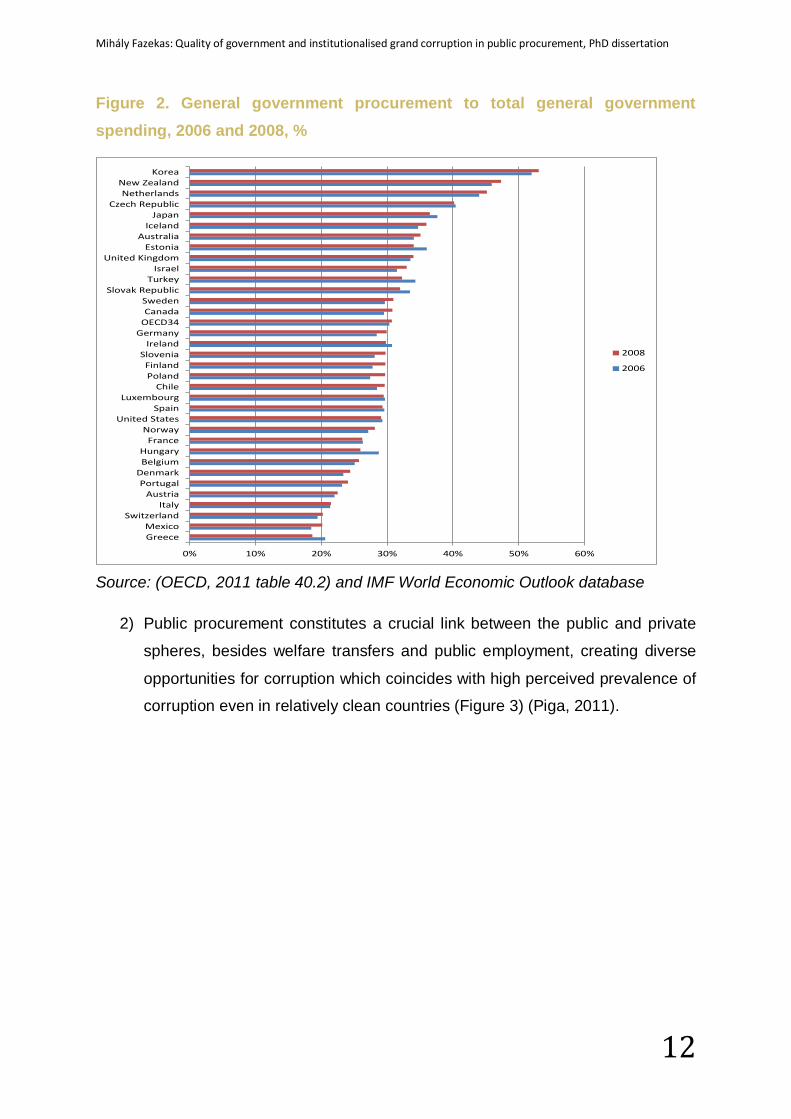
1) it represents a large portion of GDP as well as public spending: 19-53% of
general government spending across OECD countries and about 30% or
more in CEE in 2008 (Figure 2)1.
1 Although the methodology used for calculating the size of public procurement markets is an upper bound estimate of the actual value.
Mihály Fazekas: Quality of government and institutionalised grand corruption in public procurement, PhD dissertation
12
Figure 2. General government procurement to total general government spending, 2006 and 2008, %
Source: (OECD, 2011 table 40.2) and IMF World Economic Outlook database
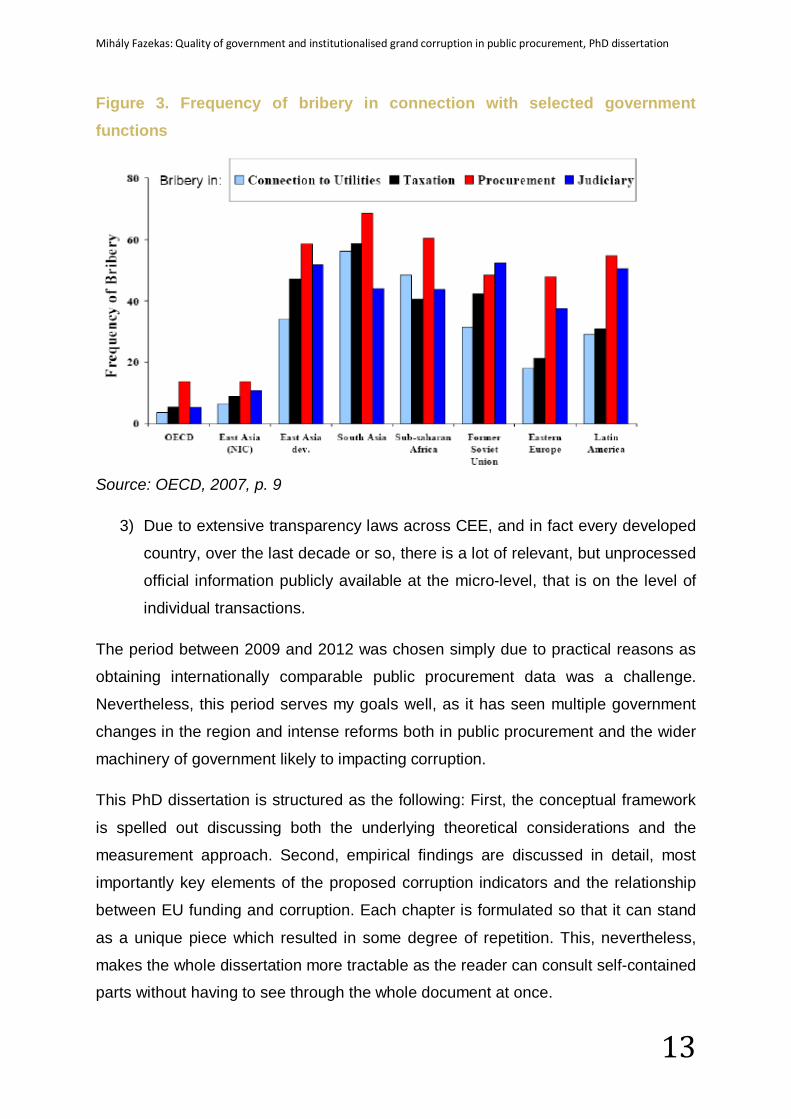
2) Public procurement constitutes a crucial link between the public and private
spheres, besides welfare transfers and public employment, creating diverse
opportunities for corruption which coincides with high perceived prevalence of
corruption even in relatively clean countries (Figure 3) (Piga, 2011).
0% 10% 20% 30% 40% 50% 60%
GreeceMexico
SwitzerlandItaly
AustriaPortugal
DenmarkBelgiumHungary
FranceNorway
United StatesSpain
LuxembourgChile
PolandFinland
SloveniaIreland
GermanyOECD34CanadaSweden
Slovak RepublicTurkey
IsraelUnited Kingdom
EstoniaAustralia
IcelandJapan
Czech RepublicNetherlands
New ZealandKorea
2008
2006
Mihály Fazekas: Quality of government and institutionalised grand corruption in public procurement, PhD dissertation
13
Figure 3. Frequency of bribery in connection with selected government functions
Source: OECD, 2007, p. 9
3) Due to extensive transparency laws across CEE, and in fact every developed
country, over the last decade or so, there is a lot of relevant, but unprocessed
official information publicly available at the micro-level, that is on the level of
individual transactions.
The period between 2009 and 2012 was chosen simply due to practical reasons as
obtaining internationally comparable public procurement data was a challenge.
Nevertheless, this period serves my goals well, as it has seen multiple government
changes in the region and intense reforms both in public procurement and the wider
machinery of government likely to impacting corruption.
This PhD dissertation is structured as the following: First, the conceptual framework
is spelled out discussing both the underlying theoretical considerations and the
measurement approach. Second, empirical findings are discussed in detail, most
importantly key elements of the proposed corruption indicators and the relationship
between EU funding and corruption. Each chapter is formulated so that it can stand
as a unique piece which resulted in some degree of repetition. This, nevertheless,
makes the whole dissertation more tractable as the reader can consult self-contained
parts without having to see through the whole document at once.

Mihály Fazekas: Quality of government and institutionalised grand corruption in public procurement, PhD dissertation
14
Part I – Towards a conceptual framework
Mihály Fazekas: Quality of government and institutionalised grand corruption in public procurement, PhD dissertation
15
Chapter 2 - Understanding quality of government and corruption
This chapter provides the definitions for quality of government and corruption which
are the basis for measurement and analysis. No comprehensive review of the
literature on these themes is offered simply because it would take up a full PhD
dissertation on its own. Instead, what is offered is a brief critical review of the most
relevant theories and a thorough discussion of the definitions adopted. Quality of
government serves as a broad theme within which the issue of corruption is defined.
Theoretical models of causal links are only covered by the respective theoretical
sections in the later empirical chapters in order to keep empirical work self-
containing.
1. What is quality of government? Quality of government is a widely used and often hotly contested concept. Scientific
disciplines such as (political) sociology, political science, or (institutional) economics
have their unique view on it at least partially reflecting their main area of scientific
interest (e.g. economists often see the quality of government in light of economic
growth it contributes to). Debates around quality of government have spawned
surprisingly many inadequate conceptualisations, two of which deserve some critical
discussion as they are widely used: 1) functionalist definitions and 2) all-
encompassing definitions.
Functionalist definitions hold the promise of being elegantly simple by defining
quality of government as those institutions which serve a purpose. One of the most
often quoted example of this is quality of government as institutions serving
economic growth (Porta, Lopez-de-Silanes, Shleifer, & Vishny, 1999). The main
problem with any such approach is that high quality or good government can result in
a range of positive or negative outcomes while it is unclear why one or the other
outcome shall be superior. In addition, it exactly the relationship between
government quality and desired societal and economic outcomes which is of
question for many researchers, hence, assuming away the problem leaves us with
no tools to work with. Finally, functionalist definitions can often result in a circular
chain of definitions such as 1) what is required for economic growth is good
government; and 2) what is good government is what produces economic growth.
Mihály Fazekas: Quality of government and institutionalised grand corruption in public procurement, PhD dissertation
16
A prime example of all-encompassing definitions is the concept of (good)
governance adopted by Kaufmann and colleagues at the World Bank:
“the traditions and institutions by which authority in a country is exercised. This
includes (a) the process by which governments are selected, monitored and
replaced; (b) the capacity of the government to effectively formulate and
implement sound policies; and (c) the respect of citizens and the state for the
institutions that govern economic and social interactions among them.”
(Kaufmann et al., 2010 p. 4)
While the authors go a long way to break down this broad definition into smaller
parts, at the end of the day, their concept of governance encompasses everything
from the access to power to the exercise of power; from the content of policies to the
process by which they are formulated. As Rothstein & Teorell (2008) (p. 168) put it
“The problem is that such a definition is just about as broad as any definition of
“politics”.” In addition, the measurement of this concept, however impressive in
scope, suffers from a number of biases towards international business elites and
generally lacks the hard elements which would allow for deriving causal inferences
(Kurtz & Schrank, 2007a, 2007b).
In order to avoid the pitfalls of defining quality of government in functional or all-
encompassing terms, focusing the definition on how public authority is exercised
appears to be fruitful. It makes the distinction between the access to power and the
exercise of power clear while it also steers clear from conflating the content of
policies with the process of decision making and implementing policies. Hence,
following Weber2 and many contemporary scholars quality of modern governments
can be defined as
the degree to which the exercise of public authority follows the principle of
universalism or impartiality.
In this context, universalistic or impartial exercise of power is such that only rational-
legal rules applying to a case are taken into account when making public decisions
or implementing them. This definition departs from the similar definition adopted by
2 The concept of impartiality is clearly linked to Weber’s legal-rational ideal while being applied to the whole state rather than to state bureaucracy only (Dahlström et al., 2010).
Mihály Fazekas: Quality of government and institutionalised grand corruption in public procurement, PhD dissertation
17
Rothstein & Teorell (2008) in that it also refers to making public decisions not only
implementing them. This is because it is hard to separate decision making from
implementation when it comes to impartiality as, for example, a law enacted in a
partial manner giving special favours to a particular individual (think about for
example a law which stipulates that only the brother of the president can receive
highway construction contracts) can be impartially implemented still rendering it
partial. Hence, both decision making and implementation should follow the principle
of universalism or impartiality in a high quality government.
In spite of efforts to establish impartiality or even-handedness as a generally
applicable norm (Rothstein & Torsello, 2013), such a norm is far from warranted in
every context. By implication, the above definition is only applicable in contexts
where the norm of universalism is established at least in part. For example, even in a
largely patrimonial society, development funding may be attached to a universalistic
spending principle which can be respected in spite of generally divergent norms in
the wider society.
Unsurprisingly, the quality of government is only applicable to the state, hence, its
space of validity hinges upon the scope of the state, that is what kinds of products
and services a given state provides or is expected to provide by the majority of the
population.
This definition of quality of government implies that a high quality government is free
of corruption, i.e. abuse of public office for private gain (Nye, 1967), as well as
clientelistic and patronage practices (Mungiu-Pippidi, 2006); however quality of
government can be low for other reasons too. On an abstract level, the principle of
universalism in the exercise of public authority can be violated for two fundamental
reasons: 1) lack of capacity to live up to such a norm (state capacity); and 2)
deliberate violation in order to benefit a particular group or individual (corruption).
The first kind of violation arises in a more or less random way implying no regular
benefits to any particular group or individual. Here, intentionality is lacking. A prime
example of this violation is when official records are accidentally lost by the state and
the corresponding citizens get an inferior treatment compared to all others as a
result. The second kind of violation arises in a non-random fashion, whereby the
involved actors intentionally violate the principle of ethical universalism. In order
Mihály Fazekas: Quality of government and institutionalised grand corruption in public procurement, PhD dissertation
18
words, state capacity is about the means to deliver in an impartial manner, while
corruption is about the balance between the motivations and controls for purposefully
using public means for public goals.
While, these two types of violations are conceptually distinct, they need not neatly
separate in reality. For example, when record keeping capacities are low, intentional
bending of rules is more easy to carry out.
These two components of quality of government: state capacity and corruption are
discussed separately below.
2. What is state capacity? In the sociological and political science literature pluralist (Baumgartner, Berry,
Hojnacki, Kimball, & Leech, 2008; Berry, 1999; Mahoney, 2008), class-domination
(Domhoff, 1990, 1996, 2006), Foucauldian (Foucault, 1980, 1991), and state centrist
(Evans, Rueschemeyer, & Skocpol, 1985; Evans, 1995; Finegold & Skocpol, 1995;
Weiss, 1998) schools have formulated often opposing theories of the capacities of
the state. Among many others they have long debated whether the state is
autonomous, i.e. whether it is simply the reflection of societal interests and power
relations or whether it is capable of acting independent of these. The proposed
analysis clearly assumes that the state can be autonomous if it commands sufficient
capacity. Below, relevant literature is critically reviewed first, then a simple
conceptualisation is offered.
The proposed research’s state capacity concept directly relates to the formulation of
state capacity in the state centrist and institutionalist accounts (Evans, 1995;
Jessop, 2006). State capacity in these works, by and large, refers to the capacity of
the state to carry through its decisions, that is implementation capacity which can
take the form of, for example, capacity to coordinate state intervention into the
economy (e.g. Skocpol & Finegold, 1982) or capacity to extract resources from the
society (Tilly, 1985). By now, ‘state capacity’ has become a frequently used term for
a burgeoning literature with various meanings and measurements.3 In the works
within the diverse tradition of state centrist institutionalism, state capacity emerges
as the prime explanatory factor behind policy success and failure in terms of, for
3 Google scholar returned more than 26 000 articles mentioning the term ‘state capacity’ on the 15th of March 2011.
Mihály Fazekas: Quality of government and institutionalised grand corruption in public procurement, PhD dissertation
19
example, war and international conflict, state coordination of the economy, or
industrial development. One of the virtues of this school of thought is that it gives a
detailed historical account of the development as well as the impacts of state
capacity in developed as well as developing countries both in contemporaneous and
historical perspectives. Nevertheless, our understanding of state capacity building
and deconstructing efforts in the specific context of CEE countries is incomplete. It is
suggested that much of the existing state capacity was purged in the transition
process by reform minded governments mostly following neo-liberal advice (Hamm,
Stuckler, & King, 2010; King & Hamm, 2005; King & Szelényi, 2005). The
subsequent efforts to strengthen state capacity are subject to heated debates
claiming dominance of external or internal forces and evoking the capturing
tendencies of business. Furthermore, this school of thought places the state into an
interaction with civil society and markets (e.g. constructing markets) (Polányi, 1957);
it also opens up the black box of the state and considers the interaction among state
institutions (Block & Evans, 2005; Lange, 2005).
Much of the state capacity and related scholarship is driven by the argument put
forward by Weber (Weber, 1978 ch. 11) that bureaucracy is one of the institutional
foundations of capitalist economies associated with a rational-legal order and
capitalist growth (Albrow, 1970). This bureaucracy constitutes “a distinct
organizational setting, the bureau or office: formalized, hierarchical, specialized with
a clear functional division of labor and demarcation of jurisdiction, standardized, rule
based, and impersonal. […] bureaucracy refers to a professional, full-time
administrative staff with lifelong employment, organized careers, salaries, and
pensions, appointed to office and rewarded on the basis of formal education, merit,
and tenure.” (Olsen, 2005, p. 2). Based on this clear theoretical model, two recent
attempts were made to develop an empirical research program and further refine
and test the ideas of Weber:
1. Evans and Rauch developed a ‘Weberianness’ score based on a narrower
understanding of the Weberian model, i.e. meritocratic recruitment and
predictable long-term career paths, which they found to be conducive to
economic growth and bureaucratic quality in some low and middle income
countries (Evans & Rauch, 1999; Rauch & Evans, 2000).
Mihály Fazekas: Quality of government and institutionalised grand corruption in public procurement, PhD dissertation
20
2. Scholars at the Quality of Government Institute, University of Gothenburg4
have taken forward and further refined the ideas of Evans and Rauch. Their
work concentrates on meritocratic versus political recruitment, career path of
bureaucrats, and their salaries which have led to conceptualizing two principal
aspects of bureaucracy: professionalism and closedness (Dahlström,
Lapuente, & Teorell, 2010).
One of the greatest merits of these accounts is that they strictly differentiate between
inputs to and internal processes of state bureaucracies (e.g. career progression) and
the outcomes which are expected to derive from the existence of such state
structures (e.g. economic growth). This approach allows for separating state and
society in the policy process which in a second analytical step can be linked through
mechanisms. However, both of these research strands focus on a narrow
understanding of public administration, i.e. central government, and limited concepts
of organisational structures. In addition, when considering the impacts of Weberian
bureaucracy no or only one intervening factor is considered. Furthermore and more
significantly, these applications of the Weberian perspective on bureaucracy is
limited in contemporary developed societies where a host of state-society
institutionalized relationships exist which contribute towards state capacity, but,
strictly speaking, lie outside the domain of bureaucracy. These developments must
be taken into account if one wants to develop an empirically accurate account of
state capacity. This is not to say that bureaucracy is not crucial in state capacity as,
for example it is central to managing state-society relationships; rather the analytical
perspective must be broadened (Pierre & Peters, 2005).
Finally, these schools of thought acknowledge the role of bureaucratic expertise and
knowledge in producing outcomes; nevertheless, they do not explicitly theorize or
measure these, even though in Weber’s original account they featured as key
insights (Evans, 1995 ch. 2). Similarly, the previously reviewed state centric
institutionalist authors make notice, but does not spell out in detail the role played by
expertise and knowledge even though there is a substantive amount of scholarly
work by now (Amsden, 2001; Gordon, 1977; P. A. Hall, 1993; Rueschemeyer, 1983).
4 See: http://www.qog.pol.gu.se/
Mihály Fazekas: Quality of government and institutionalised grand corruption in public procurement, PhD dissertation
21
Another strand of scholarly work connected to Weber’s ideas is provided by scholars
who assess the administrative capacity of the state, among others, in CEE
(Dimitrova, 2002; Meyer-Sahling, 2011; World Bank, 2006). However, these authors
go beyond the Weberian tradition in that they take into account the developments in
public administration and management which yield additional insights in analysing
contemporaneous public service reforms. In addition, this literature is more explicitly
linked to prescriptions of intergovernmental and governmental institutions such as
the EU or the OECD (OECD, 1998, 1999). The great value of this literature is that it
unravels the internal structure of public administrations and seeks to understand the
dynamics which drive public administration reform. Administrative capacity is
understood as characteristic of the central state bureaucracy, in particular the
presence of (1) the rule of law (i.e. legality, reliability and predictability); (2) openness
and transparency; (3) legal accountability; and (4) efficiency and effectiveness in a
number of domains such as recruitment and career progression (Meyer-Sahling,
2009). Based on this framework , an extensive survey of civil servants in CEE was
conducted which revealed, among others, that much progress achieved until the EU
accession has been reversed and there is a significant implementation gap in the
region, that is apparent deviation between the legal framework and actual practice
(Meyer-Sahling, 2011). In addition, CEE countries are characterized by a mixture of
classical Weberian and New Public Management type bureaucracies where there is
no clear pattern of sequencing these reforms or trajectories towards a common
model (Meyer-Sahling, 2009). While this literature is highly relevant to the detailed
analysis we aim at, its exclusive focus on the central bureaucracy apparently leaves
a great number of critical questions unanswered.
Michael Mann’s analysis of state despotic and infrastructural powers derives
from a long standing interest of sociologists regarding the question who controls
whom in the society (Weiss, 2005). The despotic power of the state denotes the “the
range of actions which the elite is empowered to undertake without routine,
institutionalized negotiation with civil society groups” while the state’s infrastructural
power refers to the “institutional capacity of a central state […] to penetrate its
territories and logistically implement decisions” (Mann, 1984, p. 113). His work has
generated a rich theoretical and empirical scholarship (J. A. Hall & Schroeder, 2005;
Soifer & vom Hau, 2008). This framework differentiates among the central state, its
Mihály Fazekas: Quality of government and institutionalised grand corruption in public procurement, PhD dissertation
22
radiating institutions, and civil society which lends it strong analytical tools (Soifer,
2008). Moreover, it places the emphasis on the relationship between state and
society, i.e. negotiated interdependence (Weiss, 2005), as well as among different
state institutions which highlights to what degree and in what ways the state is
dependent on civil society in implementing its decisions (Soifer & vom Hau, 2008).
Nevertheless, some authors call for clearly delineating the concept of state
infrastructural power from state capacity understood as bureaucratic professionalism
(Soifer & vom Hau, 2008; Ziblatt, 2008) where the former is more related to the
‘street-level bureaucrats’ whose abilities define the overall implementation capacity
of the state; whereas the latter concerns the professionalism of the higher ranking
bureaucrats. Clearly, there is a potential conceptual confusion here as, for example,
it is unclear where the boundary between high and low ranking bureaucrats lies or
why the professionalism of higher ranking bureaucrats doesn’t count towards the
state’s overall implementation capacity. This potentially perplexing distinction can be
resolved by focusing on the different resources the state commands when
implementing its decisions. As the later discussion will show, there is a great merit in
differentiating between the state resources which are directly in the hands of the
state (e.g. professionalism of the bureaucrats, financial resources) and those
resources which it can use, but lie outside its direct control, i.e. relational resources
such as legitimacy and popular support.
In contrast to the above discussed concepts of state capacity, the proposed approach to state capacity focuses on resource endowments of the state while
avoiding issues such as in what ways and to what ends these are actually exercised.
These are much more the domain of corruption, discussed in section 1.3. Such focus
strictly detaches state capacity from outcomes of public action such as effective
policy implementation. The below formulation of state capacity is proposed:
State capacity refers to the state’s – i.e. political leaders, state
bureaucracy and other governmental organisations - capacity to make
decisions and implement them in line with the principle of ethical
universalism.
This definition directly follows from the concept of the quality of government. In order
to avoid using a state capacity definition which is too broad for operationalization,
Mihály Fazekas: Quality of government and institutionalised grand corruption in public procurement, PhD dissertation
23
further break-up of the concept is offered. The point of departure is that in order to
solve any collective action problem a state apparatus has to make decisions,
implement them, and reach consent from the governed (even if it is forced consent)
(Jann & Wegrich, 2007). Thus, state capacity can relate to each of these three core
functions: (1) policy capacity, (2) administrative capacity, and (3) mobilization
capacity (cf. Painter & Pierre, 2005; Polidano, 2000). Loosely following the guidance
of Painter & Pierre (2005) and Polidano (2000), these three concepts are defined
and briefly explained below.
Policy capacity is the state’ ability to marshal the necessary resources to
structure the collective decision making process, coordinate it, and feed
informed analysis into it.
Policy capacity in this framework refers to the domain of politics where decisions are
made in a democratic or otherwise fashion. While the definition does not imply any
normatively desirable or superior mode of decision making it does draw the attention
to the simple fact that any intelligible collective decision making process requires
adequate processes and structures in place which determine which actors at what
point can provide input and which of them have a bigger say in the final decision. In
addition, it also highlights the crucial role of knowledge in the collective decision
making process and the importance of knowledge management (Fazekas & Burns,
2012; Howlett, 2009).
Administrative capacity refers to public and semi-public organisations’
ability to manage effectively their human, ideational, and physical
resources required for implementing collective decisions.
The concept of administrative capacity comes closest to the above enumerated
concepts of ‘Weberianness’, bureaucratic effectiveness, and implementation
capacity. It is important to highlight that effective implementation crucially hinges
upon (1) human resources such as the availability of well-trained bureaucrats who
adhere to the organisation’s goals, the presence of resources for motivation, and
organisational procedures regulating the division of labour; (2) ideational resources
such as reliable and timely statistics and causal theories to support state
intervention; and (3) physical resources such as IT infrastructure and buildings. The
implementation of collective decisions produces the outputs of government activity
Mihály Fazekas: Quality of government and institutionalised grand corruption in public procurement, PhD dissertation
24
ranging from regular provision of public goods, such as schooling and issuing
permissions, to unique projects such as joining the European Union (EU). It is
important to highlight that administrative capacity does involve policy decisions;
however, these decisions are of more practical nature in comparison to the decisions
made through using policy capacity.
Mobilization capacity encompasses the state’s ability to mobilize critical
resources outside the state such as popular support, cooperation, and
knowledge in furtherance of public goals.
Mobilization capacity is explicitly focused on state-society relations among the three
capacity concepts proposed here. While mobilization capacity concerns
implementation of collective decisions just like administrative capacity, it constitutes
the crucial link between state outputs and outcomes by explicitly reflecting on the
role played by society in producing these outcomes and impacts. This role is most
explicit in cases where the state and the society co-produce public goods (Ostrom,
1996). Examples cover a wide range of phenomena from contractual public-private
partnerships to informal cooperation between police and civil society (Joshi & Moore,
2004). The decisive role played by society in producing outcomes is also present in
more traditional areas of public service delivery such as health care or public
procurement. Take for example a public tendering procedure where the state
employing its high administrative capacity announces a highly professional and
adequate tender; however, if the applicant companies decide to collude the received
bids will be excessively expensive and potentially low quality. The crucial resources
which the state needs in order to produce the outcomes in line with collective
decisions lie outside the public domain. These resources are, for example,
legitimacy, popular support, and willingness to cooperate and share knowledge
possessed by societal actors. Clearly, the state has some influence over these
resources, but no direct control.
The three concepts introduced above, i.e. policy capacity, administrative capacity,
and mobilization capacity, are analytically distinct concepts; nevertheless, they
mutually impact each other. Policy capacity and the high level, strategic decisions
made through it define and can redefine the level of administrative and mobilization
capacities. For example, low level of policy capacity may imply that decisions don’t
Mihály Fazekas: Quality of government and institutionalised grand corruption in public procurement, PhD dissertation
25
reflect adequately collective preferences which can directly result in loss of
legitimacy decreasing mobilization capacity. Similarly, administrative capacity
impacts on policy as well as mobilization capacities. An inefficient bureaucracy is
unlikely to support the decision making process with reliable knowledge and is likely
to erode legitimacy of the state. Finally, mobilization capacity feeds back into policy
and administrative capacities. The public’s unwillingness to share information with
the state often constrains the quality of collective decisions and the implementation
ability of the state.
The proposed framework does not offer an easy and straightforward answer to the
question of the level of state capacity or its constitutive elements. The key problem
highlighted by the framework is that the three different capacity concepts interact
with each other hence the framework allows for assigning different levels to each of
the elements depending on the others. This is not surprising as, for example, low
quality laws produced by low level of policy capacity are difficult to implement both
because the administration faces insurmountable interpretation issues and because
implementation has to face with the resistance of the population. It is noted by a
number of authors that low quality regulation often leads to corruption and regulatory
capture as vague rules open the way for discretion and abuse (Hellman, Jones, &
Kaufmann, 2003; Hellman, Jones, Kaufmann, & Schankerman, 2000; Slinko,
Yakovlev, & Zhuravskaya, 2004). On the other hand, increasing policy capacity may
reverse the situation implying that the same amount of administrative resources can
produce different outcomes. Nevertheless, the way forward appears to be more
adequate conceptualization and measurement of each of the three elements in
themselves and as a second step exploring the interactions among them in
producing collective outcomes (Keefer, 2004).
It is recognized that state capacity is at least partially goal-dependent, that is the
level of state capacity depends on the nature of goals and tasks allocated to the
state organisations in question. This also means that there is no such thing as
generally capable state; states are capable in some things while incapable in others
(Oszlak, 2005). To give an example, a classic Weberian bureaucracy may well be
excellent in traditional command and control governance; however, it is most likely to
be inapt for the tasks associated with a transparent, open, and participatory
governance mode where hierarchical relationships, insulation of bureaucracy from
Mihály Fazekas: Quality of government and institutionalised grand corruption in public procurement, PhD dissertation
26
society are disadvantages. This also leads to a genuine problem of cross country
research on state capacity. Because countries define different goals and intervene
into the economy and civil society in different ways the same resources and
structures of different countries are very likely to imply different levels of state
capacity. This problem permeates objective measures of state capacity, but even
more perception based indicators where it appears to be a crucial problem as to
which ‘ideal state’ do respondents compare the actual observed state behaviour
(Kurtz & Schrank, 2007a).
3. What is corruption? Corruption or the lack of it forms the other crucial component of quality of
government. Recall that corruption implies the violation of the impartiality principle for
a reason, that is benefiting a particular group or individual over others. As corruption
is a contested and often ambiguous concept, a brief review of literature is offered
before this thesis’ definition is introduced.
The term corruption is used to cover diverse phenomena in many contexts which
differ in the prevailing norms of good conduct. Hence, many characterisations of
corruption are normatively charged and context-dependent (Johnston, 1996). A
common definition of corruption is “the misuse of public office for private gain” (Rose-
Ackerman, 1978). This definition clearly sets out that corruption is an activity
undertaken by those holding public office and implicitly implies that codes of conduct
for public officials are well-defined along with an established separation between the
public and private spheres. Furthermore, the scholarship based on this definition
predominantly understood corruption within a bureaucratic context and equated
corruption with bribery of public officials. The problem is that Weberian-type
bureaucracy and the underlying rational-legal order may not be present to start with
rendering the definition useless. In addition, it is similarly inadequate to capture
corruption in public positions with high degrees of discretion such as members of
parliament (Warren, 2003).
Nevertheless, the other components of the definition are similarly problematic:
misuse and private gain. “Misuse” attempts to steer scholars away from excessive
legalism, to consider technically legal but otherwise questionable practices. The
obvious question, then, is how to characterise the border between use and misuse,
Mihály Fazekas: Quality of government and institutionalised grand corruption in public procurement, PhD dissertation
27
the answer inevitably depending on the context. “Private gain” works well in the
canonical case of a citizen or firm bribing a petty official to obtain some advantage,
as the bribe money goes in the official’s pocket, but for many other types of
potentially corrupt exchanges, gains may benefit groups spanning through the
public-private boundary rather than a single individual.
A commonly-employed conceptualisation of corruption is the principal-agent
framework which explains the incidence and organisation of corruption (Klitgaard,
1991; Lambsdorff, 2007; Szántó, Tóth, & Varga, 2012). While this framework informs
us of the difficulties faced by a ‘clean’ principal in monitoring her agents in an effort
to prevent their deviation to corruption, there are very few such principals in
systematically corrupt countries such as CEE countries. In fact, obtaining public
office is often the primary means of extracting rents and conducting corruption
(Hellman et al., 2003; Mungiu-Pippidi, 2006). Hence, focusing only on this
relationship, to the neglect of the networks that support a corrupt principal in her
position, misses the key contextual feature sustaining corruption (Rothstein, 2011).
Reflecting on the contested nature of the term corruption and the limited space
available for a theoretical discussion, no generally applicable definition is offered
which would cover all forms of corruption and satisfy all the criticism made against
corruption concepts. Rather, a more feasible and practical route is followed which
clearly identifies the set of actions which are considered to be corrupt or not and the
set of rules which define these, following from the concept of quality of government
already outlined above. Hence,
corruption is understood as a deliberate deviation from the norm of ethical
universalism in order to benefit a particular group or individual in the exercise of
public authority.
Like in the case of our quality of government definition, this formulation of corruption
can only be applied to contexts where universalism as a guiding principle is
established throughout the whole society or at least in a given area of public action.
Once again the potential scope of corruption depends on the scope of the state. This
definition of corruption is also closely related to the idea of social orders where open
versus closed access to public resources plays a central role (North, Wallis, &
Weingast, 2009). This also implies that corruption is crucially about power and
Mihály Fazekas: Quality of government and institutionalised grand corruption in public procurement, PhD dissertation
28
access to the spoils of collective institutions; in other words, one can only talk about
corruption if access should be, at least in principle, open to a wider group of actors,
but it is limited to a few by breaking some established written or unwritten rules.
As in systematically corrupt environments many specific rules may be biased and
constrain open access in spite of a general promise of open access, conflicting rules
represent a major challenge to this understanding of corruption. The simple solution
is that what matters is whether the general principles of universalism and open
access are established irrespective of some lower-order, specific regulations. For
example, if a public procurement law backed by an international treaty stipulates
competition and open access to tenders for all bidders, which is the case for every
EU member state, then using administrative regulations or courts for closing access
to otherwise eligible bidders is considered to be corruption. In this respect, we can
talk about legal corruption. In a similar vein, if the norm of ethical universalism is not
established in a country in general, for example in most developing country contexts,
but development funding is expected to be spent in an open and transparent way,
then corruption can be established with regards to conditions attached to spending
the money rather than the given country’s particularistic traditions at large. However,
if no violation of access occurs, as for example in many health care systems of
Central and Eastern Europe where gratuity payments are pretty much automatic and
expected by both parties, the above definition doesn’t confer the label of corruption.
As corruption is a highly diverse phenomenon, its adequate understanding and
measurement requires it to be broken down into types or kinds with distinct logics
and actor constellations. For the subsequent empirical analysis three characteristics
are key: 1) government function affected (e.g. rule-making or implementation); 2)
level of government engaging in corruption (e.g. low or high); and 3) degree of
institutionalisation (e.g. irregular and occasional or recurrent and institutionalised).
As already noted in section 1.2, the exercise of public authority requires to fulfil three
functions at a most basic level: make decisions, implement them, and reach consent
from the governed (even if it is forced consent) (Jann & Wegrich, 2007). By
implication, three government functions can be corrupted: particularistic collective
decisions (e.g. selling laws); particularistic policy implementation (e.g. unfairly
favouring a friend’s company over others in public procurement); and particularistic
Mihály Fazekas: Quality of government and institutionalised grand corruption in public procurement, PhD dissertation
29
consent to public action (e.g. selling one’s vote in a local construction permit
application procedure) (Karklins, 2005). As public action, controls, and forms of
corrupt rents differ in each of these cases, it is expected that these three types of
corruption would follow divergent logics, hence would need to be analysed with
different tools.
In terms of level of government affected, typically low-level and high-level corruption
are differentiated, where the former refers to the actions of street-level bureaucrats
who deliver public services such as issuing work permits, while the latter refers to
decision making and managerial roles with wider ramifications such as awarding
public procurement contracts (Pardo, 2004). While the distinction between these two
may not always be clear, they display largely different logics primarily driven by the
potential size of rents and different kinds of monitoring mechanisms. High-level or
grand corruption usually involves fewer people and larger sums offering greater
potential for corrupt organisations to evolve.
In terms of the degree of institutionalisation, there are two extremes along this
imaginary scale, one where corrupt transactions occur sporadically between isolated
individuals without any expectation of a repeated transaction, and the other one
where corrupt transactions are recurrent and highly institutionalised with the
expectation of continuation. The point here is not only the number of transactions
between actors, but also the nature of those transactions with their established rules,
roles, and mutually shared expectations. Highly institutionalised corruption borders
with organised crime (von Lampe, 2008), may partially appropriate the state (state
capture), blur the public-private boundary, and create powerful informal institutions
(Grzymala-Busse, 2008; Hellman et al., 2003; Wedel, 2003) often by manipulating
policy implementation such as public procurement (Piga, 2011) and making
corruption look legal (Kaufmann & Vicente, 2005).
Mihály Fazekas: Quality of government and institutionalised grand corruption in public procurement, PhD dissertation
30
Chapter 3 - Framework for measuring institutionalised grand corruption
Measuring corruption in general and institutionalised grand corruption in particular
has been on the agenda for many years by now. Even though there are many
indicators around and quite a few promising developments have arisen, no real
breakthrough has happened yet (Sequeira, 2012). The lack of adequate indicators is
a serious problem both for policy and academic research. As the field is vast, no
review is offered here, instead our novel approach is discussed in detail (for a
detailed discussion of corruption measurement problems see section 4.2).
1. What is measured exactly? In order to harness the large amounts of previously unexploited data and to reflect
the large monetary value and its crucial importance in the functioning of
governments, corruption is measured in the domain of public procurement. As
corrupt rents can be extracted from a range of government activities other than
public procurement such as wages for public employees, sale or renting of public
assets, or regulation, this choice represents a considerable narrowing of the field of
interest. While there may be considerable overlaps and interactions between these
different fields, it nevertheless lends crisp analytical focus to the subsequent
measurement and analytical exercises.
While public procurement corruption can manifest in a diversity of forms, the
subsequent empirical analysis only concentrates on one form in order to focus
attention on corruption which most likely have the widest ramification for democracy,
public goods, and development: institutionalised grand corruption. Hence, the
working definition of corruption adopted is the following:
institutionalised grand corruption in public procurement refers to the
particularistic allocation and performance of public procurement contracts by
bending universalistic rules and principles of good public procurement in order
to benefit a group of individuals while denying access to all others (for a similar
understanding of corruption see: Mungiu-Pippidi, 2006; North et al., 2009;
Rothstein & Teorell, 2008).
Mihály Fazekas: Quality of government and institutionalised grand corruption in public procurement, PhD dissertation
31
2. Core elements of a unique measurement approach The starting point is that neither surveys of corruption nor detailed case studies are
adequate enough for measuring corruption for policy purposes and testing scientific
theories. While these can be part of a wider measurement strategy, harnessing Big
Data, the immensely increasing speed and amount of data created covering virtually
the full spectrum of social life, holds the promise of providing the sought after new
indicators.
By implication, the measurement approach seeks to provide indicators which
• solely derive from objective data describing actor behaviour,
• are defined on the micro level such as individual transactions,
• allow for consistent comparisons across countries, organisations, and time,
and
• rest on a thorough understanding of the corrupt rent extraction process.
This approach requires a combination of qualitative and quantitative methods where
the two works closely together.
While corruption is clandestine, it must leave traces in official records of public
procurement, company ownership, and financial information. As open access, fair
competition, and transparency are prescribed by legal frameworks across every
developed and in many less developed countries, corruption, that is particularistic
limitations on open access, has to pretend that it is fully legal. This characteristic of
institutionalised grand corruption in public procurement creates the opportunity for an
indirect measurement approach following from anomalies of open market
competition. In addition, the competition between corrupt groups and especially the
change of power between them (e.g. which predatory elite group forms government)
create a unique opportunity to identify what is open competition and what is only a
pretence of it.
The proposed measurement approach is general as long as the underlying data is
available and sufficient understanding of each country’s context is warranted. The
data in this thesis only comes from Hungary, Czech Republic and Slovakia which
could be treated as pilot countries for a wider measurement exercise with more
ambitious comparative goals.
Mihály Fazekas: Quality of government and institutionalised grand corruption in public procurement, PhD dissertation
32
While the discussion concentrates on public procurement, the same logic can be
applied to other areas of public spending as long as they are also bidding markets
for distributing public resources. Further examples cover:
• EU subsidies for enterprises,
• Sale of public property,
• Renting out public property, or
• Bidding for public licenses.
3. Overview of the proposed indicators At an abstract level, successful and recurrent rent extraction requires
1. the generation and allocation of rents,
2. vehicle(s) for extracting and transferring rents to the ‘final’ beneficiaries, and
3. controlling the process of rent extraction.
As each of these three functions is necessary for successfully maintaining
institutionalised grand corruption and each of them is likely to leave marks in official
records, it is possible to develop three separate indicators (with two variants for
process control). As indirect indicators of corruption are only approximate and
contain a degree of error, using multiple indicators to characterise the same country,
organisation, or transaction is likely to increase precision. This thesis sets out in
detail only the first indicator, while pointing at the details of the others.
1. Corruption Risk Index (CRI) – generation and allocation of rents
CRI measures the probability that the principle of open access is violated in
the process of awarding and performing public procurement contracts in order
to serve corrupt rent extraction by a select few. In other words, it expresses
the probability of tender issuers pretending that tenders are competitive as
prescribed by law while restricting competition to award contract to a well-
connected bidder recurrently.
CRI is a composite indicator of elementary corruption risk indicators capturing
‘corruption techniques’ such as tailoring eligibility criteria to fit a single
company or using exceptional procedure types to limit openness of
competition. It reflects a corrupt rent extraction logic whereby elementary
Mihály Fazekas: Quality of government and institutionalised grand corruption in public procurement, PhD dissertation
33
corruption techniques are systematically used for restricting access and
recurrently benefiting the same winner.
CRI is constructed in three steps: 1) A long list of elementary corruption
indicators is identified (30+ indicators) which are proven to indicate corruption
in some cases using qualitative methods (see chapter 3). 2) Those indicators
are selected from the long list which prove to be systematically linked to
restricted access as captured by a single bidder contract as well as to
recurrent contract award to the same company as captured by winner contract
share over 12 months. Regression analysis controlling for alternative
explanations such as market specificities and low state capacity are used for
identifying such indicators (see chapter 4). 3) Selected elementary corruption
risk indicators are weighted by reflecting their strength in predicting lack of
competition and recurrent contract award (see chapter 4).
While CRI is defined on the level of individual public procurement tenders it
can also be aggregated to characterise organisations, markets, or countries
over time.
2. Winner Company Risk Index (WRI) - vehicle for extracting and transferring
rents
WRI measures the probability that a company is predominantly used for
extracting and transferring corrupt rents earned in public procurement. While
any company winning a public procurement contract can be used for
extracting rents, even the most established and well-regarded companies,
those companies whose primary purpose is rent extraction will differ from
other companies in their industry. Such differences can be the short period
between company incorporation and winning in public procurement or
unusually intransparent ownership structure. Hence, WRI is a composite
indicator of elementary company risk indices.
WRI is constructed in three steps similar to CRI: 1) A long list of elementary
company risk indicators5 is identified which are proven to indicate corruption
5 While this indicator is the least well developed in the thesis, an initial list is offered which will form the basis of creating a more complete list: 1) time between incorporation and winning public procurement contract, 2) time between winning public procurement contract and bankruptcy, 3) total annual public procurement contract value per total annual turnover, 4) total annual public procurement contract value per employee, 5) ownership transparency (i.e. country company registration risk score and amount of missing information), 6) company seat risk (i.e. large number of companies on the
Mihály Fazekas: Quality of government and institutionalised grand corruption in public procurement, PhD dissertation
34
for some companies using qualitative methods. 2) Those indicators are
selected from the long list which prove to be systematically linked to high
corruption risks using CRI, PII, and PCI (for the definition of the two latter
indicators see below). Regression analysis controlling for alternative
explanations such as market specificities and low state capacity are used for
identifying such indicators. 3) Selected elementary corruption risk indicators
are weighted by reflecting their strength in predicting corruption.
While WRI is defined for individual companies, it can be aggregated to the
level of markets, public organisations, or countries, for example by taking the
average WRI of companies winning contracts on a market, from a public
organisation, or in a country.
3.1 Indicator of political interference on public procurement markets (PII) –
controlling the process of rent extraction
PII indicates whether a company’s success on the public procurement market
depends on the political group in power at the national or local level. Such
companies are identified by the change in total company contract volume from
before to after government change. Those companies are designated as
politically connected companies whose change in market share cannot be
explained by standard economic explanations of market success such as
main market or prior investment and whose deviation from the standard
economic explanatory model is very large6.
Political connections identified in such an indirect way signal that a company
is tied to hence, at least partially, controlled by political groups prone to
corruption. In this sense, does PII indicate the political control of rent
extraction. However, it does not indicate whether it is politics which captures
business or the other way around.
While PII indicates companies’ indirect political connections, it can also be
used for characterising markets, organisations, or whole countries. The
simplest way to do so is to divide the total contract value earned by politically
same address and risk score of the other companies on the same address), and 7) failing to file annual balance sheet. 6 The meaning of very large gets concrete quantitative meaning when ‘normal’ years, that is periods without change of government are compared with the period of government change; or when municipalities where there was no change of local government are compared with municipalities where there was.
Mihály Fazekas: Quality of government and institutionalised grand corruption in public procurement, PhD dissertation
35
connected companies by the total contract value of the market, organisation,
or country.
3.2 Indicator of political control of public procurement contractors (PCI) -
controlling the process of rent extraction
PCI measures whether a public procurement winning company has direct
political connections. Political connections are identified by checking whether
each winning firm’s owners and managers held or still hold a political office
where political office is broadly defined as elected national and local
representatives and high-level appointed public officials such as supreme
court judges or heads of national police force.
Political connections identified in such a direct way signal that a company is
tied to hence, at least partially, controlled by political groups prone to
corruption. In this sense, does PCI indicate the political control of rent
extraction. However, it does not indicate whether it is politics which captures
business or the other way around.
While PCI indicates companies’ direct political connections, it can also be
used for characterising markets, organisations, or whole countries. The
simplest way to do so is to divide the total contract value earned by politically
connected companies by the total contract value of the market, organisation,
or country.
4. The issue of validity Clearly, none of the four proposed indicators indicate institutionalised grand
corruption directly. However, they are designed so that they signal the likelihood of
institutionalised grand corruption to occur. Unfortunately, in systematically corrupt
environments, we cannot rely on courts to validate our indicators: first, because they
are highly likely to fail to uncover and prosecute most of the corruption cases (i.e.
problem of false negatives); second, because they are also likely to hand out biased
judgements serving political purposes (i.e. problem of false positives). By implication,
the validation of indicators has to rely on alternative methods. We propose four
procedures of validation:
1) Internal validity confirmed by the set-up of indicators themselves such as the
clarity of indicator building logic, the richness of qualitative evidence
supporting components of each indicator, and the quality or regression
Mihály Fazekas: Quality of government and institutionalised grand corruption in public procurement, PhD dissertation
36
models used for singling out corruption from other phenomena such as state
capacity or market specificities.
2) External validity established by the co-variation between the four lead
indicators which is expected to be only moderately strong as they indeed
capture different aspects of the corrupt rent extraction process in public
procurement with their divergent flaws. Nevertheless, no co-variation would be
a strong argument against validity. It must be noted that WRI is devised
exactly through exploiting the correlation between its elementary indicators
and the three other lead indicators. Hence, constructing WRI satisfies this
condition by definition.
3) External validity indicated by further indicators such as company productivity
(Cole & Tran, 2011) or institutional integrity measures (Szente, 2011). While it
is possible to check the proposed ‘objective’ indicators of institutionalised
grand corruption against widely used survey measures such as government
favouritism (World Economic Forum, 2010), it is expected that the difference
in indicator scope and quality may lead to little to no correlation.
4) External validity demonstrated by well-documented cases is a tempting route
to validation; however, due to weaknesses of courts in systematically corrupt
environments, case selection may render such an exercise very difficult or
impossible. However, contrasting organisations of very high corruption risks
with those of very low risks using a thick qualitative account may deliver a
valuable validity test.
The below thesis discusses validity tests 1-3, but it remains for further research to
carry out validity test nr. 4.
The proposed validity tests must be understood only as indications of retrospective
validity because the problem of reflexivity is particularly troubling in corruption
research. This means that validity can be established in retrospect, but corrupt
groups are likely to respond to changes in monitoring technology and detection
probabilities. Hence, as soon as any of these indicators is used for monitoring
corruption at large, indicator validity is expected to deteriorate due to efforts of
corrupt actors to better hide their actions. This means that further refinements, also
including the incorporation of further variables (role of regulator to constantly
increase transparency!), are necessary for the indicators to remain valid.
Mihály Fazekas: Quality of government and institutionalised grand corruption in public procurement, PhD dissertation
37
Part II – Empirical results
Mihály Fazekas: Quality of government and institutionalised grand corruption in public procurement, PhD dissertation
38
Chapter 4 - Corruption manual for beginners: “Corruption techniques” in
public procurement with examples from Hungary7
1. Introduction
While there have been recent advances in measuring and understanding petty or
low-level corruption (e.g. Charron, Lapuente, & Rothstein, 2013; Rose & Peiffer,
2012), research into grand or high-level corruption8 has remained underdeveloped in
the last decades. This is in large part due to the lack of data. In order to advance
research as well as evidence based policy, reliable indicators are needed to gauge
the structure and the magnitude of grand corruption. Data based on perceptions and
formal institutional structures are plentiful, but these have not proven particularly
useful in unearthing the mechanisms creating and sustaining grand corruption. The
only way forward is to understand the micro-level context of grand corruption in
particular fields of government activity such as public investment, law-making, or
issuing permits and licenses and to develop qualitative and quantitative indicators
based on a thorough understanding of the corruption process.
Below, technologies of grand corruption in public procurement are described and
corresponding quantitative indicators are developed which directly or indirectly signal
their use. What we call corruption techniques are techniques used by corrupt actors
to make their corrupt, often illegal, acts look legal and to hide their actions from the
eyes of the public. For example, making competition for a public contract look fair
and open whereas the winner and the contract value were already agreed before the
launch of the tendering process. Each corruption technique is described in abstract
terms by outlining its characteristic elements, the actors’ reasons for resorting to it,
the constraints on application, and some real-life examples as reported by the
media, the courts, or our interviewees. The list of these techniques which is far from
complete, can nevertheless be considered as novel scientific result in itself.
However, the main rationale for their structured discussion is to provide solid
theoretical and methodological ground for quantitative indicators of grand corruption.
7 Some of the research underlying this chapter has been conducted in collaboration with István János Tóth from the Corruption Research Center Budapest. 8 Grand corruption (or state capture) refers to societal actors’ institutionalized and particularistic influence over public rule formation or policy implementation through private payments or favours.
Mihály Fazekas: Quality of government and institutionalised grand corruption in public procurement, PhD dissertation
39
These techniques can be considered as the input side of the public procurement
corruption process where the output side is the collection of rents by the ‘right’9
organisations and individuals. We intend to define the list of indicators as
comprehensively as possible because techniques can be used interchangeably and
in combination making the measurement quality of overall corrupt activities ultimately
dependent on the adequacy of this list.
Corruption techniques are grouped by referring to the different stages of the public
procurement process (see section 2.2) in order to highlight the interdependencies
between them and to emphasize the process, flow character of such corruption
instead of a static understanding. It is important to keep in mind that grand corruption
is institutionalized, recurrent, and mobilizes considerable collective resources so
elementary techniques must be seen as parts of a larger corrupt process. Each
corruption technique involves violation of principles of good public procurement in
order to achieve corrupt benefits even if narrowly defined laws and regulations are
not infringed upon. While there are many possible errors and deviations from good
public procurement principles (European Court of Auditors, 2012), what makes the
below corruption techniques intertwined with grand corruption is that they are
typically used by corrupt groups to hide and legalize their actions. That is, the below
list only contains those techniques which are reportedly employed by such groups as
described by the media, courts, academic literature, and interviewees in Hungary.
Hence, techniques and actions which may simply result from administrative error and
incompetence are not discussed in this section as they cannot be reliably linked to
grand corruption.
When defining individual techniques we followed the simple rule that each of them
should be able to lead to corrupt rent extraction on its own if applied skilfully. This
enabled us to identify the elementary building blocks of more complex corrupt
strategies whose exact composition changes over time as regulation changes.
Moreover, in practice, elementary techniques are typically combined with each other
and various degrees of complementarities and substitutions exist among them (e.g.
9 Throughout this paper, the terms ‘right’, ‘desired’, or ‘wanted’ organisation refers to those organisations who form part of corrupt networks and are deliberately benefiting from corrupt rent allocation. A prime example is a company owned by the cousin of the mayor winning procurement contracts from the municipality in question.
Mihály Fazekas: Quality of government and institutionalised grand corruption in public procurement, PhD dissertation
40
once all the ‘unwanted’ bidders are excluded on administrative grounds there is no
need for subjectively applying award criteria to ‘unwanted’ bidders).
The below listed techniques are explained from the viewpoint of tender issuers
which, nevertheless, does not indicate that it has to be the issuer who initiates the
corrupt transaction or that the issuer possesses all or most of the knowledge
necessary for managing the corrupt transaction. Taking the perspective of the issuer
simply acknowledges the fact that it is the issuer who, at the end of the day, has to
formally manage the process of public procurement. Interviews indicated that the
initiation of the corrupt exchange or de facto management may very well be done by
a powerful and well-connected company or a politically supported public
procurement adviser. For example, the head of public procurement department of a
major construction company reported: “I wrote the full tender documentation myself
which was subsequently sent out to all bidders.”.
As we look at grand corruption and state capture primarily as resulting from collusion
between some public and private actors, only those techniques of corruption are
discussed below which involve or require the deliberate collaboration of the issuer,
even though it may well be that multiple bidders take part in the corrupt transaction
(e.g. the politically connected winning bidder pays off 2-3 other companies to mimic
competition). By implication, cartels and likes involving bidders only are not part of
the discussion.
In order to identify as complete and reliable list of corruption techniques as possible
a number of data collection methods were used in Hungary:
• the small body of academic literature was screened, including secondary
analysis of interviews done by other researchers,
• a review of media reports of concrete corruption cases was conducted,
• original interviews were carried out with public procurement practitioners who
have seen corrupt transactions close up, and
• some court cases relating to public procurement corruption were reviewed.
First, we reviewed the small body of directly relevant academic literature of the last
10 years looking at corruption involving public procurement in Hungary and
international research papers specifically looking at public procurement corruption.
Mihály Fazekas: Quality of government and institutionalised grand corruption in public procurement, PhD dissertation
41
This literature collected data by interviews, surveys and media reviews; in addition, a
few papers made use of administrative data and court cases. As the literature is
small, standard keyword searches yielded very few documents, hence our search
strategy largely relied on exploring the bibliographic network of key publications. The
literature review combined with our own ideas spawned the initial list and definitions
of corruption techniques further refined by additional data collection.
Second, the review of media reports covered all major online newspapers of
Hungary such as www.index.hu, www.origo.hu, www.fn.hu, www.mno.hu,
http://vg.hu, http://hetivalasz.hu, www.nol.hu, http://hvg.hu, and www.hir24.hu which
together cover the whole political spectrum from the left to the right. Many of these
have a print edition too, but our review was constrained to the online material which
is mostly equivalent or even more extensive than the print version. The time period
of systematic analysis was between 1/1/2008 and 1/8/201210, but further articles are
also included from later dates if they were brought to our attention. Due to technical
issues with newspaper archives there was some random variation in the
completeness of our sample, that is some months are missing from the sample.
However, this doesn’t weaken the analysis as the goal is to find examples rather
than establish the prevalence of certain techniques in the press. Among all the
articles of these online newspapers, we initially selected those that contained any
keywords associated with corruption (concrete list of keywords can be found in
Appendix 4A). In a second step, from this large sample of articles, we identified
those which discussed a corruption case in public procurement in detail (i.e. simply
stating that this and this contract award was corrupt and benefited this and this
individuals was not good enough for selection). In the final step, this short list of
articles was checked again by the authors and were categorised according to a pre-
defined initial list of corruption techniques. Based on articles describing techniques
beyond our initial list, new corruption techniques were defined leading to a list
covering all the articles in the sample. The results of the media review can be found
in Appendix 4A.
Third, interviews with public procurement practitioners ‘close’ to corrupt transactions
were carried out to explore the underlying rationale of each corruption technique,
10 In the case of http://hvg.hu and http://vg.hu we only had the online content starting from 1/11/2010.
Mihály Fazekas: Quality of government and institutionalised grand corruption in public procurement, PhD dissertation
42
gather specific examples (without concrete names), verify whether the techniques
are typically used in corrupt transactions, and to identify additional corruption
techniques. We conducted semi-structured interviews lasting for about 1-1.5 hours
with 14 individuals covering all three major actor categories of public procurement
(issuers, bidders, and advisors). They work in construction, healthcare, and IT
services sectors taking part in projects ranging from large infrastructure projects of
millions of EUR to small services contracts of few thousand EUR. In all but one case,
the interviewees either referred to concrete cases they saw from ‘close’ or described
the suitability of a corruption technique in general to reach corrupt goals based on
their experience. Given the sensitive nature of the topic, interviewees avoided
explicitly mentioning names of individuals or companies. The interview evidence
formed the basis on which the final list of corruption techniques was further refined.
Finally, there have been about 600-700 convictions per year by Hungarian courts on
the basis of corruption charges between 1990 and 200911 and more than 1500
Hungarian court decisions mentioning “public procurement” since 200512. While we
could already obtain the text of court decisions, it requires additional work to
systematically categorize and check these cases against the below list of corruption
techniques. In addition, decisions of the European Court of Justice should also be
screened and analysed to cover the full spectrum of judicial review of public
procurement in Hungary. We only look at the documents referring to high profile
court cases that were reported by the press.
11 For annual figures and details of case identification see: http://www.crc.uni-corvinus.hu/download/korrupcios_buncselekmenyek_1972_2009_100428.xls 12 http://www.birosag.hu/engine.aspx?page=anonim
Mihály Fazekas: Quality of government and institutionalised grand corruption in public procurement, PhD dissertation
43
2. Principles and models of good public procurement At the heart of grand corruption in public procurement lies the simple fact that public
procurement legislation in the EU and Hungary in particular prescribes basic
universalistic principles which must be violated in order to collect the corruption
rents. As grand corruption may very well succeed in appearing legal according to the
detailed regulations covering public contract award, it is the underlying general
principles which define clearly what is corrupt and what is not.
Thus, below we outline the underlying principles of good public procurement and
define a simple abstract model of procurement activities allowing for grouping of
corruption techniques. Each of the corruption techniques and the corresponding
indicator relates to a specific public procurement activity and an underlying principle
whose breach implies corruption.
2.1 Principles of good public procurement While there is a multitude of principles of good public procurement in the academic
and policy literatures as well as in EU and national laws, there are considerable
overlaps among them paving the way for a synthesis valid for the last 10 years (i.e.
about 2002-2012) (Arrowsmith, 2009, 2010 ch. 1. OECD, 2007; Transparency
International, 2006). While many of the principles in the literature relate to actual
outcomes of public procurement such as efficiency of spending, our focus
exclusively lies in the process of public procurement in order to aid later discussions
of corruption techniques employed during procurement procedures.
The principles relating to the process of public procurement directly derive from the
ideas of public sector integrity and impartial government creating the link between
the general discussions of corruption and state capacity and the domain of public
procurement. Hence, good public procurement rests on three principles which
mutually support each other:
• Transparency,
• Fair competition13, and
• Accountability. 13 Even though fair competition also applies to the absence of collusion among bidders, this aspect is deliberately left aside in order to concentrate attention to corruption and the private-public nexus. There is evidence that corruption and collusion tend to go together, even though they are distinct phenomena (OECD, 2010b).
Mihály Fazekas: Quality of government and institutionalised grand corruption in public procurement, PhD dissertation
44
The principle of transparency means that information about public procurement
should be readily available in a precise, reliable, and structured form for the public as
a whole or its representatives (Kovacic, Marshall, Marx, & Raiff, 2006; OECD, 2007;
Soreide, 2002). Transparency should concern all the information pertaining to the
public procurement process and outcomes such as general laws, regulations, judicial
decisions, administrative rulings, procedures and policies on public procurement,
statistics on procurement activities, and individual procedures and award decisions.
While excess transparency may harm competition (e.g. disclosure of commercially
sensitive information), transparency in Hungary is generally considered to be too
restricted rather than too extensive (Freedom House, 2012; Tóth & Márkus, 2010).
The principle of fair competition means that potential bidders should have equal
opportunities for participation, contract award decisions should be impartial, and that
public procurement rules should be applied equally to all contractors (Arrowsmith,
2009). That is, fair competition implies a level playing field for every potential and
actual competitor. In general, decision making procedures should be rule-bound
whereby every rule is transparently accessible to potential and actual bidders.
Naturally, bidders may be treated differently if reasonable justification for such
treatment is specified prior to the procedure. However, this discretion should also be
exercised in an accountable manner.
The principle of accountability means that issuing authorities and their officers, public
procurement advisors, and bidder companies and their employees should be held
accountable for their actions according to their pre-defined duties and tasks
(European Bank for Reconstruction and Development, 2011; Transparency
International, 2006). Accountability primarily refers to 1) effective mechanisms and
capacity for internal control and audit; and 2) effective mechanisms for filing
complaints and challenging public procurement decisions. Accountability is also
essential for ensuring fair competition. As accountability mechanisms are typically
very costly both for the state and the bidding companies, balance between costs and
benefits of accountability systems must be struck.
Institutionalised grand corruption in public procurement, therefore, implies that some
or all of these principles are systematically and recurrently breached in the conduct
Mihály Fazekas: Quality of government and institutionalised grand corruption in public procurement, PhD dissertation
45
of procurement by some actors in order to obtain unfair benefits in competition and
contracting (e.g. higher than market price).
The above should make it clear that the definition of grand corruption employed here
may or may not imply breaking any laws as defined by Hungarian courts and law-
makers. While at the level of principles our definition and the legal definition perfectly
matches, actions deemed corrupt according to our definition may seem completely
lawful in light of the detailed prescriptions of public procurement and related laws.
For a transaction to be deemed corrupt here, neither bribery nor coercion is a
necessary condition (Jancsics & Jávor, 2012; Szántó & Tóth, 2008).
2.2 Standard model of public procurement The standard model of public procurement enumerates the major actors and defines
the key phases of the process in order to allow for a structured discussion of
corruption techniques.
Public procurement requires interaction among three major actors while there is a
range of external actors intervening under some circumstances (Transparency
International, 2006). The three actors internal to the public procurement process are
1) issuers of tender, 2) public procurement advisors or brokers, and 3) bidder
companies. There are external actors within the state such as 4) politicians who can
also take on senior civil service positions; and 5) review bodies such as courts, state
audit institutions, and competition agencies. The external actors outside the state are
the 6) media and 7) the civil society.
The academic and policy literature identifies four major phases of the public
procurement process spanning from the identification of organisational need up until
the implementation and conclusion of the contract (Byatt, 2001; Piga, 2011; Thai,
2009; Transparency International, 2006; Várday, 2005).
1. Needs assessment;
2. Process design and document preparation;
3. Tender evaluation and award decision; and
4. Contract implementation and management.
The needs assessment phase involves determining the object and quantity of the
procurement task in line with the organisation’s needs. The process design and
Mihály Fazekas: Quality of government and institutionalised grand corruption in public procurement, PhD dissertation
46
document preparation phase translates the decisions of the previous phase into the
specific context of public procurement according to national laws and the
organisation’s own regulations (e.g. drafting the text of call for tenders). During the
tender evaluation and award decision phase the bids are assessed according to the
pre-defined criteria and contract is concluded with the winning bidder. The contract
implementation phase encompasses all the activities which relate to managing and
monitoring the implementation of the contract and its modifications.
The main decision points and steps of the public procurement process are
highlighted in Figure 4 together with indications of officially available data in
Hungary. The figure makes it clear that the only phase where there is no official data
in the Public Procurement Bulletin is the needs assessment phase. Hence, our
indicators won’t cover these, quite important, aspects of public procurement, for
example corruption may arise during planning a road construction project which
otherwise is lawfully executed when the road unfairly benefits some who happen to
own land along the planned path (Tanzi & Davoodi, 1997). While, corruption
techniques can be mapped on to each step of the public procurement process (see
section 4), it is suggested that they are typically used in concert to achieve the
desired particularistic decision highlighting the important difference between official
steps and procedures and informal decisions and power relations.
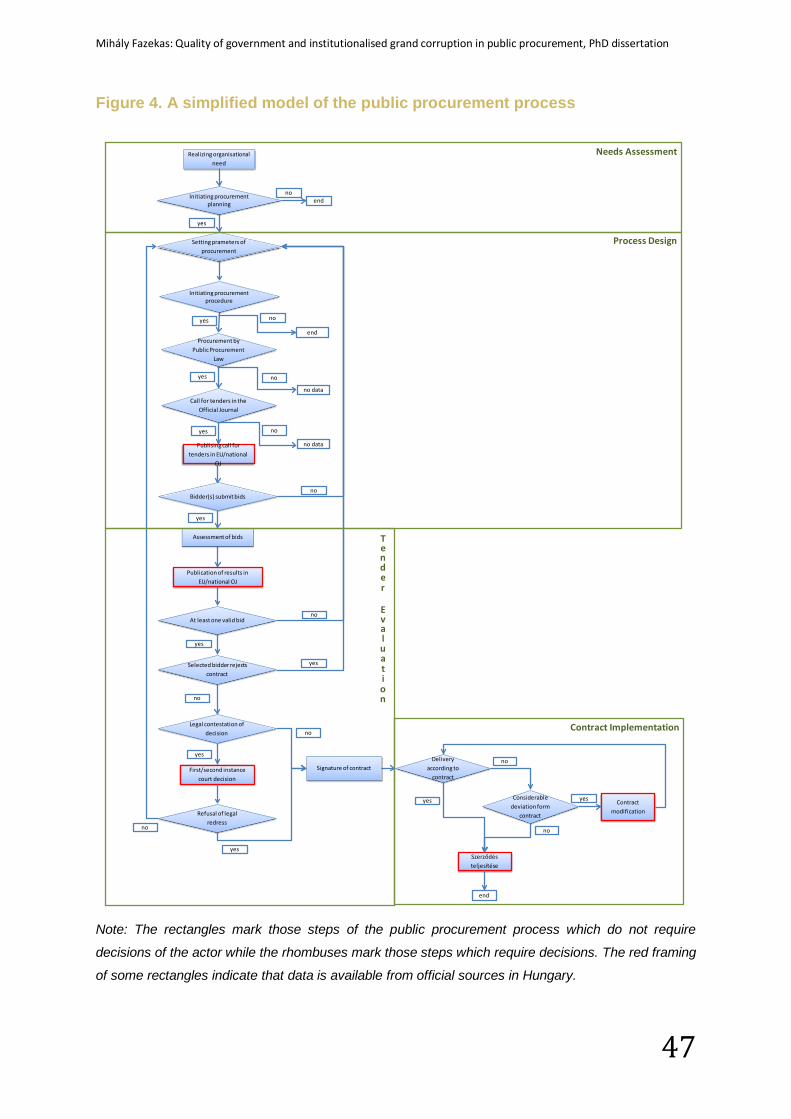
Mihály Fazekas: Quality of government and institutionalised grand corruption in public procurement, PhD dissertation
47
Figure 4. A simplified model of the public procurement process
Note: The rectangles mark those steps of the public procurement process which do not require
decisions of the actor while the rhombuses mark those steps which require decisions. The red framing
of some rectangles indicate that data is available from official sources in Hungary.
yes no
Setting prameters of procurement
Publising call for tenders in EU/national
OJ
Procurement by Public Procurement
Law
no data
Call for tenders in theOfficial Journal
yes
no data
no
Bidder(s) submit bids
yes
no
At least one valid bid
Publication of results in EU/national OJ
yes
no
Selected bidder rejects contract
yes
no
Signature of contract
Legal contestation of decision
yes
no
Deliveryaccording to
contract
yes
noFirst/second instance
court decision
Contract modificationRefusal of legal
redress
yes
no
Szerződésteljesítése
Considerabledeviation form
contract
yes
no
Realizing organisational need
Initiating procurementprocedure
Assessment of bids
Initiating procurement planning end
yes
no
end
yes no
end
Needs Assessment
Process Design
Tender
Evaluation
Contract Implementation
Mihály Fazekas: Quality of government and institutionalised grand corruption in public procurement, PhD dissertation
48
3. The data The database used for developing the quantitative indicators corresponding to
individual corruption techniques derive from Hungarian public procurement
announcements from between 2009-2012 (e.g. individual contracts, calls for tender,
court rulings on the decisions) (this database is referred to as PP henceforth).The
data represent a complete database of all public procurement procedures conducted
under national Public Procurement Law in Hungary. As already highlighted in Figure
4, among the different steps of any public procurement procedure there is a legal
obligation to publish i) call for tender in most cases, ii) contract awards in every case,
iii) modification of contract in every case, iv) completion of contract in most cases
(the obligation ceased as of 1/1/2012), v) results of legal proceedings in every case
(e.g. court decisions regarding contract awards), and vi) errors and corrections of
previous announcements in every instance. Our database contains most of the
variables regularly appearing as required by law in each of these announcements
such as the name and address of the winner company or the contract value.
The place of publication of these documents is the Public Procurement Bulletin
which appears on a weekly basis and is accessible online14. For this publication, the
Hungarian Public Procurement Authority maintains a homepage where online
announcements appear and a database supporting publication. Unfortunately, the
Authority was unwilling to share its data with us (and it has also been unwilling to
share its data with other key public institutions such as the Hungarian Competition
Authority as our interview evidence indicates). By implication, we downloaded all the
announcements available online mainly in html sometimes in pdf format. Then these
texts became the source of our structured database which contains variables with
clear meaning and well-defined categories. As the original texts available online and
most likely the underlying database of the Hungarian Public Procurement Authority
contain a range of errors, inconsistencies, and omissions we applied several
correction measures to arrive at a database sufficient quality for quantitative analysis
(detailed account of data cleaning procedures can be found in Hungarian in Fazekas
& Tóth (2012a) and in English with somewhat less detail in Fazekas & Tóth (2012b)).
14 See: http://www.kozbeszerzes.hu/nid/KE (in Hungarian)
Mihály Fazekas: Quality of government and institutionalised grand corruption in public procurement, PhD dissertation
49
A major limitation of our database is that it only contains information on public
procurement cases under the Hungarian Public Procurement Law as there is no
central depository of other contracts. This law defines minimum estimated contract
value for its application depending on the type of announcing body and kind of
products or services to be procured (for example, from 1 January 2012, classical
issuers have to follow the national regulations if they procure services for more than
8 million HUF or 27 thousand EUR). Some public organisations can be rather
resourceful in circumventing the law if they find it in their interest (e.g. slicing up
contracts so that the parts are under the threshold, or resorting to special
exemptions). This is indicated by, for example, the gap between the OECD’s
estimation of public procurement in Hungary based on aggregate budget data: 20%
of the GDP (2008)15 (OECD, 2011) and the amount of public procurement carried
out under the Public Procurement Law: 7% (2008) (Hungarian Public Procurement
Authority, 2009).
Having data only on larger and more heavily regulated public procurement results is
an obviously biased sample of all public procurement contracts. Larger contracts are
rarer events than the rest of public contracting which limits the quantitative scope of
our analysis. They are also more demanding administratively not only simply due to
their sheer size, but also because of stricter regulations. Most importantly,
procedures carried out under the Public Procurement Law are heavily regulated in
terms of transparency (e.g. format and organ of announcements) and fairness (e.g.
nature of award criteria or time available for tendering). While these regulations may
well be flawed in a range of ways they definitely increase the cost of corruption.
Moreover, larger contracts imply larger potential benefits from corruption. Hence, our
sample of all public contracts is biased towards more costly and more high stakes
corruption which indicates that any analysis of such data can be indicative only of
grand corruption and state capture rather than petty corruption.
Contract award notices represent the most important part of a procedure’s life-cycle.
For each procedure under the Hungarian Public Procurement Law, at least the
contract award announcement has to be published. Thus, we show some elementary
statistics relating to contract awards in order to provide an overview of the data. Out
15 Even though it must be noted that the OECD’s estimation is an upper bound estimate.
Mihály Fazekas: Quality of government and institutionalised grand corruption in public procurement, PhD dissertation
50
of the 84085 awarded contracts announced in the Hungarian Public Procurement
Bulleting throughout 2009-2012 only 53272 were analysed in most calculations due
to five distinctive, but sometimes overlapping reasons (Table 1):16
1. Repetitions,
2. Corrections,
3. Unsuccessfulness,
4. Cancellations, and
5. Framework contracts.
First, Hungarian announcements above the EU threshold have to be published both
at the Journal of the European Union (TED) and the Hungarian Public Procurement
Bulletin. However, for reasons unknown to the authors, the announcements
appearing in TED also appear according to a special format in the Hungarian Public
Procurement Bulletin. This leads to duplication of announcements with only slightly
different information content (e.g. announcements in TED don’t contain the names of
bidders who lost, whereas notices in the Hungarian Public Procurement Bulletin do).
In order to avoid double counting and retain maximum possible information content
we excluded all the contract award notices appearing originally in TED and
reappearing at the Hungarian Public Procurement Bulleting too. Second, those
announcements which were later corrected by a full, repeated announcement were
also excluded from our sample for most analyses.17 More work is needed on this
aspect as corrections are not referenced in a standardised fashion in many cases.
Third, those announcements or parts of announcements which were contract award
notices, but awarded no contract were also excluded. Unsuccessfulness or invalidity
are explicitly marked in the announcements; however, as there was no name of
winner in a great number of announcements, it is unclear if these are actually invalid 16 In fact, we should extend our data with one sample referring to centralised procurement whereby issuers don’t procure on their own rather through a centralised body. Unfortunately, we don’t yet have detailed data on who bought what and how much from this central public procurement body. For the moment, we account for centralised procurement as one other issuer without knowing the details of the flows of goods and services between individual issuers and the central body. Data acquisition is in progress. 17 As many corrections don’t appear completely anew, rather a specific correction is published that explains which parts of the original announcement were wrong and what the correct information is, we inputed the correct data to the corrected announcements. This introduces a slight bias to our sample as correct information appears to be available in our data earlier than it was in fact for the public. As this only concerns 132 contract award announcements, we consider this to be of relatively minor importance (there are additional corrections for other types of announcements which we still need to take into account).
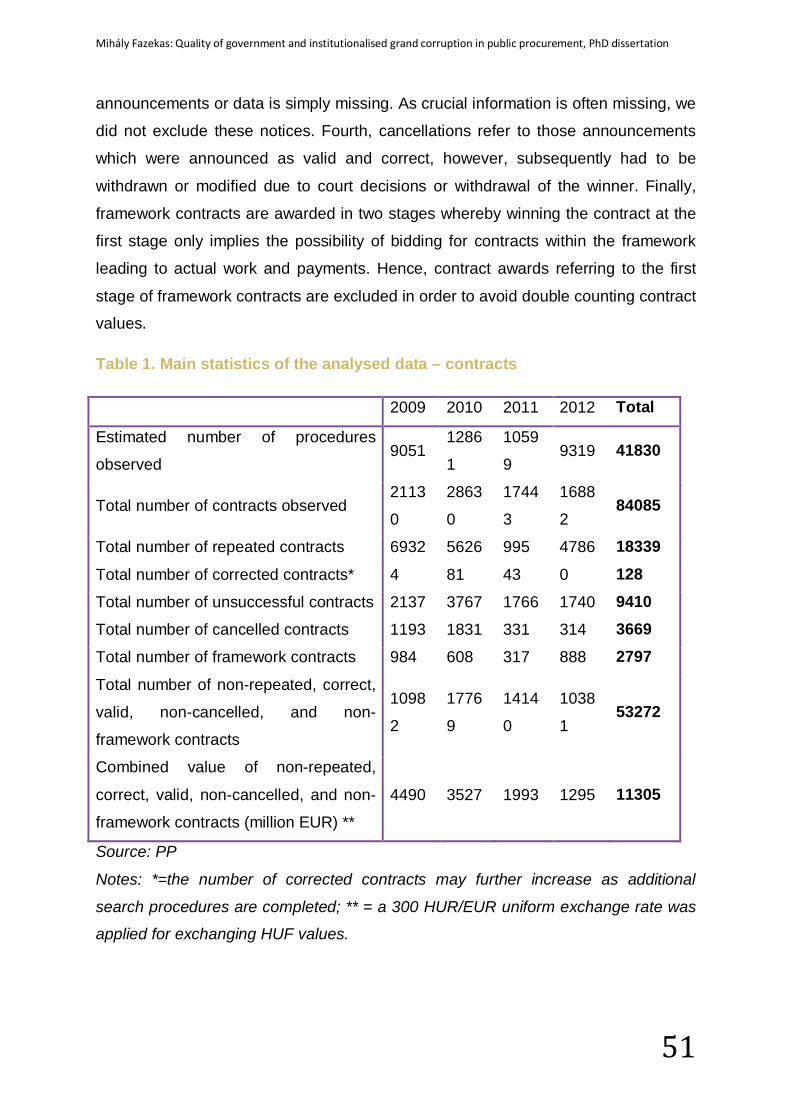
Mihály Fazekas: Quality of government and institutionalised grand corruption in public procurement, PhD dissertation
51
announcements or data is simply missing. As crucial information is often missing, we
did not exclude these notices. Fourth, cancellations refer to those announcements
which were announced as valid and correct, however, subsequently had to be
withdrawn or modified due to court decisions or withdrawal of the winner. Finally,
framework contracts are awarded in two stages whereby winning the contract at the
first stage only implies the possibility of bidding for contracts within the framework
leading to actual work and payments. Hence, contract awards referring to the first
stage of framework contracts are excluded in order to avoid double counting contract
values.
Table 1. Main statistics of the analysed data – contracts
2009 2010 2011 2012 Total
Estimated number of procedures
observed 9051
1286
1
1059
9 9319 41830
Total number of contracts observed 2113
0
2863
0
1744
3
1688
2 84085
Total number of repeated contracts 6932 5626 995 4786 18339
Total number of corrected contracts* 4 81 43 0 128 Total number of unsuccessful contracts 2137 3767 1766 1740 9410 Total number of cancelled contracts 1193 1831 331 314 3669 Total number of framework contracts 984 608 317 888 2797
Total number of non-repeated, correct,
valid, non-cancelled, and non-
framework contracts
1098
2
1776
9
1414
0
1038
1 53272
Combined value of non-repeated,
correct, valid, non-cancelled, and non-
framework contracts (million EUR) **
4490 3527 1993 1295 11305
Source: PP
Notes: *=the number of corrected contracts may further increase as additional
search procedures are completed; ** = a 300 HUR/EUR uniform exchange rate was
applied for exchanging HUF values.
Mihály Fazekas: Quality of government and institutionalised grand corruption in public procurement, PhD dissertation
52
4. “Technologies” of corruption This section discusses each corruption technique and the corresponding indicators
(note that some indicators relate to multiple techniques). Discussion follows a simple
structure in each case: underlying rationale for using the technique, the principle of
good public procurement breached, control mechanisms, some real-life examples,
and indicators. Techniques are grouped according to the four major phases of the
public procurement process (process design and document preparation are put
under different headings in order to avoid any single heading containing too many
techniques).
Indicators are formulated in a way that they are as closely associated with the
underlying corruption technique as possible. However, there are complex non-
linearities in the relationship between corruption and procurement characteristics so
in many cases further refinement will be necessary through linking indicators to each
other and potentially corrupt outcomes.
As the present discussion takes the viewpoint of tender issuers, the indicators
primarily aim at capturing organisational behaviour (i.e. choices made by individual
organisations) rather than meso- to macro level influences such as complexity of
technology or investment projects of particular markets. Hence, in cases where
strong market-level influences are suspected (e.g. complexity of technology is likely
to impact heavily on complexity of eligibility criteria), the indicators are adjusted to
reflect deviations from the market mean. While this focuses the indicator on
organisational decisions, it also impedes cross-market comparisons. Thus,
corruption risks emanating from the fact that an organisation operates on a particular
market are downplayed even though they may be powerful contributing factors to its
overall corrupt behaviour.
4.1 Needs assessment and definition
T1.1 Defining unnecessary need
Issuers of tenders can choose to procure goods and services which are in fact not
necessary for them or procure them in a size and quantity excessive compared to
their actual needs (Heggstad & Froystad, 2011; Tanzi & Davoodi, 1997;
Transparency International, 2006). When this benefits particular supplier(s) mis-
assessment of needs can serve as a corruption technique (for a US example see
Mihály Fazekas: Quality of government and institutionalised grand corruption in public procurement, PhD dissertation
53
Goldman et al., 2012 p. 11). By arbitrarily increasing the quantity and overall price of
procured goods and services (e.g. by adding unnecessary capacities), the earned
corruption fee can be increased as it tends to increase with overall contract value.
Hence, this technique works well with other techniques allowing for limiting
competition hence making it easy to capture rents.
In principle, there is a range of control mechanisms which are intended to make this
technique difficult and costly to implement. These are the reviews of the State Audit
Organisation (SAO), judicial review, and public/media scrutiny. Even though there
have been instances when these presented an effective barrier, control functions are
very limited in general (State Audit Organisation, 2008).
Prime examples of this kind of technique in Hungary come from large infrastructure
projects, especially highway construction such as M7 or M6 in the recent years. In
the latter case, a pan-European investigation was launched in November 2012 on
charges of corruption and bribery. According to media reports these highways were
constructed with additional unnecessary content such as tunnels on flat surfaces, the
(in)famous viaduct of Kőröshegy which turned out to be one of CEE’s largest such
construct in spite of going through an only mildly hilly area. Moreover, some stories
told by interviewees outline the usual approach whereby it is not the need which gets
defined first, but the supply; that is, the company providing a particular service or
goods and knowing about a relevant EU funding opportunity seeks an issuer to ‘join-
in’ (Szántó & Tóth, 2008).
This technique is one of those few for which no quantitative indicator is proposed at
this stage of the research. Later on, case by case analysis could be conducted
involving additional data collection in order to reveal excess procurement content for
example by comparing procured values of issuers with comparable needs (e.g.
capacity of photo-copy machines for municipalities of similar size).
T1.2 Defining need in a way to benefit a particular supplier Issuers of tenders can choose to procure goods and services in a form or with
capacities which are unnecessary for fulfilling their actual needs, but are
advantageous for certain supplier(s) (Tanzi & Davoodi, 1997; Transparency
International, 2006; World Bank, 2007). If the issuer requires characteristics and
capacities which can only be performed by a single supplier’s goods and services,
Mihály Fazekas: Quality of government and institutionalised grand corruption in public procurement, PhD dissertation
54
fair competition can be ruled out right from the beginning. Such requirements are
most easily defined on markets where products and services have a high number of
very specific characteristics such as large infrastructure construction or IT
infrastructure and services. This technique largely supports other means of tailoring
the public procurement process to one bidder (T2.2).
This kind of corruption is difficult to detect as knowing what is actually needed by an
organisation is difficult to decipher by external control bodies (i.e. problem of
information asymmetry). The Hungarian SAO regularly audits individual pubic
organisations and conducts more comprehensive public procurement reviews, but
these concern only a selected set of organisations over longer time periods making
detection rather unlikely. Moreover, the lack of long term vision for sectors or the
whole country make assessment of investment needs close to impossible as there is
no solid benchmark (Báger, 2011). Supporting institutions such as the Hungarian
National Development Agency or the European Commission’s OLAF and European
Court of Auditors also conduct reviews which have the potential to detect ‘tailored’
procurement, but they are likely to be ineffective due to information asymmetries and
narrow focus on financial compliance.
There is one direct quantitative indicator for this technique suggested by the
literature (Bandiera, Prat, & Valletti, 2009):
A) prevalence of avoiding centralised procurement.
Centralised procurement systems replace the multitude of local procurement
processes with a few large purchases. Buying directly from the centralised
procurement authority (in Hungary the Public Procurement and Supplies Bureau or
Közbeszerzési és Ellátási Főigazgatóság) is likely to decrease corruption risks of
local entities as they can no longer influence contract award (Bandiera et al., 2009).
However, this logic is crucially dependent on the quality, price, and flexibility of
centrally procured provision. In an environment ridden with systemic corruption,
centralised purchasing simply centralises corruption and state capture leading to low
quality and/or high price provision (Piga, 2011). Indeed, interview evidence suggests
that, depending on the centralised procurement contract covering a specific market
such as hospital stationery, or furniture, centralised procurement maybe more or less
competitive than local procurement. If centralised procurement is more efficient than
Mihály Fazekas: Quality of government and institutionalised grand corruption in public procurement, PhD dissertation
55
potential local procurement corrupt tender issuers are more likely to opt out of the
central system and conduct procurement locally. However, if the centralised contract
is less competitive than the potential local ones even non-corrupt, well-governed
issuers opt out. Assuming further research can reveal the relative efficiency of
centralised purchasing, the adequate indicator is the following:
PACPit = (PPVit - CPPVit ) / PPVit
where PACPit refers to the proportion of not-purchasing through centralised public
procurement within total value of contracts awarded according to the Public
Procurement Law by the ith unit of observation, typically public organisation, over
period t, PPVit denotes the total value of contracts awarded according to the Public
Procurement Law by the ith unit of observation during period t, and CPPVit refers to
the total purchasing through centralised public procurement of the ith unit of
observation over period t. As centralised purchasing is not available in every product
and services markets only those spending items are taken into account which could
be in principle obtained through centralised spending.
Unfortunately, we are still in negotiation with the Hungarian Public Procurement and
Supplies Bureau for obtaining public organisation and product specific data.
Consequentially, this indicator could not be calculated here.
4.2 Process design
T2.1 Tinkering with the threshold and exceptional rules
In Hungary like in any other European country, the application of the Public
Procurement Law as well as the different procedural regimes is dependent on
expected contract value thresholds and a range of specific exceptions (on the
coordination of procedures for the award of public works contracts, public supply
contracts and public service contracts, 2004). Application conditions such as
thresholds are crucial for corruption, first, as public procurement outside the Public
Procurement Law is typically less stringently regulated in terms of transparency and
open competition; second, different procedural regimes prescribe different degrees
of transparency and openness (OECD, 2010a). For example, the open regime
requires issuers to publish a call for tenders in the Public Procurement Bulletin
whereas the negotiation procedure does not. Hence, bringing procedures outside the
Mihály Fazekas: Quality of government and institutionalised grand corruption in public procurement, PhD dissertation
56
applicability of the Public Procurement Law or into a less open and competitive
procedural regime under the law provides better opportunities for hiding corrupt
action (Heggstad & Froystad, 2011; Kenny & Musatova, 2010; OECD, 2007;
Transparency International, 2006). Moving procedures across public procurement
regimes or completely outside the remit of the Public Procurement Law can be done
in three principal ways:
1. Slicing up contracts so that they fall out from the unwanted public
procurement procedural regime (e.g. below the national threshold) (Papanek,
2009 ch. 6; Piga, 2011);
2. invoking special rules of exception such as national security or extreme
urgency (OECD, 2007; Schultz & Soreide, 2008; Soreide, 2002); and
3. underestimating expected contract value (expected contract value is the basis
for mandatory regime choice).
In addition, corrupt networks capable of moving contracts across public
organisations can also resort to channelling money through institutions falling outside
the remit of the Public Procurement Law such as the Hungarian Development Bank
(Major Dezsériné, 2003; Papanek, 2009 ch. 6). Due to the difficulty of detecting
quantitatively this latter technique no further discussion is offered.
As conducting public procurement according to different procedural regimes also has
considerable costs for the issuers (i.e. some procedures are more costly than others)
smaller or poorer issuers may also try to use this technique for cost saving reasons.
By implication, the use of this technique as a signal of corruption should be seen in
the light of issuer size and wealth.
The choice of procedural regime or the avoidance of applying the Public
Procurement Law has wide-ranging impacts on other indicators and the structure of
the PP database. First, contracts outside the remit of the Public Procurement Law
are not recorded in the PP database. The only trace of such purchases is in public
organisations’ annual budget figures from which estimates can be constructed for
overall procurement (Audet, 2002; European Commission, 2011b). Second, choice
of procedural regime impacts on the availability of other corruption techniques which
we discuss below: T2.6-Submission deadline and T3.2-Publication of calls for tender.
While issuers’ hands are tied in terms of minimum submission deadlines and
Mihály Fazekas: Quality of government and institutionalised grand corruption in public procurement, PhD dissertation
57
mandatory publication of calls for tender if they conduct an open procedure, they are
offered more choice when using other regimes. By implication, the choice of regime
type determines submission deadline and call for tenders publication to some degree
in an asymmetric way. Third, the procedure choice may also support the use of other
corruption techniques, especially T2.2-Tailoring eligibility criteria and T2.4-Tailoring
evaluation criteria. It is possible to launch a public procurement procedure as a
restricted procedure where there are two phases, the first serving the pre-screening
and pre-selection of eligible bidders, and the second constituting the actual decision
among the shortlisted bidders. Tailoring the eligibility and evaluation criteria to the
benefit of a particular bidder is made easy by the detailed knowledge of shortlisted
bidders remaining after the first phase.
Both slicing contracts and invoking special rules are regulated in the Public
Procurement Law, making the application of this corruption technique difficult in
principle. However, in practice, detection is difficult as the contracts are moved out of
the more transparent domain and determining the actual joined-up nature of two or
more contracts requires intimate knowledge of the contracts as well as the issuer
(Piga, 2011). As with many other techniques, external control is exercised by the
SAO and supporting institutions especially the National Development Agency
managing most of the EU funding coming into Hungary. Early surveys of practice
confirm what our interviews underlined: external control is rare and not very effective
(Major Dezsériné, 2003). In the case of underestimating contract value, but still
remaining under the umbrella of the Public Procurement Law, deviation between
estimated and actual contract value can be observed. In these cases, the Public
Procurement Arbitration Board may intervene and fine issuers. However, fines are
incurred by issuers, whereas corruption fees accrue to the corrupt network making
the fines a potentially weak instrument.
There are wide ranging examples of circumventing the more stringent regulations of
the Public Procurement Law both from Hungary and from abroad. In Hungary, it is
very telling that practitioners simply call the restricted procedure (“meghívásos
eljárás” in Hungarian) the “three bidder procedure” as one public procurement
adviser working in the industry for over a decade put it: “just bring two friends with
whom we can agree on the exact content of their bids”. In Italy, a “culture of
emergency” has evolved in public procurement leading to “a systematic search for
Mihály Fazekas: Quality of government and institutionalised grand corruption in public procurement, PhD dissertation
58
the exceptionality” and a frequent use of “mechanisms of arbitrary choice in public
contracting” (Soreide, 2002 p. 18).
Due to the central position of this technique in relation to other techniques and the
wide ranging ramifications of procedural regime choice to several aspects of public
procurement, a large number of indicators are developed. We discuss three direct
indicators:
A) proportion of non-open procedures;
B) average corruption risk score of procedures followed; and
C) frequency of actual contract value above estimated contract value.
We also discuss one indirect indicator:
D) ratio of contract value according to Public Procurement Law over total
procurement contract value.
The frequency of using higher corruption risk procedure types signals in a simple
and straightforward way the underlying corruption technique. Corruption risks
indicated by the choice of procedural regime can be measured in a variety of ways.
For example, a sophisticated econometric paper looking at corruption in public
procurement in Paraguay uses the proportion of exceptional procedures over all
other procedures (Auriol, Flochel, & Straub, 2011). In order to focus our indicator on
the largest differences in corruption risks the proposed simple measure of tinkering
with procedural regimes takes open procedures as a benchmark:
NOPRit = 1 – ( OPRit / TNPit )
where NOPRit refers to the proportion of non-open procedures over all procedures
concluded of the ith unit of observation such as public organisation or bidder over
period t, OPRit refers to the number of procedures following open procedural regime
of the ith unit of observation during period t, and TNPit refers to the total number of
procedures concluded by the ith unit of observation over period t (Table 2).
It is possible to rank procedure types according to level of transparency and degree
of openness of competition prescribed. Hence procedure types could be ranked
according to their corruption risks. Averaging the corruption risk ranks of procedures
concluded may serve as a more subtle indicator of corruption than simply looking at
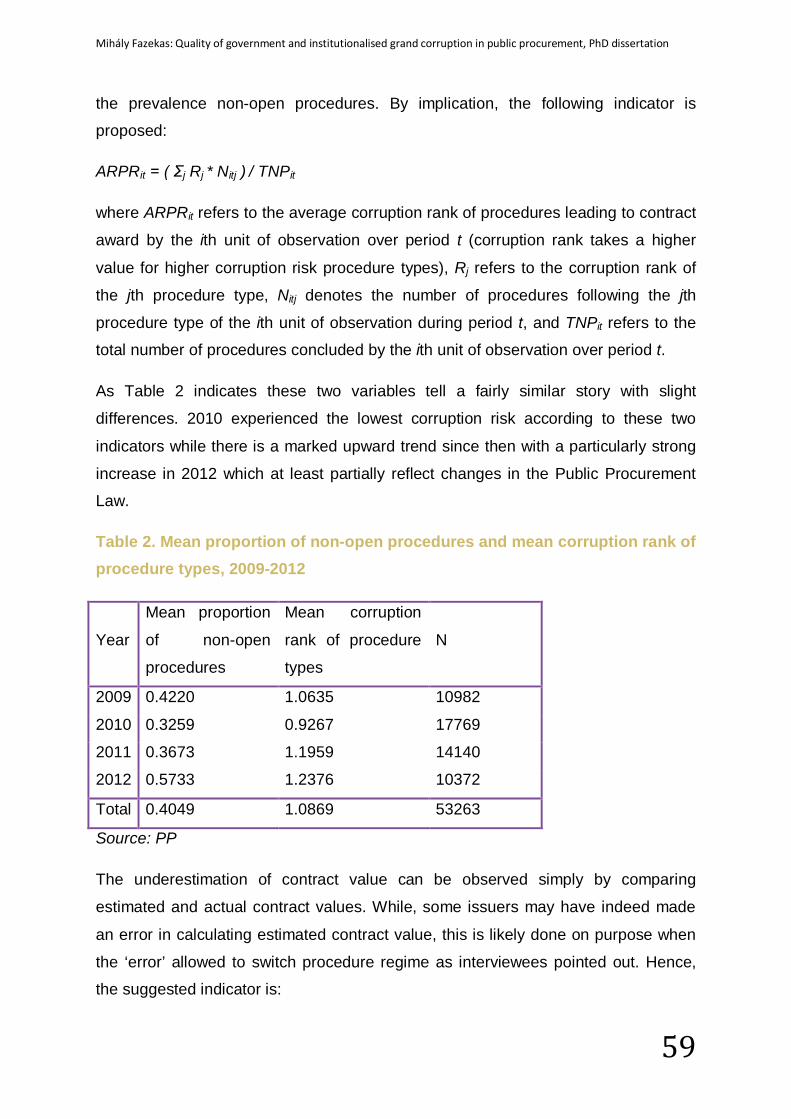
Mihály Fazekas: Quality of government and institutionalised grand corruption in public procurement, PhD dissertation
59
the prevalence non-open procedures. By implication, the following indicator is
proposed:
ARPRit = ( Σj Rj * Nitj ) / TNPit
where ARPRit refers to the average corruption rank of procedures leading to contract
award by the ith unit of observation over period t (corruption rank takes a higher
value for higher corruption risk procedure types), Rj refers to the corruption rank of
the jth procedure type, Nitj denotes the number of procedures following the jth
procedure type of the ith unit of observation during period t, and TNPit refers to the
total number of procedures concluded by the ith unit of observation over period t.
As Table 2 indicates these two variables tell a fairly similar story with slight
differences. 2010 experienced the lowest corruption risk according to these two
indicators while there is a marked upward trend since then with a particularly strong
increase in 2012 which at least partially reflect changes in the Public Procurement
Law.
Table 2. Mean proportion of non-open procedures and mean corruption rank of procedure types, 2009-2012
Year
Mean proportion
of non-open
procedures
Mean corruption
rank of procedure
types
N
2009 0.4220 1.0635 10982
2010 0.3259 0.9267 17769
2011 0.3673 1.1959 14140
2012 0.5733 1.2376 10372
Total 0.4049 1.0869 53263
Source: PP
The underestimation of contract value can be observed simply by comparing
estimated and actual contract values. While, some issuers may have indeed made
an error in calculating estimated contract value, this is likely done on purpose when
the ‘error’ allowed to switch procedure regime as interviewees pointed out. Hence,
the suggested indicator is:
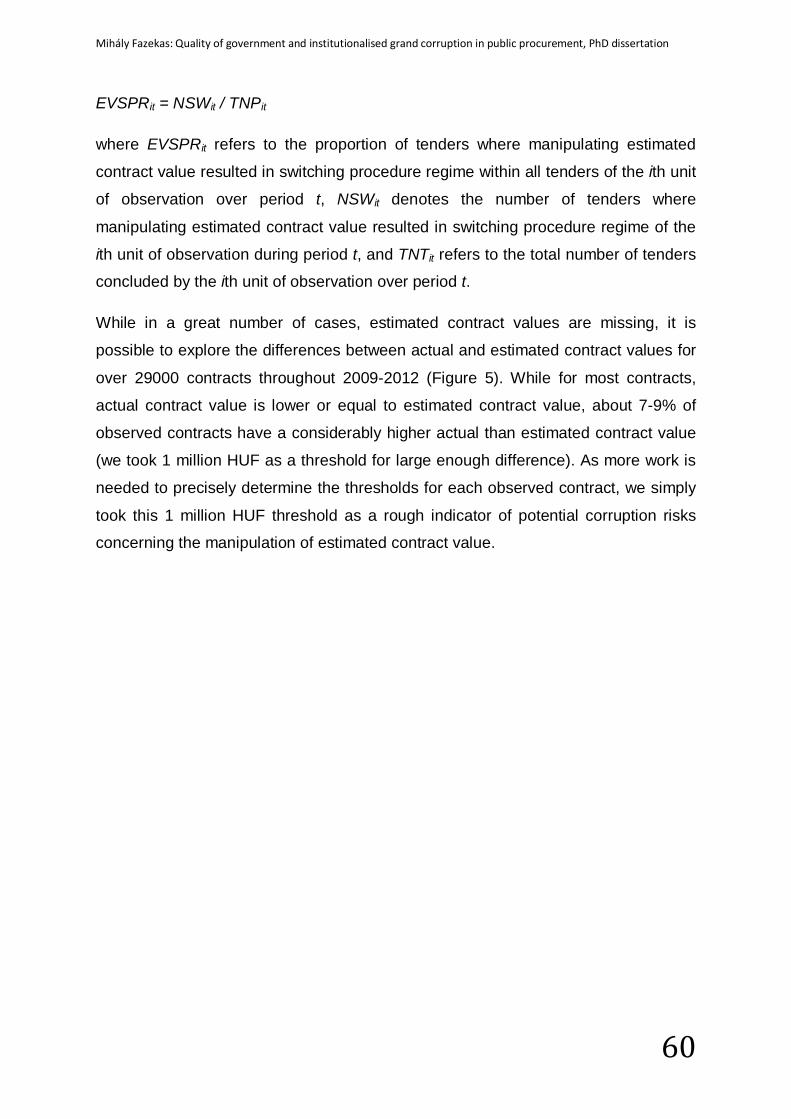
Mihály Fazekas: Quality of government and institutionalised grand corruption in public procurement, PhD dissertation
60
EVSPRit = NSWit / TNPit
where EVSPRit refers to the proportion of tenders where manipulating estimated
contract value resulted in switching procedure regime within all tenders of the ith unit
of observation over period t, NSWit denotes the number of tenders where
manipulating estimated contract value resulted in switching procedure regime of the
ith unit of observation during period t, and TNTit refers to the total number of tenders
concluded by the ith unit of observation over period t.
While in a great number of cases, estimated contract values are missing, it is
possible to explore the differences between actual and estimated contract values for
over 29000 contracts throughout 2009-2012 (Figure 5). While for most contracts,
actual contract value is lower or equal to estimated contract value, about 7-9% of
observed contracts have a considerably higher actual than estimated contract value
(we took 1 million HUF as a threshold for large enough difference). As more work is
needed to precisely determine the thresholds for each observed contract, we simply
took this 1 million HUF threshold as a rough indicator of potential corruption risks
concerning the manipulation of estimated contract value.
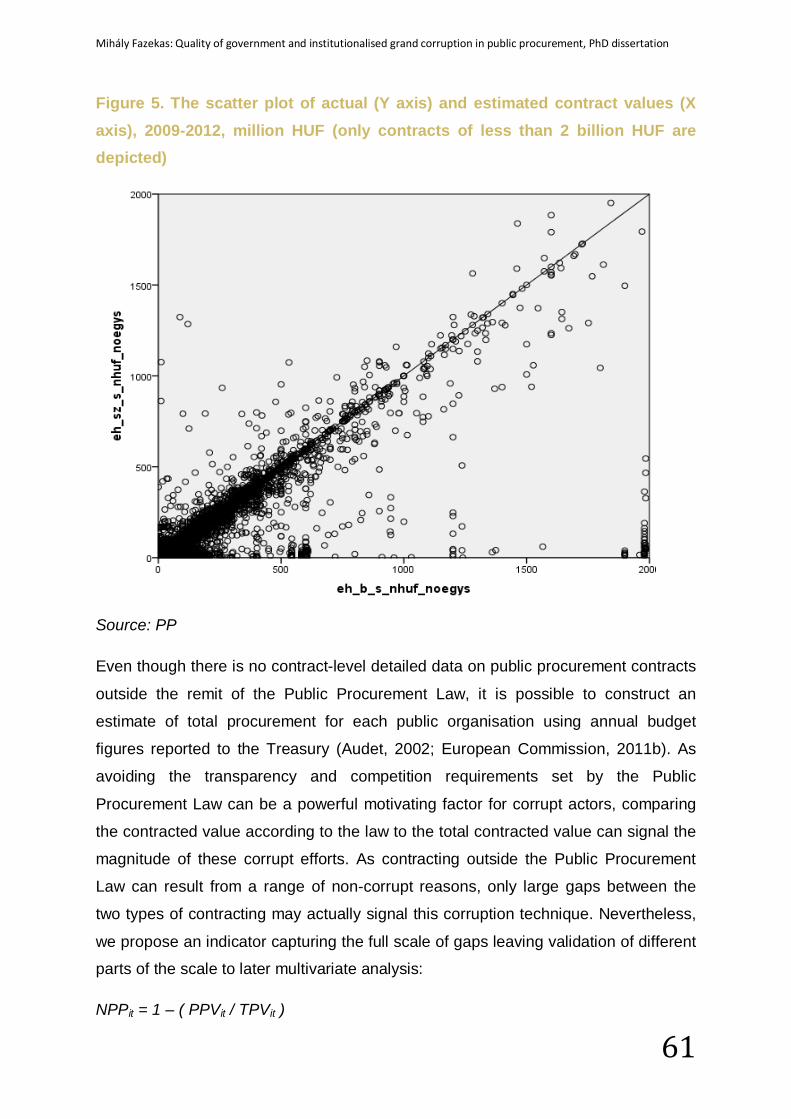
Mihály Fazekas: Quality of government and institutionalised grand corruption in public procurement, PhD dissertation
61
Figure 5. The scatter plot of actual (Y axis) and estimated contract values (X axis), 2009-2012, million HUF (only contracts of less than 2 billion HUF are depicted)
Source: PP
Even though there is no contract-level detailed data on public procurement contracts
outside the remit of the Public Procurement Law, it is possible to construct an
estimate of total procurement for each public organisation using annual budget
figures reported to the Treasury (Audet, 2002; European Commission, 2011b). As
avoiding the transparency and competition requirements set by the Public
Procurement Law can be a powerful motivating factor for corrupt actors, comparing
the contracted value according to the law to the total contracted value can signal the
magnitude of these corrupt efforts. As contracting outside the Public Procurement
Law can result from a range of non-corrupt reasons, only large gaps between the
two types of contracting may actually signal this corruption technique. Nevertheless,
we propose an indicator capturing the full scale of gaps leaving validation of different
parts of the scale to later multivariate analysis:
NPPit = 1 – ( PPVit / TPVit )
Mihály Fazekas: Quality of government and institutionalised grand corruption in public procurement, PhD dissertation
62
where NPPit refers to the proportion of contract value not according to the Public
Procurement Law within the total procurement spending of the ith unit of observation,
typically public organisation, over period t, PPVit denotes the total value of contracts
awarded according to the Public Procurement Law of the ith unit of observation
during period t, and TPVit refers to the total procurement spending of the ith unit of
observation over period t. As we dispose of more detailed budget figures than
previous studies (Audet, 2002; European Commission, 2011b), we calculated total
procurement as the sum of material expenses and investment expenses accrued in
a given period.
Even though, we cannot yet present the full picture of the Hungarian public
administration, data on central public organisations are already highly illuminating. It
appears that on average close to 80% of procurement spending takes place outside
the Public Procurement Law’s remit throughout 2009-2011 (Figure 6). In addition,
this proportion has increased from 75% In 2009 to 81% in 2011. This raises the
concern that the analysis of PP data only looks at the “tip of the iceberg”.
Figure 6. Percentage of procurement spending not according to the Public Procurement Law, 2009-2011, N=631 issuer (the same issuer counts as multiple observations across the years)
Source: PP
Mihály Fazekas: Quality of government and institutionalised grand corruption in public procurement, PhD dissertation
63
While there is no specific indicator developed based on the breaks in distributions of
contract values around thresholds and after changes in thresholds, it is suggested
that a more detailed analysis of contract value distributions could lead to additional
insights as to how issuers may game the system of procedure regimes and the
corresponding thresholds.
T2.2 Tailoring eligibility criteria Eligibility criteria define which potential bidders can bid and which bids can be
considered for competition. That is, both bidders and their bids should meet a set of
criteria in order to be considered for a tender. Hence, tailoring eligibility criteria to
exclude most or all non-wanted bidders even though they could bid given the actual
object of procurement can effectively inhibit fair competition. This is by far the most
widely quoted corruption technique in the Hungarian (Báger, 2011; Major Dezsériné,
2003; Pálinkó, Szántó, & Tóth, 2008; Papanek, 2009) and international literature
(Goldman et al., 2012; Grodeland, 2005, 2010; Heggstad & Froystad, 2011; Piga,
2011; Soreide, 2006) which was confirmed by our interviewees. Tailoring can be
done by
1. defining a combination of hard criteria such as prior works or annual turnover
clearly excluding some companies, or
2. setting vague and subjective criteria allowing issuers to exercise discretion in
a partial manner.
Once, only the desired bidder remains as eligible bidder, it can submit a price
considerably above market price earning a rent (OECD, 2007; Transparency
International, 2006). Naturally, some criteria are justified as they aid sorting out
capable bidders and bids; what makes them more than simple reasonable pre-
screening is their excessive amount and overly restrictive nature in the light of the
procured goods and services.
Consistently differentiating reasonable and excessive criteria, i.e. limiting the
applicability of this technique, is difficult and requires robust case law and uniformly
applied rules. In Hungary, there are several decisions of the Public Procurement
Arbitration Board on this issue; however, according to interviewees, legal uncertainty
is high as the very same issue could be judged differently by different judges.
Nevertheless, due to potential judicial challenge, this technique may only result in
Mihály Fazekas: Quality of government and institutionalised grand corruption in public procurement, PhD dissertation
64
limiting the list of bidders rather than eliminating all but one. In a next step, involving
other techniques, the list can be shrank further.
The most intimately linked corruption technique designed to further shrink the list of
eligible bidders and bids is T2.3-abusing formal and administrative requirements.
Once complicated and difficult to meet set of criteria is defined, it is relatively easy
for the issuer to find at least one requirement which was not appropriately
documented. This provides sufficient grounds for the issuer to exclude bidders and
their bids. Furthermore, corruption technique T1.2 (defining needs to benefit a
particular supplier) neatly supports this corruption technique as eligibility criteria
should, in principle, follow from organisational needs and the characteristics of goods
and services to be procured. Biased needs estimation makes biased criteria setting
more easily defensible at court.
Interviewees in Hungary frequently shared concrete examples demonstrating the
abuse of the system of references (i.e. proof of prior experience). One large
construction company was excluded from a tender for building a hospital on the
grounds that they had no specific experience with building a lone-standing morgue
even though they had built hospitals with a morgue. As lone-standing and within
hospital morgues have essentially the same technical parameters this criteria was
likely used to exclude unwanted bidders. The respondent knew which 3 companies
had specific experience with building lone-standing morgues. Other suspicious
eligibility criteria made it clear to this company that the process was ‘set-up’ right
from the beginning.
Other frequently quoted examples relate to detailed financial criteria (financial
information on large companies is public so it is easy to tailor criteria to the detriment
of unwanted bidders). A public procurement advisor gave an example: “During a
public car purchase procedure, the company was excluded because there was a
condition specified requiring bidders to have higher own capital than subscribed
capital. The company couldn’t meet this criterion due to an ongoing investment
Mihály Fazekas: Quality of government and institutionalised grand corruption in public procurement, PhD dissertation
65
(subscribed capital: 125 billion HUF, own capital: 124.7 billion HUF). Instead an XY
‘phantom’ company18 won the tender.” (Papanek, 2009 p. 239).
There is one direct indicator associated with this corruption technique:
A) length of eligibility criteria.
Length and complexity of eligibility criteria both for bidders and bids provides a crude
measure of the use of this technique especially when taking into consideration the
size of the contract too (i.e. bigger contracts may require more lengthy and complex
system of criteria for valid reasons). As looking at the use of specific ‘suspicious’
criteria was not made possible by our limited understanding and diverse nature of
these ‘suspicious’ criteria19, we propose the following crude measure:
ADLECit = Σjk ( LECitjk - ALECk ) / Nit
where ADLECit denotes the average difference in the length of eligibility criteria
between the call for tenders of the ith unit of observation such as issuer over period t
and the average length at the kth market over period t, LECitjk refers to length of
eligibility criteria of the jth call for tenders of ith unit of observation belonging to the
kth market during period t, ALECk denotes the average length of eligibility criteria
during the whole observation period for the kth market, and Nit refers to the number
of calls for tenders of ith unit of observation during period t. Public procurement
markets are taken as reference groups recognising that more lengthy and complex
criteria is justified for specific markets. Unfortunately, if a market is dominated by
excessively complicated and lengthy eligibility criteria due to the large number of
corrupt procedures this normalisation will lead to an underestimation of corruption
risks. Length of criteria is simply measured as the number of characters used.
The average length of eligibility criteria in each public procurement market as defined
by CPV20 main divisions varied between 4400 characters in the market of printed
matter and related products (CPV division 22) to 9700 characters in the market of 18 Phantom company in ordinary Hungarian language (fantomcég) typically refers to a company created specifically for corrupt or tax evasion purposes having very little economic activity other than related to rent extraction. 19 More work is under way to develop better direct measure of complexity and restrictiveness as the complete text of criteria is available to us for every call for tenders. We will combine additional interview examples of frequently used ‘suspicious’ criteria and text mining methods. 20 CPV=Common Procurement Vocabulary. For more info see: http://simap.europa.eu/codes-and-nomenclatures/codes-cpv/codes-cpv_en.htm
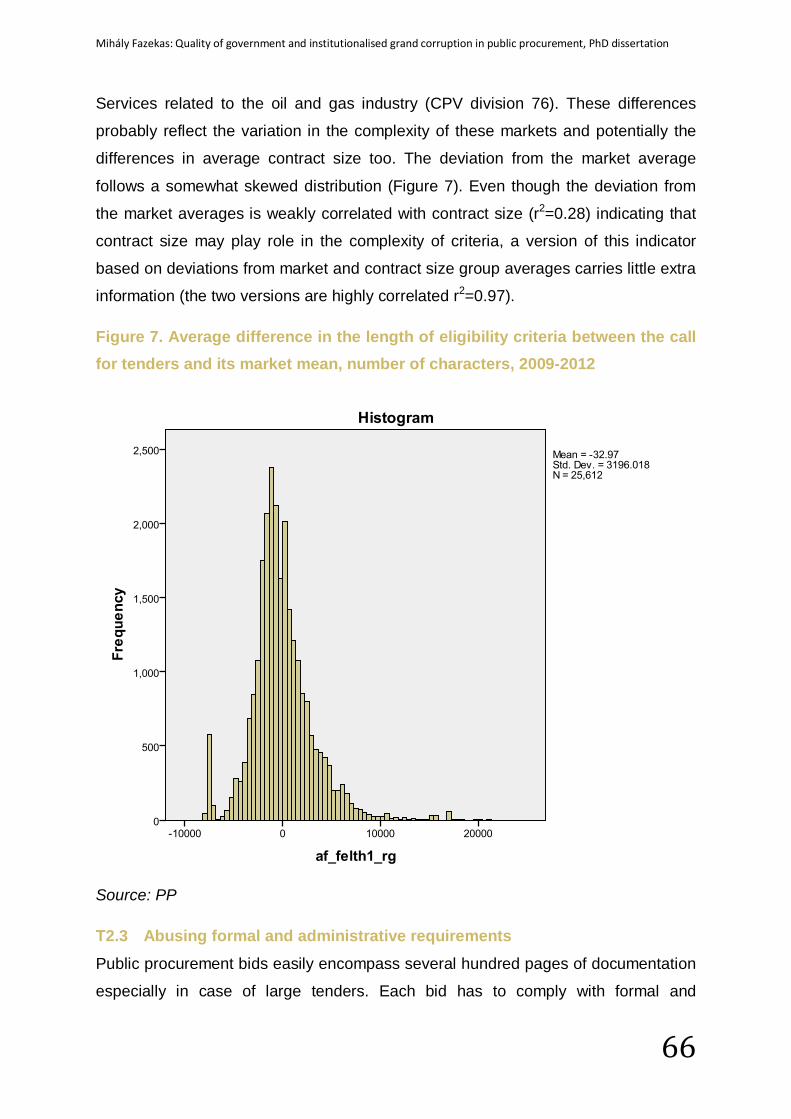
Mihály Fazekas: Quality of government and institutionalised grand corruption in public procurement, PhD dissertation
66
Services related to the oil and gas industry (CPV division 76). These differences
probably reflect the variation in the complexity of these markets and potentially the
differences in average contract size too. The deviation from the market average
follows a somewhat skewed distribution (Figure 7). Even though the deviation from
the market averages is weakly correlated with contract size (r2=0.28) indicating that
contract size may play role in the complexity of criteria, a version of this indicator
based on deviations from market and contract size group averages carries little extra
information (the two versions are highly correlated r2=0.97).
Figure 7. Average difference in the length of eligibility criteria between the call for tenders and its market mean, number of characters, 2009-2012
Source: PP
T2.3 Abusing formal and administrative requirements Public procurement bids easily encompass several hundred pages of documentation
especially in case of large tenders. Each bid has to comply with formal and
Mihály Fazekas: Quality of government and institutionalised grand corruption in public procurement, PhD dissertation
67
administrative requirements such as the format of the budget or the provision of
original documents from public bodies (e.g. registration at the court registry). While
these requirements are desirable in general, their large number and complexity
provide ample opportunities for abuse. According to our interviews as well as the
international literature, it is practically always possible to find a formal or
administrative error which provides grounds for excluding the bid from competition
(Báger, 2011; Grodeland, 2005; Papanek, 2009; Transparency International, 2006).
Hence, this corruption technique abuses minor technical errors to serve the interests
of corrupt networks by allowing them to limit competition to their preferred bidders.
Excluding bids on formal and administrative grounds is a legitimate activity, but it
becomes cause for suspicion once it becomes excessive, inconsistently applied, and
regularly leads to only one remaining bid.
In principle, the prescribed opportunity for bidders to correct such errors after
submitting their bids limit the applicability of this technique. However, in Hungary, the
procedure of requesting and submitting corrections is largely unregulated. This
means that corrupt issuers comply with the law only formally, but not substantially:
as a public procurement advisor working in the construction industry for over a
decade put it: “it is easy, you request on Friday 13 o’clock the original copy of any
minor document bearing a public agency’s stamp on it to be submitted by Monday
10h. It all looks fine, you left three days for correction, but in fact you made it
impossible.” Another surprising sign of the frequency of this technique is that one of
its specific versions acquired its own expression in public procurement ‘slang’:
“exhaustion technique”. According to a Public Procurement Lawyer active in a range
of sectors for several years this term means that “unwanted bidders are requested to
submit corrections in several turns until they finally understand that there is no point
in trying, they won’t ever win the contract they bid for.”21 According to our interviews,
it seems that this technique is one of the new ‘hype’ techniques in Hungary due to
the ease of its applicability (i.e. lack of regulation).
A concrete example quoted by one interviewee concerned a procurement procedure
for a garden reconstruction project where the company was excluded on the grounds
21 The „exhaustion technique” sometimes also includes periods of Public Procurement Arbitration Board intervention once again with the same message to unwanted bidders: give it up, no matter how hard you try, in the end we will find the right legal form for excluding you.
Mihály Fazekas: Quality of government and institutionalised grand corruption in public procurement, PhD dissertation
68
that its submitted budget was not complete. It was deemed incomplete because the
price of grass seed was not explicitly highlighted as a separate line in the proposed
budget even though it was included in the total budget for lawn installation costs.
Challenging this decision at the Public Procurement Arbitration Board did not change
the situation either in spite of prior court decisions annulling the decision of issuers in
analogous situations.
This technique is closely related to technique T2.2-tailoring eligibility criteria as both
stem from the complexity and length of the defined eligibility criteria. Moreover, this
technique neatly works together with other techniques aiming at reducing
competition. For example, tailoring needs and eligibility criteria could get the number
of bidders down to 3-5 while formal and administrative reasons could remove the
remaining unwanted bidders from the competition. If this would not lead to only one
bidder, manipulation of evaluation criteria could still leave ample room for
discretionary choice of preferred bidder.
Due to the close association between this and the previous techniques (T2.2), one
proposed indicator is the same for them. There are two direct measures:
A) proportion of excluded bids, and
B) length of eligibility criteria.
The proportion of valid bids within all received bids can be considered as a direct
measure of this corruption technique as it allows for directly gauging how excessively
certain issuers or on certain markets exclusions of received bids is exercised.
Hence, the proposed indicator is
PERBit = ( NRBit - NVBit ) / NRBit
where PERBit refers to the proportion of excluded bids over all received bids of the
ith unit of observation (typically public organisation) over period t, NRBit refers to the
total number of received bids by the ith unit of observation over period t , and NVBit
denotes the total number of valid bids of the ith unit of observation during period t.
The distribution of contract award notices according to the percentage of excluded
bids displays particular spikes at 33%, 50% and 66% which reflect the most typical
situations whereby one out of three, one out of two, and two out of three received
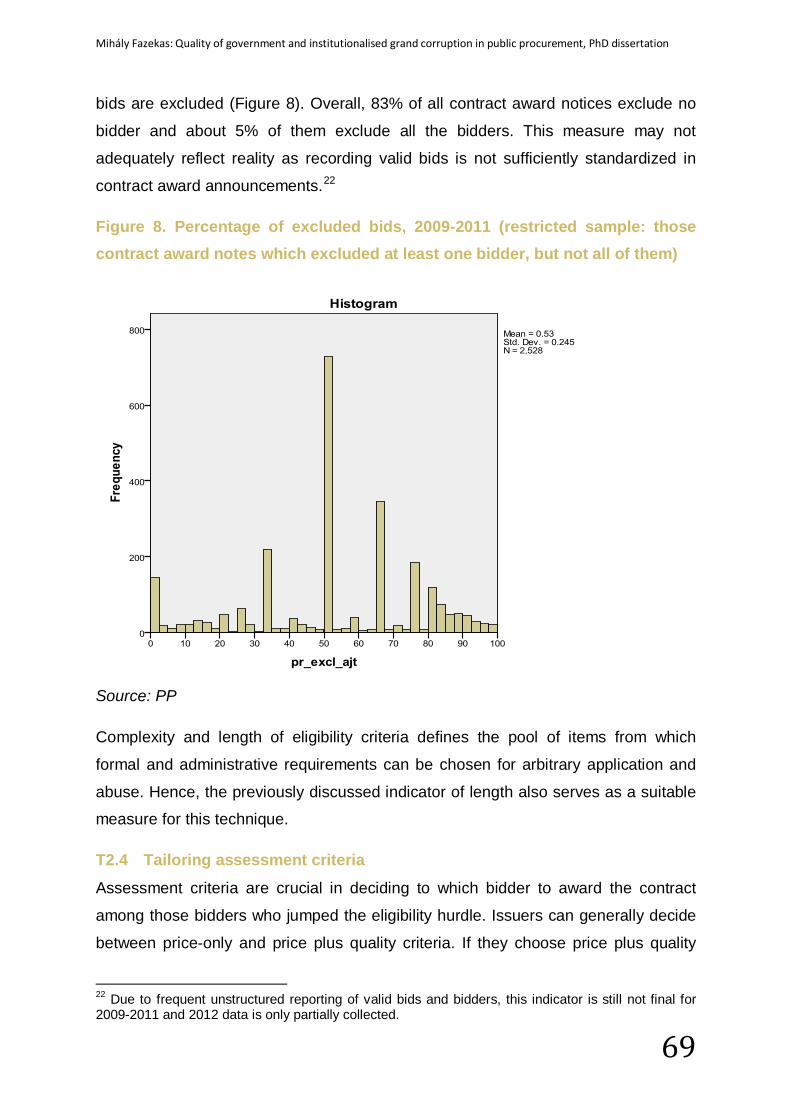
Mihály Fazekas: Quality of government and institutionalised grand corruption in public procurement, PhD dissertation
69
bids are excluded (Figure 8). Overall, 83% of all contract award notices exclude no
bidder and about 5% of them exclude all the bidders. This measure may not
adequately reflect reality as recording valid bids is not sufficiently standardized in
contract award announcements.22
Figure 8. Percentage of excluded bids, 2009-2011 (restricted sample: those contract award notes which excluded at least one bidder, but not all of them)
Source: PP
Complexity and length of eligibility criteria defines the pool of items from which
formal and administrative requirements can be chosen for arbitrary application and
abuse. Hence, the previously discussed indicator of length also serves as a suitable
measure for this technique.
T2.4 Tailoring assessment criteria
Assessment criteria are crucial in deciding to which bidder to award the contract
among those bidders who jumped the eligibility hurdle. Issuers can generally decide
between price-only and price plus quality criteria. If they choose price plus quality
22 Due to frequent unstructured reporting of valid bids and bidders, this indicator is still not final for 2009-2011 and 2012 data is only partially collected.
Mihály Fazekas: Quality of government and institutionalised grand corruption in public procurement, PhD dissertation
70
there is a range of possible quality criteria which are more or less objectively
measurable. By deliberately choosing those assessment criteria which are hard to
objectively measure such as quality of organigram, issuers can grant themselves
considerable discretion raising corruption risks (Lengwiler & Wolfstetter, 2006;
OECD, 2007; Piga, 2011; Transparency International, 2006; World Bank, 2007).
However, not all quality criteria are subjective, for example speed of completion,
amount of indemnity, or payment deadline can be objectively assessed. In addition,
there are markets such as IT where the standard is competition based on system
performance while price is fixed.
Even though the Public Procurement Law defines the range of permissible
evaluation criteria, there is still a broad arsenal from which corrupt networks can
choose lawfully making effective external control difficult.
As mentioned earlier, this corruption technique may be used in tandem with other
techniques limiting the range of eligible bidders. It can also serve as a substitute for
excluding bidders, that is if exclusion efforts were not successful or were deemed too
risky, subjective evaluation criteria can still ‘do the job’. Postulating subjective
evaluation criteria can only serve a corrupt purpose if the corrupt network manages
to control the subjective scoring mechanism too. Hence, corruption technique T4.3-
unfair scoring is essential for the success of this technique.
There are two proposed direct indicators for this corruption technique:
A) length of assessment criteria, and
B) weight of non-price criteria.
The length of assessment criteria serves as a proxy for the overall complexity of
criteria. We consider more complex set of criteria as more difficult to check by
external actors and giving more discretion to the decision maker hence involving
higher corruption risks. Following a similar logic to eligibility criteria length (T2.2), the
following indicator is calculated:
ADACLit = Σjk ( LACitjk - AACk ) / Nit
where ADALCit denotes the average difference in the length of assessment criteria
between the call for tenders of the ith unit of observation such as issuer over period t
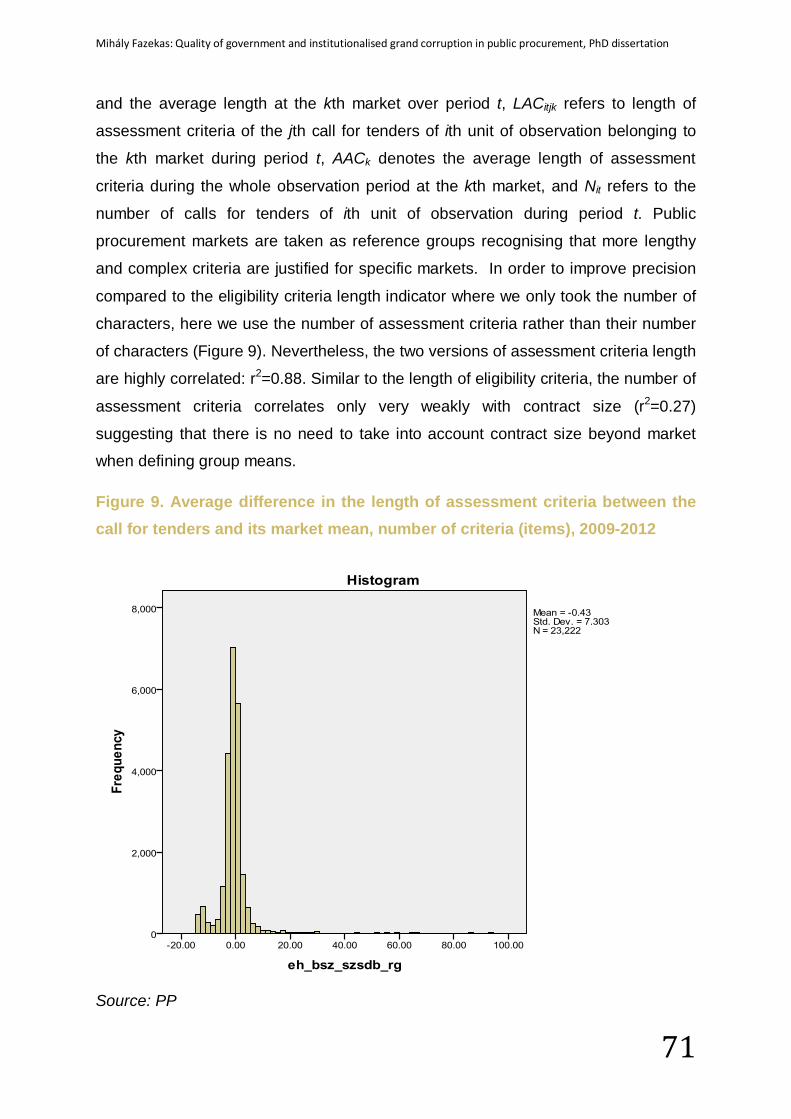
Mihály Fazekas: Quality of government and institutionalised grand corruption in public procurement, PhD dissertation
71
and the average length at the kth market over period t, LACitjk refers to length of
assessment criteria of the jth call for tenders of ith unit of observation belonging to
the kth market during period t, AACk denotes the average length of assessment
criteria during the whole observation period at the kth market, and Nit refers to the
number of calls for tenders of ith unit of observation during period t. Public
procurement markets are taken as reference groups recognising that more lengthy
and complex criteria are justified for specific markets. In order to improve precision
compared to the eligibility criteria length indicator where we only took the number of
characters, here we use the number of assessment criteria rather than their number
of characters (Figure 9). Nevertheless, the two versions of assessment criteria length
are highly correlated: r2=0.88. Similar to the length of eligibility criteria, the number of
assessment criteria correlates only very weakly with contract size (r2=0.27)
suggesting that there is no need to take into account contract size beyond market
when defining group means.
Figure 9. Average difference in the length of assessment criteria between the call for tenders and its market mean, number of criteria (items), 2009-2012
Source: PP
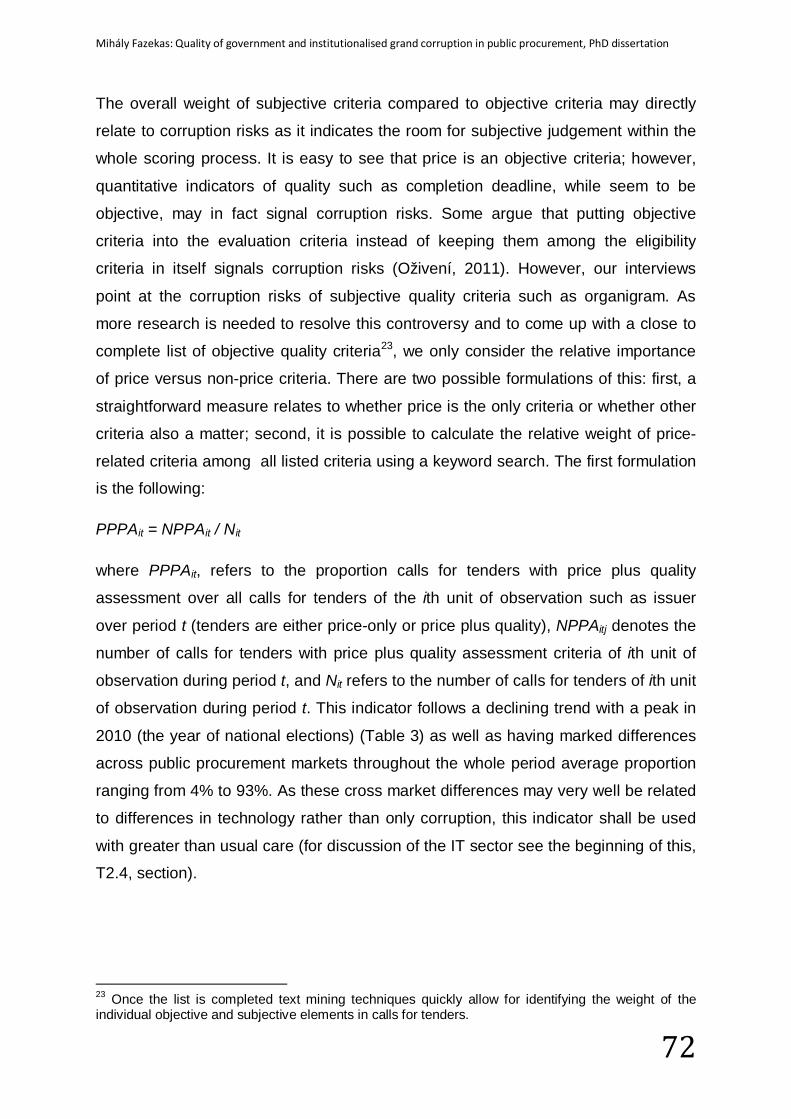
Mihály Fazekas: Quality of government and institutionalised grand corruption in public procurement, PhD dissertation
72
The overall weight of subjective criteria compared to objective criteria may directly
relate to corruption risks as it indicates the room for subjective judgement within the
whole scoring process. It is easy to see that price is an objective criteria; however,
quantitative indicators of quality such as completion deadline, while seem to be
objective, may in fact signal corruption risks. Some argue that putting objective
criteria into the evaluation criteria instead of keeping them among the eligibility
criteria in itself signals corruption risks (Oživení, 2011). However, our interviews
point at the corruption risks of subjective quality criteria such as organigram. As
more research is needed to resolve this controversy and to come up with a close to
complete list of objective quality criteria23, we only consider the relative importance
of price versus non-price criteria. There are two possible formulations of this: first, a
straightforward measure relates to whether price is the only criteria or whether other
criteria also a matter; second, it is possible to calculate the relative weight of price-
related criteria among all listed criteria using a keyword search. The first formulation
is the following:
PPPAit = NPPAit / Nit
where PPPAit, refers to the proportion calls for tenders with price plus quality
assessment over all calls for tenders of the ith unit of observation such as issuer
over period t (tenders are either price-only or price plus quality), NPPAitj denotes the
number of calls for tenders with price plus quality assessment criteria of ith unit of
observation during period t, and Nit refers to the number of calls for tenders of ith unit
of observation during period t. This indicator follows a declining trend with a peak in
2010 (the year of national elections) (Table 3) as well as having marked differences
across public procurement markets throughout the whole period average proportion
ranging from 4% to 93%. As these cross market differences may very well be related
to differences in technology rather than only corruption, this indicator shall be used
with greater than usual care (for discussion of the IT sector see the beginning of this,
T2.4, section).
23 Once the list is completed text mining techniques quickly allow for identifying the weight of the individual objective and subjective elements in calls for tenders.
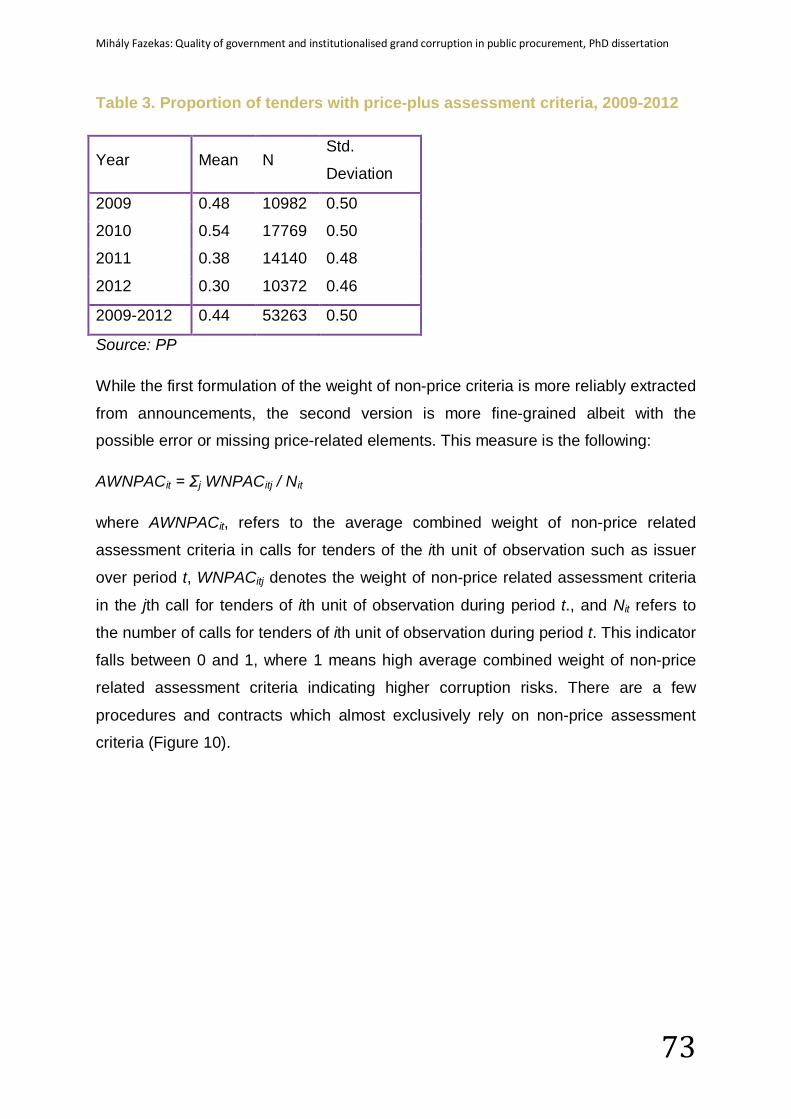
Mihály Fazekas: Quality of government and institutionalised grand corruption in public procurement, PhD dissertation
73
Table 3. Proportion of tenders with price-plus assessment criteria, 2009-2012
Year Mean N Std.
Deviation
2009 0.48 10982 0.50
2010 0.54 17769 0.50
2011 0.38 14140 0.48
2012 0.30 10372 0.46
2009-2012 0.44 53263 0.50
Source: PP
While the first formulation of the weight of non-price criteria is more reliably extracted
from announcements, the second version is more fine-grained albeit with the
possible error or missing price-related elements. This measure is the following:
AWNPACit = Σj WNPACitj / Nit
where AWNPACit, refers to the average combined weight of non-price related
assessment criteria in calls for tenders of the ith unit of observation such as issuer
over period t, WNPACitj denotes the weight of non-price related assessment criteria
in the jth call for tenders of ith unit of observation during period t., and Nit refers to
the number of calls for tenders of ith unit of observation during period t. This indicator
falls between 0 and 1, where 1 means high average combined weight of non-price
related assessment criteria indicating higher corruption risks. There are a few
procedures and contracts which almost exclusively rely on non-price assessment
criteria (Figure 10).
Mihály Fazekas: Quality of government and institutionalised grand corruption in public procurement, PhD dissertation
74
Figure 10. Frequency distribution of awarded contracts according to the combined weight of non-price related assessment criteria, 2009-2012
Source: PP
T2.5 Using a long term complex contract
There is theoretical as well as empirical evidence that the length of collaboration is
positively related to corruption risks (Coviello & Gagliarducci, 2010). In addition,
complex contracts involving many unforeseeable events and a range of options such
as public-private partnerships (PPP) or framework contracts are harder to control
(Báger, 2011). Hence, the overall weight of such contracts in the public procurement
portfolio of an issuer may signal mid to long term corruption risks. Central purchasing
bodies’ framework contracts may reduce corruption risks for smaller entities buying
through the central framework (Bandiera et al., 2009); but framework agreements
awarded, especially those with only one bidder in the framework, may represent a
considerable corruption risk as some of our interviewees pointed out.
In principle, the competitive award of such long term complex contracts assures
sufficient control; however, the lack of pre-determined purchased quantities allow for
specific forms of collecting corruption rent. For example, in the case of framework
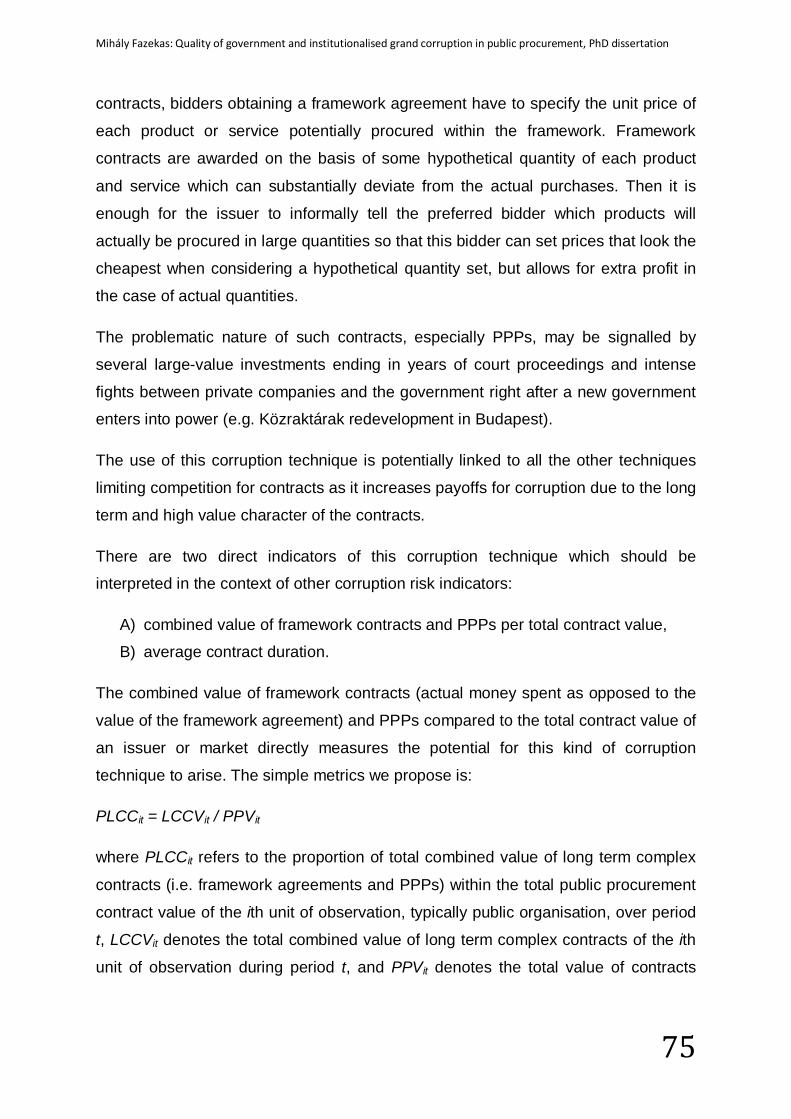
Mihály Fazekas: Quality of government and institutionalised grand corruption in public procurement, PhD dissertation
75
contracts, bidders obtaining a framework agreement have to specify the unit price of
each product or service potentially procured within the framework. Framework
contracts are awarded on the basis of some hypothetical quantity of each product
and service which can substantially deviate from the actual purchases. Then it is
enough for the issuer to informally tell the preferred bidder which products will
actually be procured in large quantities so that this bidder can set prices that look the
cheapest when considering a hypothetical quantity set, but allows for extra profit in
the case of actual quantities.
The problematic nature of such contracts, especially PPPs, may be signalled by
several large-value investments ending in years of court proceedings and intense
fights between private companies and the government right after a new government
enters into power (e.g. Közraktárak redevelopment in Budapest).
The use of this corruption technique is potentially linked to all the other techniques
limiting competition for contracts as it increases payoffs for corruption due to the long
term and high value character of the contracts.
There are two direct indicators of this corruption technique which should be
interpreted in the context of other corruption risk indicators:
A) combined value of framework contracts and PPPs per total contract value,
B) average contract duration.
The combined value of framework contracts (actual money spent as opposed to the
value of the framework agreement) and PPPs compared to the total contract value of
an issuer or market directly measures the potential for this kind of corruption
technique to arise. The simple metrics we propose is:
PLCCit = LCCVit / PPVit
where PLCCit refers to the proportion of total combined value of long term complex
contracts (i.e. framework agreements and PPPs) within the total public procurement
contract value of the ith unit of observation, typically public organisation, over period
t, LCCVit denotes the total combined value of long term complex contracts of the ith
unit of observation during period t, and PPVit denotes the total value of contracts
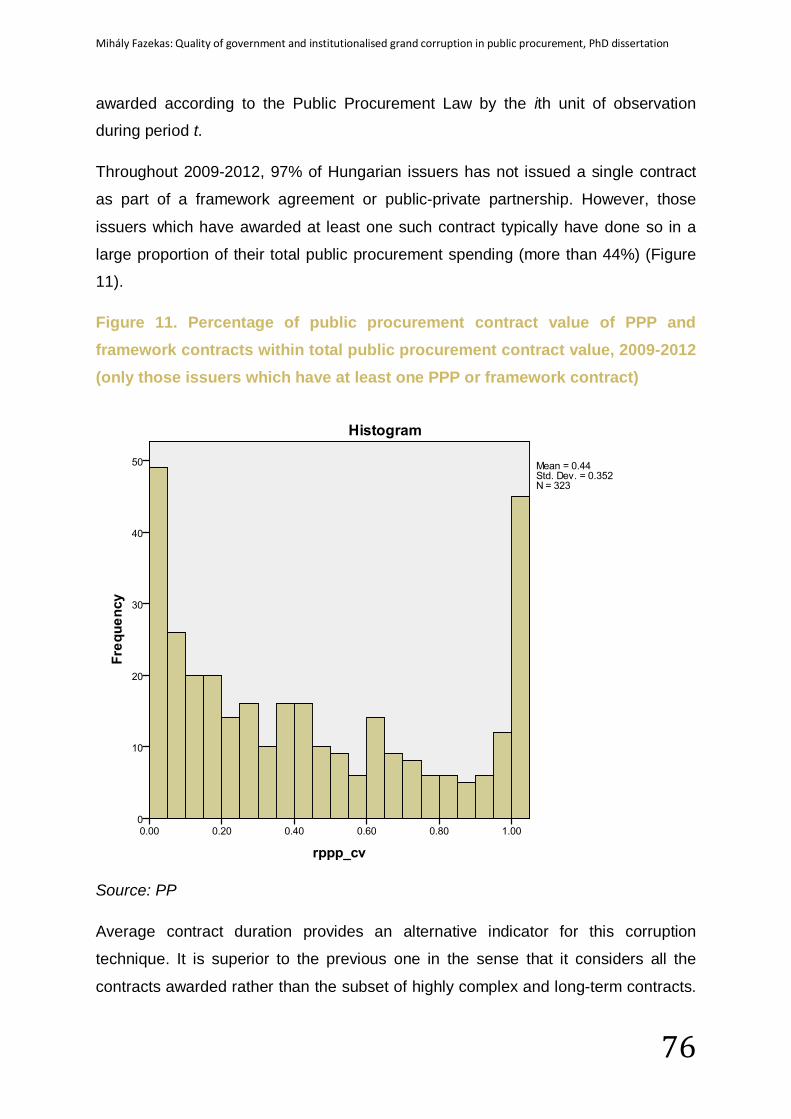
Mihály Fazekas: Quality of government and institutionalised grand corruption in public procurement, PhD dissertation
76
awarded according to the Public Procurement Law by the ith unit of observation
during period t.
Throughout 2009-2012, 97% of Hungarian issuers has not issued a single contract
as part of a framework agreement or public-private partnership. However, those
issuers which have awarded at least one such contract typically have done so in a
large proportion of their total public procurement spending (more than 44%) (Figure
11).
Figure 11. Percentage of public procurement contract value of PPP and framework contracts within total public procurement contract value, 2009-2012 (only those issuers which have at least one PPP or framework contract)
Source: PP
Average contract duration provides an alternative indicator for this corruption
technique. It is superior to the previous one in the sense that it considers all the
contracts awarded rather than the subset of highly complex and long-term contracts.
Mihály Fazekas: Quality of government and institutionalised grand corruption in public procurement, PhD dissertation
77
Following a similar logic to that of eligibility and assessment criteria, we normed
contract length with market average as different technologies imply different
reasonable contract lengths. The proposed metrics is:
ADCDit = Σjk ( CDitjk - ACDk ) / TNCit
where ADCDit denotes the average difference in contract duration between the call
for tenders of the ith unit of observation such as issuer over period t and the average
contract duration at the kth market over period t, CDitjk denotes the contract duration
of the jth contract awarded by the ith unit of observation belonging to the kth market
during period t, ACDk denotes the average contract duration during the whole
observation period for the kth market, and TNCit refers to the total number of
contracts awarded by the ith unit of observation during period t. The limit of
applicability for this metric is that contract duration is often unreliably disclosed in
announcements.
Unfortunately, we could not gather data on the length of all the contracts awarded,
first because some are of unlimited length; second, some others don’t disclose any
information on length even though we have reasons to suspect that they are of
limited length24. There are about than 31 000 contracts where we have sufficient
data on contract length (either from calls for tenders, contract award announcements
or contract completion announcements). These reveal that the overwhelming
majority of contracts cluster around the mean of their markets while a small number
of contracts are considerably longer going up to 33 years ‘excess’ duration (Figure
12). This accentuates how atypical PPP-s, framework contracts, and other long term
contracts are in general.
24 Contract length is either given in the contract award notice where there is an explicit requirement for publishing it, but unfortunately the relevant fields often remain empty. A further piece of the puzzle we could make use of is the contract completion announcement which allows for gauging the actual rather than the planned contract length.
Mihály Fazekas: Quality of government and institutionalised grand corruption in public procurement, PhD dissertation
78
Figure 12. Contract length in years (normed by market average), contracts awarded in 2009-2012 (only contracts shorter than 10 years)
Source: PP
T2.6 Tinkering with the submission period Submission periods, that is the time period between the publication of call for tenders
and the deadline for submitting the bids, in Hungary and most EU countries, are
tightly regulated for some procedure types while largely unregulated for others.
Regulation typically implies postulating minimum submission periods for some
procedure types, for example 45 days for open procedure above EU threshold under
normal circumstances. Submission periods constitute a useful tool for limiting
competition, as leaving too little time for preparing bids can effectively exclude
bidders (Kenny & Musatova, 2010; OECD, 2007). An impossibly short submission
period such as one day combined with early information provision to the ‘desired’
winner (T3.1 - selective information provision), so that it can start preparing before
the publication of call for tenders, constitutes a highly effective way of excluding
Mihály Fazekas: Quality of government and institutionalised grand corruption in public procurement, PhD dissertation
79
unwanted bidders. Limiting competition to that bidder, which is part of the corrupt
network, allows for collecting rents. Some of the short deadlines are obviously due to
non-corrupt reasons such as issuers who are under time pressure trying to rush
through a procedure in order to complete a project on time. While this can happen in
some cases to some issuers, regular occurrences of such procedures and extremely
short deadlines may indeed signal deliberate attempts to abuse the system of
submission periods.
Checking whether the submission periods comply with legal requirements appears to
be somewhat effective when the call for tenders is published in the Public
Procurement Bulletin25. The Public Procurement Authority particularly heavily
concentrates on compliance in this area, and the media often picks up some of the
extreme stories. General compliance with legal requirements was confirmed by
interviewees as well as inspection of time series data in Hungary, but internationally
too (Fazekas & Tóth, 2012b; Oživení, 2011). Hence, it is expected that extremely
short deadlines would appear only for procedure types where little or no regulation
exists and by invoking special reasons for accelerated procedures where heavy
regulation exists. However, procedures where the call for tenders has only been
published on the homepage of the issuer or hasn’t been published at all are
expected to have extremely short submission periods more often.
This corruption technique is closely associated with a number of others. First, as
already mentioned T3.1 - selective information provision constitutes its very crucial
‘tandem’ partner for putting the desired bidder in advantage over other bidders.
Second, as procedure type defines the minimum length of submission period, the
success of tinkering with thresholds and exceptions (T2.1) is a powerful determinant
of the availability of this technique. Third, avoiding publication of call for tenders
(T3.2) beyond greatly diminishing transparency also allows for unaccountable use of
deadlines (i.e. it is difficult to check whether the submission period was reasonable).
A telling example of how widespread this technique was shared by one large
procurer: “A fairly small procurement need – about 4 million HUF (14 thousand EUR) 25 According to a ‘test announcement’ recorded by one large issuer in Budapest in collaboration with the authors, there is no automatic control on submission deadlines in the online system of announcement submission. Hence, control relies exclusively on controllers of the Public Procurement Authority spotting the shorter than legal deadlines which has not been 100% accurate as our statistical evidence points out (see below for more details).
Mihály Fazekas: Quality of government and institutionalised grand corruption in public procurement, PhD dissertation
80
- arose in the organisation which had to be met swiftly. We sent out direct invitations
with a one day submission period to the four major players of the market whom we
knew from previous purchases. Neither of them even replied to the call. We enquired
their reasons over the phone and 3 out of 4 said that they interpreted the invitation
as ‘set-up’, that is they were needed to mimic competition whereas the winner is
already decided.” Another example widely covered by Hungarian media left four
days of weekend plus national holidays for bidders to submit their bids for a 716
million HUF (2.5 million EUR) creative communications and PR tender26. This case
has even resulted in a court proceeding in which the final decision is still pending;
however the contract has been signed and delivery commenced so any court
decision is unlikely to interrupt the suspicious deal.
We propose three direct indicators each measuring the same technique from a
slightly different angle:
A) proportion of tenders with accelerated submission periods within all
procedures,
B) proportion of tenders with extremely short submission periods within all
procedures, and
C) average contract value per weekday available for submission.
As Hungarian law allows for accelerating procedures (i.e. shortening submission
periods), a direct indication of circumventing regulations of submission periods is the
frequency or regularity of accelerated procedures. The legal framework determining
acceleration rules and the minimum number of days has been intricately complex
and has changed frequently. Hence, a simple approach was taken reflecting both
general rules of accelerated procedures and the empirical distributions of submission
periods (cut-points can be found in Table 4).
26 For the original call for tenders: http://www.kozbeszerzes.hu/adatbazis/mutat/hirdetmeny/portal_12337_2012/ and the contract award notice: http://www.kozbeszerzes.hu/adatbazis/mutat/hirdetmeny/portal_14257_2012/
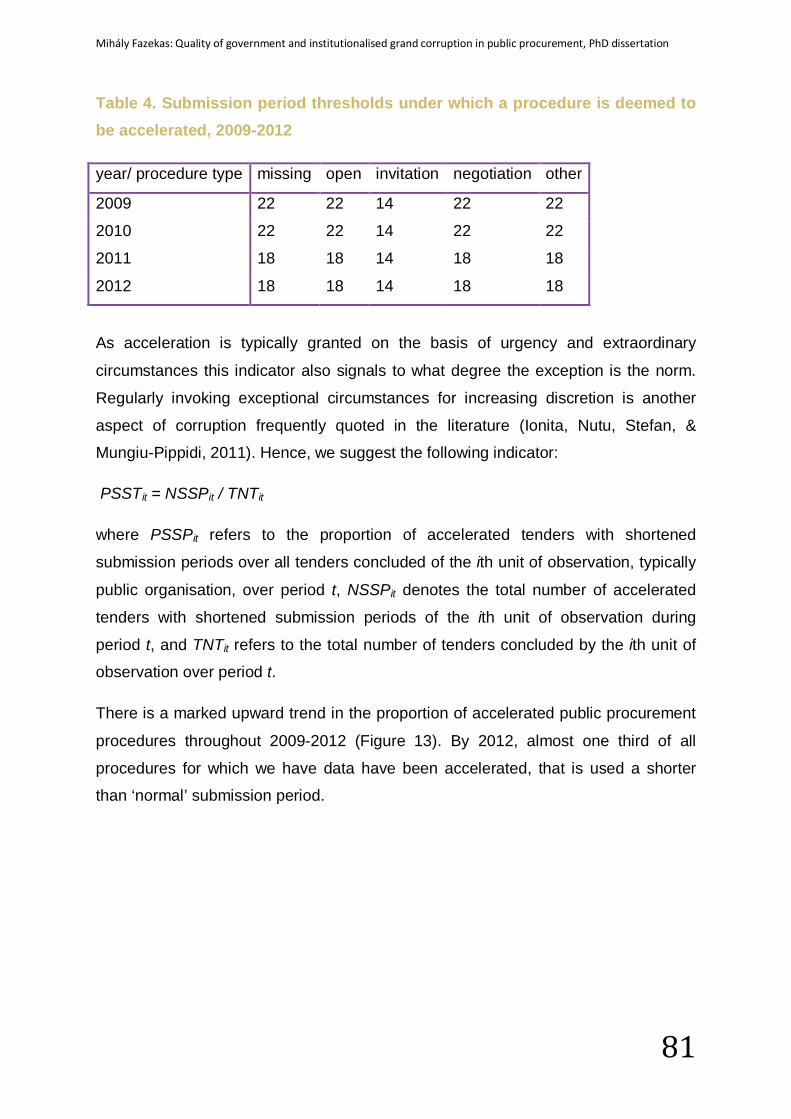
Mihály Fazekas: Quality of government and institutionalised grand corruption in public procurement, PhD dissertation
81
Table 4. Submission period thresholds under which a procedure is deemed to be accelerated, 2009-2012
year/ procedure type missing open invitation negotiation other
2009 22 22 14 22 22
2010 22 22 14 22 22
2011 18 18 14 18 18
2012 18 18 14 18 18
As acceleration is typically granted on the basis of urgency and extraordinary
circumstances this indicator also signals to what degree the exception is the norm.
Regularly invoking exceptional circumstances for increasing discretion is another
aspect of corruption frequently quoted in the literature (Ionita, Nutu, Stefan, &
Mungiu-Pippidi, 2011). Hence, we suggest the following indicator:
PSSTit = NSSPit / TNTit
where PSSPit refers to the proportion of accelerated tenders with shortened
submission periods over all tenders concluded of the ith unit of observation, typically
public organisation, over period t, NSSPit denotes the total number of accelerated
tenders with shortened submission periods of the ith unit of observation during
period t, and TNTit refers to the total number of tenders concluded by the ith unit of
observation over period t.
There is a marked upward trend in the proportion of accelerated public procurement
procedures throughout 2009-2012 (Figure 13). By 2012, almost one third of all
procedures for which we have data have been accelerated, that is used a shorter
than ‘normal’ submission period.
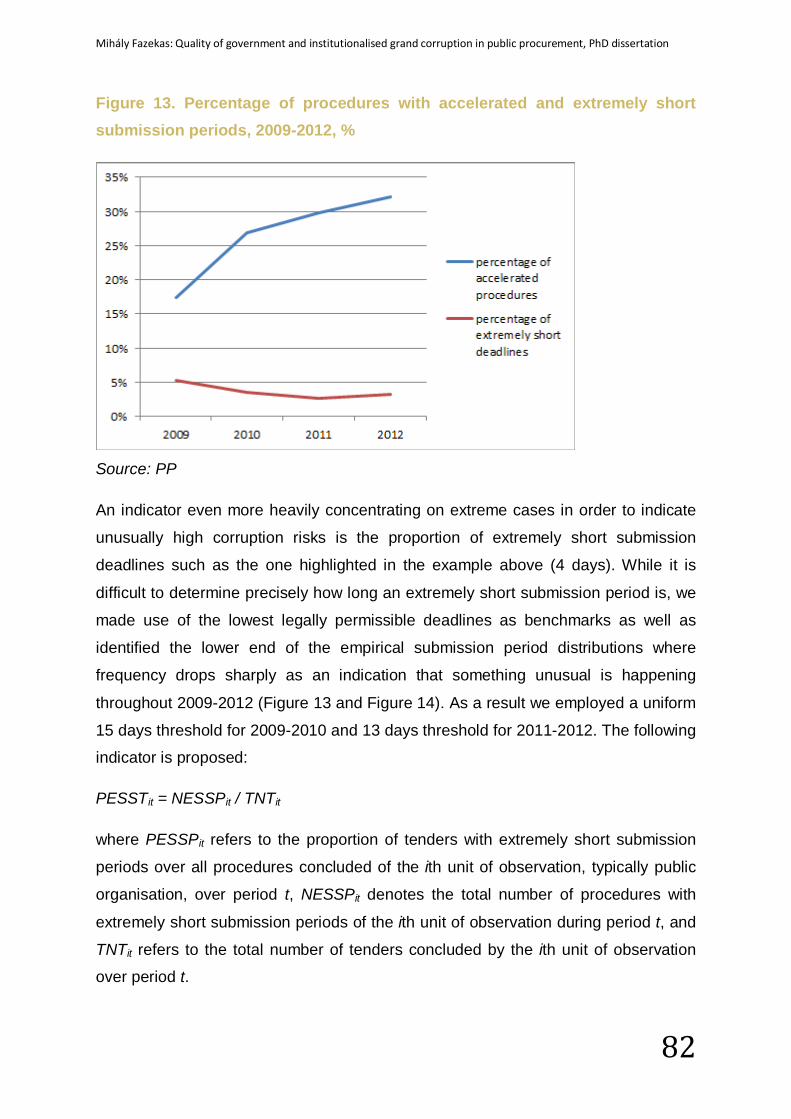
Mihály Fazekas: Quality of government and institutionalised grand corruption in public procurement, PhD dissertation
82
Figure 13. Percentage of procedures with accelerated and extremely short submission periods, 2009-2012, %
Source: PP
An indicator even more heavily concentrating on extreme cases in order to indicate
unusually high corruption risks is the proportion of extremely short submission
deadlines such as the one highlighted in the example above (4 days). While it is
difficult to determine precisely how long an extremely short submission period is, we
made use of the lowest legally permissible deadlines as benchmarks as well as
identified the lower end of the empirical submission period distributions where
frequency drops sharply as an indication that something unusual is happening
throughout 2009-2012 (Figure 13 and Figure 14). As a result we employed a uniform
15 days threshold for 2009-2010 and 13 days threshold for 2011-2012. The following
indicator is proposed:
PESSTit = NESSPit / TNTit
where PESSPit refers to the proportion of tenders with extremely short submission
periods over all procedures concluded of the ith unit of observation, typically public
organisation, over period t, NESSPit denotes the total number of procedures with
extremely short submission periods of the ith unit of observation during period t, and
TNTit refers to the total number of tenders concluded by the ith unit of observation
over period t.
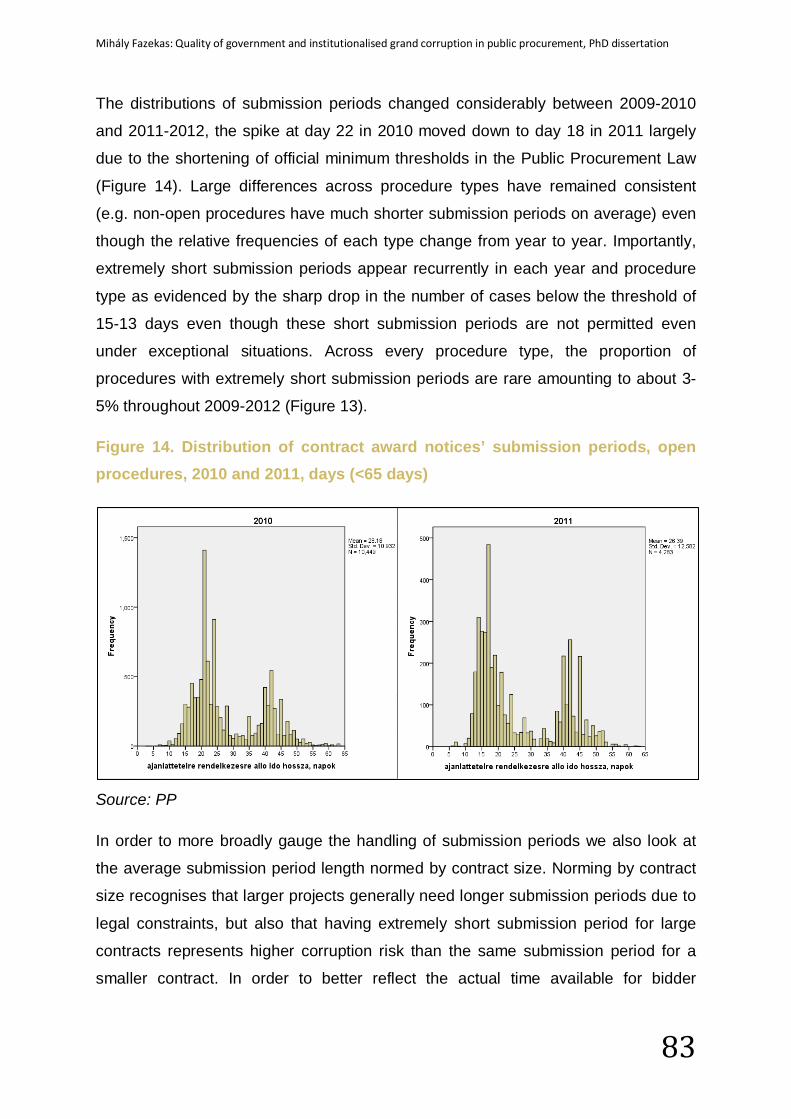
Mihály Fazekas: Quality of government and institutionalised grand corruption in public procurement, PhD dissertation
83
The distributions of submission periods changed considerably between 2009-2010
and 2011-2012, the spike at day 22 in 2010 moved down to day 18 in 2011 largely
due to the shortening of official minimum thresholds in the Public Procurement Law
(Figure 14). Large differences across procedure types have remained consistent
(e.g. non-open procedures have much shorter submission periods on average) even
though the relative frequencies of each type change from year to year. Importantly,
extremely short submission periods appear recurrently in each year and procedure
type as evidenced by the sharp drop in the number of cases below the threshold of
15-13 days even though these short submission periods are not permitted even
under exceptional situations. Across every procedure type, the proportion of
procedures with extremely short submission periods are rare amounting to about 3-
5% throughout 2009-2012 (Figure 13).
Figure 14. Distribution of contract award notices’ submission periods, open procedures, 2010 and 2011, days (<65 days)
Source: PP
In order to more broadly gauge the handling of submission periods we also look at
the average submission period length normed by contract size. Norming by contract
size recognises that larger projects generally need longer submission periods due to
legal constraints, but also that having extremely short submission period for large
contracts represents higher corruption risk than the same submission period for a
smaller contract. In order to better reflect the actual time available for bidder
Mihály Fazekas: Quality of government and institutionalised grand corruption in public procurement, PhD dissertation
84
preparing for a tender, we took the number of weekdays as a reference rather than
calendar days as prescribed in the Public Procurement Law. Hence, the indicator is:
ASPVit = ( Σj ( CVitj / SPitj )) / TNTit
where ASPVit refers to the average contract value per number of weekdays available
for submission for the ith unit of observation, typically public organisation, over
period t, SPit denotes the number of week days available for submission in the jth
procedure of the ith unit of observation during period t, CVit refers to the contract
value of the jth procedure by the ith unit of observation over period t, and TNTit refers
to the total number of tenders concluded by the ith unit of observation over period t.
This indicator cannot be treated as a continuous measure of corruption risks. Rather,
its high values indicate unusually high corruption risks and middle and low values
convey very little as to the level of corruption risks involved.
On average, this ratio almost reaches 5 throughout 2009-2012 that is, there were
almost 5 million HUF of contract value for each weekday of submission period. It is
noteworthy that the distribution of this ratio is highly skewed with only few very large
numbers (Figure 15). As submission periods may also reflect differences in
technology and industry standards, it is conceivable that norming by market means
leads to a better indicator.
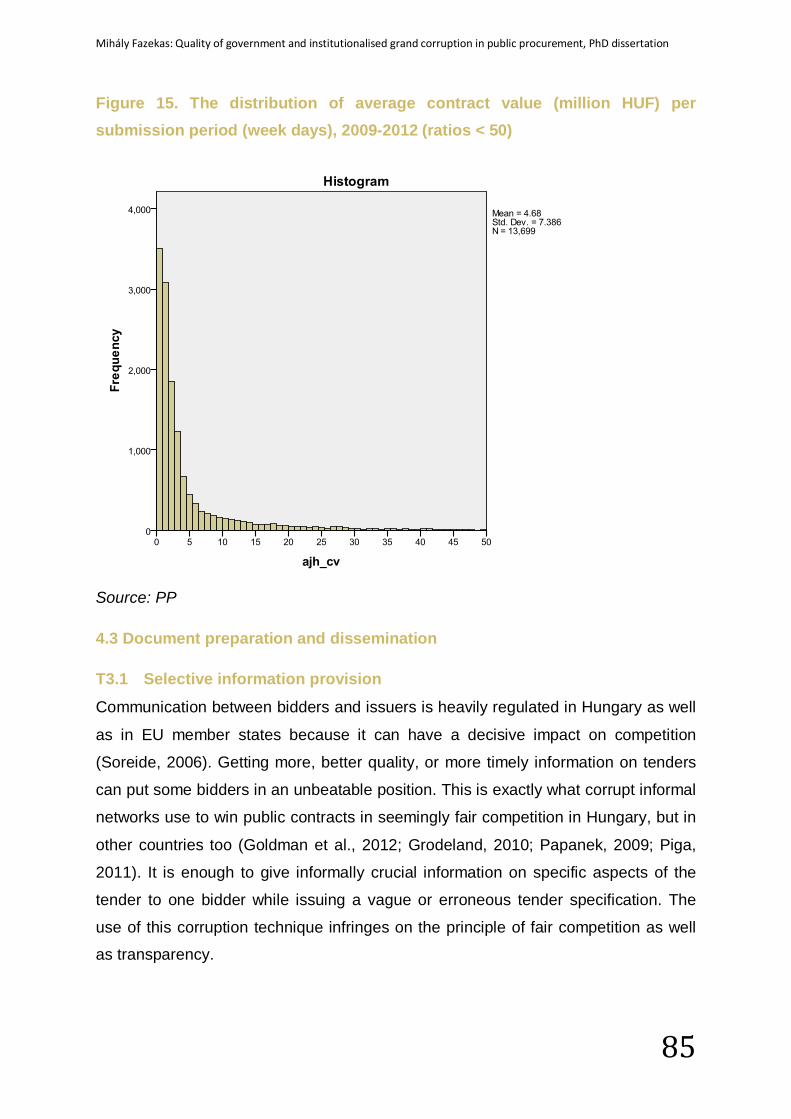
Mihály Fazekas: Quality of government and institutionalised grand corruption in public procurement, PhD dissertation
85
Figure 15. The distribution of average contract value (million HUF) per submission period (week days), 2009-2012 (ratios < 50)
Source: PP
4.3 Document preparation and dissemination
T3.1 Selective information provision
Communication between bidders and issuers is heavily regulated in Hungary as well
as in EU member states because it can have a decisive impact on competition
(Soreide, 2006). Getting more, better quality, or more timely information on tenders
can put some bidders in an unbeatable position. This is exactly what corrupt informal
networks use to win public contracts in seemingly fair competition in Hungary, but in
other countries too (Goldman et al., 2012; Grodeland, 2010; Papanek, 2009; Piga,
2011). It is enough to give informally crucial information on specific aspects of the
tender to one bidder while issuing a vague or erroneous tender specification. The
use of this corruption technique infringes on the principle of fair competition as well
as transparency.
Mihály Fazekas: Quality of government and institutionalised grand corruption in public procurement, PhD dissertation
86
There is little effective external control on any of these information flows as it is
difficult, if not impossible, to monitor informal talks and information transmission
through intermediaries. Several of our interviewees confirmed that there are informal
talks putting the well-connected bidders in an advantageous position in Hungary
rather frequently.
This technique is related to the choice of procedure type (T2.1) as less transparent
procedure types such as negotiation make it very easy to provide information to one
bidder while concealing it from other bidders. Furthermore, T2.7-tinkering with
submission period works neatly in tandem with this technique as early informal
‘warning’ of the preferred bidder of a future call for tenders with very short
submission deadline gives it a decisive competitive advantage (e.g. in extreme cases
it can be the only one actually able to put together a valid bid).
A construction company’s public procurement manager gave the example in an
interview where there were two sets of tender documents: one for the official tender
documentation and another one for the “friendly bidder” (in Hungarian: “csókos
pályázó”). As a result, the “friendly bidder” was at a great advantage over all other
bidders in terms of more accurate and detailed tendering information.
Due to the high level of secrecy and lack of any direct record of unfair information
provision there is no direct indicator. The use of extremely short submission periods,
which make it impossible to put together a bid on time without prior information, can
indirectly signal the use of this corruption technique. Hence, the two indirect
indicators:
A) proportion of tenders with extremely short submission periods within all
procedures; and
B) proportion of procedures with call for tenders modified within all procedures.
The first indicator is likely able to signal only a particular type of corruption dealing
(i.e. prior information provision) rather than all types falling under the umbrella of this
corruption technique (e.g. better quality information provided to the pre-selected
bidder). For detailed discussion of this indicator see section T2.6.
For the second indirect indicator relating to modifications of call for tenders, we adopt
the following formula:
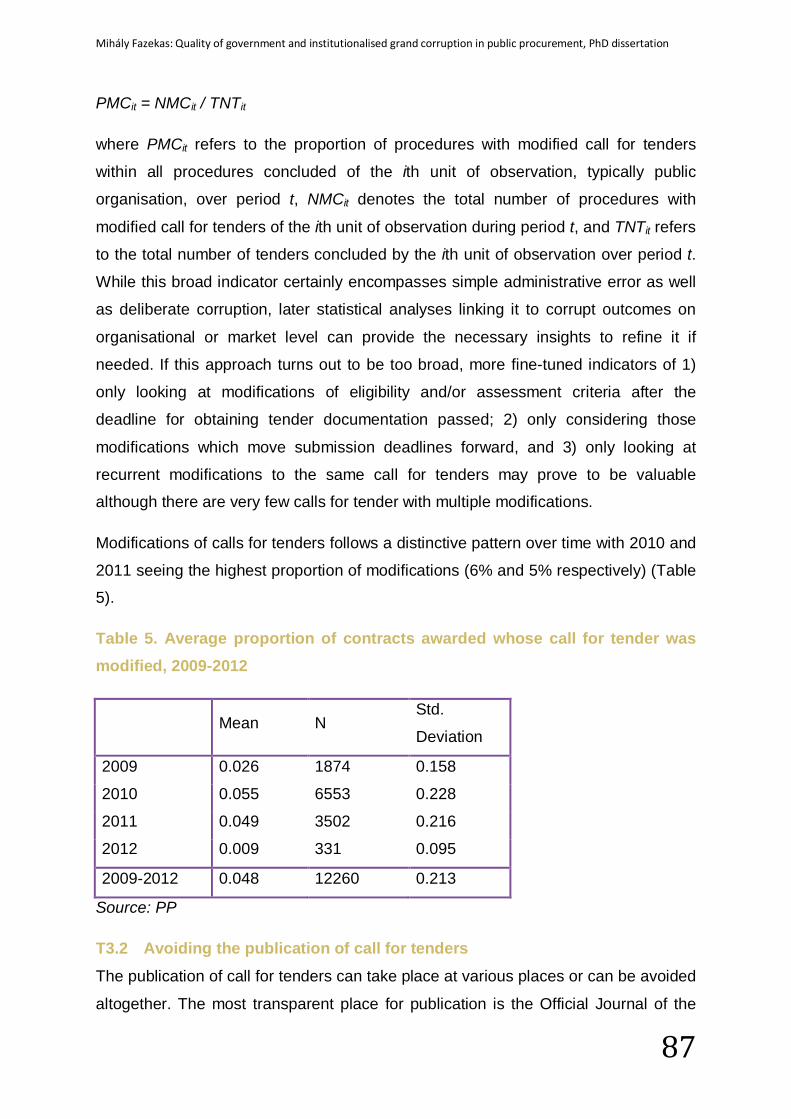
Mihály Fazekas: Quality of government and institutionalised grand corruption in public procurement, PhD dissertation
87
PMCit = NMCit / TNTit
where PMCit refers to the proportion of procedures with modified call for tenders
within all procedures concluded of the ith unit of observation, typically public
organisation, over period t, NMCit denotes the total number of procedures with
modified call for tenders of the ith unit of observation during period t, and TNTit refers
to the total number of tenders concluded by the ith unit of observation over period t.
While this broad indicator certainly encompasses simple administrative error as well
as deliberate corruption, later statistical analyses linking it to corrupt outcomes on
organisational or market level can provide the necessary insights to refine it if
needed. If this approach turns out to be too broad, more fine-tuned indicators of 1)
only looking at modifications of eligibility and/or assessment criteria after the
deadline for obtaining tender documentation passed; 2) only considering those
modifications which move submission deadlines forward, and 3) only looking at
recurrent modifications to the same call for tenders may prove to be valuable
although there are very few calls for tender with multiple modifications.
Modifications of calls for tenders follows a distinctive pattern over time with 2010 and
2011 seeing the highest proportion of modifications (6% and 5% respectively) (Table
5).
Table 5. Average proportion of contracts awarded whose call for tender was modified, 2009-2012
Mean N
Std.
Deviation
2009 0.026 1874 0.158
2010 0.055 6553 0.228
2011 0.049 3502 0.216
2012 0.009 331 0.095
2009-2012 0.048 12260 0.213
Source: PP
T3.2 Avoiding the publication of call for tenders The publication of call for tenders can take place at various places or can be avoided
altogether. The most transparent place for publication is the Official Journal of the
Mihály Fazekas: Quality of government and institutionalised grand corruption in public procurement, PhD dissertation
88
European Union or the Hungarian Public Procurement Bulletin which can guarantee
the highest number of potential bidders informed about the tender (e.g. there are for-
profit providers who recycle and disseminate procurement notices to potential
bidders27). If issuers decide to only publish the call for tenders on their homepage it
still can be considered as transparent, but considerably less as potential bidders may
find it harder to monitor hundreds of individual homepages as opposed to one
national page of public procurement. In the case when no call for tender is published
at all, but instead it is sent to selected bidders the principle of transparency is
violated the most extensively. While the choice of publication organ is regulated by
the Public Procurement Law, which requires publication in the Public Procurement
Bulletin in the case of large tenders, issuers can effectively choose the place of
publication in a great number of cases28. If choice is exercised in favour of less
transparency, leading to lower number of bidders, it can be suspected that the issuer
may have something to hide, thus raising corruption risks (Heggstad & Froystad,
2011; Lengwiler & Wolfstetter, 2006; OECD, 2007; Ware, Moss, Campos, & Noone,
2007).
The effectiveness of the external control of this corruption technique is problematic.
As was underlined earlier, periodic reviews of individual organisations’ public
procurement activity and the rare systemic reviews by SAO constitute a weak
instrument against abuses (Báger, 2011). When contract award announcements
appear in the Public Procurement Bulletin, their references to prior call for tenders
are checked but procedures are hardly ever cancelled due to a missing call for
tenders.
This corruption technique is strongly associated with T2.1-tinkering with thresholds
and exceptions defining the procedural regime to follow. As when the procedure type
prescribes publication in the official journal, avoiding publicity becomes harder for
issuers. Moreover, this technique forms a formidable combination with T2.6-tinkering
with the submission period as publishing the call for tenders in a difficult to reach
location (e.g. a hard to find part of the institution’s own homepage) with a very short
27 For example: www.tender-ertesito.hu 28 In fact, the crosstabulation of procedure type and call for tenders published in the official journal reveals that a great many call for tenders are published in the Public Procurement Bulletin even though no regulation prescribes it. On the other hand, there are many procedures whereby the call for tenders should have been published in the Bulletin still it cannot be found there.
Mihály Fazekas: Quality of government and institutionalised grand corruption in public procurement, PhD dissertation
89
deadline competition from unwanted bidders can be minimized. Finally, this
technique may be traded off with T3.3 - strategically modifying the call for tenders.
There is only one direct indicator proposed for this corruption technique focusing on
the difference between the most widely used publication organ (Public Procurement
Bulletin) and all other venues:
A) proportion of procedures without call for tenders in the official journal within all
procedures.
This indicator is directly measured by the following formula:
PNPCit = NNPCit / TNTit
where PNPCit refers to the proportion of procedures without a call for tenders
published in the Hungarian Pubic Procurement Bulletin29 within all procedures
concluded of the ith unit of observation, typically public organisation, over period t,
NNPCit denotes the total number of procedures without a call for tenders published
in the Hungarian Pubic Procurement Bulletin of the ith unit of observation during
period t, and TNTit refers to the total number of tenders concluded by the ith unit of
observation over period t.
Interestingly, there has been a large increase in the proportion of procedures without
call for tenders in the Public Procurement Bulletin between 2009-2010 and 2011-
2012 largely coinciding the new government entering office. In 2009-2010 it
amounted to 17%-24%, but jumped to 57%267% in 2011-2012 (Table 6). While the
full account of the reasons behind this pattern requires further analysis changes in
the Public Procurement Law under the new government contributed for sure.
29 This Bulletin also contains copies of announcements in the European Union’s Official Journal (TED) issued by Hungarian authorities.
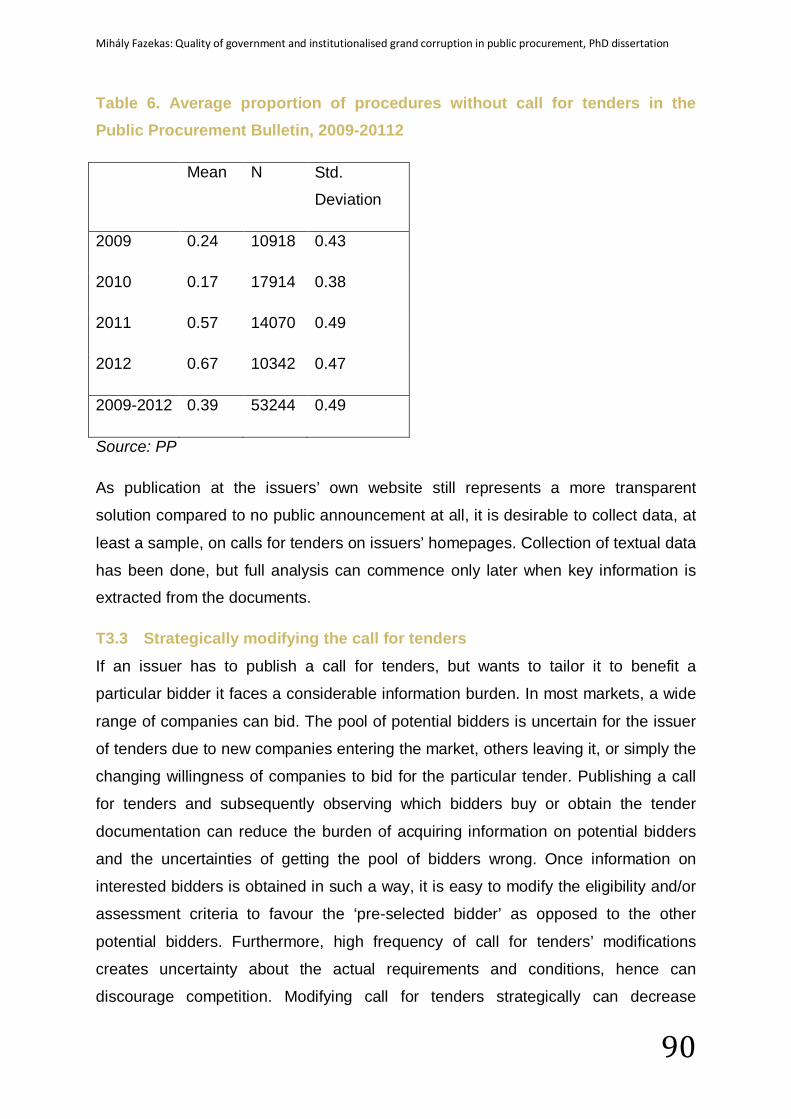
Mihály Fazekas: Quality of government and institutionalised grand corruption in public procurement, PhD dissertation
90
Table 6. Average proportion of procedures without call for tenders in the Public Procurement Bulletin, 2009-20112
Mean N Std.
Deviation
2009 0.24 10918 0.43
2010 0.17 17914 0.38
2011 0.57 14070 0.49
2012 0.67 10342 0.47
2009-2012 0.39 53244 0.49
Source: PP
As publication at the issuers’ own website still represents a more transparent
solution compared to no public announcement at all, it is desirable to collect data, at
least a sample, on calls for tenders on issuers’ homepages. Collection of textual data
has been done, but full analysis can commence only later when key information is
extracted from the documents.
T3.3 Strategically modifying the call for tenders If an issuer has to publish a call for tenders, but wants to tailor it to benefit a
particular bidder it faces a considerable information burden. In most markets, a wide
range of companies can bid. The pool of potential bidders is uncertain for the issuer
of tenders due to new companies entering the market, others leaving it, or simply the
changing willingness of companies to bid for the particular tender. Publishing a call
for tenders and subsequently observing which bidders buy or obtain the tender
documentation can reduce the burden of acquiring information on potential bidders
and the uncertainties of getting the pool of bidders wrong. Once information on
interested bidders is obtained in such a way, it is easy to modify the eligibility and/or
assessment criteria to favour the ‘pre-selected bidder’ as opposed to the other
potential bidders. Furthermore, high frequency of call for tenders’ modifications
creates uncertainty about the actual requirements and conditions, hence can
discourage competition. Modifying call for tenders strategically can decrease
Mihály Fazekas: Quality of government and institutionalised grand corruption in public procurement, PhD dissertation
91
transparency and discourage competition. This technique is primarily based on
interview evidence coming from Hungary, so it may represent a Hungarian speciality
or it may simply have escaped the attention of the literature so far.
Even though inadmissible eligibility or assessment criteria can be and does get
detected and removed, the control of changing any criteria is very rare if not
completely non-existent according to our interviewees.
This corruption technique is intimately linked to T2.2 - tailoring eligibility criteria and
T2.4 –tailoring assessment criteria, as the combinations can readily increase the
techniques’ effectiveness. For example, initial eligibility criteria can be set so that it
rules out all but one bidder, but when an unexpected or inadequately assessed
bidder obtains the tender documentation, which could successfully bid for the tender,
a modification to the call for tenders’ eligibility criteria can exclude the unwanted
bidder.
After identifying two versions of this corruption technique (i.e. modification after
bidders are known and frequent modifications) it is possible to devise fine-tuned
indicators gauging each version. However, in order to avoid using too narrowly
focused indicators we adopt a broader approach and propose to use the metrics
already discussed above (see section T3.1):
A) proportion of procedures with call for tenders modified within all procedures.
T3.4 Excessively pricey and hard to access documentation Public procurement tendering is open and transparent as long as the necessary
tender documents are easily and cheaply accessible. If documents are difficult or
expensive to obtain some potential bidders may be excluded or at least discouraged
from competing. Asking a considerable price for tender documents is in principle fair;
however, it can exclude less well-off potential bidders and those bidders who find
their chances of winning lower. A rational potential bidder would only buy the tender
documentation if it deems the expected profit (chances of winning * profit earned if
winning) higher than the price of tendering (tender preparation + tender document
costs). If a company knows that it is a sure winner due to its corrupt connections it is
willing to pay a very high price for the documentation; whereas an average bidder
with uncertain winning chances would be less willing to pay a high price. Hence, it is
Mihály Fazekas: Quality of government and institutionalised grand corruption in public procurement, PhD dissertation
92
easy to set the price of documentation so high that it is prohibitive for all the bidders
except for one. Making the acquisition of tender documents difficult is an additional
method for increasing the costs of bidding. The easiest way to acquire documents is
from the internet; however, issuers are free to define the ways of obtaining paper-
based tender documents from themselves or their designated representatives.
Corrupt networks can use these techniques for completely eliminating, or at least
weakening competition. While this method was mentioned by two of our
interviewees, we found little evidence of it in the literature so this corruption
technique is potentially less reliable.
Collecting fees for providing the tender documentation is justified by the costs of
compiling them accruing to the issuer. By law, price should reflect costs of producing
the documents. In practice, it was usual in Hungary to ask for excessive prices up to
several million HUF (several tens of thousands EUR). This practice has changed
lately in Hungary as reported by one of our interviewees with legal background,
when the Public Procurement Arbitration Board has started to force issuers to set
more reasonable, that is lower prices. This shows that in some respects external
control may function well in Hungary.
This technique can work most effectively together with others aimed at decreasing
competition so that they can leave only the desired company standing in the
competition.
One of the large construction companies operating almost exclusively on the public
procurement market highlighted that high price of tender documentation effectively
deters them from some tenders. Another interviewee working for a most likely
exemplary issuer simply put it: “if one wants competition, it puts all the documents on
the net accessible for free!”.
There is one proposed direct indicator corresponding to one of the forms of this
technique30:
A) price of documentation divided by estimated contract value.
30 That is difficult access to documentation was not possible to measure, however, the location of accessing the tender documents such as postal address, internet address are regularly reported in call for tender announcements so later research can develop an additional indicator.
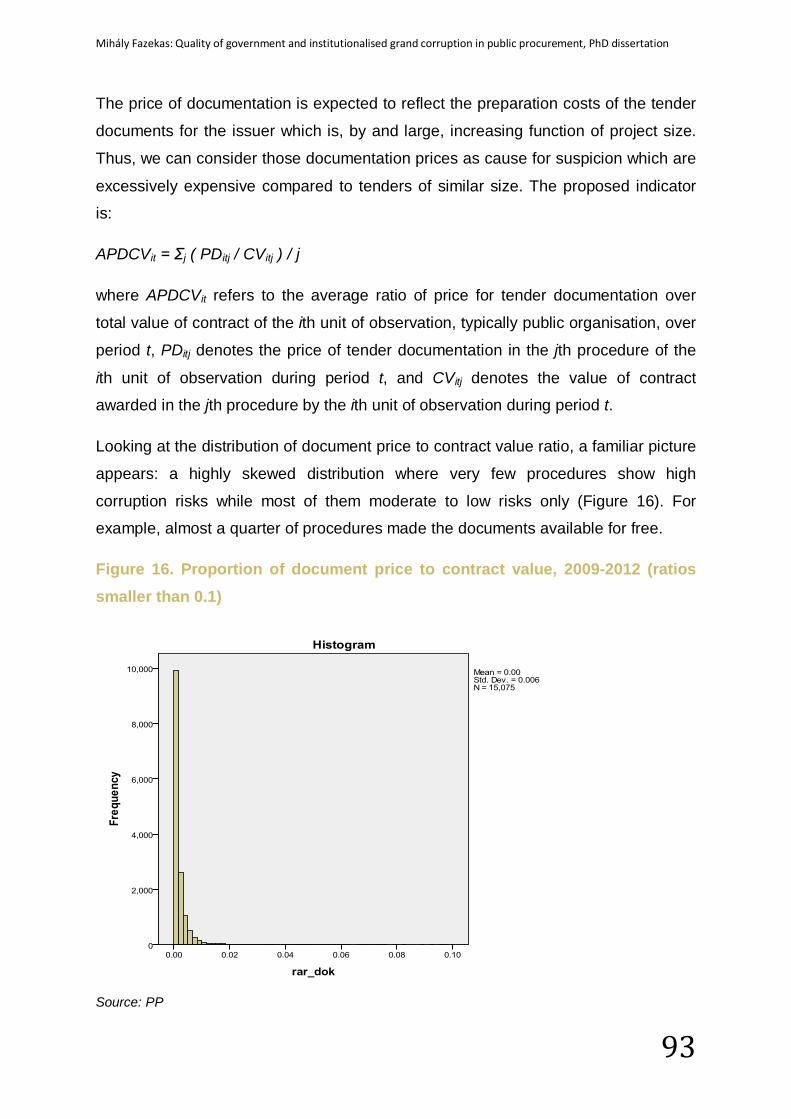
Mihály Fazekas: Quality of government and institutionalised grand corruption in public procurement, PhD dissertation
93
The price of documentation is expected to reflect the preparation costs of the tender
documents for the issuer which is, by and large, increasing function of project size.
Thus, we can consider those documentation prices as cause for suspicion which are
excessively expensive compared to tenders of similar size. The proposed indicator
is:
APDCVit = Σj ( PDitj / CVitj ) / j
where APDCVit refers to the average ratio of price for tender documentation over
total value of contract of the ith unit of observation, typically public organisation, over
period t, PDitj denotes the price of tender documentation in the jth procedure of the
ith unit of observation during period t, and CVitj denotes the value of contract
awarded in the jth procedure by the ith unit of observation during period t.
Looking at the distribution of document price to contract value ratio, a familiar picture
appears: a highly skewed distribution where very few procedures show high
corruption risks while most of them moderate to low risks only (Figure 16). For
example, almost a quarter of procedures made the documents available for free.
Figure 16. Proportion of document price to contract value, 2009-2012 (ratios smaller than 0.1)
Source: PP
Mihály Fazekas: Quality of government and institutionalised grand corruption in public procurement, PhD dissertation
94
T3.5 Deliberate errors in document publication
Preparing and publishing any tender document accurately is essential both for
transparency, accountability and competition. The simple fact of publishing the
necessary announcements is far from sufficient for establishing whether these three
elementary principles are followed in the conduct of an issuer. Accuracy,
completeness, and clarity of information are essential (OECD, 2009). Often, even a
small omission or error can have considerable consequences. For example,
erroneously categorizing a call for tender in the CPV nomenclature can effectively
exclude potential bidders from a tender as most companies search by CPV codes
rather than going through all the announcements made each day (there are
commercial companies offering email alerts to potential bidder companies based on
new calls for tenders in markets defined by CPV codes). This corruption technique
can have basically two effects depending on the phase of the public procurement
procedure: 1) during the tendering phase, omissions and errors can disadvantage
some bidders (Ware et al., 2007); 2) during the award decision and contract
management phase omissions and errors can infringe on the capacity of outsiders to
hold actors accountable. The latter suggests that the use of this technique is not
necessary if other corruption techniques already limited the number of bidders while
making the procedure look by and large legal.
While every announcement is checked by the Hungarian Public Procurement
Authority before publication and corrections are made if necessary, the wide range
and frequent errors in the actual published documents clearly demonstrates that this
check is insufficient. For example, contract value or the name of winner are missing
in many cases. For most errors, even if they are identified by the Authority it can only
ask issuers to correct them, but cannot deny or considerably delay publication in
order to effectively sanction deviance. Nevertheless, there are cases when the
announcement’s publication date is much after the dispatch date of the issuer (i.e.
organisation sent it long time before it actually gets published). More research is
needed to explore why and how this can happen, and most importantly whether
manipulating actual publication data as compared to dispatch date can be intentional
(one interviewee suggested it can be, but failed to provide a detailed account of the
methods used).
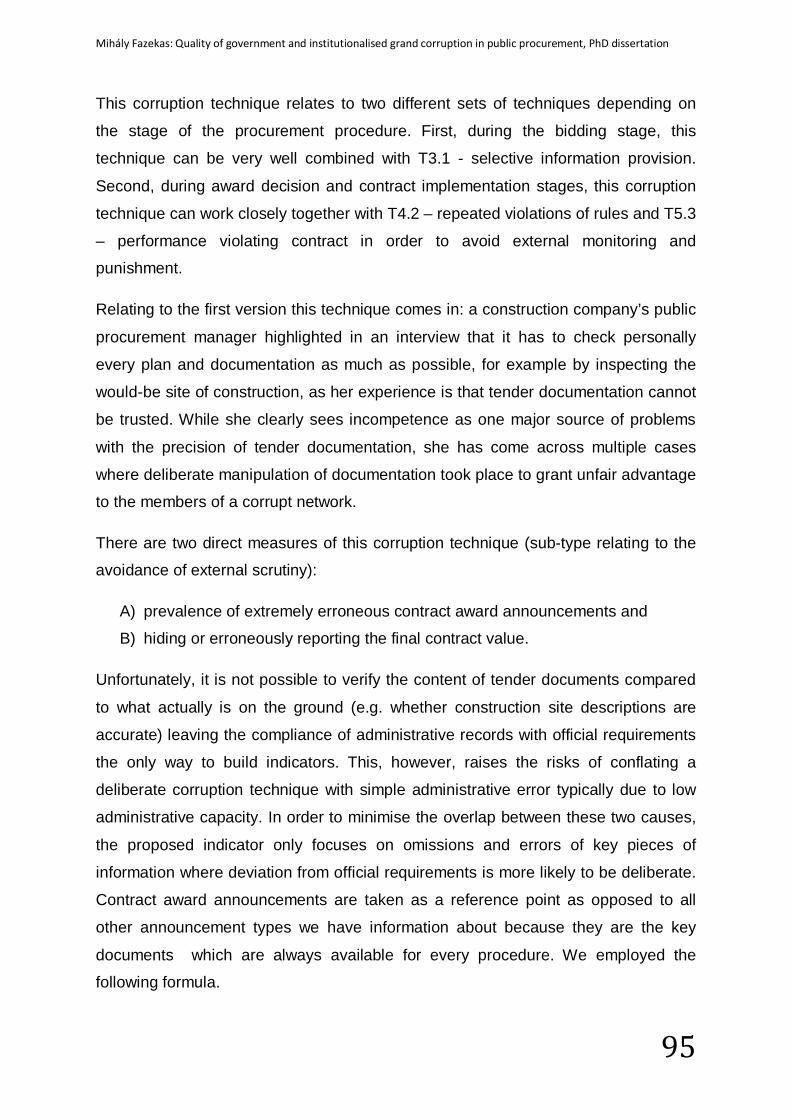
Mihály Fazekas: Quality of government and institutionalised grand corruption in public procurement, PhD dissertation
95
This corruption technique relates to two different sets of techniques depending on
the stage of the procurement procedure. First, during the bidding stage, this
technique can be very well combined with T3.1 - selective information provision.
Second, during award decision and contract implementation stages, this corruption
technique can work closely together with T4.2 – repeated violations of rules and T5.3
– performance violating contract in order to avoid external monitoring and
punishment.
Relating to the first version this technique comes in: a construction company’s public
procurement manager highlighted in an interview that it has to check personally
every plan and documentation as much as possible, for example by inspecting the
would-be site of construction, as her experience is that tender documentation cannot
be trusted. While she clearly sees incompetence as one major source of problems
with the precision of tender documentation, she has come across multiple cases
where deliberate manipulation of documentation took place to grant unfair advantage
to the members of a corrupt network.
There are two direct measures of this corruption technique (sub-type relating to the
avoidance of external scrutiny):
A) prevalence of extremely erroneous contract award announcements and
B) hiding or erroneously reporting the final contract value.
Unfortunately, it is not possible to verify the content of tender documents compared
to what actually is on the ground (e.g. whether construction site descriptions are
accurate) leaving the compliance of administrative records with official requirements
the only way to build indicators. This, however, raises the risks of conflating a
deliberate corruption technique with simple administrative error typically due to low
administrative capacity. In order to minimise the overlap between these two causes,
the proposed indicator only focuses on omissions and errors of key pieces of
information where deviation from official requirements is more likely to be deliberate.
Contract award announcements are taken as a reference point as opposed to all
other announcement types we have information about because they are the key
documents which are always available for every procedure. We employed the
following formula.
Mihály Fazekas: Quality of government and institutionalised grand corruption in public procurement, PhD dissertation
96
PECit = NECit / TNTit
where PECit refers to the proportion of procedures with extremely erroneous contract
award announcements within all procedures concluded of the ith unit of observation,
typically public organisation, over period t, NECit denotes the total number of
procedures with extremely erroneous contract award announcements of the ith unit
of observation during period t, and TNTit refers to the total number of tenders
concluded by the ith unit of observation over period t. Extremely erroneous contract
award announcements were those which lacked or incorrectly reported31 any of the
following information:
• Name of winner,
• Value of contract, and
• Type of procedure.
The proportion of announcements with such errors showed strong increase between
2009-2011, but dropped drastically in 2012 most likely due to the introduction of the
new public procurement law which saw a more stringent control of announcements
(Figure 17). As with many other indicators discussed here, the regularity of
publishing extremely erroneous information is by no means a continuous measure of
corruption. Rather, its high prevalence in spite of sufficient experience with
conducting public procurement is what signals substantial corruption risks.
31 While using unit prices for reporting the final total contract value is clearly deemed as incorrect reporting, this indicator excludes these cases. The reason is that abusing unit prices is a different kind of error than simple omission or unclear information provision. Unit prices are discussed in section T4.4.
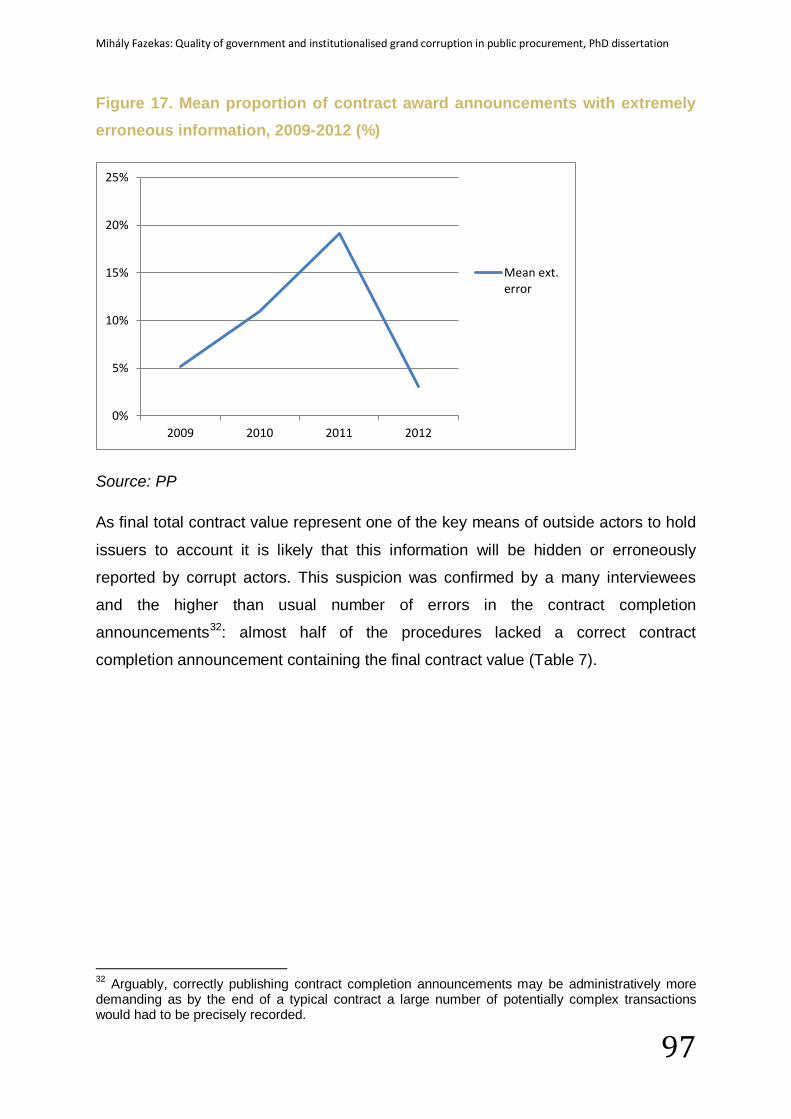
Mihály Fazekas: Quality of government and institutionalised grand corruption in public procurement, PhD dissertation
97
Figure 17. Mean proportion of contract award announcements with extremely erroneous information, 2009-2012 (%)
Source: PP
As final total contract value represent one of the key means of outside actors to hold
issuers to account it is likely that this information will be hidden or erroneously
reported by corrupt actors. This suspicion was confirmed by a many interviewees
and the higher than usual number of errors in the contract completion
announcements32: almost half of the procedures lacked a correct contract
completion announcement containing the final contract value (Table 7).
32 Arguably, correctly publishing contract completion announcements may be administratively more demanding as by the end of a typical contract a large number of potentially complex transactions would had to be precisely recorded.
0%
5%
10%
15%
20%
25%
2009 2010 2011 2012
Mean ext.error
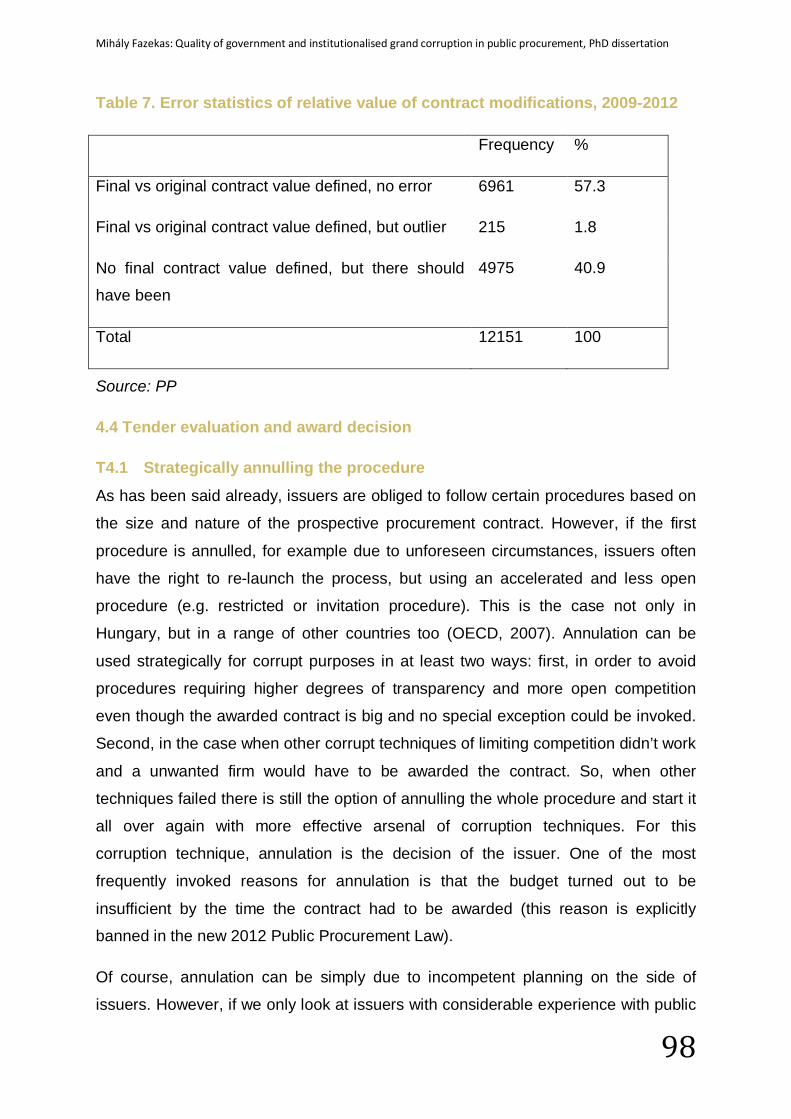
Mihály Fazekas: Quality of government and institutionalised grand corruption in public procurement, PhD dissertation
98
Table 7. Error statistics of relative value of contract modifications, 2009-2012
Frequency %
Final vs original contract value defined, no error 6961 57.3
Final vs original contract value defined, but outlier 215 1.8
No final contract value defined, but there should
have been
4975 40.9
Total 12151 100
Source: PP
4.4 Tender evaluation and award decision
T4.1 Strategically annulling the procedure
As has been said already, issuers are obliged to follow certain procedures based on
the size and nature of the prospective procurement contract. However, if the first
procedure is annulled, for example due to unforeseen circumstances, issuers often
have the right to re-launch the process, but using an accelerated and less open
procedure (e.g. restricted or invitation procedure). This is the case not only in
Hungary, but in a range of other countries too (OECD, 2007). Annulation can be
used strategically for corrupt purposes in at least two ways: first, in order to avoid
procedures requiring higher degrees of transparency and more open competition
even though the awarded contract is big and no special exception could be invoked.
Second, in the case when other corrupt techniques of limiting competition didn’t work
and a unwanted firm would have to be awarded the contract. So, when other
techniques failed there is still the option of annulling the whole procedure and start it
all over again with more effective arsenal of corruption techniques. For this
corruption technique, annulation is the decision of the issuer. One of the most
frequently invoked reasons for annulation is that the budget turned out to be
insufficient by the time the contract had to be awarded (this reason is explicitly
banned in the new 2012 Public Procurement Law).
Of course, annulation can be simply due to incompetent planning on the side of
issuers. However, if we only look at issuers with considerable experience with public
Mihály Fazekas: Quality of government and institutionalised grand corruption in public procurement, PhD dissertation
99
procurement, for example, at least 3 procedures per year, successive annulations of
the same public procurement procedure may in fact signal strategic behaviour to
avoid fair competition and decrease transparency.
As the potential reasons for issuer induced annulation is limited and annulations are
fairly visible, external control may represent a strong obstacle to the application of
this technique. In addition, it is also costly for the issuers as they have to re-run the
same procedure multiple times. Hence, it is likely that this is used either as a
‘solution of last resort’ or as a blunt and expensive technique.
First, this technique is linked in general to all other techniques aiming at decreasing
competition if it is used once the other techniques failed to produce the desired
result. Second, it can also be considered as an extension or alternative to the
tinkering with thresholds and exceptions (T2.1) in order to get the most suitable
procedural regime for corrupt conduct. Third, this technique is similar in effect to the
next technique (T4.2 – violation of public procurement rules) as long as it leads to
the annulation of the procedure. It is, however, very different in origin as it results
from the issuer’s decision whereas T4.2 is due to court decision.
A famous example extensively discussed by the press in Hungary was the contract
for reconstruction the levee next to the settlement Csongrád at river Tisza.33 It took
four procedures to award a contract eventually to the same company as originally
intended. The losing bidders complained several times that the procedure was
tailored to one consortium close to the government and it also raised suspicion that
the issuer annulled the process itself34. In addition, the Public Procurement
Arbitration Board annulled the procedure twice, an issue we will get back to below.
This corruption technique can be associated with one direct indicator:
A) proportion of annulled procedures re-launched subsequently
and indirect indicator:
B) decrease in the number of bids received in subsequent rounds.
33 http://index.hu/belfold/2012/09/13/otodszorre_is_kozgep_nyerte_el_a_milliardos_csongradi_munkat/ 34 http://www.kozbeszerzes.hu/adatbazis/mutat/hirdetmeny/portal_16326_2011/
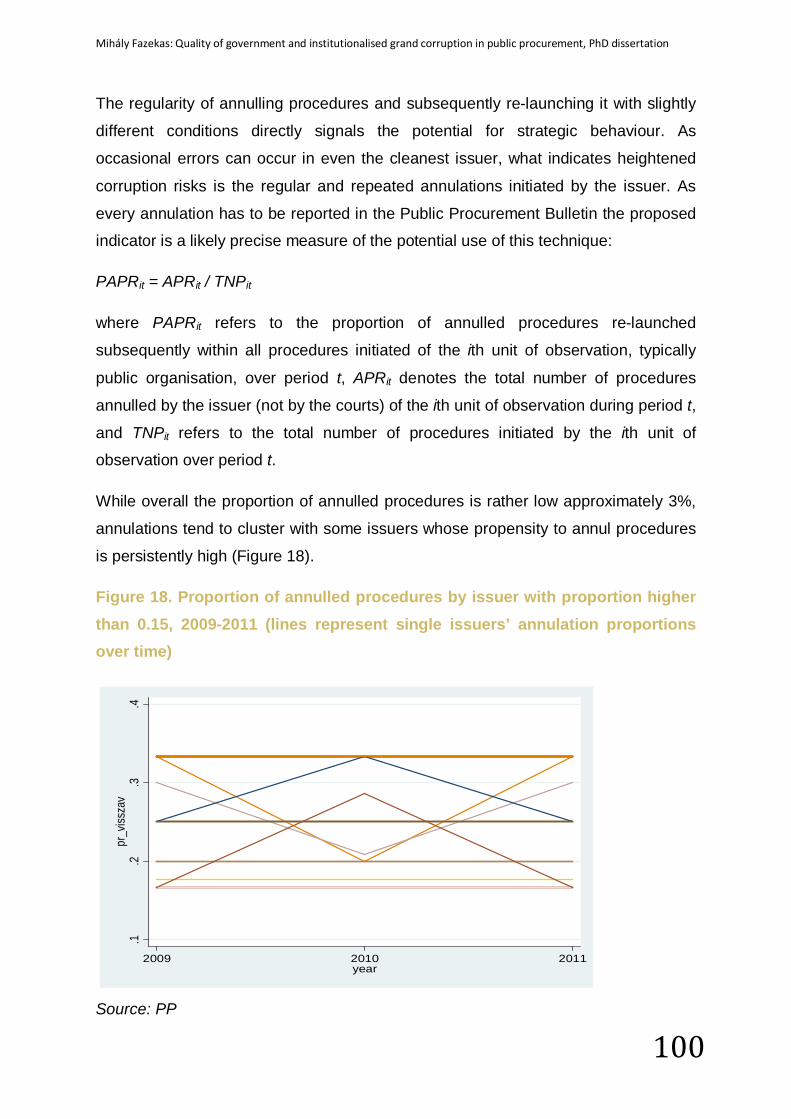
Mihály Fazekas: Quality of government and institutionalised grand corruption in public procurement, PhD dissertation
100
The regularity of annulling procedures and subsequently re-launching it with slightly
different conditions directly signals the potential for strategic behaviour. As
occasional errors can occur in even the cleanest issuer, what indicates heightened
corruption risks is the regular and repeated annulations initiated by the issuer. As
every annulation has to be reported in the Public Procurement Bulletin the proposed
indicator is a likely precise measure of the potential use of this technique:
PAPRit = APRit / TNPit
where PAPRit refers to the proportion of annulled procedures re-launched
subsequently within all procedures initiated of the ith unit of observation, typically
public organisation, over period t, APRit denotes the total number of procedures
annulled by the issuer (not by the courts) of the ith unit of observation during period t,
and TNPit refers to the total number of procedures initiated by the ith unit of
observation over period t.
While overall the proportion of annulled procedures is rather low approximately 3%,
annulations tend to cluster with some issuers whose propensity to annul procedures
is persistently high (Figure 18).
Figure 18. Proportion of annulled procedures by issuer with proportion higher than 0.15, 2009-2011 (lines represent single issuers’ annulation proportions over time)
Source: PP
.1.2
.3.4
pr_v
issza
v
2009 2010 2011year
Mihály Fazekas: Quality of government and institutionalised grand corruption in public procurement, PhD dissertation
101
It follows from the above discussion that the major objective of using this corruption
technique is to limit competition, that is, decreasing the number of bidders to one,
even though decreased competition can be associated with other measures (e.g.
subjective evaluation criteria used for arbitrary scoring). Hence, if subsequent rounds
of re-launched tenders lead to decreased number of bidders it is likely that the
underlying rationale of annulling the procedure was in line with the described
corruption technique. We propose therefore the following indirect indicator signalling
the potential use of this technique:
ADRBit = Σj ( NRBAitj - NRBSitj ) / j
where ADRBit refers to the average difference between the number of bids received
in the annulled and completed public procurement procedures of the ith unit of
observation, typically public organisation, over period t, NRBAitj refers to the number
of bids received in the jth procedure’s annulled award notice of the ith unit of
observation during period t, and NRBSitj refers to the number of bids received in the
jth procedure’s final successful award notice of the ith unit of observation during
period t. As multiple annulations can take place within the same procedure this
indicator simply compares the first and last ‘rounds’ in order to simplify the
calculations. This is justified on the grounds that intermediary annulations (i.e. those
happening between the first and last ‘round’) most likely represent unsuccessful
applications of the technique.
Unfortunately, this indicator could not be calculated due to technical complexities,
further work must be done to arrive at a reliable estimate.
T4.2 Repeated violations of public procurement rules The violation of Public Procurement Laws and regulations represents the simplest
and crudest corruption strategy. As long as violations are not gross, they may remain
undetected making the completed procurement process look legally acceptable.
While violation of some rules is also a hallmark of a range of corruption techniques
discussed in this section, what makes this technique distinct is the repeated
violations within the same procedure (Ware et al., 2007; World Bank, 2007).
Assuming that the judicial control is not completely captured by corrupt networks,
repeated violations mean that the issuer is likely breaching regulations not simply out
of administrative incompetence, but deliberately in order to benefit a ‘desired’
Mihály Fazekas: Quality of government and institutionalised grand corruption in public procurement, PhD dissertation
102
company. If this is really the case, this technique impinges on fair competition and
accountability. Obviously, not every violation and error is a tool for corruption, only
those which appear recurrently suggesting strategic use of ‘minor mistakes’ should
raise suspicion.
In principle, public procurement practice is closely monitored and we can safely
assume that, at least in some cases, judicial control does function properly. But
because, external control of the Public Procurement Arbitration Board, courts, and
SAO is weak in general in this field (Báger, 2011), it is quite possible that repeated
violations are not or partially detected. This, of course, limits our ability to use court
decisions as a reliable indicator.
This corruption technique can be linked to most other techniques, especially those
directly weakening competition.
An excellent example of this technique is the previously mentioned levee
reconstruction project at the river Tisza. While on one occasion the issuer itself
annulled the procedure, twice the Public Procurement Arbitration Board struck it
down. This, nevertheless, did not stop the issuer from awarding the contract to the
same consortium closely associated with the highest echelons of the government.
The only direct indicator for this corruption technique is
A) repeated court rulings against the issuer within the same procedure.
Developing an indicator based on rulings of the Public Procurement Arbitration
Board or the Hungarian courts potentially suffers from biases as monitoring and
adjudication may be influenced strategically by corrupt networks (Jancsics & Jávor,
2012). In order to minimise this bias we only consider cases of repeated court rulings
within the same procedure. The logic behind this twist is that once the first court
ruling was made the case becomes more exposed making it harder for corrupt
networks to strategically turn off judicial review. Hence, repeated court rulings may in
fact represent appropriately the number of actual ‘irregularities’ of the procedure.
Moreover, repeated errors infringing on the Public Procurement Law and other
regulations are more likely to represent deliberate ‘bending’ of rules rather than
simple errors. The proposed indicator is as follows:
Mihály Fazekas: Quality of government and institutionalised grand corruption in public procurement, PhD dissertation
103
PRCRit = RCRit / TNPit
where PRCRit refers to the proportion of procedures with more than one court rulings
against the issuer within all procedures initiated of the ith unit of observation,
typically public organisation, over period t, RCRit denotes the total number of
procedures with more than one court ruling against the issuer of the ith unit of
observation during period t, and TNPit refers to the total number of procedures
initiated by the ith unit of observation over period t.
Using this indicator together with any of the other indicators outlined in this section
may lead to double-counting some techniques. For example, when the court annuls
the procedure for reasons already included in other corruption techniques, we count
it twice in a composite indicator. While in general it may introduce a bias, we don’t
think it is an issue as court decisions are likely involving larger contracts
(administrative fees make it no worth to go for smaller contracts) and more extensive
violations. Hence, this double counting can be considered as weighting the
importance of the revealed violations in some cases and simply revealing additional
corruption risks in others.
Unfortunately, linking court rulings to public procurement procedures requires a large
amount of manual labour as there is no standard reference in court rulings to the
announcement being challenged.35 Further work is needed to finalise this indicator.
T4.3 Unfair scoring
Scoring of competing bids takes place every time bids are evaluated on the basis of
price plus quality. Issuers are obliged to assemble an evaluation committee and
keep records of their scoring. As the process of scoring is internal to the public
organisation and attaching scores to subjective criteria (see T2.4) is difficult to
effectively control from outside, scoring can be easily abused for the benefit of a
corrupt network (Papanek, 2009). If scores are given to benefit a ‘desired’ company
it clearly infringes upon the principle of fair competition.
The process of scoring is difficult to control for external bodies in general, but
especially in the case of subjective evaluation criteria. Bidders who did not win are
35 In fact sometimes there is no direct reference at all besides the names of plaintiff and respondent and the short title of the announcement
Mihály Fazekas: Quality of government and institutionalised grand corruption in public procurement, PhD dissertation
104
likely to question the fairness of scoring; however, due to privacy law and trade
secret considerations their chances of an effective challenge are rather low.
This technique works in tandem with T2.4 – tailoring evaluation criteria, as subjective
criteria defined already at the outset makes the application of this technique easier.
According to one interviewee from the construction sector this technique is most
likely exercised in a subtle way: the call for tenders defines evaluation criteria
regarding non-quantitative performance and the evaluation committee scores these
non-quantitative aspects in a barely visible unfair manner by giving the ‘desired
bidder only one point in addition to the others. Nevertheless, these scores add up in
the end just a little bit higher than the best ‘unwanted’ bidder.
Due to the lack of publicly available detailed records of the scoring and evaluation
processes inside the issuer organisations there could be no direct indicator
developed. Nevertheless, there are three indirect measures36 which could point at
the use of this technique:
A) average contract value per weekdays available for decision,
B) length of evaluation criteria, and
C) weight of non-price criteria.
The number of days passed between the submission deadline and the final decision
in general is likely to indicate the efficiency of the decision making process given the
size (and complexity) of the contract to be awarded (Heggstad & Froystad, 2011;
Strand, Ramada, & Canton, 2011). However, in the case of extremely short periods
that is, a couple of days only the suspicion may arise that the decision was made in
haste without serious consideration rather than extremely efficiently. This suspicion
can be further strengthened if the total value of the contract is taken into account as
more expensive contracts tend to be more complex, requiring longer time to arrive at
an optimal decision. Hence, we propose the following indicator:
ADDCVit = ( Σj (CVitj / DDitj )) / TNTit
36 While in principle extremely short decision periods could be identified in a similar way extremely short submission periods were identified, unfortunately, the distribution of decision periods did not reveal any obvious cut-point or suspiciously short period (minimum was 7 days). Thus, no indicator is developed solely on the basis of decision periods.
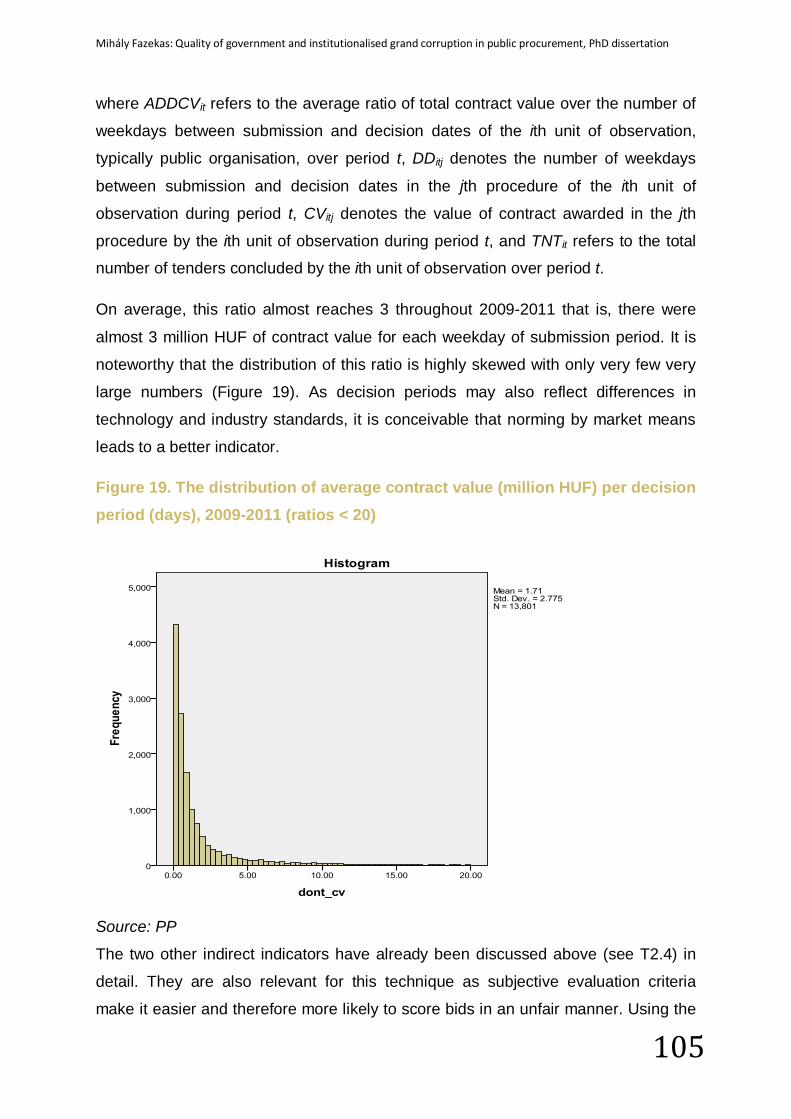
Mihály Fazekas: Quality of government and institutionalised grand corruption in public procurement, PhD dissertation
105
where ADDCVit refers to the average ratio of total contract value over the number of
weekdays between submission and decision dates of the ith unit of observation,
typically public organisation, over period t, DDitj denotes the number of weekdays
between submission and decision dates in the jth procedure of the ith unit of
observation during period t, CVitj denotes the value of contract awarded in the jth
procedure by the ith unit of observation during period t, and TNTit refers to the total
number of tenders concluded by the ith unit of observation over period t.
On average, this ratio almost reaches 3 throughout 2009-2011 that is, there were
almost 3 million HUF of contract value for each weekday of submission period. It is
noteworthy that the distribution of this ratio is highly skewed with only very few very
large numbers (Figure 19). As decision periods may also reflect differences in
technology and industry standards, it is conceivable that norming by market means
leads to a better indicator.
Figure 19. The distribution of average contract value (million HUF) per decision period (days), 2009-2011 (ratios < 20)
Source: PP
The two other indirect indicators have already been discussed above (see T2.4) in
detail. They are also relevant for this technique as subjective evaluation criteria
make it easier and therefore more likely to score bids in an unfair manner. Using the
Mihály Fazekas: Quality of government and institutionalised grand corruption in public procurement, PhD dissertation
106
same indicators for techniques T2.4 and T4.3 reinforces the view that they are
typically applied in tandem.
T4.4 Abusing the unit price of contract value As has been outlined already, it is essential for any reporting system on public
procurement to make information on contract values reliably and transparently
available to the wider public. In this respect transparency may decrease corruption
on its own (Transparency International, 2006). If the contract value is given in unit
prices such as HUF per kWh or % of interest rate without explicitly specifying the
corresponding quantities or at least the estimations of quantities the principle of
transparency is violated as it is not possible to know how much money is being spent
at the end of the day. Using unit prices in public procurement contracts can be
source of abuse and corruption as reported by our interviewees and international
examples (OECD, 2007). Contracts in unit prices allow for adjusting quantity
intransparently throughout the lifespan of the contract hence obtaining corruption
fee.
A particular widespread form of this technique can be found in the services sector
where the pre-selected winner wins the actual tender on the basis of low unit costs.
However, during delivery the corrupt issuer will allow the winner to invoice larger
than actual quantities of at least some of the services delivered. ‘Over-invoicing’ is
easily done without much risk of detection in services sector as hours spent on
giving advice, meetings or fixing machines cannot be easily controlled externally.
Obviously, those bidders which are not offered such a deal prior to bidding cannot
offer so low prices for the services and lose out in competition which on paper looks
fair, but in fact is not.
This corruption technique is closely associated with T3.5 – deliberate errors in
document publication in its approach and effect, but it doesn’t necessary imply an
error in the figures presented rather a failure to provide additional information
required for fully determining the value of a contract. This corruption technique works
well with techniques related to performance of the contract, especially T5.4 –
performance violating the contract, as it renders hiding such improper delivery less
visible.
There is only one direct indicator of this corruption technique:
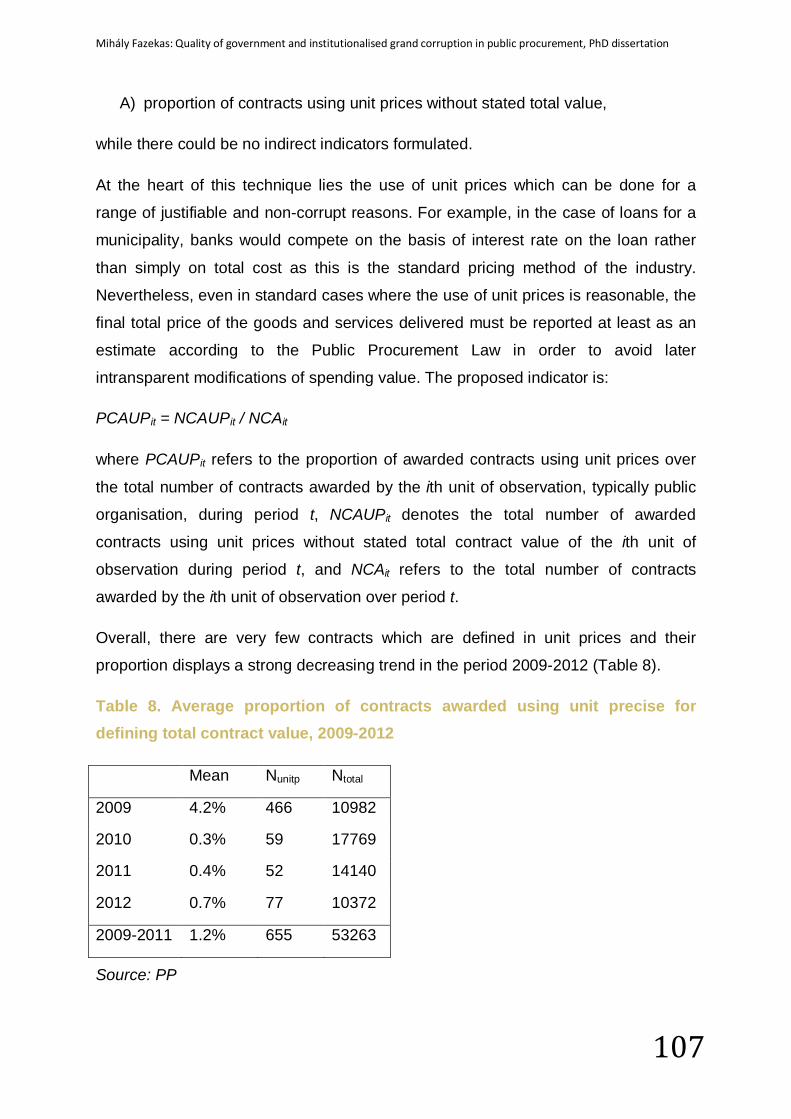
Mihály Fazekas: Quality of government and institutionalised grand corruption in public procurement, PhD dissertation
107
A) proportion of contracts using unit prices without stated total value,
while there could be no indirect indicators formulated.
At the heart of this technique lies the use of unit prices which can be done for a
range of justifiable and non-corrupt reasons. For example, in the case of loans for a
municipality, banks would compete on the basis of interest rate on the loan rather
than simply on total cost as this is the standard pricing method of the industry.
Nevertheless, even in standard cases where the use of unit prices is reasonable, the
final total price of the goods and services delivered must be reported at least as an
estimate according to the Public Procurement Law in order to avoid later
intransparent modifications of spending value. The proposed indicator is:
PCAUPit = NCAUPit / NCAit
where PCAUPit refers to the proportion of awarded contracts using unit prices over
the total number of contracts awarded by the ith unit of observation, typically public
organisation, during period t, NCAUPit denotes the total number of awarded
contracts using unit prices without stated total contract value of the ith unit of
observation during period t, and NCAit refers to the total number of contracts
awarded by the ith unit of observation over period t.
Overall, there are very few contracts which are defined in unit prices and their
proportion displays a strong decreasing trend in the period 2009-2012 (Table 8).
Table 8. Average proportion of contracts awarded using unit precise for defining total contract value, 2009-2012
Mean Nunitp Ntotal
2009 4.2% 466 10982
2010 0.3% 59 17769
2011 0.4% 52 14140
2012 0.7% 77 10372
2009-2011 1.2% 655 53263
Source: PP
Mihály Fazekas: Quality of government and institutionalised grand corruption in public procurement, PhD dissertation
108
4.5 Contract implementation
T5.1 Modifying the contract strategically
What gets delivered by the end of the contractual period is often different from what
was originally contracted. If this deviation is not the result of plain negligence of
contractual obligations then a contract has to be officially modified and announced in
the Public Procurement Bulletin. While contract modifications can take place due to a
range of justifiable reasons, such as exceptionally bad weather constraining
construction works, it can also be abused for corrupt purposes (European Court of
Auditors, 2012; Papanek, 2009). Corruption rent can be earned by increasing prices,
extending deadlines, and diminishing quality each of which is regularly observed in a
range of countries (Heggstad & Froystad, 2011; Kenny & Musatova, 2010; Lengwiler
& Wolfstetter, 2006; OECD, 2007; Transparency International, 2006; Ware et al.,
2007). This technique infringes on the principle of accountability, but it can also harm
fair competition. This is the case when the ‘desired’ bidder knows about the
possibility of contract modification prior to bidding enabling it to offer lower price
and/or higher quality than its competitors
An effective constraint on this technique is that every modification of the original
contract has to be announced in the Public Procurement Bulletin and all the other
bidders have to be notified. There are no indications of regular breach of these
obligations either according to interviews and media reports or court decisions. If the
contract modification concerns aspects of the tender relevant for selecting the
winning bidder those who lost the tender can challenge the contract award in court.
In addition, supporting bodies like the National Development Agency try to minimize
contract modification as much as possible due to EU funding regulations in
particular.
This technique can be employed simultaneously with virtually any other technique.
Nevertheless, it may be a substitute for any corruption technique limiting competition
in the bidding phase as there is no need for modifying the contract if the ‘desired
winner’ could offer a higher price and/or lower quality already at the outset. It is also
a substitute for T5.4 – performance violating contract, as if simple violation is feasible
it is not necessary to risk raising attention through modifying the contract with its
publication requirements.
Mihály Fazekas: Quality of government and institutionalised grand corruption in public procurement, PhD dissertation
109
There could be three direct indicators conceived for this corruption technique while
there is no indirect measure:
A) proportion of modified contracts,
B) difference between the awarded and final contract value, and
C) difference between originally planned and final completion period.
As highlighted above, contracts can be modified for a range of reasons; however,
those markets or issuers where contract modification is a regular practice may still
be considered as higher corruption risk markets or issuers. This is because, we can
expect issuers to develop specific skills over time to manage more complicated or
more uncertain contracts rendering contract modifications for non-corrupt reasons an
exception rather than the rule. By implication, the proposed indicator is:
PMCit = NMCit / NCAit
where PMCit refers to the proportion of awarded contracts which were subsequently
modified over the total number of contracts awarded by the ith unit of observation,
typically public organisation, over period t, NMCit denotes the total number of
awarded contracts which were subsequently modified of the ith unit of observation
during period t, and NCAit refers to the total number of contracts awarded by the ith
unit of observation over period t.
Overall, contract modifications are surprisingly frequent events, annually between
4% to 16% of all contracts were subsequently modified. This underlies the
importance of the contract implementation phase compared to the contract award
phase in terms of final outcomes. What is even more surprising is that a large
number of contracts, over 2300, were modified more than once (Figure 20). On
average modified contracts were modified 2.6 times. Contract modification have
experienced a considerable spike in 2010 and 2011, that is after the new
government came into power suggesting the potential links between electoral cycles
and contract modification activities.
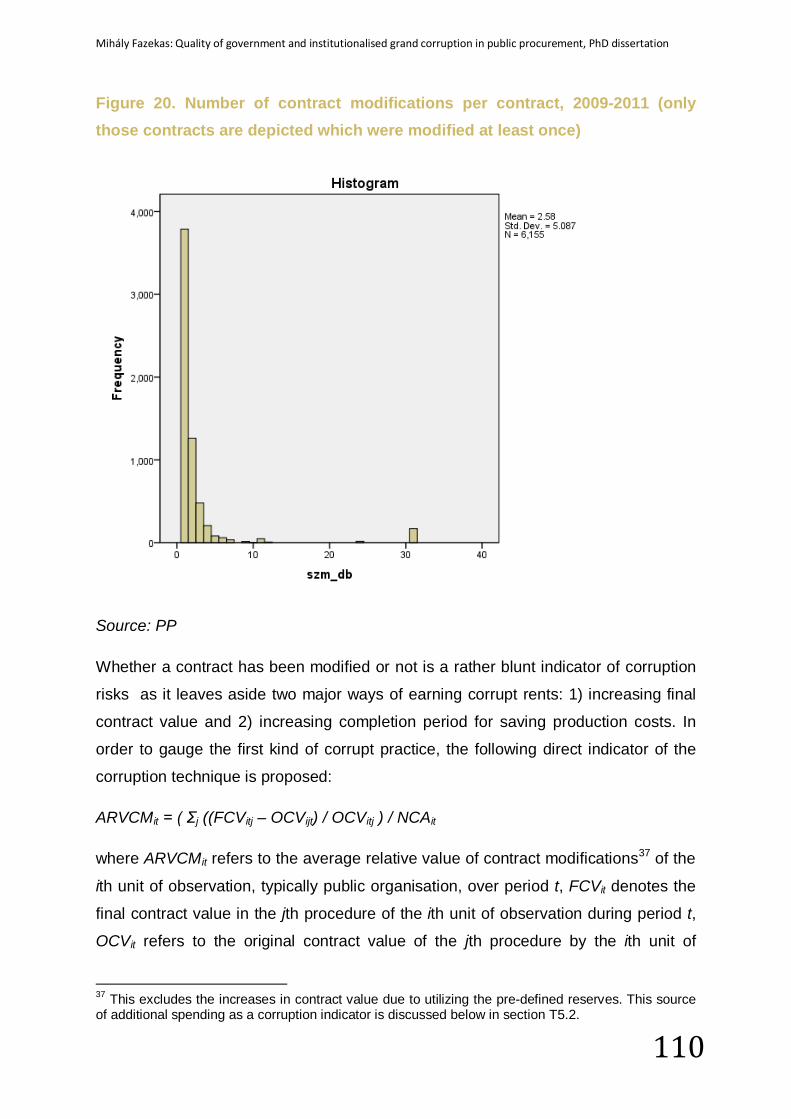
Mihály Fazekas: Quality of government and institutionalised grand corruption in public procurement, PhD dissertation
110
Figure 20. Number of contract modifications per contract, 2009-2011 (only those contracts are depicted which were modified at least once)
Source: PP
Whether a contract has been modified or not is a rather blunt indicator of corruption
risks as it leaves aside two major ways of earning corrupt rents: 1) increasing final
contract value and 2) increasing completion period for saving production costs. In
order to gauge the first kind of corrupt practice, the following direct indicator of the
corruption technique is proposed:
ARVCMit = ( Σj ((FCVitj – OCVijt) / OCVitj ) / NCAit
where ARVCMit refers to the average relative value of contract modifications37 of the
ith unit of observation, typically public organisation, over period t, FCVit denotes the
final contract value in the jth procedure of the ith unit of observation during period t,
OCVit refers to the original contract value of the jth procedure by the ith unit of
37 This excludes the increases in contract value due to utilizing the pre-defined reserves. This source of additional spending as a corruption indicator is discussed below in section T5.2.
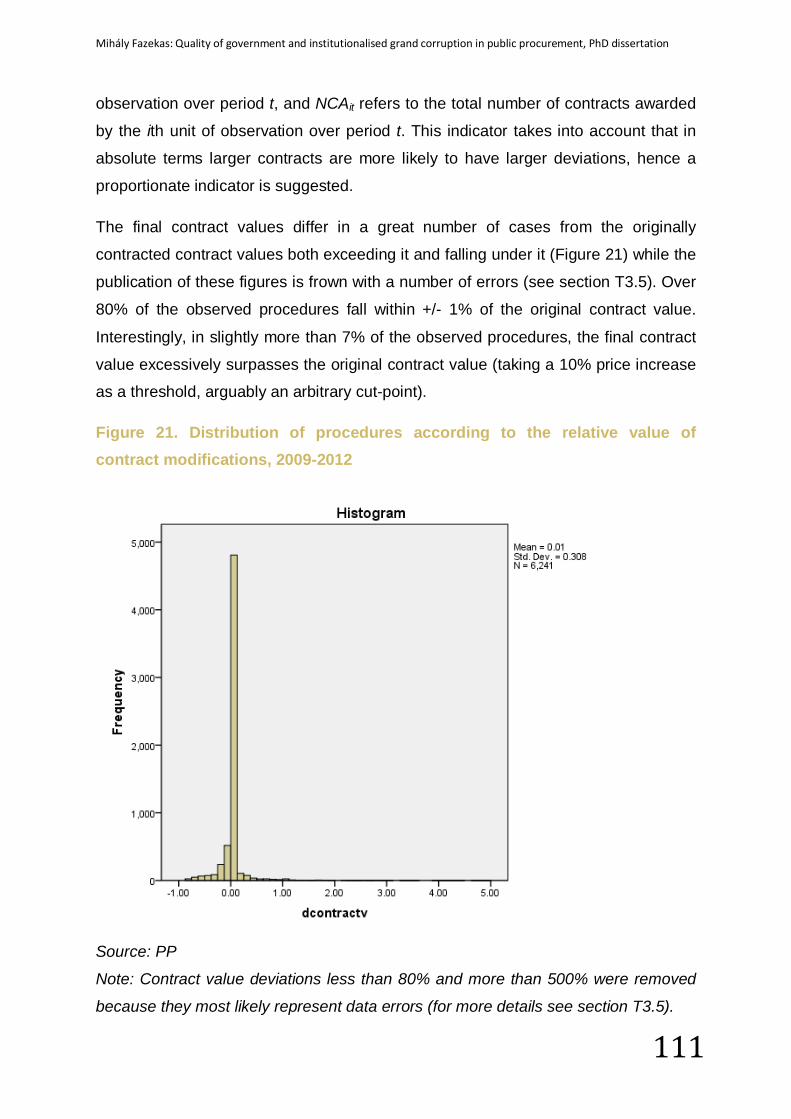
Mihály Fazekas: Quality of government and institutionalised grand corruption in public procurement, PhD dissertation
111
observation over period t, and NCAit refers to the total number of contracts awarded
by the ith unit of observation over period t. This indicator takes into account that in
absolute terms larger contracts are more likely to have larger deviations, hence a
proportionate indicator is suggested.
The final contract values differ in a great number of cases from the originally
contracted contract values both exceeding it and falling under it (Figure 21) while the
publication of these figures is frown with a number of errors (see section T3.5). Over
80% of the observed procedures fall within +/- 1% of the original contract value.
Interestingly, in slightly more than 7% of the observed procedures, the final contract
value excessively surpasses the original contract value (taking a 10% price increase
as a threshold, arguably an arbitrary cut-point).
Figure 21. Distribution of procedures according to the relative value of contract modifications, 2009-2012
Source: PP
Note: Contract value deviations less than 80% and more than 500% were removed
because they most likely represent data errors (for more details see section T3.5).
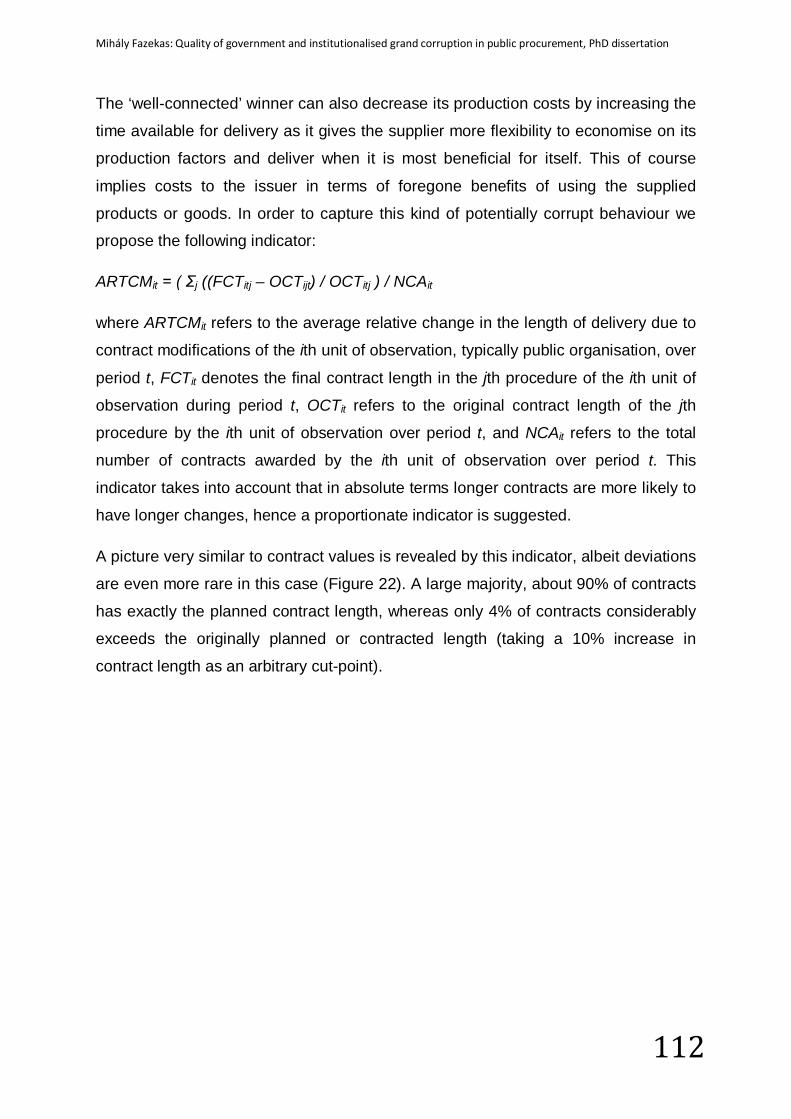
Mihály Fazekas: Quality of government and institutionalised grand corruption in public procurement, PhD dissertation
112
The ‘well-connected’ winner can also decrease its production costs by increasing the
time available for delivery as it gives the supplier more flexibility to economise on its
production factors and deliver when it is most beneficial for itself. This of course
implies costs to the issuer in terms of foregone benefits of using the supplied
products or goods. In order to capture this kind of potentially corrupt behaviour we
propose the following indicator:
ARTCMit = ( Σj ((FCTitj – OCTijt) / OCTitj ) / NCAit
where ARTCMit refers to the average relative change in the length of delivery due to
contract modifications of the ith unit of observation, typically public organisation, over
period t, FCTit denotes the final contract length in the jth procedure of the ith unit of
observation during period t, OCTit refers to the original contract length of the jth
procedure by the ith unit of observation over period t, and NCAit refers to the total
number of contracts awarded by the ith unit of observation over period t. This
indicator takes into account that in absolute terms longer contracts are more likely to
have longer changes, hence a proportionate indicator is suggested.
A picture very similar to contract values is revealed by this indicator, albeit deviations
are even more rare in this case (Figure 22). A large majority, about 90% of contracts
has exactly the planned contract length, whereas only 4% of contracts considerably
exceeds the originally planned or contracted length (taking a 10% increase in
contract length as an arbitrary cut-point).
Mihály Fazekas: Quality of government and institutionalised grand corruption in public procurement, PhD dissertation
113
Figure 22. Distribution of awarded contracts according to the relative change in contract length, 2009-2012, %
Source: PP
T5.2 Abusing an add-on contract or emergency reserve This corruption technique comes in two variants sharing the same logic, but differing
in the method of realisation. First, once a contract is awarded, the need for additional
but linked services or goods can arise, justifying the award of one or more add-on
contracts. For example, unforeseen characteristics of a construction site may require
additional work to be completed such as removing previously unknown objects from
the site. This, nevertheless, creates the opportunity to extract rents in a corrupt
manner (Papanek, 2009). Invoking some sort of technical reason – justified or not –
(e.g. that the company is already on the construction site with its machines and
people) is sufficient to invite only the winner of the prior contract to the public
procurement procedure for the add-on contract (European Court of Auditors, 2012).
Then the sole bidder can set a price substantially above market price earning extra
profit for the corrupt network. If the well-connected bidder knows about the potential
Mihály Fazekas: Quality of government and institutionalised grand corruption in public procurement, PhD dissertation
114
for add-on contracts it can offer low price and/or high quality for the first contract,
even if it loses money on it, as it will be able to more than compensate for the losses
in the second or later contracts.
Second, additional services and goods can also be delivered within the framework of
the main contract if it contained a reserve for unforeseen circumstances. According
to interviewees, winning a contract at a competitive market price knowing that 10-
15% of extra money will surely accompany the main contract from the reserve for
‘unforeseen’ events is the major technique for extracting the corrupt rent in
Hungarian large infrastructure projects. While this variant of the corruption technique
is essentially the same as the use of add-on contracts, it doesn’t require any
additional announcement or external intervention. Hence, it is very difficult to
externally monitor.
While splitting up contracts is heavily regulated by the Public Procurement Law, it is
relatively easy in complex projects, especially in construction, to name some
unforeseen circumstances based on which add-on contracts can be awarded in a
subsequent procedure. In addition, if the add-on contracts fall outside the Public
Procurement Law, for example because they are small, then monitoring and external
review becomes difficult.
A typical example of abusing add-on contracts was shared by one of our
interviewees working as a supplier in the healthcare sector for several decades: “the
contract for delivery of expensive machinery can be awarded to a company offering
impossibly low prices making a considerable loss on the deal. However, moving the
machines within the hospital from one room to another is not part of the original
contract, rather there will be a separate contract between the hospital and the
company using inflated prices (not announced anywhere publicly). For example 100
000 HUF (350 EUR) for moving a machine form one room to another, practically
moving it 10 meters. Then you just need to move those machines a couple of times
back and forth and you can imagine the amount of profit generated…”.
An example for abusing emergency reserves comes from a large highway
construction project where, according to the interviewee, it was easy to find
justification for exhausting the contractual reserves simply by referring to the need
for building auxiliary roads for the construction site. Such roads are built when bad
Mihály Fazekas: Quality of government and institutionalised grand corruption in public procurement, PhD dissertation
115
weather such as heavy rain makes it hard to approach the construction site and
deliver the necessary equipment and material. It is unlikely that any review body
would go and check weather data and contest the necessity of building expensive
auxiliary roads.
Abusing add-on contracts comes very close to T2.1 - tinkering with thresholds and
exceptions, but in this case at least one of the contracts is awarded under the
umbrella of the Public Procurement Law and rules on combining contracts and
exceptions are circumvented only for the other contract(s). Abusing emergency
reserves is very similar in effect to T5.1 – modifying the contract strategically with the
important difference that the contract modification can be achieved within the
framework of the original contract. Furthermore, both of the variants of this technique
can be substitutes for the techniques limiting competition during the bidding phase
as there is no need to limit competition if the ‘pre-selected’ bidder can win through a
fair competitive procedure and subsequently increase its profit through abusing add-
on contracts and emergency reserves.
There could be conceived two direct indicators for this corruption technique,
reflecting the two variants it comes in:
A) proportion of add-on contracts, and
B) proportion of contracts exhausting the planned reserves.
Focusing simply on the regularity of using add-on contracts signals the most
substantive corruption risks, especially if this practice is standard in the given
context. As add-on contracts may well fall below the threshold for applying the Public
Procurement Law many of the less costly instances of this techniques cannot be
recorded by our database. The proposed indicator is the following:
PAOCit = NAOCit / NCAit
where PAOCit refers to the proportion of awarded contracts followed by at least one
add-on contract over the total number of contracts awarded by the ith unit of
observation, typically public organisation, over period t, NAOCit denotes the total
number of awarded contracts followed by at least one add-on contract of the ith unit
of observation during period t, and NCAit refers to the total number of contracts
awarded by the ith unit of observation over period t.
Mihály Fazekas: Quality of government and institutionalised grand corruption in public procurement, PhD dissertation
116
Our method of identifying add-on contracts could only rely on simple key-word
search in the contract title which often highlight the fact that a contract is on top of an
existing one. Unfortunately, there is no standardized definition in the Public
Procurement Law of add-on contracts and no uniform way of linking add-on
contracts to main contracts. By implication, our identification procedure may only
scratch the surface of the phenomenon. We identified 128 add-on contracts
throughout 2009-2012 with a total value of 6.5 million EUR.
Gauging the regularity of exhausting the pre-defined emergency reserve can be
directly measured in the following way even though some issuers may not readily
report the reserves built-in their contracts38:
PEERit = NEECit / NECAit
where PEERit refers to the proportion of awarded contracts exhausting the
emergency reserve over the total number of contracts containing such a reserve
provision awarded by the ith unit of observation, typically public organisation, over
period t, NEECit denotes the total number of awarded contracts exhausting the
emergency reserve of the ith unit of observation during period t, and NECAit refers to
the total number of contracts containing a reserve provision awarded by the ith unit
of observation over period t.
While it was possible to screen contracts for identifying whether they contain an
emergency reserve, number of cases is too low to provide a meaningful analysis.
Further work is needed in this respect to identify more relevant cases.
T5.3 Performance violating the contract
At the end of the day, looking at contractual relationships, reported characteristics of
public tendering and contracts are useful only to the degree they reflect what is
happening in reality, that is whether performance is according to contract or not.
However, if the issuer and contractor are parts of the same corrupt network, it is
relatively easy to simply deviate from contractual obligations secretly and earn profit
on it. This can be done by lower than agreed quality or lower quantity (Meagher
38 While there are numerous examples of reporting contractual emergency reserves, there is no clear evidence that this practice would be mandatory for every issuer or that the Public Procurement Authority would regularly control and enforce its reporting. Hence, we have the suspicion that the above indicator is downward biased.
Mihály Fazekas: Quality of government and institutionalised grand corruption in public procurement, PhD dissertation
117
Patrick, 1997; Piga, 2011). Such a corruption technique violates the principle of
accountability and it has been observed in a range of countries (OECD, 2007;
Papanek, 2009; Transparency International, 2006). A simple way to implement such
transactions is to bribe the technical controller or involve the controllers in the
network directly. In the case of large construction projects, low quality or deficient
quantity may not be visible at all at for a couple of years. Often quoted examples by
our interviewees were lower than contracted quality cables and tubes in the wall or
deficient strength of the base for roads due to lower than contracted quantity of some
expensive material.
If control was ineffective during the construction phase, it is very difficult to exercise
effective ex-post control in the case of construction projects. The only means to keep
this corruption technique at bay in construction projects is the effective enforcement
of guarantee clauses forcing the suppliers to factor in future repair costs under a
scenario that their ‘connections’ may not be in power anymore. For services
contracts, performance cannot be effectively checked in many cases if the buyer and
contractor cooperate in perpetrating corruption (see at section T5.2 on the example
of add-on services contracts).
This corruption technique can be combined with practically any of the above
techniques, while it may be a substitute for T5.1 – modifying contracts strategically
as modification is not necessary if contractual obligations can be simply violated
without consequences.
Unfortunately, due to its invisible nature even to thorough audits, this corruption
technique could not be associated with any direct or indirect indicators. It is,
nevertheless, suggested that we can consider this technique as an unmeasured, but
very likely correlate of the above techniques. Based on media reports, low
quality/quantity performance is typical of high corruption risk contracts.
Mihály Fazekas: Quality of government and institutionalised grand corruption in public procurement, PhD dissertation
118
4.6 Summary of corruption techniques and their indicators As there are many corruption techniques and indicators, it is worth summarizing the
above discussion in one table outlining corruption techniques and the corresponding
direct and indirect indicators (Table 9). It is clear from the above discussion as well
as the below table that a number of indicators could signal multiple techniques and
that some techniques are likely substitutes or complements for each other bearing
consequences for the correlations across their indicators. Later on, these
hypothesized relationships across indicators can be used for verifying corruption
indicators.
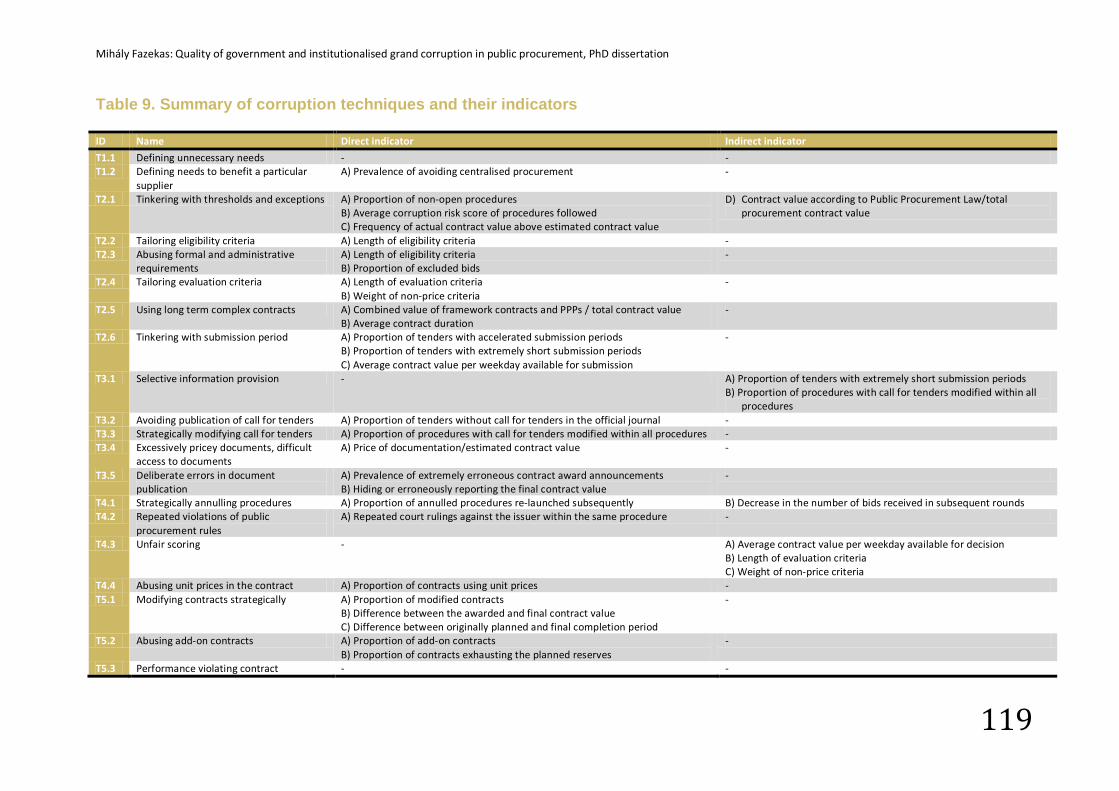
Mihály Fazekas: Quality of government and institutionalised grand corruption in public procurement, PhD dissertation
119
Table 9. Summary of corruption techniques and their indicators
ID Name Direct indicator Indirect indicator
T1.1 Defining unnecessary needs - - T1.2 Defining needs to benefit a particular
supplier A) Prevalence of avoiding centralised procurement -
T2.1 Tinkering with thresholds and exceptions A) Proportion of non-open procedures B) Average corruption risk score of procedures followed C) Frequency of actual contract value above estimated contract value
D) Contract value according to Public Procurement Law/total procurement contract value
T2.2 Tailoring eligibility criteria A) Length of eligibility criteria - T2.3 Abusing formal and administrative
requirements A) Length of eligibility criteria B) Proportion of excluded bids
-
T2.4 Tailoring evaluation criteria A) Length of evaluation criteria B) Weight of non-price criteria
-
T2.5 Using long term complex contracts A) Combined value of framework contracts and PPPs / total contract value B) Average contract duration
-
T2.6 Tinkering with submission period A) Proportion of tenders with accelerated submission periods B) Proportion of tenders with extremely short submission periods C) Average contract value per weekday available for submission
-
T3.1 Selective information provision - A) Proportion of tenders with extremely short submission periods B) Proportion of procedures with call for tenders modified within all
procedures T3.2 Avoiding publication of call for tenders A) Proportion of tenders without call for tenders in the official journal - T3.3 Strategically modifying call for tenders A) Proportion of procedures with call for tenders modified within all procedures - T3.4 Excessively pricey documents, difficult
access to documents A) Price of documentation/estimated contract value -
T3.5 Deliberate errors in document publication
A) Prevalence of extremely erroneous contract award announcements B) Hiding or erroneously reporting the final contract value
-
T4.1 Strategically annulling procedures A) Proportion of annulled procedures re-launched subsequently B) Decrease in the number of bids received in subsequent rounds T4.2 Repeated violations of public
procurement rules A) Repeated court rulings against the issuer within the same procedure -
T4.3 Unfair scoring - A) Average contract value per weekday available for decision B) Length of evaluation criteria C) Weight of non-price criteria
T4.4 Abusing unit prices in the contract A) Proportion of contracts using unit prices - T5.1 Modifying contracts strategically A) Proportion of modified contracts
B) Difference between the awarded and final contract value C) Difference between originally planned and final completion period
-
T5.2 Abusing add-on contracts A) Proportion of add-on contracts B) Proportion of contracts exhausting the planned reserves
-
T5.3 Performance violating contract - -
Mihály Fazekas: Quality of government and institutionalised grand corruption in public procurement, PhD dissertation
120
5. Instead of conclusions: the use of such an inventory and some reservations
According the academic literature, interviews, and the media analysis, the list of
corruption techniques in use has not changed much in the last 10 years in Hungary
or internationally. While quantitative analysis revealed that the prevalence of
individual techniques changed probably due to regulatory action and the evolution of
corruption networks’ resources. These observations suggests that there may be a
reliable basis for the time series analysis performed later.
The indicators presented in this paper by no means exhaust the full list of corruption
techniques and the potential measurement tools. On the one hand, they can only
represent the best available evidence collected by the authors. On the other hand,
they primarily relate to the Hungarian and Eastern European context. For these
reasons, this paper shall be considered as a living book to which further techniques
and indicators will be added as more evidence is unearthed either from Hungary or
from other countries. Currently, research by the authors and further colleagues is
ongoing in a range of countries such as Croatia, Czech Republic, Romania, Russia,
and Slovakia which hopefully will add further detail and evidence to this list.
5.1 Use of such an inventory First and foremost, the long list of corruption techniques and the corresponding
indicators set out above provide a solid basis on which indicator verification can take
place and a composite corruption indicator can be built. Any composite indicator
developed from these elementary measures should take into account the
substitutability and synergies existing between many of the above variables. Hence,
the analysis of their co-variation can increase our trust in their validity and usefulness
as indicators of corruption. In a further paper, the authors links each of these
elementary indicators situated on the input side of the corruption process to outcome
indicators of the corrupt procurement process. Outcome indicators in this respect
directly relate to the corrupt selection of bidders. Examples include single bidder
contracts, exclusion of all but one bidder, or political office of winning bidder’s
owners.
Second, while the above list may appear very long and some description very
cumbersome, it allows for a detecting changes over time in the relative use of these
Mihály Fazekas: Quality of government and institutionalised grand corruption in public procurement, PhD dissertation
121
techniques. Thus, it also increases our confidence in linking the whole set of
corruption indicators to the underlying actual level of corruption as hopefully only a
few major techniques remained unaccounted for.
Third, this list may also be useful for audit and control institutions which aim at
curbing corruption in public procurement and other areas of public spending in which
bidding and auctions are a major method of resource allocation (e.g. EU funding for
enterprise development or publicly owned land allocation).
5.2 Interpretation challenges There are three main challenges to this paper’s approach as we can see:
1. The benchmark is moving: the legal and societal norms are changing over
time, so does the benchmark according to which we define corruption. But,
principles and overarching objectives of public procurement are stable
throughout our observation period hence this problem can be partially
sidelined. Of course, the details of the legal framework are changing
constantly which may be considered as a corruption risk on its own, but these
can be taken into account in the details of the indicators developed without
touching on the underlying principles (e.g. legally binding thresholds may
change from year to year, the underlying behaviour of abusing exceptions
remains the same and can be precisely measured).
2. Confounding administrative incompetence and corruption: Arguably,
many of the behavioural patterns revealed by our indicators can also be
produced by simple administrative incompetence that has nothing to do with
corruption. On the one hand, carefully defining corruption indicators may solve
a large part of this critique, as some non-random, but moderate values may
very well result from incompetent procurement management, however,
recurrent and gross errors and misconduct suggest deliberate action. On the
other hand, systematically controlling for administrative capacity from
independent sources such as the Treasury’s institutional annual wage
statistics and testing relationships among individual indicators can vastly
increase our confidence in measurement and refine the indicators (e.g. length
of eligibility criteria in general is unrelated to the decrease in the number of
bidders while above a certain threshold it turns out to be a significant and
Mihály Fazekas: Quality of government and institutionalised grand corruption in public procurement, PhD dissertation
122
powerful predictor). Nevertheless, one could argue that administrative
incompetence may very well co-evolve with corruption. Therefore, to some
degree, disentangling the two may not be fully possible (Golden & Picci,
2005).
3. Indicators and underlying mechanism describe attempts at solving the widespread problem of low trust in business transactions rather than corruption: In a low trust environment where many companies cannot be
trusted to deliver, official records are imprecise, and the courts are inefficient
at resolving business disputes the behaviour described as corrupt may very
well aim at getting things done in spite of generally unreliable business
relationships. For example, deliberately tailoring the tender to the company of
a cousin may serve the public interest if the family tie is used by the officials to
enforce the contract. Now, this often implies an extra costs which we
interpreted as corrupt rent; however, it may simply be the cost of extra-
contractual monitoring and enforcement mechanism that has nothing to do
with corruption. Further qualitative and quantitative work is needed to rule out
this alternative explanation.
Mihály Fazekas: Quality of government and institutionalised grand corruption in public procurement, PhD dissertation
123
Chapter 5 - Anatomy of grand corruption: a composite corruption risk index
based on objective data39
1. Introduction
Various corruption indices have received considerable academic, policy, and media
attention, at least partially due to the central role the underlying phenomena play in
the quality of democratic governance, the provision of public goods, economic
growth, and equality. Understanding their importance, some international
organisations regularly monitor corruption in their member countries (European
Commission, 2011c) and even tie funding to performance on governance indicators
including corruption (Andersson & Heywood, 2009; Radelet, 2002, 2003).
In the absence of robust objective measures, there are three major sources of
corruption indicators to date: 1) surveys of corruption perceptions and attitudes
(which are most widely used); 2) reviews of institutional and legal frameworks; and 3)
detailed analyses and audits of individual cases. Unfortunately, each of these has
serious deficiencies leaving us without any reasonably reliable and valid indicator of
corruption allowing for comparing countries over time or exploring within country
diversity.
In order to fill some of the gap between the demand for corruption indices and the
dire state of the data currently available, the goal of this paper is to develop a novel
measure of institutionalised grand corruption which:
1. solely derives from objective data describing behaviour,
2. is defined on the micro level such as individual transactions,
3. allows for consistent temporal comparisons within and across countries, and
4. rests on a thorough understanding of the corrupt rent extraction process.
In the context of public procurement, institutionalised grand corruption refers to the
particularistic allocation and performance of public procurement contracts by bending
prior explicit rules and principles of good public procurement in order to benefit a
39 Some of the research underlying this chapter has been conducted in collaboration with István János Tóth from the Corruption Research Center Budapest.
Mihály Fazekas: Quality of government and institutionalised grand corruption in public procurement, PhD dissertation
124
group of individuals while denying access to all others (for a related discussion see
Mungiu-Pippidi, 2006; North et al., 2009; Rothstein & Teorell, 2008).
The proposed indicator of institutionalised grand corruption fulfils all of the above
criteria with potential for replication in most developed countries including every EU
member state, Russia, and the US. Time series available in these countries range
between 6-8 years. The approach makes use of micro-level data on individual public
procurement procedures allowing for directly modelling corrupt actors’ rent extraction
activities. Institutionalised grand corruption in public procurement requires 1) the
generation of corrupt rents and 2) the regular extraction of such rents. To achieve
both of these, any corrupt group has to restrict competition prescribed by
procurement laws to benefit a particular bidder multiple times. Hence, measuring the
degree of competition restriction, recurrent contract awards to the same company,
and the typical techniques used to achieve these goals allow for detecting
institutionalised grand corruption consistently across countries, organisations and
time.
The paper is structured as the follows: first, the literature on corruption measurement
is reviewed; second, the proposed novel measurement approach is presented; third,
Hungarian data and variables are summarized; fourth, the composite corruption risk
index is constructed and some external validity measures offered; finally,
conclusions and further research directions are provided.
Mihály Fazekas: Quality of government and institutionalised grand corruption in public procurement, PhD dissertation
125
2. Literature on measuring grand corruption By now, an industry has emerged for measuring corruption. However, the available
measurements are either fundamentally flawed or too narrow for testing theories of
grand corruption and developing effective solutions to it.
In a broad sense, corruption indicators derive primarily from:
• Surveys of attitudes, perceptions and experiences of corruption among
different stakeholders (e.g. general population, firms, experts);
• Reviews of institutional features controlling corruption in countries or
individual organisations; and
• Audits and investigations of individual cases (see Kaufmann, Kraay, &
Mastruzzi, 2006; Transparency International, 2012).
Among perception and attitude surveys, the two most widely used are the World
Bank’s Control of Corruption (Kaufmann et al., 2010) and Transparency
International’s Corruption Perceptions Index40. Both of these have received
extensive criticism applicable to any similar survey (Andersson & Heywood, 2009;
Kaufmann et al., 2007; Kurtz & Schrank, 2007a, 2007b; Lambsdorff, 2006b). Without
trying to be exhaustive, some of the key arguments include: perceptions may or may
not be related to actual experience (Rose & Peiffer, 2012), they can be driven by
general sentiment reflecting, for example economic growth (Kurtz & Schrank, 2007a)
or media coverage of high profile corruption cases (Golden & Picci, 2005). Arguably,
perceptions of grand corruption are even more unreliable than perceptions of
everyday corruption since experts and citizens have almost no direct experience of
this type of corruption. As both indicators and others of this type primarily derive from
non-representative surveys, representativeness bias is likely to occur, in addition to
reflexivity bias (i.e. respondents influenced by prior and future measurements)
exaggerated by small sample sizes (Golden & Picci, 2005). These indicators vary
surprisingly little over time given the large changes in underlying governance
structures suggesting that they are too insensitive to change (Arndt & Oman, 2006;
Kurtz & Schrank, 2007a; Mungiu-Pippidi, 2011).
40 http://cpi.transparency.org/cpi2012/results/ (accessed: 16/1/2013)
Mihály Fazekas: Quality of government and institutionalised grand corruption in public procurement, PhD dissertation
126
Surveys of experiences with corruption, that is low-level bribery, such as the Quality
of Government Institute’s regional survey (Charron, Dijkstra, & Lapuente, 2010) or
surveys in Latin American countries (Seligson, 2002) while addressing some of the
weaknesses of perception surveys fall short of a sufficient data source. A prime
problem is non-response or false response to sensitive questions such as giving or
receiving bribes. Most importantly, only a tiny fraction of the population has direct
experience with grand corruption limiting the use of this method.
Reviews of institutions controlling corruption, while crucial in understanding the
determinants of corruption, are, by design, not measuring corruption directly. In the
absence of a precisely measured outcome variable, they have to rely on untested
theories of which institutional features work.
Analyses of individual cases are highly reliable in establishing and explaining both
petty and grand corruption, however, their narrow scope and lack of generalizability
make them of only limited use for comparative purposes.
2.1 Objective measures of corruption
Some authors recognising the deficiencies of the above indicators have embarked
on developing objective measures which rely on directly observable, hard indicators
of behaviour that likely indicate corrupt behaviour (Table 10). These studies look into
corruption in various contexts such as elections and high level politics or welfare
services and redistributive politics. For example Olken (2007) uses independent
engineers to review road projects and calculates the amount and value of missing
inputs to determine corruption. More closely associated with our approach are those
studies which focus on corruption in public procurement and bidding markets. For
example, Golden & Picci (2005) propose a new measure of corruption based on the
difference between the quantity of infrastructure and public spending on it. Other
authors use some indicators also part of our composite indicator such as the use of
exceptional procedure types (Auriol et al., 2011) or explicit scoring rules (Hyytinen,
Lundberg, & Toivanen, 2008) or political connections of winning companies
(Goldman, Rocholl, & So, 2013).
While these papers inspired our approach and point in the right direction, they
cannot readily be scaled up to allow for temporal comparisons across countries and
organisations. The reason is that they rely on a too narrow single indicator which
Mihály Fazekas: Quality of government and institutionalised grand corruption in public procurement, PhD dissertation
127
may or may not be the primary vehicle for corrupt rent extraction depending on the
regulatory framework in place (Olken & Pande, 2012). For example, corruption linked
to exceptional procedure types may be easily removed by simply deleting the
procedure from the procurement law, however it is unlikely that this alone would
change the underlying corrupt phenomena much (Auriol et al., 2011). Instead, these
and further elementary indicators have to be combined for meaningful temporal
international comparisons.
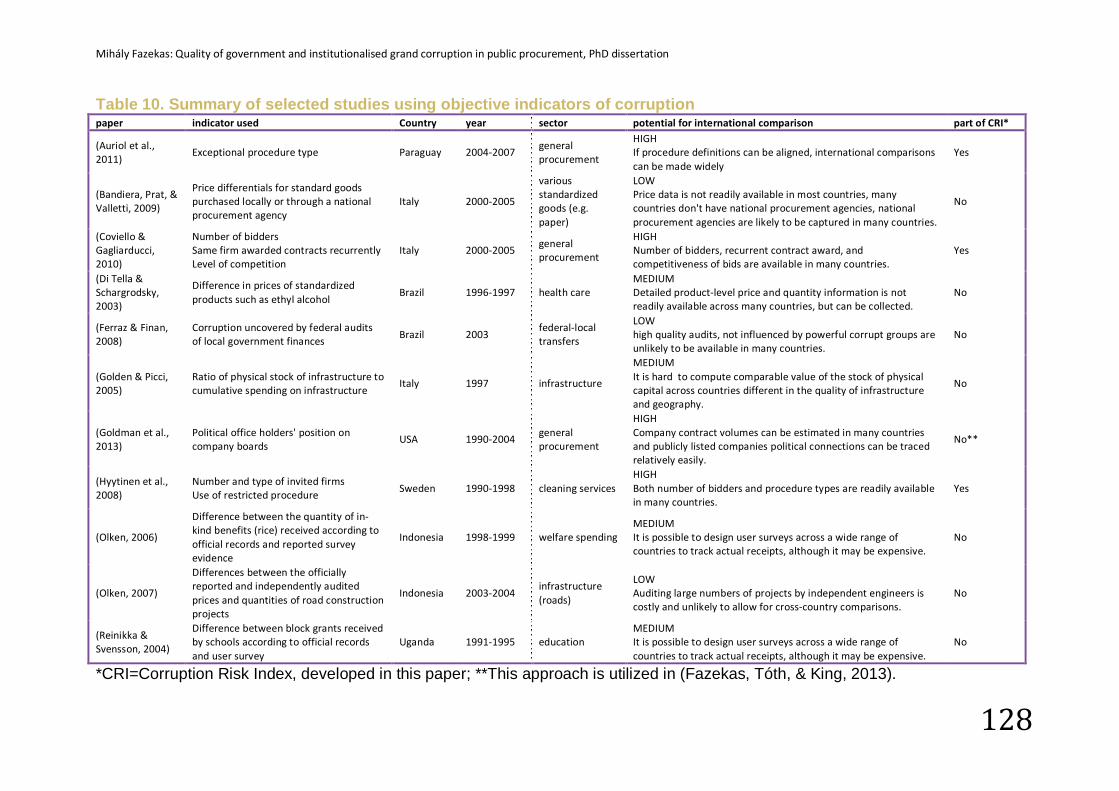
Mihály Fazekas: Quality of government and institutionalised grand corruption in public procurement, PhD dissertation
128
Table 10. Summary of selected studies using objective indicators of corruption paper indicator used Country year sector potential for international comparison part of CRI*
(Auriol et al., 2011)
Exceptional procedure type Paraguay 2004-2007 general procurement
HIGH If procedure definitions can be aligned, international comparisons can be made widely
Yes
(Bandiera, Prat, & Valletti, 2009)
Price differentials for standard goods purchased locally or through a national procurement agency
Italy 2000-2005
various standardized goods (e.g. paper)
LOW Price data is not readily available in most countries, many countries don't have national procurement agencies, national procurement agencies are likely to be captured in many countries.
No
(Coviello & Gagliarducci, 2010)
Number of bidders Same firm awarded contracts recurrently Level of competition
Italy 2000-2005 general procurement
HIGH Number of bidders, recurrent contract award, and competitiveness of bids are available in many countries.
Yes
(Di Tella & Schargrodsky, 2003)
Difference in prices of standardized products such as ethyl alcohol
Brazil 1996-1997 health care MEDIUM Detailed product-level price and quantity information is not readily available across many countries, but can be collected.
No
(Ferraz & Finan, 2008)
Corruption uncovered by federal audits of local government finances
Brazil 2003 federal-local transfers
LOW high quality audits, not influenced by powerful corrupt groups are unlikely to be available in many countries.
No
(Golden & Picci, 2005)
Ratio of physical stock of infrastructure to cumulative spending on infrastructure
Italy 1997 infrastructure
MEDIUM It is hard to compute comparable value of the stock of physical capital across countries different in the quality of infrastructure and geography.
No
(Goldman et al., 2013)
Political office holders' position on company boards
USA 1990-2004 general procurement
HIGH Company contract volumes can be estimated in many countries and publicly listed companies political connections can be traced relatively easily.
No**
(Hyytinen et al., 2008)
Number and type of invited firms Use of restricted procedure
Sweden 1990-1998 cleaning services HIGH Both number of bidders and procedure types are readily available in many countries.
Yes
(Olken, 2006)
Difference between the quantity of in-kind benefits (rice) received according to official records and reported survey evidence
Indonesia 1998-1999 welfare spending MEDIUM It is possible to design user surveys across a wide range of countries to track actual receipts, although it may be expensive.
No
(Olken, 2007)
Differences between the officially reported and independently audited prices and quantities of road construction projects
Indonesia 2003-2004 infrastructure (roads)
LOW Auditing large numbers of projects by independent engineers is costly and unlikely to allow for cross-country comparisons.
No
(Reinikka & Svensson, 2004)
Difference between block grants received by schools according to official records and user survey
Uganda 1991-1995 education MEDIUM It is possible to design user surveys across a wide range of countries to track actual receipts, although it may be expensive.
No
*CRI=Corruption Risk Index, developed in this paper; **This approach is utilized in (Fazekas, Tóth, & King, 2013).
Mihály Fazekas: Quality of government and institutionalised grand corruption in public procurement, PhD dissertation
129
3. The measurement approach
3.1 Corrupt rent extraction in public procurement Institutionalised corruption’s primary aim is earning corruption rents. Corruption rents
in public procurement can be earned if and only if the winning contractor is a pre-
selected company which earns extra profit due to higher than market price for the
delivered quantity and/or quality.
The winning company has to be pre-selected in order to control rent extraction in an
institutionalised manner. This rules out occasional corruption where the company is
lured into corruption during the public procurement process. Extra profit has to be
realised in order to create the pot of money from which rents can be paid.
In order to adequately measure extra profit; price, delivered quantity, and quality of
deliveries has to be known with high precision. However, none of these three can
adequately be measured. Price and quantity are publicly available, but they are
comparable only for homogenous products such as electricity without laborious
case-by-case analysis and even then it is difficult to arrive at accurate estimates.
Quality cannot be reliably observed in official records without using expensive expert
knowledge. Hence, we can only measure the process of awarding contracts to pre-
selected companies.
Competition has to be eliminated or tilted in order to award the contract to the pre-
selected company. Bypassing competition can be done in three primary forms, each
corresponding to a phase of the public procurement process:
1. Limiting the set of bidders: submission phase;
2. Unfairly assessing bidders: assessment phase; and
3. Ex-post modifying conditions of performance41: delivery phase.
On the one hand, these three elementary corruption strategies can be combined in
any way to reach the final desired outcome. For example, some bidders may be
excluded with a tightly tailored eligibility criteria while the remaining unwanted
41 While modifying contract conditions does not belong to the set of company selection techniques, it can be part of an arsenal supporting the selection of the ‘right’ company. For example, the pre-selected company wins in a competitive process by promising low price and high quality knowing that later contract modifications will allow it to earn the agreed corruption rent.
Mihály Fazekas: Quality of government and institutionalised grand corruption in public procurement, PhD dissertation
130
bidders can simply be unfairly scored on subjective scoring items. On the other
hand, once the desired outcome has been achieved at a given stage, there is no
need for further corrupt actions which would increase the risk of detection with no
additional benefit. For example, if the only company submitting a valid bid is the pre-
selected company there is no need to modify contract content later to increase price.
3.2 Measurement model Utilizing a public procurement database (for details see section 4), it is possible to
measure a host of elementary indicators in relation to each of the above three stages
of public procurement from which a composite indicator can be built (see chapter 4).
In order to most adequately model the company selection process, measurement is
carried out on the level of individual contract award. Later, aggregation to
organisation level per year can also be carried out to link procurement data to
company profitability for example.
Likely outcomes of corrupt procurement procedures are defined for each of the
above three main phases (see section 5.1). Indicators of likely corruption techniques
to achieve these outcomes in each phase are also defined, which constitute the
inputs for corrupt contract award and completion (see chapter 4)
The corrupt contract award process is modelled using multiple regression linking
likely corruption inputs (e.g. eligibility criteria tailored to one company) to likely
corruption outcomes (e.g. only one company submitting a bid) in the presence of
variables controlling for alternative explanations (e.g. number of competitors on the
market). Our models linking corrupt inputs to outcomes in public procurement explain
recurrent contract award to a pre-selected company with those corruption techniques
which typically serve as means for corruptly eliminating competitors (see chapter 4)
The explanatory model linking corruption inputs to outcomes delivers a set of
coefficients which represent the strength of association between each underlying
likely corruption input and likely corruption outcome. Reliability of elementary
corruption indicators is defined using their regression coefficients, as those
corruption inputs which are more powerful in predicting probable corruption
outcomes are more likely to signal corruption rather than noise. Falsely indicating
corruption is minimised by dropping those indicators which didn’t prove to be
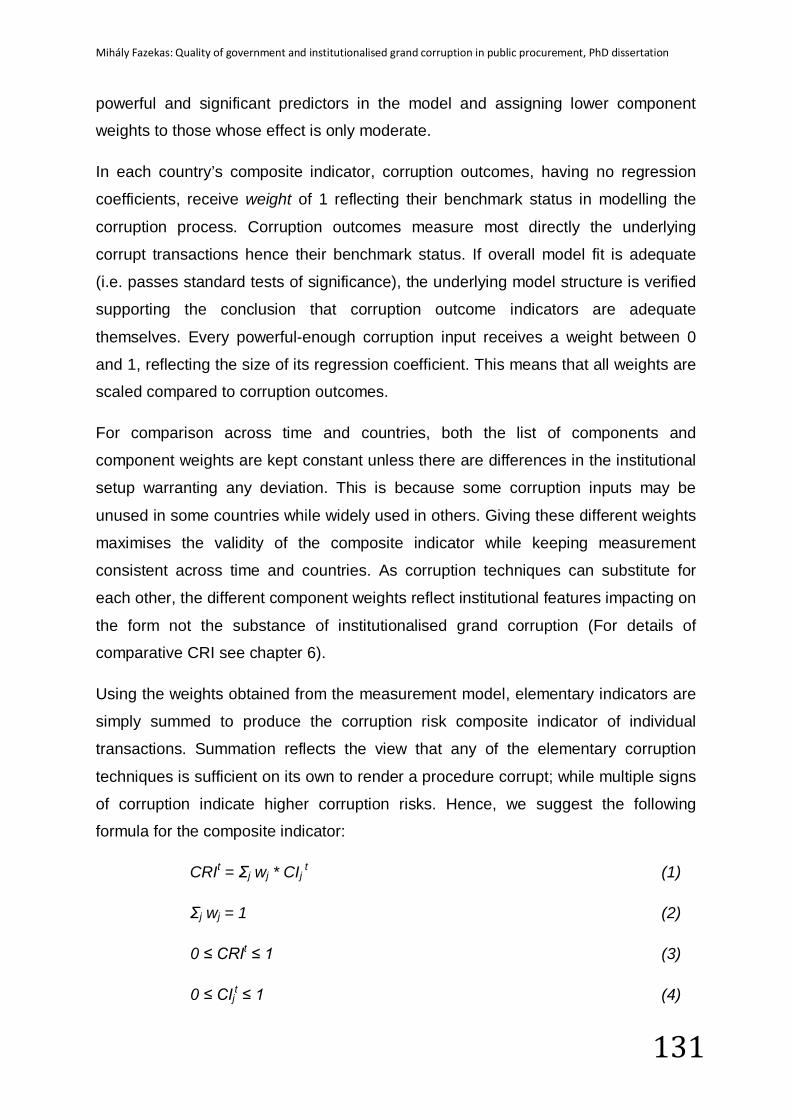
Mihály Fazekas: Quality of government and institutionalised grand corruption in public procurement, PhD dissertation
131
powerful and significant predictors in the model and assigning lower component
weights to those whose effect is only moderate.
In each country’s composite indicator, corruption outcomes, having no regression
coefficients, receive weight of 1 reflecting their benchmark status in modelling the
corruption process. Corruption outcomes measure most directly the underlying
corrupt transactions hence their benchmark status. If overall model fit is adequate
(i.e. passes standard tests of significance), the underlying model structure is verified
supporting the conclusion that corruption outcome indicators are adequate
themselves. Every powerful-enough corruption input receives a weight between 0
and 1, reflecting the size of its regression coefficient. This means that all weights are
scaled compared to corruption outcomes.
For comparison across time and countries, both the list of components and
component weights are kept constant unless there are differences in the institutional
setup warranting any deviation. This is because some corruption inputs may be
unused in some countries while widely used in others. Giving these different weights
maximises the validity of the composite indicator while keeping measurement
consistent across time and countries. As corruption techniques can substitute for
each other, the different component weights reflect institutional features impacting on
the form not the substance of institutionalised grand corruption (For details of
comparative CRI see chapter 6).
Using the weights obtained from the measurement model, elementary indicators are
simply summed to produce the corruption risk composite indicator of individual
transactions. Summation reflects the view that any of the elementary corruption
techniques is sufficient on its own to render a procedure corrupt; while multiple signs
of corruption indicate higher corruption risks. Hence, we suggest the following
formula for the composite indicator:
CRIt = Σj wj * CIj t (1)
Σj wj = 1 (2)
0 ≤ CRIt ≤ 1 (3)
0 ≤ CIjt ≤ 1 (4)
Mihály Fazekas: Quality of government and institutionalised grand corruption in public procurement, PhD dissertation
132
where CRIt stands for the corruption risk index of transaction t, CIj t represents the jth
elementary corruption indicator observed in transaction t, and wj represents the
weight of elementary corruption indicator j. Elementary corruption indicators can be
either corruption inputs or outputs.
Higher level units’ such as organisations’ CRI can be obtained by calculating the
arithmetic average of their transactions’ CRI in a given period (it is also possible to
use contract values for weighting). The added value of aggregating CRI to a higher
unit of observation such as an issuer of tenders is that it further increases our
confidence in CRI. An organisation consistently displaying high CRI over time is
likely to be actually a corrupt organisation rather than simply a victim of random
fluctuations in the data.
Mihály Fazekas: Quality of government and institutionalised grand corruption in public procurement, PhD dissertation
133
4. Data The database derives from Hungarian public procurement announcements of 2009-
2012 (this database is referred to as PP henceforth). The data represent a complete
database of all public procurement procedures conducted under Hungarian Public
Procurement Law. PP contains variables appearing in 1) calls for tenders, 2) contract
award notices, 3) contract modification notices, 4) contract completion
announcements, and 5) administrative corrections notices. As not all of these kinds
of announcements appear for each procedure, for example depending on procedure
type, we only have the variables deriving from contract award notices consistently
across every procedure. Comparable data sets exist or can be constructed from
public records in all EU countries, the USA, and Russia for the last 6-8 years
(Appendix 5A with details).
The place of publication of these documents is the Public Procurement Bulletin
which appears is accessible online42. As there is no readily available database, we
used a crawler algorithm to capture the text of every announcement. Then, applying
a complex automatic and manual text mining strategy, we created a structured
database which contains variables with clear meaning and well-defined categories.
As the original texts available online contain a range of errors, inconsistencies, and
omissions, we applied several correction measures to arrive at a database of
sufficient quality for scientific research. For a full description of database
development, see Fazekas & Tóth (2012a) in Hungarian and in somewhat less detail
Fazekas & Tóth (2012b) in English.
A potential limitation of our database is that it only contains information on public
procurement procedures under the Hungarian Public Procurement Law as there is
no central depository of other contracts. The law defines the minimum estimated
contract value for its application depending on the type of announcing body and the
kind of products or services to be procured (for example, from 1 January 2012,
classical issuers have to follow the national regulations if they procure services for
more than 8 million HUF or 27 thousand EUR). By implication, PP is a biased
sample of total Hungarian public procurement of the period, containing only the
larger and more heavily regulated cases. This bias makes PP well suited for studying
42 See: http://www.kozbeszerzes.hu/nid/KE (in Hungarian)
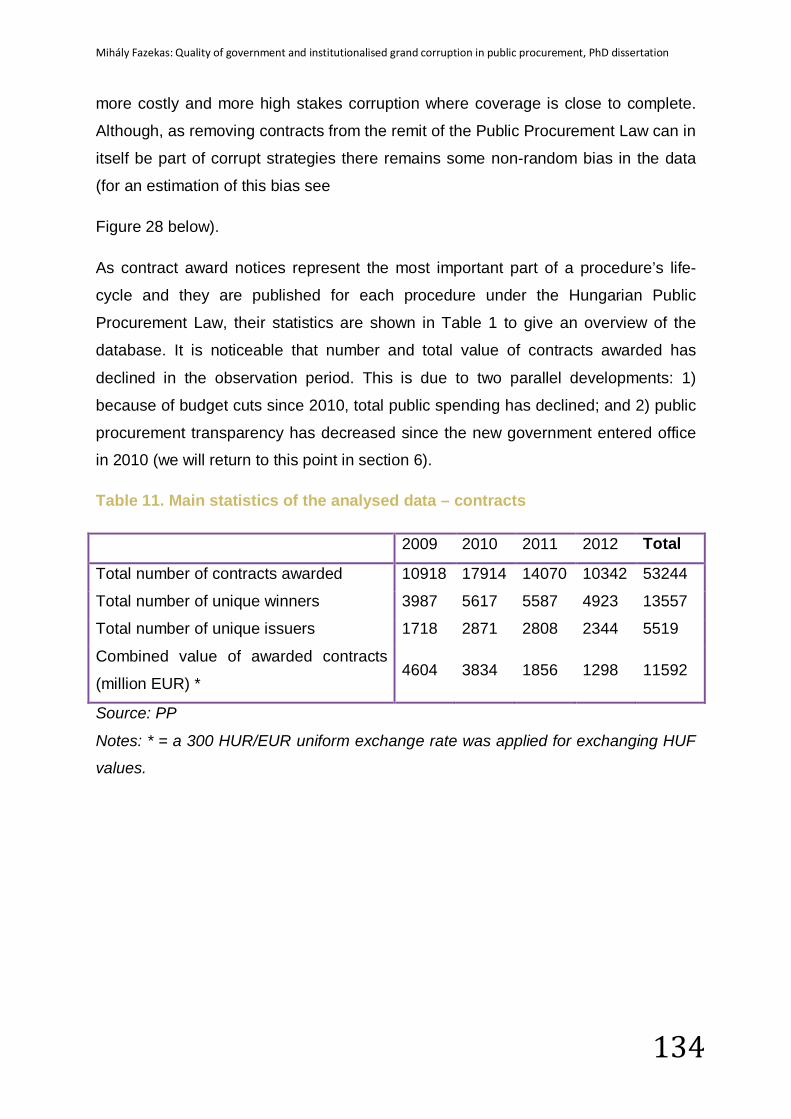
Mihály Fazekas: Quality of government and institutionalised grand corruption in public procurement, PhD dissertation
134
more costly and more high stakes corruption where coverage is close to complete.
Although, as removing contracts from the remit of the Public Procurement Law can in
itself be part of corrupt strategies there remains some non-random bias in the data
(for an estimation of this bias see
Figure 28 below).
As contract award notices represent the most important part of a procedure’s life-
cycle and they are published for each procedure under the Hungarian Public
Procurement Law, their statistics are shown in Table 1 to give an overview of the
database. It is noticeable that number and total value of contracts awarded has
declined in the observation period. This is due to two parallel developments: 1)
because of budget cuts since 2010, total public spending has declined; and 2) public
procurement transparency has decreased since the new government entered office
in 2010 (we will return to this point in section 6).
Table 11. Main statistics of the analysed data – contracts
2009 2010 2011 2012 Total
Total number of contracts awarded 10918 17914 14070 10342 53244
Total number of unique winners 3987 5617 5587 4923 13557
Total number of unique issuers 1718 2871 2808 2344 5519
Combined value of awarded contracts
(million EUR) * 4604 3834 1856 1298 11592
Source: PP
Notes: * = a 300 HUR/EUR uniform exchange rate was applied for exchanging HUF
values.
Mihály Fazekas: Quality of government and institutionalised grand corruption in public procurement, PhD dissertation
135
5. Building blocks: the corruption process’ outcomes and inputs
5.1 Indicators of corruption outcomes
The key outcome of institutionalised corruption in public procurement, which we are
measuring here, is contract performance by a pre-selected company. This corruption
outcome can be secured at the procurement process’
1. Submission phase: only the pre-selected bidder submits a bid; or
2. Assessment phase: contract award to the pre-selected bidder;
As it is extremely rare that the company awarded a contract is changed during the
delivery phase, the corruption outcome at the delivery phase43 could be treated as
fully determined by phases 1 and 2. Three outcome indicators are proposed to
capture the full scale of institutionalised public procurement corruption where
outcomes of any prior stage also serve as an inputs to later stages (Table 12). The
corrupt outcome of the submission phase - only the pre-selected bidder submits a
bid – is indicated by whether a single bid was submitted to the tender. In single
submitted bid contracts, the issuer has an exceptionally large leeway to award the
contract in a way which serves corrupt rent extraction. The corrupt outcome of the
assessment phase - contract award to the pre-selected bidder – can only partially be
captured by a quantitative indicator: exclusion of all but one received bid. Much of
the award process such as scoring bidders is not extensively reported in public
records hence the lack of further direct outcome indicators. In order to capture the
final corruption outcome more appropriately, a further indicator is proposed which
signals repeated contract award to the same company throughout multiple
procedures: winner’s share of issuer’s contracts during the 12 month period before
the contract award in question.
43 If corruption is not institutionalised the delivery phase may well be the location of forming corrupt links. This, however, falls outside the remit of our measurement model.
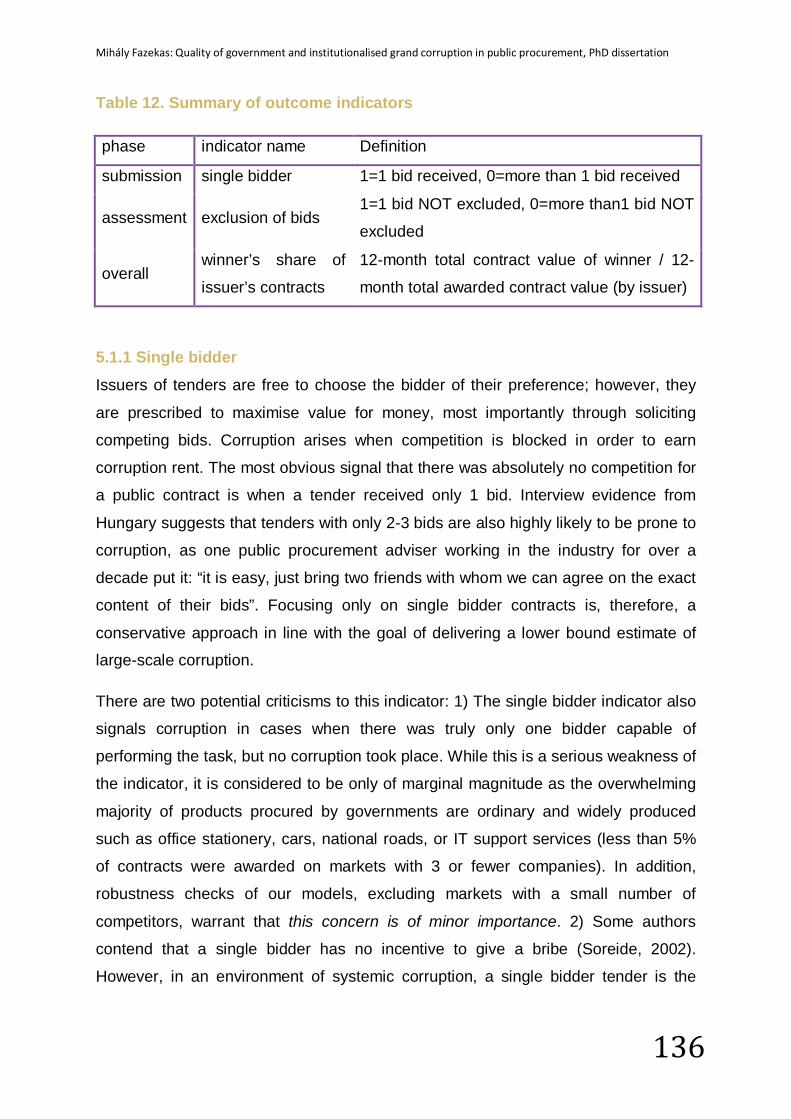
Mihály Fazekas: Quality of government and institutionalised grand corruption in public procurement, PhD dissertation
136
Table 12. Summary of outcome indicators
phase indicator name Definition
submission single bidder 1=1 bid received, 0=more than 1 bid received
assessment exclusion of bids 1=1 bid NOT excluded, 0=more than1 bid NOT
excluded
overall winner’s share of
issuer’s contracts
12-month total contract value of winner / 12-
month total awarded contract value (by issuer)
5.1.1 Single bidder Issuers of tenders are free to choose the bidder of their preference; however, they
are prescribed to maximise value for money, most importantly through soliciting
competing bids. Corruption arises when competition is blocked in order to earn
corruption rent. The most obvious signal that there was absolutely no competition for
a public contract is when a tender received only 1 bid. Interview evidence from
Hungary suggests that tenders with only 2-3 bids are also highly likely to be prone to
corruption, as one public procurement adviser working in the industry for over a
decade put it: “it is easy, just bring two friends with whom we can agree on the exact
content of their bids”. Focusing only on single bidder contracts is, therefore, a
conservative approach in line with the goal of delivering a lower bound estimate of
large-scale corruption.
There are two potential criticisms to this indicator: 1) The single bidder indicator also
signals corruption in cases when there was truly only one bidder capable of
performing the task, but no corruption took place. While this is a serious weakness of
the indicator, it is considered to be only of marginal magnitude as the overwhelming
majority of products procured by governments are ordinary and widely produced
such as office stationery, cars, national roads, or IT support services (less than 5%
of contracts were awarded on markets with 3 or fewer companies). In addition,
robustness checks of our models, excluding markets with a small number of
competitors, warrant that this concern is of minor importance. 2) Some authors
contend that a single bidder has no incentive to give a bribe (Soreide, 2002).
However, in an environment of systemic corruption, a single bidder tender is the
Mihály Fazekas: Quality of government and institutionalised grand corruption in public procurement, PhD dissertation
137
ideal outcome created by colluding bidders and issuers, especially if the same single
bidder wins contracts repeatedly (see section 5.1.3).
5.1.2 Exclusion of all but one bidder It is possible that a corrupt issuer didn’t manage to deter all but one bidder from
submitting a bid, in which case it can still award the contract to the ‘well-connected’
bidder if it manages 1) to exclude the bids of all unwanted bidders on administrative
or formal grounds (Heggstad & Froystad, 2011); or 2) to unfairly assess the bids to
favour a particular bidder. As there is no direct evidence available in public records
for the latter, the assessment phase’s corruption outcome indicator captures only the
former. Having a single valid bid tender can be heavily associated with corruption for,
by and large, the same reasons as for single submitted bid (see section 5.1.1).
Counter-arguments follow the same lines too. This similarity between the two
measures, while conveying additional information, is also supported by regression
results (Table 18).
5.1.3 Winner’s share of issuer’s contracts While there is no separate indicator for the delivery phase, we develop a likely
corruption outcome measure for the public procurement corruption process as a
whole. The ultimate goal of large-scale institutionalised corruption is to repeatedly
award contracts to the same company or companies controlled by the corrupt group
(Heggstad & Froystad, 2011). By implication, winner’s share of issuer’s contracts
indicates the likelihood of such corruption. As the primary location of collusion and
capture is the individual public organisation disbursing public funds, this variable is
defined as the ratio of contract value the winner won from a given issuer to the total
value of contracts awarded by the given issuer throughout a 12-month period.
Using winner’s share within issuer’s contracts (or winner’s contract share as we will
call it to remain succinct) as corruption indicator is likely to suffer from disturbances
in periods when a new dominant group takes control of public organisations with its
new clientele, for example when a new government comes into office. Changes of
dominant, captor groups are expected to be rare events, hence, this downward bias
may only be moderate (and controlling for year of contract award in the below
regressions captures much of this potential bias). Moreover, this indicator also
underestimates corruption when the corrupt network uses multiple companies for
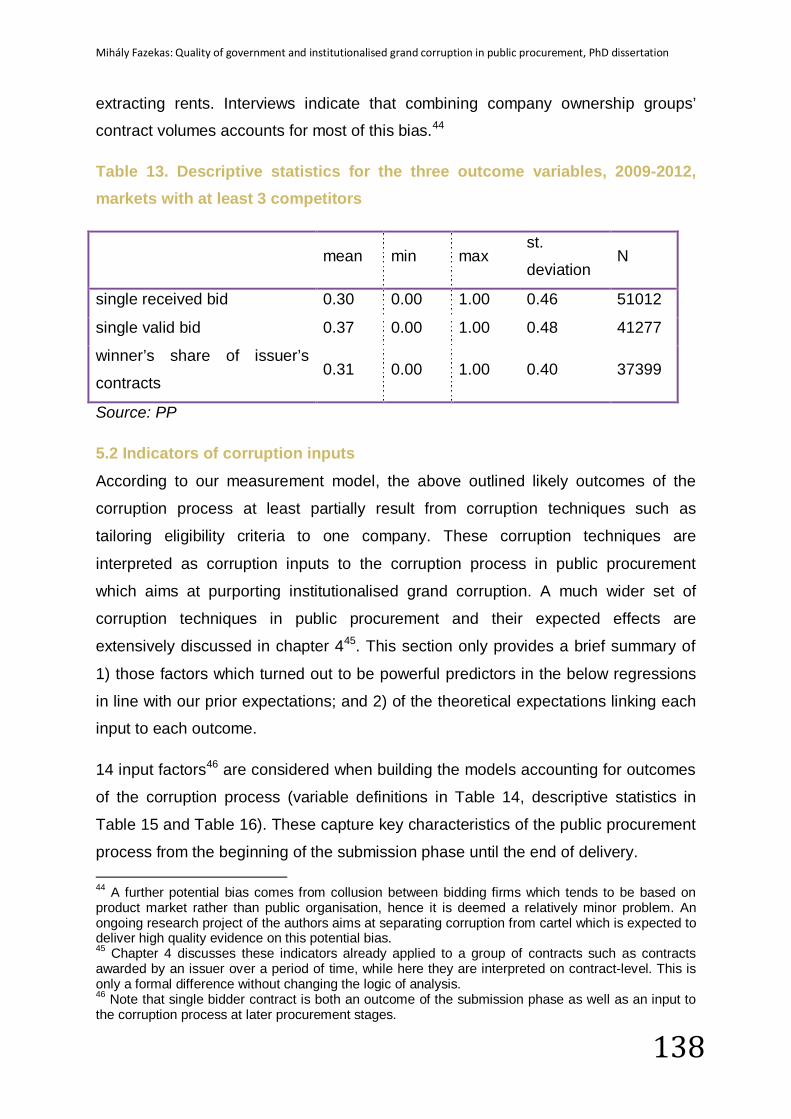
Mihály Fazekas: Quality of government and institutionalised grand corruption in public procurement, PhD dissertation
138
extracting rents. Interviews indicate that combining company ownership groups’
contract volumes accounts for most of this bias.44
Table 13. Descriptive statistics for the three outcome variables, 2009-2012, markets with at least 3 competitors
mean min max
st.
deviation N
single received bid 0.30 0.00 1.00 0.46 51012
single valid bid 0.37 0.00 1.00 0.48 41277
winner’s share of issuer’s
contracts 0.31 0.00 1.00 0.40 37399
Source: PP
5.2 Indicators of corruption inputs According to our measurement model, the above outlined likely outcomes of the
corruption process at least partially result from corruption techniques such as
tailoring eligibility criteria to one company. These corruption techniques are
interpreted as corruption inputs to the corruption process in public procurement
which aims at purporting institutionalised grand corruption. A much wider set of
corruption techniques in public procurement and their expected effects are
extensively discussed in chapter 445. This section only provides a brief summary of
1) those factors which turned out to be powerful predictors in the below regressions
in line with our prior expectations; and 2) of the theoretical expectations linking each
input to each outcome.
14 input factors46 are considered when building the models accounting for outcomes
of the corruption process (variable definitions in Table 14, descriptive statistics in
Table 15 and Table 16). These capture key characteristics of the public procurement
process from the beginning of the submission phase until the end of delivery. 44 A further potential bias comes from collusion between bidding firms which tends to be based on product market rather than public organisation, hence it is deemed a relatively minor problem. An ongoing research project of the authors aims at separating corruption from cartel which is expected to deliver high quality evidence on this potential bias. 45 Chapter 4 discusses these indicators already applied to a group of contracts such as contracts awarded by an issuer over a period of time, while here they are interpreted on contract-level. This is only a formal difference without changing the logic of analysis. 46 Note that single bidder contract is both an outcome of the submission phase as well as an input to the corruption process at later procurement stages.
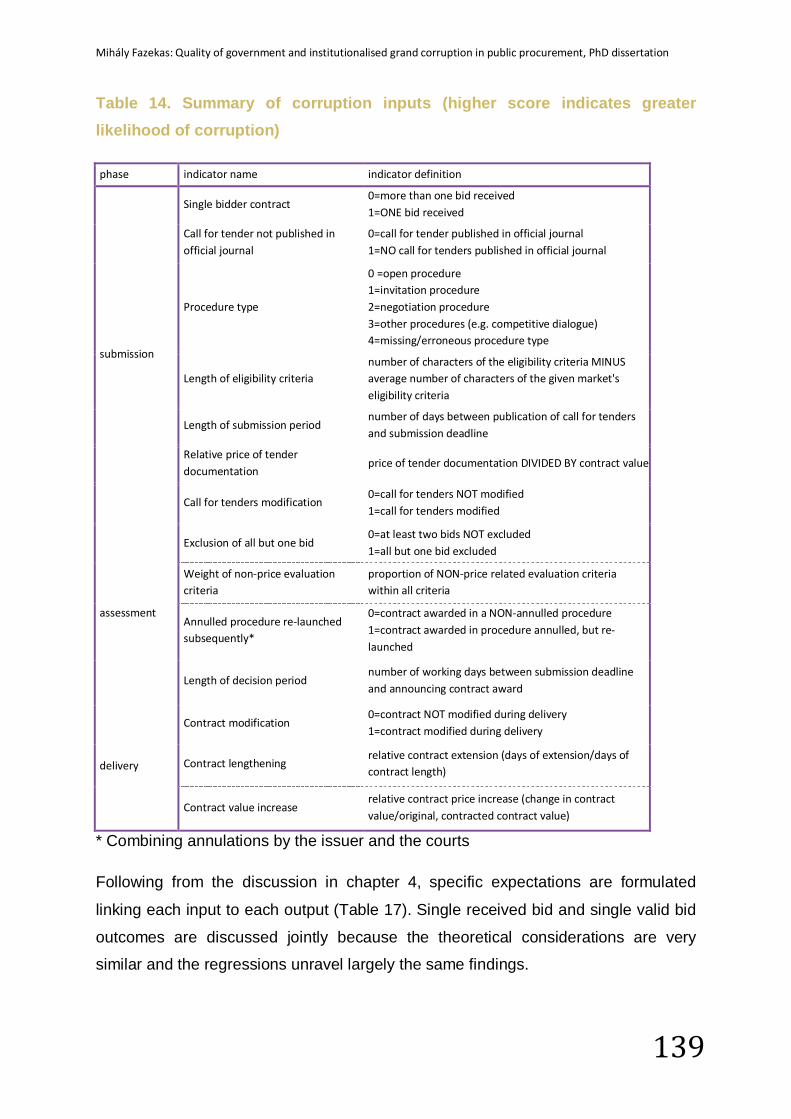
Mihály Fazekas: Quality of government and institutionalised grand corruption in public procurement, PhD dissertation
139
Table 14. Summary of corruption inputs (higher score indicates greater likelihood of corruption)
phase indicator name indicator definition
submission
Single bidder contract 0=more than one bid received 1=ONE bid received
Call for tender not published in official journal
0=call for tender published in official journal 1=NO call for tenders published in official journal
Procedure type
0 =open procedure 1=invitation procedure 2=negotiation procedure 3=other procedures (e.g. competitive dialogue) 4=missing/erroneous procedure type
Length of eligibility criteria number of characters of the eligibility criteria MINUS average number of characters of the given market's eligibility criteria
Length of submission period number of days between publication of call for tenders and submission deadline
Relative price of tender documentation
price of tender documentation DIVIDED BY contract value
Call for tenders modification 0=call for tenders NOT modified 1=call for tenders modified
assessment
Exclusion of all but one bid 0=at least two bids NOT excluded 1=all but one bid excluded
Weight of non-price evaluation criteria
proportion of NON-price related evaluation criteria within all criteria
Annulled procedure re-launched subsequently*
0=contract awarded in a NON-annulled procedure 1=contract awarded in procedure annulled, but re-launched
Length of decision period number of working days between submission deadline and announcing contract award
delivery
Contract modification 0=contract NOT modified during delivery 1=contract modified during delivery
Contract lengthening relative contract extension (days of extension/days of contract length)
Contract value increase relative contract price increase (change in contract value/original, contracted contract value)
* Combining annulations by the issuer and the courts
Following from the discussion in chapter 4, specific expectations are formulated
linking each input to each output (Table 17). Single received bid and single valid bid
outcomes are discussed jointly because the theoretical considerations are very
similar and the regressions unravel largely the same findings.
Mihály Fazekas: Quality of government and institutionalised grand corruption in public procurement, PhD dissertation
140
The expectations are formulated in a general linear form, for example, the shorter
the submission period is the more likely that only one bid was received. However,
many of the continuous variables are indeed not a continuous measure of corruption
risks, rather there are critical thresholds beyond which corruption risks greatly
increase. For example, a submission period of 5 days compared to 15 days is likely
to convey higher corruption risks while a submission period of 35 days compared to
45 days may carry little to no information regarding corruption. By implication, behind
any of our linear hypotheses lies the expectation of finding the thresholds which best
capture spikes in the probability of a corruption outcome hence corruption risks.
In every case, the input variables are defined in a way that their higher values are
expected to signal higher corruption risks. However, some of the corruption inputs
are typically used as ‘corrective action’ later on in the procurement process to fix the
failed attempts at bending competition earlier. These factors are expected to have
negative association with corruption outcomes of earlier stages. For example, if only
the well-connected company submitted a bid there is no need for subsequently
modifying the contract as the corrupt bidder could set the price and quality allowing
for corrupt rent extraction. However, if there was real competition at the submission
phase the well-connected bidder is likely to be forced to submit a competitive bid
with little scope for earning extra profit; hence the need for subsequent contract
modification.
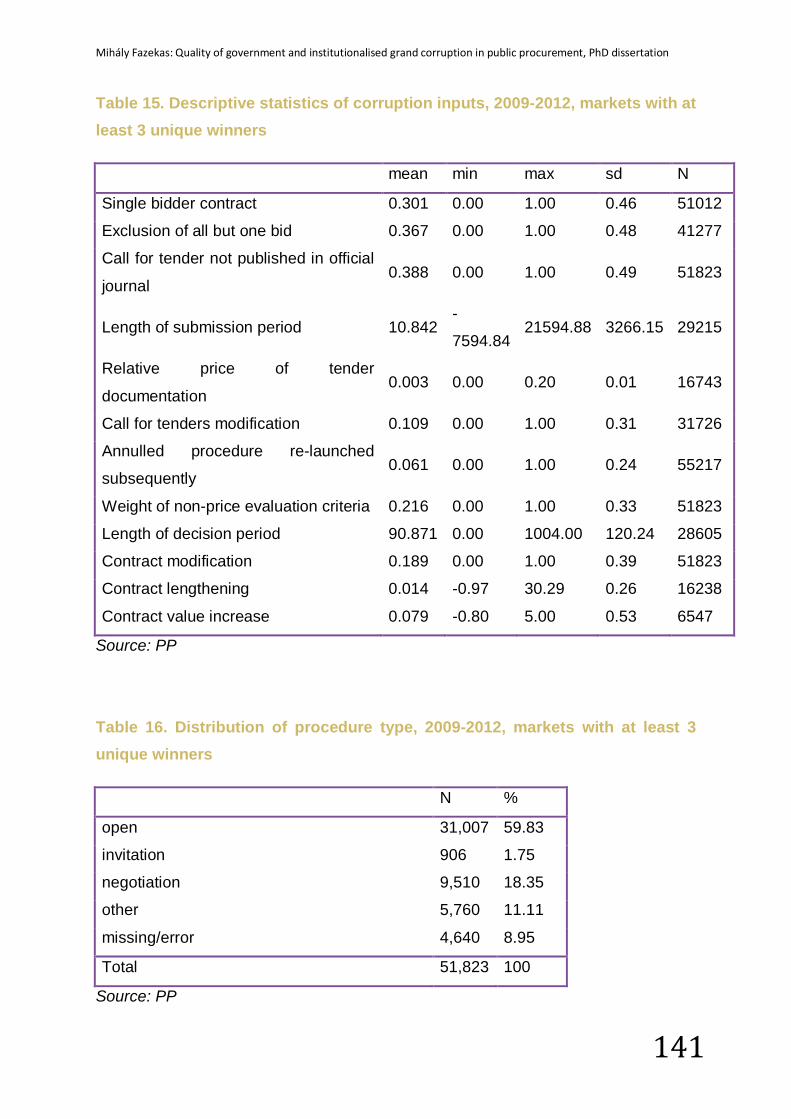
Mihály Fazekas: Quality of government and institutionalised grand corruption in public procurement, PhD dissertation
141
Table 15. Descriptive statistics of corruption inputs, 2009-2012, markets with at least 3 unique winners
mean min max sd N
Single bidder contract 0.301 0.00 1.00 0.46 51012
Exclusion of all but one bid 0.367 0.00 1.00 0.48 41277
Call for tender not published in official
journal 0.388 0.00 1.00 0.49 51823
Length of submission period 10.842 -
7594.84 21594.88 3266.15 29215
Relative price of tender
documentation 0.003 0.00 0.20 0.01 16743
Call for tenders modification 0.109 0.00 1.00 0.31 31726
Annulled procedure re-launched
subsequently 0.061 0.00 1.00 0.24 55217
Weight of non-price evaluation criteria 0.216 0.00 1.00 0.33 51823
Length of decision period 90.871 0.00 1004.00 120.24 28605
Contract modification 0.189 0.00 1.00 0.39 51823
Contract lengthening 0.014 -0.97 30.29 0.26 16238
Contract value increase 0.079 -0.80 5.00 0.53 6547
Source: PP
Table 16. Distribution of procedure type, 2009-2012, markets with at least 3 unique winners
N %
open 31,007 59.83
invitation 906 1.75
negotiation 9,510 18.35
other 5,760 11.11
missing/error 4,640 8.95
Total 51,823 100
Source: PP
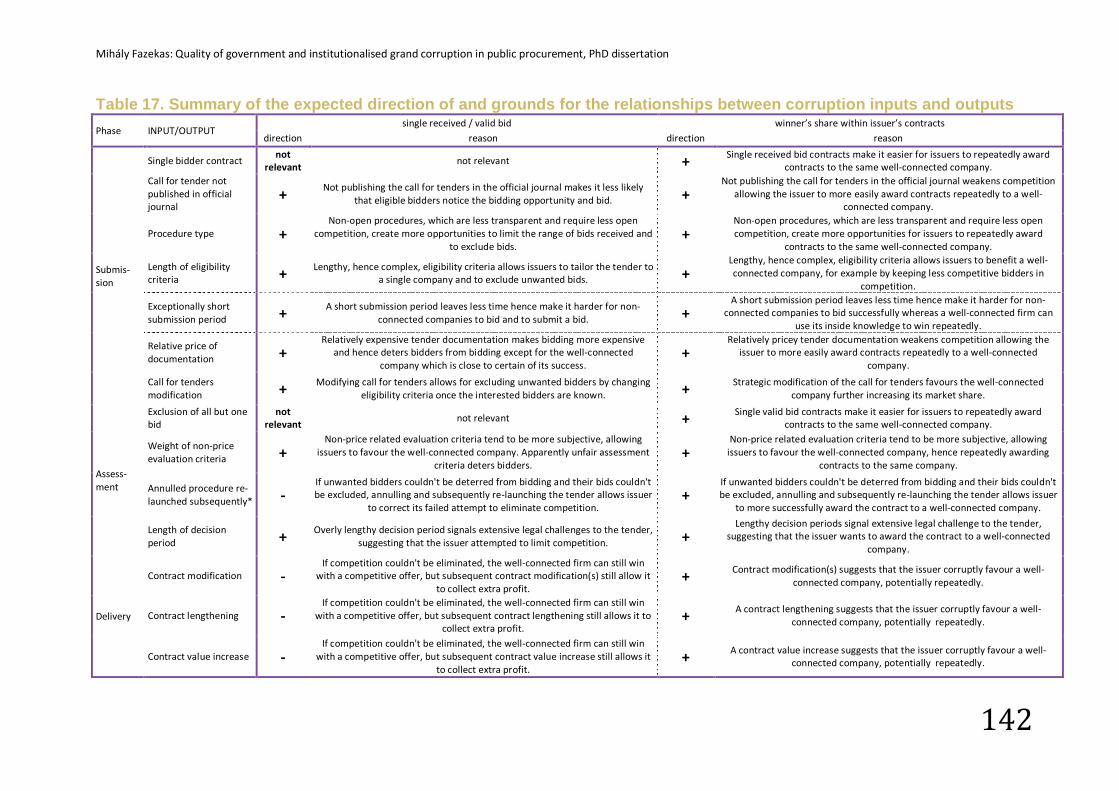
Mihály Fazekas: Quality of government and institutionalised grand corruption in public procurement, PhD dissertation
142
Table 17. Summary of the expected direction of and grounds for the relationships between corruption inputs and outputs Phase INPUT/OUTPUT
single received / valid bid winner’s share within issuer’s contracts direction reason direction reason
Submis-sion
Single bidder contract not
relevant not relevant + Single received bid contracts make it easier for issuers to repeatedly award
contracts to the same well-connected company. Call for tender not published in official journal
+ Not publishing the call for tenders in the official journal makes it less likely that eligible bidders notice the bidding opportunity and bid. +
Not publishing the call for tenders in the official journal weakens competition allowing the issuer to more easily award contracts repeatedly to a well-
connected company.
Procedure type + Non-open procedures, which are less transparent and require less open
competition, create more opportunities to limit the range of bids received and to exclude bids.
+ Non-open procedures, which are less transparent and require less open competition, create more opportunities for issuers to repeatedly award
contracts to the same well-connected company.
Length of eligibility criteria + Lengthy, hence complex, eligibility criteria allows issuers to tailor the tender to
a single company and to exclude unwanted bids. + Lengthy, hence complex, eligibility criteria allows issuers to benefit a well-connected company, for example by keeping less competitive bidders in
competition.
Exceptionally short submission period + A short submission period leaves less time hence make it harder for non-
connected companies to bid and to submit a bid. + A short submission period leaves less time hence make it harder for non-
connected companies to bid successfully whereas a well-connected firm can use its inside knowledge to win repeatedly.
Relative price of documentation +
Relatively expensive tender documentation makes bidding more expensive and hence deters bidders from bidding except for the well-connected
company which is close to certain of its success. +
Relatively pricey tender documentation weakens competition allowing the issuer to more easily award contracts repeatedly to a well-connected
company.
Call for tenders modification + Modifying call for tenders allows for excluding unwanted bidders by changing
eligibility criteria once the interested bidders are known. + Strategic modification of the call for tenders favours the well-connected company further increasing its market share.
Assess-ment
Exclusion of all but one bid
not relevant
not relevant + Single valid bid contracts make it easier for issuers to repeatedly award contracts to the same well-connected company.
Weight of non-price evaluation criteria +
Non-price related evaluation criteria tend to be more subjective, allowing issuers to favour the well-connected company. Apparently unfair assessment
criteria deters bidders. +
Non-price related evaluation criteria tend to be more subjective, allowing issuers to favour the well-connected company, hence repeatedly awarding
contracts to the same company.
Annulled procedure re-launched subsequently* -
If unwanted bidders couldn't be deterred from bidding and their bids couldn't be excluded, annulling and subsequently re-launching the tender allows issuer
to correct its failed attempt to eliminate competition. +
If unwanted bidders couldn't be deterred from bidding and their bids couldn't be excluded, annulling and subsequently re-launching the tender allows issuer
to more successfully award the contract to a well-connected company.
Length of decision period + Overly lengthy decision period signals extensive legal challenges to the tender,
suggesting that the issuer attempted to limit competition. + Lengthy decision periods signal extensive legal challenge to the tender,
suggesting that the issuer wants to award the contract to a well-connected company.
Delivery
Contract modification - If competition couldn't be eliminated, the well-connected firm can still win
with a competitive offer, but subsequent contract modification(s) still allow it to collect extra profit.
+ Contract modification(s) suggests that the issuer corruptly favour a well-connected company, potentially repeatedly.
Contract lengthening - If competition couldn't be eliminated, the well-connected firm can still win
with a competitive offer, but subsequent contract lengthening still allows it to collect extra profit.
+ A contract lengthening suggests that the issuer corruptly favour a well-connected company, potentially repeatedly.
Contract value increase - If competition couldn't be eliminated, the well-connected firm can still win
with a competitive offer, but subsequent contract value increase still allows it to collect extra profit.
+ A contract value increase suggests that the issuer corruptly favour a well-connected company, potentially repeatedly.
Mihály Fazekas: Quality of government and institutionalised grand corruption in public procurement, PhD dissertation
143
6. Composite corruption risk index This section discusses 1) the regressions modelling institutionalised grand corruption in
public procurement, 2) derives component weights for composite indicator building, and
3) provides validity tests for the resulting composite indicator.
The regressions’ primary purpose is to validate whether corruption inputs could
contribute to outputs in line with our theoretical expectations reflecting institutionalised
grand corruption on the procurement market. They provide the primary source of
internal validity of the composite indicator. As different phases of the procurement
process are intertwined with each other, most appropriate analytical technique would be
Structural Equation Modelling (Hoyle, 2012). However, this technique cannot easily
handle large numbers of binary variables among dependent and independent variables
and many non-linear relationships, hence, we opted for modelling each stage
separately, but using partially overlapping variable sets. For outcomes single received
bid and single valid bid, we used binary logistic regression; while for the winner’s
contract share outcome, we used linear regression.
In any regression, a significant and large coefficient is interpreted as indicating that the
given corruption input is typically used for reaching the corruption output even after
taking into account alternative explanations, such as contract size or length, and all
other corruption inputs. This still means that it can be used for other, non-corrupt
purposes in atypical cases; conversely, all the non-significant and weak explanatory
factors may still be used for corrupt purposes, albeit only exceptionally.
Component weights of the composite indicator are derived from regression coefficients;
whereby, the larger coefficient means higher component weight. This reflects the view
that the more often a corruption input is used in combination with corruption outcomes
the more confident we can be that institutionalised grand corruption lies behind its use.
6.1 Modelling corrupt rent extraction: component weights Regression models were built based on the above theoretical expectations by entering
each corruption input and controls step-by-step. Here, only final regression results are
reported for the sake of brevity. The regressions are fitted only one markets with at
least 3 different winners in 2009-2012, that is where there is surely enough adequate
competitors present. As the validity of all three outcome variables crucially hinges on
Mihály Fazekas: Quality of government and institutionalised grand corruption in public procurement, PhD dissertation
144
the availability of suitable competitors, robustness checks are presented in Appendix 5B
excluding markets with less than 38 and 110 different winners throughout 2009-2012.
The conclusions are substantially the same on the restricted samples too.
Thresholds in continuous variables were identified in an iterative process: first, a model
was fitted using the linear continuous predictor; second, jumps in residual values were
identified using residual distribution graphs. For example, average residual values of
the regression using all the control variables plus the linear continuous measure of the
relative price of documentation for predicting single received bid are depicted in Figure
23, left panel. It clearly indicates that there are three distinctive groups of relative
document prices. For the lowest region, ranging between approximately the 24th and
40th percentiles, the model overestimates the probability of a single received bid, while it
is the opposite case for the region between the 70th and 100th percentiles. These
suggest at least three distinct categories. The right panel of Figure 23 shows the same
residual distribution after the categorical measure of relative document price replaced
its continuous version in the model with categories following the cut-points identified
earlier. No clear pattern remains in the residual distribution, suggesting most non-
linearity has been accounted for by the categorical measure of relative document price.
A similar procedure was followed in the case of every continuous variable; if necessary
completing multiple iterations of searching for thresholds.
In order to preserve the full population of observations, we always included a missing
category in every categorical variable. In addition, this also helped measuring corruption
inputs as concealing relevant tender information from bidders or the wider public often
serves as a corruption technique.
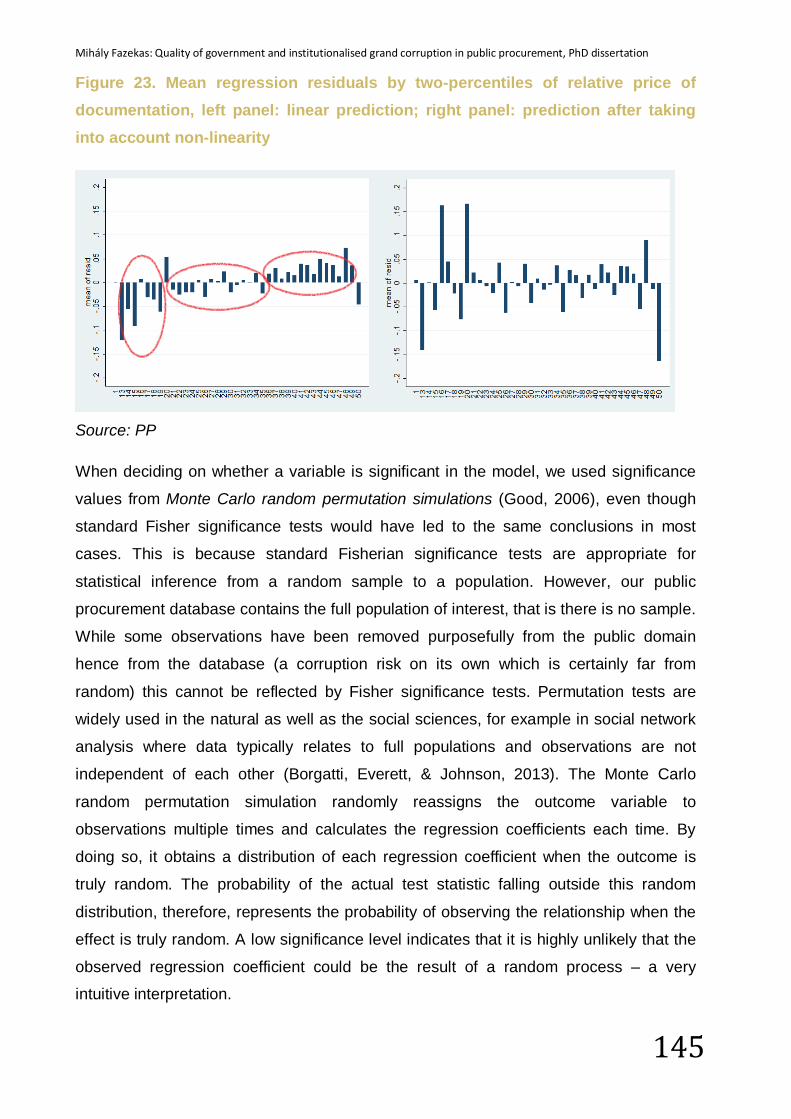
Mihály Fazekas: Quality of government and institutionalised grand corruption in public procurement, PhD dissertation
145
Figure 23. Mean regression residuals by two-percentiles of relative price of documentation, left panel: linear prediction; right panel: prediction after taking into account non-linearity
Source: PP
When deciding on whether a variable is significant in the model, we used significance
values from Monte Carlo random permutation simulations (Good, 2006), even though
standard Fisher significance tests would have led to the same conclusions in most
cases. This is because standard Fisherian significance tests are appropriate for
statistical inference from a random sample to a population. However, our public
procurement database contains the full population of interest, that is there is no sample.
While some observations have been removed purposefully from the public domain
hence from the database (a corruption risk on its own which is certainly far from
random) this cannot be reflected by Fisher significance tests. Permutation tests are
widely used in the natural as well as the social sciences, for example in social network
analysis where data typically relates to full populations and observations are not
independent of each other (Borgatti, Everett, & Johnson, 2013). The Monte Carlo
random permutation simulation randomly reassigns the outcome variable to
observations multiple times and calculates the regression coefficients each time. By
doing so, it obtains a distribution of each regression coefficient when the outcome is
truly random. The probability of the actual test statistic falling outside this random
distribution, therefore, represents the probability of observing the relationship when the
effect is truly random. A low significance level indicates that it is highly unlikely that the
observed regression coefficient could be the result of a random process – a very
intuitive interpretation.
Mihály Fazekas: Quality of government and institutionalised grand corruption in public procurement, PhD dissertation
146
Five different regressions are reported in Table 18, two binary logistic regressions on
single received bid and two binary logistic regressions on single valid bid, following the
same structure:
Pr (single bidderi=1) = 1
1+e-Zi (5)
(6)
where single bidderi equals 1 if the ith contract awarded had only one bidder and 0 if it
has more; Zi represents the logit of a contract being a single bidder contract; β0 is the
constant of the regression; Sij is the matrix of j corruption inputs of the submission
phase for the ith contract such as length of submission period; Aik stands for the matrix
of k corruption inputs of the assessment phase for the ith contract such weight of non-
price evaluation criteria; Dil stands for the matrix of l corruption inputs of the delivery
phase for the ith contract such contract lengthening; Cim stands for the matrix of m
control variables for the ith contract such as the number of competitors on the market; εi
is the error term; and β1j, β2k , β3l, and β4m represent the vectors of coefficients for
explanatory and control variables.
In addition to the four logistic regression models in Table 18, a linear regression on
winner’s share within issuer’s contracts is reported following the structure:
(7)
where Yi represents winner’s share within issuer’s contracts; β0 is the constant of the
regression; Sij is the matrix of j corruption inputs of the submission phase for the ith
contract such as length of submission period; Aik stands for the matrix of k corruption
inputs of the assessment phase for the ith contract such weight of non-price evaluation
criteria; Dil stands for the matrix of l corruption inputs of the delivery phase for the ith
contract such contract lengthening; Cim stands for the matrix of m control variables for
the ith contract such as the number of competitors on the market; εi is the error term;
and β1j, β2k , β3l, and β4m represent the vectors of coefficients for explanatory and
control variables.
The main differences among regressions are the outcome variables and whether the
sample also includes withdrawn contracts (models 2 and 4). Withdrawn contracts
iimmillikkijji CDASZ εβββββ +++++= 43210
iimmillikkijji CDASY εβββββ +++++= 43210
Mihály Fazekas: Quality of government and institutionalised grand corruption in public procurement, PhD dissertation
147
couldn’t be included in regressions on winner’s share within issuer’s contracts as they
would have inflated contract values of 12 month periods. Each regression includes the
full list of controls and predictors having non-missing values in the given sample.
Control variables account for the most obvious alternative explanations to our corrupt
outcomes:
• type of product procured using 40 different CPV47 divisions which control for
differences in technology and market standards;
• number of winners throughout 2009-2012 on the product market using a matrix
of 820 CPV categories at level 3 and 4 geographical regions using NUTS48
definitions which makes sure that our findings on single bidders and winner’s
share within issuer’s contracts are not driven by the low number of competitors
available on the market.
• year of contracting which by and large proxies the changes in the legal
framework and government in power;
• log real contract value (2009 constant prices) and contract length, both
controlling for the differences emanating from contract size and complexity;
• whether the contract is a framework contract which have specific regulations and
procedural rules49; and
• issuer type, sector, and status controlling for the regulatory as well as the
institutional specificities of different issuers.
The regressions are performed on a restricted sample in order for the regressions to
adequately fit a corrupt rent extraction logic as opposed to market specificities or
inexperience with public procurement:
• markets with at least 3 unique winners throughout 2009-2012 for markets
defined by a matrix of 820 CPV categories at level 3 and 4 geographical regions
using NUTS definitions; and
• issuers awarding at least 3 contracts in the 12 months period prior to the contract
award in question.
47 CPV=Common Procurement Vocabulary. For more info see: http://simap.europa.eu/codes-and-nomenclatures/codes-cpv/codes-cpv_en.htm 48 NUTS=Nomenclature of territorial units for statistics. For more info see: http://epp.eurostat.ec.europa.eu/portal/page/portal/nuts_nomenclature/introduction 49 For details see:? http://ec.europa.eu/internal_market/publicprocurement/docs/explan-notes/classic-dir-framework_en.pdf
Mihály Fazekas: Quality of government and institutionalised grand corruption in public procurement, PhD dissertation
148
By and large, our hypotheses are supported by regressions, warranting the construction
of a composite indicator reflecting systematically corrupt public procurement (Table
18).50 First, the single received or valid bid is a powerful predictor of winner’s share
within issuer’s contracts. Those contracts with a single bid tend to be awarded to
winners with 1.8% higher share within issuer’s contracts on average compared to
contracts with more than one bids. This significant effect confirms that restricting the
number of bids to one can support corrupt rent extraction on a recurrent basis. The
magnitude of the impact is modest which is not surprising as restricting competition at
the submission phase is only one of many ways to bent competition in public
procurement.
Second, not publishing the call for tenders in the official journal increases the probability
of single received and valid bids and the winner’s contract share in every regression in
line with expectations. For example, in model 1 and 3, it increases the average
probability of a single received bid contract award by 14.8%-16.9% which is one of the
strongest impact across models.
Third, every non-open procedure type carries a higher corruption risk than open
procedures in terms of single received and valid bids and winner’s contract share,
supporting and further refining our theoretical expectations. Other, exceptional
procedures carry the highest corruption risks adding 2.9% to winner’s share within
issuer’s contracts compared to open procedures. Invitation and negotiation procedures
are powerful and significant predictors in the regressions explaining single bidder
contracts, but they have weak or counterintuitive impacts in the winner’s contract share
regressions which suggests that their main effect is likely to come through number of
bidders. Invitation procedures appear to have about twice as strong effect on the
probability of a single bidder contract award (7.1%-7.8%) as negotiation procedures
(2.7%-5.9%).
Fourth, relative length of eligibility criteria behaves as expected with more lengthy, thus
complex, criteria associated with higher probability of a single bidder contract and
higher winner contract share. The effect of criteria length around the market average
length seems weak, but positive indicating that there may be markets where complex
criteria is frequently used to deter bidders. Criteria lengths considerably higher than
50 Of course, a number of further corruption inputs identified in chapter 4 are not presented here as they turned out to be either insignificant or too small.
Mihály Fazekas: Quality of government and institutionalised grand corruption in public procurement, PhD dissertation
149
market average are especially strongly associated with higher probability of single
bidder contracts and higher winner contract share. For example, criteria length above
market average by 520-2639 characters51 increases probability of a single received bid
by 10.4%-11.9% and the winner’s share within issuer’s contracts by 1.3% compared to
the shortest criteria-length group. Interestingly, the call for tenders which are published,
but don’t contain eligibility criteria at the section where it is prescribed by law, are
associated with especially high corruption risks: 9%-16% higher probability of single
received bid contract compared to the shortest character length group. This signals that
making eligibility criteria less visible deters bidders.
Fifth, the shorter the submission period the higher the probability of single received and
valid bids and winner contract share in line with expectations. This relationship appears
in distinct jumps around legally prescribed thresholds and the abuse of weekends. The
exceptionally short submission period abusing weekends is one of the most powerful
predictors in all of the models. It increases the winner’s share within issuer’s contracts
by 7.6% and the probability of single valid bid by 17.2%-19.8%. Similar to criteria
length, not displaying visibly and clearly the submission deadline is associated with very
high corruption risks, for example 16%-24% higher probability of single received bid. As
the effect is negligible on winner contract share, this corruption technique’s impact
arises primarily in the submission phase.
Sixth, more expensive tender documents increase both the probability of single bidder
contracts and winner contract share in line with expectations. Compared to free
documentation, document prices between 0.04%-0.1% of the contract value increase
the probability of single received bid by 2.9%-3.4% and increase winner’s share within
issuer’s contracts by 3.5%. Even more expensive tender documents have a stronger
impact in the single bidder regressions, but insignificant and small effect in the winner
contract share regression. This indicates that their main effect is exercised in the
submission phase. The effect of the cheapest tender documentation is ambiguous
across regressions. Missing tender documentation price is insignificant in most
regressions. Therefore, these categories receive a zero weight in the composite
indicator.
51 Standard deviation of character lengths from the population mean is 3435 for the whole 2009-2012 period. So, eligibility criteria 2639 characters above its market average is about three quarters standard deviation difference.
Mihály Fazekas: Quality of government and institutionalised grand corruption in public procurement, PhD dissertation
150
Seventh, call for tenders modifications behave according to expectations only for the
period of the previous government (before 01/05/2010)52, that is it increases the
probability of single bidder contracts and the winner’s market share. While it takes on a
considerable significant negative coefficient under the current government’ period.
These differences signal the changing role call for tenders modifications may play in
corrupt rent extraction in response to changing regulatory (e.g. new Public Procurement
Law entering into force soon after the new government entered into force) and political
climate such judicial review of modifications (interviews indicate that the regulations and
practice of judicial review of procurement tenders changed considerably after the new
government entered office). Call for tenders modifications receive a positive weight in
the composite indicator only for the pre-May 2012 period reflecting a conservative
approach.
52 Restricted sample results are not reported here. Regression outputs can be obtained from the authors.
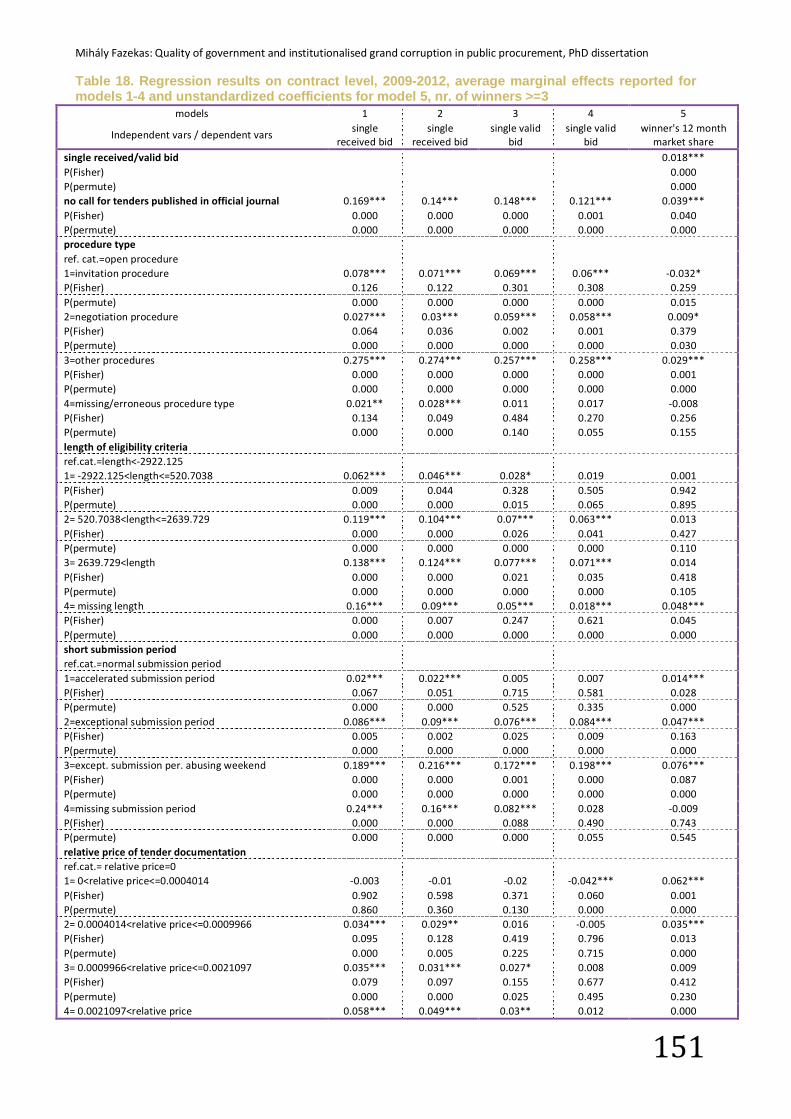
Mihály Fazekas: Quality of government and institutionalised grand corruption in public procurement, PhD dissertation
151
Table 18. Regression results on contract level, 2009-2012, average marginal effects reported for models 1-4 and unstandardized coefficients for model 5, nr. of winners >=3
models 1 2 3 4 5
Independent vars / dependent vars single
received bid single
received bid single valid
bid single valid
bid winner's 12 month
market share single received/valid bid
0.018***
P(Fisher)
0.000 P(permute)
0.000
no call for tenders published in official journal 0.169*** 0.14*** 0.148*** 0.121*** 0.039*** P(Fisher) 0.000 0.000 0.000 0.001 0.040 P(permute) 0.000 0.000 0.000 0.000 0.000 procedure type
ref. cat.=open procedure
1=invitation procedure 0.078*** 0.071*** 0.069*** 0.06*** -0.032* P(Fisher) 0.126 0.122 0.301 0.308 0.259 P(permute) 0.000 0.000 0.000 0.000 0.015 2=negotiation procedure 0.027*** 0.03*** 0.059*** 0.058*** 0.009* P(Fisher) 0.064 0.036 0.002 0.001 0.379 P(permute) 0.000 0.000 0.000 0.000 0.030 3=other procedures 0.275*** 0.274*** 0.257*** 0.258*** 0.029*** P(Fisher) 0.000 0.000 0.000 0.000 0.001 P(permute) 0.000 0.000 0.000 0.000 0.000 4=missing/erroneous procedure type 0.021** 0.028*** 0.011 0.017 -0.008 P(Fisher) 0.134 0.049 0.484 0.270 0.256 P(permute) 0.000 0.000 0.140 0.055 0.155 length of eligibility criteria
ref.cat.=length<-2922.125
1= -2922.125<length<=520.7038 0.062*** 0.046*** 0.028* 0.019 0.001 P(Fisher) 0.009 0.044 0.328 0.505 0.942 P(permute) 0.000 0.000 0.015 0.065 0.895 2= 520.7038<length<=2639.729 0.119*** 0.104*** 0.07*** 0.063*** 0.013 P(Fisher) 0.000 0.000 0.026 0.041 0.427 P(permute) 0.000 0.000 0.000 0.000 0.110 3= 2639.729<length 0.138*** 0.124*** 0.077*** 0.071*** 0.014 P(Fisher) 0.000 0.000 0.021 0.035 0.418 P(permute) 0.000 0.000 0.000 0.000 0.105 4= missing length 0.16*** 0.09*** 0.05*** 0.018*** 0.048*** P(Fisher) 0.000 0.007 0.247 0.621 0.045 P(permute) 0.000 0.000 0.000 0.000 0.000 short submission period
ref.cat.=normal submission period
1=accelerated submission period 0.02*** 0.022*** 0.005 0.007 0.014*** P(Fisher) 0.067 0.051 0.715 0.581 0.028 P(permute) 0.000 0.000 0.525 0.335 0.000 2=exceptional submission period 0.086*** 0.09*** 0.076*** 0.084*** 0.047*** P(Fisher) 0.005 0.002 0.025 0.009 0.163 P(permute) 0.000 0.000 0.000 0.000 0.000 3=except. submission per. abusing weekend 0.189*** 0.216*** 0.172*** 0.198*** 0.076*** P(Fisher) 0.000 0.000 0.001 0.000 0.087 P(permute) 0.000 0.000 0.000 0.000 0.000 4=missing submission period 0.24*** 0.16*** 0.082*** 0.028 -0.009 P(Fisher) 0.000 0.000 0.088 0.490 0.743 P(permute) 0.000 0.000 0.000 0.055 0.545 relative price of tender documentation
ref.cat.= relative price=0
1= 0<relative price<=0.0004014 -0.003 -0.01 -0.02 -0.042*** 0.062*** P(Fisher) 0.902 0.598 0.371 0.060 0.001 P(permute) 0.860 0.360 0.130 0.000 0.000 2= 0.0004014<relative price<=0.0009966 0.034*** 0.029** 0.016 -0.005 0.035*** P(Fisher) 0.095 0.128 0.419 0.796 0.013 P(permute) 0.000 0.005 0.225 0.715 0.000 3= 0.0009966<relative price<=0.0021097 0.035*** 0.031*** 0.027* 0.008 0.009 P(Fisher) 0.079 0.097 0.155 0.677 0.412 P(permute) 0.000 0.000 0.025 0.495 0.230 4= 0.0021097<relative price 0.058*** 0.049*** 0.03** 0.012 0.000
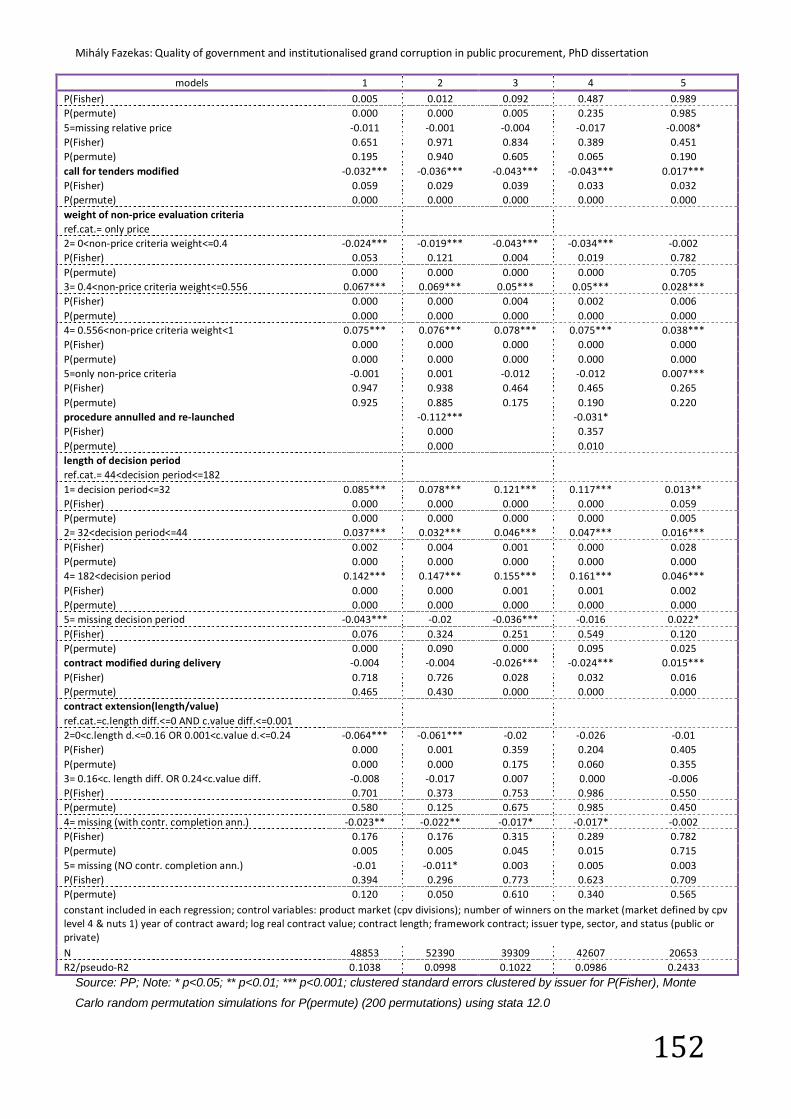
Mihály Fazekas: Quality of government and institutionalised grand corruption in public procurement, PhD dissertation
152
models 1 2 3 4 5 P(Fisher) 0.005 0.012 0.092 0.487 0.989 P(permute) 0.000 0.000 0.005 0.235 0.985 5=missing relative price -0.011 -0.001 -0.004 -0.017 -0.008* P(Fisher) 0.651 0.971 0.834 0.389 0.451 P(permute) 0.195 0.940 0.605 0.065 0.190 call for tenders modified -0.032*** -0.036*** -0.043*** -0.043*** 0.017*** P(Fisher) 0.059 0.029 0.039 0.033 0.032 P(permute) 0.000 0.000 0.000 0.000 0.000 weight of non-price evaluation criteria
ref.cat.= only price
2= 0<non-price criteria weight<=0.4 -0.024*** -0.019*** -0.043*** -0.034*** -0.002 P(Fisher) 0.053 0.121 0.004 0.019 0.782 P(permute) 0.000 0.000 0.000 0.000 0.705 3= 0.4<non-price criteria weight<=0.556 0.067*** 0.069*** 0.05*** 0.05*** 0.028*** P(Fisher) 0.000 0.000 0.004 0.002 0.006 P(permute) 0.000 0.000 0.000 0.000 0.000 4= 0.556<non-price criteria weight<1 0.075*** 0.076*** 0.078*** 0.075*** 0.038*** P(Fisher) 0.000 0.000 0.000 0.000 0.000 P(permute) 0.000 0.000 0.000 0.000 0.000 5=only non-price criteria -0.001 0.001 -0.012 -0.012 0.007*** P(Fisher) 0.947 0.938 0.464 0.465 0.265 P(permute) 0.925 0.885 0.175 0.190 0.220 procedure annulled and re-launched -0.112***
-0.031*
P(Fisher)
0.000
0.357
P(permute)
0.000
0.010
length of decision period
ref.cat.= 44<decision period<=182
1= decision period<=32 0.085*** 0.078*** 0.121*** 0.117*** 0.013** P(Fisher) 0.000 0.000 0.000 0.000 0.059 P(permute) 0.000 0.000 0.000 0.000 0.005 2= 32<decision period<=44 0.037*** 0.032*** 0.046*** 0.047*** 0.016*** P(Fisher) 0.002 0.004 0.001 0.000 0.028 P(permute) 0.000 0.000 0.000 0.000 0.000 4= 182<decision period 0.142*** 0.147*** 0.155*** 0.161*** 0.046*** P(Fisher) 0.000 0.000 0.001 0.001 0.002 P(permute) 0.000 0.000 0.000 0.000 0.000 5= missing decision period -0.043*** -0.02 -0.036*** -0.016 0.022* P(Fisher) 0.076 0.324 0.251 0.549 0.120 P(permute) 0.000 0.090 0.000 0.095 0.025 contract modified during delivery -0.004 -0.004 -0.026*** -0.024*** 0.015*** P(Fisher) 0.718 0.726 0.028 0.032 0.016 P(permute) 0.465 0.430 0.000 0.000 0.000 contract extension(length/value)
ref.cat.=c.length diff.<=0 AND c.value diff.<=0.001
2=0<c.length d.<=0.16 OR 0.001<c.value d.<=0.24 -0.064*** -0.061*** -0.02 -0.026 -0.01 P(Fisher) 0.000 0.001 0.359 0.204 0.405 P(permute) 0.000 0.000 0.175 0.060 0.355 3= 0.16<c. length diff. OR 0.24<c.value diff. -0.008 -0.017 0.007 0.000 -0.006 P(Fisher) 0.701 0.373 0.753 0.986 0.550 P(permute) 0.580 0.125 0.675 0.985 0.450 4= missing (with contr. completion ann.) -0.023** -0.022** -0.017* -0.017* -0.002 P(Fisher) 0.176 0.176 0.315 0.289 0.782 P(permute) 0.005 0.005 0.045 0.015 0.715 5= missing (NO contr. completion ann.) -0.01 -0.011* 0.003 0.005 0.003 P(Fisher) 0.394 0.296 0.773 0.623 0.709 P(permute) 0.120 0.050 0.610 0.340 0.565 constant included in each regression; control variables: product market (cpv divisions); number of winners on the market (market defined by cpv level 4 & nuts 1) year of contract award; log real contract value; contract length; framework contract; issuer type, sector, and status (public or private) N 48853 52390 39309 42607 20653 R2/pseudo-R2 0.1038 0.0998 0.1022 0.0986 0.2433
Source: PP; Note: * p<0.05; ** p<0.01; *** p<0.001; clustered standard errors clustered by issuer for P(Fisher), Monte
Carlo random permutation simulations for P(permute) (200 permutations) using stata 12.0
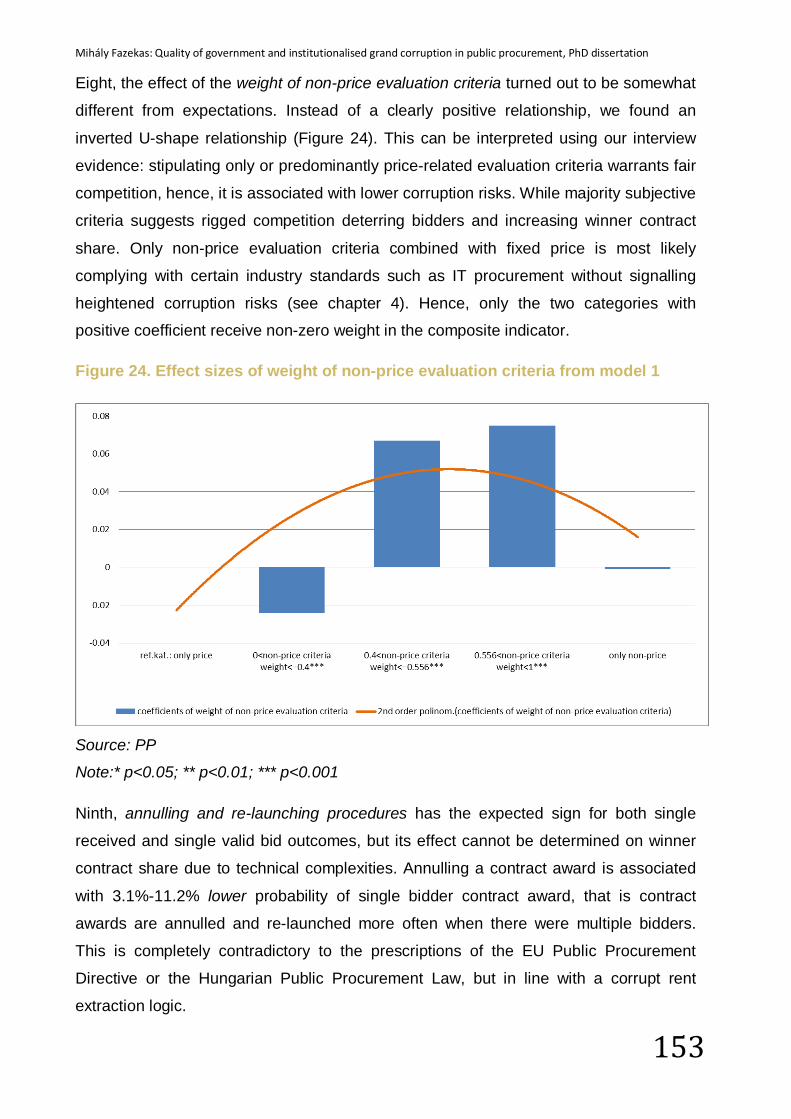
Mihály Fazekas: Quality of government and institutionalised grand corruption in public procurement, PhD dissertation
153
Eight, the effect of the weight of non-price evaluation criteria turned out to be somewhat
different from expectations. Instead of a clearly positive relationship, we found an
inverted U-shape relationship (Figure 24). This can be interpreted using our interview
evidence: stipulating only or predominantly price-related evaluation criteria warrants fair
competition, hence, it is associated with lower corruption risks. While majority subjective
criteria suggests rigged competition deterring bidders and increasing winner contract
share. Only non-price evaluation criteria combined with fixed price is most likely
complying with certain industry standards such as IT procurement without signalling
heightened corruption risks (see chapter 4). Hence, only the two categories with
positive coefficient receive non-zero weight in the composite indicator.
Figure 24. Effect sizes of weight of non-price evaluation criteria from model 1
Source: PP
Note:* p<0.05; ** p<0.01; *** p<0.001
Ninth, annulling and re-launching procedures has the expected sign for both single
received and single valid bid outcomes, but its effect cannot be determined on winner
contract share due to technical complexities. Annulling a contract award is associated
with 3.1%-11.2% lower probability of single bidder contract award, that is contract
awards are annulled and re-launched more often when there were multiple bidders.
This is completely contradictory to the prescriptions of the EU Public Procurement
Directive or the Hungarian Public Procurement Law, but in line with a corrupt rent
extraction logic.
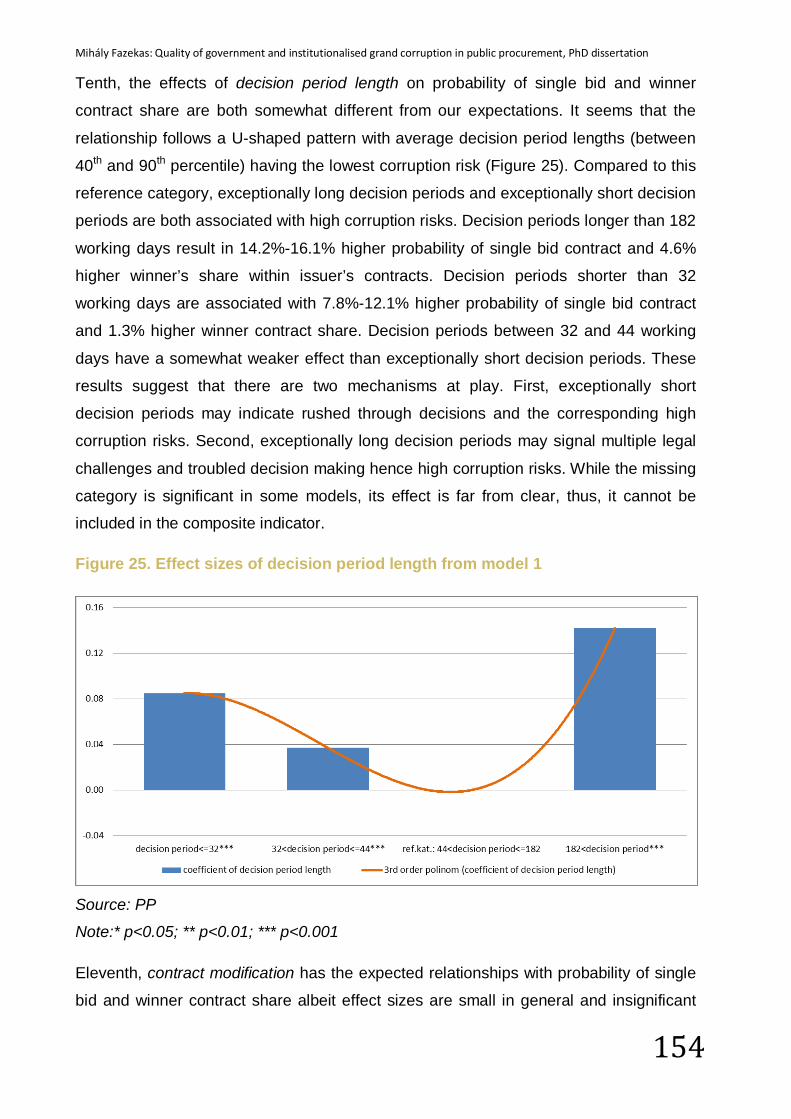
Mihály Fazekas: Quality of government and institutionalised grand corruption in public procurement, PhD dissertation
154
Tenth, the effects of decision period length on probability of single bid and winner
contract share are both somewhat different from our expectations. It seems that the
relationship follows a U-shaped pattern with average decision period lengths (between
40th and 90th percentile) having the lowest corruption risk (Figure 25). Compared to this
reference category, exceptionally long decision periods and exceptionally short decision
periods are both associated with high corruption risks. Decision periods longer than 182
working days result in 14.2%-16.1% higher probability of single bid contract and 4.6%
higher winner’s share within issuer’s contracts. Decision periods shorter than 32
working days are associated with 7.8%-12.1% higher probability of single bid contract
and 1.3% higher winner contract share. Decision periods between 32 and 44 working
days have a somewhat weaker effect than exceptionally short decision periods. These
results suggest that there are two mechanisms at play. First, exceptionally short
decision periods may indicate rushed through decisions and the corresponding high
corruption risks. Second, exceptionally long decision periods may signal multiple legal
challenges and troubled decision making hence high corruption risks. While the missing
category is significant in some models, its effect is far from clear, thus, it cannot be
included in the composite indicator.
Figure 25. Effect sizes of decision period length from model 1
Source: PP
Note:* p<0.05; ** p<0.01; *** p<0.001
Eleventh, contract modification has the expected relationships with probability of single
bid and winner contract share albeit effect sizes are small in general and insignificant
Mihály Fazekas: Quality of government and institutionalised grand corruption in public procurement, PhD dissertation
155
for model 1-2. Modifying contract at least once after contract award is associated with
2.4%-2.6% lower probability of single valid bid and 1.5% higher winner’s share within
issuer’s contracts. This indicates that a competitive contract award procedure may
necessitate contract modification to assure rent extraction.
Twelfth, increasing contract length and increasing the contract value after contract
award had to be considered together due to low number of relevant observations.
These two techniques can be combined in as much as they represent two parallel
methods for increasing the profitability of a contract, that is making delivery cheaper by
extending the completion deadline or making price higher by increasing contract value.
Contract extension (length/value) display the expected relationships, but effects are
insignificant for the winner contract share regression.
Compared to contracts which were performed within the timeframe of delivery and
original contract price (less than 0.1% value increase), contracts with 0%-16.2% longer
delivery period or 0.1%-24% higher contract value were associated with 6.1%-6.4%
lower probability of single received bid. For contracts which were extended even more
the effects are insignificant which may signal that excessive project overruns are more
often due to non-corrupt reasons such as low state capacity. For contracts whose
contract completion announcement didn’t contain the prescribed final contract length or
final contract value information the probability of single bid was 1.7%-2.3% lower which
is a moderately strong impact. This suggests that competitive tendering makes it more
necessary to hide the final total performance potentially not according to original
contractual terms. Hence, contract extensions of moderate magnitude and missing
information are included in the composite indicator.
Based on these regression results the variables and their categories could be selected
which will make up the composite corruption risk index (CRI). First, all three corruption
outcomes could be part of CRI because the regressions accounting for them are of
adequate quality (i.e. formal tests of model appropriateness are affirmative). Second, as
mentioned earlier, outcome variables get the weight of 1 reflecting their benchmark
status. Qualitative evidence clearly underlines that any of the corruption inputs (i.e.
corruption techniques) is sufficient on its own to render a procurement procedure
corrupt. Therefore, each significant corruption input receives the weight of 1. In order to
reflect coefficient sizes of categories in each corruption input, we ranked categories of
each variable with the most impactful category receiving weight 1 and the others
Mihály Fazekas: Quality of government and institutionalised grand corruption in public procurement, PhD dissertation
156
proportionately lower weights. For example, if there are four significant categories of a
variable, then they would get weights 1, 0.75, 0.5, and 0.25. Finally, we normed each
component weight so that the resulting composite indicator falls between 0 and 1 (Table
19). This was achieved in two steps: component weights were divided by the total
number of components (N=13), then the resulting score was divided by its observed
maximum (CRI[raw]=0.805). This rescaling assures that the minimum (maximum) of the
score corresponds to the lowest (highest) corruption risks observed. The upper end of
the scale may be too conservative as the combined presence of 3-4 corruption inputs
and/or outputs (CRI=0.27-0.36) is already almost certainly very corrupt according to our
interviewees53.
53 Calculating CRI for court decisions which established corruption in public procurement could serve as a more robust upper bound for the CRI scale. Further work is in progress.
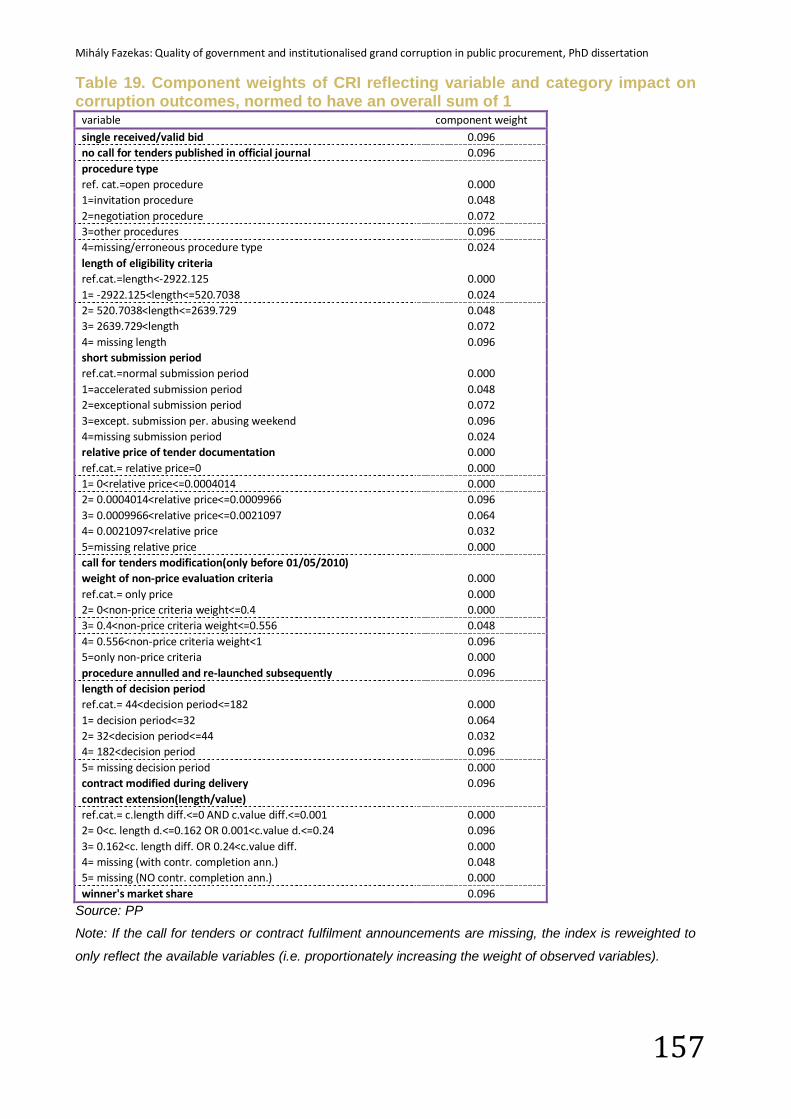
Mihály Fazekas: Quality of government and institutionalised grand corruption in public procurement, PhD dissertation
157
Table 19. Component weights of CRI reflecting variable and category impact on corruption outcomes, normed to have an overall sum of 1
variable component weight single received/valid bid 0.096 no call for tenders published in official journal 0.096 procedure type
ref. cat.=open procedure 0.000 1=invitation procedure 0.048 2=negotiation procedure 0.072 3=other procedures 0.096 4=missing/erroneous procedure type 0.024 length of eligibility criteria
ref.cat.=length<-2922.125 0.000 1= -2922.125<length<=520.7038 0.024 2= 520.7038<length<=2639.729 0.048 3= 2639.729<length 0.072 4= missing length 0.096 short submission period
ref.cat.=normal submission period 0.000 1=accelerated submission period 0.048 2=exceptional submission period 0.072 3=except. submission per. abusing weekend 0.096 4=missing submission period 0.024 relative price of tender documentation 0.000 ref.cat.= relative price=0 0.000 1= 0<relative price<=0.0004014 0.000 2= 0.0004014<relative price<=0.0009966 0.096 3= 0.0009966<relative price<=0.0021097 0.064 4= 0.0021097<relative price 0.032 5=missing relative price 0.000 call for tenders modification(only before 01/05/2010)
weight of non-price evaluation criteria 0.000 ref.cat.= only price 0.000 2= 0<non-price criteria weight<=0.4 0.000 3= 0.4<non-price criteria weight<=0.556 0.048 4= 0.556<non-price criteria weight<1 0.096 5=only non-price criteria 0.000 procedure annulled and re-launched subsequently 0.096 length of decision period
ref.cat.= 44<decision period<=182 0.000 1= decision period<=32 0.064 2= 32<decision period<=44 0.032 4= 182<decision period 0.096 5= missing decision period 0.000 contract modified during delivery 0.096 contract extension(length/value)
ref.cat.= c.length diff.<=0 AND c.value diff.<=0.001 0.000 2= 0<c. length d.<=0.162 OR 0.001<c.value d.<=0.24 0.096 3= 0.162<c. length diff. OR 0.24<c.value diff. 0.000 4= missing (with contr. completion ann.) 0.048 5= missing (NO contr. completion ann.) 0.000 winner's market share 0.096
Source: PP
Note: If the call for tenders or contract fulfilment announcements are missing, the index is reweighted to
only reflect the available variables (i.e. proportionately increasing the weight of observed variables).
Mihály Fazekas: Quality of government and institutionalised grand corruption in public procurement, PhD dissertation
158
6.2 Validating the corruption risk index Validating CRI will take several years of work, here only elementary validating
procedures are done. First, we look at the cross-sectional and time-series distribution of
CRI to see if it behaves in any apparently unusual way. Second, the relationship
between the amount of spending not reported in the PP database and CRI on the
organisational level is explored to gauge the possible extent of distortion due to missing
observations. Third, profitability and turnover growth of winning firms with different CRI
are analysed. Fourth, political control of winning companies is collated with their CRI.
Fifth, average CRI of companies whose market success seems to be strongly
determined by the government in power is compared with those whose success is
largely unaffected by government change (Fazekas et al., 2013).
First, applying the weights specified in Table 19, each contract receives a corruption
risk index (CRI) falling into a 0–1 band. Calculating the average CRI of each winning
firm results in a CRI distribution which doesn’t deviate extensively from a normal
distribution, albeit it has a long tail to the right (Figure 25). These companies with CRI
higher than approximately 0.4-0.5 represent particularly high corruption risks and hence
deserve attention in later research.
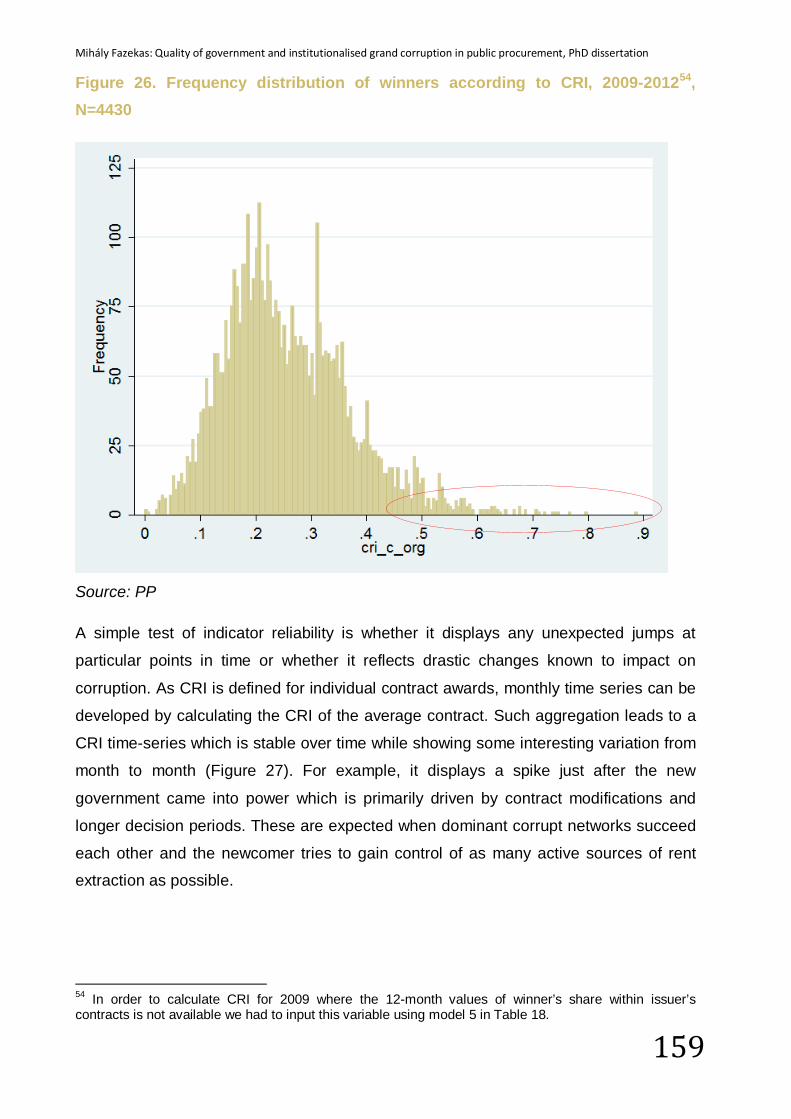
Mihály Fazekas: Quality of government and institutionalised grand corruption in public procurement, PhD dissertation
159
Figure 26. Frequency distribution of winners according to CRI, 2009-201254, N=4430
Source: PP
A simple test of indicator reliability is whether it displays any unexpected jumps at
particular points in time or whether it reflects drastic changes known to impact on
corruption. As CRI is defined for individual contract awards, monthly time series can be
developed by calculating the CRI of the average contract. Such aggregation leads to a
CRI time-series which is stable over time while showing some interesting variation from
month to month (Figure 27). For example, it displays a spike just after the new
government came into power which is primarily driven by contract modifications and
longer decision periods. These are expected when dominant corrupt networks succeed
each other and the newcomer tries to gain control of as many active sources of rent
extraction as possible.
54 In order to calculate CRI for 2009 where the 12-month values of winner’s share within issuer’s contracts is not available we had to input this variable using model 5 in Table 18.
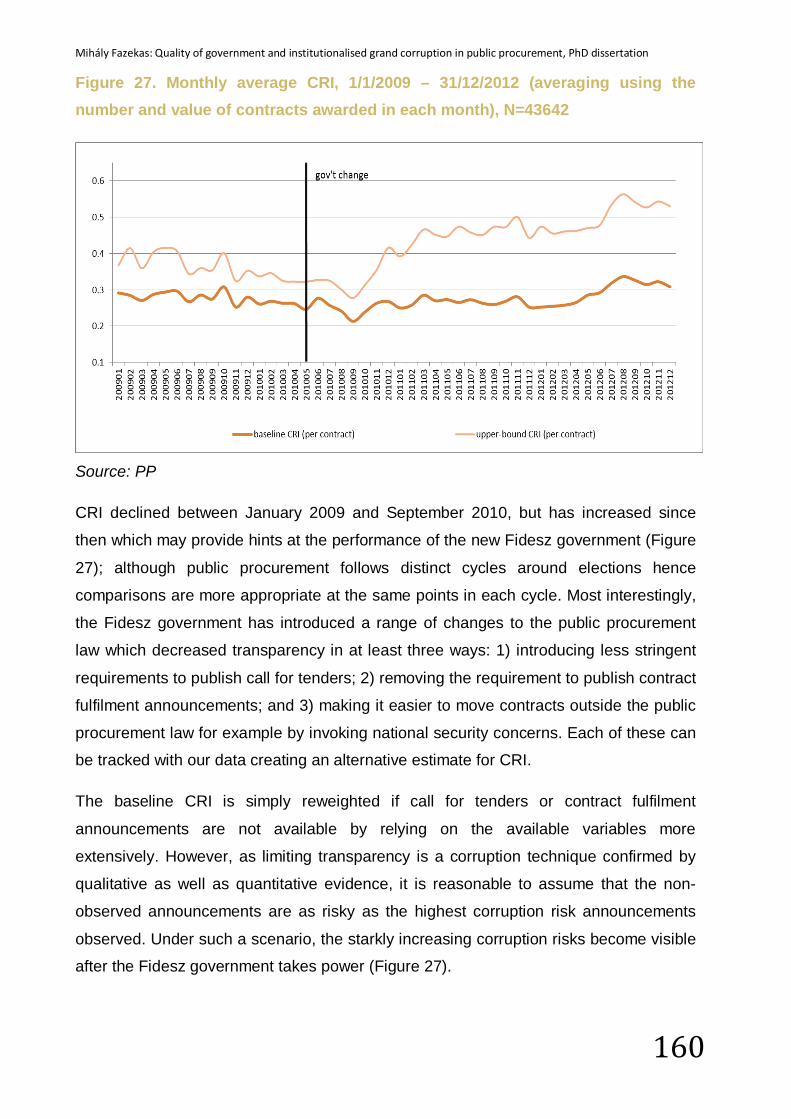
Mihály Fazekas: Quality of government and institutionalised grand corruption in public procurement, PhD dissertation
160
Figure 27. Monthly average CRI, 1/1/2009 – 31/12/2012 (averaging using the number and value of contracts awarded in each month), N=43642
Source: PP
CRI declined between January 2009 and September 2010, but has increased since
then which may provide hints at the performance of the new Fidesz government (Figure
27); although public procurement follows distinct cycles around elections hence
comparisons are more appropriate at the same points in each cycle. Most interestingly,
the Fidesz government has introduced a range of changes to the public procurement
law which decreased transparency in at least three ways: 1) introducing less stringent
requirements to publish call for tenders; 2) removing the requirement to publish contract
fulfilment announcements; and 3) making it easier to move contracts outside the public
procurement law for example by invoking national security concerns. Each of these can
be tracked with our data creating an alternative estimate for CRI.
The baseline CRI is simply reweighted if call for tenders or contract fulfilment
announcements are not available by relying on the available variables more
extensively. However, as limiting transparency is a corruption technique confirmed by
qualitative as well as quantitative evidence, it is reasonable to assume that the non-
observed announcements are as risky as the highest corruption risk announcements
observed. Under such a scenario, the starkly increasing corruption risks become visible
after the Fidesz government takes power (Figure 27).
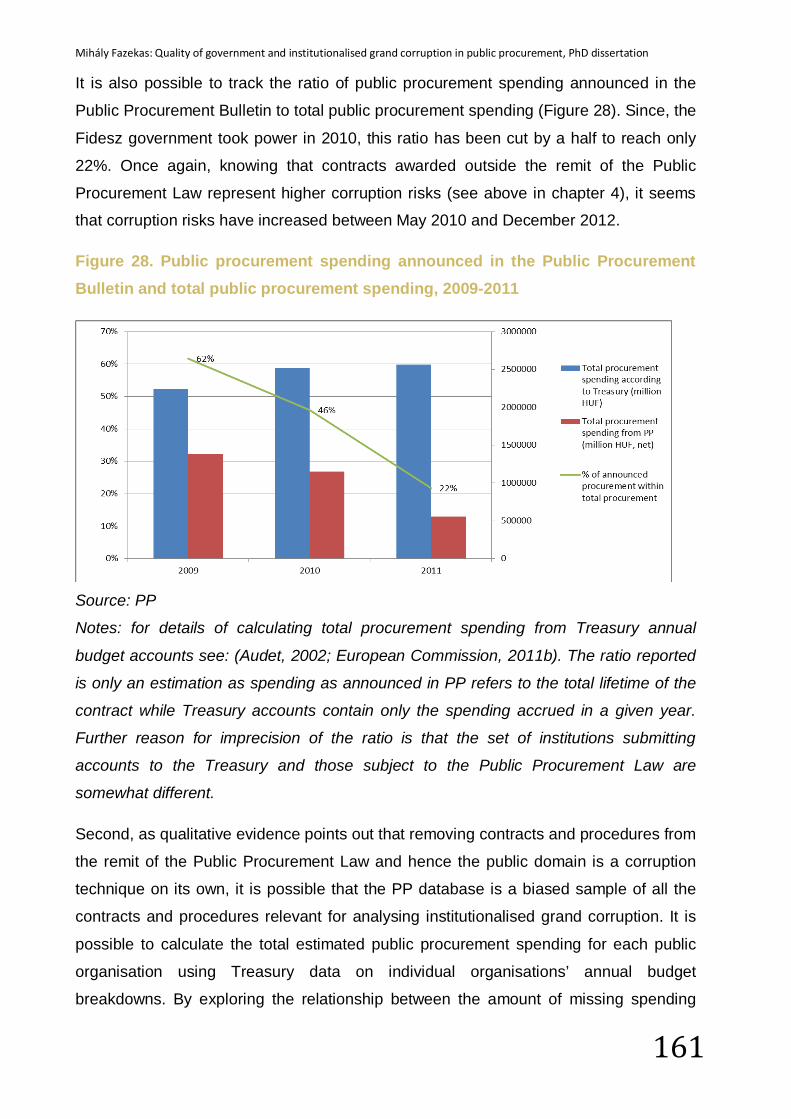
Mihály Fazekas: Quality of government and institutionalised grand corruption in public procurement, PhD dissertation
161
It is also possible to track the ratio of public procurement spending announced in the
Public Procurement Bulletin to total public procurement spending (Figure 28). Since, the
Fidesz government took power in 2010, this ratio has been cut by a half to reach only
22%. Once again, knowing that contracts awarded outside the remit of the Public
Procurement Law represent higher corruption risks (see above in chapter 4), it seems
that corruption risks have increased between May 2010 and December 2012.
Figure 28. Public procurement spending announced in the Public Procurement Bulletin and total public procurement spending, 2009-2011
Source: PP
Notes: for details of calculating total procurement spending from Treasury annual
budget accounts see: (Audet, 2002; European Commission, 2011b). The ratio reported
is only an estimation as spending as announced in PP refers to the total lifetime of the
contract while Treasury accounts contain only the spending accrued in a given year.
Further reason for imprecision of the ratio is that the set of institutions submitting
accounts to the Treasury and those subject to the Public Procurement Law are
somewhat different.
Second, as qualitative evidence points out that removing contracts and procedures from
the remit of the Public Procurement Law and hence the public domain is a corruption
technique on its own, it is possible that the PP database is a biased sample of all the
contracts and procedures relevant for analysing institutionalised grand corruption. It is
possible to calculate the total estimated public procurement spending for each public
organisation using Treasury data on individual organisations’ annual budget
breakdowns. By exploring the relationship between the amount of missing spending
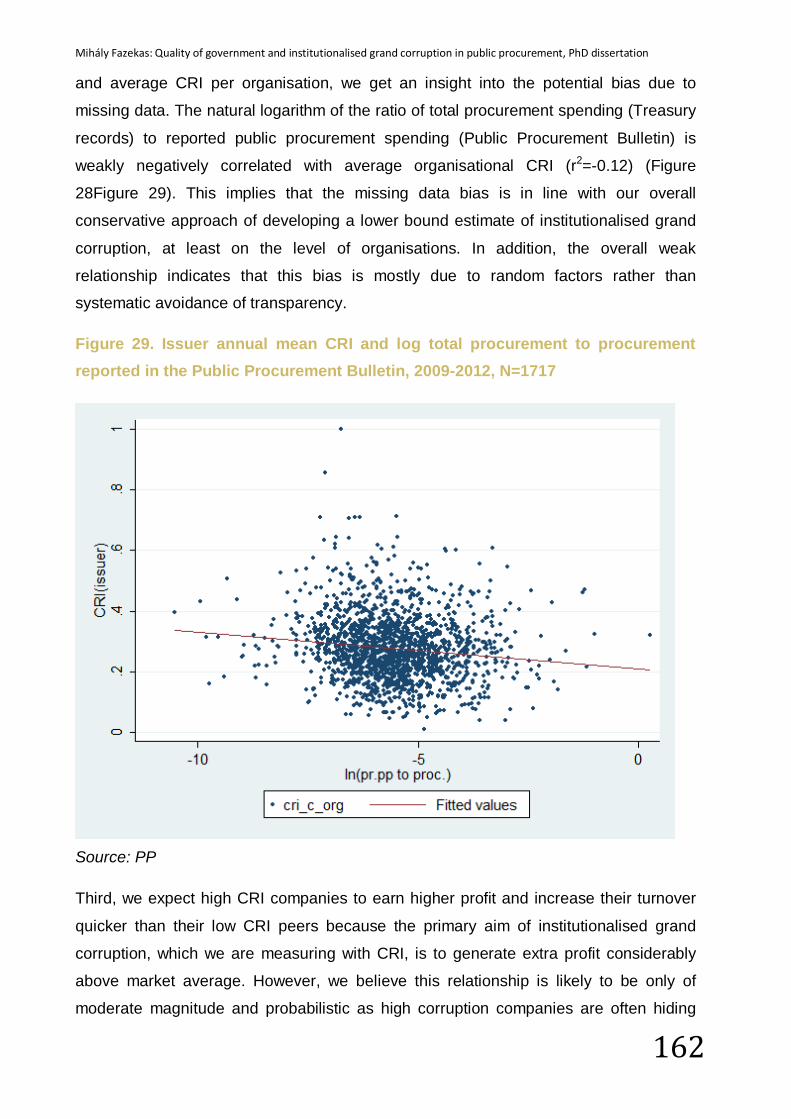
Mihály Fazekas: Quality of government and institutionalised grand corruption in public procurement, PhD dissertation
162
and average CRI per organisation, we get an insight into the potential bias due to
missing data. The natural logarithm of the ratio of total procurement spending (Treasury
records) to reported public procurement spending (Public Procurement Bulletin) is
weakly negatively correlated with average organisational CRI (r2=-0.12) (Figure
28Figure 29). This implies that the missing data bias is in line with our overall
conservative approach of developing a lower bound estimate of institutionalised grand
corruption, at least on the level of organisations. In addition, the overall weak
relationship indicates that this bias is mostly due to random factors rather than
systematic avoidance of transparency.
Figure 29. Issuer annual mean CRI and log total procurement to procurement reported in the Public Procurement Bulletin, 2009-2012, N=1717
Source: PP
Third, we expect high CRI companies to earn higher profit and increase their turnover
quicker than their low CRI peers because the primary aim of institutionalised grand
corruption, which we are measuring with CRI, is to generate extra profit considerably
above market average. However, we believe this relationship is likely to be only of
moderate magnitude and probabilistic as high corruption companies are often hiding
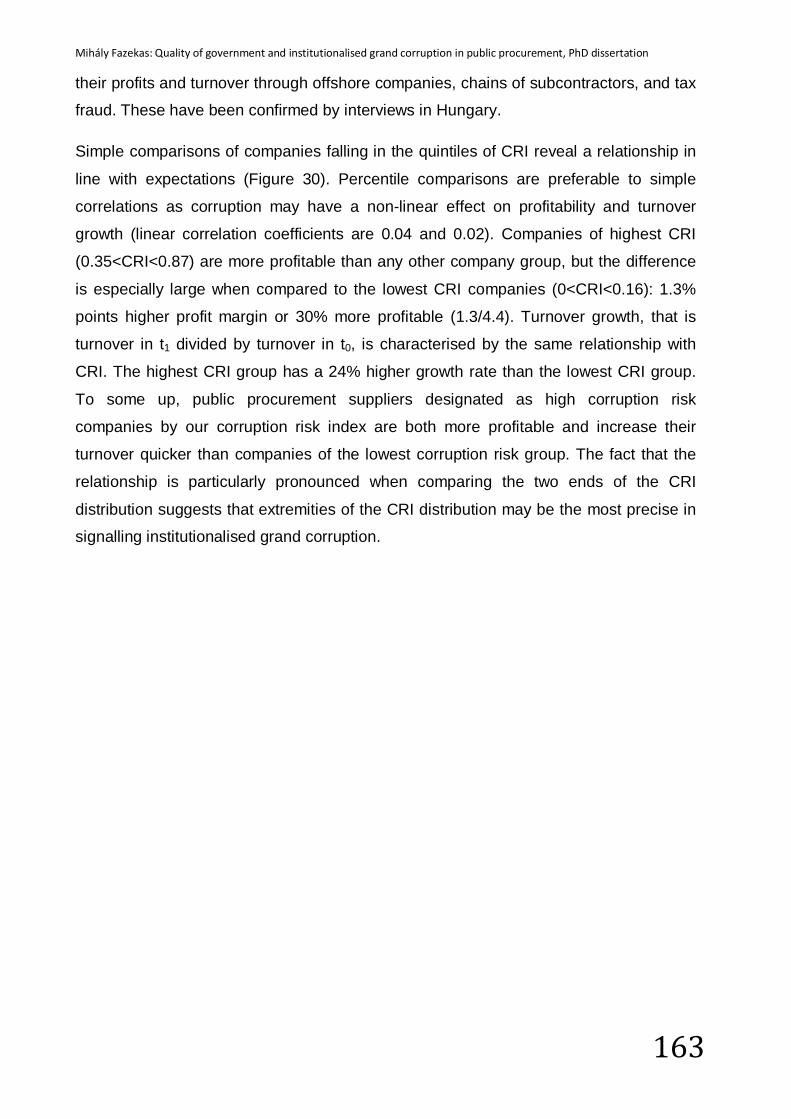
Mihály Fazekas: Quality of government and institutionalised grand corruption in public procurement, PhD dissertation
163
their profits and turnover through offshore companies, chains of subcontractors, and tax
fraud. These have been confirmed by interviews in Hungary.
Simple comparisons of companies falling in the quintiles of CRI reveal a relationship in
line with expectations (Figure 30). Percentile comparisons are preferable to simple
correlations as corruption may have a non-linear effect on profitability and turnover
growth (linear correlation coefficients are 0.04 and 0.02). Companies of highest CRI
(0.35<CRI<0.87) are more profitable than any other company group, but the difference
is especially large when compared to the lowest CRI companies (0<CRI<0.16): 1.3%
points higher profit margin or 30% more profitable (1.3/4.4). Turnover growth, that is
turnover in t1 divided by turnover in t0, is characterised by the same relationship with
CRI. The highest CRI group has a 24% higher growth rate than the lowest CRI group.
To some up, public procurement suppliers designated as high corruption risk
companies by our corruption risk index are both more profitable and increase their
turnover quicker than companies of the lowest corruption risk group. The fact that the
relationship is particularly pronounced when comparing the two ends of the CRI
distribution suggests that extremities of the CRI distribution may be the most precise in
signalling institutionalised grand corruption.
Mihály Fazekas: Quality of government and institutionalised grand corruption in public procurement, PhD dissertation
164
Figure 30. Mean profit margin and mean turnover growth by CRI quintiles, 2009-2012, N (pr.margin)=3097; N(turno.growth)=2894
Source: PP
Note:* p<0.05; ** p<0.01; *** p<0.001 designate the significance of the difference from
the “low CRI” group. Significance levels computed using Monte-Carlo random
permutations (300 repetitions) with stata
Fourth, we expect that companies with political connections to display higher corruption
risks as the primary vehicle for maintaining institutionalised grand corruption is to have
strong ties between powerful political and business actors. We mapped the owners and
manager of each company winning in 2009-2012 (15% of companies were either
unidentifiable or we lacked the relevant data) and matched them with key political
officeholders of public organisations existing in the period (for full list of institutions and
offices see Appendix 5C). The matching was done between more than 35000
owners/managers of winning firms and more than 10000 political officeholders based
on full name55. Matching solely on name is obviously prone to random error which is
nevertheless set aside for the present analysis by assuming that name frequency is not
correlated with CRI. Those companies which have or had at least one owner or
manager holding a political office at any point in time were designated as politically
connected firms.
55 Matching based on publicly available biographical data will be available in a later version of this paper.
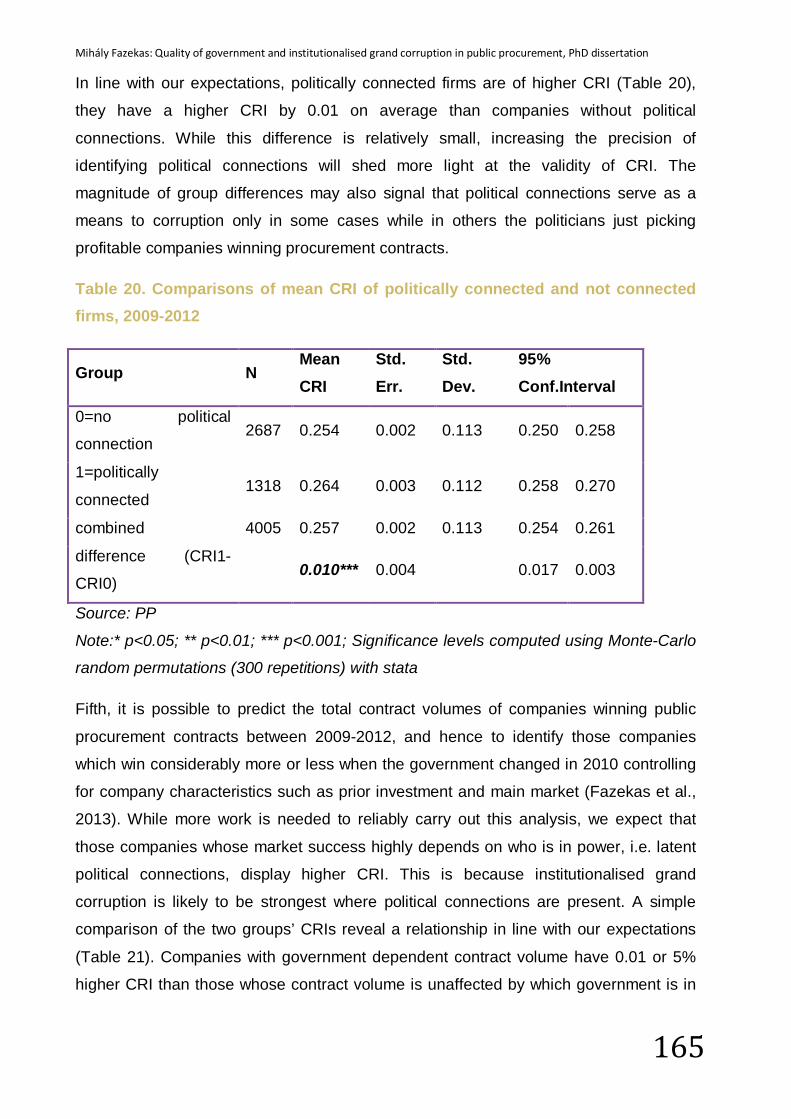
Mihály Fazekas: Quality of government and institutionalised grand corruption in public procurement, PhD dissertation
165
In line with our expectations, politically connected firms are of higher CRI (Table 20),
they have a higher CRI by 0.01 on average than companies without political
connections. While this difference is relatively small, increasing the precision of
identifying political connections will shed more light at the validity of CRI. The
magnitude of group differences may also signal that political connections serve as a
means to corruption only in some cases while in others the politicians just picking
profitable companies winning procurement contracts.
Table 20. Comparisons of mean CRI of politically connected and not connected firms, 2009-2012
Group N Mean CRI
Std. Err.
Std. Dev.
95% Conf.Interval
0=no political
connection 2687 0.254 0.002 0.113 0.250 0.258
1=politically
connected 1318 0.264 0.003 0.112 0.258 0.270
combined 4005 0.257 0.002 0.113 0.254 0.261
difference (CRI1-
CRI0) 0.010*** 0.004
0.017 0.003
Source: PP
Note:* p<0.05; ** p<0.01; *** p<0.001; Significance levels computed using Monte-Carlo
random permutations (300 repetitions) with stata
Fifth, it is possible to predict the total contract volumes of companies winning public
procurement contracts between 2009-2012, and hence to identify those companies
which win considerably more or less when the government changed in 2010 controlling
for company characteristics such as prior investment and main market (Fazekas et al.,
2013). While more work is needed to reliably carry out this analysis, we expect that
those companies whose market success highly depends on who is in power, i.e. latent
political connections, display higher CRI. This is because institutionalised grand
corruption is likely to be strongest where political connections are present. A simple
comparison of the two groups’ CRIs reveal a relationship in line with our expectations
(Table 21). Companies with government dependent contract volume have 0.01 or 5%
higher CRI than those whose contract volume is unaffected by which government is in
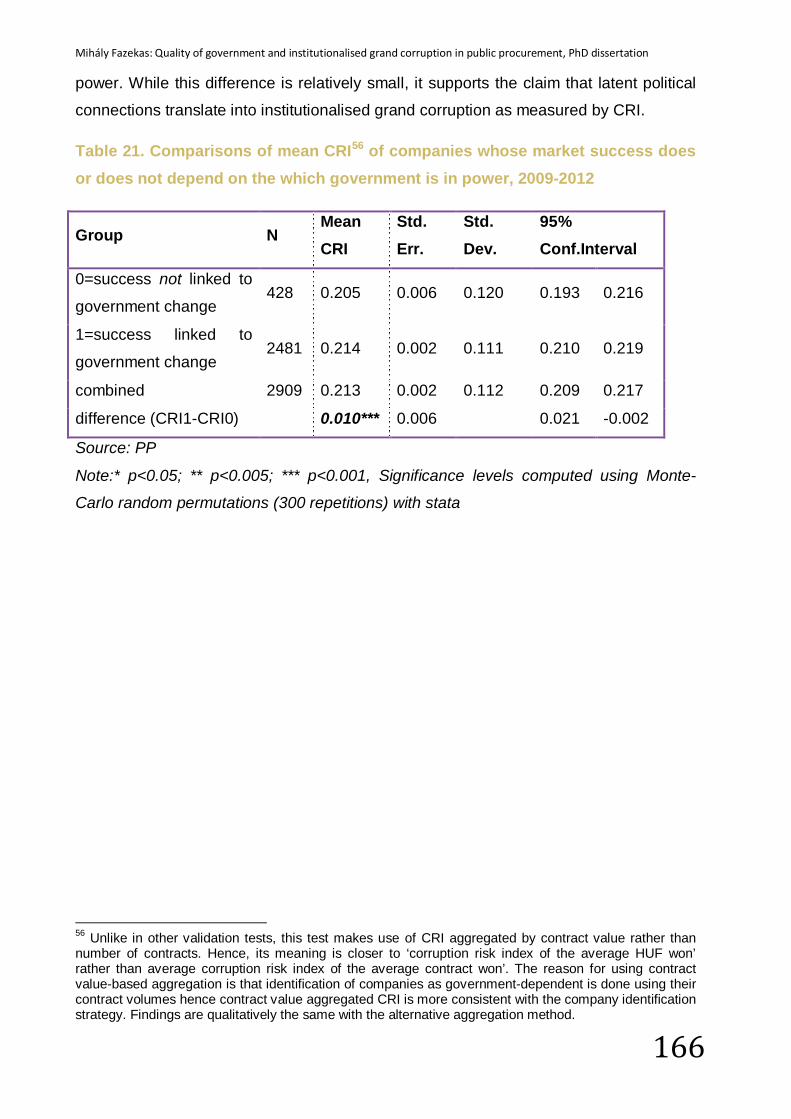
Mihály Fazekas: Quality of government and institutionalised grand corruption in public procurement, PhD dissertation
166
power. While this difference is relatively small, it supports the claim that latent political
connections translate into institutionalised grand corruption as measured by CRI.
Table 21. Comparisons of mean CRI56 of companies whose market success does or does not depend on the which government is in power, 2009-2012
Group N Mean CRI
Std. Err.
Std. Dev.
95% Conf.Interval
0=success not linked to
government change 428 0.205 0.006 0.120 0.193 0.216
1=success linked to
government change 2481 0.214 0.002 0.111 0.210 0.219
combined 2909 0.213 0.002 0.112 0.209 0.217
difference (CRI1-CRI0)
0.010*** 0.006
0.021 -0.002
Source: PP
Note:* p<0.05; ** p<0.005; *** p<0.001, Significance levels computed using Monte-
Carlo random permutations (300 repetitions) with stata
56 Unlike in other validation tests, this test makes use of CRI aggregated by contract value rather than number of contracts. Hence, its meaning is closer to ‘corruption risk index of the average HUF won’ rather than average corruption risk index of the average contract won’. The reason for using contract value-based aggregation is that identification of companies as government-dependent is done using their contract volumes hence contract value aggregated CRI is more consistent with the company identification strategy. Findings are qualitatively the same with the alternative aggregation method.
Mihály Fazekas: Quality of government and institutionalised grand corruption in public procurement, PhD dissertation
167
7. Conclusions and the uses of the indicators The analysis demonstrated that it is feasible and fruitful to construct a corruption risk
index (CRI) at the micro-level based on objective behavioural data only. Initial evidence
confirms the validity of CRI. The great advantage of our approach is that a large amount
of data is available for research across every developed country for the last 6-8 years,
opening up a new horizon for comparative corruption research. In addition, such
comparative research will be able to use a conceptually much clearer concept whose
measurement avoids the pitfalls of subjective indicators as well as prior objective
indicators.
Almost every corruption input displayed a relationship with corruption outcomes in line
with prior expectations (Table 22). Robust models linking corruption inputs to outputs
allowed for deriving component weights for CRI composed of 14 variable groups neither
of which dominates the resulting index (linear correlation coefficients between
corruption inputs and CRI range between 0.01 and 0.57). The strength of this approach
is that any change of regulation impacting on the relative costs of a corruption
technique compared to other techniques leaves our CRI robust, as the increasing use
of measured substitutive corruption techniques are adequately reflected. This
characteristic of our CRI is particularly useful when comparing different countries of
diverse regulatory environments and power constellations between elite groups. Further
comparative work will use the same set of variables and regression setup in order to
identify country- and period-specific parameters, as for example character-length of
eligibility criteria tailored to a single company is likely to vary across countries and time
with different regulatory institutions while the underlying institutionalised corruption may
remain the same (for a demonstration of this idea in practice see chapter 6).
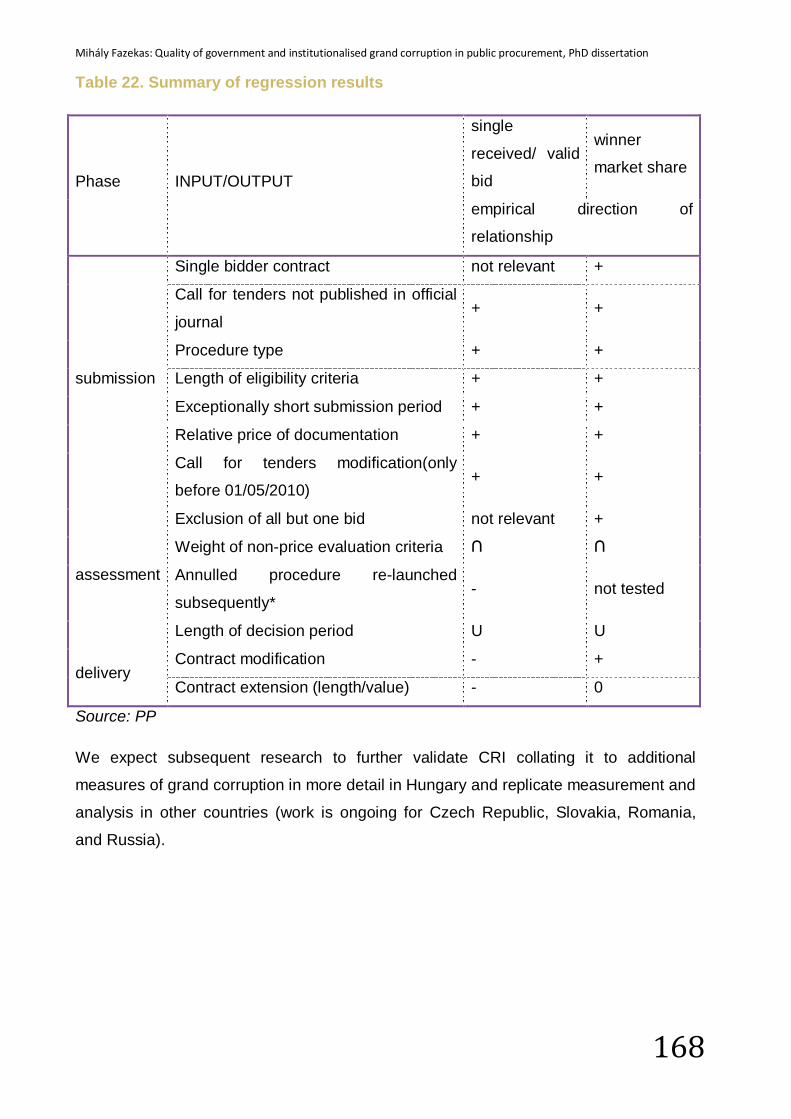
Mihály Fazekas: Quality of government and institutionalised grand corruption in public procurement, PhD dissertation
168
Table 22. Summary of regression results
Phase INPUT/OUTPUT
single
received/ valid
bid
winner
market share
empirical direction of
relationship
submission
Single bidder contract not relevant +
Call for tenders not published in official
journal + +
Procedure type + +
Length of eligibility criteria + +
Exceptionally short submission period + +
Relative price of documentation + +
Call for tenders modification(only
before 01/05/2010) + +
assessment
Exclusion of all but one bid not relevant +
Weight of non-price evaluation criteria ∩ ∩
Annulled procedure re-launched
subsequently* - not tested
Length of decision period U U
delivery Contract modification - +
Contract extension (length/value) - 0
Source: PP
We expect subsequent research to further validate CRI collating it to additional
measures of grand corruption in more detail in Hungary and replicate measurement and
analysis in other countries (work is ongoing for Czech Republic, Slovakia, Romania,
and Russia).
Mihály Fazekas: Quality of government and institutionalised grand corruption in public procurement, PhD dissertation
169
Chapter 6 - Are EU funds a corruption risk? The impact of EU funds on grand
corruption in Central and Eastern Europe57
1. Introduction It is hard to miss the ‘buzz’ around how extensively corruption affects the spending of
European Union (EU) funds across many new and old member states: Italian mafia
hijacking highway projects, or the European Commission freezing Structural Funds
payments in countries such as Romania, Bulgaria, or Hungary. Some of these cases
point at the involvement of high-level politics and organised criminal groups, raising the
possibility that the EU in fact extensively finances large-scale corruption in a number of
countries.
EU funds constitute a considerable part of GDP in many member states, especially in
Central and Eastern Europe (CEE) where it amounts to 1.9%-4.4% of annual member
state GDPs (KPMG, 2012) and well above 50% of public investment. Even if only a
fraction of these amounts is impacted by corruption, the negative effects are likely to be
considerable in terms of mis-investment (e.g. empty highways leading to nowhere) and
distorted economic incentives, jeopardizing regional convergence, one of the primary
goals of EU funds. If corruption in EU funds spending is indeed connected to high-level
politics and organised crime, then ramifications are more severe, impacting political
competition, democracy, and social welfare eventually.
Given high – suspected – corruption risks in EU funds spending, especially in CEE, the
large sums involved, and the potential negative consequences, this paper sets out to
explore the following research question:
What is the impact of EU funds spending on institutionalised grand corruption in CEE?
It focuses on three new EU member states: Czech Republic, Hungary, and Slovakia
throughout 2009-2012. These three EU member states represent different levels of
wealth and development trajectories. Their political institutions differ considerably with
Hungary increasingly displaying some authoritarian characteristics lately and generally
57 Some of the research underlying this chapter has been conducted in collaboration with Jana Chvalkovska, Jiri Skuhrovec, and István János Tóth.
Mihály Fazekas: Quality of government and institutionalised grand corruption in public procurement, PhD dissertation
170
failing to tackle corruption (Batory, 2012); Slovakia making some progress towards
clean government albeit with question marks (Beblavy, 2009), and Czech Republic
being one of the good performers of CEE while displaying some signs of a deteriorating
situation (Transparency International, 2012b). In spite of differences, these countries
share a broadly similar post-communist heritage and a relatively homogenous
regulatory framework defined by the EU.
2009-2012 constitutes a turbulent period with the global economic crisis unfolding and
turning into a sovereign debt crisis in Europe, with the three countries being affected in
different ways. There was at least one general election in 2009-2012 in each of these
countries. This turbulent environment provides the perfect setting for testing the
robustness of our theory in different political and economic contexts.
EU funds are spent in various forms which make it hard to arrive at a blanket
assessment. Therefore, we opted for looking only at public procurement spending by public or semi-public organisations (e.g. state owned enterprises) financed from EU funds, which predominantly means the use of Cohesion and Structural Funds. This
approach carries the advantage that projects can be compared which are similar in
most respects except for the source of financing: predominantly EU or national.
Moreover, there is exceptionally good data available on public procurement spending in
all three countries on the level of individual contracts for the period.
Our approach is a major departure from prior studies in this area, as it utilizes a large-
scale micro-level quantitative database which allows for unearthing a rich detailed
picture on the level of individual actors while also being broad enough to evaluate whole
systems of governance.
The paper is structured as follows: first, a brief overview of key arguments in the
literature is provided; second, the data sources and our new indicators are discussed;
third, our hypotheses are assessed; fourth, conclusions and further research directions
are offered.
Mihály Fazekas: Quality of government and institutionalised grand corruption in public procurement, PhD dissertation
171
2. Theory In spite of the considerable public and policy interest in corruption risks in EU funds
spending, there is remarkably little scientific work on the question to date58.
Looking into the broader discussion, there are two potential sources of theoretical
underpinning: the broad economic, sociological, and political science literature on aid
dependence and the Europeanization literature in political science. These two
literatures offer no unambiguous theoretical expectation on whether and how EU funds
contribute to the quality of institutions and impact corruption. Rather, what we find is a
set of conflicting predictions and mechanisms which need empirical evaluation.
The literature looking at the effect of development aid on quality of institutions and
corruption is vast; however, it can be applied to the context of CEE countries and EU
funds only with caution due to the greatly different contexts and funding volumes (i.e.
EU funding amounts to 3-4% of recipient countries’ GDP whereas many developing
countries receive aid more than 10% of GDP (Bräutigam & Knack, 2004)).
Nevertheless, according to this literature, foreign aid can have a positive effect on governance by providing clear policy goals of improving the civil service and helping
countries to overcome the lack of resources for state building (Knack, 2001). However,
development aid can also destroy institutions and impede state building in a similar
way as natural resources can (Djankov, Montalvo, & Reynal-Querol, 2008).
Development aid can weaken accountability and the development of civil society by
breaking the link between domestic revenues (i.e. taxation) and government services. It
can also directly destruct domestic administrative capacity by reallocating talented
bureaucrats from domestic institutions to aid organisations and by providing additional
organisational goals potentially increasing institutional fragmentation. Probably most
importantly, development aid increases the pool of public resources available for rent
seeking which easily translates into additional corruption in contexts with weak controls
of corruption (Bräutigam, 2000). While these causal pathways may work differently in
the CEE context, the above arguments may still account for a large part of the
mechanisms linking EU funds to corruption in the region. Combining these insights with
58 Keyword searches using “EU funds” and “corruption” returned not a single article in search engines: Google scholar, Jstor, Wiley online, Business Source Complete, Project Muse, and Sage Journals when searching only in the title. Only the Web of Knowledge database returned an article: (Dimulescu et al., 2013). However, searching in the main text of articles returns a large number of hits. For example, Google scholar found 98400 hits for the same keywords (25/9/2013).
Mihály Fazekas: Quality of government and institutionalised grand corruption in public procurement, PhD dissertation
172
scholarship specific to CEE and EU governance leads to more robust theoretical
underpinnings.
In the Europeanization literature, few would debate that that the EU contributed to institution building and improvement of governance in CEE countries throughout the accession process (Epstein & Sedelmeier, 2009). The EU provided the highly
popular goal of accession for CEE governments and guidance on which institutional
improvements should be implemented to reach this goal albeit with varying clarity
(Meyer-Sahling, 2011). These resulted in a wealth of reforms of public administration,
democratic checks and balances, or financial management.
However, many authors expressed concerns that CEE countries reversed a range of reforms after accession and left many EU-supported and/or requested new rules
as ‘empty shells’ (Dimitrova, 2009; Epstein & Sedelmeier, 2009; Mungiu-Pippidi, 2007).
These concerns stem from the EU’s diminishing leverage to keep new member states
in line with principles of good government and the perceived limited embeddedness of
many pre-accession reforms. Many of these reforms were either ‘implemented’ only on
paper or created islands of excellence isolated from the rest of public administration
(Goetz, 2001).
Similarly to the literature on aid dependency, the Europeanization literature delivers
good reasons for believing that EU funds advance good government. First, one of the
most important remaining post-accession levers of Brussels for disciplining new
member states is EU funds and the threat of withdrawing them (Epstein & Sedelmeier,
2009) which should, in principle, motivate recipient countries to manage funds well. This
argument implies a macro to micro causal mechanism whereby governments in general
and national managing authorities in particular, take additional steps to guard the
integrity of EU funds spending compared to national spending. Second, the
disbursement of EU funds is more heavily regulated, making, in principle, corruption
more costly. For example, project management and payments have to be rigorously
documented and detailed regulations followed. Heavy administrative and regulatory
requirements can also contribute to higher administrative capacity in the recipient
organisations as they often have to invest in their capacities to be able to receive and
manage EU funds. Third, more extensive monitoring and controls of EU funds also
point at potential beneficial effects (Pricewaterhouse Coopers, 2013). Public spending
financed from EU funds are subject to EU monitoring in addition to the usual national
Mihály Fazekas: Quality of government and institutionalised grand corruption in public procurement, PhD dissertation
173
audit frameworks making detection and punishment of wrongdoing more likely
(European Commission, 2003; European Court of Auditors, 2012, 2013). Moreover, the
European Court of Justice represents an additional venue for judicial review, making
the capture of domestic courts a less effective way of avoiding punishment for
corruption.
Similar to the development aid literature, the Europeanization literature also delivers
arguments stating that external funding such as EU funds in CEE deteriorate the quality of government and increase corruption. There are at least three reasons.
First, EU Cohesion and Structural Funds are spent on investment projects where public
discretion is high. From the wider literature, it is clear that discretionary spending is
more likely to involve corruption than non-discretionary spending such as pensions,
albeit the direction of causality is far from clear (Mauro, 1998; Tanzi & Davoodi, 2001).
Second, EU funding provides a large additional pool of public resources for rent
extraction. Hence, all else being equal, EU funds add to the pool of particularistically
allocated public resources (Mungiu-Pippidi, 2013). Third, EU funds, like external
funding in developing countries, weaken the link between domestic civil society,
taxation, and policy performance. While the relative value of EU funding in CEE
countries’ budgets is considerably lower than development aid in least developed
countries, for particular public organisations the proportion can be extremely high (e.g.
in 24.5% of Hungarian issuing bodies between 2009-2012, all the public procurement
contracts awarded were financed from EU funds).
In addition to the above broader arguments, preliminary evidence from Hungary
(Fazekas et al., 2013) and Romania (Dimulescu, Pop, & Doroftei, 2013) suggest that
corruption in EU funds reaches up to high-level politicians. Therefore, it is conceivable
that EU funds, in fact, fuel high-level corruption networks which can simultaneously
control business and political positions. This implies that EU funding keeps corrupt
elites in power rather than promoting integrity.
From the above discussion, the following hypotheses result: on the one hand,
H0: EU funds decrease institutionalised grand corruption in CEE,
on the other hand:
HA1: EU funds increase institutionalised grand corruption in CEE.
Mihály Fazekas: Quality of government and institutionalised grand corruption in public procurement, PhD dissertation
174
While the literature doesn’t discuss this possibility extensively, theoretically, it is also
possible that
HA2: EU funds leave institutionalised grand corruption unchanged in CEE.
In the context of public procurement, institutionalised grand corruption refers to the
particularistic allocation and performance of public procurement contracts by bending
universalistic rules and principles of good public procurement in order to benefit a group
of individuals while denying access to all others (for a similar understanding of
corruption see: Mungiu-Pippidi, 2006; North et al., 2009; Rothstein & Teorell, 2008).
While causal mechanisms cannot be tested one by one in detail, three major effects
can be identified and hence will be tested separately: 1) the effect of additional
resources represented by EU funding; 2) the effect of different monitoring and incentive
structures attached to EU funding; and 3) the spillover effect of managing EU funds in
the public administration (unfortunately this third effect could not be tested in this
version of the paper, more work is in progress).
The above hypotheses assume a simple, linear relationship between EU funding and
corruption which may be an oversimplification of reality. The aid dependency literature
touches upon a number of crucial factors mediating the effect of external funding on
institutional quality. Among these, the most essential is prior quality of government in
the recipient countries (Moss, Pettersson, & van de Walle, 2006). Extrapolating from
this argument, it is also possible that EU spending’s effect on corruption depends on the
level of corruption and administrative capacity in the recipient organisations. We will
return to this consideration in light of the empirical findings.
Mihály Fazekas: Quality of government and institutionalised grand corruption in public procurement, PhD dissertation
175
3. Data and variables
3.1. Data sources The database derives from public procurement announcements of 2009-2012 in Czech Republic, Hungary, and Slovakia (this database is called Public Procurement
Comparative database, referred to as PPC henceforth). The data represent a complete
database of all public procurement procedures conducted under national public
procurement laws. PPC contains variables appearing in 1) calls for tenders, 2) contract
award notices, 3) contract modification notices, and 4) administrative corrections
notices. As not all of these kinds of announcements appear for each procedure, for
example depending on procedure type, we only have the information deriving from
contract award notices consistently across every procedure. All the countries’ public
procurement legislation is within the framework of the EU Public Procurement Directive
and hence are, by and large, comparable. Utilization of certain regulatory tools are
different, nevertheless, which provides useful variability for later analysis.
The data derives from official government online sources in each country (Table
23). As there is no readily available database, we used a crawler algorithm to capture
every announcement available online. Then, applying a complex automatic and manual
text mining strategy, we created a structured database which contains variables with
well-defined categories. As the original texts available online contain a range of errors,
inconsistencies, and omissions, we applied several correction measures to arrive at a
database of sufficient quality for scientific research59. For a full description of database
development, see Soudek & Skuhrovec (2013) on the Czech Republic, Fazekas & Tóth
(2012a, 2012b) on Hungary, and Transparency International Slovakia (2009) on
Slovakia.
59 For example, contract award announcements and calls for tenders are directly linked through a unique procedure ID in the Czech Republic only. Whereas in Hungary and Slovakia, the announcements refer to each other in varying formats making our linking procedure imperfect.
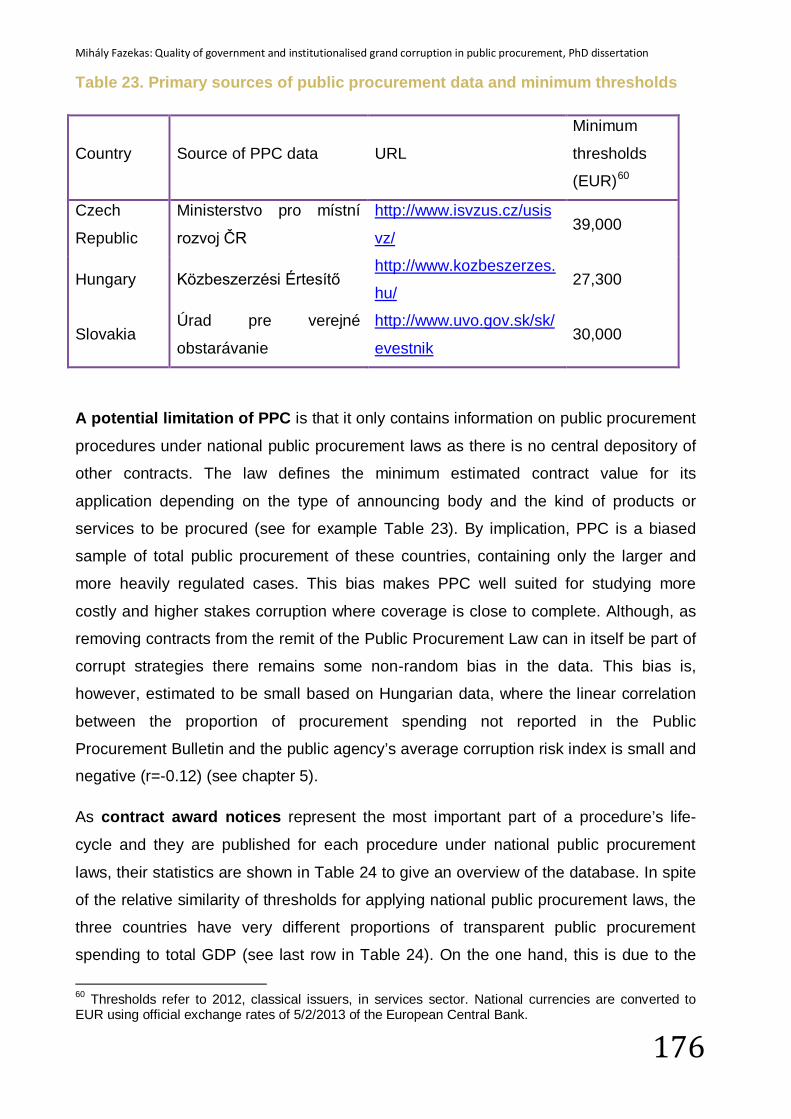
Mihály Fazekas: Quality of government and institutionalised grand corruption in public procurement, PhD dissertation
176
Table 23. Primary sources of public procurement data and minimum thresholds
Country Source of PPC data URL
Minimum
thresholds
(EUR)60
Czech
Republic
Ministerstvo pro místní
rozvoj ČR
http://www.isvzus.cz/usis
vz/ 39,000
Hungary Közbeszerzési Értesítő http://www.kozbeszerzes.
hu/
27,300
Slovakia Úrad pre verejné
obstarávanie
http://www.uvo.gov.sk/sk/
evestnik 30,000
A potential limitation of PPC is that it only contains information on public procurement
procedures under national public procurement laws as there is no central depository of
other contracts. The law defines the minimum estimated contract value for its
application depending on the type of announcing body and the kind of products or
services to be procured (see for example Table 23). By implication, PPC is a biased
sample of total public procurement of these countries, containing only the larger and
more heavily regulated cases. This bias makes PPC well suited for studying more
costly and higher stakes corruption where coverage is close to complete. Although, as
removing contracts from the remit of the Public Procurement Law can in itself be part of
corrupt strategies there remains some non-random bias in the data. This bias is,
however, estimated to be small based on Hungarian data, where the linear correlation
between the proportion of procurement spending not reported in the Public
Procurement Bulletin and the public agency’s average corruption risk index is small and
negative (r=-0.12) (see chapter 5).
As contract award notices represent the most important part of a procedure’s life-
cycle and they are published for each procedure under national public procurement
laws, their statistics are shown in Table 24 to give an overview of the database. In spite
of the relative similarity of thresholds for applying national public procurement laws, the
three countries have very different proportions of transparent public procurement
spending to total GDP (see last row in Table 24). On the one hand, this is due to the
60 Thresholds refer to 2012, classical issuers, in services sector. National currencies are converted to EUR using official exchange rates of 5/2/2013 of the European Central Bank.
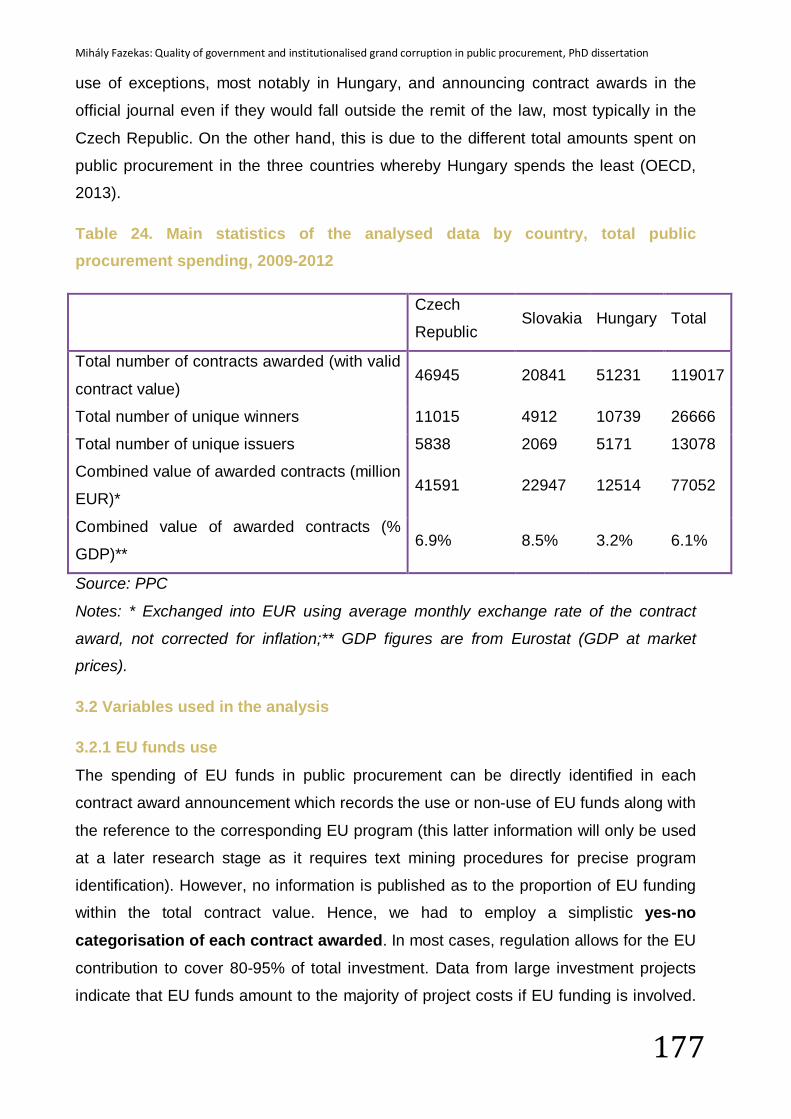
Mihály Fazekas: Quality of government and institutionalised grand corruption in public procurement, PhD dissertation
177
use of exceptions, most notably in Hungary, and announcing contract awards in the
official journal even if they would fall outside the remit of the law, most typically in the
Czech Republic. On the other hand, this is due to the different total amounts spent on
public procurement in the three countries whereby Hungary spends the least (OECD,
2013).
Table 24. Main statistics of the analysed data by country, total public procurement spending, 2009-2012
Czech
Republic Slovakia Hungary Total
Total number of contracts awarded (with valid
contract value) 46945 20841 51231 119017
Total number of unique winners 11015 4912 10739 26666
Total number of unique issuers 5838 2069 5171 13078
Combined value of awarded contracts (million
EUR)* 41591 22947 12514 77052
Combined value of awarded contracts (%
GDP)** 6.9% 8.5% 3.2% 6.1%
Source: PPC
Notes: * Exchanged into EUR using average monthly exchange rate of the contract
award, not corrected for inflation;** GDP figures are from Eurostat (GDP at market
prices).
3.2 Variables used in the analysis
3.2.1 EU funds use
The spending of EU funds in public procurement can be directly identified in each
contract award announcement which records the use or non-use of EU funds along with
the reference to the corresponding EU program (this latter information will only be used
at a later research stage as it requires text mining procedures for precise program
identification). However, no information is published as to the proportion of EU funding
within the total contract value. Hence, we had to employ a simplistic yes-no categorisation of each contract awarded. In most cases, regulation allows for the EU
contribution to cover 80-95% of total investment. Data from large investment projects
indicate that EU funds amount to the majority of project costs if EU funding is involved.
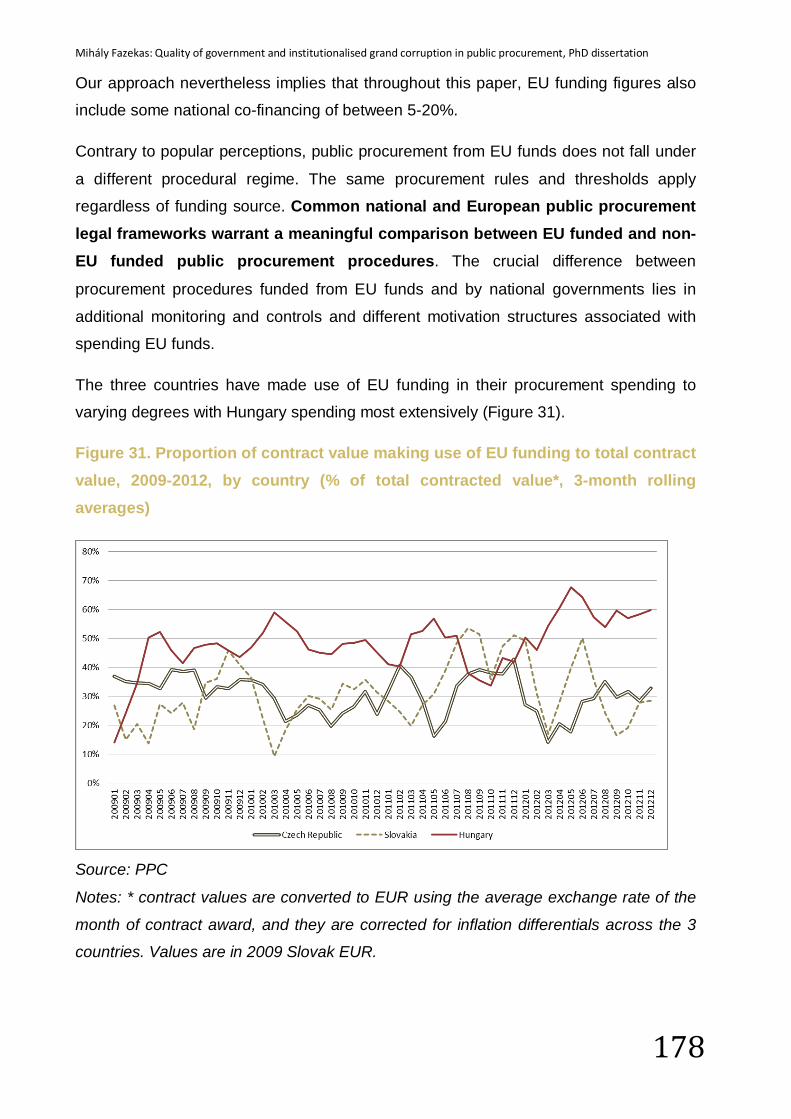
Mihály Fazekas: Quality of government and institutionalised grand corruption in public procurement, PhD dissertation
178
Our approach nevertheless implies that throughout this paper, EU funding figures also
include some national co-financing of between 5-20%.
Contrary to popular perceptions, public procurement from EU funds does not fall under
a different procedural regime. The same procurement rules and thresholds apply
regardless of funding source. Common national and European public procurement legal frameworks warrant a meaningful comparison between EU funded and non-EU funded public procurement procedures. The crucial difference between
procurement procedures funded from EU funds and by national governments lies in
additional monitoring and controls and different motivation structures associated with
spending EU funds.
The three countries have made use of EU funding in their procurement spending to
varying degrees with Hungary spending most extensively (Figure 31).
Figure 31. Proportion of contract value making use of EU funding to total contract value, 2009-2012, by country (% of total contracted value*, 3-month rolling averages)
Source: PPC
Notes: * contract values are converted to EUR using the average exchange rate of the
month of contract award, and they are corrected for inflation differentials across the 3
countries. Values are in 2009 Slovak EUR.
Mihály Fazekas: Quality of government and institutionalised grand corruption in public procurement, PhD dissertation
179
3.2.2 Indicators of institutionalised grand corruption Developing comparative indicators of institutionalised grand corruption in public
procurement for all three countries represent the primary methodological innovation of
this article. The approach follows closely the composite indicator building methodology
developed by the author (see chapter 5) making use of a wide range of elementary
indicators of corruption in public procurement deriving from a review of international
academic and policy literature, key informant interviews in Hungary, and content
analysis of the Hungarian media (see chapter 4).
The measurement approach exploits the fact that for institutionalised grand corruption to work, procurement contracts have to be awarded recurrently to companies belonging to the corrupt network. This can only be achieved, if legally
prescribed rules of competition and openness are bent or broken. By implication, it is
possible to identify the input side of the corruption process, that is techniques used for
limiting competition (e.g. leaving too little time for bidders to submit their bids), and also
the output side of corruption, that is signs of limited competition (e.g. a single bid
received). By measuring the degree of unfair restriction of competition in public
procurement, an indirect indicator of corruption can be obtained. This indicator, called
corruption risk index (CRI) represents the probability of particularistic contract award and delivery in public procurement falling between 0 and 1.
The variables describing the input side of the corruption process in public procurement,
that is elementary corruption techniques, are reported in Table 25. There is a more
complete list of conceivable and measurable elementary corruption indicators (see
chapter 4); however for the purposes of comparability only a subset is used in this
paper. Indicators are grouped according to the phase of the procurement process they
relate to. This is a work in progress; data will be processed for 2-3 additional
elementary corruption risk indicators in each country.
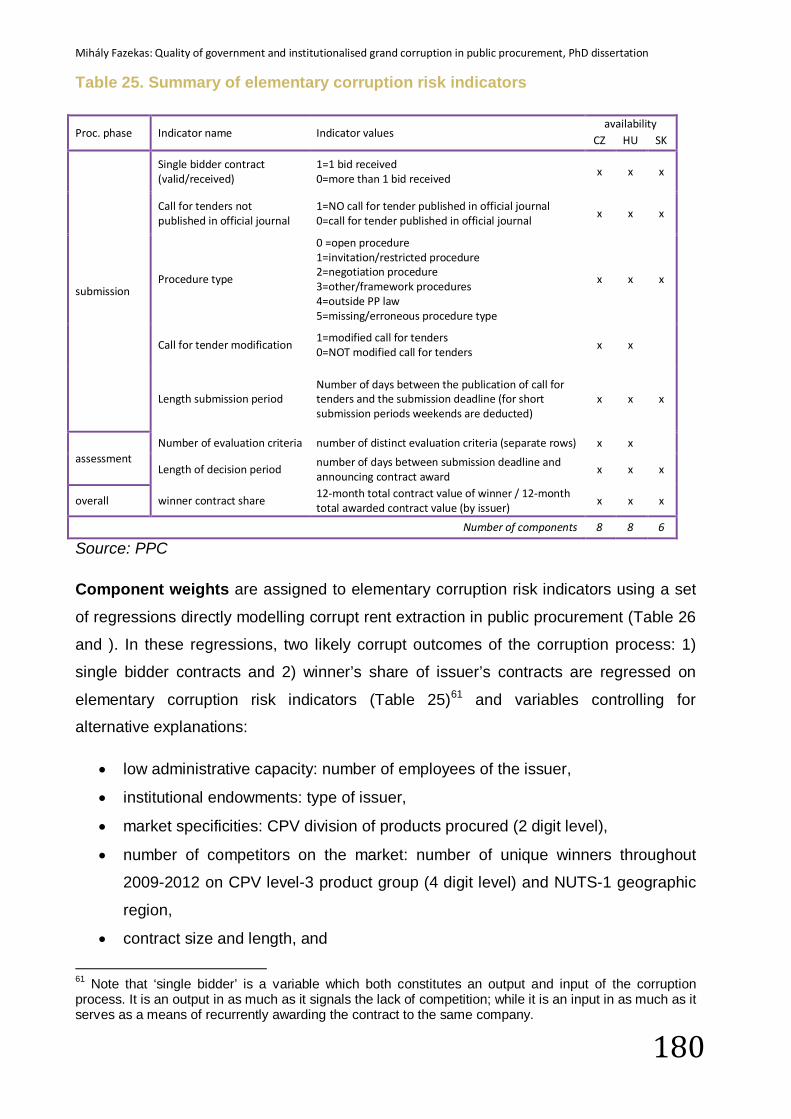
Mihály Fazekas: Quality of government and institutionalised grand corruption in public procurement, PhD dissertation
180
Table 25. Summary of elementary corruption risk indicators
Proc. phase Indicator name Indicator values availability
CZ HU SK
submission
Single bidder contract (valid/received)
1=1 bid received 0=more than 1 bid received
x x x
Call for tenders not published in official journal
1=NO call for tender published in official journal 0=call for tender published in official journal
x x x
Procedure type
0 =open procedure 1=invitation/restricted procedure 2=negotiation procedure 3=other/framework procedures 4=outside PP law 5=missing/erroneous procedure type
x x x
Call for tender modification 1=modified call for tenders 0=NOT modified call for tenders
x x
Length submission period Number of days between the publication of call for tenders and the submission deadline (for short submission periods weekends are deducted)
x x x
assessment Number of evaluation criteria number of distinct evaluation criteria (separate rows) x x
Length of decision period number of days between submission deadline and announcing contract award
x x x
overall winner contract share 12-month total contract value of winner / 12-month total awarded contract value (by issuer)
x x x
Number of components 8 8 6
Source: PPC
Component weights are assigned to elementary corruption risk indicators using a set
of regressions directly modelling corrupt rent extraction in public procurement (Table 26
and ). In these regressions, two likely corrupt outcomes of the corruption process: 1)
single bidder contracts and 2) winner’s share of issuer’s contracts are regressed on
elementary corruption risk indicators (Table 25)61 and variables controlling for
alternative explanations:
• low administrative capacity: number of employees of the issuer,
• institutional endowments: type of issuer,
• market specificities: CPV division of products procured (2 digit level),
• number of competitors on the market: number of unique winners throughout
2009-2012 on CPV level-3 product group (4 digit level) and NUTS-1 geographic
region,
• contract size and length, and
61 Note that ‘single bidder’ is a variable which both constitutes an output and input of the corruption process. It is an output in as much as it signals the lack of competition; while it is an input in as much as it serves as a means of recurrently awarding the contract to the same company.
Mihály Fazekas: Quality of government and institutionalised grand corruption in public procurement, PhD dissertation
181
• regulatory changes: year of contract award;
and using a restricted sample in order for the regressions to adequately fit a corrupt rent
extraction logic as opposed to market specificities or inexperience with public
procurement:
• markets with at least 3 unique winners throughout 2009-2012 for markets
defined by cpv (level 3) and nuts (level 1) categories for each country; and
• issuers awarding at least 3 contracts in the 12 months period prior to the contract
award in question.
For continuous variables such as the length of submission period, thresholds had to be
identified in order to reflect the non-linear character of corruption. This was done in two
steps in each country. First, the above regression models were fit using the continuous
version of the variable and the residual distribution was analysed in order to identify
distinct patterns lending themselves to categorisation; second, the same regression
models were re-estimated using the categorical version of the continuous variable and
the residual distribution checked for remaining patterns. If some systemic error
remained, further categories were introduced. As a result thresholds are different for
each country. These differences can be interpreted as reflections on different regulatory
and market conditions. For example, submission period thresholds differ per country,
year, and procedure type, primarily because the legally permissible submission period
lengths and the degree to which actors abide by these rules greatly differ.
Regression results indicate that there is considerable market access restriction, hence
likely institutionalised grand corruption, going on in all three countries during the 2009-
2012 period, by and large following the same techniques and ‘tricks’ (Table 26 and
Table 27). These results on their own demonstrate that corruption is systemic in public
procurement in these countries. Arriving at robust regression models with considerable
explanatory power (pseudo R2 between 0.11 and 0.30 for binary logistic regressions;
and R2 between 0.19 and 0.29 for linear regression) by using the same regression set-
up and variables point at the feasibility of cross-country measurement.
While there is not enough space to discuss each variable in detail, some examples
show the logic of analysis and our approach to interpretation. In the Czech Republic,
the modification of the call for tenders is associated with a 0.6% higher probability of
receiving a single bid and with a 1.5% higher winner’s contract share. Both results point
Mihály Fazekas: Quality of government and institutionalised grand corruption in public procurement, PhD dissertation
182
at a likely interpretation that modifying call for tenders during the bidding phase is
systematically used for restricting access and recurrently benefiting the same company.
This result warrants that the modification of call for tenders will be part of the Czech
CRI. In Slovakia, not publishing the call for tenders in the official journal is associated
with 9.0% higher probability of a single bidder contract award and a 1.3% higher
winner’s contract share. Both results suggest that avoiding the transparent and easily
accessible publication of a new tender can typically be used for limiting competition to
recurrently benefit a particular company. This implies that call for tenders not published
in the official journal becomes part of the Slovak CRI. In Hungary, leaving only 5 or
fewer days, inclusive the weekend, for bidders to submit their bids is associated with
20% higher probability of a single bidder contract and with a 7.9% higher winner’s
contract share compared to periods longer than 20 calendar days. These indicate that
extremely short submission periods are often used for limiting competition and awarding
contracts recurrently to the same company. Once again, this provides sufficient grounds
for including this category in the Hungarian CRI.
Following this logic, only those variables and variable categories are included in CRI
which are in line with a rent extraction logic and proven to be significant and powerful
predictors in at least one of the two regressions for each country62.
62 Being significant and of substantive size in only one of the two regressions is a sufficient condition for inclusion in the CRI of the given country because some corruption techniques are most typically used during the bidding phase or at later phases. Recall that single received bid is a likely corrupt outcome of the bidding phase while the winner’s contract share is indicative of corrupt outcomes for the whole public procurement process.

Mihály Fazekas: Quality of government and institutionalised grand corruption in public procurement, PhD dissertation
183
Table 26. Binary logistic regression results on contract level, 2009-2012, by country, average marginal effects, for markets where nr. of winners >=3
Source: PPC; Note: * p<0.05; ** p<0.01; *** p<0.001; clustered standard errors clustered by issuer for P(Fisher),
Monte Carlo random permutation simulations for P(permute) (200 permutations) using stata 12.0
Independent vars-CZ CZ Independent vars-SK SK Independent vars-HU HUNO call for tenders in off. journal 0.116*** NO call for tenders in off. journal 0.091*** NO call for tenders in off. journal 0.098***P(Fisher) 0.000 P(Fisher) 0.002 P(Fisher) 0.000P(permute) 0.000 P(permute) 0.000 P(permute) 0.000procedure type procedure type procedure typeref. cat.=open procedure ref. cat.=open procedure ref. cat.=open procedure1=invitation procedure -0.042*** 1=invitation procedure 0.01 1=invitation procedure 0.082***P(Fisher) 0.126 P(Fisher) 0.796 P(Fisher) 0.212P(permute) 0.000 P(permute) 0.575 P(permute) 0.0002=negotiation procedure 0.4*** 2=negotiation procedure 0.498*** 2=negotiation procedure 0.074***P(Fisher) 0.000 P(Fisher) 0.000 P(Fisher) 0.001P(permute) 0.000 P(permute) 0.000 P(permute) 0.0003=outside PP law -0.087*** 3=other procedure types 0.344*** 3=other procedure types 0.276***P(Fisher) 0.000 P(Fisher) 0.000 P(Fisher) 0.000P(permute) 0.435 P(permute) 0.000 P(permute) 0.0004=other/missing/erroneous procedure type -0.049 4=outside PP law -0.029 4=missing/error 0.025***P(Fisher) 0.278 P(Fisher) 0.629 P(Fisher) 0.171P(permute) 1.000 P(permute) 0.190 P(permute) 0.000modification of call for tenders 0.006*** modification of call for tenders n.a. modification of call for tenders n.a.P(Fisher) 0.747P(permute) 0.000short submission period short submission period short submission periodref.cat.=s.period>55* ref.cat.= s.period>25 ref.cat.=s.period>201= 47<s.period<=55 0.044*** 1= 14<s.period<=25 0.078*** 1= 17<s.period<=20 0.001P(Fisher) 0.060 P(Fisher) 0.011 P(Fisher) 0.944P(permute) 0.000 P(permute) 0.000 P(permute) 0.8752= 43<s.period<=47 0.067*** 2= s.period<=14 0.02 2= 5<s.period<=14 0.103***P(Fisher) 0.014 P(Fisher) 0.776 P(Fisher) 0.005P(permute) 0.000 P(permute) 0.680 P(permute) 0.0003= 38<s.period<=43 0.05*** 3= missing 0.064 3= 0<s.period<=5 (incl.weekend) 0.2***P(Fisher) 0.049 P(Fisher) 0.657 P(Fisher) 0.002P(permute) 0.000 P(permute) 0.600 P(permute) 0.0004= 27<s.period<=38 0.007 4=missing 0.05***P(Fisher) 0.811 P(Fisher) 0.213P(permute) 0.440 P(permute) 0.0005= 0<s.period<=27 0.009P(Fisher) 0.734P(permute) 0.2306=missing submission period -0.053P(Fisher) 0.559P(permute) 0.455number of assessment criteria number of assessment criteria n.a. number of assessment criteriaref.cat.= nr.of criteria=0 ref.cat.=2<nr.of criterioa<=41= 0<nr.of criteria<=2 0.053 1=nr.of criterioa=0 0.053***P(Fisher) 0.014 P(Fisher) 0.014P(permute) 1.000 P(permute) 0.0002= 2<nr.of assessment criteria<=8 -0.006*** 2= 0<nr.of criterioa<=2 0.087***P(Fisher) 0.772 P(Fisher) 0.003P(permute) 0.000 P(permute) 0.0003= 8<nr.of criteria 0.009 4= 4<nr.of criterioa 0.068***P(Fisher) 0.713 P(Fisher) 0.007P(permute) 0.520 P(permute) 0.000length of decision period length of decision period length of decision periodref.cat.= 113<dec.period<=201 ref.cat.=62<dec.period<=120 ref.cat.= 44<dec.period<=1821= 0<dec.period<=54 0.212 1= 0<dec.period<=62 0.127*** 1= 0<dec.period<=32 0.14***P(Fisher) 0.000 P(Fisher) 0.000 P(Fisher) 0.000P(permute) 0.470 P(permute) 0.000 P(permute) 0.0002= 54<dec.period<=67 0.111*** 3= 120<dec.period<=227 0.134*** 2= 32<dec.period<=44 0.056***P(Fisher) 0.000 P(Fisher) 0.034 P(Fisher) 0.000P(permute) 0.000 P(permute) 0.000 P(permute) 0.0003= 67<dec.period<=100 0.083*** 4= 227<dec.period<=322 0.16*** 4= 182<dec.period 0.16***P(Fisher) 0.000 P(Fisher) 0.016 P(Fisher) 0.000P(permute) 0.000 P(permute) 0.000 P(permute) 0.0004= 100<dec.period<=113 0.053*** 5= 322<dec.period 0.173*** missing -0.045***P(Fisher) 0.010 P(Fisher) 0.698 P(Fisher) 0.179P(permute) 0.000 P(permute) 0.000 P(permute) 0.0006= 201<dec.period 0.075*** 6= missing 0.047P(Fisher) 0.003 P(Fisher) 0.000P(permute) 0.000 P(permute) 0.5507= missing decision period 0.128P(Fisher) 0.521P(permute) 1.000
N 39423 16957 32006Pseudo-R2 0.295 0.231 0.108
Dependent var: single bidder contract (1), multi-bidder contract (0)
constant included in each regressioncontrol variables: type of issuer, number of employees, product market; number of winners on the market; year of contract award; log contract value; contract length
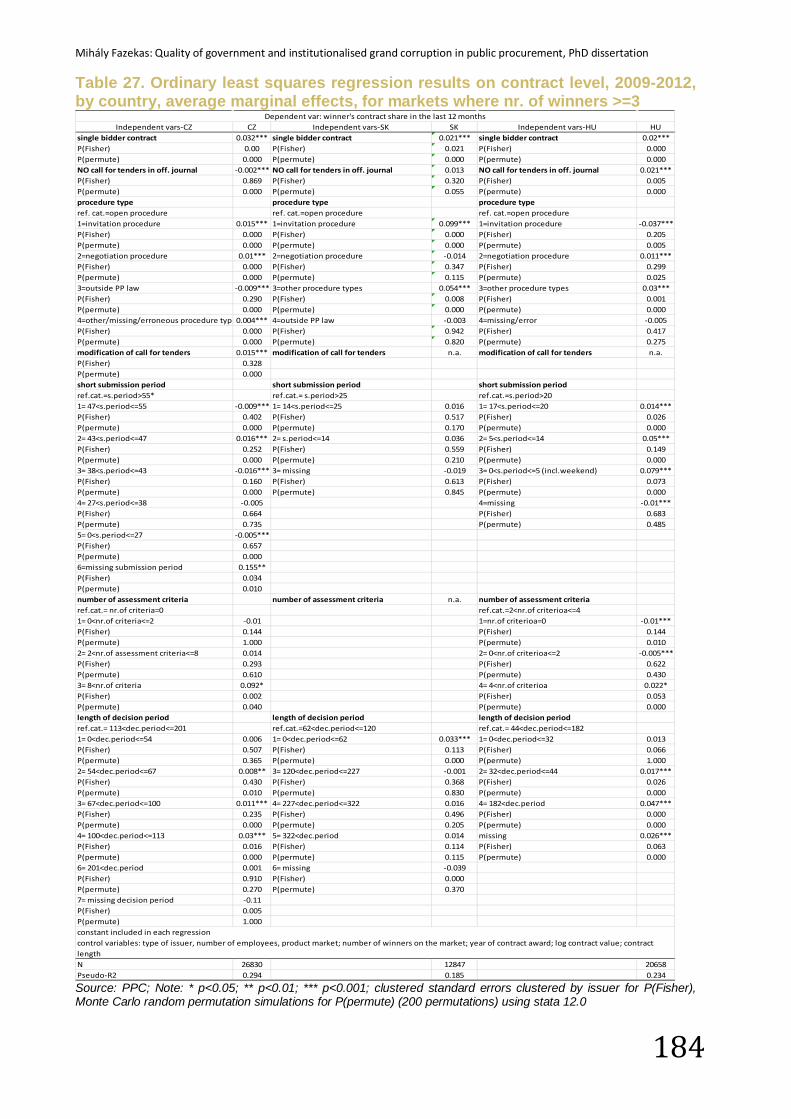
Mihály Fazekas: Quality of government and institutionalised grand corruption in public procurement, PhD dissertation
184
Table 27. Ordinary least squares regression results on contract level, 2009-2012, by country, average marginal effects, for markets where nr. of winners >=3
Source: PPC; Note: * p<0.05; ** p<0.01; *** p<0.001; clustered standard errors clustered by issuer for P(Fisher), Monte Carlo random permutation simulations for P(permute) (200 permutations) using stata 12.0
Independent vars-CZ CZ Independent vars-SK SK Independent vars-HU HUsingle bidder contract 0.032*** single bidder contract 0.021*** single bidder contract 0.02***P(Fisher) 0.00 P(Fisher) 0.021 P(Fisher) 0.000P(permute) 0.000 P(permute) 0.000 P(permute) 0.000NO call for tenders in off. journal -0.002*** NO call for tenders in off. journal 0.013 NO call for tenders in off. journal 0.021***P(Fisher) 0.869 P(Fisher) 0.320 P(Fisher) 0.005P(permute) 0.000 P(permute) 0.055 P(permute) 0.000procedure type procedure type procedure typeref. cat.=open procedure ref. cat.=open procedure ref. cat.=open procedure1=invitation procedure 0.015*** 1=invitation procedure 0.099*** 1=invitation procedure -0.037***P(Fisher) 0.000 P(Fisher) 0.000 P(Fisher) 0.205P(permute) 0.000 P(permute) 0.000 P(permute) 0.0052=negotiation procedure 0.01*** 2=negotiation procedure -0.014 2=negotiation procedure 0.011***P(Fisher) 0.000 P(Fisher) 0.347 P(Fisher) 0.299P(permute) 0.000 P(permute) 0.115 P(permute) 0.0253=outside PP law -0.009*** 3=other procedure types 0.054*** 3=other procedure types 0.03***P(Fisher) 0.290 P(Fisher) 0.008 P(Fisher) 0.001P(permute) 0.000 P(permute) 0.000 P(permute) 0.0004=other/missing/erroneous procedure type0.004*** 4=outside PP law -0.003 4=missing/error -0.005P(Fisher) 0.000 P(Fisher) 0.942 P(Fisher) 0.417P(permute) 0.000 P(permute) 0.820 P(permute) 0.275modification of call for tenders 0.015*** modification of call for tenders n.a. modification of call for tenders n.a.P(Fisher) 0.328P(permute) 0.000short submission period short submission period short submission periodref.cat.=s.period>55* ref.cat.= s.period>25 ref.cat.=s.period>201= 47<s.period<=55 -0.009*** 1= 14<s.period<=25 0.016 1= 17<s.period<=20 0.014***P(Fisher) 0.402 P(Fisher) 0.517 P(Fisher) 0.026P(permute) 0.000 P(permute) 0.170 P(permute) 0.0002= 43<s.period<=47 0.016*** 2= s.period<=14 0.036 2= 5<s.period<=14 0.05***P(Fisher) 0.252 P(Fisher) 0.559 P(Fisher) 0.149P(permute) 0.000 P(permute) 0.210 P(permute) 0.0003= 38<s.period<=43 -0.016*** 3= missing -0.019 3= 0<s.period<=5 (incl.weekend) 0.079***P(Fisher) 0.160 P(Fisher) 0.613 P(Fisher) 0.073P(permute) 0.000 P(permute) 0.845 P(permute) 0.0004= 27<s.period<=38 -0.005 4=missing -0.01***P(Fisher) 0.664 P(Fisher) 0.683P(permute) 0.735 P(permute) 0.4855= 0<s.period<=27 -0.005***P(Fisher) 0.657P(permute) 0.0006=missing submission period 0.155**P(Fisher) 0.034P(permute) 0.010number of assessment criteria number of assessment criteria n.a. number of assessment criteriaref.cat.= nr.of criteria=0 ref.cat.=2<nr.of criterioa<=41= 0<nr.of criteria<=2 -0.01 1=nr.of criterioa=0 -0.01***P(Fisher) 0.144 P(Fisher) 0.144P(permute) 1.000 P(permute) 0.0102= 2<nr.of assessment criteria<=8 0.014 2= 0<nr.of criterioa<=2 -0.005***P(Fisher) 0.293 P(Fisher) 0.622P(permute) 0.610 P(permute) 0.4303= 8<nr.of criteria 0.092* 4= 4<nr.of criterioa 0.022*P(Fisher) 0.002 P(Fisher) 0.053P(permute) 0.040 P(permute) 0.000length of decision period length of decision period length of decision periodref.cat.= 113<dec.period<=201 ref.cat.=62<dec.period<=120 ref.cat.= 44<dec.period<=1821= 0<dec.period<=54 0.006 1= 0<dec.period<=62 0.033*** 1= 0<dec.period<=32 0.013P(Fisher) 0.507 P(Fisher) 0.113 P(Fisher) 0.066P(permute) 0.365 P(permute) 0.000 P(permute) 1.0002= 54<dec.period<=67 0.008** 3= 120<dec.period<=227 -0.001 2= 32<dec.period<=44 0.017***P(Fisher) 0.430 P(Fisher) 0.368 P(Fisher) 0.026P(permute) 0.010 P(permute) 0.830 P(permute) 0.0003= 67<dec.period<=100 0.011*** 4= 227<dec.period<=322 0.016 4= 182<dec.period 0.047***P(Fisher) 0.235 P(Fisher) 0.496 P(Fisher) 0.000P(permute) 0.000 P(permute) 0.205 P(permute) 0.0004= 100<dec.period<=113 0.03*** 5= 322<dec.period 0.014 missing 0.026***P(Fisher) 0.016 P(Fisher) 0.114 P(Fisher) 0.063P(permute) 0.000 P(permute) 0.115 P(permute) 0.0006= 201<dec.period 0.001 6= missing -0.039P(Fisher) 0.910 P(Fisher) 0.000P(permute) 0.270 P(permute) 0.3707= missing decision period -0.11P(Fisher) 0.005P(permute) 1.000
N 26830 12847 20658Pseudo-R2 0.294 0.185 0.234
Dependent var: winner's contract share in the last 12 months
constant included in each regressioncontrol variables: type of issuer, number of employees, product market; number of winners on the market; year of contract award; log contract value; contract length
Mihály Fazekas: Quality of government and institutionalised grand corruption in public procurement, PhD dissertation
185
Once the list of elementary corruption risk indicators is determined with the help of the
above regressions (note that corruption outcomes are also part of this list even though
they don’t have regression coefficients), each of the variables and their categories
receive a component weight (Table 28). As we lack the detailed knowledge of which
elementary corruption technique is a necessary or sufficient condition for corruption to
occur, we assign equal weight to each variable and the sizes of regression coefficients
are only used to determine the weights within variables. For example, if there are four
significant categories of a variable, then they would get weights 1, 0.75, 0.5, and 0.25
reflecting category ranking according to coefficient sizes. The component weights are
normed so that the observed CRI falls between 0 and 1.
The strength of this composite indicator approach is that the individual components of
CRI are vulnerable to changes in regulation, competitive environment, or elite power
balance on their own, but taken together they are a more robust proxy of legal corruption over time.
In an international comparative perspective, a further strength of CRI is that it balances national specificities with international comparability. On the one hand, it provides
a comparative indicator in as much as the logic of indicator building and the underlying
indicators are the same in each country (of course, as much as data availability permits,
further work is in progress). On the other hand, component weights and variable
category thresholds (e.g. the definition of accelerated procedure in terms of submission
period length differs by country and year) reflect the different national contexts. The
same overall scale of country level CRI (i.e. 0-1) lends some meaning to the ‘which
country is more corrupt’ question; nevertheless, the primary purpose of the
measurement exercise is to go beyond simplistic understandings of corruption and
explore the structure of corruption within each context.
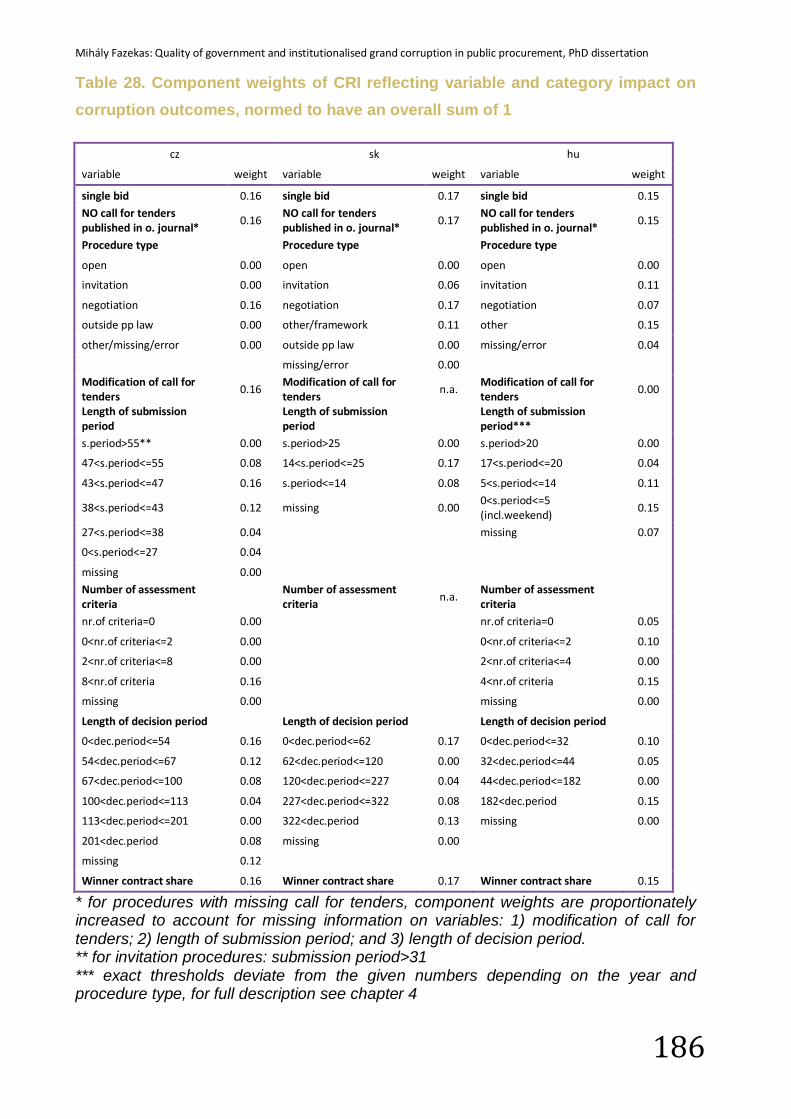
Mihály Fazekas: Quality of government and institutionalised grand corruption in public procurement, PhD dissertation
186
Table 28. Component weights of CRI reflecting variable and category impact on corruption outcomes, normed to have an overall sum of 1
cz sk hu
variable weight variable weight variable weight
single bid 0.16 single bid 0.17 single bid 0.15 NO call for tenders published in o. journal*
0.16 NO call for tenders published in o. journal*
0.17 NO call for tenders published in o. journal*
0.15
Procedure type
Procedure type
Procedure type
open 0.00 open 0.00 open 0.00
invitation 0.00 invitation 0.06 invitation 0.11
negotiation 0.16 negotiation 0.17 negotiation 0.07
outside pp law 0.00 other/framework 0.11 other 0.15
other/missing/error 0.00 outside pp law 0.00 missing/error 0.04
missing/error 0.00
Modification of call for tenders
0.16 Modification of call for tenders
n.a. Modification of call for tenders
0.00
Length of submission period
Length of submission period
Length of submission period***
s.period>55** 0.00 s.period>25 0.00 s.period>20 0.00
47<s.period<=55 0.08 14<s.period<=25 0.17 17<s.period<=20 0.04
43<s.period<=47 0.16 s.period<=14 0.08 5<s.period<=14 0.11
38<s.period<=43 0.12 missing 0.00 0<s.period<=5 (incl.weekend)
0.15
27<s.period<=38 0.04
missing 0.07
0<s.period<=27 0.04
missing 0.00
Number of assessment criteria
Number of assessment criteria
n.a. Number of assessment criteria
nr.of criteria=0 0.00
nr.of criteria=0 0.05
0<nr.of criteria<=2 0.00
0<nr.of criteria<=2 0.10
2<nr.of criteria<=8 0.00
2<nr.of criteria<=4 0.00
8<nr.of criteria 0.16
4<nr.of criteria 0.15
missing 0.00
missing 0.00
Length of decision period
Length of decision period
Length of decision period
0<dec.period<=54 0.16 0<dec.period<=62 0.17 0<dec.period<=32 0.10
54<dec.period<=67 0.12 62<dec.period<=120 0.00 32<dec.period<=44 0.05
67<dec.period<=100 0.08 120<dec.period<=227 0.04 44<dec.period<=182 0.00
100<dec.period<=113 0.04 227<dec.period<=322 0.08 182<dec.period 0.15
113<dec.period<=201 0.00 322<dec.period 0.13 missing 0.00
201<dec.period 0.08 missing 0.00
missing 0.12
Winner contract share 0.16 Winner contract share 0.17 Winner contract share 0.15
* for procedures with missing call for tenders, component weights are proportionately increased to account for missing information on variables: 1) modification of call for tenders; 2) length of submission period; and 3) length of decision period. ** for invitation procedures: submission period>31 *** exact thresholds deviate from the given numbers depending on the year and procedure type, for full description see chapter 4
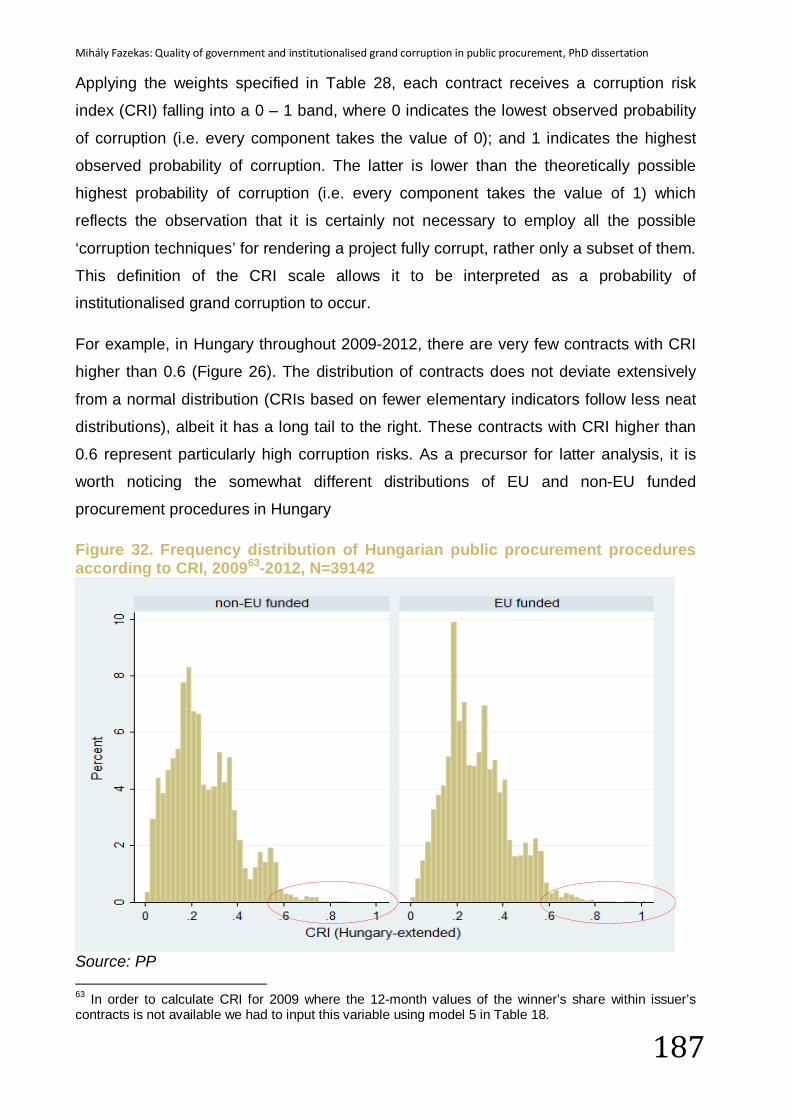
Mihály Fazekas: Quality of government and institutionalised grand corruption in public procurement, PhD dissertation
187
Applying the weights specified in Table 28, each contract receives a corruption risk
index (CRI) falling into a 0 – 1 band, where 0 indicates the lowest observed probability
of corruption (i.e. every component takes the value of 0); and 1 indicates the highest
observed probability of corruption. The latter is lower than the theoretically possible
highest probability of corruption (i.e. every component takes the value of 1) which
reflects the observation that it is certainly not necessary to employ all the possible
‘corruption techniques’ for rendering a project fully corrupt, rather only a subset of them.
This definition of the CRI scale allows it to be interpreted as a probability of
institutionalised grand corruption to occur.
For example, in Hungary throughout 2009-2012, there are very few contracts with CRI
higher than 0.6 (Figure 26). The distribution of contracts does not deviate extensively
from a normal distribution (CRIs based on fewer elementary indicators follow less neat
distributions), albeit it has a long tail to the right. These contracts with CRI higher than
0.6 represent particularly high corruption risks. As a precursor for latter analysis, it is
worth noticing the somewhat different distributions of EU and non-EU funded
procurement procedures in Hungary
Figure 32. Frequency distribution of Hungarian public procurement procedures according to CRI, 200963-2012, N=39142
Source: PP 63 In order to calculate CRI for 2009 where the 12-month values of the winner’s share within issuer’s contracts is not available we had to input this variable using model 5 in Table 18.
Mihály Fazekas: Quality of government and institutionalised grand corruption in public procurement, PhD dissertation
188
While the principal demonstration of validity of CRI is to be found in the regressions
directly modelling corrupt rent extraction in public procurement, external validity tests
are also constructed by using other ‘objective’ indicators of high-level corruption. For
example, in Hungary, companies owned or managed by political office holders have a significantly higher CRI (CRI difference=0.01, approximately one standard
deviation). There are further validity tests using company profitability, turnover growth
and the dependence of winning companies’ contract volumes on which government is
in power, each pointing at the robust validity of CRI (for full details see chapter 5).
In a comparative perspective, CRI of the average contract awarded can be calculated
for each country even for short periods such as months (Figure 33). This aggregate CRI
comes closest to frequently used subjective indicators of the prevalence of corruption.
Monthly average CRIs allow for tracking the countries’ changing corruption performance over time: albeit starting from a much higher level, Slovakia appears to
permanently improve its performance; Czech Republic remains largely stable; while
Hungary greatly deteriorates since the May 2010 change of government. As a result of
these movements, the three countries have somewhat converged in terms of their
average level of grand corruption.
There are two alternative CRI lines for Hungary as the new government greatly
decreased transparency in public procurement, for example by loosening the
requirement for publishing call for tenders, and there are alternative ways of taking this
change into account. The lower corruption risk path ignores missing variables due to
non-published calls for tenders and re-weights components in order to take into account
only the non-missing information; while the higher corruption risk path assumes that the
non-published calls for tenders are as corrupt as the worst published call for tenders.
While there is no data available to test which assumption is more appropriate, interview
evidence points out that deliberate decreases in transparency are associated with high
levels of corruption (see chapter 5).64
Depicting data only on markets with at least three competitors (i.e. three different
companies which have won at least one procurement contract on the market) corrects
for the small market and small country biases by removing them from the sample. Only
looking at issuers who have awarded at least 3 procurement contracts in the 12 months 64 While the scale of decreasing transparency clearly sets Hungary apart, the same arguments apply to the two other countries as they have many tenders submitted without a published call for tenders. Nevertheless, the difference between alternative calculations is only small in their case.
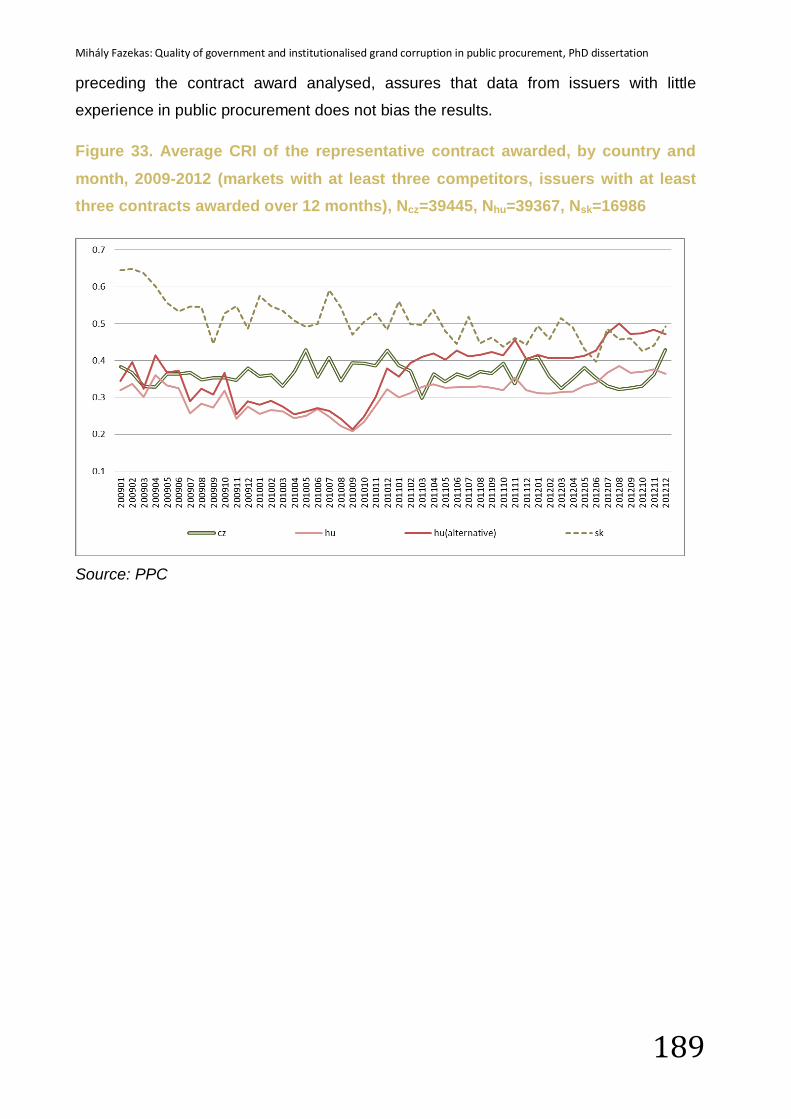
Mihály Fazekas: Quality of government and institutionalised grand corruption in public procurement, PhD dissertation
189
preceding the contract award analysed, assures that data from issuers with little
experience in public procurement does not bias the results.
Figure 33. Average CRI of the representative contract awarded, by country and month, 2009-2012 (markets with at least three competitors, issuers with at least three contracts awarded over 12 months), Ncz=39445, Nhu=39367, Nsk=16986
Source: PPC
Mihály Fazekas: Quality of government and institutionalised grand corruption in public procurement, PhD dissertation
190
4. Corruption risks and particularistic allocation of EU funding EU funds can exert influence on institutionalised grand corruption in CEE countries in
two principal ways: first, by providing additional funding for public investment hence increasing the pool of potential rents to earn; second, by changing the motivation structure and constraints of corrupt networks. Motivations and
constraints of corruption are different for EU Structural and Cohesion Funds because
monitoring may be more intense and thorough, and because national accountability
mechanisms may work in a different way when funding comes from outside. The first
approach focuses attention on increased amount of spending, whereas the second on
the different motivations for and controls of corruption.
4.1 Corruption risks of spending more
Institutionalised grand corruption thrives on public resources, especially on public
resources whose allocation can be influenced to benefit a small circle of businessmen
and politicians without restraint (Auriol et al., 2011; Goldman et al., 2013; Soreide,
2002). Hence, by increasing the overall value of public procurement spending,
corruption risks and corrupt rent extraction increase, unless they are offset by more
stringent controls of corruption. This section estimates the increase in corruption risks
due to increased spending only while holding motivations and controls, that is average
corruption risks, constant.
As EU regulation prescribes that EU Structural and Cohesion Funds should represent
additional spending rather than substituting national spending (European Council,
2006), we assumed 100% additionality, including national co-financing. This means that
every euro of EU funding spent in public procurement is considered to come on top of
nationally funded public procurement.
Changes in overall prevalence of corruption due to the increased amount of spending
are approximated by the expected value of EU funds allocated in a particularistic way,
where this expected value is calculated by relying on expected value theory (Kahneman
& Tversky, 1979):
Expected total value of particularistic resource allocation (EUR) =
probability of corruption (%) * total value spent (EUR)
Mihály Fazekas: Quality of government and institutionalised grand corruption in public procurement, PhD dissertation
191
where the probability of corruption to occur is measured by CRI. This value captures the
amount of resources allocated in a particularistic way which, by no means, equates with
the value of corruption rents extracted or cost of corruption. Rather, it implies the overall
value of public funds most likely available for rent extraction, while this rent very much
depends on the profitability and cost structure of benefiting companies (e.g. even in a
very corrupt road construction project, something must be built which costs at least
some amount to the contractor). The total social cost of corruption is composed of many
components of which corruption rent is only one, and perhaps not even the biggest.
Imagine, for example the misallocation of public investment to high corruption rent, but
low social return projects such as barely used stadiums expensive to maintain.
Using this formula and holding corruption risks (CRI) constant at the national funding’s
average, the value of additional particularistically allocated public resources generated by EU funding was between 0.9% and 1.8% of national GDPs in 2009-2012 in the three countries (Figure 34). Recall, CRI of EU funding has to be held
constant (i.e. at the average CRI of nationally funded public procurement) in order to
separate the effect of additional spending from the effect of different motivation for and
control of corruption. This second factor will be estimated in the next section.
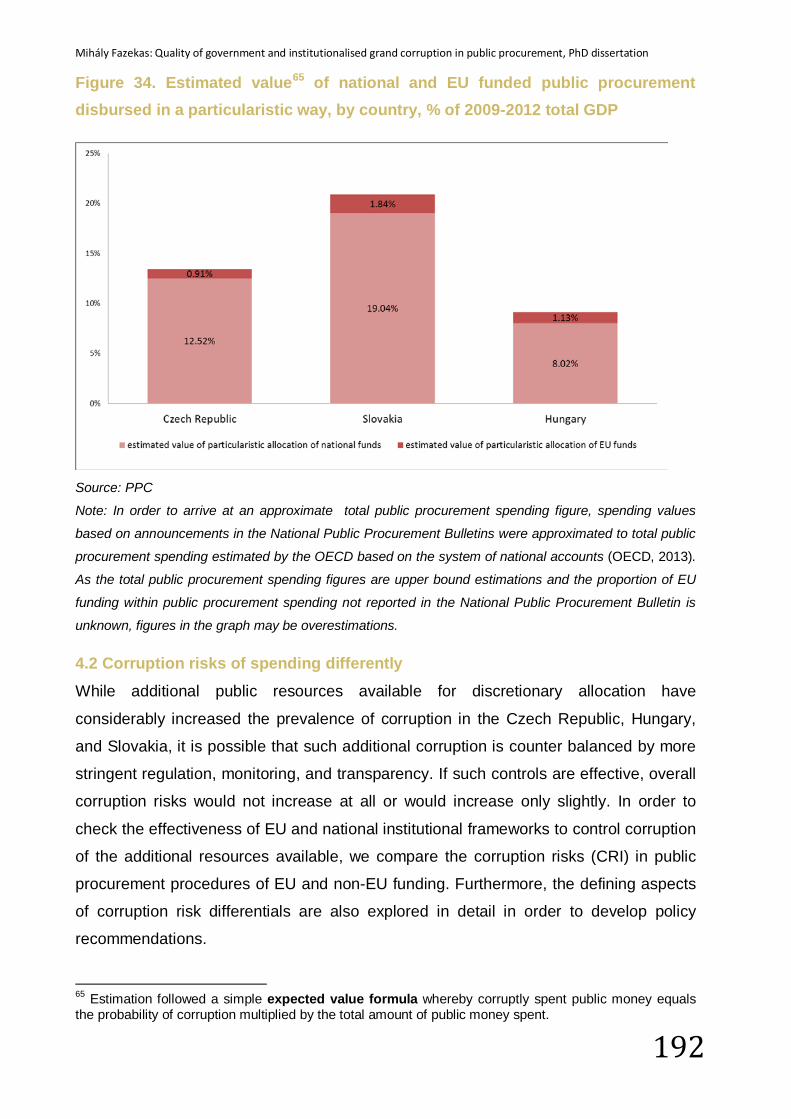
Mihály Fazekas: Quality of government and institutionalised grand corruption in public procurement, PhD dissertation
192
Figure 34. Estimated value65 of national and EU funded public procurement disbursed in a particularistic way, by country, % of 2009-2012 total GDP
Source: PPC
Note: In order to arrive at an approximate total public procurement spending figure, spending values
based on announcements in the National Public Procurement Bulletins were approximated to total public
procurement spending estimated by the OECD based on the system of national accounts (OECD, 2013).
As the total public procurement spending figures are upper bound estimations and the proportion of EU
funding within public procurement spending not reported in the National Public Procurement Bulletin is
unknown, figures in the graph may be overestimations.
4.2 Corruption risks of spending differently While additional public resources available for discretionary allocation have
considerably increased the prevalence of corruption in the Czech Republic, Hungary,
and Slovakia, it is possible that such additional corruption is counter balanced by more
stringent regulation, monitoring, and transparency. If such controls are effective, overall
corruption risks would not increase at all or would increase only slightly. In order to
check the effectiveness of EU and national institutional frameworks to control corruption
of the additional resources available, we compare the corruption risks (CRI) in public
procurement procedures of EU and non-EU funding. Furthermore, the defining aspects
of corruption risk differentials are also explored in detail in order to develop policy
recommendations.
65 Estimation followed a simple expected value formula whereby corruptly spent public money equals the probability of corruption multiplied by the total amount of public money spent.
Mihály Fazekas: Quality of government and institutionalised grand corruption in public procurement, PhD dissertation
193
4.2.1 Corruption risks in EU and non-EU funded procurement procedures In order to identify the causal impact of EU funding on corruption risks, EU and non-EU
funded procurement procedures are compared which are as similar in every major
respect as possible except for the funding source. As EU funding is not randomly
assigned to procurement procedures, we have to rely on state-of-the-art statistical
methods to select similar procedures, that is constructing the treatment (EU funding)
and control groups (no EU funding) (Imbens & Wooldridge, 2009). Therefore, first, we
show a baseline comparison of CRI between EU and non-EU funded procedures in the
three countries; second, we employ propensity score matching using stata (Leuven &
Sianesi, 2003).
EU and non-EU funded procurement procedures’ CRIs are compared within each
country. In Hungary, two alternative comparisons are made: one using a comparative
CRI (henceforth hu(comparative)), and another one using a CRI composed of a wider
indicator set indicators (henceforth hu(extended), for full description see chapter 5). The
reason for also including the extended CRI for Hungary is that it paints a richer picture
of the driving forces behind corruption risks of EU funding.
A simple comparison of average CRI scores within each country suggests that EU funded procurement carries higher corruption risks than nationally funded procurement in the Czech Republic and Hungary, while it carries lower corruption risks in Slovakia. However, these comparisons may very well be biased as EU and
non-EU funded projects could be fundamentally different. For example, if EU funded
projects are larger and more complex, then comparisons are inadequate.
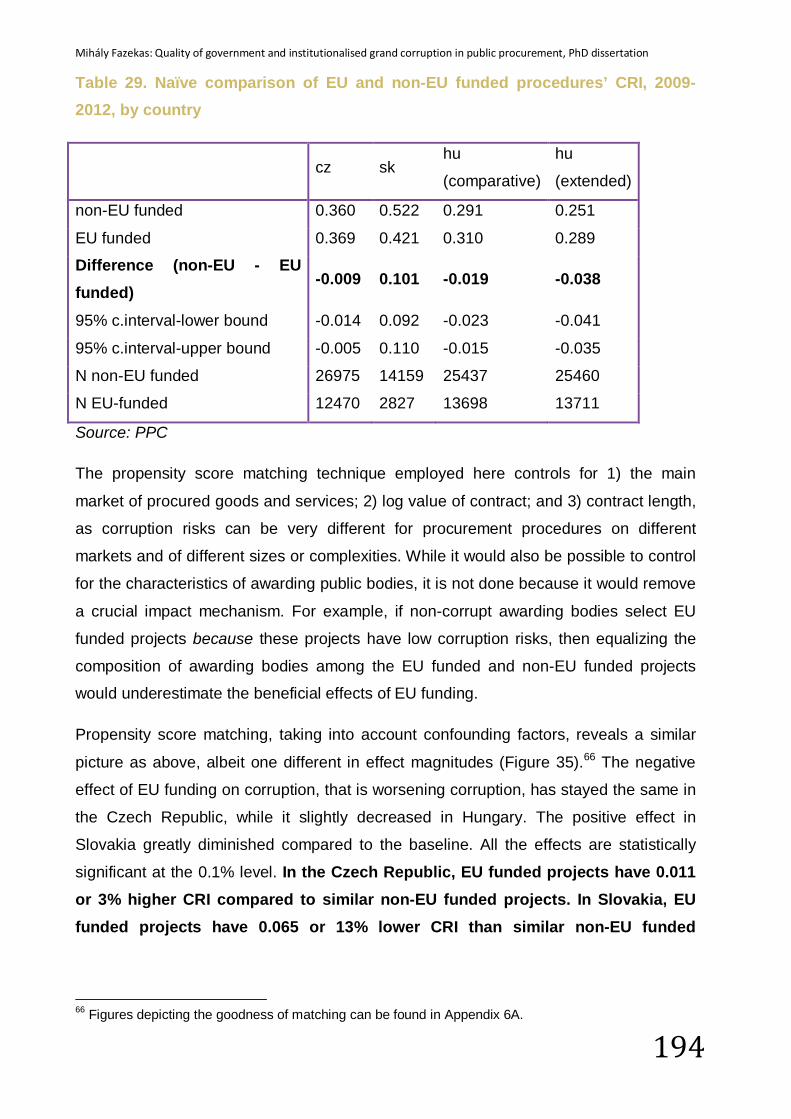
Mihály Fazekas: Quality of government and institutionalised grand corruption in public procurement, PhD dissertation
194
Table 29. Naïve comparison of EU and non-EU funded procedures’ CRI, 2009-2012, by country
cz sk
hu
(comparative)
hu
(extended)
non-EU funded 0.360 0.522 0.291 0.251
EU funded 0.369 0.421 0.310 0.289
Difference (non-EU - EU funded)
-0.009 0.101 -0.019 -0.038
95% c.interval-lower bound -0.014 0.092 -0.023 -0.041
95% c.interval-upper bound -0.005 0.110 -0.015 -0.035
N non-EU funded 26975 14159 25437 25460
N EU-funded 12470 2827 13698 13711
Source: PPC
The propensity score matching technique employed here controls for 1) the main
market of procured goods and services; 2) log value of contract; and 3) contract length,
as corruption risks can be very different for procurement procedures on different
markets and of different sizes or complexities. While it would also be possible to control
for the characteristics of awarding public bodies, it is not done because it would remove
a crucial impact mechanism. For example, if non-corrupt awarding bodies select EU
funded projects because these projects have low corruption risks, then equalizing the
composition of awarding bodies among the EU funded and non-EU funded projects
would underestimate the beneficial effects of EU funding.
Propensity score matching, taking into account confounding factors, reveals a similar
picture as above, albeit one different in effect magnitudes (Figure 35).66 The negative
effect of EU funding on corruption, that is worsening corruption, has stayed the same in
the Czech Republic, while it slightly decreased in Hungary. The positive effect in
Slovakia greatly diminished compared to the baseline. All the effects are statistically
significant at the 0.1% level. In the Czech Republic, EU funded projects have 0.011 or 3% higher CRI compared to similar non-EU funded projects. In Slovakia, EU funded projects have 0.065 or 13% lower CRI than similar non-EU funded
66 Figures depicting the goodness of matching can be found in Appendix 6A.
Mihály Fazekas: Quality of government and institutionalised grand corruption in public procurement, PhD dissertation
195
projects. In Hungary, EU funded projects have 0.01 or 3% higher CRI compared to similar non-EU funded projects using the comparable CRI definition.
The effect on Hungarian extended CRI is a great deal larger than for the comparative CRI: 0.022 or 8% higher CRI for EU funded projects than for comparable non-EU funded projects. This suggests that corruption risks may come
from harder to track factors such as complexity of eligibility criteria or factors associated
with the delivery phase such as contract modification (note that Hungary is unique
among the three countries in the mandatory publication of every contract modification
and contract fulfilment notice). As the differences in driving factors may reveal
additional findings, they are explored in the next section.
In order to get a sense of how big these differences are, we calculated the expected
value of changes once again. In the Czech Republic, the increase in the expected value of particularistic resource allocation due to higher corruption risks of EU funds amounts to 158 million EUR or 0.03% of the total 2009-2012 GDP. In Hungary, the same figure is only 52 million EUR or 0.02% of total 2009-2012 GDP. The difference in overall values between the Czech Republic and Hungary are due to
lower public procurement spending in Hungary and slightly smaller average effect. In Slovakia, the expected value of lower average corruption risks associated with EU funds translate into a 381 million EUR or 0.23% of total 2009-2012 GDP. While
this positive effect appears very large in comparison to the other two analysed
countries, it must be borne in mind that Slovakia seems to have a much higher overall
prevalence of institutionalised grand corruption. This improvement of 0.23% of GDP is
only a small correction in comparison to the 1.84% of GDP additional particularistic
resource allocation (see Figure 34). Taken together, the overall effect of EU funds
spending in Slovakia is still considerably higher than in the two other countries: 1.61%
(1.84% minus 0.23%) as opposed to 0.94% and 1.15% for Czech Republic and
Hungary, respectively.
Overall, effect sizes are dwarfed by the effect of additional amount of spending,
discussed in the previous section. This implies that the increasing corruption risks due to the greatly increased amount of public resources available for allocation could not be met with more stringent controls of corruption preventing a worsening corruption situation. In spite of being designed for controlling fraud and
misuse, the EU’s monitoring system have failed to moderate increasing corruption risks
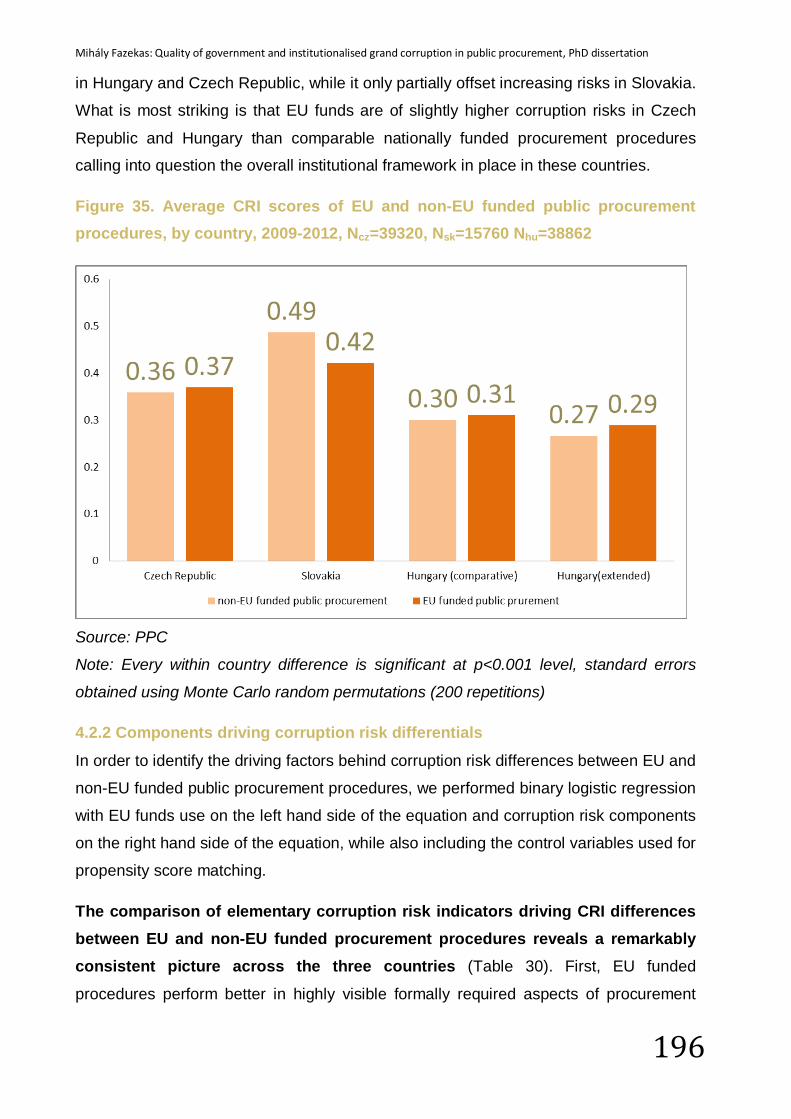
Mihály Fazekas: Quality of government and institutionalised grand corruption in public procurement, PhD dissertation
196
in Hungary and Czech Republic, while it only partially offset increasing risks in Slovakia.
What is most striking is that EU funds are of slightly higher corruption risks in Czech
Republic and Hungary than comparable nationally funded procurement procedures
calling into question the overall institutional framework in place in these countries.
Figure 35. Average CRI scores of EU and non-EU funded public procurement procedures, by country, 2009-2012, Ncz=39320, Nsk=15760 Nhu=38862
Source: PPC
Note: Every within country difference is significant at p<0.001 level, standard errors
obtained using Monte Carlo random permutations (200 repetitions)
4.2.2 Components driving corruption risk differentials
In order to identify the driving factors behind corruption risk differences between EU and
non-EU funded public procurement procedures, we performed binary logistic regression
with EU funds use on the left hand side of the equation and corruption risk components
on the right hand side of the equation, while also including the control variables used for
propensity score matching.
The comparison of elementary corruption risk indicators driving CRI differences between EU and non-EU funded procurement procedures reveals a remarkably consistent picture across the three countries (Table 30). First, EU funded
procedures perform better in highly visible formally required aspects of procurement
Mihály Fazekas: Quality of government and institutionalised grand corruption in public procurement, PhD dissertation
197
such as publishing the call for tenders, using open procedure type, or allowing sufficient
time for bidders to bid. For example, procurement tenders are 3%-12% more likely to be
funded by the EU rather than nationally if they have a published call for tenders, clearly
indicating that transparency requirements are implemented in all three countries.
Second, less strictly regulated aspects such as period of time for making an award
decision, call for tender modification, or complexity of assessment criteria represent
consistently higher corruption risks for EU funded projects. Although, effects are multi-
directional in most of the cases. For example, Czech procurement tenders are 9% more
likely to be funded by the EU than nationally if the call for tenders was modified or
Slovakian procurement tenders 17% more likely to be EU funded with lengthy decision
periods (between 227 and 322 days).
Third, the key dimension according to which EU funded projects are underperforming is corruption risks associated with lack of competition: single
bidder contract award and winners’ contract share. The extensive efforts to make EU
funded projects high value for money through competition seem to be insufficient.
Procurement procedures are 3%-4% more likely to be EU funded if they have a single
bidder and their markets are much more concentrated too: Procurement procedures are
12%-28% more likely to be funded by the EU if their winner market share is high (i.e.
every prior contract is won by the same winner compared to no prior contract won by
the winner).
Taking into account the broader set of elementary corruption risk indicators in Hungary alters the picture considerably (Table 31). First, the detrimental corruption
risk effect of weak competition remains very strong. Second, the effects of procedure
type, submission period length, and decision period length have become insignificant or
only weakly negative. Third and most importantly, some less visible procurement
corruption risk characteristics take on a crucial role in increasing EU funds corruption
risks: weight of non-price evaluation criteria, length of eligibility criteria, and contract
modification during delivery.
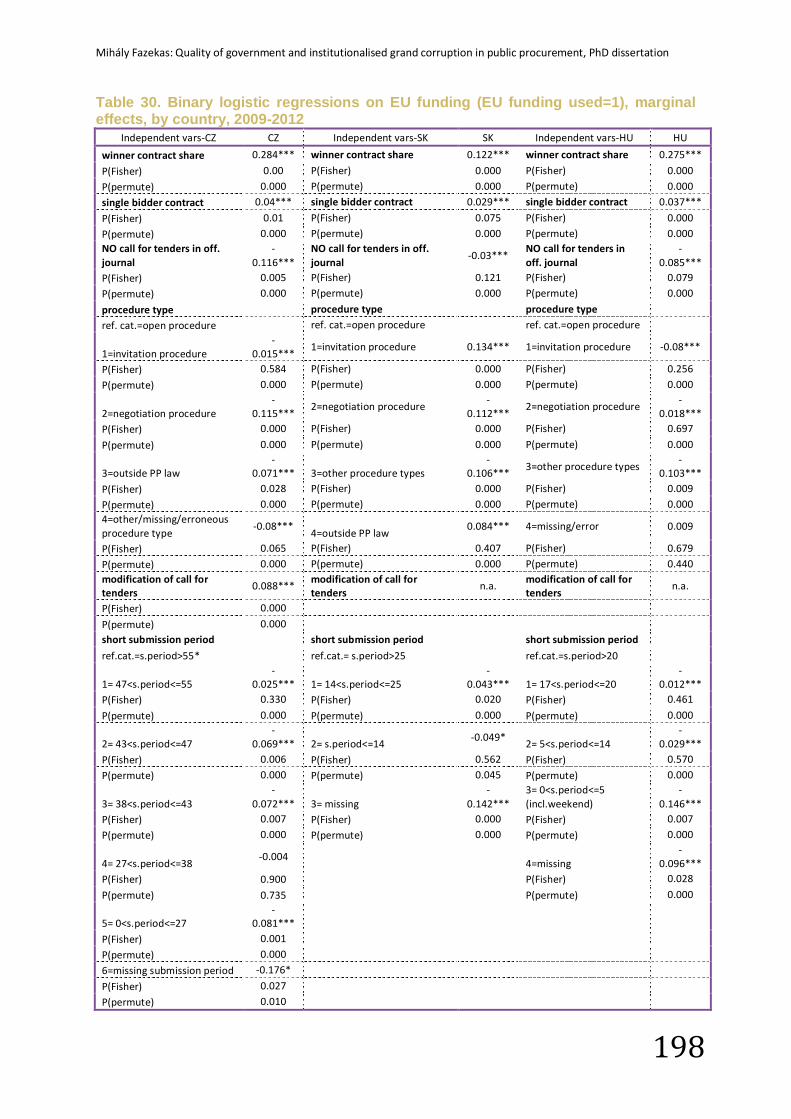
Mihály Fazekas: Quality of government and institutionalised grand corruption in public procurement, PhD dissertation
198
Table 30. Binary logistic regressions on EU funding (EU funding used=1), marginal effects, by country, 2009-2012
Independent vars-CZ CZ Independent vars-SK SK Independent vars-HU HU
winner contract share 0.284*** winner contract share 0.122*** winner contract share 0.275***
P(Fisher) 0.00 P(Fisher) 0.000 P(Fisher) 0.000
P(permute) 0.000 P(permute) 0.000 P(permute) 0.000
single bidder contract 0.04*** single bidder contract 0.029*** single bidder contract 0.037***
P(Fisher) 0.01 P(Fisher) 0.075 P(Fisher) 0.000
P(permute) 0.000 P(permute) 0.000 P(permute) 0.000 NO call for tenders in off. journal
-0.116***
NO call for tenders in off. journal
-0.03*** NO call for tenders in off. journal
-0.085***
P(Fisher) 0.005 P(Fisher) 0.121 P(Fisher) 0.079
P(permute) 0.000 P(permute) 0.000 P(permute) 0.000
procedure type procedure type
procedure type
ref. cat.=open procedure
ref. cat.=open procedure
ref. cat.=open procedure
1=invitation procedure -
0.015*** 1=invitation procedure 0.134*** 1=invitation procedure -0.08***
P(Fisher) 0.584 P(Fisher) 0.000 P(Fisher) 0.256
P(permute) 0.000 P(permute) 0.000 P(permute) 0.000
2=negotiation procedure -
0.115*** 2=negotiation procedure
-0.112***
2=negotiation procedure -
0.018*** P(Fisher) 0.000 P(Fisher) 0.000 P(Fisher) 0.697
P(permute) 0.000 P(permute) 0.000 P(permute) 0.000
3=outside PP law -
0.071*** 3=other procedure types -
0.106*** 3=other procedure types
-0.103***
P(Fisher) 0.028 P(Fisher) 0.000 P(Fisher) 0.009
P(permute) 0.000 P(permute) 0.000 P(permute) 0.000 4=other/missing/erroneous procedure type
-0.08*** 4=outside PP law
0.084*** 4=missing/error 0.009
P(Fisher) 0.065 P(Fisher) 0.407 P(Fisher) 0.679
P(permute) 0.000 P(permute) 0.000 P(permute) 0.440 modification of call for tenders
0.088*** modification of call for tenders
n.a. modification of call for tenders
n.a.
P(Fisher) 0.000
P(permute) 0.000
short submission period
short submission period
short submission period
ref.cat.=s.period>55* ref.cat.= s.period>25 ref.cat.=s.period>20
1= 47<s.period<=55 -
0.025*** 1= 14<s.period<=25 -
0.043*** 1= 17<s.period<=20 -
0.012*** P(Fisher) 0.330 P(Fisher) 0.020 P(Fisher) 0.461
P(permute) 0.000 P(permute) 0.000 P(permute) 0.000
2= 43<s.period<=47 -
0.069*** 2= s.period<=14 -0.049*
2= 5<s.period<=14 -
0.029*** P(Fisher) 0.006 P(Fisher) 0.562 P(Fisher) 0.570
P(permute) 0.000 P(permute) 0.045 P(permute) 0.000
3= 38<s.period<=43 -
0.072*** 3= missing -
0.142*** 3= 0<s.period<=5 (incl.weekend)
-0.146***
P(Fisher) 0.007 P(Fisher) 0.000 P(Fisher) 0.007
P(permute) 0.000 P(permute) 0.000 P(permute) 0.000
4= 27<s.period<=38 -0.004
4=missing
-0.096***
P(Fisher) 0.900
P(Fisher) 0.028
P(permute) 0.735
P(permute) 0.000
5= 0<s.period<=27 -
0.081***
P(Fisher) 0.001
P(permute) 0.000
6=missing submission period -0.176*
P(Fisher) 0.027
P(permute) 0.010
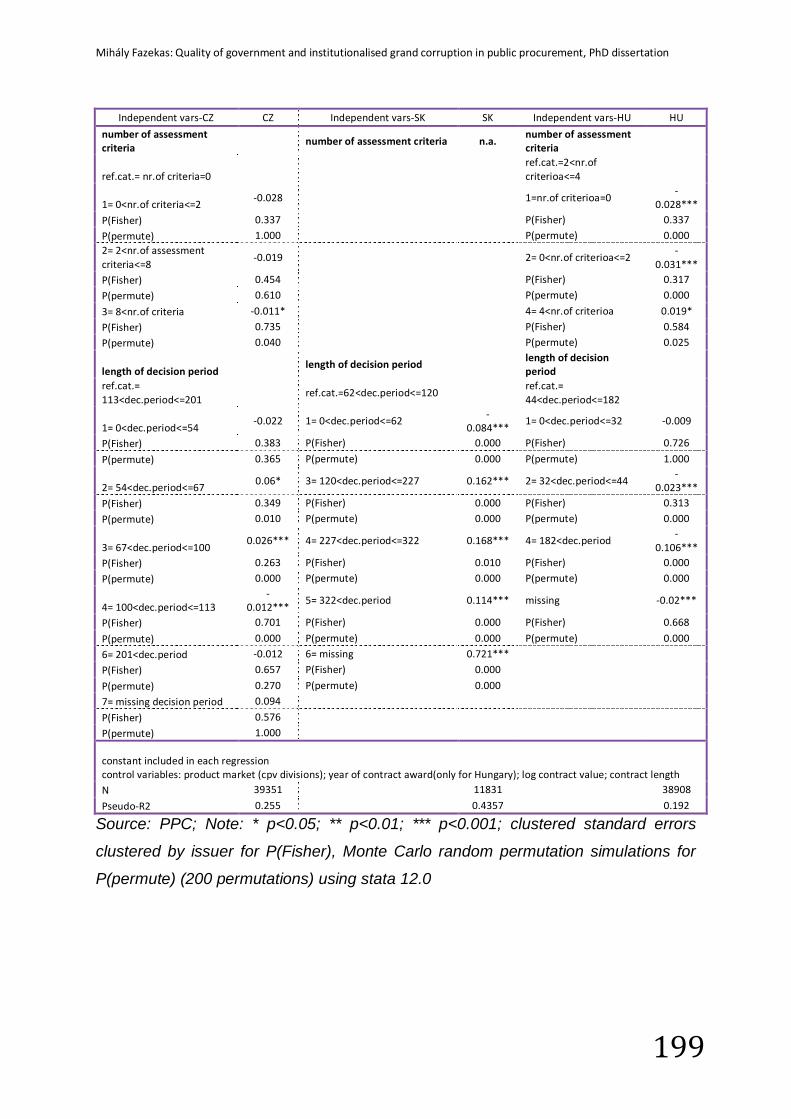
Mihály Fazekas: Quality of government and institutionalised grand corruption in public procurement, PhD dissertation
199
Independent vars-CZ CZ Independent vars-SK SK Independent vars-HU HU
number of assessment criteria
number of assessment criteria n.a. number of assessment criteria
ref.cat.= nr.of criteria=0 ref.cat.=2<nr.of criterioa<=4
1= 0<nr.of criteria<=2 -0.028
1=nr.of criterioa=0
-0.028***
P(Fisher) 0.337
P(Fisher) 0.337
P(permute) 1.000
P(permute) 0.000 2= 2<nr.of assessment criteria<=8
-0.019
2= 0<nr.of criterioa<=2 -
0.031*** P(Fisher) 0.454
P(Fisher) 0.317
P(permute) 0.610
P(permute) 0.000
3= 8<nr.of criteria -0.011*
4= 4<nr.of criterioa 0.019*
P(Fisher) 0.735
P(Fisher) 0.584
P(permute) 0.040
P(permute) 0.025
length of decision period length of decision period
length of decision period
ref.cat.= 113<dec.period<=201
ref.cat.=62<dec.period<=120
ref.cat.= 44<dec.period<=182
1= 0<dec.period<=54 -0.022 1= 0<dec.period<=62
-0.084***
1= 0<dec.period<=32 -0.009
P(Fisher) 0.383 P(Fisher) 0.000 P(Fisher) 0.726
P(permute) 0.365 P(permute) 0.000 P(permute) 1.000
2= 54<dec.period<=67 0.06* 3= 120<dec.period<=227 0.162*** 2= 32<dec.period<=44
-0.023***
P(Fisher) 0.349 P(Fisher) 0.000 P(Fisher) 0.313
P(permute) 0.010 P(permute) 0.000 P(permute) 0.000
3= 67<dec.period<=100 0.026*** 4= 227<dec.period<=322 0.168*** 4= 182<dec.period
-0.106***
P(Fisher) 0.263 P(Fisher) 0.010 P(Fisher) 0.000
P(permute) 0.000 P(permute) 0.000 P(permute) 0.000
4= 100<dec.period<=113 -
0.012*** 5= 322<dec.period 0.114*** missing -0.02***
P(Fisher) 0.701 P(Fisher) 0.000 P(Fisher) 0.668
P(permute) 0.000 P(permute) 0.000 P(permute) 0.000
6= 201<dec.period -0.012 6= missing 0.721***
P(Fisher) 0.657 P(Fisher) 0.000
P(permute) 0.270 P(permute) 0.000
7= missing decision period 0.094
P(Fisher) 0.576
P(permute) 1.000
constant included in each regression control variables: product market (cpv divisions); year of contract award(only for Hungary); log contract value; contract length N 39351 11831 38908
Pseudo-R2 0.255 0.4357 0.192
Source: PPC; Note: * p<0.05; ** p<0.01; *** p<0.001; clustered standard errors
clustered by issuer for P(Fisher), Monte Carlo random permutation simulations for
P(permute) (200 permutations) using stata 12.0
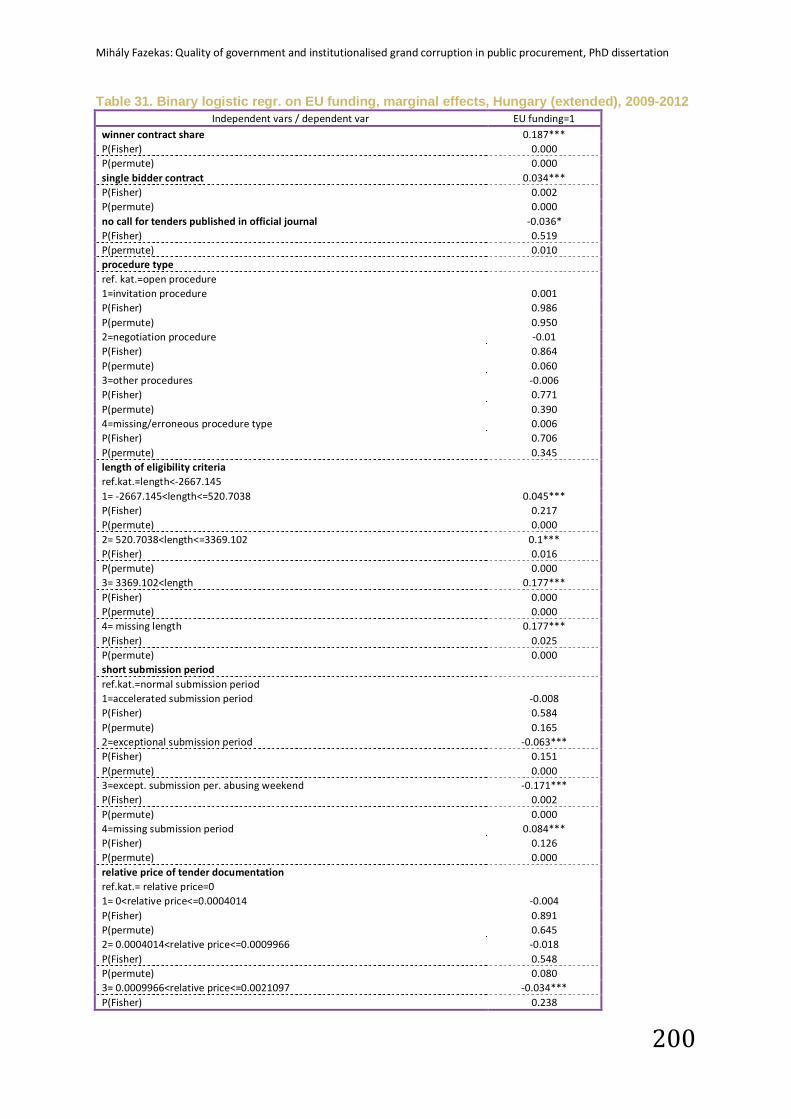
Mihály Fazekas: Quality of government and institutionalised grand corruption in public procurement, PhD dissertation
200
Table 31. Binary logistic regr. on EU funding, marginal effects, Hungary (extended), 2009-2012 Independent vars / dependent var EU funding=1
winner contract share 0.187*** P(Fisher) 0.000 P(permute) 0.000 single bidder contract 0.034*** P(Fisher) 0.002 P(permute) 0.000 no call for tenders published in official journal -0.036* P(Fisher) 0.519 P(permute) 0.010 procedure type
ref. kat.=open procedure
1=invitation procedure 0.001 P(Fisher) 0.986 P(permute) 0.950 2=negotiation procedure -0.01 P(Fisher) 0.864 P(permute) 0.060 3=other procedures -0.006 P(Fisher) 0.771 P(permute) 0.390 4=missing/erroneous procedure type 0.006 P(Fisher) 0.706 P(permute) 0.345 length of eligibility criteria
ref.kat.=length<-2667.145
1= -2667.145<length<=520.7038 0.045*** P(Fisher) 0.217 P(permute) 0.000 2= 520.7038<length<=3369.102 0.1*** P(Fisher) 0.016 P(permute) 0.000 3= 3369.102<length 0.177*** P(Fisher) 0.000 P(permute) 0.000 4= missing length 0.177*** P(Fisher) 0.025 P(permute) 0.000 short submission period
ref.kat.=normal submission period
1=accelerated submission period -0.008 P(Fisher) 0.584 P(permute) 0.165 2=exceptional submission period -0.063*** P(Fisher) 0.151 P(permute) 0.000 3=except. submission per. abusing weekend -0.171*** P(Fisher) 0.002 P(permute) 0.000 4=missing submission period 0.084*** P(Fisher) 0.126 P(permute) 0.000 relative price of tender documentation
ref.kat.= relative price=0
1= 0<relative price<=0.0004014 -0.004 P(Fisher) 0.891 P(permute) 0.645 2= 0.0004014<relative price<=0.0009966 -0.018 P(Fisher) 0.548 P(permute) 0.080 3= 0.0009966<relative price<=0.0021097 -0.034*** P(Fisher) 0.238
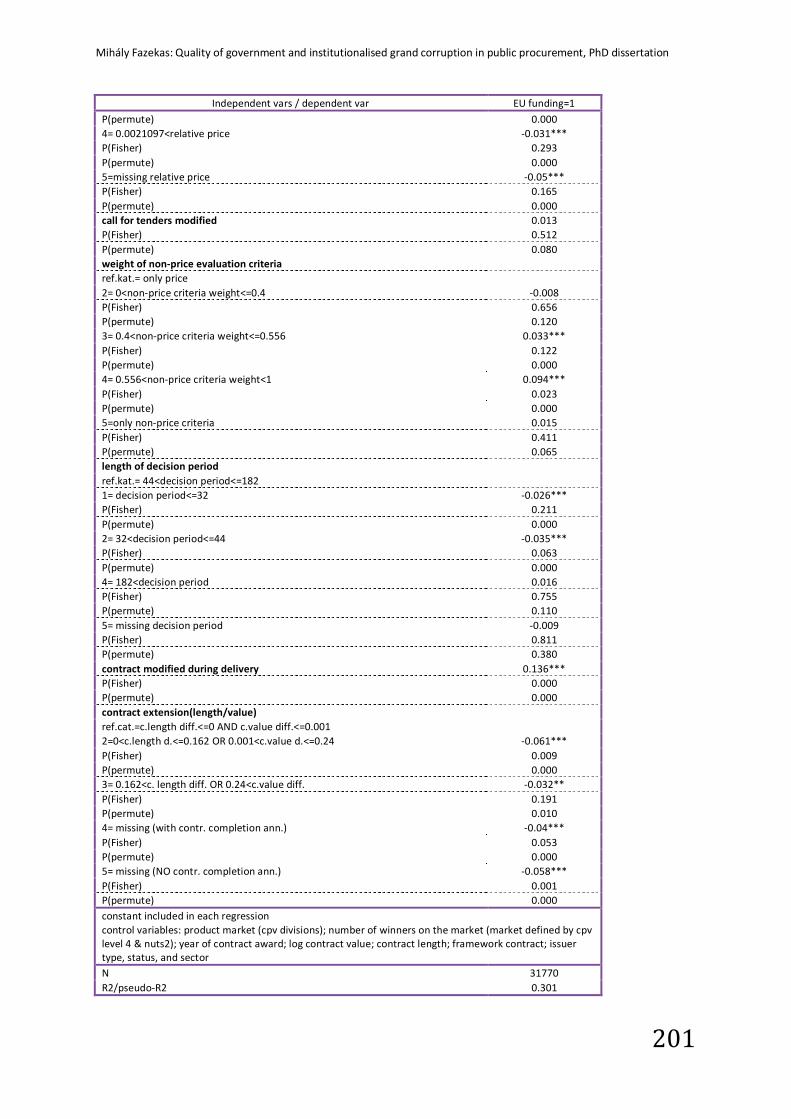
Mihály Fazekas: Quality of government and institutionalised grand corruption in public procurement, PhD dissertation
201
Independent vars / dependent var EU funding=1 P(permute) 0.000 4= 0.0021097<relative price -0.031*** P(Fisher) 0.293 P(permute) 0.000 5=missing relative price -0.05*** P(Fisher) 0.165 P(permute) 0.000 call for tenders modified 0.013 P(Fisher) 0.512 P(permute) 0.080 weight of non-price evaluation criteria
ref.kat.= only price
2= 0<non-price criteria weight<=0.4 -0.008 P(Fisher) 0.656 P(permute) 0.120 3= 0.4<non-price criteria weight<=0.556 0.033*** P(Fisher) 0.122 P(permute) 0.000 4= 0.556<non-price criteria weight<1 0.094*** P(Fisher) 0.023 P(permute) 0.000 5=only non-price criteria 0.015 P(Fisher) 0.411 P(permute) 0.065 length of decision period
ref.kat.= 44<decision period<=182
1= decision period<=32 -0.026*** P(Fisher) 0.211 P(permute) 0.000 2= 32<decision period<=44 -0.035*** P(Fisher) 0.063 P(permute) 0.000 4= 182<decision period 0.016 P(Fisher) 0.755 P(permute) 0.110 5= missing decision period -0.009 P(Fisher) 0.811 P(permute) 0.380 contract modified during delivery 0.136*** P(Fisher) 0.000 P(permute) 0.000 contract extension(length/value)
ref.cat.=c.length diff.<=0 AND c.value diff.<=0.001
2=0<c.length d.<=0.162 OR 0.001<c.value d.<=0.24 -0.061*** P(Fisher) 0.009 P(permute) 0.000 3= 0.162<c. length diff. OR 0.24<c.value diff. -0.032** P(Fisher) 0.191 P(permute) 0.010 4= missing (with contr. completion ann.) -0.04*** P(Fisher) 0.053 P(permute) 0.000 5= missing (NO contr. completion ann.) -0.058*** P(Fisher) 0.001 P(permute) 0.000 constant included in each regression control variables: product market (cpv divisions); number of winners on the market (market defined by cpv level 4 & nuts2); year of contract award; log contract value; contract length; framework contract; issuer type, status, and sector N 31770 R2/pseudo-R2 0.301
Mihály Fazekas: Quality of government and institutionalised grand corruption in public procurement, PhD dissertation
202
5. Conclusions and policy consequences While much additional work is needed, this paper has already demonstrated that it is
feasible and fruitful to use detailed, contract-level data for tracking corruption risks
over time across EU countries. Such monitoring can be done in real-time if the
necessary investment into database development is made. Chapter 5 discusses data
availability in Europe and beyond in detail.
Our preliminary findings indicate that EU funding considerably increase corruption risks in Central and Eastern Europe in at least two principal ways
(Figure 36). First, by making a large amount of additional public resources available
for rent extraction in public procurement; second, by failing to implement sufficient
controls of corruption counter-balancing additional resources for corruption. In spite
of extensive monitoring efforts of EU authorities, EU funded procurement spending
represents even higher corruption risks than the comparable national spending in
Czech Republic and Hungary. EU funded public procurement in Slovakia carries only
slightly lower corruption risks than comparable national procurement spending, albeit
national spending is generally of much higher corruption risk than in the two other
countries. In either case, this positive effect falls long way short of offsetting the
negative effect of increased discretionary spending available. Nevertheless, the
comparatively better performance of Slovakian public procurement projects funded
by the EU suggests that EU funding can have a somewhat positive effect in a very
high corruption risk environment. Based on this finding further research could look at
the conditional effect of EU funding on corruption.
For the three countries combined, our results imply an estimated additional particularistic resource allocation worth up to 1.20% of combined GDP of the three countries throughout 2009-2012. This is the result of an estimated maximum
1.23% of GDP in terms of additional funding disbursed in a particularistic way, and
an estimated maximum 0.03% of GDP in terms of lower corruption risk of EU funded
procurement than national procurement. These figures are exceptionally high, for
example compared to total EU funds allocation to these countries which is about
3.3% of their GDP.
While EU funded public procurement may well be effective in lifting growth rates in
Central and Eastern Europe, its desired benefits stand in contrast with corruption
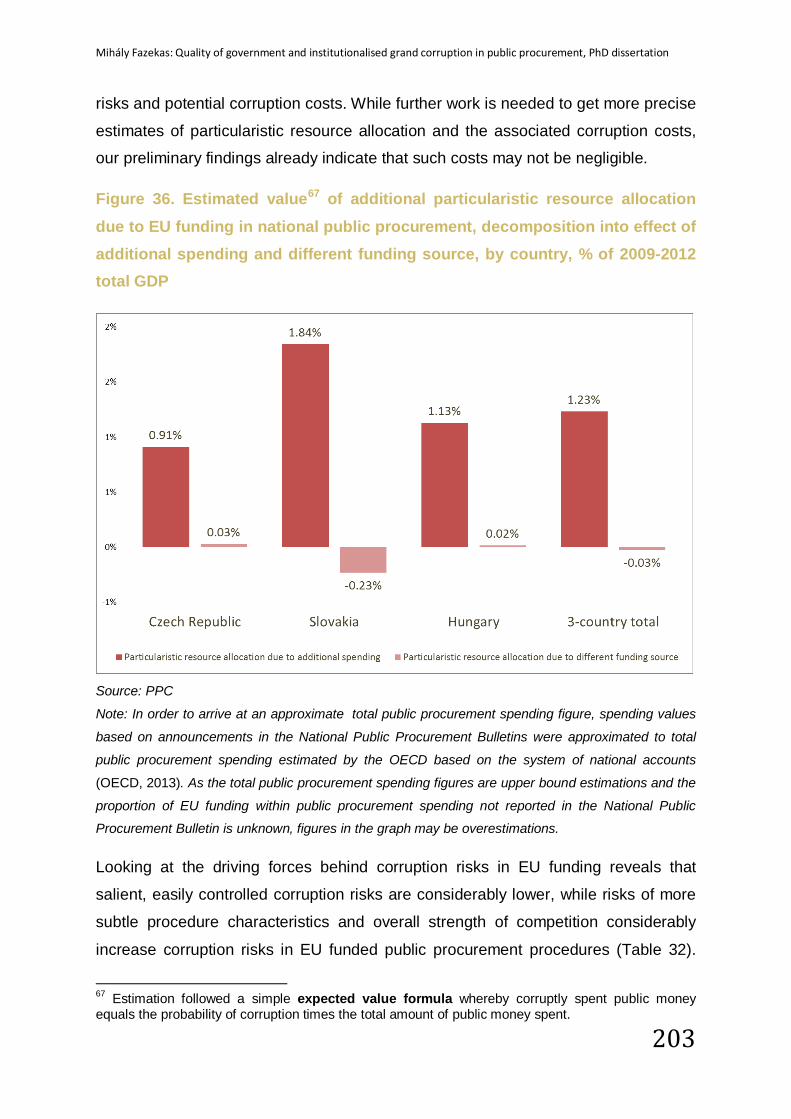
Mihály Fazekas: Quality of government and institutionalised grand corruption in public procurement, PhD dissertation
203
risks and potential corruption costs. While further work is needed to get more precise
estimates of particularistic resource allocation and the associated corruption costs,
our preliminary findings already indicate that such costs may not be negligible.
Figure 36. Estimated value67 of additional particularistic resource allocation due to EU funding in national public procurement, decomposition into effect of additional spending and different funding source, by country, % of 2009-2012 total GDP
Source: PPC
Note: In order to arrive at an approximate total public procurement spending figure, spending values
based on announcements in the National Public Procurement Bulletins were approximated to total
public procurement spending estimated by the OECD based on the system of national accounts
(OECD, 2013). As the total public procurement spending figures are upper bound estimations and the
proportion of EU funding within public procurement spending not reported in the National Public
Procurement Bulletin is unknown, figures in the graph may be overestimations.
Looking at the driving forces behind corruption risks in EU funding reveals that
salient, easily controlled corruption risks are considerably lower, while risks of more
subtle procedure characteristics and overall strength of competition considerably
increase corruption risks in EU funded public procurement procedures (Table 32).
67 Estimation followed a simple expected value formula whereby corruptly spent public money equals the probability of corruption times the total amount of public money spent.
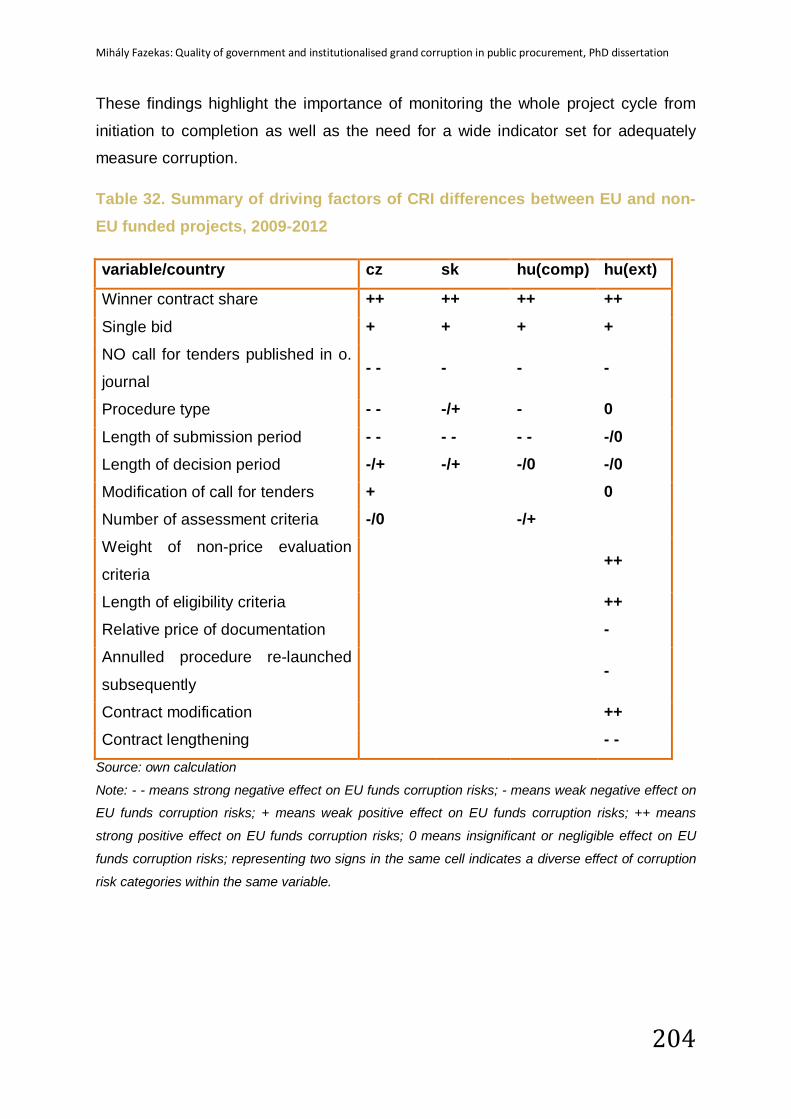
Mihály Fazekas: Quality of government and institutionalised grand corruption in public procurement, PhD dissertation
204
These findings highlight the importance of monitoring the whole project cycle from
initiation to completion as well as the need for a wide indicator set for adequately
measure corruption.
Table 32. Summary of driving factors of CRI differences between EU and non-EU funded projects, 2009-2012
variable/country cz sk hu(comp) hu(ext)
Winner contract share ++ ++ ++ ++
Single bid + + + + NO call for tenders published in o.
journal - - - - -
Procedure type - - -/+ - 0
Length of submission period - - - - - - -/0 Length of decision period -/+ -/+ -/0 -/0 Modification of call for tenders +
0
Number of assessment criteria -/0
-/+
Weight of non-price evaluation
criteria ++
Length of eligibility criteria
++ Relative price of documentation
-
Annulled procedure re-launched
subsequently -
Contract modification
++ Contract lengthening
- -
Source: own calculation
Note: - - means strong negative effect on EU funds corruption risks; - means weak negative effect on
EU funds corruption risks; + means weak positive effect on EU funds corruption risks; ++ means
strong positive effect on EU funds corruption risks; 0 means insignificant or negligible effect on EU
funds corruption risks; representing two signs in the same cell indicates a diverse effect of corruption
risk categories within the same variable.
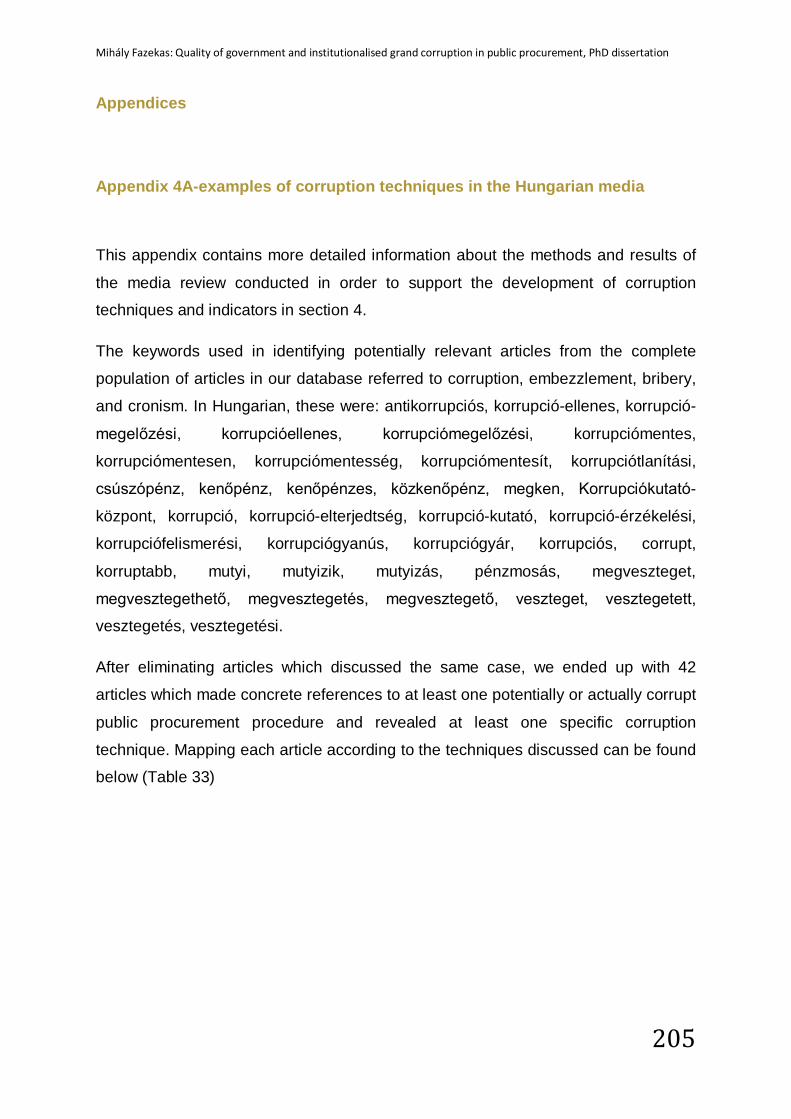
Mihály Fazekas: Quality of government and institutionalised grand corruption in public procurement, PhD dissertation
205
Appendices
Appendix 4A-examples of corruption techniques in the Hungarian media
This appendix contains more detailed information about the methods and results of
the media review conducted in order to support the development of corruption
techniques and indicators in section 4.
The keywords used in identifying potentially relevant articles from the complete
population of articles in our database referred to corruption, embezzlement, bribery,
and cronism. In Hungarian, these were: antikorrupciós, korrupció-ellenes, korrupció-
megelőzési, korrupcióellenes, korrupciómegelőzési, korrupciómentes,
korrupciómentesen, korrupciómentesség, korrupciómentesít, korrupciótlanítási,
csúszópénz, kenőpénz, kenőpénzes, közkenőpénz, megken, Korrupciókutató-
központ, korrupció, korrupció-elterjedtség, korrupció-kutató, korrupció-érzékelési,
korrupciófelismerési, korrupciógyanús, korrupciógyár, korrupciós, corrupt,
korruptabb, mutyi, mutyizik, mutyizás, pénzmosás, megveszteget,
megvesztegethető, megvesztegetés, megvesztegető, veszteget, vesztegetett,
vesztegetés, vesztegetési.
After eliminating articles which discussed the same case, we ended up with 42
articles which made concrete references to at least one potentially or actually corrupt
public procurement procedure and revealed at least one specific corruption
technique. Mapping each article according to the techniques discussed can be found
below (Table 33)
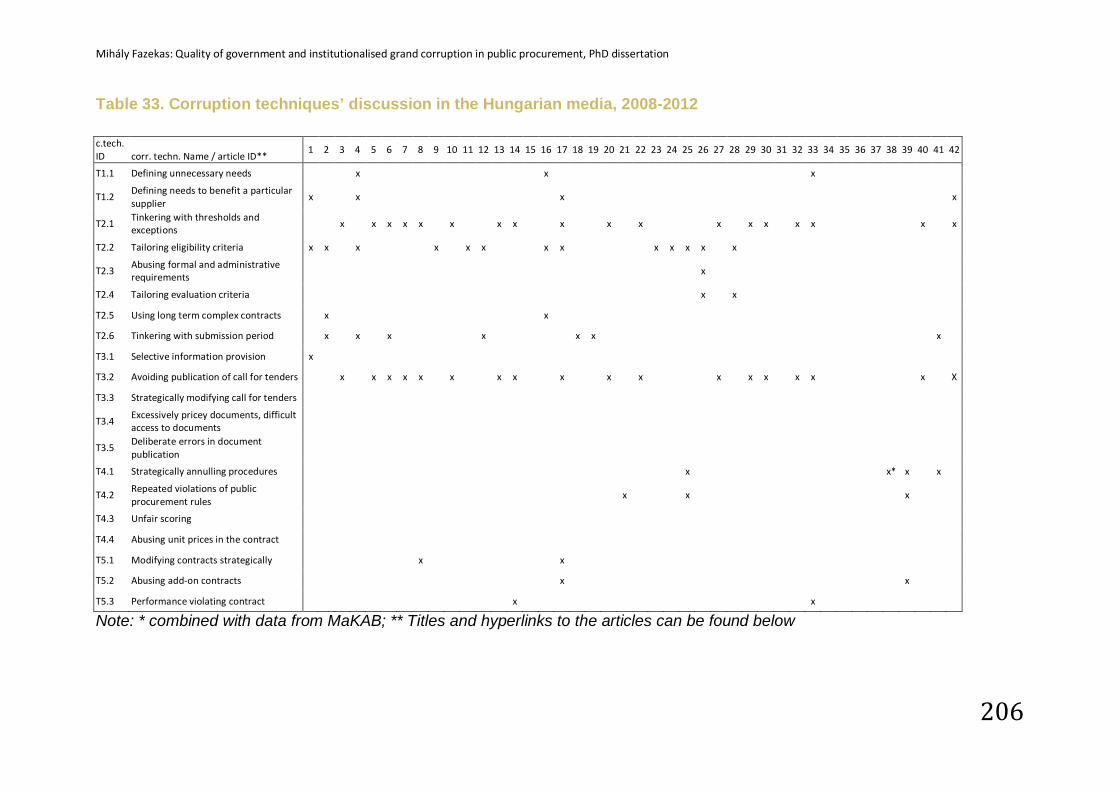
Mihály Fazekas: Quality of government and institutionalised grand corruption in public procurement, PhD dissertation
206
Table 33. Corruption techniques’ discussion in the Hungarian media, 2008-2012
c.tech. ID corr. techn. Name / article ID**
1 2 3 4 5 6 7 8 9 10 11 12 13 14 15 16 17 18 19 20 21 22 23 24 25 26 27 28 29 30 31 32 33 34 35 36 37 38 39 40 41 42
T1.1 Defining unnecessary needs
x
x
x
T1.2 Defining needs to benefit a particular supplier
x
x
x
x
T2.1 Tinkering with thresholds and exceptions
x
x x x x
x
x x
x
x
x
x
x x
x x
x
x
T2.2 Tailoring eligibility criteria x x
x
x
x x
x x
x x x x
x
T2.3 Abusing formal and administrative requirements
x
T2.4 Tailoring evaluation criteria
x
x
T2.5 Using long term complex contracts
x
x
T2.6 Tinkering with submission period
x
x
x
x
x x
x
T3.1 Selective information provision x
T3.2 Avoiding publication of call for tenders
x
x x x x
x
x x
x
x
x
x
x x
x x
x
X
T3.3 Strategically modifying call for tenders
T3.4 Excessively pricey documents, difficult access to documents
T3.5 Deliberate errors in document publication
T4.1 Strategically annulling procedures
x
x* x
x
T4.2 Repeated violations of public procurement rules
x
x
x
T4.3 Unfair scoring
T4.4 Abusing unit prices in the contract
T5.1 Modifying contracts strategically
x
x
T5.2 Abusing add-on contracts
x
x
T5.3 Performance violating contract
x
x
Note: * combined with data from MaKAB; ** Titles and hyperlinks to the articles can be found below
Mihály Fazekas: Quality of government and institutionalised grand corruption in public procurement, PhD dissertation
207
Table 34. IDs, titles, and hyperlinks of articles discussing corruption techniques in the Hungarian media, 2008-2012 (linked to Table 33), continued overleaf
ID title source
1 Most 100 ezer forintos bicikliket venne a Posta http://index.hu/gazdasag/magyar/pst090122/
2 Háziversenyen dőlt el a papírtender http://index.hu/belfold/2009/11/05/haziversenyen_dolt_el_a_papirtender/
3 Fidesz: Panírban számolták a kenőpénzt http://index.hu/belfold/2010/03/31/fidesz_panirban_szamoltak_a_kenopenzt/
4 Ejtették a kellemetlenné vált ötmilliárdos légifotóbizniszt http://index.hu/belfold/2010/10/28/otmilliardot_sporolt_az_index_az_orszagnak/
5 Az NBH-nak is kínos az eredetiségvizsgálós cég bűnügye http://www.origo.hu/itthon/20100311-mentesseg-a-kozbeszerzes-alol-nemzetbiztonsagi-okok-miatt.html
6 Hat nap alatt költött 770 milliót a Daimler-botrányban felbukkanó Volánbusz http://www.origo.hu/itthon/20100324-daimlerugy-hallgat-a-mercedes-a-magyarorszagi-korrupcios-vadakrol.html
7 Trükkös HM-es ingatlanüzemeltetés http://www.mno.hu/portal/781468
8 A pártfinanszírozás debreceni modellje http://www.nol.hu/belfold/20110430-a_debreceni_modell
9 Gyanús elemek a csuklósbusz- tenderben? Demszkynek korai az idő http://mno.hu/portal/541455
10 Milliárdok a Kossuth téri mélygarázsra http://mno.hu/portal/585854
11 Volt HM-es dandártábornokot vádolnak vesztegetéssel http://hvg.hu/itthon/20110927_katona_karoly_dandartabornok#rss
12 Jól van, Zsoltikám: egy Nokiás-doboz hányattatásai http://m.index.hu/belfold/budapest/2011/10/08/egy_nokias-doboz_hanyattatasai/
13 Verseny nélküli megbízás a Közbeszerzések Tanácsánál http://www.vg.hu/kozelet/jog/verseny-nelkuli-megbizas-a-kozbeszerzesek-tanacsanal-363931
14 A Lakos család esete a budapesti beruházásokkal http://hetivalasz.hu/reflektor/szennyes-25374/
15 Úton állók http://hetivalasz.hu/itthon/uton-allok-18664/
16 Rendőrvicc http://hetivalasz.hu/itthon/rendorvicc-23619/
17 Korrupciós kiskáté kezdo vállalkozóknak http://index.hu/belfold/2011/12/09/korrupcios_kiskate_kezdo_vallalkozoknak/
18 Feljelentés gyanúsan gyors közbeszerzés miatt http://index.hu/belfold/2012/08/21/gyanusan_gyors_kozbeszerzes_miatt_tesz_feljelentest_az_lmp/
19 Villámtendert írt ki autóvásárlásra a rendőrség http://index.hu/belfold/2012/08/24/villamtendert_irt_ki_autovasarlasra_a_rendorseg/
20 A verseny csak látszat? - sorra nyeri a tendereket a volt Fidesz-pártigazgató cége
https://www.napi.hu/magyar_vallalatok/a_verseny_csak_latszat_sorra_nyeri_a_tendereket_a_volt_fidesz-partigazgato_cege.530349.html
21 Kétmilliós bírság az OMSZ-nek az esetkocsik beszerzése miatt http://index.hu/belfold/2012/06/06/ketmillios_birsag_az_omsz-nek_az_esetkocsik_beszerzese_miatt/
22 Titkosították a Ludovika Campus beruházását is http://index.hu/belfold/2012/08/08/titkositottak_a_ludovika_campus_beruhazasat_is/
23 Budapest Szíve európai uniós bírságot kaphat http://index.hu/belfold/budapest/2012/03/06/tarlost_es_rogant_egyutt_szivatja_az_eu/
24 Egy kicsit könnyebb lesz lopni a MÁV-nál-Cégekre szabott beszerzések http://index.hu/gazdasag/magyar/2012/09/10/mav/
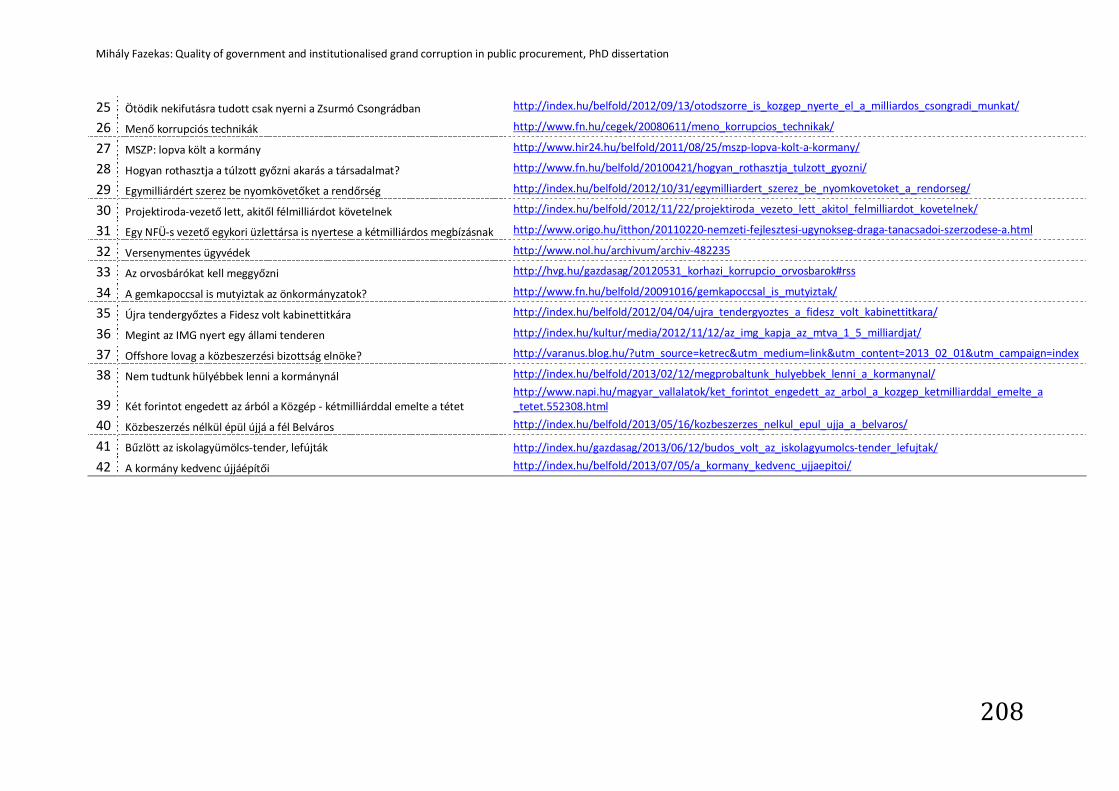
Mihály Fazekas: Quality of government and institutionalised grand corruption in public procurement, PhD dissertation
208
25 Ötödik nekifutásra tudott csak nyerni a Zsurmó Csongrádban http://index.hu/belfold/2012/09/13/otodszorre_is_kozgep_nyerte_el_a_milliardos_csongradi_munkat/
26 Menő korrupciós technikák http://www.fn.hu/cegek/20080611/meno_korrupcios_technikak/
27 MSZP: lopva költ a kormány http://www.hir24.hu/belfold/2011/08/25/mszp-lopva-kolt-a-kormany/
28 Hogyan rothasztja a túlzott győzni akarás a társadalmat? http://www.fn.hu/belfold/20100421/hogyan_rothasztja_tulzott_gyozni/
29 Egymilliárdért szerez be nyomkövetőket a rendőrség http://index.hu/belfold/2012/10/31/egymilliardert_szerez_be_nyomkovetoket_a_rendorseg/
30 Projektiroda-vezető lett, akitől félmilliárdot követelnek http://index.hu/belfold/2012/11/22/projektiroda_vezeto_lett_akitol_felmilliardot_kovetelnek/
31 Egy NFÜ-s vezető egykori üzlettársa is nyertese a kétmilliárdos megbízásnak http://www.origo.hu/itthon/20110220-nemzeti-fejlesztesi-ugynokseg-draga-tanacsadoi-szerzodese-a.html
32 Versenymentes ügyvédek http://www.nol.hu/archivum/archiv-482235
33 Az orvosbárókat kell meggyőzni http://hvg.hu/gazdasag/20120531_korhazi_korrupcio_orvosbarok#rss
34 A gemkapoccsal is mutyiztak az önkormányzatok? http://www.fn.hu/belfold/20091016/gemkapoccsal_is_mutyiztak/
35 Újra tendergyőztes a Fidesz volt kabinettitkára http://index.hu/belfold/2012/04/04/ujra_tendergyoztes_a_fidesz_volt_kabinettitkara/
36 Megint az IMG nyert egy állami tenderen http://index.hu/kultur/media/2012/11/12/az_img_kapja_az_mtva_1_5_milliardjat/
37 Offshore lovag a közbeszerzési bizottság elnöke? http://varanus.blog.hu/?utm_source=ketrec&utm_medium=link&utm_content=2013_02_01&utm_campaign=index
38 Nem tudtunk hülyébbek lenni a kormánynál http://index.hu/belfold/2013/02/12/megprobaltunk_hulyebbek_lenni_a_kormanynal/
39 Két forintot engedett az árból a Közgép - kétmilliárddal emelte a tétet http://www.napi.hu/magyar_vallalatok/ket_forintot_engedett_az_arbol_a_kozgep_ketmilliarddal_emelte_a _tetet.552308.html
40 Közbeszerzés nélkül épül újjá a fél Belváros http://index.hu/belfold/2013/05/16/kozbeszerzes_nelkul_epul_ujja_a_belvaros/
41 Bűzlött az iskolagyümölcs-tender, lefújták http://index.hu/gazdasag/2013/06/12/budos_volt_az_iskolagyumolcs-tender_lefujtak/
42 A kormány kedvenc újjáépítői http://index.hu/belfold/2013/07/05/a_kormany_kedvenc_ujjaepitoi/
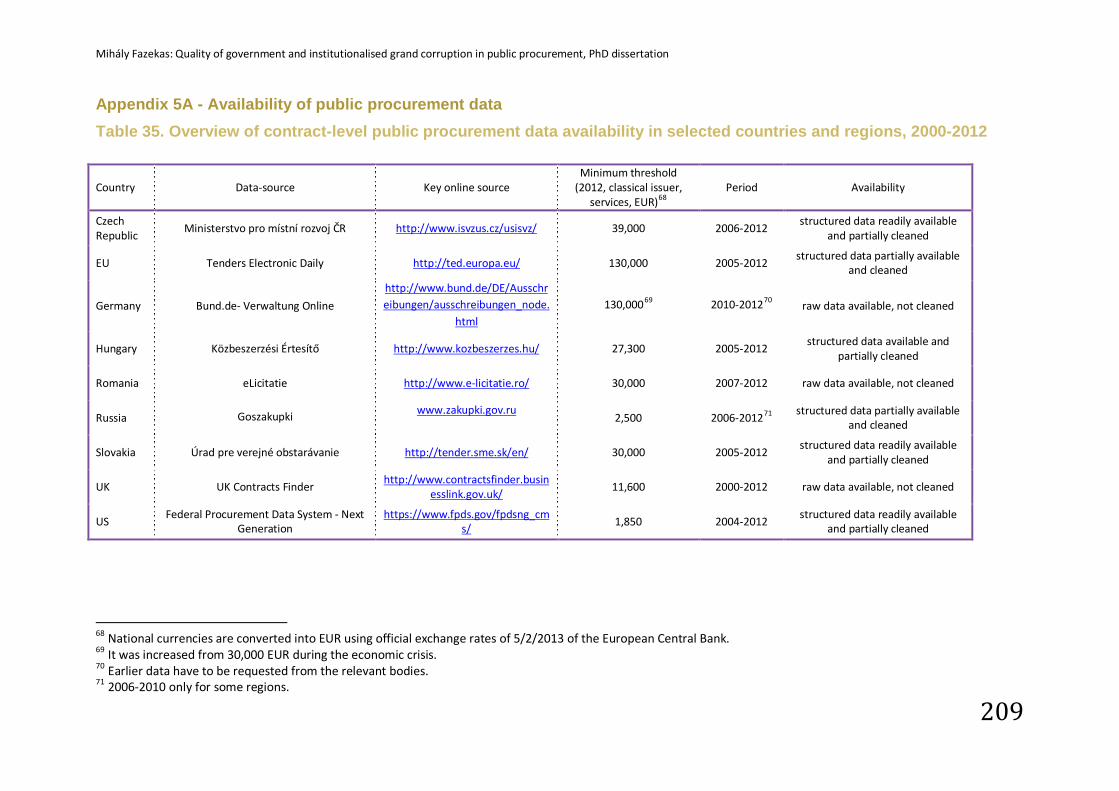
Mihály Fazekas: Quality of government and institutionalised grand corruption in public procurement, PhD dissertation
209
Appendix 5A - Availability of public procurement data Table 35. Overview of contract-level public procurement data availability in selected countries and regions, 2000-2012
Country Data-source Key online source Minimum threshold
(2012, classical issuer, services, EUR)68
Period Availability
Czech Republic
Ministerstvo pro místní rozvoj ČR http://www.isvzus.cz/usisvz/ 39,000 2006-2012 structured data readily available
and partially cleaned
EU Tenders Electronic Daily http://ted.europa.eu/ 130,000 2005-2012 structured data partially available
and cleaned
Germany Bund.de- Verwaltung Online
http://www.bund.de/DE/Ausschreibungen/ausschreibungen_node.
html
130,00069 2010-201270 raw data available, not cleaned
Hungary Közbeszerzési Értesítő http://www.kozbeszerzes.hu/ 27,300 2005-2012 structured data available and
partially cleaned
Romania eLicitatie http://www.e-licitatie.ro/ 30,000 2007-2012 raw data available, not cleaned
Russia Goszakupki www.zakupki.gov.ru
2,500 2006-201271 structured data partially available
and cleaned
Slovakia Úrad pre verejné obstarávanie http://tender.sme.sk/en/ 30,000 2005-2012 structured data readily available
and partially cleaned
UK UK Contracts Finder http://www.contractsfinder.busin
esslink.gov.uk/ 11,600 2000-2012 raw data available, not cleaned
US Federal Procurement Data System - Next
Generation https://www.fpds.gov/fpdsng_cm
s/ 1,850 2004-2012
structured data readily available and partially cleaned
68 National currencies are converted into EUR using official exchange rates of 5/2/2013 of the European Central Bank. 69 It was increased from 30,000 EUR during the economic crisis. 70 Earlier data have to be requested from the relevant bodies. 71 2006-2010 only for some regions.
Mihály Fazekas: Quality of government and institutionalised grand corruption in public procurement, PhD dissertation
210
Appendix 5B - Robustness checks The most convincing alternative explanation to this paper’s interpretation of
regressions as models of corrupt contract award states that products and services
bought by public agencies are highly specific. Therefore, both single bidder and high
share of the winner within the issuer’s contracts are driven by the lack of adequate
suppliers rather than corruption. In order to control for this important confounding
factor each regression contains the number of winners on the market throughout
2009-2012 as an explanatory factor. In addition, this appendix reports regressions on
restricted samples which include contracts for products and services procured on
markets with more than 2, 9, and 37 winners in 2009-2012. The cut-points 2 and 37
were defined using the same technique of identifying thresholds in continuous
variables as spelled out in section 6.1. The cut-point of 9 was added arbitrarily in
order to display an intermediary value.
To define the number of adequate competitors on a market, an appropriate definition
of market has to be found. We defined markets along two dimensions: 1) the nature
of product or service procured, and 2) the geographical location of contract
performance. CPV codes differentiate over 3000 products and services as detailed
as eggs (03142500-3) or potatoes (03212100-1). While we aim at being conservative
in market definition, such level of detail is surely excessive. Exploiting the
hierarchical nature of CPV classification, level-4 categories were selected as suitable
for market definition, because the distribution of winners throughout 2009-2012
suggested that there are a large number of markets with a fairly small winners.
Contracts were awarded in 820 level-4 CPV categories such as crops, products of
market gardening and horticulture (0311) or construction materials (4411). Even
though Hungary is a relatively small country interviewees suggested that there may
be geographical frontiers of markets. Hence, we used 3 NUTS-1 regions plus the
whole country to define markets along a geographical dimension (national reach
typically requires an extensive set of local offices warranting an effective market
barrier). Taken together, these resulted in 820*4=3280 distinct markets.
To define how many suitable competitors a market has, we simply calculated the
winners of each market throughout 2009-2012. This is a conservative estimate as
Mihály Fazekas: Quality of government and institutionalised grand corruption in public procurement, PhD dissertation
211
bidders who never won, for example because they were too expensive, but
submitted valid bids were not taken into account. As some companies may have
gone bankrupt or been bought by others, this estimation strategy may also be
somewhat upward biased; therefore in some regressions we excluded markets with
very many competitors.
The below tables demonstrate the robustness of our models to excluding markets
with specific products and services (Error! Reference source not found., Table 36,
and Table 37). Each of the findings in these alternative specifications remain
unchanged compared to the main regressions, while indicators of goodness of fit
improve somewhat.
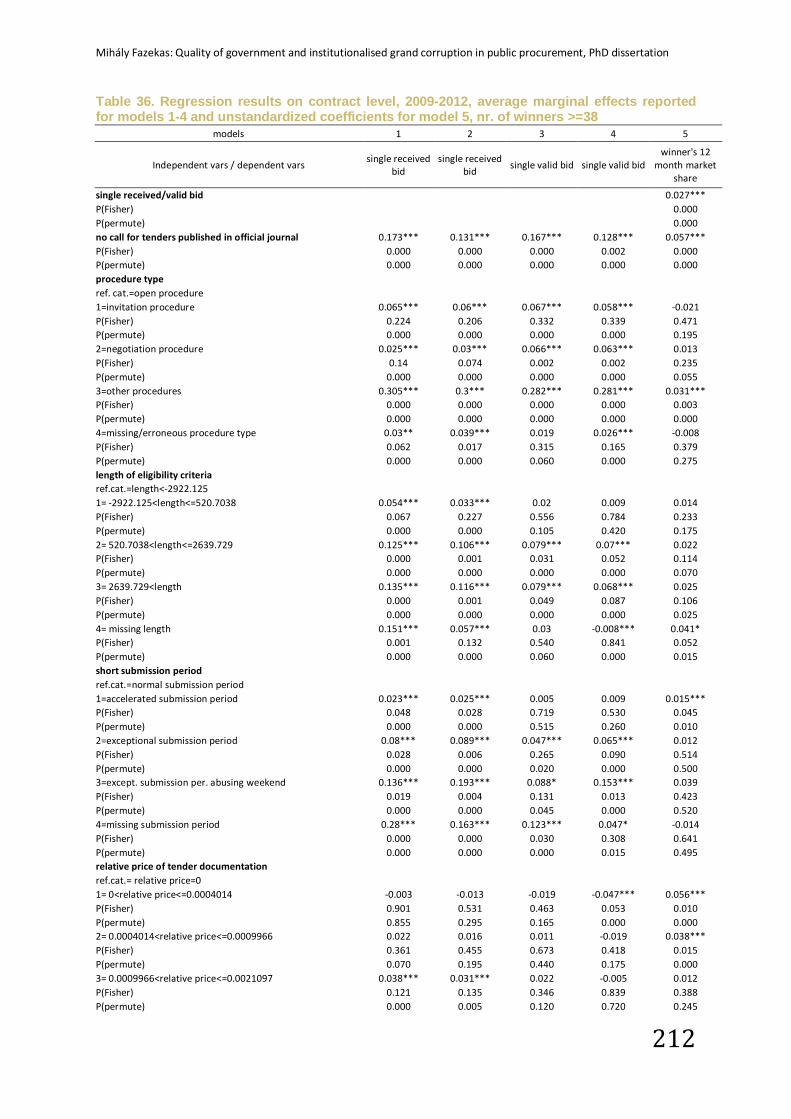
Mihály Fazekas: Quality of government and institutionalised grand corruption in public procurement, PhD dissertation
212
Table 36. Regression results on contract level, 2009-2012, average marginal effects reported for models 1-4 and unstandardized coefficients for model 5, nr. of winners >=38
models 1 2 3 4 5
Independent vars / dependent vars single received
bid single received
bid single valid bid single valid bid
winner's 12 month market
share
single received/valid bid
0.027*** P(Fisher)
0.000
P(permute)
0.000 no call for tenders published in official journal 0.173*** 0.131*** 0.167*** 0.128*** 0.057*** P(Fisher) 0.000 0.000 0.000 0.002 0.000 P(permute) 0.000 0.000 0.000 0.000 0.000 procedure type
ref. cat.=open procedure
1=invitation procedure 0.065*** 0.06*** 0.067*** 0.058*** -0.021 P(Fisher) 0.224 0.206 0.332 0.339 0.471 P(permute) 0.000 0.000 0.000 0.000 0.195 2=negotiation procedure 0.025*** 0.03*** 0.066*** 0.063*** 0.013 P(Fisher) 0.14 0.074 0.002 0.002 0.235 P(permute) 0.000 0.000 0.000 0.000 0.055 3=other procedures 0.305*** 0.3*** 0.282*** 0.281*** 0.031*** P(Fisher) 0.000 0.000 0.000 0.000 0.003 P(permute) 0.000 0.000 0.000 0.000 0.000 4=missing/erroneous procedure type 0.03** 0.039*** 0.019 0.026*** -0.008 P(Fisher) 0.062 0.017 0.315 0.165 0.379 P(permute) 0.000 0.000 0.060 0.000 0.275 length of eligibility criteria
ref.cat.=length<-2922.125
1= -2922.125<length<=520.7038 0.054*** 0.033*** 0.02 0.009 0.014 P(Fisher) 0.067 0.227 0.556 0.784 0.233 P(permute) 0.000 0.000 0.105 0.420 0.175 2= 520.7038<length<=2639.729 0.125*** 0.106*** 0.079*** 0.07*** 0.022 P(Fisher) 0.000 0.001 0.031 0.052 0.114 P(permute) 0.000 0.000 0.000 0.000 0.070 3= 2639.729<length 0.135*** 0.116*** 0.079*** 0.068*** 0.025 P(Fisher) 0.000 0.001 0.049 0.087 0.106 P(permute) 0.000 0.000 0.000 0.000 0.025 4= missing length 0.151*** 0.057*** 0.03 -0.008*** 0.041* P(Fisher) 0.001 0.132 0.540 0.841 0.052 P(permute) 0.000 0.000 0.060 0.000 0.015 short submission period
ref.cat.=normal submission period
1=accelerated submission period 0.023*** 0.025*** 0.005 0.009 0.015*** P(Fisher) 0.048 0.028 0.719 0.530 0.045 P(permute) 0.000 0.000 0.515 0.260 0.010 2=exceptional submission period 0.08*** 0.089*** 0.047*** 0.065*** 0.012 P(Fisher) 0.028 0.006 0.265 0.090 0.514 P(permute) 0.000 0.000 0.020 0.000 0.500 3=except. submission per. abusing weekend 0.136*** 0.193*** 0.088* 0.153*** 0.039 P(Fisher) 0.019 0.004 0.131 0.013 0.423 P(permute) 0.000 0.000 0.045 0.000 0.520 4=missing submission period 0.28*** 0.163*** 0.123*** 0.047* -0.014 P(Fisher) 0.000 0.000 0.030 0.308 0.641 P(permute) 0.000 0.000 0.000 0.015 0.495 relative price of tender documentation
ref.cat.= relative price=0
1= 0<relative price<=0.0004014 -0.003 -0.013 -0.019 -0.047*** 0.056*** P(Fisher) 0.901 0.531 0.463 0.053 0.010 P(permute) 0.855 0.295 0.165 0.000 0.000 2= 0.0004014<relative price<=0.0009966 0.022 0.016 0.011 -0.019 0.038*** P(Fisher) 0.361 0.455 0.673 0.418 0.015 P(permute) 0.070 0.195 0.440 0.175 0.000 3= 0.0009966<relative price<=0.0021097 0.038*** 0.031*** 0.022 -0.005 0.012 P(Fisher) 0.121 0.135 0.346 0.839 0.388 P(permute) 0.000 0.005 0.120 0.720 0.245
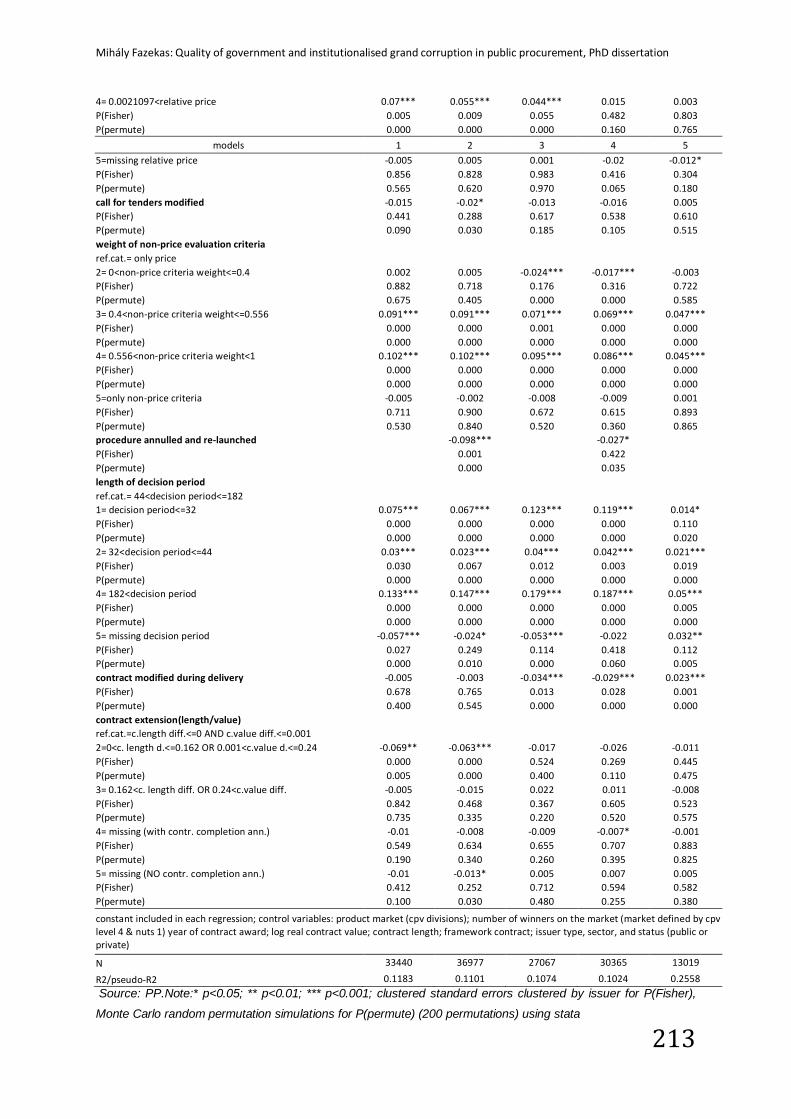
Mihály Fazekas: Quality of government and institutionalised grand corruption in public procurement, PhD dissertation
213
4= 0.0021097<relative price 0.07*** 0.055*** 0.044*** 0.015 0.003 P(Fisher) 0.005 0.009 0.055 0.482 0.803 P(permute) 0.000 0.000 0.000 0.160 0.765
models 1 2 3 4 5 5=missing relative price -0.005 0.005 0.001 -0.02 -0.012* P(Fisher) 0.856 0.828 0.983 0.416 0.304 P(permute) 0.565 0.620 0.970 0.065 0.180 call for tenders modified -0.015 -0.02* -0.013 -0.016 0.005 P(Fisher) 0.441 0.288 0.617 0.538 0.610 P(permute) 0.090 0.030 0.185 0.105 0.515 weight of non-price evaluation criteria
ref.cat.= only price
2= 0<non-price criteria weight<=0.4 0.002 0.005 -0.024*** -0.017*** -0.003 P(Fisher) 0.882 0.718 0.176 0.316 0.722 P(permute) 0.675 0.405 0.000 0.000 0.585 3= 0.4<non-price criteria weight<=0.556 0.091*** 0.091*** 0.071*** 0.069*** 0.047*** P(Fisher) 0.000 0.000 0.001 0.000 0.000 P(permute) 0.000 0.000 0.000 0.000 0.000 4= 0.556<non-price criteria weight<1 0.102*** 0.102*** 0.095*** 0.086*** 0.045*** P(Fisher) 0.000 0.000 0.000 0.000 0.000 P(permute) 0.000 0.000 0.000 0.000 0.000 5=only non-price criteria -0.005 -0.002 -0.008 -0.009 0.001 P(Fisher) 0.711 0.900 0.672 0.615 0.893 P(permute) 0.530 0.840 0.520 0.360 0.865 procedure annulled and re-launched
-0.098***
-0.027*
P(Fisher)
0.001
0.422
P(permute)
0.000
0.035
length of decision period
ref.cat.= 44<decision period<=182
1= decision period<=32 0.075*** 0.067*** 0.123*** 0.119*** 0.014* P(Fisher) 0.000 0.000 0.000 0.000 0.110 P(permute) 0.000 0.000 0.000 0.000 0.020 2= 32<decision period<=44 0.03*** 0.023*** 0.04*** 0.042*** 0.021*** P(Fisher) 0.030 0.067 0.012 0.003 0.019 P(permute) 0.000 0.000 0.000 0.000 0.000 4= 182<decision period 0.133*** 0.147*** 0.179*** 0.187*** 0.05*** P(Fisher) 0.000 0.000 0.000 0.000 0.005 P(permute) 0.000 0.000 0.000 0.000 0.000 5= missing decision period -0.057*** -0.024* -0.053*** -0.022 0.032** P(Fisher) 0.027 0.249 0.114 0.418 0.112 P(permute) 0.000 0.010 0.000 0.060 0.005 contract modified during delivery -0.005 -0.003 -0.034*** -0.029*** 0.023*** P(Fisher) 0.678 0.765 0.013 0.028 0.001 P(permute) 0.400 0.545 0.000 0.000 0.000 contract extension(length/value)
ref.cat.=c.length diff.<=0 AND c.value diff.<=0.001
2=0<c. length d.<=0.162 OR 0.001<c.value d.<=0.24 -0.069** -0.063*** -0.017 -0.026 -0.011 P(Fisher) 0.000 0.000 0.524 0.269 0.445 P(permute) 0.005 0.000 0.400 0.110 0.475 3= 0.162<c. length diff. OR 0.24<c.value diff. -0.005 -0.015 0.022 0.011 -0.008 P(Fisher) 0.842 0.468 0.367 0.605 0.523 P(permute) 0.735 0.335 0.220 0.520 0.575 4= missing (with contr. completion ann.) -0.01 -0.008 -0.009 -0.007* -0.001 P(Fisher) 0.549 0.634 0.655 0.707 0.883 P(permute) 0.190 0.340 0.260 0.395 0.825 5= missing (NO contr. completion ann.) -0.01 -0.013* 0.005 0.007 0.005 P(Fisher) 0.412 0.252 0.712 0.594 0.582 P(permute) 0.100 0.030 0.480 0.255 0.380
constant included in each regression; control variables: product market (cpv divisions); number of winners on the market (market defined by cpv level 4 & nuts 1) year of contract award; log real contract value; contract length; framework contract; issuer type, sector, and status (public or private)
N 33440 36977 27067 30365 13019
R2/pseudo-R2 0.1183 0.1101 0.1074 0.1024 0.2558
Source: PP.Note:* p<0.05; ** p<0.01; *** p<0.001; clustered standard errors clustered by issuer for P(Fisher),
Monte Carlo random permutation simulations for P(permute) (200 permutations) using stata
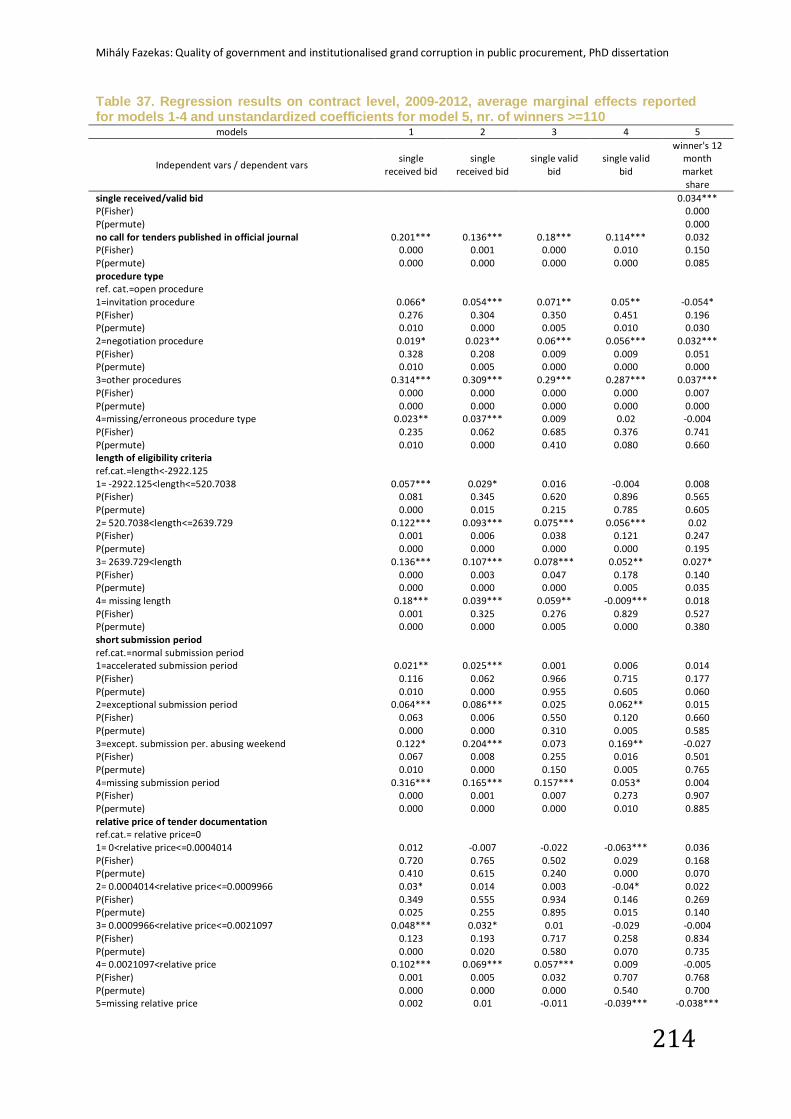
Mihály Fazekas: Quality of government and institutionalised grand corruption in public procurement, PhD dissertation
214
Table 37. Regression results on contract level, 2009-2012, average marginal effects reported for models 1-4 and unstandardized coefficients for model 5, nr. of winners >=110
models 1 2 3 4 5
Independent vars / dependent vars single
received bid single
received bid single valid
bid single valid
bid
winner's 12 month market share
single received/valid bid
0.034*** P(Fisher)
0.000
P(permute)
0.000 no call for tenders published in official journal 0.201*** 0.136*** 0.18*** 0.114*** 0.032 P(Fisher) 0.000 0.001 0.000 0.010 0.150 P(permute) 0.000 0.000 0.000 0.000 0.085 procedure type
ref. cat.=open procedure
1=invitation procedure 0.066* 0.054*** 0.071** 0.05** -0.054* P(Fisher) 0.276 0.304 0.350 0.451 0.196 P(permute) 0.010 0.000 0.005 0.010 0.030 2=negotiation procedure 0.019* 0.023** 0.06*** 0.056*** 0.032*** P(Fisher) 0.328 0.208 0.009 0.009 0.051 P(permute) 0.010 0.005 0.000 0.000 0.000 3=other procedures 0.314*** 0.309*** 0.29*** 0.287*** 0.037*** P(Fisher) 0.000 0.000 0.000 0.000 0.007 P(permute) 0.000 0.000 0.000 0.000 0.000 4=missing/erroneous procedure type 0.023** 0.037*** 0.009 0.02 -0.004 P(Fisher) 0.235 0.062 0.685 0.376 0.741 P(permute) 0.010 0.000 0.410 0.080 0.660 length of eligibility criteria
ref.cat.=length<-2922.125
1= -2922.125<length<=520.7038 0.057*** 0.029* 0.016 -0.004 0.008 P(Fisher) 0.081 0.345 0.620 0.896 0.565 P(permute) 0.000 0.015 0.215 0.785 0.605 2= 520.7038<length<=2639.729 0.122*** 0.093*** 0.075*** 0.056*** 0.02 P(Fisher) 0.001 0.006 0.038 0.121 0.247 P(permute) 0.000 0.000 0.000 0.000 0.195 3= 2639.729<length 0.136*** 0.107*** 0.078*** 0.052** 0.027* P(Fisher) 0.000 0.003 0.047 0.178 0.140 P(permute) 0.000 0.000 0.000 0.005 0.035 4= missing length 0.18*** 0.039*** 0.059** -0.009*** 0.018 P(Fisher) 0.001 0.325 0.276 0.829 0.527 P(permute) 0.000 0.000 0.005 0.000 0.380 short submission period
ref.cat.=normal submission period
1=accelerated submission period 0.021** 0.025*** 0.001 0.006 0.014 P(Fisher) 0.116 0.062 0.966 0.715 0.177 P(permute) 0.010 0.000 0.955 0.605 0.060 2=exceptional submission period 0.064*** 0.086*** 0.025 0.062** 0.015 P(Fisher) 0.063 0.006 0.550 0.120 0.660 P(permute) 0.000 0.000 0.310 0.005 0.585 3=except. submission per. abusing weekend 0.122* 0.204*** 0.073 0.169** -0.027 P(Fisher) 0.067 0.008 0.255 0.016 0.501 P(permute) 0.010 0.000 0.150 0.005 0.765 4=missing submission period 0.316*** 0.165*** 0.157*** 0.053* 0.004 P(Fisher) 0.000 0.001 0.007 0.273 0.907 P(permute) 0.000 0.000 0.000 0.010 0.885 relative price of tender documentation
ref.cat.= relative price=0
1= 0<relative price<=0.0004014 0.012 -0.007 -0.022 -0.063*** 0.036 P(Fisher) 0.720 0.765 0.502 0.029 0.168 P(permute) 0.410 0.615 0.240 0.000 0.070 2= 0.0004014<relative price<=0.0009966 0.03* 0.014 0.003 -0.04* 0.022 P(Fisher) 0.349 0.555 0.934 0.146 0.269 P(permute) 0.025 0.255 0.895 0.015 0.140 3= 0.0009966<relative price<=0.0021097 0.048*** 0.032* 0.01 -0.029 -0.004 P(Fisher) 0.123 0.193 0.717 0.258 0.834 P(permute) 0.000 0.020 0.580 0.070 0.735 4= 0.0021097<relative price 0.102*** 0.069*** 0.057*** 0.009 -0.005 P(Fisher) 0.001 0.005 0.032 0.707 0.768 P(permute) 0.000 0.000 0.000 0.540 0.700 5=missing relative price 0.002 0.01 -0.011 -0.039*** -0.038***
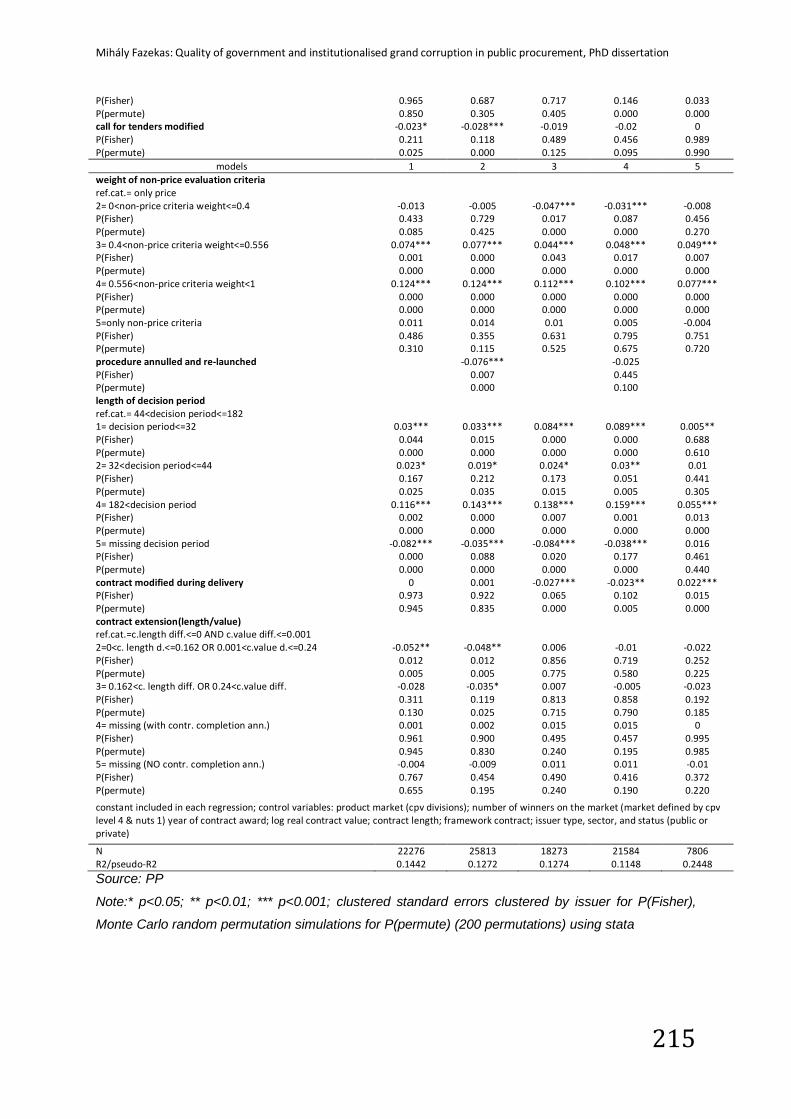
Mihály Fazekas: Quality of government and institutionalised grand corruption in public procurement, PhD dissertation
215
P(Fisher) 0.965 0.687 0.717 0.146 0.033 P(permute) 0.850 0.305 0.405 0.000 0.000 call for tenders modified -0.023* -0.028*** -0.019 -0.02 0 P(Fisher) 0.211 0.118 0.489 0.456 0.989 P(permute) 0.025 0.000 0.125 0.095 0.990
models 1 2 3 4 5 weight of non-price evaluation criteria
ref.cat.= only price
2= 0<non-price criteria weight<=0.4 -0.013 -0.005 -0.047*** -0.031*** -0.008 P(Fisher) 0.433 0.729 0.017 0.087 0.456 P(permute) 0.085 0.425 0.000 0.000 0.270 3= 0.4<non-price criteria weight<=0.556 0.074*** 0.077*** 0.044*** 0.048*** 0.049*** P(Fisher) 0.001 0.000 0.043 0.017 0.007 P(permute) 0.000 0.000 0.000 0.000 0.000 4= 0.556<non-price criteria weight<1 0.124*** 0.124*** 0.112*** 0.102*** 0.077*** P(Fisher) 0.000 0.000 0.000 0.000 0.000 P(permute) 0.000 0.000 0.000 0.000 0.000 5=only non-price criteria 0.011 0.014 0.01 0.005 -0.004 P(Fisher) 0.486 0.355 0.631 0.795 0.751 P(permute) 0.310 0.115 0.525 0.675 0.720 procedure annulled and re-launched
-0.076***
-0.025
P(Fisher)
0.007
0.445
P(permute)
0.000
0.100
length of decision period
ref.cat.= 44<decision period<=182
1= decision period<=32 0.03*** 0.033*** 0.084*** 0.089*** 0.005** P(Fisher) 0.044 0.015 0.000 0.000 0.688 P(permute) 0.000 0.000 0.000 0.000 0.610 2= 32<decision period<=44 0.023* 0.019* 0.024* 0.03** 0.01 P(Fisher) 0.167 0.212 0.173 0.051 0.441 P(permute) 0.025 0.035 0.015 0.005 0.305 4= 182<decision period 0.116*** 0.143*** 0.138*** 0.159*** 0.055*** P(Fisher) 0.002 0.000 0.007 0.001 0.013 P(permute) 0.000 0.000 0.000 0.000 0.000 5= missing decision period -0.082*** -0.035*** -0.084*** -0.038*** 0.016 P(Fisher) 0.000 0.088 0.020 0.177 0.461 P(permute) 0.000 0.000 0.000 0.000 0.440 contract modified during delivery 0 0.001 -0.027*** -0.023** 0.022*** P(Fisher) 0.973 0.922 0.065 0.102 0.015 P(permute) 0.945 0.835 0.000 0.005 0.000 contract extension(length/value)
ref.cat.=c.length diff.<=0 AND c.value diff.<=0.001
2=0<c. length d.<=0.162 OR 0.001<c.value d.<=0.24 -0.052** -0.048** 0.006 -0.01 -0.022 P(Fisher) 0.012 0.012 0.856 0.719 0.252 P(permute) 0.005 0.005 0.775 0.580 0.225 3= 0.162<c. length diff. OR 0.24<c.value diff. -0.028 -0.035* 0.007 -0.005 -0.023 P(Fisher) 0.311 0.119 0.813 0.858 0.192 P(permute) 0.130 0.025 0.715 0.790 0.185 4= missing (with contr. completion ann.) 0.001 0.002 0.015 0.015 0 P(Fisher) 0.961 0.900 0.495 0.457 0.995 P(permute) 0.945 0.830 0.240 0.195 0.985 5= missing (NO contr. completion ann.) -0.004 -0.009 0.011 0.011 -0.01 P(Fisher) 0.767 0.454 0.490 0.416 0.372 P(permute) 0.655 0.195 0.240 0.190 0.220
constant included in each regression; control variables: product market (cpv divisions); number of winners on the market (market defined by cpv level 4 & nuts 1) year of contract award; log real contract value; contract length; framework contract; issuer type, sector, and status (public or private)
N 22276 25813 18273 21584 7806 R2/pseudo-R2 0.1442 0.1272 0.1274 0.1148 0.2448
Source: PP
Note:* p<0.05; ** p<0.01; *** p<0.001; clustered standard errors clustered by issuer for P(Fisher),
Monte Carlo random permutation simulations for P(permute) (200 permutations) using stata
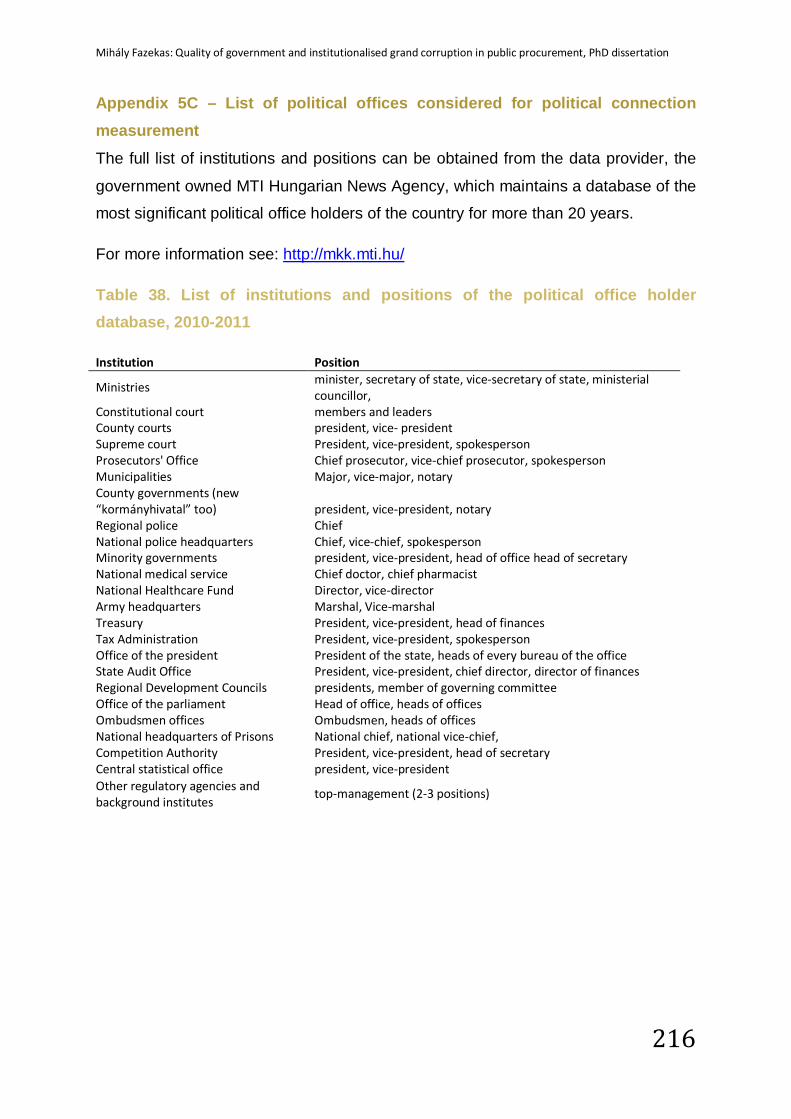
Mihály Fazekas: Quality of government and institutionalised grand corruption in public procurement, PhD dissertation
216
Appendix 5C – List of political offices considered for political connection measurement The full list of institutions and positions can be obtained from the data provider, the
government owned MTI Hungarian News Agency, which maintains a database of the
most significant political office holders of the country for more than 20 years.
For more information see: http://mkk.mti.hu/
Table 38. List of institutions and positions of the political office holder database, 2010-2011
Institution Position
Ministries minister, secretary of state, vice-secretary of state, ministerial councillor,
Constitutional court members and leaders County courts president, vice- president Supreme court President, vice-president, spokesperson Prosecutors' Office Chief prosecutor, vice-chief prosecutor, spokesperson Municipalities Major, vice-major, notary County governments (new “kormányhivatal” too) president, vice-president, notary Regional police Chief National police headquarters Chief, vice-chief, spokesperson Minority governments president, vice-president, head of office head of secretary National medical service Chief doctor, chief pharmacist National Healthcare Fund Director, vice-director Army headquarters Marshal, Vice-marshal Treasury President, vice-president, head of finances Tax Administration President, vice-president, spokesperson Office of the president President of the state, heads of every bureau of the office State Audit Office President, vice-president, chief director, director of finances Regional Development Councils presidents, member of governing committee Office of the parliament Head of office, heads of offices Ombudsmen offices Ombudsmen, heads of offices National headquarters of Prisons National chief, national vice-chief, Competition Authority President, vice-president, head of secretary Central statistical office president, vice-president Other regulatory agencies and background institutes
top-management (2-3 positions)
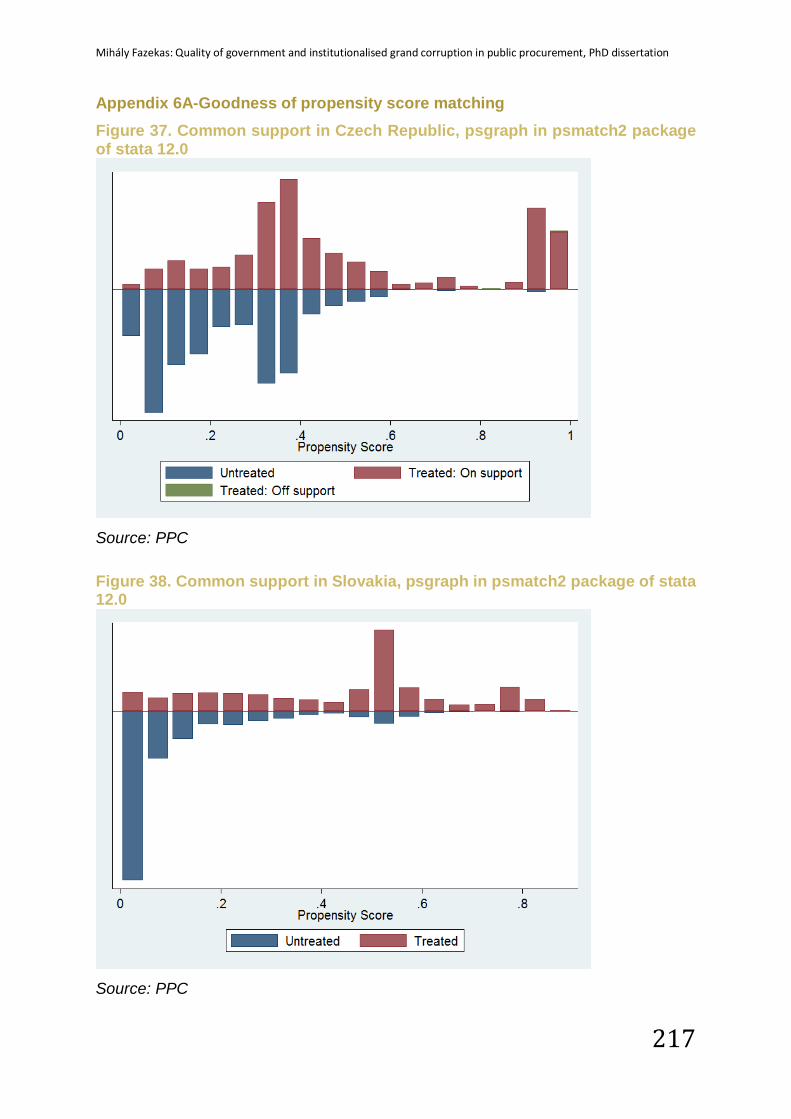
Mihály Fazekas: Quality of government and institutionalised grand corruption in public procurement, PhD dissertation
217
Appendix 6A-Goodness of propensity score matching Figure 37. Common support in Czech Republic, psgraph in psmatch2 package of stata 12.0
Source: PPC
Figure 38. Common support in Slovakia, psgraph in psmatch2 package of stata 12.0
Source: PPC
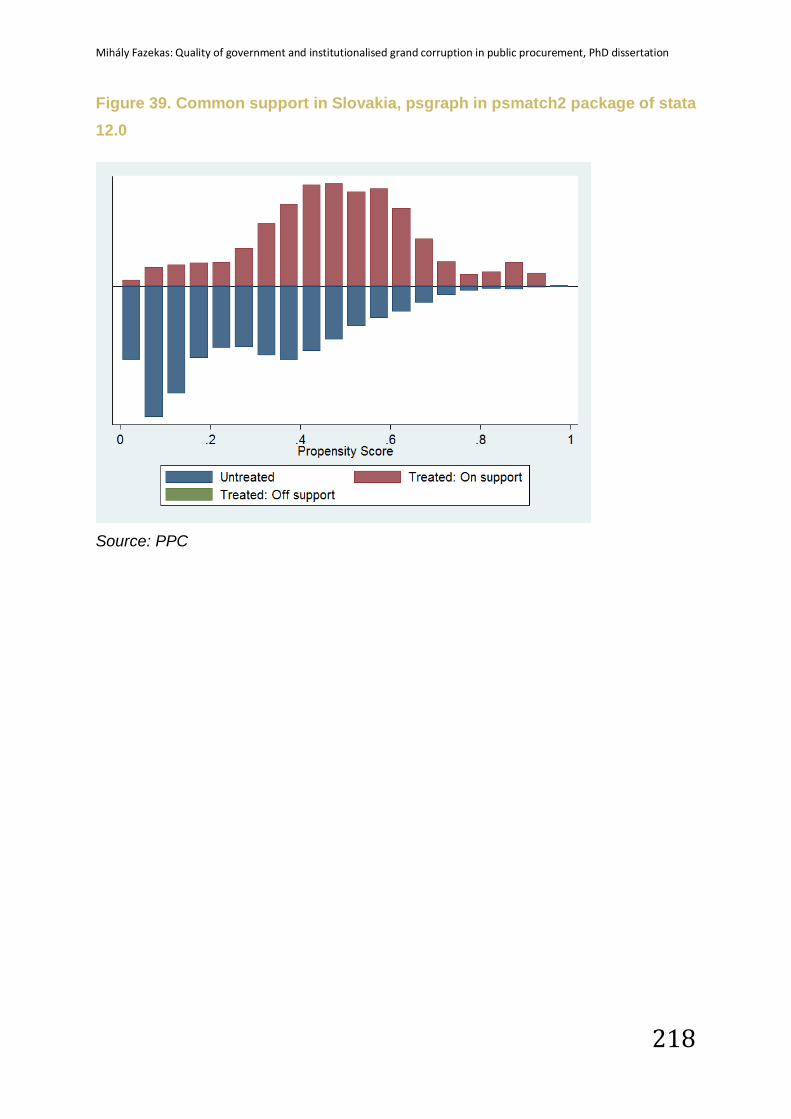
Mihály Fazekas: Quality of government and institutionalised grand corruption in public procurement, PhD dissertation
218
Figure 39. Common support in Slovakia, psgraph in psmatch2 package of stata 12.0
Source: PPC
Mihály Fazekas: Quality of government and institutionalised grand corruption in public procurement, PhD dissertation
219
Bibliography
Albrow, M. (1970). Bureaucracy. London: Macmillan.
Amsden, A. (2001). The Rise of “the Rest”: Challenges to the West from Late-Industrializing Economies. NewYork: Oxford University Press.
Andersson, S., & Heywood, P. M. (2009). The Politics of Perception: Use and Abuse of Transparency International’s Approach to Measuring Corruption. Political Studies, 57, 746–767.
Arndt, C., & Oman, C. (2006). Uses and Abuses of Governance Indicators. Paris: OECD.
Arrowsmith, S. (2009). EC Regime on Public Procurement. In K. V Thai (Ed.), International handbook of public procurement (pp. 254–290). New York: CRC Press.
Arrowsmith, S. (2010). Public procurement: Basic concepts and the coverage of procurement rules. In S. Arrowsmith (Ed.), Public procurement regulation: an introduction (pp. 1–32). Nottingham: University of Nottingham.
Audet, D. (2002). Government Procurement: A Synthesis Report. OECD Journal on Budgeting, 2(3), 149–194.
Auriol, E., Flochel, T., & Straub, S. (2011). Public Procurement and Rent-Seeking: The Case of Paraguay. TSE Working Papers: 11-224, Toulouse: Toulouse School of Economics (TSE).
Báger, G. (2011). Corruption Risks in Public Administration. Methodology and Empirical Experiences. Public Finance Quarterly, 2, 44–57.
Bandiera, O., Prat, A., & Valletti, T. (2009). Active and Passive Waste in Government Spending: Evidence from a Policy Experiment. American Economic Review, 99(4), 1278–1308.
Batory, A. (2012). Why do anti-corruption laws fail in Central Eastern Europe? A target compliance perspective. Regulation & Governance, 6(1), 66–82. doi:10.1111/j.1748-5991.2011.01125.x
Baumgartner, F. R., Berry, J. M., Hojnacki, M., Kimball, D. C., & Leech, B. L. (2008). Lobbying and Policy Change: Who Wins, Who Loses, and Why. Chicago: University of Chicago Press.
Beblavy, M. (2009). Conditions for effective large-scale anticorruption efforts and the role of external actors: What does the Slovak experience tell us? Public Administration and Development, 29(3), 180–192. doi:10.1002/pad.526
Mihály Fazekas: Quality of government and institutionalised grand corruption in public procurement, PhD dissertation
220
Berry, J. M. (1999). The New Liberalism: The Rising Power of Citizen Groups. Washington, DC: Brookings Institution Press.
Block, F., & Evans, P. B. (2005). The State and the Economy. In N. J. Smelser & R. Swedberg (Eds.), The Handbook of Economic Sociology (pp. 505–526). Princeton, NJ: Princeton University Press.
Borgatti, S. P., Everett, M. G., & Johnson, J. C. (2013). Analyzing Social Networks. London: SAGE Publications.
Bräutigam, D. A. (2000). Aid Dependence and Governance. Stockholm: Almqvist & Wiksell International.
Bräutigam, D. A., & Knack, S. (2004). Foreign Aid, Institutions, and Governance in Sub ‐Saharan Africa. Economic Development and Cultural Change, 52(2), 255–285. doi:10.1086/380592
Byatt, I. (2001). Delivering Better Services for Citizens. A review of local government procurement in England. London.
Charron, N., Dijkstra, L., & Lapuente, V. (2010). Mapping Quality of Government in the European Union: A Study of National and Sub-National Variation. Gothenburg.
Charron, N., & Lapuente, V. (2011). Why Do Some Regions in Europe Have Higher Quality of Government? Göteborg.
Charron, N., Lapuente, V., & Rothstein, B. (Eds.). (2013). Quality of Government and Corruption from a European Perspective. A Comparative Study of Good Government in EU Regions. Cheltenham, UK: Edward Elgar Pub.
Cole, S., & Tran, A. (2011). Evidence from the Firm: A New Approach to Understanding Corruption. In S. Rose-Ackerman & T. Søreide (Eds.), International Handbook on the Economics of Corruption, volume two. Cheltenham, UK: Edward Elgar Publishing.
Coviello, D., & Gagliarducci, S. (2010). Building Political Collusion: Evidence from Procurement Auctions. IZA DP No. 4939, Bonn: Institute for the Study of Labor (IZA).
Dahlström, C., Lapuente, V., & Teorell, J. (2010). Dimensions of Bureaucracy. A Cross-National Dataset on the Structure and Behaviorof Public Administration. Gothenburg: The Quality of Government Institute, University of Gothenburg.
Di Tella, R., & Schargrodsky, E. (2003). The Role of Wages and Auditing during a Crackdown on Corruption in the City of Buenos Aires. Journal of Law and Economics, 46(1), 269–292.
Dimitrova, A. (2002). Enlargement, Institution-Building and the EU’s Administrative Capacity Requirement. West European Politics, 25(4), 171–190.
Mihály Fazekas: Quality of government and institutionalised grand corruption in public procurement, PhD dissertation
221
Dimitrova, A. (2009). Post-accession compliance between administrative co-ordination and political bargaining. European Integration Online Papers, 13(2), 1–18. doi:10.1695/2009019
Dimulescu, V., Pop, R., & Doroftei, I. M. (2013). Corruption risks with EU funds in Romania. Romanian Journal of Political Science, 13(1), 101–123.
Djankov, S., Montalvo, J., & Reynal-Querol, M. (2008). The curse of aid. Journal of Economic Growth, 13(3), 169–194. doi:10.1007/s10887-008-9032-8
Domhoff, W. G. (1990). Power Elite and the State. How Policy is Made in America? New York: Aldine de Gruyter.
Domhoff, W. G. (1996). State Autonomy or Class Dominance? Case Studies on Policy Making in America. New York: Aldine de Gruyter.
Domhoff, W. G. (2006). Who Rules America? Power, Politics & Social Change. Boston, Massachusetts: McGraw-Hill.
Donchev, D., & Ujhelyi, G. (2009). What Do Corruption Indices Measure?
Epstein, R. A., & Sedelmeier, U. (Eds.). (2009). International influence beyond conditionality: postcommunist Europe after EU enlargement. London: Routledge.
European Bank for Reconstruction and Development. (2011). EBRD Public Procurement Assessment. Review of laws and practice in the EBRD region-2011. London.
European Commission. (2003). A Comprehensive EU Policy Against Corruption. Brussels.
European Commission. Communication from the Commission to the Council, the European Parliament and the European Economic and Social Committee Fighting Corruption in the EU (2011). Brussels.
European Commission. (2011b). Public Procurement Indicators 2010. Brussels.
European Commission. (2011c). Establishing an EU Anti-corruption reporting mechanism for periodic assessment (“EU Anti-corruption Report”). Brussels.
European Council. Laying down general provisions on the European Regional Development Fund, the European Social Fund and the Cohesion Fund and repealing Regulation (EC) No 1260/1999. , Pub. L. No. COUNCIL REGULATION (EC) No 1083/2006 (2006). European Union.
European Court of Auditors. (2012). Annual Report on the Implementation of the Budget concerning financial year 2011. Brussels.
Mihály Fazekas: Quality of government and institutionalised grand corruption in public procurement, PhD dissertation
222
European Court of Auditors. (2013). Are EU Cohesion Policy funds well spent on roads? Luxembourg: European Court of Auditors.
Evans, P. B. (1995). Embedded autonomy: states and industrial transformation. Princeton, NJ: Princeton University Press.
Evans, P. B., & Rauch, J. E. (1999). Bureaucracy and Growth: A Cross-National Analysis of the Effects of “Weberian” State Structures on Economic Growth. American Sociological Review, 64(5), 748–765.
Evans, P. B., Rueschemeyer, D., & Skocpol, T. (Eds.). (1985). Bringing the state back in. Cambridge, UK: Cambridge University Press.
Fazekas, M., & Burns, T. (2012). Exploring the complex interaction between governance and knowledge in education. Paris: OECD, OECD Education Working Papers: OECD.
Fazekas, M., & Tóth, I. J. (2012a). Hibák, javítások és előzetes eredmények - magyarországi közbeszerzések 2010-2011. Corruption Research Centre, Budapest.
Fazekas, M., & Tóth, I. J. (2012b). Public Procurement, Corruption and State Capacity in Hungary – objective measures and new insights. Corruption Research Centre, Budapest.
Fazekas, M., Tóth, I. J., & King, L. P. (2013). Hidden Depths.The Case of Hungary. In A. Mungiu-Pippidi (Ed.), Controlling Corruption in Europe vol. 1 (pp. 74–82). Berlin: Barbara Budrich Publishers.
Ferraz, C., & Finan, F. (2008). Exposing Corrupt Politicians: The Effects of Brazil’s Publicly Released Audits on Electoral Outcomes. The Quarterly Journal of Economics, 123(2), 703–745. doi:10.1162/qjec.2008.123.2.703
Finegold, K., & Skocpol, T. (1995). State and party in America’s New Deal. Madison, W: University of Wisconsin Press.
Foucault, M. (1980). Power/knowledge: selected interviews and other writings, 1972-1977. London: Harvester Press.
Foucault, M. (1991). Governmentality. Chicago: University of Chicago Press.
Freedom House. (2012). Nations in Transit 2012. Washington, DC: Freedom House.
Goetz, K. H. (2001). Making sense of post-communist central administration: modernization, Europeanization or Latinization? Journal of European Public Policy, 8(6), 1032–1051.
Golden, M. A., & Picci, L. (2005). Proposal for a New Measure of Corruption, illustrated with Italian data. Economics & Politics, 17(1), 37–75. doi:10.1111/j.1468-0343.2005.00146.x
Mihály Fazekas: Quality of government and institutionalised grand corruption in public procurement, PhD dissertation
223
Goldman, E., Rocholl, J., & So, J. (2013). Politically Connected Boards of Directors and The Allocation of Procurement Contracts. Review of Finance, 17(5), 1617–1648. doi:10.1093/rof/rfs039
Goldman, E., So, J., & Rocholl, J. (2012). Politically Connected Boards of Directors and the Allocation of Procurement Contracts.
Good, P. I. (2006). Resampling Methods A Practical Guide to Data Analysis (3rd editio.). Berlin: Birkhauser.
Gordon, C. (1977). Power/Knowledge. Selected Interviews and Other Writings. Foucault. New York: Pantheon Books.
Grodeland, A. B. (2005). Bulgaria, Czech Republic, Romania and Slovenia: The Use Of Contacts and Informal Networks in Public Procurement. In OECD (Ed.), Fighting Corruption and Promoting Integrity in Public Procurement (pp. 59–76). Paris: OECD.
Grodeland, A. B. (2010). Informal relations in public procurement. In X International Scientific Conference on the problems of the development of the economy and society. Moscow: State University.
Grzymala-Busse, A. (2008). Beyond Clientelism : Incumbent State Capture and State Formation. Comparative Political Studies, 41(4/5), 638–673.
Hall, J. A., & Schroeder, R. (Eds.). (2005). An Anatomy of Power. The Social Theory of Michael Mann. Cambridge, UK: Cambridge University Press.
Hall, P. A. (1993). Policy Paradigms, Social Learning, and the State: The Case of Economic Policymaking in Britain. Comparative Politics, 25(3), 275–296.
Hamm, P., Stuckler, D., & King, L. P. (2010). The Governance Grenade: Mass Privatization, State Capacity and Economic Growth in Post-Communist Countries. Political Economy Research Institute.
Heggstad, K. K., & Froystad, M. (2011). The basics of integrity in procurement. Bergen, Norway: U4 Anti-Corruption Resource Centre Chr. Michelsen Institute (CMI).
Hellman, J. S., Jones, G., & Kaufmann, D. (2003). Seize the state, seize the day: state capture and influence in transition economies. Journal of Comparative Economics, 31(4), 751–773.
Hellman, J. S., Jones, G., Kaufmann, D., & Schankerman, M. (2000). Measuring Governance, Corruption, and State Capture: How Firms and Bureaucrats Shape the Business Environment in Transition Economies. Washington, DC.
Howlett, M. (2009). Policy analytical capacity and evidence-based policy-making: Lessons from Canada. Canadian Public Administration, 52(2), 153–175.
Mihály Fazekas: Quality of government and institutionalised grand corruption in public procurement, PhD dissertation
224
Hoyle, R. H. (Ed.). (2012). Handbook of Structural Equation modeling. New York: Guildford Press.
Hungarian Public Procurement Authority. (2009). J/354. Beszámoló az Országgyűlés részére a Közbeszerzések Tanácsa 2009. január 1. – december 31. közötti időszakban végzett tevékenységéről, a közbeszerzések tisztaságával és átláthatóságával kapcsolatos tapasztalatairól, valamint a jogorvoslati eljárások. Budapest.
Hyytinen, A., Lundberg, S., & Toivanen, O. (2008). Politics and Procurement: Evidence from Cleaning Contracts. HECER Discussion paper No. 233.
Imbens, G. W., & Wooldridge, J. M. (2009). Recent Developments in the Econometrics of Program Evaluation. Journal of Economic Literature, 47(1), 5–86.
Ionita, S., Nutu, O., Stefan, L., & Mungiu-Pippidi, A. (2011). Beyond perception. Has Romania’s governance improved after 2004? Romanian Journal of Political Science, 11(1).
Jancsics, D., & Jávor, I. (2012). Corrupt Governmental Networks. International Public Management Journal, 15(1), 62–99. doi:10.1080/10967494.2012.684019
Jann, W., & Wegrich, K. (2007). Theories of the policy cycle. In F. Fischer, G. J. Miller, & M. S. Sidney (Eds.), Handbook of public policy analysis: theory, politics, and methods (pp. 43–62). London: Taylor & Francis.
Jessop, B. (2006). The State And State-Building. In R. A. W. Rhodes, S. A. Binder, & B. A. Rockman (Eds.), The Oxford Handbook of Political Institutions (pp. 111–130). Oxford, UK: Oxford University Press.
Johnston, M. (1996). The search for definitions: the vitality of politics and the issue of corruption. International Social Science Journal, 48(149), 321–335.
Joshi, A., & Moore, M. (2004). Institutionalised Co-production: Unorthodox Public Service Delivery in Challenging Environments. Journal of Development Studies, 40(4), 31–49.
Kahneman, D., & Tversky, A. (1979). Prospect Theory: An Analysis of Decision Under Risk. Econometrica, 47(2), 263–291.
Karklins, R. (2005). The System Made Me Do It: Corruption In Post-communist Societies. New York: M.E. Sharpe.
Kaufmann, D., Kraay, A., & Mastruzzi, M. (2006). Measuring Corruption: Myths and realities. Development.
Kaufmann, D., Kraay, A., & Mastruzzi, M. (2007). Growth and Governance: A Reply. The Journal of Politics, 69(2), 555–562.
Mihály Fazekas: Quality of government and institutionalised grand corruption in public procurement, PhD dissertation
225
Kaufmann, D., Mastruzzi, M., & Kraay, A. (2010). The Worldwide Governance Indicators. Methodology and Analytical Issues. Washington, DC.
Kaufmann, D., & Vicente, P. C. (2005). Legal Corruption.
Keefer, P. (2004). A review of the political economy of governance: From property rights to voice. Washington, DC.
Kenny, C., & Musatova, M. (2010). “Red Flags of Corruption” in World Bank Projects: An Analysis of Infrastructure Contracts. Washington, DC.
King, L. P., & Hamm, P. (2005). Privatization and State Capacity in Postcommunist Society. Michigan.
King, L. P., & Szelényi, I. (2005). Post-Communist Economic Systems. In N. J. Smelser & R. Swedberg (Eds.), The Handbook of Economic Sociology (pp. 205–229). Princeton, NJ: Princeton University Press.
Klitgaard, R. (1991). Controlling Corruption. Berkeley, CA: University of California Press.
Knack, S. (2001). Aid Dependence and the Quality of Governance: Cross-Country Empirical Tests. Southern Economic Journal, 68(2), 310–329. doi:10.2307/1061596
Kovacic, W. E., Marshall, R. C., Marx, L. M., & Raiff, M. E. (2006). Bidding rings and the design of anti-collusive measures for auctions and procurements. In N. Dimitri, G. Piga, & G. Spagnolo (Eds.), Handbook of Procurement (pp. 381–411). Cambridge, UK: Cambridge University Press.
KPMG. (2012). EU Funds in Central and Eastern Europe. 2011. Warsaw, Poland: KPMG.
Kurtz, M. J., & Schrank, A. (2007a). Growth and Governance: Models, Measures, and Mechanisms. The Journal of Politics, 69(2), 538–554.
Kurtz, M. J., & Schrank, A. (2007b). Growth and Governance: A Defense. Journal of Politics, 69(2), 563–569.
Lambsdorff, J. G. (2006a). Causes and consequences of corruption: What do we know from a cross-section of countries? In S. Rose-Ackerman (Ed.), International handbook on the economics of corruption (pp. 3–51). Cheltenham, UK: Edward Elgar.
Lambsdorff, J. G. (2006b). Measuring Corruption – The Validity and Precision of Subjective Indicators (CPI). In C. Sampford, A. Shacklock, C. Connors, & F. Galtun (Eds.), Measuring Corruption (pp. 81–100). Aldershot, UK: Ashgate.
Lambsdorff, J. G. (2007). The Institutional Economics of Corruption and Reform: Theory, Evidence and Policy. Cambridge, UK: Cambridge University Press.
Mihály Fazekas: Quality of government and institutionalised grand corruption in public procurement, PhD dissertation
226
Lange, M. (2005). The Rule of Law and Development: A Weberian Framework of States and State-Society Relations. In States and Development. Historical Antecedents of Stagnation and Advance (pp. 48–66). New York: Palgrave Macmillan.
Lengwiler, Y., & Wolfstetter, E. (2006). Corruption in procurement auctions. In N. Dimitri, G. Piga, & G. Spagnolo (Eds.), Handbook of Procurement (pp. 412–429). Cambridge, UK: Cambridge University Press.
Leuven, E., & Sianesi, B. (2003). PSMATCH2: Stata module to perform full Mahalanobis and propensity score matching, common support graphing, and covariate imbalance testing.
Mahoney, C. (2008). Brussels Versus the Beltway. Advocacy in the United States and the European Union. Washington, DC: Georgetown University Press.
Major Dezsériné, M. (2003). Nature of corruption in the public procurement in Hungary. Budapest.
Mann, M. (1984). The autonomous power of the state. Oxford, UK: Blackwell.
Mauro, P. (1998). Corruption and the composition of government expenditure. Journal of Public Economics, 69, 263–279.
Meagher Patrick. (1997). Combatin corruption in Africa: Institutional challenges and responses. Maryland, US.
Meyer-Sahling, J.-H. (2009). Sustainability of Civil Service Reforms in Central and Eastern Europe. Five Years After EU Accession. Paris: OECD.
Meyer-Sahling, J.-H. (2011). The Durability of EU Civil Service Policy in Central and Eastern Europe after Accession. Governance: An International Journal of Policy, Administration and Institutions, 24(2), 231–260. doi:10.1111/j.1468-0491.2011.01523.x
Morris, S. D. (2008). Disaggregating Corruption: A Comparison of Participation and Perceptions in Latin America with a Focus on Mexico. Bulletin of Latin American Research, 27(3), 388–409.
Moss, T. J., Pettersson, G., & van de Walle, N. (2006). An Aid-Institutions Paradox? A Review Essay on Aid Dependency and State Building in Sub-Saharan Africa. Center for Global Development Working Paper No. 74.
Mungiu-Pippidi, A. (2006). Corruption: Diagnosis and Treatment. Journal of Democracy, 17(3), 86–99.
Mungiu-Pippidi, A. (2007). EU Accession is no “End of History.” Journal of Democracy, 18(4), 8–16.
Mihály Fazekas: Quality of government and institutionalised grand corruption in public procurement, PhD dissertation
227
Mungiu-Pippidi, A. (Ed.). (2011). Contextual Choices in Fighting Corruption: Lessons Learned. Oslo: Norwegian Agency for Development Cooperation.
Mungiu-Pippidi, A. (Ed.). (2013). Controlling Corruption in Europe. The Anticorruption Report 1. Berlin: Barbara Budrich Publishers.
North, D. C., Wallis, J. J., & Weingast, B. R. (2009). Violence and Social Orders. A Conceptual Framework for Interpreting Recorded Human History. Cambridge, UK: Cambridge University Press.
Nye, J. S. (1967). Corruption and Political Development: A Cost-Benefit Analysis. The American Political Science Review, 61(2), 417–427.
OECD. (1998). Preparing Public Administrations for the European Administrative Space. Paris.
OECD. (1999). European Principles for Public Administration. Paris.
OECD. (2007). Integrity in Public Procurement. Good Practice from A to Z. Paris: OECD.
OECD. (2009). OECD Principles for Integrity in Public Procurement. Paris: OECD.
OECD. (2010a). Public Procurement in EU Member States - The Regulation of Contract Below the EU Thresholds and in Areas not Covered by the Detailed Rules of the EU Directives. Paris. doi:http://dx.doi.org/10.1787/5km91p7s1mxv-en
OECD. (2010b). Collusion and Corruption in Public Procurement. Paris: OECD.
OECD. (2011). Government at a Glance. Paris: OECD.
OECD. (2013). Government at a Glance 2013. Paris: OECD.
Olken, B. A. (2006). Corruption and the costs of redistribution: Micro evidence from Indonesia. Journal of Public Economics, 90(4–5), 853–870.
Olken, B. A. (2007). Monitoring Corruption: Evidence from a Field Experiment in Indonesia. Journal of Political Economy, 115(2), 200–249.
Olken, B. A., & Pande, R. (2012). Corruption in Developing Countries. Boston, Massachusetts.
Olsen, J. P. (2005). Maybe It Is Time to Rediscover Bureaucracy. Journal of Public Administration Research and Theory, 16(1), 1–24.
on the coordination of procedures for the award of public works contracts, public supply contracts and public service contracts (2004). Luxembourg: Euroepan Parliament and the Council.
Mihály Fazekas: Quality of government and institutionalised grand corruption in public procurement, PhD dissertation
228
Ostrom, E. (1996). Crossing the great divide: Coproduction, synergy, and development. World Development, 24(6), 1073–1087.
Oszlak, O. (2005). State Bureaucracy: Politics and Policies. In T. Janoski, R. R. Alford, A. M. Hicks, & M. A. Schwartz (Eds.), The Handbook of Political Sociology. States, civil societies, and globalization (pp. 489–505). Cambridge, UK: Cambridge University Press.
Oživení. (2011). Openness of Tender Procedures in the Czech Republic. Prague: Oživení.
Painter, M., & Pierre, J. (2005). Unpacking Policy Capacity: Issues and Themes. In M. Painter & J. Pierre (Eds.), Challenges to State Policy Capacity. Global Trends and Comparative Perspectives (pp. 1–18). New York: Palgrave Macmillan.
Pálinkó, É., Szántó, Z., & Tóth, I. J. (2008). Üzleti korrupció Magyarországon – vállalatvezetők szemszögéből Interjúelemzés. In Z. Szántó & I. J. Tóth (Eds.), Korrupciós kockázatok az üzleti szektorban – kutatási háttértanulmányok (pp. 35–54). Budapest: Budapesti Corvinus Egyetem.
Papanek, G. (2009). A korrupció és a közbeszerzési korrupció Magyarországon. I. kötet. Budapest.
Pardo, I. (2004). Where it hurts: an Italian case of graded and stratified corruption. In Between Morality and Law: Corruption, Anthropology and Comparative Society (pp. pp. 33–52). Cornwall, UK: MPG Books.
Pierre, J., & Peters, B. G. (2005). Governing complex societies: trajectories and scenarios. New York: Palgrave Macmillan.
Piga, G. (2011). A fighting chance against corruption in public procurement? In S. Rose-Ackerman & T. Soreide (Eds.), International Handbook on the Economics of Corruption, Volume Two (pp. 141–181). Cheltenham, UK: Edward Elgar.
Polányi, K. (1957). The Great Transformation. Boston: Beacon Hill.
Polidano, C. (2000). Measuring Public Sector Capacity. World Development, 28(5), 805–822.
Porta, R. La, Lopez-de-Silanes, F., Shleifer, A., & Vishny, R. (1999). The Quality of Goverment. Journal of Law, Economics, and Organization, 15(1), 222–279.
Pricewaterhouse Coopers. (2013). Identifying and reducing corruption in public procurement in the EU. Brussels: PricewaterhouseCoopers and Ecorys.
Radelet, S. (2002). Qualifying for the Millennium Challenge Account.
Radelet, S. (2003). Bush and Foreign Aid. Foreign Affairs, 82(5), 104–117.
Mihály Fazekas: Quality of government and institutionalised grand corruption in public procurement, PhD dissertation
229
Rauch, J. E., & Evans, P. B. (2000). Bureaucratic structure and bureaucratic performance in less developed countries. Journal of Public Economics, 75(1), 49–71.
Reinikka, R., & Svensson, J. (2004). Local Capture: Evidence From a Central Government Transfer Program in Uganda. The Quarterly Journal of Economics, 119(2), 678–704.
Rose, R., & Peiffer, C. (2012). Paying Bribes to Get Public Services: A Global Guide to Concepts and Survey Measures. Glasgow, UK: Centre for the Study of Public Policy.
Rose-Ackerman, S. (1978). Corruption: A Study in Political Economy. New York: Academic Press.
Rothstein, B. (2011). Anti-Corruption: The Indirect “Big-Bang” Approach. Review of International Political Economy, 18(2), 228 — 250.
Rothstein, B., & Teorell, J. (2008). What Is Quality of Government? A Theory of Impartial Government Institutions. Governance, 21(2), 165–190.
Rothstein, B., & Torsello, D. (2013). Is corruption understood differently in different cultures? Anthropology meets Political Science. QoG Working Paper Series 2013:5, Gothenburg.
Rueschemeyer, D. (1983). Professional Autonomy and the Social Control of Expertise. In R. Dingwall & P. Lewis (Eds.), The Sociology of the Professions. London: Macmillan.
Sampford, C., Shacklock, A., Connors, C., & Galtung, F. (Eds.). (2006). Measuring Corruption. Aldershot, UK: Ashgate.
Schultz, J., & Soreide, T. (2008). Corruption in emergency procurement. Disasters, 32(4), 516–536. doi:10.1111/j.1467-7717.2008.01053.x
Seligson, M. A. (2002). The impact of corruption on regime legitimacy: a comparative study of four Latin American countries. Journal of Politics, 64, 408–433.
Sequeira, S. (2012). Advances in Measuring Corruption in the Field. In D. Serra & L. Wantchekon (Eds.), New Advances in Experimental Research on Corruption (pp. 145–176). Bingley, UK: Emerald Group Publishing Limited.
Skocpol, T., & Finegold, K. (1982). State Capacity and Economic Intervention in the Early New Deal. Political Science Quarterly, 97(2), 255–278.
Slinko, I., Yakovlev, E., & Zhuravskaya, E. (2004). Effects of State Capture: Evidence from Russian Regions. In J. Kornai & S. Rose-Ackerman (Eds.), Building a trustworthy State in Post-Socialist Transition (pp. 119–132). New York: Palgrave Macmillan.
Mihály Fazekas: Quality of government and institutionalised grand corruption in public procurement, PhD dissertation
230
Soifer, H. (2008). State Infrastructural Power: Approaches to Conceptualization and Measurement. Studies in Comparative International Development, 43(3/4), 231–251.
Soifer, H., & vom Hau, M. (2008). Unpacking the Strength of the State: The Utility of State Infrastructural Power. Studies in Comparative International Development, 43(3/4), 219–230.
Soreide, T. (2002). Corruption in public procurement Causes, consequences and cures. Bergen, Norway.
Soreide, T. (2006). Corruption in international business transactions: the perspective of Norwegian firms. In S. Rose-Ackerman (Ed.), International Handbook on the Economics of Corruption (pp. 381–417). Cheltenham, UK: Edward Elgar.
Soudek, J., & Skuhrovec, J. (2013). Public Procurement of Homogeneous Goods: the Czech Republic Case Study. IES Working Paper 05/2013. IES FSV. Prague: Charles University.
State Audit Organisation. (2008). Jelentés a közbeszerzési rendszer működésének ellenőrzéséről. Budapest.
Strand, I., Ramada, P., & Canton, E. (2011). Public procurement in Europe. Cost and effectiveness. London: PricewaterhouseCoopers, London Economics and Ecorys.
Szántó, Z., & Tóth, I. J. (2008). Business corruption in Hungary: From various angles. Research summary. In Z. Szántó & I. J. Tóth (Eds.), Korrupciós kockázatok az üzleti szektorban – kutatási háttértanulmányok (pp. 75–98). Budapest: Nyitott Könyvműhely.
Szántó, Z., Tóth, I. J., & Varga, S. (2012). The social and institutional structure of corruption: some typical network configurations of corruption transactions in Hungary. In B. Vedres & M. Scotti (Eds.), Networks in Social Policy Problems. Cambridge, UK: Cambridge University Press.
Szántó, Z., Tóth, I. J., Varga, S., & Cserpes, T. (2010). Gazdasági érdekcsoportok, szabályozási kudarcok, járadékvadászat és korrupció. Budapest.
Szente, Z. (Ed.). (2011). Elemzések a Közszféra korrupciós kockázatairól. Budapest: Állami Számvevőszék.
Tanzi, V., & Davoodi, H. (2001). Corruption, growth, and public finances. In A. K. Jain (Ed.), The Political Economy of Corruption (pp. 89–110). New York: Routledge.
Tanzi, V., & Davoodi, H. R. (1997). Corruption, Public Investment, and Growth. Washington, DC.
Mihály Fazekas: Quality of government and institutionalised grand corruption in public procurement, PhD dissertation
231
Thai, K. V. (2009). International Public Procurement: Concepts and Practices. In K. V Thai (Ed.), International handbook of public procurement (pp. 2–24). London: CRC Press.
Tilly, C. (1985). War making and state making as organized crime. In P. B. Evans, D. Rueschemeyer, & T. Skocpol (Eds.), Bringing the state back in (pp. 169–191). Cambridge, UK: Cambridge University Press.
Torsello, D. (2012). The New Environmentalism?: Civil Society and Corruption in the Enlarged EU. Farnham, UK: Ashgate.
Tóth, I. J., & Márkus, M. (2010). Jogkövető Magatartás A Magyar Állami Intézményekben. Minisztériumok és háttérintézmények honlapjainak statisztikai elemzése és az intézmények sorrendje az ETI szerint – 2010. Budapest.
Transparency International. (2006). Handbook for Curbing Corruption in Public Procurement. Berlin: Transparency International.
Transparency International. (2012a). Gateway: Mapping The Corruption Assessment Landscape. Berlin: Transparency International.
Transparency International. (2012b). Money, politics, power: corruption risks in europe. Berlin: Transparency International.
Transparency International Slovakia. (2009). Open public procurement. Retrieved October 08, 2013, from http://tender.sme.sk/en/pages/about
Várday, G. (2005). A hazai közbeszerzés egy gyakorló szakértő szemével. In T. Tátrai (Ed.), Közbeszerzési kézikönyv nem csak pályázóknak (pp. 189–208). Budapest: Szaktudás Kiadó Ház.
Von Lampe, K. (2008). Organized Crime in Europe: Conceptions and Realities. Policing, 2(1), 7–17. doi:10.1093/police/pan015
Ware, G. T., Moss, S., Campos, J. E., & Noone, G. P. (2007). Corruption in Public Procurement: A Perennial Challenge. In J. E. Campos & S. Pradhan (Eds.), The Many Faces of Corruption. Tracking Vulnerabilities at the Sector Level. Washington, DC: World Bank.
Warren, M. E. (2003). What Does Corruption Mean in a Democracy? American Journal of Political Science, 48(2), 328–343.
Weber, M. (1978). Economy and society. (G. Roth & C. Wittich, Eds.). Berkeley: University of California Press.
Wedel, J. R. (2003). Clans, cliques and captured states: rethinking “transition” in Central and Eastern Europe and the former Soviet Union. Journal of International Development, 15(4), 427–440.
Mihály Fazekas: Quality of government and institutionalised grand corruption in public procurement, PhD dissertation
232
Weiss, L. (1998). The myth of the powerless state. Ithaca, NY: Cornell University Press.
Weiss, L. (2005). Infrastructural power, economic transformation, and globalization. In J. A. Hall & R. Schroeder (Eds.), An Anatomy of Power. The Social Theory of Michael Mann (pp. 167–186). Cambridge, UK: Cambridge University Press.
World Bank. (2006). Administrative Capacity in the New Member States: The Limits of Innovation? Washington, DC.
World Bank. (2007). Corruption Warning Signs. Is Your Project at Risk? Washington, DC: World Bank.
World Economic Forum. (2010). The Global Competitiveness Report 2010–2011. Geneva, Switzerland: World Economic Forum.
Ziblatt, D. (2008). Why Some Cities Provide More Public Goods than Others: A Subnational Comparison of the Provision of Public Goods in German Cities in 1912. Studies in Comparative International Development, 43(3/4), 273–289.


![Prometheus Bound by Aeschylus and Prometheus Unbound by … · 2014-05-19 · Prometheus Bound by Aeschylus and Prometheus Unbound by Percy Bysshe Shelley: [Prometheus Unbound] Translated](https://img.pdfslide.us/doc/110x75/5e6b69d324985e52ae4c9922/prometheus-bound-by-aeschylus-and-prometheus-unbound-by-2014-05-19-prometheus.jpg)