Embed Size (px)
Citation preview

http://repository.osakafu-u.ac.jp/dspace/
Title On Cavity Flow Simulating Vortex Induced in the Low Q Low V Layer
Author(s) Kinoshita, Osamu; Shibuya, Hidetoshi; Ito, Hidebumi
Editor(s)
CitationBulletin of University of Osaka Prefecture. Series A, Engineering and nat
ural sciences. 1986, 35(1), p.93-100
Issue Date 1986-10-31
URL http://hdl.handle.net/10466/8442
Rights

93
On Cavity Kow Simulating Vortex induced
in the Low Q Low V Layer
Osamu KINOSHrTA", Hidetoshi SHIBuYA* and Hidebumi IT6"
(Received June 16, 1986)
Two types of cavity flow are investigated experimentaHy and computationally as
models simulating vortex which would be induced in the low Q low V layer by a sub-
siding oceanic plate in a trench-arc system.. In Model .I, the cavity is bounded by semi-
infinite parallel walls and a cavity mouth ,intersects them obliquely with angle e. In .
Model ll, the wedge-shaped corner of the cavity is partly replaced by solid. As a result,
the position of vortex center and the total fiow quantity of vortex in Model ll scare-
cely vary froni those in Modgl I, until the maximum thickness of the solid part
becomes avalue which is about three eighths of the thickuessof the fiuid layer for small
angles as e = 30e and 450 or a quarter for 1arge angles as 60e and 75e.
1. Introduction
In a trench-arc system, it has been constdered that vortex is induced in the low Q
low V layer by a subsiding oceanic platei'2). This can be modeled as the two-dirnen-
sional cavity flow having the shape as shown in Fig. 1, where the operating fluid is
contained in AB'DE, parabel wdls AB' and DE are fixed and B'D is a moving wall with
a constant speed. The flow is steady and has a characteristic of very low Reynolds
number. Investigation of this cavity fiow has shown a result that shear stress along the
moving wah is very large near the point B'2). Therefbre the downgoing slab would not
induced any flow near the wedge corner of B' to slip against mantle. Thus " is desirable
that the wedge-shaped corner BB'C is replaced by solid, where BC may correspond to
the aseismic front. In this paper, the former AB'DE ahd the latter ABCDE are called
Model I and Model ll respectively, and the both vortexes are compared. The investiga-
tions are done by experiments for various dip angle e and by computational simula-
tions for e = 450. Kinoshita and It6 have taken charge of the experiments ar}d .Shibuya
Fig. 1
> 6{viE;)c
7.
Mustrative diagram of cavity rnodels. Model I: AB'DE, Model H: ABCDE, SP: stagnation
point, VC: vortex center.
* College of Integrated Arts and Sciences.

94 Osarnu KINOSHITA, Hidetoshi SHIBUYA and Hidebumi IT6
has done charge of the computational simulations.
2. AnalysesbyExperiments
The experimental method has been mentioned in It6 et al.2) and Kinoshita and
It63). The photographs of flow patterns fOr Model I have been also shown for dip angles
e = goO , 7sO ,600 ,450 and 3002). In this paper, fbr each of these dip angles, BC is taken
to be a quarter of the thickness L of the fluid layer and moreover for e =300, BC
= 3L18 and L12 are added. In Fig. 2 the flow patterns obtained for Model ll are shown.
An actual size of the thickness L is 4 cm for all photographs, These photographs are
taken by means of switching on and off the light with switching interval 5 seconds. The
illuminated paths are trajectories of minute air bubbles mixed in the operating fluid
(water glass). In order to obtain the velocity distribution of flow as well as the flow
pattern, four switching intervals of 5, 10, 20 and 30 seconds have been used, because
lengths of the trajectories depend largely on the position of flow. Each of the photo-
graphs for Model I shown in the previous paper2) was taken in 2 minute exposure to
obtain only the flow pattern. In that case, as very minute bubbles were used, delicate
streamlines were photographed. To obtain the velocity distribution, however, slightly
larger bubbles are suitable as seen in Fig. 2.
ag・ eskStw' ・
' ' stFs(
"・i:・mell:lee:gEl±, s}・・.,"・.)..fw..'/kwu..ew
miy.g e{
l 'A'g-.'".v..
tt' k,, i. s'. . v.' . e'`.・:"
S・,
E';
Fig. 2 Flow patterns of Model ll photographed
by mearis of switching on and off a dght.
The left fbur photographs are in the con--
ditions of BC = L/4 and e = 900, 750, 6oO
and 450. TIhe right three ones are in e =
300 and BC = L/4, 3L/8 and L12.

On thvity jF7bw Simulating Vbrtex Induced in the Low e Low VLayer 95
In these photographs the first vortex is seen sharply, but the second vortex is not
well observed, which is induced by the first vortex. Hence, only the first vortex is taken
up in the experiment.
Figure 3 shows the positions of the vortex center for various dip angles e in Models
I and ll, where the vertical and horizontal scales are normalized by L and each of the
inclined 1ines shows the moving wal1. The positions of the vortex center in Model ll
with BC = L/4 are considered to be almost the same with those in the Model I except-
ing e = 900. There is a tendency that, when the dip angle ofmoving wall decreases, the
vorteX center moves away gradually from the moving wall. When e = 900, the vortex
center for BC = L/4 shifts distinctly from that in Model I. When e = 300, the vortex
center does not shift till BC becomes 3L/8, but the vortex center for BC =L/2 shifts
distinctly.
Figure 4 shows the relationship between the dip angle e and the position of stagna-
tion point, where s is the distance from the wedge corner B' to the stagnation point
Horizontal Distance
1.5 1.0 O.5 O
3oe" ue ge
o45
6of os
7so
%9ct
OA
O.5
1.0
o2
2.9
o-eso=Le)
Fig. 3 Positions of the vortex center obtained by experiments for Models I and ll. Each of inclined
lines shows the moving wall. Vertica! and horizontal scales are norrnalized by the thickness
L of fluid layer. Circle; BC = O, triangle; BC = L/4, square; BC = 3L18, star; BC = L/2.
4EL
3
2
1
Fig. 4
30 50 .70 90 eo
Relation between dip angle e and position of the stagnation point. The length s is measured
from the wedge corner B'. 'The symbols are the same as Fig. 3.

96 Osamu KINOSHITA, Hidetoshi SHIBUYA and Hidebumi IT6
dividing the first vortex and the second one (re£ Fig. 1). As 'seen in Fig. 2, it is ambi-
guous to settle the stagnation point from only one photograph. The settlement has been
done by comparing many photographs with different switchng intervals. The stagna-
tion points of Model " examined here are almost unchanged from ones ofModel I. This
figure is usefu1 to know an extent of the first vortex.
Figure 5 is a comparison between streamlines of Model I and those ofModel ll
for e = 300, where each streamline is affixed by a value of the normalized stream func-
tion. Figures 5(a) and (b) have been already"obtained by Kinoshita and It63) and
Kinoshita et al.4) respectively. A boundary (AB'DE in Model I or ABCDE in Model ll) is
one streamline. The stream function W' is a volume of flow between the streamline and
the boundary, provided sP' = O at the boundary. The values of stream function in Fig, 5
were calculated by this way from velocity distribution (ref. Fig. 2). The normalized one
Wis given by ,W = W'/ VbL ,
where Vb is velocity of the moving wdl. Values of the stream function at the vortex
center in Figs. 5(a) and (b) are O.123 and O.124 respectively, being nearly equal. How-
ever, it is noteworthy that the former is a little less than the latter as wru be mentioned
later.
(a)
".OIS
.S%
va
(b)Fig. 5 Streamlines with values of stream function for e = 300.
The stream function at the vortex center is a total volume of flow of the first
vortex. These values for e = 300, 600 and 900 in Model I have been obtained to be
O.123, O.109 and O.105 respectively3). The values fbr e = 450 and 750 in Model I may
be estimated by an interpolation to be O.114 and O.106 respectively. Since the total
volume of flow equais that between the vortex center and the moving wall, it must be
concerned closely with the position of vortex center. The relation between the total
volume of flow and the dip angle in ModelIis consistent with the tendency in Fig.3
that the vortex center is far off from the moving wak with decreasing dip angle. On the
t,

On thvity 177ow Simulating Vbrtex kiduced in the Low e Low VLayer 97
other hand, if the positions in Models I and ll are the same, their total volumes of flow
are also the same. When e =300, the volume of flow is considered to be ngarly constant
tM BC becomes 3L/8. Also the total v61ume of flow in Model ll with BC =L/4 for each
ofe =450, 600 and 750 is estimated to be the same as that in ModelI, Whene =900,
the total volume of flow with BC =L14 must be smaller than that with BC =O, because
the former vortex center is nearer to the moving wal1 than the latter one.
3. AmalysesbyComputationalSimulation
In order to confirm the experimental results, a series of computational simulation
analyses for e =450 with various ratio ofBC/L and for e =900 was perfbrmed.
The models calculated are two-dimensional. Since the Reynolds number of the flow
concerned is extremely small, the governing equation for the two-dimensional flow is
74 w =O
where 0 is stream function related with velocity components (u, v) by the following
equations.
awu=- 07
owv= ax
The boundary conditions assumed in the series of e = 450 are as fonows: Firstly, the
stream function equals zero on all the boundaries, secondly, the velocity is zero at the
top (AB in Fig. 1), the bottom (DE) and the vertical portion of right end (BC) of the
cavity, thirdly, at the left end of the cavity (AE), the horizontal component of velocity
is zero, and lastly the diagonal portion of the right end (CD) moves at unit velocity,
where the thickness of the cavity (L) is taken as the unit length, For e = 900, the whole
right vertical boundary' moves at unit velocity, while other boundary conditions are the
same as fbr e =450.
To solve this problem, we employed finite differential method. The dimension of
the mesh used for the calculation was 33 × 97, and the triangular portion out of the dia-gonal moving boundary fbr the series of e = 450 was filled with tero. ln a case of
e = 450 and BC = O calculations with reduced meshes of 5 × 13, 9 × 25 and 17× 49
were made in order to assess the error due to finite mesh, and the difference of maxi-
mum value of the stream function between the finest mesh and the second flnest mesh
was found to be less than 1%. The matrix was solved using ILUCR (Incomplete LUdecomposition and Coajugate Residual) method5), because of its significant advantage
both on storage consumption and speed. A FORTRAN program for ILUCR was codedby Shibuya, one of the authors, modifying the program presented in Murata et al.5).
The machine used is NEC ACOS-850/8 system situated in Computer Center, University
of Osaka Prefecture.
The results are Mustrated in Figs.6 and 7. Figure 6 shows visually how pattern of the
98 Osamu KINOSHITA, Hidetoshi SHIBUYA and Hidebumi IT6
=!.!. #!.:.;:. r ll;I# ===± :-::x--".. :::; t ==== s -==== :!!l i'#:' =;x=;
!#=:..6aCl:llllij1
==-==.
=
".-----""-....--
tnyt-,mpagge
tt= ;==tipeoQ
=t
ntttt===stt=====ttys,,mmeqnmX
==
'"'--"-'--r"---"
l-"=l# tL=ttt=lttttt=±Sl=t ====tt=== ttt s=====t =sll-=#= =="`" #lg:¢ll;[W.liigelllliiliTtgagu'
==-==-
=:ii'
=lll-i-:=
i:;:':'
illl
=l-ili
il!:`
`
ii51Riijp
=l
=l
t ============= =============-t-=
=±;=== ====t==±t ======= =='i" ltiiig::i,ljge
t=
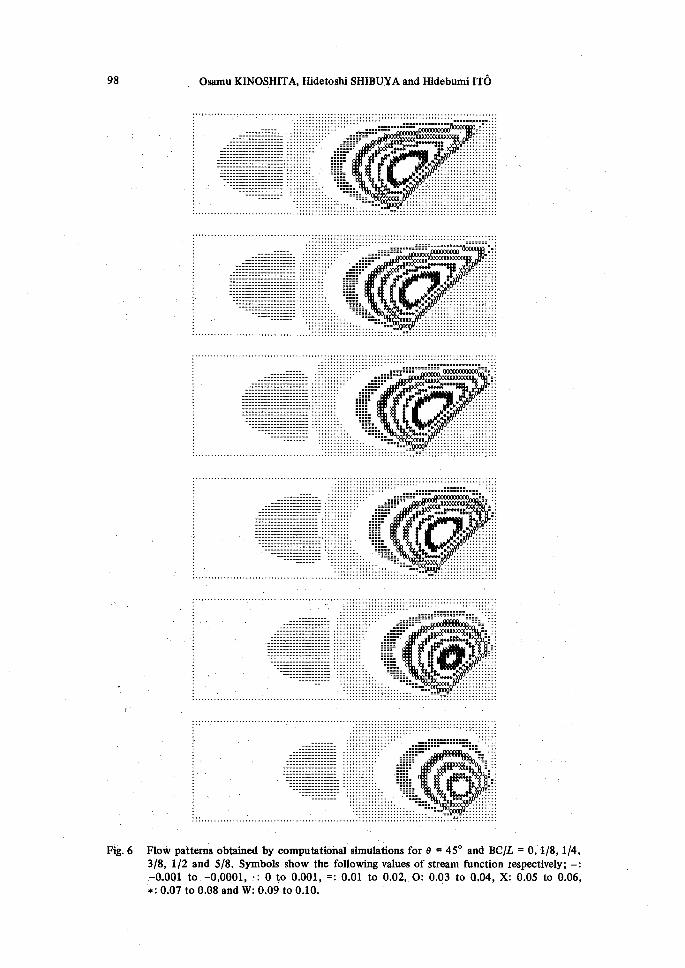
Ftg. 6 Flow patterns obtained by eomputational simulations for e = 450 and BC/L ± O, 1/8, 1/4,3/8, 1/2 and 5/8. Symbols show the fo11owing yalues of stream function respectively; -.
-e.ool to -o.oool, ・: o to o.eol, =. o,ol to o.o2, o: o.o3 to Q,o4, x: e.os to o.o6,
*: O.07 to e.08 and W・ O.09 to e.10.
On Cbvity jF7ow stnulating Vbrtex Indueed in the Low e Low ・V'Layer ・99
Fig. 7
・1::::'::::::・・・・・・・・・,・,,,,.,t・,,・・・・・・・・・・・・・・,・・,''''''':::1・I・'il・I'IIIi.lliillliiill:i:::==;,'-:;;;;;I
gl#,eet-ii:,,tiv9,i,,,,,iii9iP,l
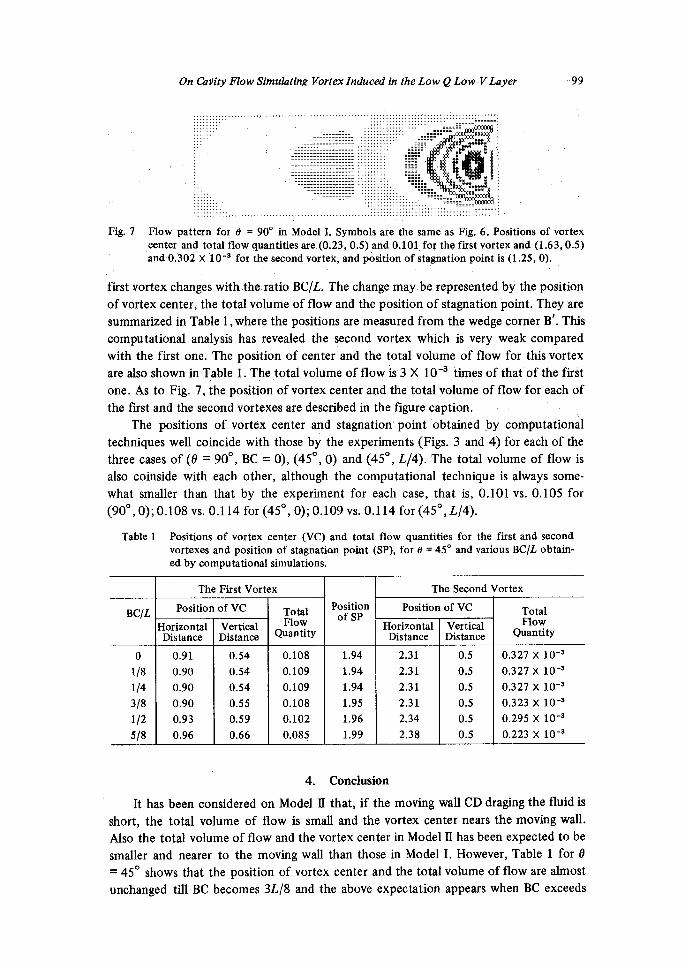
Flow pattern for e = 9ee in Model I. Symbols are the same as Fig. 6. Positions of vortex
.center and total fiow quantities are. (O.23, O.5) and O.101, fo; ths first vortex and (1.63, O.5)
and O,302 × 1O-3 for the second vortex, and position of stagnation point is (1.25, O).
first vortex changes with.the ratio BC/L. The change may be represented by the position
of vortex center, the total volume of flow and the position of stagnation point. They are
summarized in Table 1 , where the positions are measured from the wedge corner B'. This
computational analysis has revealed the secgnd vortex which is very weak compared
with the first one. The position of center and the total volume of flow for this vortex
are also shown in Table 1. The ,total volume of flow is 3 X 1O-3 times of that of the first
one. As to Fig. 7, the position of vortex center and the total volume of flow for each of
the first and the second vortexe・s are described in ・the figure' caption. ・ -
The po'sitions of vortex center and stagnation' point obtained by computational
techniques well coincide with those by the experiments (Figs. 3 and 4) for each of the
three cases of (e = 900, BC = O), (450, O) and (450, L14). The total volume of flow is
also coinside with each other, although the computational technique is always some-
what smaller than that by the experjment for each case, that is, O.101 vs. O.105 for
(900, O);O.108 vs. O.114 for (450, O);O.109 vs. O.114 for (450,L14).
Table 1 Positions of vortex center (VC) and total flow quantities for the first and second
vortexes and position of stagnation・ point (SP), for e = 45e and various BC/L obtain-
ed by computational simulations.
TheFirstVortex TheSecondVortex
BC/L PositionofVC Position
ofSPPositionofVC
Horizonta1Distance
VerticalDistance
Tota1Flow
QuantityHorizonta1Distance
Vertical
Distance
Tota1
MowQuantity
o1/81/43/81125/8
O.91
O.90
O,90
O.90
O.93
O,96
O.54
O.54
O.54
O.55
O.59
O.66
O.108
O.109
O.109
O.108
O.102
O.085
1.94
1.94
1.94
1.95
1.96
1.99
2.31
2.31
2.31
2.31
2.34
2.38
O.5
O.5
O.5
O.5
O.5
O.5
O.327×10-3
O.327×10-3
O.327×10-3
O.323×10-3
O.295×10-3
O.223×lo-3
4. Conclusion
It has been considered on Model ll that, if the moving wall CD draging the fluid is
short, the total volume of flow is small and the vortex center nears the moving wad.
Also the total volume of flow and the vortex center in Model fi has been expected to be
smaller and nearer to the moving wal1 than those in Model I. However, Table 1 for e
= 450 shows that the position of vortex center and the total volume of flow are almost
unchanged till BC becomes 3L18 and the above expectation appears when BC exceeds

1OO Osamu KINOSHITA, Hidetoshi SHIBUYA aiid Hidebumi IT6
L/2. Figure 3 shows that the position of vortex center in Model fi with BC =L/4 is
almost unchenged from that in Model I, excepting e = 900. The total volume of fiow in
Model ll with BC =L/4 may be also nearly equal to that in Model I excepting e =900,
although this has been confumed for e =30e and 450 (Figs. 5 and 6). When dip angle e
tends to 900,a diffbrence between ModelI and Model ll, as for the vortex center and
the volume of flow, may be severely subject to an influence of length BC. For smaner
dip angle such as 450 or 300 the difference does not appgar, till BC becomes about
3L/8.
As seen in Fig. 5 and Table 1, there is a tendency that Model ll with stnad BCIL has
a little larger volume of fiow than Model I. Though the difference between their
volumes of flow may be not significant, the tendency is contrary to the above expecta-
tion to be noticed.
Refetences1) D?. McKenzie, Geophys. J. Roy. Astron. Soc., 18, 1 (1969).
2) H. It6, Y. Masuda and O. Kinoshha, Bull. Univ. Osaka lhef., A32, 47 (1983).
3) O.IKinoshita and H. It6, J. Fluid Oontrol, 15, 65 (1984).4) O. Kinoshita, H. It6 and Y. Masuda, Bull. Univ. Osaka ltof., A32, 65 (1983).
5) K. Murata, T. Oguni and Y. Karaki, "Super Computer, -Its application to Scientific Calcula-
tion-", p. 304, Maiuzen, Tokyo. (in Japanese) (1985).
x