Embed Size (px)
Citation preview
Agenda Item 4.a ITEM TYPE: Report (Action, Discussion, Report)
BOARD AGENDA ITEM
TITLE: Hiring and Departure Analysis
DATE: October 11, 2017
OVERVIEW:
The Hiring and Departure Analysis is an annual report completed by the Department of Human Resources. The report provides data regarding hiring and retention of employees and assists with planning for staffing each school year. As in prior years,
the report details the education and experience levels for newly hired teachers, as well as other hiring information.
We have included historical data for the acceptance rate for Carroll County Public Schools’ teaching positions and Carroll County Public Schools’ teacher attrition as
compared to the national average. The turnover rate for professional employees leaving Carroll County Public Schools in 2016-2017 is 6.88% including retirements,
resignations, and leaves of absence. The turnover rate for professional staff last year was 9.22%. The turnover rate for classified employees leaving Carroll County Public Schools in 2016-2017 is 9.46%. These rates of turnover compare favorably with other
Boards of Education in Maryland.
RECOMMENDATION/FUTURE DIRECTION: For Board information
Submitted by:
Chantress J. Baptist, Director of Human Resources
Approve/Concur:
Jonathan D. O’Neal, Assistant Superintendent of Administration
________________________________ Stephen H. Guthrie, Superintendent of Schools

Page | 1
Hiring & Departure Analysis
October 11, 2017
Carroll County Public Schools
125 North Court Street Westminster,
Maryland 21157
410-751-3000

Page | 2
Hiring Analysis
2017-2018 School Year
October 11, 2017
Data includes October 1, 2016 through August 31, 2017 period
Carroll County Public Schools
125 North Court Street Westminster,
Maryland 21157
410-751-3000
Page | 3
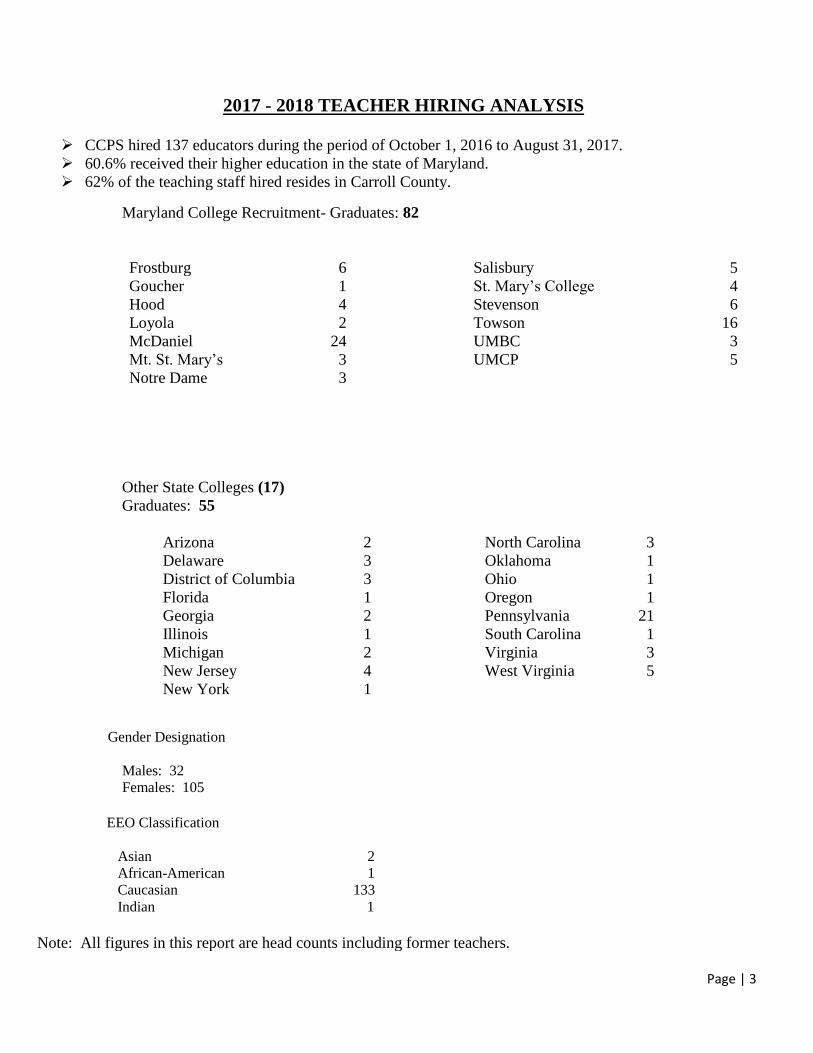
2017 - 2018 TEACHER HIRING ANALYSIS
CCPS hired 137 educators during the period of October 1, 2016 to August 31, 2017.
60.6% received their higher education in the state of Maryland.
62% of the teaching staff hired resides in Carroll County.
Maryland College Recruitment- Graduates: 82
Frostburg 6 Salisbury 5
Goucher 1 St. Mary’s College 4
Hood 4 Stevenson 6
Loyola 2 Towson 16
McDaniel 24 UMBC 3
Mt. St. Mary’s 3 UMCP 5
Notre Dame 3
44 Other State Colleges (17)
Graduates: 55
Arizona 2 North Carolina 3
Delaware 3 Oklahoma 1
District of Columbia 3 Ohio 1
Florida 1 Oregon 1
Georgia 2 Pennsylvania 21
Illinois 1 South Carolina 1
Michigan 2 Virginia 3
New Jersey 4 West Virginia 5
New York 1
Gender Designation
Males: 32
Females: 105
EEO Classification
Asian 2
African-American 1
Caucasian 133
Indian 1
Note: All figures in this report are head counts including former teachers.
Page | 4
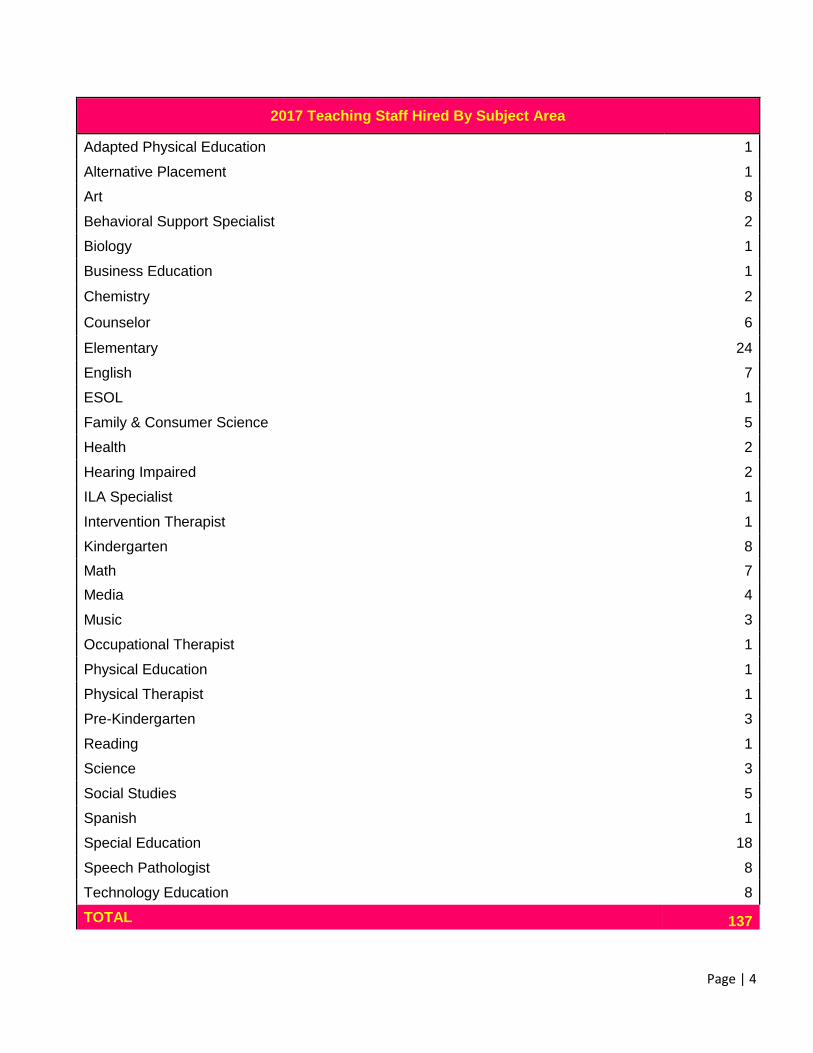
2017 Teaching Staff Hired By Subject Area
Adapted Physical Education 1
Alternative Placement 1
Art 8
Behavioral Support Specialist 2
Biology 1
Business Education 1
Chemistry 2
Counselor 6
Elementary 24
English 7
ESOL 1
Family & Consumer Science 5
Health 2
Hearing Impaired 2
ILA Specialist 1
Intervention Therapist 1
Kindergarten 8
Math 7
Media 4
Music 3
Occupational Therapist 1
Physical Education 1
Physical Therapist 1
Pre-Kindergarten 3
Reading 1
Science 3
Social Studies 5
Spanish 1
Special Education 18
Speech Pathologist 8
Technology Education 8
TOTAL 137
Page | 5
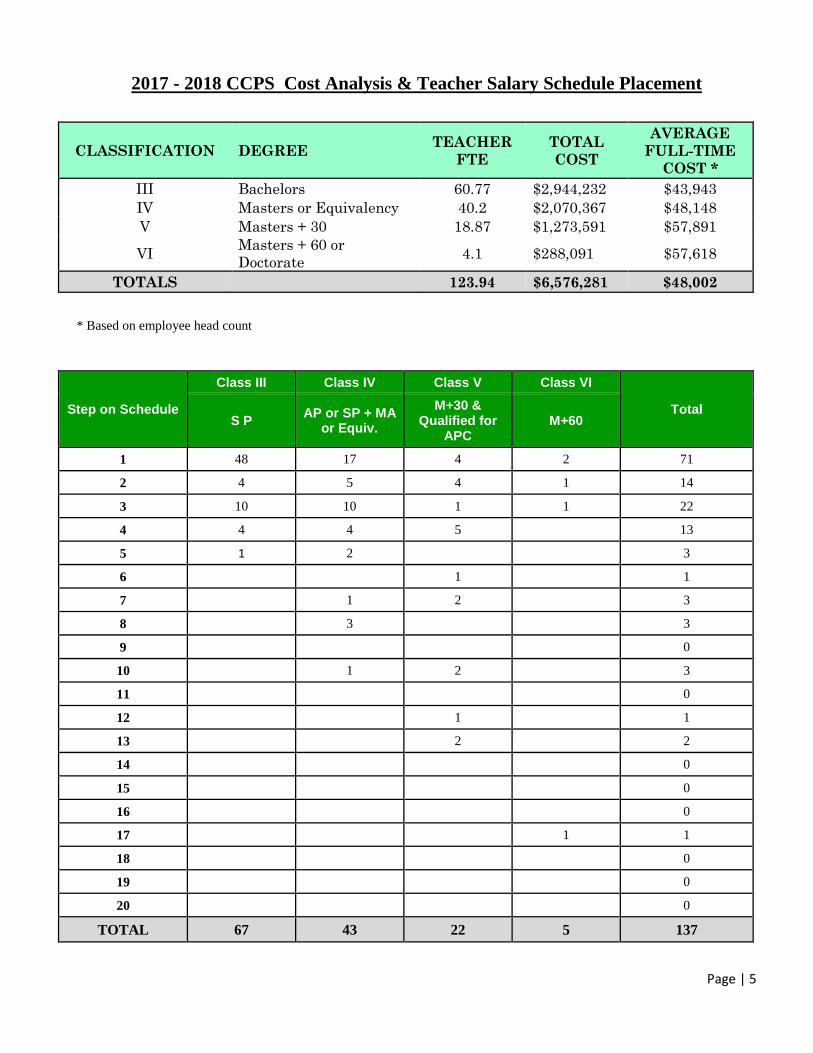
2017 - 2018 CCPS Cost Analysis & Teacher Salary Schedule Placement
CLASSIFICATION DEGREE TEACHER
FTE
TOTAL
COST
AVERAGE
FULL-TIME
COST *
III Bachelors 60.77 $2,944,232 $43,943
IV Masters or Equivalency 40.2 $2,070,367 $48,148
V Masters + 30 18.87 $1,273,591 $57,891
VI Masters + 60 or
Doctorate 4.1 $288,091 $57,618
TOTALS 123.94 $6,576,281 $48,002
* Based on employee head count
Step on Schedule
Class III Class IV Class V Class VI
Total S P
AP or SP + MA or Equiv.
M+30 & Qualified for
APC M+60
1 48 17 4 2 71
2 4 5 4 1 14
3 10 10 1 1 22
4 4 4 5 13
5 1 2 3
6 1 1
7 1 2 3
8 3 3
9 0
10 1 2 3
11 0
12 1 1
13 2 2
14 0
15 0
16 0
17 1 1
18 0
19 0
20 0
TOTAL 67 43 22 5 137
Page | 6
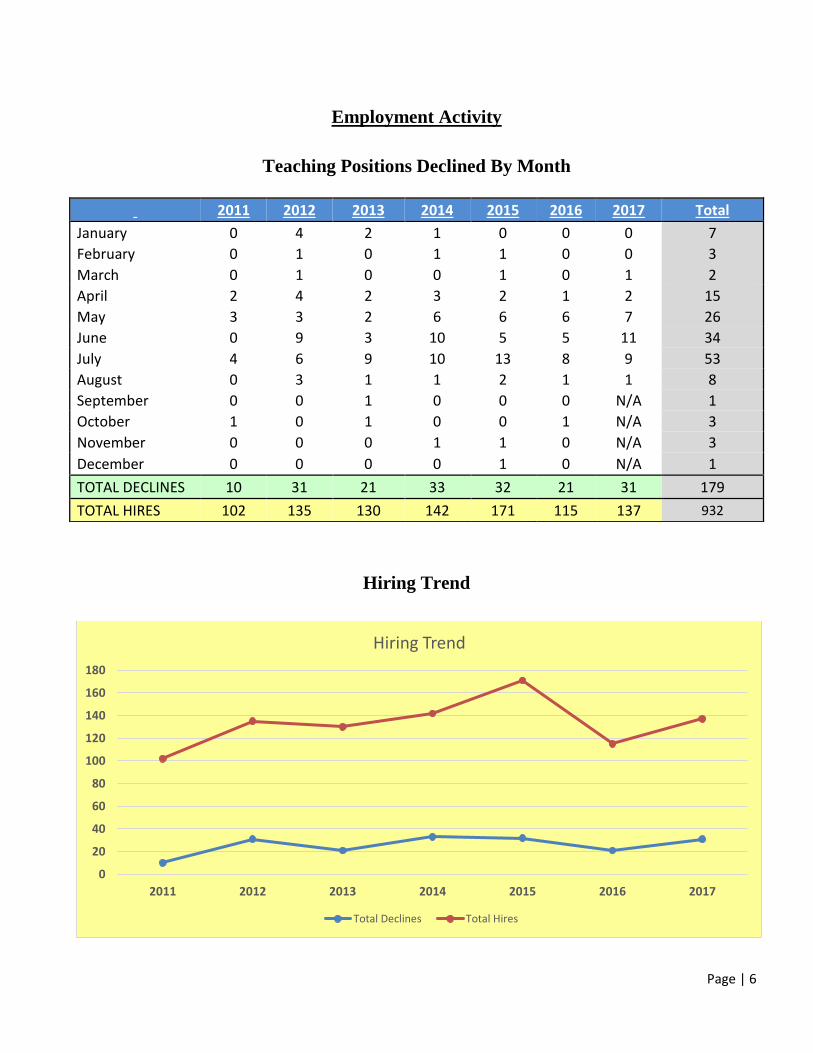
Employment Activity
Teaching Positions Declined By Month
Hiring Trend
0
20
40
60
80
100
120
140
160
180
2011 2012 2013 2014 2015 2016 2017
Hiring Trend
Total Declines Total Hires
2011 2012 2013 2014 2015 2016 2017 Total
January 0 4 2 1 0 0 0 7
February 0 1 0 1 1 0 0 3
March 0 1 0 0 1 0 1 2
April 2 4 2 3 2 1 2 15
May 3 3 2 6 6 6 7 26
June 0 9 3 10 5 5 11 34
July 4 6 9 10 13 8 9 53
August 0 3 1 1 2 1 1 8
September 0 0 1 0 0 0 N/A 1
October 1 0 1 0 0 1 N/A 3
November 0 0 0 1 1 0 N/A 3
December 0 0 0 0 1 0 N/A 1
TOTAL DECLINES 10 31 21 33 32 21 31 179
TOTAL HIRES 102 135 130 142 171 115 137 932
Page | 7
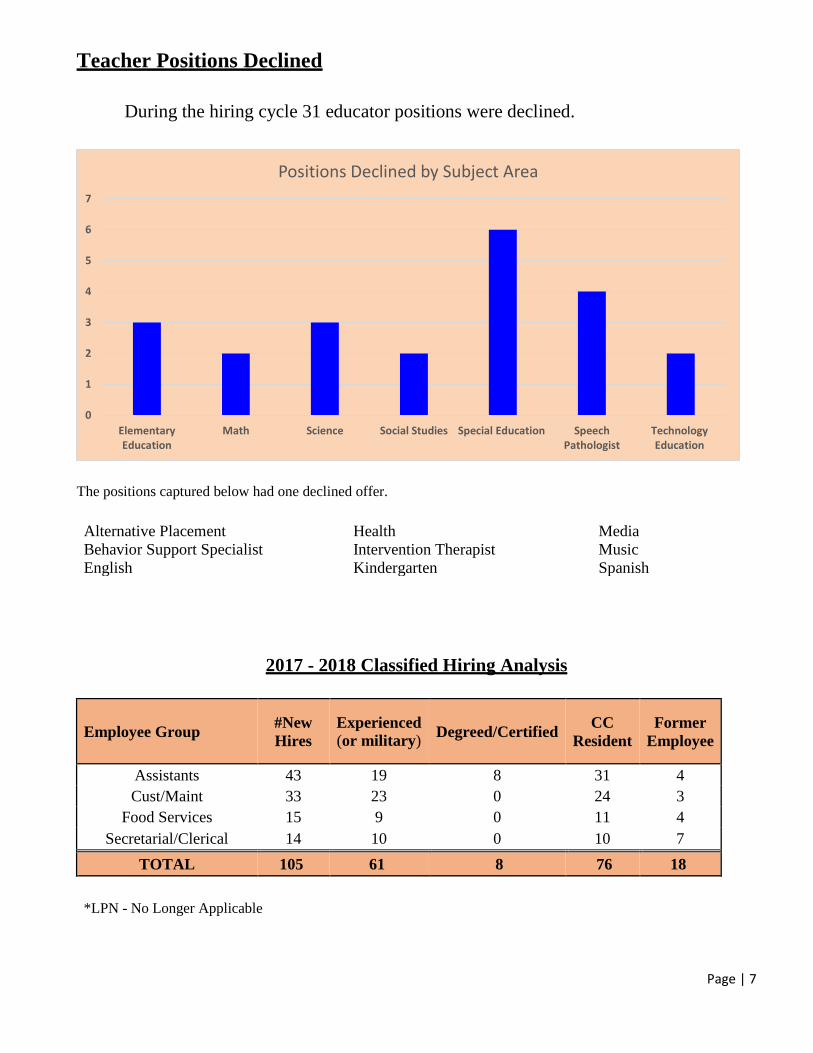
Teacher Positions Declined
During the hiring cycle 31 educator positions were declined.
The positions captured below had one declined offer.
Alternative Placement Health Media
Behavior Support Specialist Intervention Therapist Music
English Kindergarten Spanish
2017 - 2018 Classified Hiring Analysis
Employee Group #New
Hires
Experienced (or military)
Degreed/Certified CC
Resident
Former
Employee
Assistants 43 19 8 31 4
Cust/Maint 33 23 0 24 3
Food Services 15 9 0 11 4
Secretarial/Clerical 14 10 0 10 7
TOTAL 105 61 8 76 18
*LPN - No Longer Applicable
0
1
2
3
4
5
6
7
ElementaryEducation
Math Science Social Studies Special Education SpeechPathologist
TechnologyEducation
Positions Declined by Subject Area
Page | 8
Departure Analysis
October 11, 2017
Data includes October 1, 2016 through August 31, 2017 period
Carroll County Public Schools
125 North Court Street Westminster,
Maryland 21157
410-751-3000
Page | 9
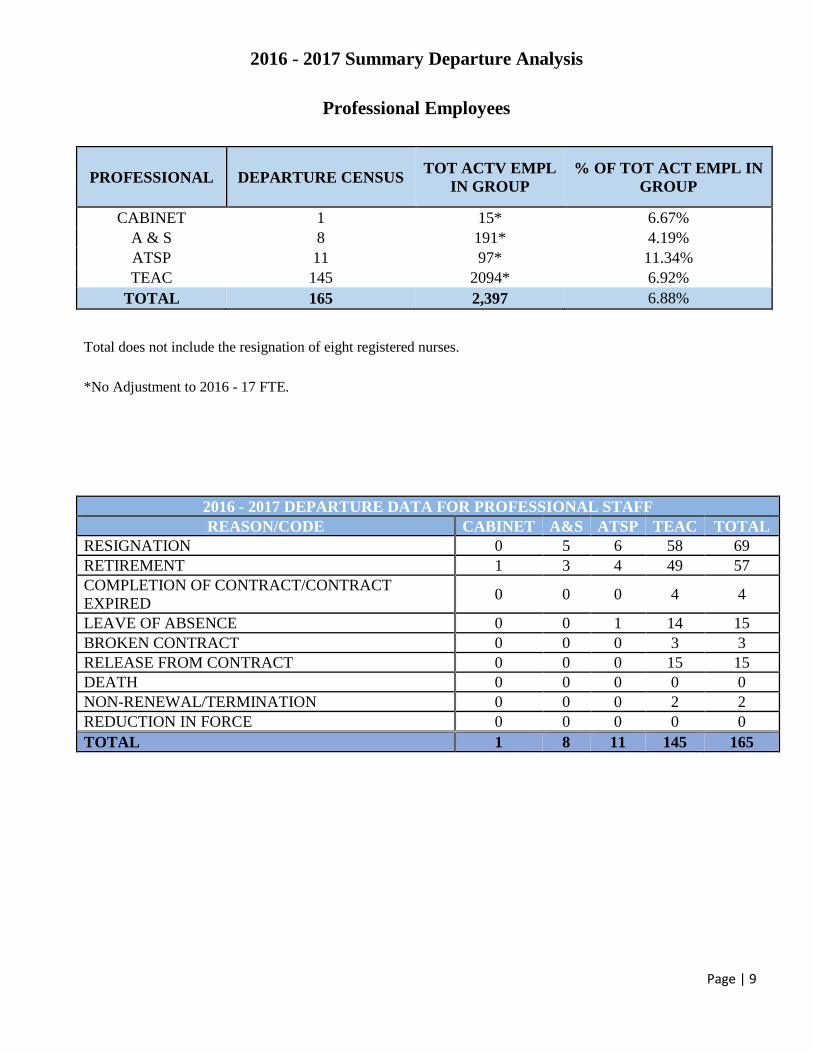
2016 - 2017 Summary Departure Analysis
Professional Employees
PROFESSIONAL DEPARTURE CENSUS TOT ACTV EMPL
IN GROUP
% OF TOT ACT EMPL IN
GROUP
CABINET 1 15* 6.67%
A & S 8 191* 4.19%
ATSP 11 97* 11.34%
TEAC 145 2094* 6.92%
TOTAL 165 2,397 6.88%
Total does not include the resignation of eight registered nurses.
*No Adjustment to 2016 - 17 FTE.
2016 - 2017 DEPARTURE DATA FOR PROFESSIONAL STAFF
REASON/CODE CABINET A&S ATSP TEAC TOTAL
RESIGNATION 0 5 6 58 69
RETIREMENT 1 3 4 49 57
COMPLETION OF CONTRACT/CONTRACT
EXPIRED 0 0 0 4 4
LEAVE OF ABSENCE 0 0 1 14 15
BROKEN CONTRACT 0 0 0 3 3
RELEASE FROM CONTRACT 0 0 0 15 15
DEATH 0 0 0 0 0
NON-RENEWAL/TERMINATION 0 0 0 2 2
REDUCTION IN FORCE 0 0 0 0 0
TOTAL 1 8 11 145 165
Page | 10
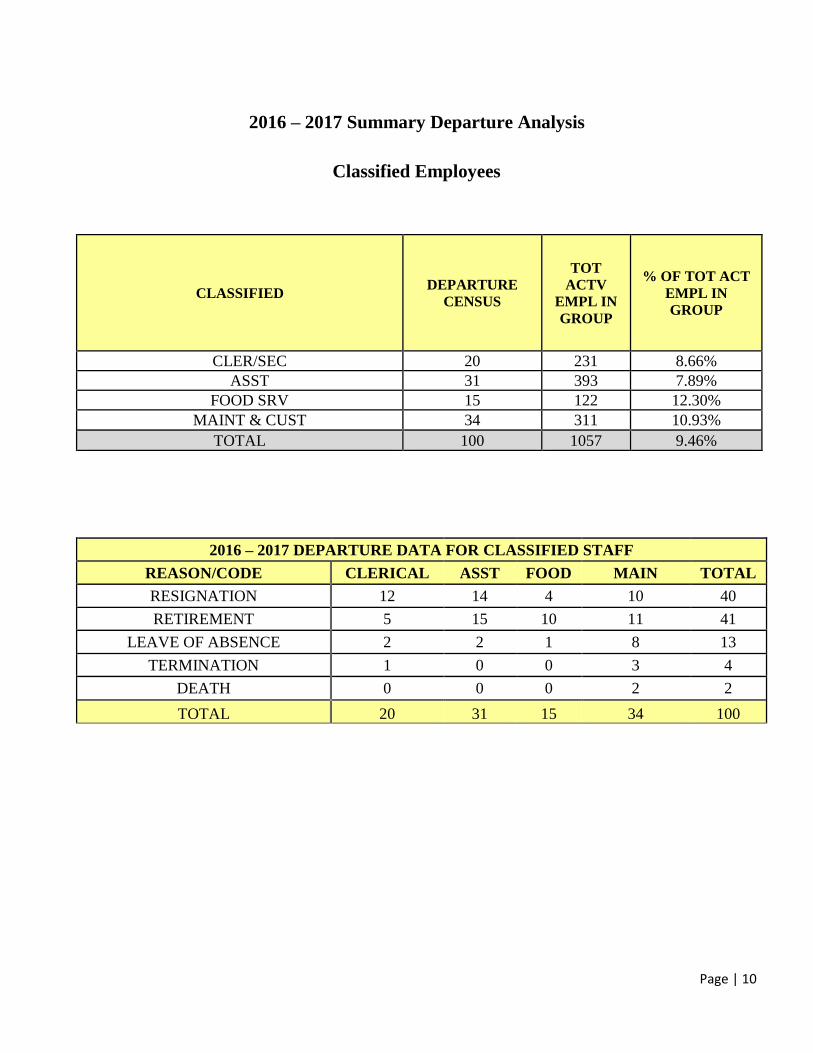
2016 – 2017 Summary Departure Analysis
Classified Employees
CLASSIFIED DEPARTURE
CENSUS
TOT
ACTV
EMPL IN
GROUP
% OF TOT ACT
EMPL IN
GROUP
CLER/SEC 20 231 8.66%
ASST 31 393 7.89%
FOOD SRV 15 122 12.30%
MAINT & CUST 34 311 10.93%
TOTAL 100 1057 9.46%
2016 – 2017 DEPARTURE DATA FOR CLASSIFIED STAFF
REASON/CODE CLERICAL ASST FOOD MAIN TOTAL
RESIGNATION 12 14 4 10 40
RETIREMENT 5 15 10 11 41
LEAVE OF ABSENCE 2 2 1 8 13
TERMINATION 1 0 0 3 4
DEATH 0 0 0 2 2
TOTAL 20 31 15 34 100
Page | 11
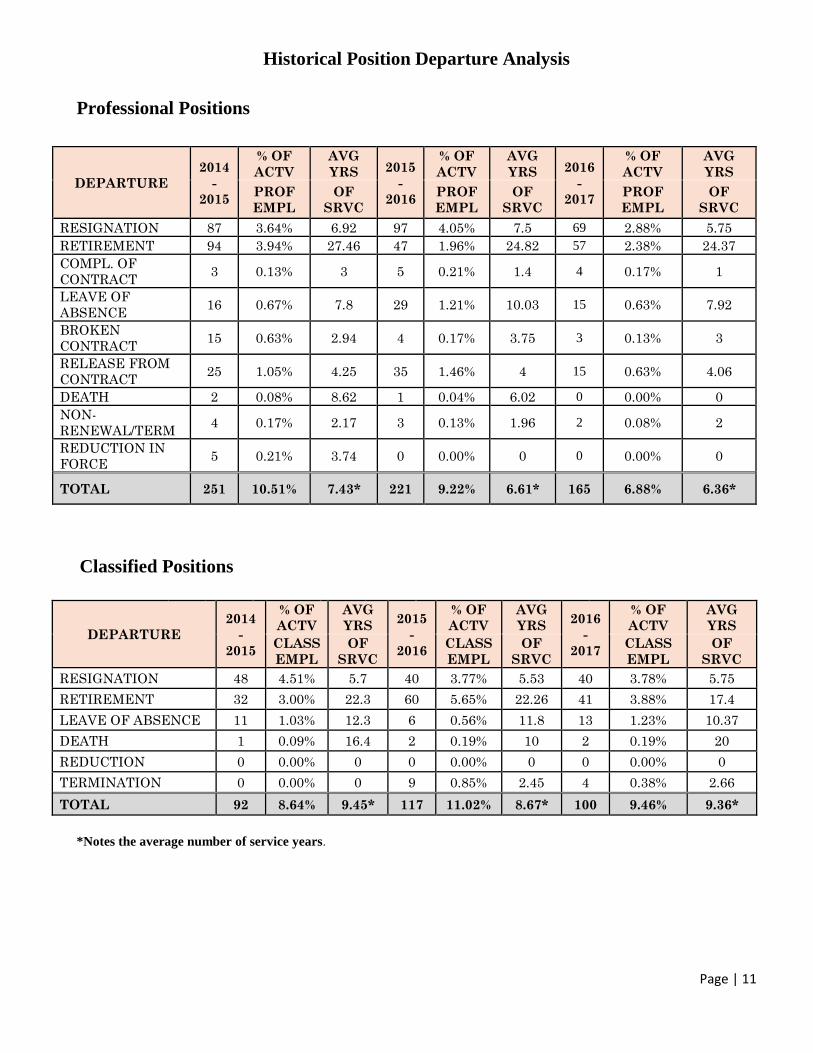
Historical Position Departure Analysis
Professional Positions
DEPARTURE
2014
-
2015
% OF
ACTV
AVG
YRS 2015
-
2016
% OF
ACTV
AVG
YRS 2016
-
2017
% OF
ACTV
AVG
YRS
PROF
EMPL
OF
SRVC
PROF
EMPL
OF
SRVC
PROF
EMPL
OF
SRVC
RESIGNATION 87 3.64% 6.92 97 4.05% 7.5 69 2.88% 5.75
RETIREMENT 94 3.94% 27.46 47 1.96% 24.82 57 2.38% 24.37
COMPL. OF
CONTRACT 3 0.13% 3 5 0.21% 1.4 4 0.17% 1
LEAVE OF
ABSENCE 16 0.67% 7.8 29 1.21% 10.03 15 0.63% 7.92
BROKEN
CONTRACT 15 0.63% 2.94 4 0.17% 3.75 3 0.13% 3
RELEASE FROM
CONTRACT 25 1.05% 4.25 35 1.46% 4 15 0.63% 4.06
DEATH 2 0.08% 8.62 1 0.04% 6.02 0 0.00% 0
NON-
RENEWAL/TERM 4 0.17% 2.17 3 0.13% 1.96 2 0.08% 2
REDUCTION IN
FORCE 5 0.21% 3.74 0 0.00% 0 0 0.00% 0
TOTAL 251 10.51% 7.43* 221 9.22% 6.61* 165 6.88% 6.36*
Classified Positions
DEPARTURE
2014
-
2015
% OF
ACTV
AVG
YRS 2015
-
2016
% OF
ACTV
AVG
YRS 2016
-
2017
% OF
ACTV
AVG
YRS
CLASS
EMPL
OF
SRVC
CLASS
EMPL
OF
SRVC
CLASS
EMPL
OF
SRVC
RESIGNATION 48 4.51% 5.7 40 3.77% 5.53 40 3.78% 5.75
RETIREMENT 32 3.00% 22.3 60 5.65% 22.26 41 3.88% 17.4
LEAVE OF ABSENCE 11 1.03% 12.3 6 0.56% 11.8 13 1.23% 10.37
DEATH 1 0.09% 16.4 2 0.19% 10 2 0.19% 20
REDUCTION 0 0.00% 0 0 0.00% 0 0 0.00% 0
TERMINATION 0 0.00% 0 9 0.85% 2.45 4 0.38% 2.66
TOTAL 92 8.64% 9.45* 117 11.02% 8.67* 100 9.46% 9.36*
*Notes the average number of service years.

Page | 12
Teacher Attrition & National Average
CCPS Attrition Rate
2013 2014 2015 2016 2017
CCPS 7.94% 9.13% 11.25% 9.41% 6.92%
National Average 15% 16.80% 20% 20% 22%*
*Projected Average
Unfortunately, the supply of new teachers is atypically low and has been declining. The number
of re-entrants (those who have stepped out of teaching) depends a great deal on whether policies
make teaching an attractive and accessible possibility.
Between 2009 and 2014, the most recent years of data available, teacher education
enrollments dropped from 691,000 to 451,000, a 35% reduction. This amounts to a
decrease of almost 240,000 professionals on their way to the classroom in the year 2014,
as compared to 2009.
Although teacher re-entrants make up one-third to one-half of each year’s supply
(depending on aspects of the economy that make teaching more or less attractive) securing
teachers even at the high end of this range will not be enough to overcome shortages. In
theory, the pool of former teachers is large, but estimates suggest only around a third of
teachers who exit the profession ever return.
Projections incorporating historical data on the teacher pipeline and estimates of re-
entrants show a steady decline in teacher supply. According to the authors’ model, 2016
will have the lowest number of available teachers in 10 years—between 180,000 and
212,000 teachers. This projection varies depending on the percent of newly prepared
teacher that actually enter the profession and the number of former teachers who return to
classroom as re-entrants.
Reference: Learning Policy Institute – https://learningpolicyinstitute.org/product/coming-crisis-teaching
.
Page | 13
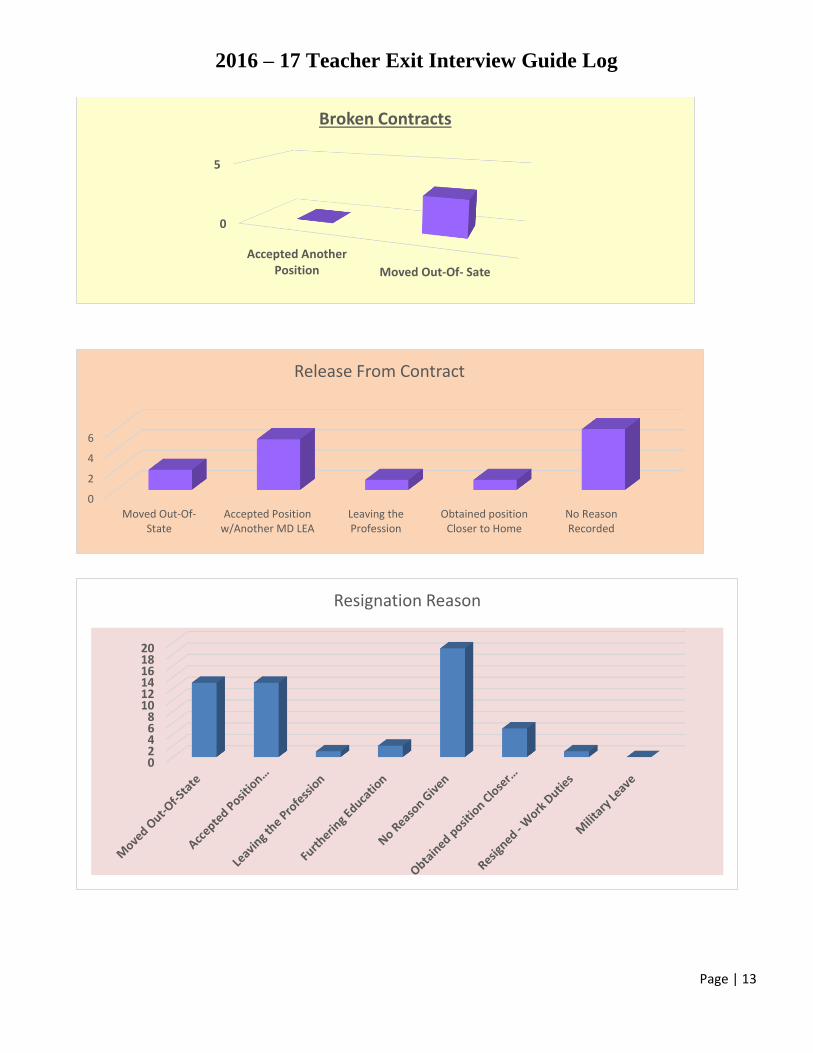
2016 – 17 Teacher Exit Interview Guide Log
0
5
Accepted AnotherPosition Moved Out-Of- Sate
Broken Contracts
0
2
4
6
Moved Out-Of-State
Accepted Positionw/Another MD LEA
Leaving theProfession
Obtained positionCloser to Home
No ReasonRecorded
Release From Contract
02468
101214161820
Resignation Reason


![CCPS Metric Pres Customizable[1]](https://img.pdfslide.us/doc/110x75/577cc37b1a28aba711961ae1/ccps-metric-pres-customizable1.jpg)