Embed Size (px)
Citation preview
Title Fabrication of carbon nanotube/NiOx(OH)y nanocomposite bypulsed electrodeposition for supercapacitor applications
Author(s) Hakamada, Masataka; Moriguchi, Akitoshi; Mabuchi, Mamoru
Citation Journal of Power Sources (2014), 245: 324-330
Issue Date 2014-01
URL http://hdl.handle.net/2433/176997
Right © 2013 Elsevier B.V.
Type Journal Article
Textversion author
Kyoto University
1
Fabrication of carbon nanotube/NiOx(OH)y nanocomposite
by pulsed electrodeposition for supercapacitor applications
Masataka HAKAMADA*, Akitoshi MORIGUCHI, Mamoru MABUCHI
Department of Energy Science and Technology, Graduate School of Energy Science,
Kyoto University, Yoshidahonmachi, Sakyo, Kyoto 606-8501, Japan
* Corresponding author. Tel: +81-75-753-5427; fax: +81-75-753-5428. E-mail:
[email protected] (M. Hakamada).
Abstract
Nanocomposite films based on carbon nanotubes (CNTs)/ nickel (Ni)-species were
fabricated by electrophoretic deposition (EPD) of CNT, followed by pulsed
electrodeposition of Ni and annealing in air. NiO/Ni(OH)2 particles with 7 ± 4 nm
diameters were uniformly dispersed on the CNT networks. Cyclic voltammetry revealed
that the CNT/NiOx(OH)y nanocomposite films had high specific capacitances of 1451,
1158, 998, 896 and 851 F/g per mass of active Ni species at 1, 10, 30, 50 and 100 mV/s,
respectively, in the potential window of 0.4 V. An annealing time of 1 h (at 523 K)
enhanced the pseudocapacity of deposited Ni species by the dehydration of Ni(OH)2 to
form NiO. Longer annealing time reduced the capacitance because of sintering and
subsequent decrease in surface area of Ni deposits. The capacitance of the fabricated
CNT/NiOx(OH)y nanocomposite was maintained after 20000 cycles of potential
sweeping.
Keywords: carbon nanotube; nickel oxide; nanocomposite; pulsed electrodeposition;
pseudocapacitance
2
1. Introduction
First reported by Iijima [1], carbon nanotubes (CNTs) have drawn considerable
attention in material sciences. Multi-walled CNTs form three-dimensional networks and
are frequently used as thin films in applications such as capacitors, actuators and
displays [2]. Electrophoretic deposition (EPD) can be used to fabricate CNT into films
with micrometer-scale thickness [3]. Thin films of CNTs are good candidates for high
surface area support materials. In addition, the high electrical conductivity of
multi-walled CNTs distinguishes them from other porous supports such as mesoporous
silica and titania.
Nanocomposites of CNT and Ni species are promising for applications in capacitors
[4], hydrogen storage [5,6] and hydrogenation catalysis [7]. In particular, CNT/NiO or
CNT/Ni(OH)2 nanocomposites show potential for applications in capacitors [8–19].
Capacitors are energy storage devices that may be become a backup power source for
hybrid vehicles. Compared with batteries, capacitors generally feature lower energy
densities but greater cycling capacity [20]. Energy density is represented by 1/2CV2,
where C is capacitance and V is voltage between the two electrodes [20]. Current
challenges in capacitor development are the simultaneous achievement of high
capacitance and voltage windows. Recently, metal oxides such as NiO [8–19], RuO2
[21,22] and MnO2 [23] have received attention as promising materials for a type of
pseudocapacitors. These pseudocapacitors use a redox reaction at the surface of the
oxides for energy storage. The theoretical capacitances of NiO and Ni(OH)2 are 2584
F/g and 2082 F/g within 0.5 V [14,24].
CNT/Ni-species (including Ni, NiO, Ni(OH)2) nanocomposites may be effectively
fabricated by electroless plating [4–7], electroplating [8,10–12,15,25,26], impregnation
3
[27,28] and other processes [9,16,18]. Pulsed electrodeposition, in which the applied
potential is oscillated at high frequencies during deposition of metals, is another strategy
to fabricate nanostructured Ni [29,30]. In this study, we carried out pulsed
electrodeposition of Ni on CNTs and annealing in air to make a CNT/NiOx(OH)y
nanocomposite. We investigated capacitive properties of the CNT/NiOx(OH)y by cyclic
voltammetry (CV) and chronopotentiometry (CP).
2. Experimental
Commercially available multi-walled CNTs (FloTube 9000, prepared by a catalytic
vapor deposition process) were purchased from CNano Technology Ltd (Santa Clara,
US). The raw CNTs were first treated in a concentrated mixture of 15.6 mol/L nitric
acid and 18 mol/L sulfuric acid (with volumetric ratio of 1 : 3) at 333 K for 8 h. The
treated CNTs were then washed several times by ultrasonication in distilled water to
remove excess acid.
Following the acid treatment, EPD was carried out to fabricate the CNT film. The
negative and positive electrodes were Pt and SUS316L (The Nilaco Corp., Tokyo,
Japan) foils with exposed areas of 20 × 25 mm2
and thickness of 20 µm, respectively.
The distance between the electrodes was 20 mm. The acid-treated CNTs were
suspended at a concentration of 1 g/L in distilled water for EPD. A voltage of 30 V was
applied between the electrodes at room temperature (298 K) for 90 s. After the EPD, the
CNTs film was dried in air and then heated at 673 K for 3 h to oxidize and insulate the
SUS316L substrate. This oxidation step facilitated preferential electrodeposition of Ni
on CNTs rather than the SUS316L substrate. Pulsed electrodeposition of Ni was carried
out on the CNTs film to form CNTs/Ni nanocomposite film. The pulsed current is
4
shown in Fig. S1 (in Supplementary Data) with maximum current densities of 3 and
0.03 A/cm2 applied for 0.5 and 50 s, respectively. These current densities were
calculated from division of the current by the apparent exposed area (5 cm2). The
electrolyte was composed of NiSO4·6H2O (240 g/L), NiCl2·6H2O (45 g/L), H3BO3 (35
g/L) and C7H5NO3S (saccharin, 2.4 g/L). The CNTs substrate made up the cathode and
Ni plate (The Nilaco Corp., Japan) was used for the anode. The temperature was
maintained at 323 K during the pulsed electrodeposition. After electrodeposition, the
CNTs/Ni nanocomposite film was washed with distilled water several times and dried in
air. Several samples were annealed in air to oxidize Ni, at temperatures of 473, 523 or
573 K for durations of 1 and 72 h.
The samples were observed by a scanning electron microscope (SEM, SU-6600 by
Hitachi High-Technologies Corporation, Japan) equipped with an energy-dispersive
X-ray (EDX) spectrometer. X-ray photoelectron spectra (XPS) of the samples were also
collected under vacuum (6.7 × 10⁻⁸
Pa) using ESCA5800 (ULVAC-PHI, Inc., Chigasaki,
Japan) with Al Kα radiation (hν = 1486.6 eV). X-ray diffraction (XRD) analyses were
also conducted by using X’Pert Pro by PANalytical, operated under a glancing beam
configuration (0.5°) with Cu radiation.
Cyclic voltammetry (CV) and chronopotentiometry (CP) were conducted using a
potentiostat and charge-discharge tester, respectively. A typical three-electrode
electrochemical cell with a Pt black counter electrode, a saturated calomel electrode
(SCE) reference electrode and the CNTs/Ni sample were used as the working electrode.
The electrolyte was an aqueous KOH s solution (6 mol/L). CV was performed at 1, 10,
30, 50, 100 mV/s in a potential range of −0.05 to +0.35 V (in this article, potentials are
documented vs SCE unless otherwise stated). CP was performed at 1 mA (5.6 A/g), 5
5
mA (27.8 A/g), 25 mA (138.9 A/g) in a potential range of −0.05 to +0.35 V. Before the
capacitance measurements, the mass of the CNT/NiOx(OH)y composite electrode was
measured by electronic balance (Shimadzu AUW-220D). After the capacitance
measurements, the composite layer (exposed to the electrolyte) were manually detached
from SUS316 substrate and the mass of the electrode without the composite was
measured. The difference between the mass values of the sample before and after the
detaching was adopted as the real composite mass. EDX was used to know the
elemental composition of the composite.
3. Results
3.1 SEM characterization
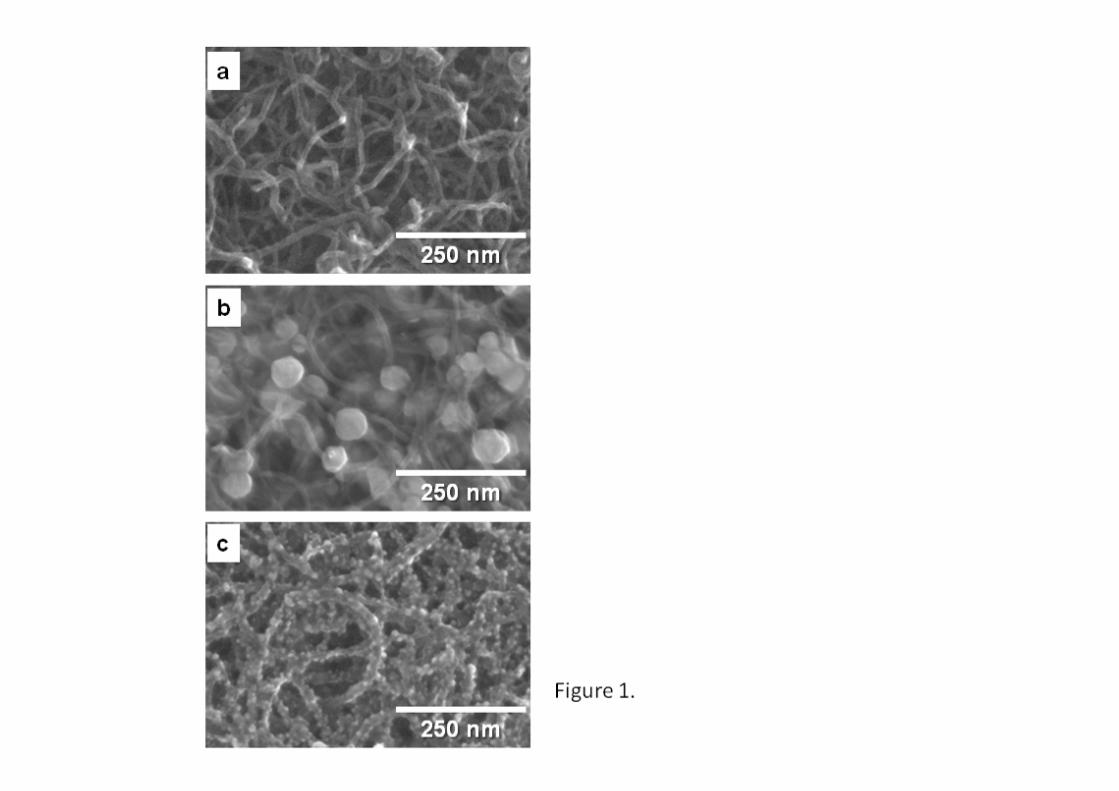
Figure 1a shows a surface view of CNTs film (after EPD and before Ni
electrodeposition). CNTs with average diameter of 13 nm formed a nanoporous network.
The thickness was approximately 1 µm, as estimated by optical microscopy. Figure 1b
shows the CNT/Ni nanocomposite fabricated by pulsed electrodeposition at a low
current density of 0.03 A/cm2. Spherical nanoparticles with a diameter of 50 ± 20 nm
were deposited on to the CNTs at a current density of 0.03 A/cm2. Figure 1c shows the
CNT/Ni nanocomposite fabricated by pulsed electrodeposition at a high maximum
current density of 3 A/cm2. Small (diameter of 7 ± 4 nm, calculated by the SEM image
analyses) nanoparticles were deposited on to the CNTs at the high current density of 3
A/cm2. EDX analyses showed the CNT/Ni contained approximately 35% by mass of Ni
in the nanocomposites fabricated at both high and low current densities.
Previous studies of electrodeposited Ni nanoparticles on CNTs gave Ni particles with
diameters larger than 15 nm [8,10,25,26]. In this study, Ni deposits with diameters less
6
than 10 nm were achieved, using pulsed electrodeposition applied at a maximum current
density of 3 A/cm2. This demonstrates that pulsed electrodeposition of Ni is effective for
reducing the size of Ni deposits on CNT.
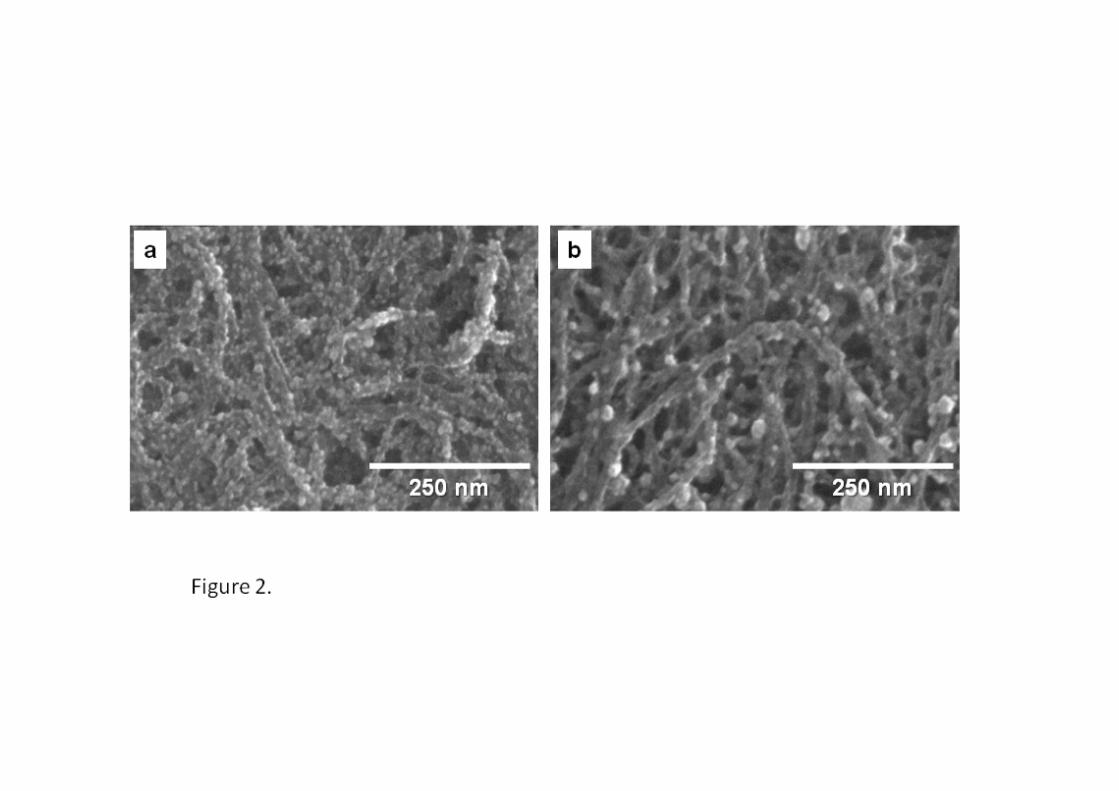
Figure 2 shows the SEM images of the CNT/NiOx(OH)y nanocomposite fabricated by
pulsed electrodeposition of Ni at 3 A/cm2 and annealed in air at 523 K for 1 and 72 h.
Comparison of Fig. 2a with that of the sample before annealing (Fig. 1c) revealed that
the size and distribution of the deposits on the CNTs were unchanged by the 1-h
annealing step. The Ni deposits maintained a fine dispersion during the annealing,
suggesting a high surface area was also preserved. However, the 72-h annealed sample
(Fig. 2b) showed a change of deposition texture, with deposits showing an average
diameter of 15 nm. Sintering of Ni deposits is the likely cause of this change in the
texture from 72-h annealing. On the other hand, XRD analyses on the samples showed
no crystalline phases for Ni species, as shown in Fig. S2 in the Supplementary Data,
suggesting that the Ni deposits are amorphous even after the annealing. Thus,
unfortunately, the NiO/Ni(OH)2 phase composition is unclear.
3.2 Electrochemical tests of capacitances
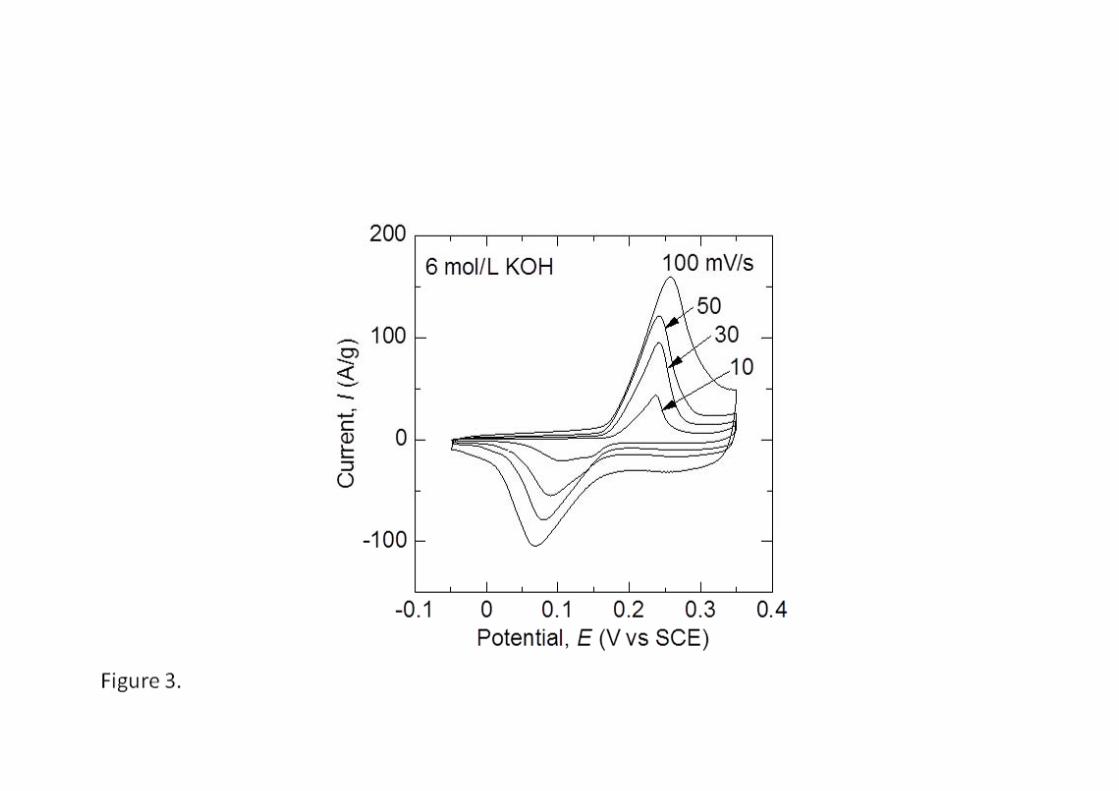
Figure 3 shows the CV curves of the CNT/NiOx(OH)y nanocomposite fabricated by
pulsed electrodeposition at 3 A/cm2 and annealed in air at 523 K for 1 h. The CV curves
featured clear redox peak pairs corresponding to the superficial Faradic reactions. The
oxidation and reduction peaks were shifted to higher and lower potentials, respectively,
with a midpoint potential of +0.16 V, as the scan rate increased. The symmetry of the
CV curves suggested that the redox reactions were highly reversible, suggesting good
potential for repeated cycling. The other samples fabricated under various conditions
7
also exhibited similar symmetric CV curves with redox peak pairs.
The specific capacitances (C) per mass of nanocomposite (approximately 0.5 mg) in
each sample were determined from the CV curves using the following equation [14,19]:
f
i)/(
||
2
1V
V
dVdtdV
I
VmC , (1)
where m is the mass of nanocomposite, ΔV is the potential window, Vi and Vf are the
starting and ending potentials in one cycle, respectively, I is the instantaneous current at
a given potential and dV/dt is the scan rate.
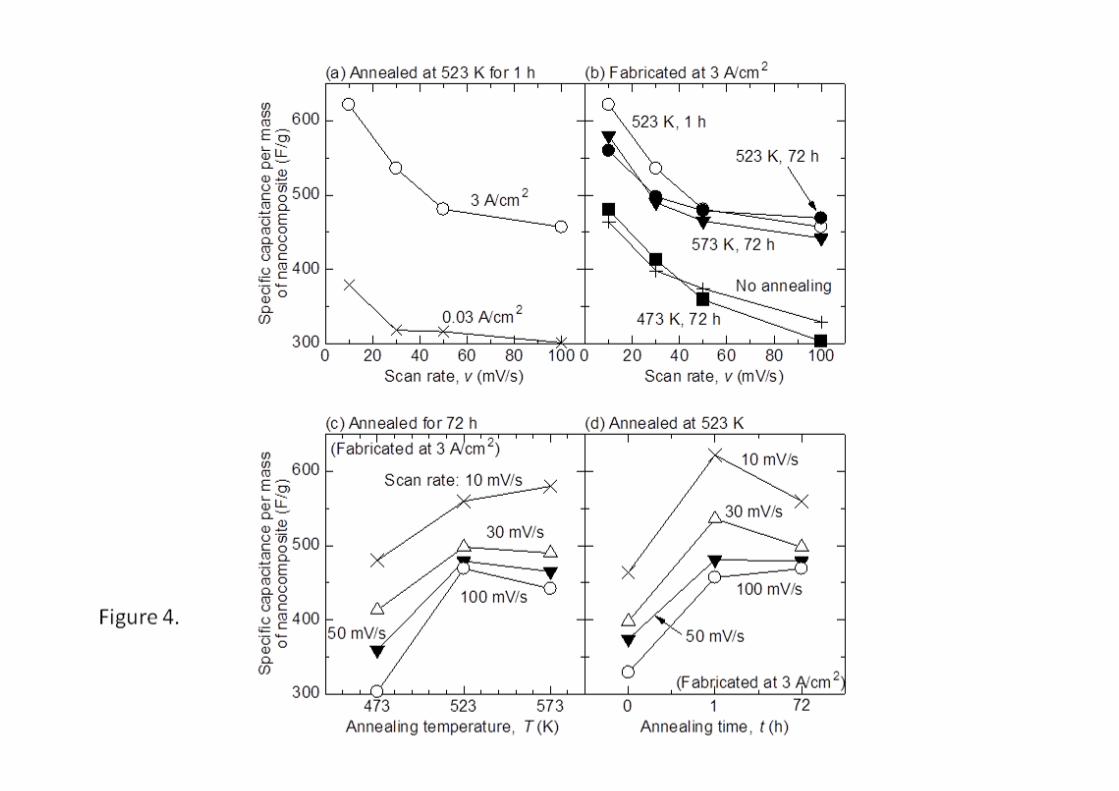
Figure 4 summarizes the relationship between scan rate and specific capacitance per
mass of CNT/NiOx(OH)y nanocomposite, for samples fabricated under different
conditions. Figure 4a shows specific capacitances of the CNT/Ni nanocomposite
fabricated at a maximum current density of 3 and 0.03 mA/cm2 and annealed in air at
523 K for 1 h. The specific capacitance of the CNT/Ni nanocomposite fabricated at 3
A/cm2 was higher than that of the nanocomposite fabricated at 0.03 mA/cm
2. As
observed in SEM images (Fig. 1c), Ni deposits on CNT were smaller (7 nm) in the
nanocomposite fabricated at 3 A/cm2. These particles therefore presented a larger
surface area of active Ni than the sample fabricated at 0.03 A/cm2. These results
suggested the redox reactions and capacitive behavior were related to the nature of the
Ni deposits.
The CNT/Ni nanocomposites fabricated at 3 A/cm2 were annealed in air at various
temperatures and durations. Figure 4b shows the effect of annealing conditions on the
specific capacitances of CNT/NiOx(OH)y nanocomposites (fabricated at 3 A/cm2). High
specific capacitances were obtained under the annealing conditions (T, t) = (523 K, 1 h),
(523 K, 72 h) and (573 K, 72 h), where T is the annealing temperature and t is the
annealing time. The annealing conditions (T, t) = (523 K, 1 h) gave nanocomposites
8
with the highest capacitance at low scan rates. The specific capacitance of the (T, t) =
(473 K, 72 h) sample was lower than other samples annealed at higher temperature and
almost similar to that of the CNT/Ni sample without annealing. Figures 4c and 4d also
indicate that the annealing conditions (T, t) = (523 K, 1 h) is the best.
The constant-current electrodeposition of Ni at 3 A/cm2 for 0.5 s on CNTs has been
conducted for comparison. Fig. S3 (in Supplementary Data) shows the SEM image of
the sample fabricated by the constant-current electrodeposition of Ni and subsequent
annealing at 523 K for 1 h. Ni-species particles with the average diameter of 40 nm
were deposited on the CNTs. CV measurements revealed that the specific capacitance
per mass of composites was 275, 172, 167, 112 F/g at the scan rates of 10, 30, 50 and
100 mV/s, respectively. The capacitance was much lower than that of the samples
fabricated by the pulsed electrodeposition (Fig. 4). Thus, the advantage of the pulsed
electrodeposition is the finer size of Ni deposits.
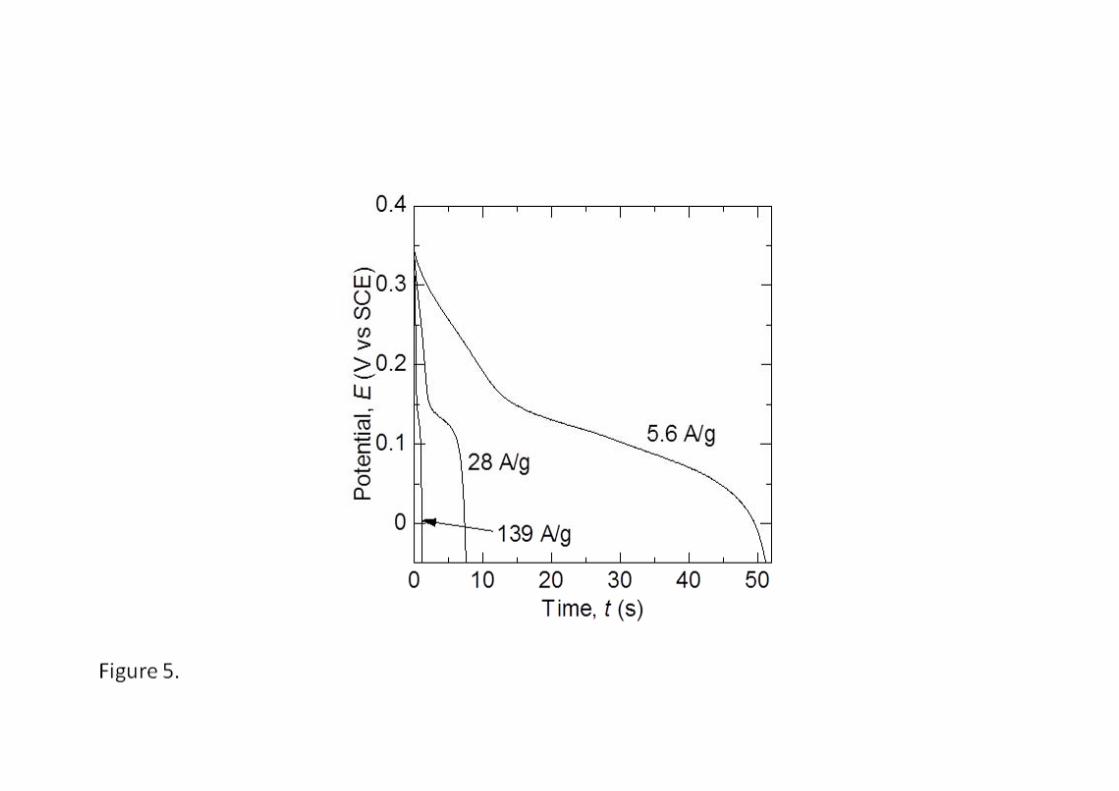
Figure 5 shows galvanostatic discharge curves from different discharge currents from
the CNT/NiOx(OH)y nanocomposite fabricated at 3 A/cm2 and annealed in air at 523 K
for 1 h. Higher discharge currents gave a shorter discharge time, consistent with
previous results [13,14,16,18]. From the discharge curves, the specific capacitances (C)
per mass of nanocomposite were derived using the following equation [18]:
Vm
tIC
, (2)
where I is the discharge current, ΔV is the potential window, Δt is the discharge time in
the potential window and m is mass of the nanocomposite. The specific capacitances per
mass of nanocomposites were calculated to be 676, 490, 364 F/g at discharge currents of
5.6, 27.8, 138.9 A/g, respectively. The capacitance was higher at smaller discharge
currents, in accordance with previous results [17,18,20,22]. The capacitances calculated
9
from the CP results were of the same order of those calculated from CV results.
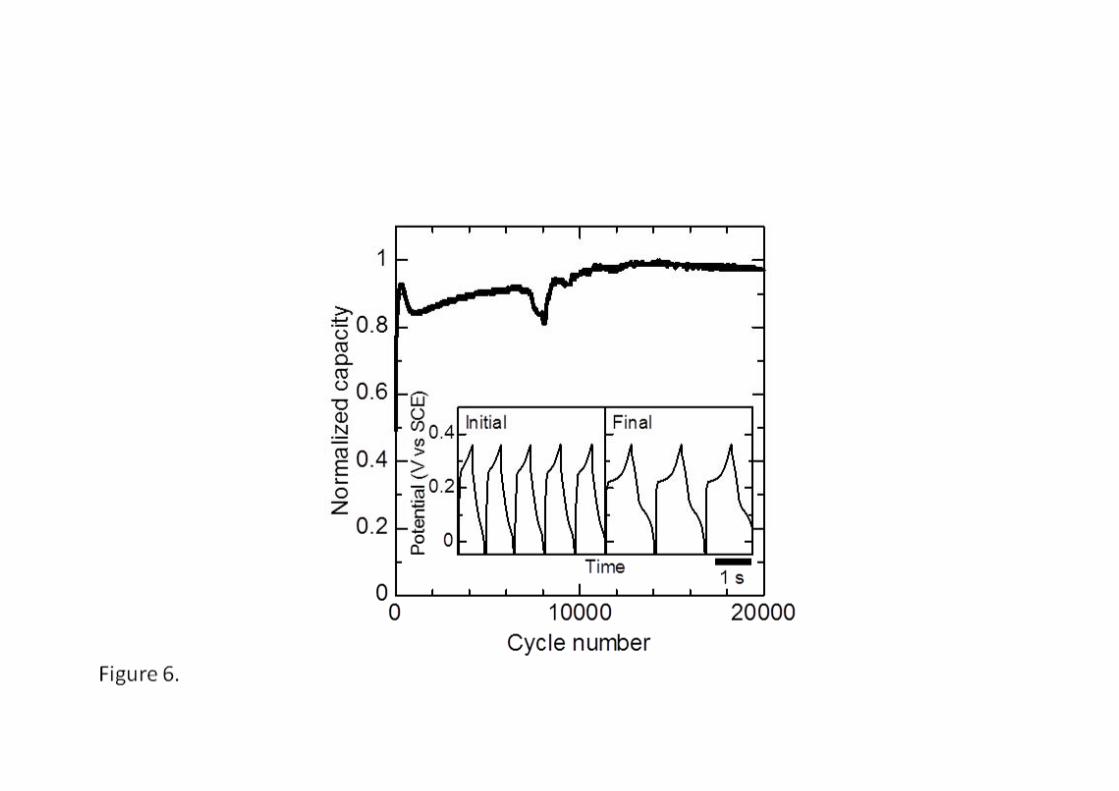
We also performed 20000-cycle CP tests at 138.9 A/g of nanocomposite fabricated at
maximum current density of 3 A/cm2
and annealed in air at 523 K for 1 h. The results
are shown in Fig. 6. The specific capacitance generally increased and stabilized after
10000 cycles, although the noticeable decrease and increase in the capacitance was
observed at 8000 cycles (at this stage, the reason for the capacitance change at 8000
cycles are not understood). During subsequent cycles, the specific capacitance remained
unchanged from the higher value. Charge/discharge curves (shown in the inset) revealed
that the time for charge/discharge cycles became longer in the later cycles, owing to the
increased capacitance (see Eq. (2)). This increase in capacitance could be explained by
removal of contamination such as carbonaceous material and adsorbed gases on the
CNT/Ni-species nanocomposites during the first 10000 charge/discharge cycles. These
results demonstrated an excellent stability to repeated charge/discharge cycling of the
CNT/Ni nanocomposites.
4. Discussion
As shown above, (T, t) = (523 K, 1 h) was the best annealing condition. In this
section, we focus on the effect of annealing time on the oxidation state and activity of
Ni species, because annealing at 573 K may damage CNTs and alter the electric
properties of not only Ni species but CNTs.
4.1 Surface states of deposited Ni
The Faradic reactions of Ni species are described by the following equations [31]:
NiO + OH− ↔ NiOOH + e
− (3)
Ni(OH)2 + OH− ↔ NiOOH + H2O + e
− (4).
10
The equilibria between NiO and Ni(OH)2 determines the electrochemical capacitance.
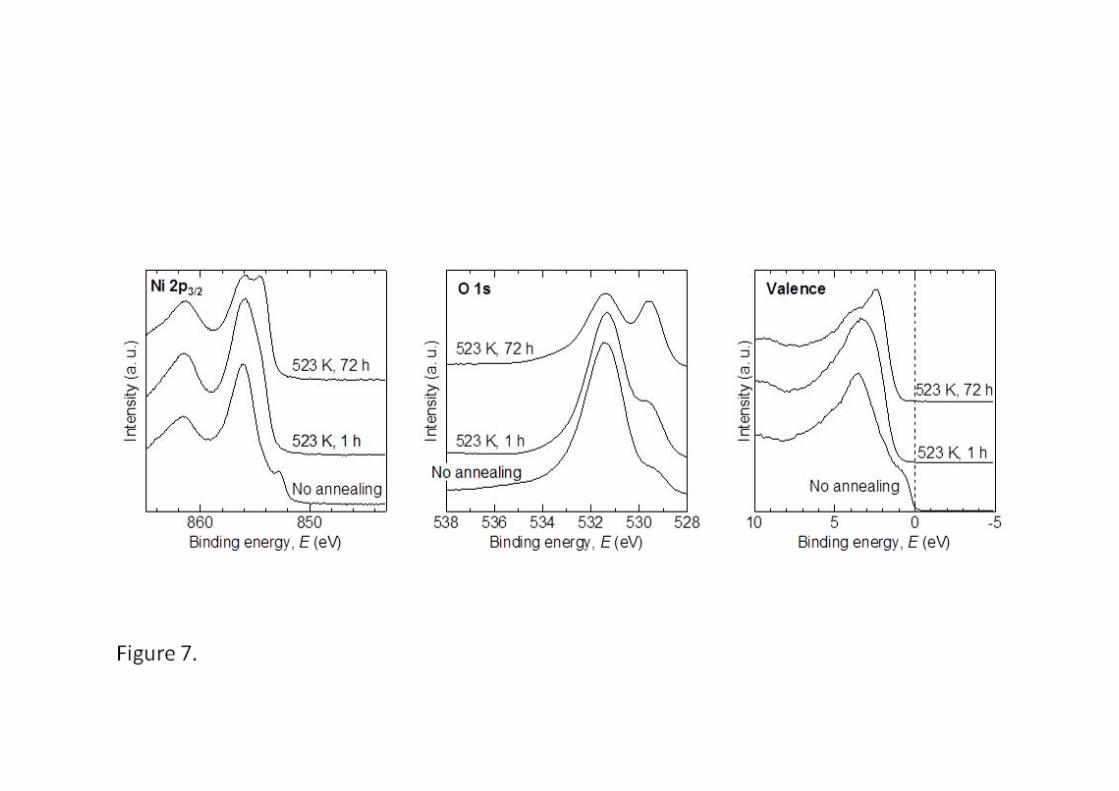
Figure 7 gives the XPS of CNT/NiOx(OH)y nanocomposites fabricated by pulsed
electrodeposition at 3 A/cm2 before and after annealing in air at 523 K. Before
annealing, the surface of nanocomposite contained a large proportion of Ni(OH)2 (856.0
eV [32,33] for Ni 2p3/2 and 531.5 eV [34,35] for O 1s) as well as a smaller proportion of
metallic Ni (852.8 eV [36]). This suggested that the majority of nanosized Ni deposits
(Fig. 1c) were oxidized to form hydroxide during pulsed electrodeposition, water
washing and drying in air. However, annealing at 523 K completely removed the
metallic Ni component around 852.8 eV. Valence level XPS Spectra around 0 eV (Fig.
7c) also showed a decrease in intensity around 1.0 eV through annealing, which implied
a decrease of metallic electronic states in the materials. Furthermore, the NiO
component (854.4 eV [37–39] for Ni 2p3/2 and 529.6 eV [40–42] for O 1s) increased
with annealing time. The molar ratio of NiO/Ni(OH)2 was calculated from XPS to be
approximately 0.10 and 0.31 in the samples annealed for 1 and 72 h, respectively. The
following dehydration reaction is suggested:
Ni(OH)2 → NiO+H2O (5).
It is known that Ni(OH)2 dehydrates at temperature greater than 523 K [23,34]. Thus, in
the CNT/Ni nanocomposite annealed at T < 473 K, the only active Ni species is likely to
be Ni(OH)2, but when annealed at T ≥ 523 K, some NiO states may become
electrochemically active.
4.2 Specific capacitance per mass of active Ni species
The surface area of the active materials is an important factor affecting specific
capacitance. We did not directly measure the surface area in this study, but performed a
11
relative comparison of the number and type (NiO and Ni(OH)2) of active sites in the
materials. The ratio of measured charge to the total theoretical charge of the active
materials is the fraction of nickel sites, involved in the faradaic reaction, z, and can be
estimated from the specific capacitance of the nanocomposite film by the following
equation [19],
MF
VCz
/
Ni
where ΔV is the potential window, 0.4 V in this study, M is the average molecular
weight of active Ni species, F is the Faraday constant, and CNi is the specific
capacitance per mass of active Ni species (NiO and Ni(OH)2) (F/g). CNi was calculated
based on the compositional information from EDX spectroscopy and XPS.
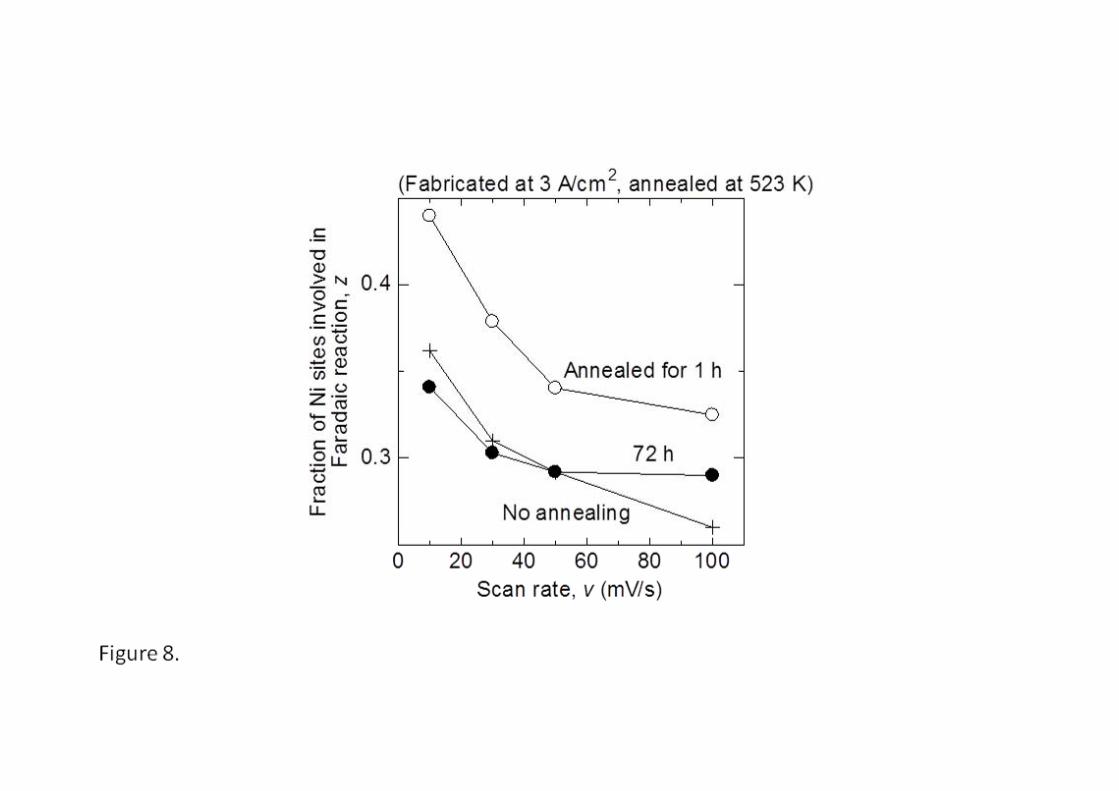
Figure 8 shows the z value for the CNT/Ni nanocomposites fabricated at 3 A/cm2
with and without annealing at 523 K. The z values of the sample with (T, t) = (523 K, 1
h) were markedly higher than those of other samples. This suggests an increase in the
number of Faradic reaction sites following annealing in air at 523 K for 1 h. However,
the z values of the sample with (T, t) = (523 K, 72 h) were low and similar to those of
the sample without annealing.
Effect of surface oxidation states of Ni in Ni-based pseudocapacitors has been
discussed in the previous studies [10,12,31]. Nam et al. [12] reported that NiO
formation from Ni(OH)2 by heating at 573 K is beneficial for stable pseudocapacitive
behavior at high scan rates. However, they also reported that redox reaction of Ni(OH)2
is responsible for the increased capacitance during repeated cyclic voltammetry. Wu and
Hsieh [31] also showed that the surface area and electric conductivity of NiO was larger
than that of Ni(OH)2. Thus the NiO formation due to dehydration of Ni(OH)2 during the
annealing is likely to increase in specific capacitance, although the detailed mechanism
12
is still in debate. In this study, the sample with (T, t) = (523 K, 72 h) showed lower z
values, despite featuring a higher NiO component at the surface compared with the
sample with (T, t) = (523 K, 1 h) (Fig. 7). This was definitely attributed to the coarsened
texture of active Ni deposits through prolonged (72 h) annealing (Fig. 2b). The reduced
surface area of these Ni deposits resulted in deterioration of the specific capacitance.
Thus, the finely dispersed structure of Ni nanoparticles with sub-10 nm diameters,
rather than oxidation state of Ni, critically determines the high capacitance of Ni-based
pseudocapacitors.
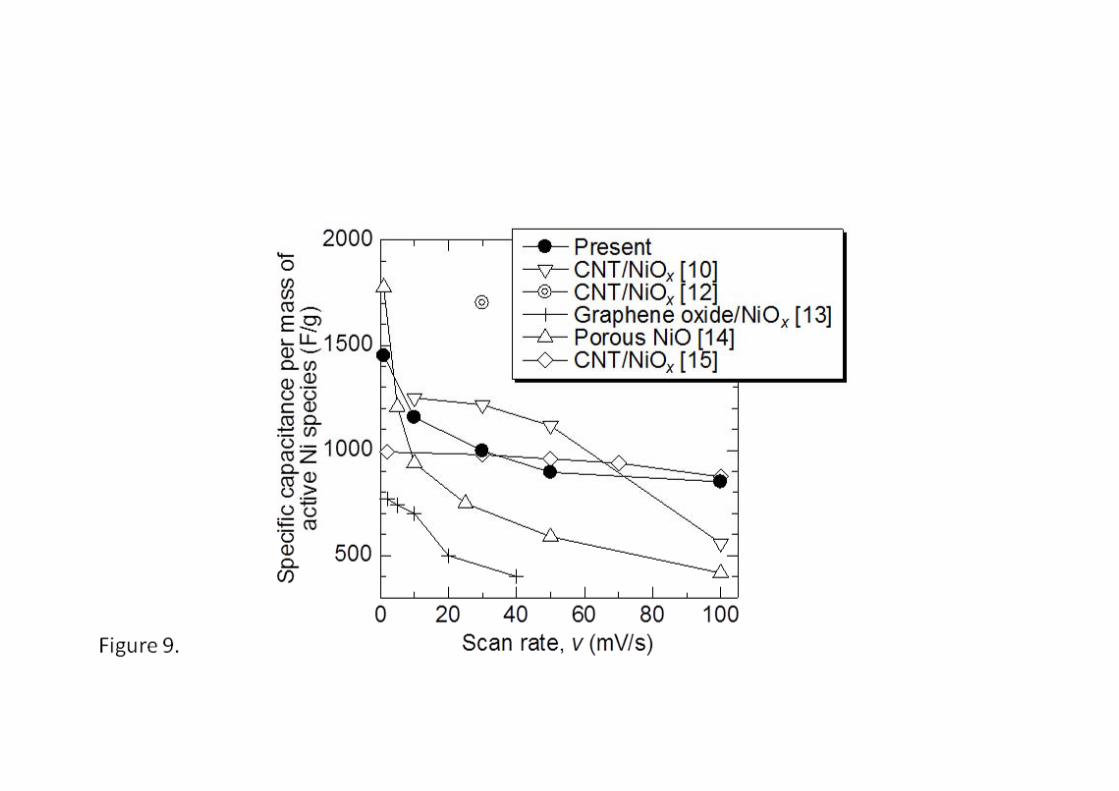
We performed additional CV measurements at a scan rate of 1 mV/s to compare the
specific capacitance of these materials with other supercapacitors composed of Ni
species. Figure 9 shows the specific capacitance per mass of active Ni species (NiO and
Ni(OH)2) (CNi, measured by CV) of the CNT/NiOx(OH)y nanocomposite fabricated at 3
A/cm2 and annealed in air at 523 K for 1 h, together with previous data from the
literature [10,12,13–15]. CNi of capacitive electrodes generally decrease as the scan rate
increases, as shown in Fig. 9. CNi of our CNT/Ni nanocomposites were higher than
those of graphene oxide/NiO [13] and porous NiO [14] and comparable with those of
other CNT/NiOx composites [10,12,15]. This comparison suggests that CNT are
effective for fast electron transfer in the CNT/Ni nanocomposite electrode.
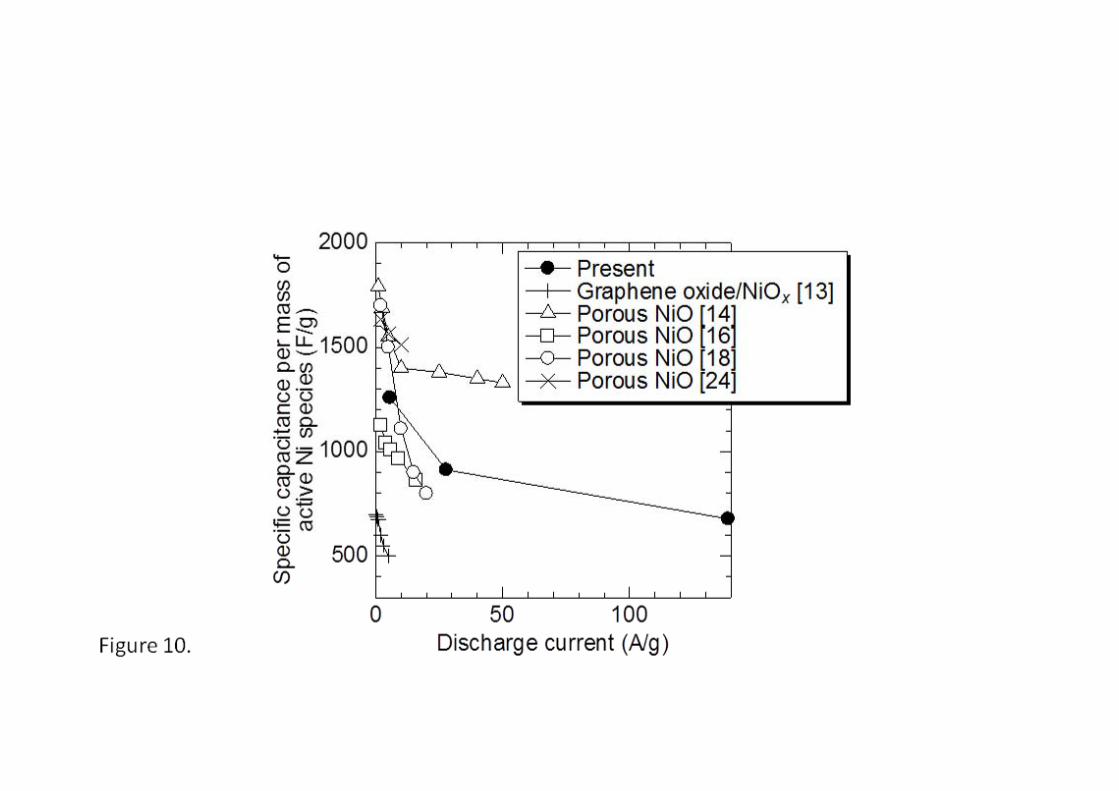
Figure 10 shows CNi (measured by CP) of the CNT/Ni nanocomposite fabricated at 3
A/cm2 and annealed in air at 523 K for 1 h. The maximum CNi was 1259 F/g at the a
discharge current of 5.6 A/g, which is also comparable with CNi measured by CP in the
previous studies [13,14,16,18,24].
13
4. Conclusions
In this study, CNT/NiOx(OH)y nanocomposite films were synthesized by EPD of
CNTs, the pulsed electrodeposition of Ni, followed by annealing steps. The materials
were tested as electrochemical capacitors. Small (7 nm) Ni nanoparticles were
uniformly deposited on the CNT surfaces by EPD. After annealing in air at 523 K for 1
h, specific capacitance per mass of active Ni species were measured as high as 1451 F/g
at a scan rate of 1 mV/s. SEM images and XPS analyses of the samples revealed that
NiO formation from dehydration of Ni(OH)2 during annealing at 523 K was beneficial
for the capacitance, but that long annealing times (72 h in this study) produced coarse,
aggregated Ni deposits with decreased specific capacitance. In cyclic CP tests, the
specific capacitance was maintained over 20,000 cycles at 138.9 A/g, which implied
excellent durability. These results suggest that this porous structured CNT/NiOx(OH)y
nanocomposite is a promising material for supercapacitors.
Acknowledgments
Capacitance measurements were financially supported by a JSPS Grant-in-Aid for
Challenging Exploratory Research 25630303. M. H. thanks The Iwatani Naoji
Foundation for supporting the synthesis of samples. The authors also thank Prof. T. Yao
and Prof. T. Yabutsuka (Kyoto Univ., Japan) for their cooperation in SEM observations.
References
[1] S. Iijima, Nature 354 (1991) 56–58.
[2] L. Hu, D. S. Hecht, G. Grüner, Chem. Rev. 110 (2010) 5790–5844.
[3] A. R. Boccaccini, J. Cho, J. A. Roether, B. J. C. Thomas, E. J. Minay, M. S. P.
14
Shaffer, Carbon 44 (2006) 3149–3160.
[4] S.-M. Bak, K.-H. Kim, C.-W. Lee, K.-B. Kim, J. Mater. Chem. 21 (2011)
1984–1990.
[5] K.-Y. Lin, W.-T. Tsai, J.-K. Chang, Int. J. Hydrogen Energy 35 (2010) 7555–7562.
[6] C.-Y. Chen, K.-Y. Lin, W.-T. Tsai, J-K. Chang, C.-M. Tseng, Int. J. Hydrogen Energy
35 (2010) 5490–5497.
[7] Z. Liu, Z. Li, F. Wang, J. Liu, J. Ji, K. C. Park, M. Endo, Mater. Res. Bull. 47 (2012)
338–343.
[8] C.-T. Hsieh, Y.-W. Chou, W.-Y. Chen, J. Solid State Electrochem. 12 (2008)
663–669.
[9] B. Gao, C.-Z. Yuan, L.-H. Su, L. Chen, X.-G. Zhang, J. Solid State Electrochem. 13
(2009) 1251–1257.
[10] B. Wen, S. Zhang, H. Fang, W. Liu, Z. Du, Mater. Chem. Phys. 131 (2011) 8–11.
[11] J. Y. Lee, K. Liang, K. H. An, Y. H. Lee, Synth. Metals 150 (2005) 153–157.
[12] K.-W. Nam, K.-H. Kim, E.-S. Lee, W.-S. Yoon, X.-Q. Yang, K.-B. Kim, J. Power
Sources 182, (2008) 642–652.
[13] X. Zhu, H. Dai, J. Hu, L. Ding, L. Jiang J. Power Sources 203 (2012) 243–249.
[14] K. Liang, X. Tang, W. Hu, J. Mater. Chem. 22 (2012) 11062–11067.
[15] K.-W. Nam, E.-S. Lee, J.-H. Kim, Y.-H. Lee, K.-B. Kim, J. Electrochem. Soc. 152
(2005) A2123–A2129.
[16] C. Yuan, J. Li, L. Hou, L. Yang, L. Shen, X. Zhang, Electrochim. Acta 78 (2012)
532–538.
[17] Q. Lu, M. W. Lattanzi, Y. Chen, X. Kou, W. Li, X. Fan, K. M. Unruh, J. G. Chen, J.
Q. Xiao, Angew. Chem. 123 (2011) 6979–6982
15
[18] M. Yang, J. X. Li, H. H. Li, L. W. Su, J. P. Wei, Z. Zhou, Phys. Chem. Chem. Phys.
14 (2012) 11048–11052.
[19] K.-W. Nam, K.-B. Kim, J. Electrochem. Soc. 149 (2002) A346–A354.
[20] A. G. Pandolfo, A. F. Hollenkamp, J. Power Sources 157 (2006) 11–27.
[21] Y.-G. Wang, X.-G. Zhang, Electrochim. Acta 49 (2004) 1957–1962.
[22] C.-C. Hu, M.-J. Liu, K.-H. Chang, J. Power Sources 163 (2007) 1126–1131.
[23] S. Chen, J. Zhu, X. Wu, Q. Han, X. Wang, ACS Nano 4 (2010) 2822–2830.
[24] D.-S. Kong, J.-M. Wang, H.-B. Shao, J.-Q. Zhang, C.-N. Cao, J. Alloy. Compd.
509 (2011) 5611–5616.
[25] Y. I. Golovin, D. Y. Golovin, A. V. Shuklinov, R. A. Stolyarov, V. M. Vasyukov,
Tech. Phys. Lett. 37 (2011) 253–255.
[26] Z.-C. Wang, Z.-B. Qi, Q.-H. Liao, in: Proceedings of 2nd IEEE International
Nanoelectronics Conference (INEC 2008), IEEE, 2008, pp. 539–541.
[27] N. Chopra, W. Shi, A. Bansal, Carbon 49 (2011) 3645–3662.
[28] N. Chopra, H. G. McWhinney, W. Shi, Mater. Charact. 62 (2011) 635–641.
[29] H. Natter, R. Hempelmann, Electrochim. Acta 49 (2003) 51–61.
[30] H. Natter, M. Schmelzer, R. Hempelmann, J. Mater. Res. 13 (1998) 1186–1197.
[31] M. S. Wu, H. H. Hsieh, Electrochim. Acta 53 (2008) 3427–3435.
[32] B. P. Löchel, H.-H. Strehblow, J. Electrochem. Soc. 131 (1984) 713–723.
[33] J. C. Klein, D. M. Hercules, J. Catal. 82 (1983) 424–441.
[34] P.-H. Lo, W.-T. Tsai, J.-T. Lee, M.-P. Hung, J. Electrochem. Soc. 142 (1995) 91–96.
[35] J. Haber, J. Stoch, L. Ungier, J. Electron Spectrosc. Relat. Phenom. 9 (1976)
459–467.
[36] A. N. Mansour, Surf. Sci. Spectra 3 (1994) 221–230.
16
[37] A. N. Mansour, Surf. Sci. Spectra 3 (1994) 231–238.
[38] K. Kishi, J. Electron Spectrosc. Relat. Phenom. 46 (1988) 237–247.
[39] R. B. Shalvoy, P. J. Reucroft, B. H. Davis, J. Catal. 56 (1979) 336–348.
[40] M. Oku, H. Tokuda, K. Hirokawa, J. Electron Spectrosc. Relat. Phenom. 53 (1991)
201–211.
[41] A. R. González-Elipe, R. Alvarez, J. P. Holgado, J. P. Espinos, G. Munuera, J. M.
Sanz, Appl. Surf. Sci. 51 (1991) 19–26.
[42] P. H. Bolt, E. ten Grotenhuis, J. W. Geus, F. H. P. M. Habraken, Surf. Sci. 329
(1995) 227–240.
[43] W. Xing, F. Li, Z.-F. Yang, G. Q. Lu, J. Power Sources 134 (2004) 324–330.
Figure captions
Figure 1. SEM images of (a) electrophoretically deposited CNTs prior to pulsed
electrodeposition of Ni, (b) CNT/Ni nanocomposite fabricated by pulsed
electrodeposition of Ni at 0.03 A/cm2, (c) CNT/Ni nanocomposite fabricated by pulsed
electrodeposition of Ni at 3 A/cm2.
Figure 2. SEM images of CNT/NiOx(OH)y nanocomposite fabricated by pulsed
electrodeposition of Ni at 3 A/cm2 and annealed in air at 523 K for (a) 1 and (b) 72 h.
Figure 3. CV curves of CNT/NiOx(OH)y nanocomposite fabricated by pulsed
electrodeposition at 3 A/cm2 and annealed in air at 523 K for 1 h. Scan rates of 10, 30,
50, 100 mV/s as indicated.
Figure 4. Relationship between specific capacitance per mass of CNT/NiOx(OH)y
nanocomposite and scan rate. Effects of (a) maximum current density during pulsed
electrodeposition of Ni, (b) annealing conditions, (c) annealing temperature and (d)
17
annealing time are shown.
Figure 5. Galvanostatic discharge curves of the CNT/NiOx(OH)y nanocomposite
fabricated by pulsed electrodeposition at 3 A/cm2 and annealed in air at 523 K for 1 h.
Figure 6. 20000-cycle charge-discharge test result of CNT/Ni nanocomposite
fabricated at maximum current density of 3 A/cm2 and annealed in air at 523 K for 1 h.
Discharge current was set to 138.9 A/g. Galvanostatic charge/discharge curves of initial
and final 4 s are shown in inset.
Figure 7. X-ray photoelectron spectra of CNT/Ni nanocomposites fabricated at 3 A/cm2
with and without subsequent annealing for oxidation of Ni. (a) Ni 2p3/2, (b) O 1 s and (c)
valence band.
Figure 8. Fraction of Ni sites involved in Faradaic reaction of the CNT/Ni
nanocomposite fabricated by pulsed electrodeposition of Ni at 3 A/cm2
with and without
annealing at 523 K as a function of scan rate in CV measurement.
Figure 9. Relationship between specific capacitances (measured by cyclic
voltammetry) of Ni-species supercapacitors per mass of active Ni species and scan rate.
The present results of CNT/NiOx(OH)y nanocomposite fabricated at 3 A/cm2 and
annealed in air at 523 K for 1 h are also shown.
Figure 10. Relationship between specific capacitances (measured by
chronopotentiometry) of Ni-species supercapacitors per mass of active Ni species and
discharge current. The present results of CNT/NiOx(OH)y nanocomposite fabricated at 3
A/cm2 and annealed in air at 523 K for 1 h are also shown.