Embed Size (px)
Citation preview

Title Effects of radiation on spray flame characteristics and sootformation
Author(s) Watanabe, Hiroaki; Kurose, Ryoichi; Komori, Satoru; Pitsch,Heinz
Citation Combustion and Flame (2008), 152(1-2): 2-13
Issue Date 2008-01
URL http://hdl.handle.net/2433/88951
Right Copyright © 2008 Elsevier
Type Journal Article
Textversion author
Kyoto University

1
Full-length paper
Effects of radiation on spray flame characteristics and
soot formation
Hiroaki Watanabea,b, Ryoichi Kuroseb,*, Satoru Komorib, and Heinz Pitschc
a Energy Engineering Research Laboratory, Central Research Institute of Electric Power Industry
(CRIEPI), 2-6-1 Nagasaka, Yokosuka, Kanagawa 240-0196, JAPAN
b Department of Mechanical Engineering and Science, and Advanced Research Institute of Fluid
Science and Engineering, Kyoto University, Yoshida-honmachi, Sakyo-ku, Kyoto 606-8501, JAPAN
c Department of Mechanical Engineering, and Center for Turbulence Research (CTR), Stanford
University, Stanford, CA 94305-3035, USA
*Corresponding author.
Address: Yoshida-honmachi, Sakyo-ku, Kyoto 606-8501, JAPAN
TEL: +81 75 753 9218
FAX: +81 75 753 9218
Email address: [email protected] (R. Kurose)

2
Abstract Two-dimensional numerical simulations are applied to spray flames formed in a laminar
counterflow, and the effects of radiation on spray flame characteristics and soot formation are
studied. N-decane (C10H22) is used as the liquid spray fuel, and the droplet motion is calculated by
the Lagrangian method. A single-step global reaction is employed for the combustion reaction model.
A kinetically based soot model with flamelet model is used to predict soot formation. Radiation is
taken into account using the discrete ordinate method. The results show that radiation strongly
affects the spray flame behavior and soot formation. Without the radiation model, flame temperature
and soot volume fraction are largely over-estimated. The soot is formed in the diffusion flame
regime, and its radiation emission increases with the increase in the equivalence ratio of the droplet
fuel. This trend is in good agreement with that of the luminous flame behavior observed in the
experiments.
Keywords: Numerical simulation, spray flame, counterflow, thermal radiation, soot

1. Introduction
Spray combustion is utilized in a number of engineering applications such as energy conversion
and propulsion devices. It is therefore necessary to predict spray combustion behavior precisely
when designing and operating equipment. However, since spray combustion is a complex
phenomenon in which dispersion of the liquid fuel droplets, their evaporation, and the chemical
reaction of the fuel vapor with the oxidizer take place interactively at the same time, the underlying
physics governing these processes have not been well understood.
Kurose and colleagues (Kurose et al. [1], Nakamura et al. [2], and Watanabe et al. [3]) have
performed numerical simulations of spray flames formed in a laminar counterflow (Hwang et al. [4]),
and investigated the detailed behavior of the spray flames in terms of group combustion and flamelet
modeling. In their work, however, there remained uncertainty as to how much radiative heat transfer
affects the characteristics of the spray flames, since their computations were conducted without a
model for radiation.
Radiation plays an important role in many combustion systems, and it is well known to affect
not only the temperature field but also pollutant emissions such as particulate matter and NOx
formed by the reactions among minor chemical species. However, since the computation of radiation
increases the computational cost and its validation is difficult, radiation effects are neglected in many
studies. A common and straightforward way to account for radiation in gaseous flames is to employ
the approximate expression for the radiative heat loss for an optically thin gray gas (Barlow et al.
[5]),
(4 404R
i
q T T pσ ⎧ ⎫= −⎨⎩
∑ ),i p iα ⎬⎭
. (1)
Here, σ is the Stefan-Boltzmann constant, T is the gas-phase temperature, is the background
temperature, 0T
,p iα is the Plank mean absorption coefficient of chemical species i, and is the
mean partial pressure of that component. However, since this expression considers only the heat
transfer between the flame and background gas, the interaction with dispersed droplets or particles in
multiphase combustion fields cannot be taken into account. For multiphase combustion, therefore, it
is necessary to directly solve additional radiative transport equations using a radiation model such as
the Discrete Ordinate method [6] or Monte Carlo method [7]. Although work in which such a
radiative transport equation is actually solved has been reported by many researchers (e.g., Coelho et
al. [8], Wang et al. [9], and Kurose et al. [10]), these are limited to RANS (Reynolds-Averaged
Navier-Stokes) simulations, and hence the detailed role of radiation in the combustion fields has not
yet been sufficiently studied. Particularly, the interaction of the formation of soot and radiation is of
interest because of the potential non-linear feedback of these processes. Very recently, Tseng and
Viskanta [11] performed a numerical simulation of an evaporating droplet, and concluded that the
ip
3

radiation absorption cannot be ignored in predicting the fuel evaporation rate and droplet lifetime.
On the other hand, several studies on the prediction and modeling of soot formation have been
performed in recent years. In the numerical simulations, the flamelet model is often used to
determine the concentrations of precursors of soot. Polycyclic aromatic hydrocarbons (PAH) are
believed to be precursors of soot, but often, simplified models use smaller molecules such as
acetylene (C2H2) to describe particle inception. Pitsch et al. [12] investigated the soot formation in a
C2H4 jet diffusion flame using a PAH inception model. Wen et al. [13] evaluated the model
dependence on soot formation using the C2H2 and PAH inception models in their kerosene jet flame
simulation. These studies show applications of the flamelet model to predicting soot formation in
gaseous diffusion flames, although not discussing spray flames.
The purpose of this study is to perform two-dimensional numerical simulations of spray flames
formed in a laminar counterflow, and investigate the effect of radiation on the behavior of the spray
flames. In addition, the effects of the radiation and overall equivalence ratio on soot formation are
examined. A one-step global reaction is employed to describe the heat release due to combustion of
liquid fuel (n-decane, C10H22). The radiative heat transfer is calculated using the discrete ordinate
method [6] with S8 quadrature set. The flamelet model is employed to determine the concentrations
of the precursors and oxidizer of soot. The results are compared with the experiments by Hwang et
al. [4].
2. Computational setup and numerical methods
2.1 Computational setup
The computational setup for spray flames in a laminar counterflow is designed to match the
experiment by Hwang et al. [4]. The computational domain considered in this study is shown in Fig.
1. The dimensions of the computational domain normalized by the diameter of the burner ports, Lp,
which are located on both the upper and lower sides, are 1 and 2 in the x and y directions,
respectively. The origin of the computational domain is located at the center of the upper port.
N-decane (C10H22) is used as the liquid fuel. From the upper port, atmospheric air (T = 300 K, P = 0.1013 MPa and oxygen mass fraction = 0.2357) is issued at
2OY 0.5 * 0.5y− ≤ ≤ , and pure
n-decane spray is injected at . From the lower port, premixed atmospheric air and
vaporized n-decane is issued at to stabilize the spray flame (equivalence ratio, φ =
0.6). The fluid velocities issued from the upper and lower ports are identical.
0.15 * 0.15y− ≤ ≤
0.5 * 0.5y− ≤ ≤
The heat release and consumption of the reactants are described with a one-step global reaction
model (Westbrook and Dryer [14]):
10 22 2 2 231 10 112
C H O CO H O+ → + . (2)
4

The reaction rate of the global reaction is given by
expba
n OF
F F
Ym YEA TW RT W
ρρ ⎛ ⎞⎛ ⎞⎛ ⎞= ⋅ − ⎜⎜ ⎟⎜ ⎟⎝ ⎠⎝ ⎠ ⎝ ⎠
F
OW ⎟ , (3)
where Fm is the consumption rate of fuel, WF and WO are the molecular weights of fuel and
oxidizer, A is the frequency factor, T is the gas-phase temperature, and E is the activation energy. In
the case of n-decane, these are given as A = 3.8×10¹¹ 1/s, E = 1.256×10⁵ J/mol, a = 0.25, b = 1.5 and
n = 0, respectively [14].
2.2 Governing equations
In this study, the discrete ordinate method is employed to solve the radiative transport equation.
The radiative heat transfer within the high temperature flame, and with the low temperature
background gas and the droplets are taken into account. To predict formation of soot, a kinetically
based soot model is used. Acetylene (C2H2) is chosen as the soot precursor, and oxidation of soot by
both O2 and OH are considered. The concentrations of C2H2 and the OH radical are determined
using the steady flamelet model, as described later.
The governing equations directly solved for the gaseous phase are the conservation equations of
mass, momentum, energy, species mass fractions, and mixture fraction. These equations can be
written as
( )j mj
u St xρ ρ∂ ∂+
∂ ∂= , (4)
( )( )i
i j ij ij i uij
uu u P g S
t xρ
ρ δ σ ρ∂ ∂
+ + − −∂ ∂
= , (5a)
1 122 3
jiij ij
j i k
uu uk
x xσ μ δ
⎡ ⎤⎛ ⎞∂∂ ∂= + −⎢ ⎜ ⎟⎜ ⎟∂ ∂ ∂⎢ ⎝ ⎠⎣ ⎦x
⎥⎥
, (5b)
1
( ) ( )n
kj k k
kj j j
Yh hu h a h a D St x x xρ ρ ρ ρ ρ
=
⎡ ⎤∂∂ ∂ ∂+ − + −⎢
∂ ∂ ∂ ∂⎢ ⎥⎣ ⎦∑ h=⎥ , (6)
,( )
( )k
k kj k k combu k
j j
Y Yu Y D S S
t x xρ
ρ ρ∂ ∂∂
+ − =∂ ∂ ∂ Y+ , (7)
( ) ( )j Zj j
Z Zu Z D St x xρ ρ ρ∂ ∂ ∂
+ −∂ ∂ ∂ Z= , (8)
where ui is the gaseous phase velocity, ρ is the density, μ is the dynamic viscosity, P is the static
pressure, gi is the gravitational force, h is the specific total enthalpy, a is the gaseous thermal
diffusivity, and hk, Yk, and Dk are the specific enthalpy, the mass fraction, and the mass diffusion coefficient of the k-th species respectively. δij is the Kronecker delta function. Sm, Sui, Sh, and Sz kYS
5

represent interactions between the gaseous and the disperse phases, and Scombu,k is the source term
due to combustion, described later. Z is the mixture fraction, which is introduced here for use with
the flamelet model. The diffusion coefficient of Z, DZ, is given as the diffusion coefficient of mixture
gas. The gaseous phase density, ρ, is calculated from the equation of state for an ideal gas.
The source terms due to the interactions between the gaseous and disperse phases are expressed
using the total number of droplets, Nd, existing in the control volume of the gaseous phase
calculations, as follows:
1 dNd
mdm
SV dt
= −Δ ∑ , (9)
( )1,
1 dNd
ui i d i d id
m f dmS u u
V τ⎡ ⎤
= − − +⎢Δ ⎣ ⎦∑ ,
d udt ⎥ , (10)
( ), , ,1 1
2
dNd
h d d i d i d VdmdS m u u Q h
V dt dt⎡ ⎤= − + + +⎢Δ ⎣
∑ S radQ ⎥⎦, (11)
1 , if (fuel),
0, otherwise,k
Nd
Y
dmk F
S V dt⎧− =⎪= Δ⎨⎪⎩
∑ (12)
2 ,
1
air
Nd
ZO
dmS
Y V dtφ
φ⎛ ⎞= − ⎜+ Δ⎝
∑ ⎟⎠ , (13)
where md is the droplet mass, ud,i is the droplet velocity, ΔV is the volume of the control volume for
the gaseous phase calculation, and hV,S is the evaporated vapor enthalpy at the droplet surface. Qd is the convective heat transfer, is the mass fraction of oxygen in air. The source term, Scombu,k, in
the chemical species conservation equation is expressed by the fuel consumption rate, 2 ,O airY
Fw , as
,k k
combu k FF F
n WS
n W= − ⋅ ⋅w , (14)
where nk and nF are the molar stoichiometric coefficients of the k-th species and the fuel in the
one-step global reaction (positive for the productions), respectively. Wk and WF are the molecular
weights of the k-th species and fuel, respectively.
The fuel droplets are tracked individually in a Lagrangian manner. It is assumed that the density
of the droplets is much greater than that of the continuous phase such that only the drag and gravity
are significant. The effect of fluid shear on the fluid force acting on the droplets is omitted [15-17].
Droplet breakup, collision, and dense particulate effects are also omitted [18,19].
Concerning the vaporization of droplets, a non-equilibrium Langmuir-Knudsen evaporation
model is chosen [20-22]. The Lagrangian droplet equations for the position, xd,i, velocity, ud,i,
temperature, Td, and mass, md, are given by
6
,
,d i
d i
dxu
dt= , (15)

, 1
,( )d ii d i
d
du fu u g
dt τ= − + i , (16)
,
( / )d d d
d p d
dT Q dm dt Ldt m c
+= V
( ) 42
, , ,
Nu 1 1 ( )3Pr
p d Vd d
p d d d p d d p d
c dm Lf T T A I Tc m dt c m c
ε π στ
⎛ ⎞⎛ ⎞ ⎛ ⎞d d⎡ ⎤= − + +⎜ ⎟⎜ ⎟ ⎜ ⎟ −⎣ ⎦⎜ ⎟ ⎝ ⎠⎝ ⎠⎝ ⎠
, (17)
Sh ln(1 )3Sc
d dM
d
dm mB
dt τ= − + . (18)
Here, T is the gas-phase temperature, cp is the specific heat of mixture gas, cp,d is the specific heat of
the liquid, LV is the latent heat of vaporization at Td, and g is the gravity. The third term on the
right-hand side of Eq. (17) represents the radiative heat transfer. Ad is the projected area of the
droplet, εd is the particle emission factor, and σ is the Stefan-Boltzman constant. The radiation
intensity, I, is calculated by the radiative transport equation as described later. τd is the particle
response time, and BM is the mass transfer number. Pr, Nu, Sc, and Sh are the Prandtl, Nusselt,
Schmidt, and Sherwood numbers, respectively. f1 and f2 are the corrections of the Stokes drag and the
heat transfer for an evaporating droplet [23]. Detailed definitions of these variables and the
numerical procedure are described in Nakamura et al. [2] and Watanabe et al. [3].
2.3 Radiation modeling
The radiative heat transfer is computed based on the discrete ordinate method [6]. The balance
equation of energy passing a specified direction, Ω, through a small differential volume in an
emitting-absorbing medium can be written as follows,
( , ) ( ) ( , ) ( )bI r I r I rα κ αΩ⋅∇ Ω = − + Ω + , (19) where is the radiation intensity, which is a function of position and direction, ( ,I r Ω) ( )bI r is the
intensity of the black body radiation at the temperature of the medium, and α and κ are the Plank
mean absorption and scattering coefficients of the medium, respectively. The value of α is calculated
using a detailed narrow-band model RADCAL [24], and that of κ is determined based on the droplet
size and number density in each cell [25]. Eq. (19) can be rewritten for the discretization of the
radiative transport equation as
( )m m m
mm m m
I I IbI I
x y zμ ξ η α κ∂ ∂ ∂
+ + = − + +∂ ∂ ∂
κ . (20)
For a discrete direction, Ωm, the values of μm, ξm, and ηm are the direction cosines of Ωm. S8
quadrature approximation which discretizes the radiation emission from each cell into eighty fluxes
is used to solve for the discrete ordinate directions. The radiative transport equation (Eq. (20)) is
iteratively solved with the energy conservation equations (6) and (11). These equations are coupled
7

through the radiative heat source
( 4
4radQ Idπ
α σ− = Ω−∫ )T . (21)
2.4 Soot formation modeling
The transport equations for the soot number density, N, and the mass density, M, are given as
j sj j
Tu Dt x x T xj
Sφρφ φ μρ φ ρ γ φ
⎛ ⎞∂ ∂ ∂ ∂+ − −⎜⎜∂ ∂ ∂ ∂⎝ ⎠
=⎟⎟ , (22)
where φ represents N or M, and Ds is the diffusion coefficient of soot. Here, N and M are given by
A NN N ρφ= , (23)
MM ρφ= , (24) respectively. NA is the Avogadro number ( kmol-1). The source terms for φN and φM can
be expressed as
266.022 10×
. .
1N
Inc CoaA
dN dNSN dt dt
⎡ ⎤⎛ ⎞ ⎛ ⎞= +⎢⎜ ⎟ ⎜ ⎟⎝ ⎠ ⎝ ⎠⎣ ⎦
⎥ , (25)
. .
PM
.Inc Gro OxiA
M dN dM dMSN dt dt dt
⎛ ⎞ ⎛ ⎞ ⎛ ⎞= + +⎜ ⎟ ⎜ ⎟ ⎜ ⎟⎝ ⎠ ⎝ ⎠ ⎝ ⎠ , (26)
where MP is the mass of a soot nucleus and has a value of 1,200 kg/kmol (based on the assumption
that the soot size corresponds to 100 carbon atoms). The fourth term on the left-hand side of Eq. (22)
accounts for the thermophoretic transport, where
( )3
4 1 8Aγ
π=
+ ⋅ , (27)
and the accommodation coefficient A are usually set to be 1.0 [26].
The inception, coagulation, growth and oxidation rates are calculated as follows. A simplified
soot inception model based on the C2H2 concentration (Leung et al. [27]) is used in this study. The
inception rate is given by
2 2
2 2
21100
1.
C H TA
Inc C H
YdN c N edt W
ρ−⎛ ⎞⎛ ⎞ = ⎜ ⎟⎜ ⎟ ⎜ ⎟⎝ ⎠ ⎝ ⎠
, (28)
where c1 = 54 s-1 (Brookes and Moss [28]).
The coagulation of soot particles is assumed to be proportional to the particle collision frequency.
The collision frequency is determined by the size of the particles and the mean free path of the
surrounding gas. The coagulation rate is given by (Puri et al. [29]) 1 2 1 6
1 2 1 6 11 6
.
24 6
Coa s A s
dN R T M Ndt Nρ πρ
⎛ ⎞ ⎛ ⎞⎛ ⎞ = −⎜ ⎟ ⎜ ⎟⎜ ⎟⎝ ⎠ ⎝ ⎠ ⎝ ⎠
, (29)
where R is the universal gas constant, and ρs = 2,000 kg/m3.
8

The soot growth model on the surface is also based on the C2H2 concentration [30,31]. The
growth rate is given by
( )2 2
2 2
2 / 3121001 3
2.
6C H T
Gro C H s
YdM Mc e Ndt W
ρ πρ
− ⎡ ⎤⎛ ⎞ ⎛ ⎞⎛ ⎞ ⎢= ⎜ ⎟ ⎜ ⎟⎜ ⎟ ⎜ ⎟⎝ ⎠ ⎢ ⎝ ⎠⎝ ⎠ ⎣ ⎦⎥⎥
, (30)
where c2 = 9,000.6 kg m /(kmol s).
Both the OH radical and O2 are considered in the oxidation of soot particles [32,33]. The soot
oxidation rate is given by
( )2
2
2 3197781 31 2
3 4.
6OOH T
Oxi OH O s
YYdM Mc c e T Ndt W W
ηρ ρ πρ
−⎧ ⎫ ⎛ ⎞⎪ ⎪⎛ ⎞ = − +⎨ ⎬ ⎜ ⎟⎜ ⎟⎝ ⎠ ⎪ ⎪ ⎝ ⎠⎩ ⎭
, (31)
where η = 0.13, c3 = 105.81 kg m/(kmol K1/2 s) and c4 = 8,903.51 kg m/(kmol K1/2 s).
The concentrations of C2H2 and OH radical are determined using the steady flamelet model [34,
35]. In this model, the concentrations of C2H2 and OH radical at each position in physical space are
identified by using a flamelet library, which is obtained by solving one-dimensional flamelet
equations in mixture fraction space. The parameters used in the table lookup are the mixture fraction,
Z, and the scalar dissipation rate, χ, defined as
22 ZD Zχ = ∇ . (32)
The one-dimensional laminar n-decane/air diffusion flames are calculated in a counterflow
configuration using the commercial software, CFX-RIF. A reduced chemical kinetic mechanism with
112 species and 883 elemental reactions is considered for the flamelet library [36]. In solving the Z
equation (Eq. (8)), the transport of Z originating from the premixed fuel from the lower port is
omitted.
It should be noted here that the present model does not consider condensation of precursors on
the soot particles. It was found in Breitbach et al. [26] from simulations of soot formation in
counterflow diffusion flames that the condensation and particle inception process compete for the
pool of available PAH molecules, but irrespective of the ratio of soot mass production by these two
processes, and almost all of the small PAH are eventually converted to soot. This implies that in such
a model, even if condensation is neglected the totally formed soot mass is almost the same. Since in
the present model the formation of C2H2 and the subsequent formation of soot is treated in a single
step, the assumption here is that condensation processes are lumped into the particle inception rate.
2.5 Computational details
The governing equations for the gaseous phase (Eqs. (4) - (8) and (22)) are solved by a finite volume method using the SIMPLE algorithm [37]. The calculation domain ( 0 * 1x≤ ≤ , ) 1 *y− ≤ ≤1
9

is divided into 200 × 400 equally spaced computational cells in the x and y directions, respectively.
The spatial integration is approximated by a fourth-order central difference scheme and the time
integration is performed via a fully implicit method. The equations of droplet behavior (Eqs. (15) -
(18)) are integrated using a second-order Adams-Bashforth scheme. Mass, heat, and momentum
interactions between gaseous and disperse phases are evaluated on the basis of the control volume of
the gaseous phase calculation [38]. Interaction terms between phases during a calculation time step
are considered at the final droplet location of the time step. At the side wall boundaries, the boundary
conditions are applied as
( )2
2
( )0, 0, 0j
j mj jj
u Pu St x xxρ φρ
∂ ∂ ∂+ − = =
∂ ∂ ∂∂∂
= . (33)
The detailed numerical procedure is described in our previous report [2,3]. The initial velocity of
droplets is the same as the fluid velocity.
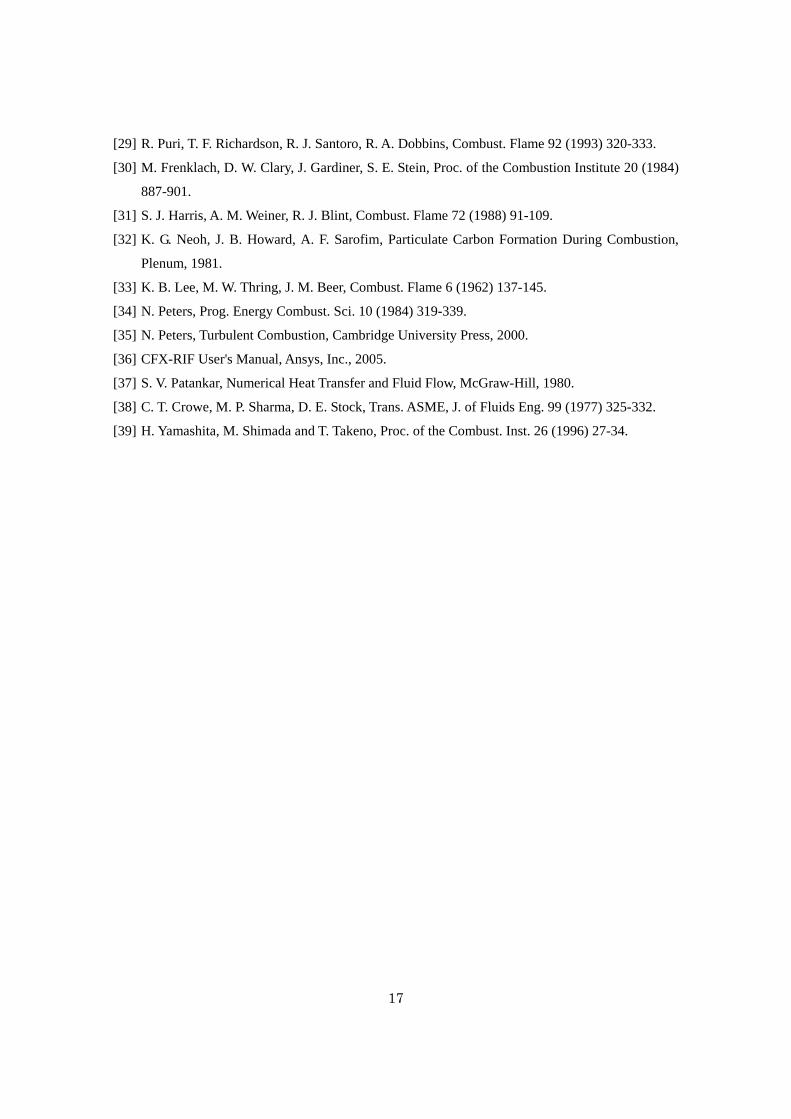
The cases performed here are listed in Table 1. The overall equivalence ratio of the flame is
varied in cases RE1 to RE4 with RE1 being the richest, and RE4 being the leanest flame. All four
cases have the full treatment of radiation and consider radiative interactions of soot, gas phase, and
dispersed phase. Cases E1 and E4 have equivalence ratios corresponding to RE1 and RE4, but
neglect radiation entirely. In order to study the importance of radiative interactions with the
dispersed phase, case PE1 has the same equivalence ratio as cases RE1 and E1, but neglects
radiation from and to the dispersed phase. For all cases, the strain rate, as, and the initial droplet size
based on the Sauter mean diameter, SMD, are set to be 40 s-1 and 106.7 μm, respectively. The strain
rate is defined as the ratio of the inlet gaseous velocity, u0, and the distance between the upper and lower port, Lp ( 02s pa u L≡ ). The overall equivalence ratio is defined as the ratio of total mass of the
droplets and air issued from the upper port. The initial droplet size distribution is set to the same as
that of the experiment [4] as shown in Fig. 2. The Reynolds number based on the burner port
diameter, Lp (= 0.02 m), the fluid velocity, u0 (= 0.4 m/s), and cold air properties is 500 for all cases.
Computations are run for 350ms (0.1 ms × 3,500 timesteps), and the last 500 steps are used for time
averaging. The CPU time required for each case is approximately 20 hours on an AMD Opteron PC.
3. Results and discussion
3.1 Spray flame characteristics
In this section, the effects of radiation on the spray flame characteristics are investigated.
Fig. 3 shows the effect of radiation on the axial variation of fuel droplet diameter. The
time-averaged Sauter mean diameter, SMD, is compared among RE4 (with radiation), E4 (without
radiation), and the experiments by Hwang et al. [4]. The equivalence ratios are identical (φl = 0.42)
for all cases. SMD is defined as
10

3
2dN
dN
dSMD
d= ∑∑ . (34)
It is found that in the experiments [4] SMD slightly increases with increasing distance from the upper port, px L . This tendency is also found for both cases RE4 and E4. The increase in SMD is due to
the fact that the smaller droplets tend to evaporate and vanish faster than the larger ones.
Quantitatively, SMD is under-estimated for both cases RE4 and E4, but the discrepancy is
diminished for case RE4 by taking radiation into account. This is because the flame temperature is
decreased by the radiative heat transfer between the flame, the surrounding unburned cold gas, and
the dispersed fuel droplets, which delays the droplet evaporation rate. This will be discussed in detail
later. It seems to indicate that the comparison between the experimental and computational data is
effective to discuss the general spray combustion behavior.
Fig. 4 shows the effects of radiation on the instantaneous distributions of the gas-phase
temperature, T, the mixture fraction, Z, and the flame index, FI. The cases RE1 (with radiation), E1
(without radiation) and PE1 (with gaseous radiation) are compared (φl = 1.26). In the figure, white
dots indicate the locations of the droplets. The parameter FI defined as
10 22 2C H OFI Y Y= ∇ ⋅∇ , (35) is used to distinguish between premixed and diffusion flames (Yamashita et al. [39]). FI becomes
positive for premixed flames and negative for diffusion flames. It is found that the fuel droplets
issued from the upper ports evaporate on their way downstream and a high temperature region is
formed in the center of the flow field by burning the evaporated fuel. A comparison of cases RE1
and E1 shows that the flame temperature is increased by ignoring radiation. This is because radiation
acts to transfer energy from the flame to the unburned gas and dispersed droplets, whose temperature
is much lower than the flame temperature. Due to this temperature increase, the droplet evaporation
is accelerated and the number of droplets entering the high temperature region tends to decrease for
case E1 compared to case RE1. Accordingly, the increase in the mixture fraction, which is an
important parameter for the combustion process, also tends to be accelerated for case E1 (Fig. 4(b)).
Nakamura et al. [2] showed that premixed and diffusion flames coexist in the spray flame, and that
droplet group combustion appears in the diffusion flame. Compared to case RE1, the premixed
regime for case E1 shifts slightly upstream, and then the diffusion regime expands for case E1 owing
to the temperature increase. On the other hand, comparing cases RE1 and PE1 shows that the
radiative heat transfer between the flame and dispersed droplets is likely to have a small influence on
the distribution of the gas-phase temperature.
The quantitative comparisons of the time-averaged profiles of the gas-phase temperature, T , the mixture fraction, Z , the evaporation rate of droplets, mS , among cases RE1, E1, and PE1 are
shown in Fig. 5. It is found that for case RE1, there are main preheat and evaporation layers in
11
0.25 0.3px L≤ ≤ . Then the heat release becomes significant and T increases to its maximum value.
As T increases, mS increases and reaches its peak value at 0.35px L = . Since Z produced by the
evaporation is transported downstream and keeps growing by droplet evaporation, the peak of Z is located about 0.1 downstream of the peak of mS , where the evaporation rate goes to zero. For case
E1, due to omission of the radiative heat transfer between the flame, unburned gas and dispersed
droplets, the peak value of T is approximately 300 K higher and the droplets ignite earlier than for case RE1. Also, the increase of both Z and mS takes place earlier than for case RE1. On the other
hand, the comparison between cases RE1 and PE1 shows that although the discrepancies in T and Z are very small, the peak value of mS for case PE1 falls to about 10 percent lower than that for
RE1 by omitting the radiative heat transfer between the flame and dispersed droplets. This means
that the flame behavior is strongly affected by the radiative heat transfer to the unburned gas, but not
to the dispersed droplets. However, the radiative heat transfer between the flame and dispersed
droplets is also very important for better prediction of the droplet evaporation rate.
Thus, the radiation significantly affects the characteristics of the spray flames. Without the
radiation model, the flame temperature and droplet evaporation rate are largely over-estimated.
However, it should be noted that the effects presented here are for the spray flames formed in a
counterflow, in which the fuel droplets perpendicularly penetrate the high temperature flame. For jet
flames, when a high-temperature co-flow is used to ignite the flame, the fuel droplets generally
move in parallel with the high temperature flame in the region near the inlet. Under these conditions,
radiation transfer of energy into the droplets might act to enhance the droplet evaporation.
3.2 Soot formation
The effects of radiation and the equivalence ratio of droplet fuel on the soot formation are
discussed in this section.
Fig. 6 shows the instantaneous distributions of the soot volume fraction, Vs, for cases RE1
(with radiation), E1 (without radiation), and PE1 (with gaseous radiation). Also, the time-averaged
profiles of the gas-phase temperature, T , mixture fraction, Z , soot volume fraction, sV ,
evaporation rate of droplets, mS , mass fraction of the soot precursor and oxidizer, kY , and the
source terms of the soot mass density, MS , for case RE1 are shown in Fig. 7. White dots in Fig.6
indicate the locations of the droplets. In case RE1, the soot is found to be mainly formed in the upper
part of the high temperature region (see Fig. 4), and the high soot volume fraction region
corresponds to the location where the diffusion flame originating from droplet group combustion is
formed (Nakamura et al. [2]). As also discussed earlier in Fig. 5 for case RE1, since Z produced by
the evaporation is transported downstream, the peak of Z is located downstream of the peak of
mS . On the other hand, the location indicating the peak value of sV corresponds to that of Z , and
12

the shape of the profile of sV is similar to that of Z . It is also observed in Fig. 7 (b) that the mass fraction of precursor
2 2C HY indicates the maximum value around 0.4px L = , where the mass
fractions of two oxidizers, OHY and 2OY , indicate the minimum value between the peaks
(around px L = 0.35 and 0.5) and almost zero, respectively. The marked OHY reduction
between the peaks can be explained in Fig. 7 (c). Although the total soot formation rate almost corresponds to and hence attributes to the inception rate, the oxidation rate increases as the inception rate increases, which reduces OHY remarkably. On the other
hand, since O2 has already been consumed by the droplet group combustion in this downstream region,
2OY is almost zero and does not seem to be affected by soot oxidation. The surface growth
of soot is found to have only a minor effect on soot formation. This is consistent with the findings of
Breitbach et al. [26] in counterflow diffusion flames using gaseous acetylene as the fuel. In that
study it was also found that particle inception has only a small contribution to the total soot mass,
but that condensation of small PAH molecules is mostly responsible for the soot mass growth. This
is also consistent with the present results, where condensation processes are captured by the particle
inception model.
The comparison of the three cases RE1, E1, and PE1 in Fig. 6 shows that for case E1, the high
soot volume fraction region distributes much wider than that for case RE1 in the center of the flow
field where the spray diffusion flame is formed (see Fig. 4). Also, the soot volume fraction for case
PE1 is slightly lower and spreads less than that for case RE1. This suggests that unlike the flame
temperature distribution as shown in Figs. 4 and 5, the effect of the radiative heat transfer between
the flame and dispersed droplets is not negligible for the distribution of the soot volume fraction. The effects of radiation on the time-averaged profiles of the soot volume fraction, sV , and mass
fractions of chemical species of the soot precursor (C2H2) and oxidizers (OH and O2), kY are
shown in Fig. 8. A comparison of cases RE1 and E1 shows that the peak value of sV is much higher
and the high sV region is wider for case E1 than for case RE1. However, no difference in the peak values of
2 2C HY between cases RE1 and E1 is observed. In addition, the peak value of OHY for E1
is higher than that for case RE1. The reason why the value of sV is much higher for case E1 is that
the temperature for case E1 becomes much higher than that for case RE1 by omitting the radiative
heat transfer between the flame, unburned cold gas, and dispersed droplets (see Fig. 4), which
increases the total soot formation rate. According to Eqs. (28) - (31), like the soot inception and
surface growth, the oxidation rate should increase with the increase in the gas-phase temperature,
which acts to suppress soot formation. However, for the present cases, O2 has already been
consumed by the droplet group combustion, for which the oxidation is not very effective. As a result,
the soot formation is increased by omitting radiation. The comparison of cases RE1 and PE1 also reveals that the peak value of sV for case RE1 is about 10 percent lower than that for case RE1.
13

This is considered to be due to the droplet evaporation rate for case PE1 being lower than that for
case RE1, as discussed earlier in Figs. 4 and 5.
Fig. 9 shows the effects of the equivalence ratio of droplet fuel on the instantaneous
distributions of the gas-phase temperature, T, the flame index, FI, the soot radiation emission, Es,
and photographs taken in the experiments (Hwang et al. [4]). The cases RE1 (φl = 1.26), RE2 (φl =
0.84) and RE3 (φl = 0.63) are compared. Es defined as
4s sE V Tσ= , (36)
can be correlated with the luminous flame since the brightness of the luminous flame is proportional
to the radiation emission from soot. It is observed that as φl increases, both the high gas-phase
temperature and diffusion flame regions become large. Also, Es increases significantly with the
increase in φl. This trend is in good qualitative agreement with the behavior of the luminous flames
observed in the experiment. In the experiment, the luminous flames for case RE1 are observed
constantly, while those for case RE3 are observed only intermittently. Fig. 10 shows the effects of
the equivalence ratio on the time-averaged profiles of the gas-phase temperature, T , the evaporation rate of droplets, mS , the soot volume fractions, sV , and mass fractions of C2H2, 2 2C HY .
A large difference in the peak values of T is not observed among cases RE1, RE2, and RE3. However, the peak value of sV increases dramatically as φl increases. This is because the increase in mS with φl promotes the formation of the precursor of soot, namely
2 2C HY .
4. Conclusions
Two-dimensional numerical simulations were applied to spray flames formed in a laminar
counterflow, and the effects of radiation on spray flame characteristics and soot formation were
studied. The main results obtained in this study can be summarized as follows.
(1) Gas phase radiation significantly affects spray flame temperature and soot formation. The
flame temperature and soot volume fraction predicted without the radiation model are much
higher than those with the radiation model. This is because the temperature of unburned gas
and fuel droplets is much lower than the gaseous flame temperature, which reduces the flame
temperature and then the soot inception and growth rates.
(2) The radiative coupling between gas phase and dispersed phase does not impact the heat release
and the distribution of the main species very much. However, this coupling is quite important
for the formation of soot.
(3) Soot is formed in the diffusion flame (droplet group combustion) regime and its radiation
emission increases with the increase in the equivalence ratio of droplet fuel. This trend
coincides well with the luminous flame behavior observed in the experiments. The increase in
14

15
soot radiation emission is due to the increase in precursor (C2H2) production.
Acknowledgements
The authors are grateful to Prof. Fumiteru Akamatsu of Osaka University for providing the
experimental data and useful discussions. The authors would also like to thank Drs. Yuya Baba,
Seung-Ming Hwang, and Maromu Otaka of CRIEPI, and Dr. Mariko Nakamura of Osaka University
for their help in developing the simulation code. They are also grateful to Drs. Matthias Ihme and
Olivier Desjardins of the Center for Turbulence Research, Stanford University for many inspiring
discussions.

16
References [1] R. Kurose, O. Desjardins, M. Nakamura, F. Akamatsu, H. Pitsch, Annual Research Briefs-2004,
Center for Turbulence Research, NASA Ames/Stanford University (2004) 269-280.
[2] M. Nakamura, F. Akamatsu, R. Kurose, M. Katsuki, Phys. Fluids 17 (2005) 123301.
[3] H. Watanabe, R. Kurose, S.-M. Hwang, F. Akamatsu, Combust. Flame 148 (2007) 234-248.
[4] S.-M. Hwang, H. Saito, S. Takada, F. Akamatsu, M. Katsuki, Proc. of the Japanese Combust.
Symp., 38 (2000) 201-202.
[5] R. S. Barlow, A. N. Karpetis, J. H. Frank, Combust. Flame 127 (2001) 2102-2118.
[6] W. A. Fiveland, J. Thermophysics 2 (1988) 309-316.
[7] J. R. Howell, M. Perlmutter, AIChE J. 10 (1964) 562-567.
[8] P. J. Coelho, O. J. Teerling, D. Roekaerts, Combust. Flame 133 (2003) 75-91.
[9] L. Wang, D. C. Haworth, S. R. Turns, M. F. Modest, Combust. Flame 141 (2005) 170-179.
[10] R. Kurose, H. Makino, A. Suzuki, Fuel 83 (2004) 693-703.
[11] C. C. Tseng, R. Viskanta, Combust. Sci. Tech. 177 (2005) 1511-1542.
[12] H. Pitsch, E. Riesmeier, N. Peters, Combust. Sci. Tech. 158 (2000) 389-406.
[13] Z. Wen, S. Yun, M. J. Thomson, M. F. Lightstone, Combust. Flame 135 (2003) 323-340.
[14] C. K. Westbrook and F. L. Dryer, Prog. Energy Combust. Sci. 10 (1984) 1-57.
[15] P.G. Saffman, J. Fluid Mech.22 (1965) 385-400, and Corrigendum 31 (1968) 624.
[16] R. Kurose, S. Komori, S., J. Fluid Mech. 384 (1999) 183-206.
[17] R. Kurose, R. Misumi, S. Komori, Int. J. Multiphase Flow 27 (2001) 1247-1258.
[18] F. Ham, S. V. Apte, G. Iaccarino, X. Wu, M. Herrmann, G. Constantinescu, K. Mahesh, P. Moin,
Annual Research Briefs-2003, Center for Turbulence Research, NASA Ames/Stanford
University (2003) 139-160.
[19] M.G. Allen, R.K. Hanson, Proc. of the Combustion Institute 21 (1986) 1755-1762.
[20] J. Bellan, K. Harstad, Int. J. Heat Mass Transfer 30 (1987) 125-136.
[21] R.S. Miller, K. Harstad, J. Bellan, J. Multiphase Flow 24 (1998) 1025-1055.
[22] R.S. Miller, J. Bellan, J. Fluid Mech. 384 (1999) 293-338.
[23] R. Kurose, H. Makino, S. Komori, M. Nakamura, F. Akamatsu, M. Katsuki, Phys. Fluids 15
(2003) 2338-2351.
[24] W. L. Grosshandler, NIST Technical Note 1402 (1993).
[25] M. F. Modest, Radiative Heat Transfer, McGraw-Hill, Inc., 1993.
[26] H. Breitbach, J. Goettgens, F. Mauss, H. Pitsch and N. Peters, Proc. of the Combustion Institute
25 (1994) 1357-1364.
[27] K. M. Leung, R. P. Lindstedt, W. P. Jones, Combust. Flame 87 (1991) 289-305.
[28] S. J. Brookes, J. B. Moss, Combust. Flame 116 (1999) 486-503.
17
[29] R. Puri, T. F. Richardson, R. J. Santoro, R. A. Dobbins, Combust. Flame 92 (1993) 320-333.
[30] M. Frenklach, D. W. Clary, J. Gardiner, S. E. Stein, Proc. of the Combustion Institute 20 (1984)
887-901.
[31] S. J. Harris, A. M. Weiner, R. J. Blint, Combust. Flame 72 (1988) 91-109.
[32] K. G. Neoh, J. B. Howard, A. F. Sarofim, Particulate Carbon Formation During Combustion,
Plenum, 1981.
[33] K. B. Lee, M. W. Thring, J. M. Beer, Combust. Flame 6 (1962) 137-145.
[34] N. Peters, Prog. Energy Combust. Sci. 10 (1984) 319-339.
[35] N. Peters, Turbulent Combustion, Cambridge University Press, 2000.
[36] CFX-RIF User's Manual, Ansys, Inc., 2005.
[37] S. V. Patankar, Numerical Heat Transfer and Fluid Flow, McGraw-Hill, 1980.
[38] C. T. Crowe, M. P. Sharma, D. E. Stock, Trans. ASME, J. of Fluids Eng. 99 (1977) 325-332.
[39] H. Yamashita, M. Shimada and T. Takeno, Proc. of the Combust. Inst. 26 (1996) 27-34.

List of captions for table and figures
Table 1 Cases performed in this study
Fig. 1. Schematic of computational setup.
Fig. 2. Droplet size distribution.
Fig. 3. Effect of radiation on axial variation of fuel droplet diameter (time-averaged Sauter mean
diameter, SMD).
Fig. 4. Effects of radiation on instantaneous distributions of (a) gas-phase temperature, T, (b)
mixture fraction, Z, and (c) flame index, FI. White dots indicate the locations of droplets.
Fig. 5. Effects of radiation on time-averaged profiles of gas-phase temperature, T , mixture fraction, Z , and evaporation rate of droplets, mS .
Fig. 6. Effects of radiation on instantaneous distribution of soot volume fraction, Vs. (a) case RE1,
(b) case E1, and (c) case PE1. White dots indicate the locations of droplets.
Fig. 7. Time-averaged profiles of (a) gas-phase temperature, T , mixture fraction, Z , soot volume fraction, sV , and evaporation rate of droplets, mS , (b) mass fractions of soot
precursor and oxidizers, kY , and (c) source terms of soot mass density, MS , for case RE1.
Fig. 8. Effects of radiation on time-averaged profiles of soot volume fraction, sV , and mass
fractions of chemical species of soot precursor and oxidizers, kY . (a) case RE1, (b) case E1,
and (c) case PE1.
Fig. 9. Effects of equivalence ratio on instantaneous distributions of (a) gas-phase temperature, T,
(b) flame index, FI, (c) soot radiation emission, Es, (d) experiment's photographs. White
dots indicate the locations of droplets.
Fig. 10. Effects of equivalence ratio on time-averaged profiles of (a) gas-phase temperature, T , and evaporation rate of droplets, mS , and (b) soot volume fraction, sV , and mass fraction of C2H2, 2 2C HY .
18
19
Table 1
Cases Equivalence ratio
φl [-] Radiation
RE1 1.26 Yes RE2 0.84 Yes RE3 0.63 Yes RE4 0.42 Yes E1 1.26 No E4 0.42 No
PE1 1.26 Continuous phase only

Fig. 1.
20

Fig. 2.
21
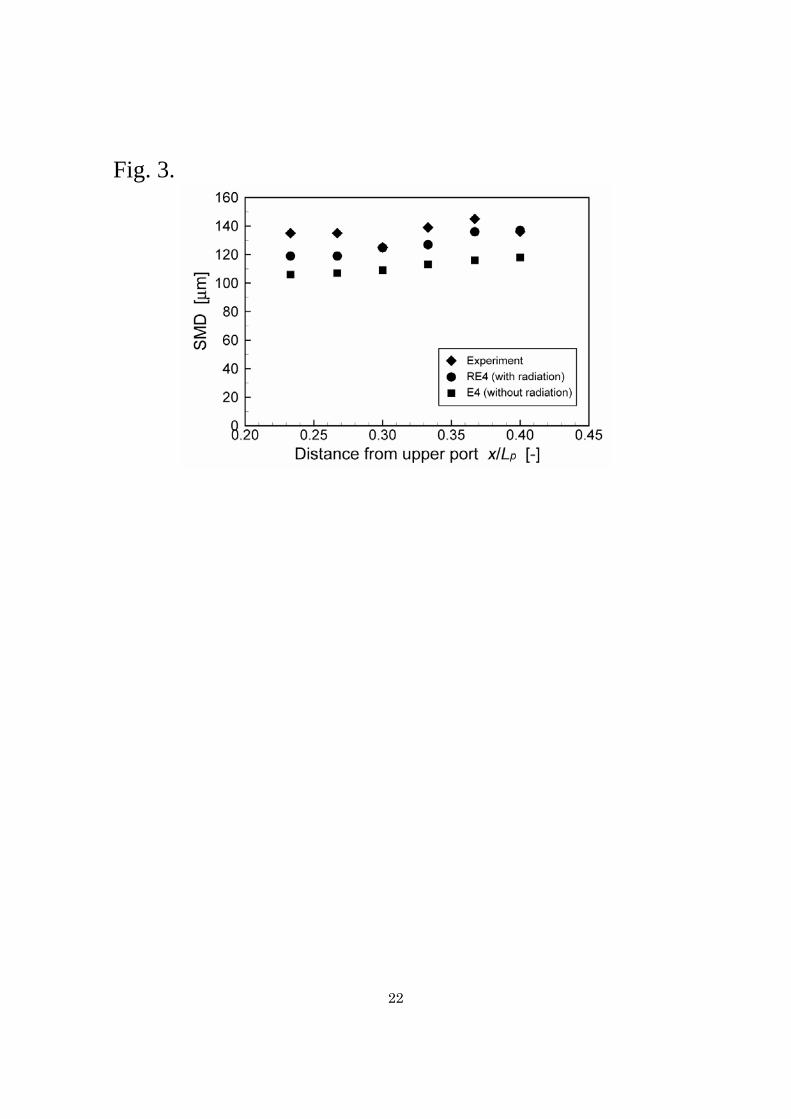
Fig. 3.
22

Fig. 4.
23

Fig. 5.
24
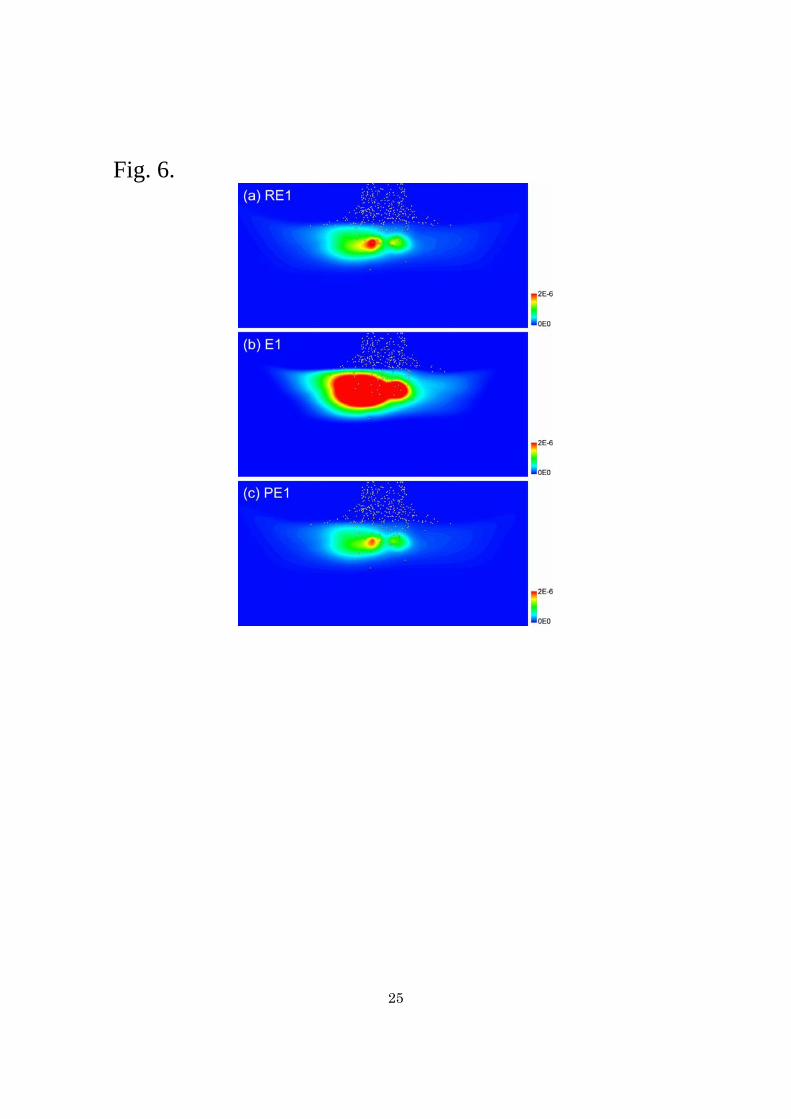
Fig. 6.
25

Fig. 7.
26

Fig. 8.
27

Fig. 9.
28
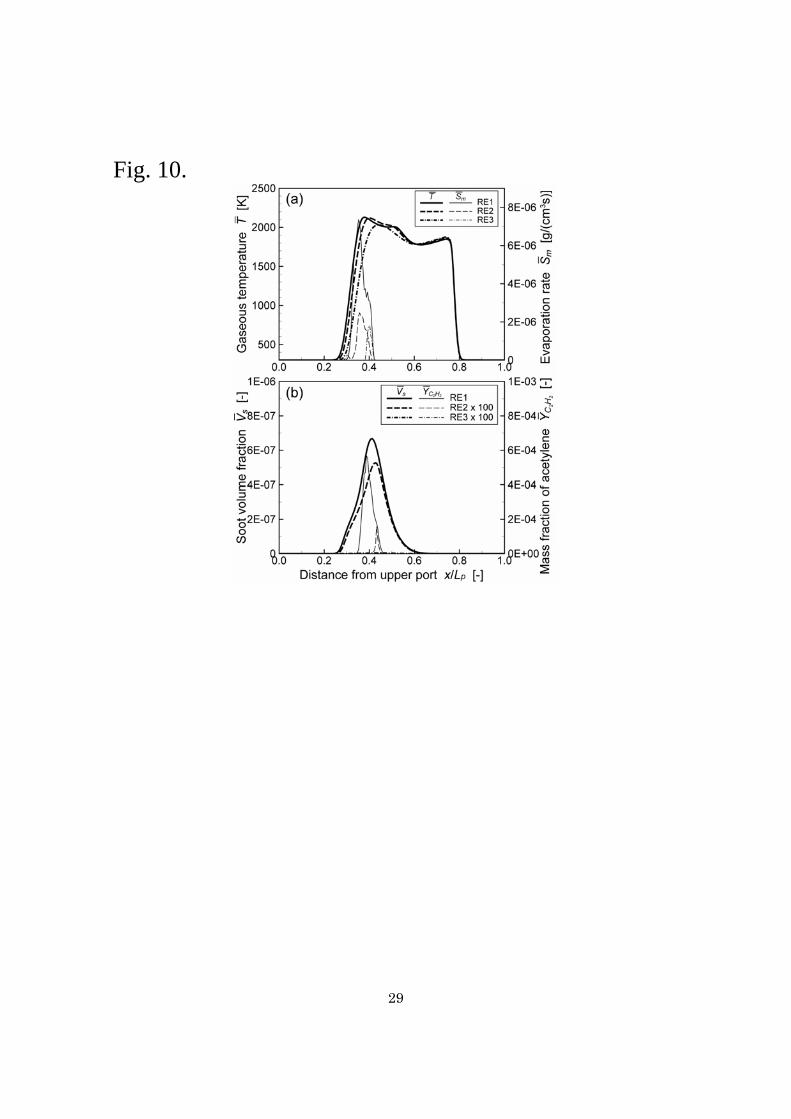
Fig. 10.
29


![Nanoparticles For Soot Reduction [Div]](https://img.pdfslide.us/doc/110x75/61fbd2699871014c47523f3a/nanoparticles-for-soot-reduction-div.jpg)