Embed Size (px)
Citation preview

RIGHT:
URL:
CITATION:
AUTHOR(S):
ISSUE DATE:
TITLE:
Detection of high-energy heavy ionsusing piezoelectric lead zirconatetitanate
Takechi, Seiji; Morinaga, Shin-ya; Kurozumi, Atsuma;Miyachi, Takashi; Fujii, Masayuki; Hasebe, Nobuyuki;Shibata, Hiromi; Murakami, Takeshi; Uchihori, Yukio; Okada,Nagaya
Takechi, Seiji ...[et al]. Detection of high-energy heavy ions using piezoelectric leadzirconate titanate. JOURNAL OF APPLIED PHYSICS 2009, 105(8): 084903.
2009-04
http://hdl.handle.net/2433/109897
Copyright 2009 American Institute of Physics. This article may be downloaded forpersonal use only. Any other use requires prior permission of the author and theAmerican Institute of Physics. The following article appeared in JOURNAL OF APPLIEDPHYSICS 105, 084903 (2009) and may be found athttp://link.aip.org/link/JAPIAU/v105/i8/p084903/s1
Detection of high-energy heavy ions using piezoelectric lead zirconatetitanate
Seiji Takechi,1,a� Shin-ya Morinaga,1 Atsuma Kurozumi,1 Takashi Miyachi,2 Masayuki Fujii,2
Nobuyuki Hasebe,2 Hiromi Shibata,3 Takeshi Murakami,4 Yukio Uchihori,4 andNagaya Okada5
1Graduate School of Engineering, Osaka City University, Osaka 558-8585, Japan2Advanced Research Institute for Science and Engineering, Waseda University, Tokyo 169-8555, Japan3Graduate School of Engineering, Kyoto University, Kyoto 606-8501, Japan4National Institute of Radiological Sciences, Chiba 263-8555, Japan5Honda Electronics Co., Ltd., Aichi 441-3193, Japan
�Received 2 December 2008; accepted 21 February 2009; published online 20 April 2009�
The characteristics of a radiation detector fabricated with stacks of piezoelectric lead zirconatetitanate �PZT� elements were studied by irradiating it with a 400 MeV /n xenon �Xe� beam forvarious beam pulse durations. This detector is referred to as the multilayered detector �MD�. Tounderstand the production mechanism behind the output voltage obtained from the MD,measurement of the spatial distribution of the output signals generated in the MD was attempted. Itwas found that the amplitude observed was dependent on the number of Xe ions per unit time andthe amount of ionization loss energy of Xe ions in PZT. © 2009 American Institute of Physics.�DOI: 10.1063/1.3106634�
I. INTRODUCTION
The detection of high-energy particles via the measure-ment of an acoustic wave that is generated in a liquid targethas been studied and the feasibility of using the acousticmethod was suggested.1–3 The acoustic wave was measuredby the hydrophones soaked in liquid medium. Lead zirconatetitanate �PZT� may be useful as the hydrophone. BecausePZT is a piezoelectric ceramic, it can be easily formed intoarbitrary shapes and can be operated without a power supplybecause of its piezoelectricity, which means that the strainbrought by an external force produces an electric charge onthe surface of the material. In addition, PZT is resistant tohigh temperature. On the basis of the above features, we arenow investigating the capability of the PZT to measureradiation.4–11
The characteristics of some detectors fabricated usingPZT have been investigated with a 400 MeV /n xenon �Xe�beam. The beam was supplied by the Heavy Ion MedicalAccelerator in Chiba �HIMAC� at the National Institute ofRadiological Sciences.12 These experiments have been per-formed with the following two methods. One is an indirectmethod. When the high-energy heavy ions enter a liquid ma-terial, they will lose their kinetic energy mainly due to ion-ization of the material. Then, the energy will be convertedinto heat, which generates a pressure wave via volume ex-pansion. Consequently, the pressure wave will propagate inthe material. The pressure wave was measured using the PZTdetector set in the liquid material, such as water, chloroform,and ethanol, irradiated by the beam.5,8,10 The other is a directmethod. When the PZT detector was directly irradiated bythe beam, the electric signal generated on the PZT wasmonitored.4,6,7,9,11
In our previous studies concerning the direct method, thecharacteristics of two types of PZT detector were studiedusing the Xe beam while varying the beam pulseduration.7,9,11 One detector consisted of a single PZT diskwith two silver �Ag� electrodes that were coated onto thefront and back surfaces of the disk. We referred to this de-tector as the single-layered detector �SD�. The other detectorwas fabricated by stacking some thin PZT disks having thesame diameter as the SD. A 2-�m-thick metal sheet made ofAg–Pd was sandwiched between each pair of disks. Thesedisks were sintered to be the same thickness as the SD andthe front and back surfaces of the assembled stack were cov-ered with the Ag electrodes. We referred to this detector asthe multilayered detector �MD�. The output voltage betweenthe two electrodes was monitored. The amplitudes of thesignals obtained from the two detectors were almost inde-pendent of the beam pulse duration. This was clearly differ-ent from the result obtained for the indirect method.8 It wasalso found that the amplitude obtained from the MD waslarger than that from the SD under the experimental condi-tions. The induced voltage may be considered to be due toionization, thermal, elastic, and piezoelectric processes in thesolid material. However, we still cannot explain in detail theproduction mechanism of the output signal from the PZT bydirect interaction with the high-energy Xe beam.
In this study, when the MD was bombarded with the Xebeam, some output signals appeared on the thin PZT ele-ments, of which the MD was built. We attempted to measurethese signals while changing the beam pulse duration to ashorter range than that used so far.
II. EXPERIMENT
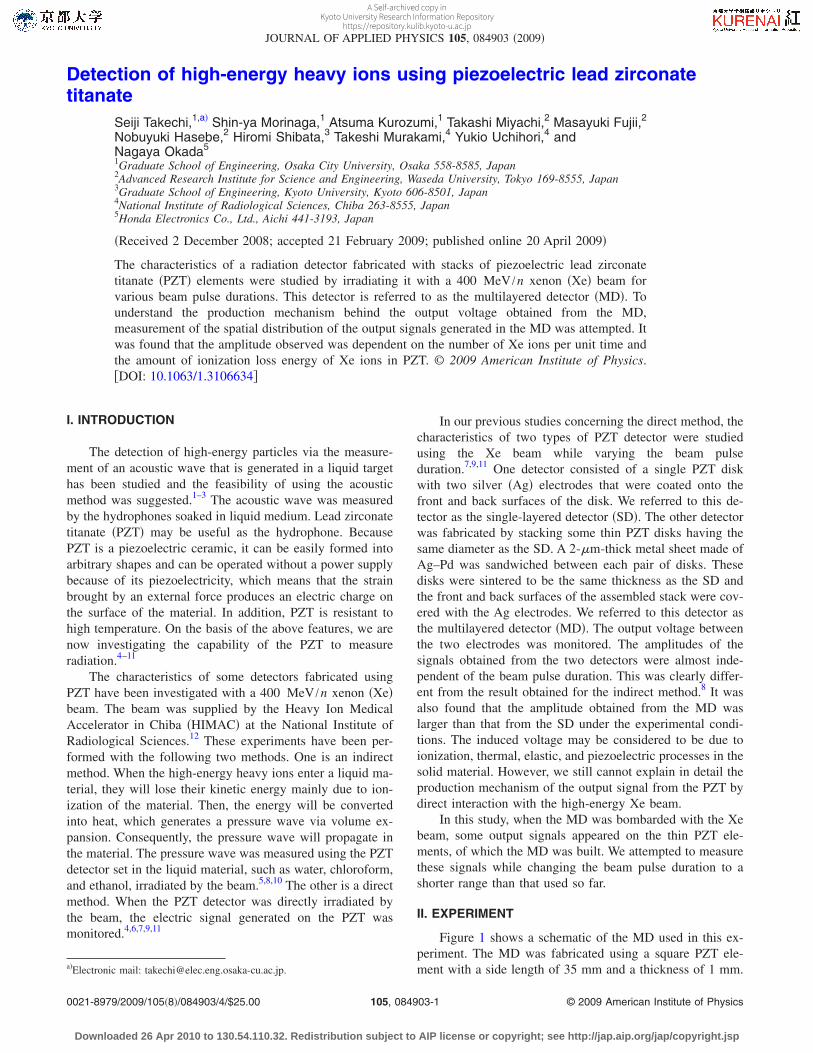
Figure 1 shows a schematic of the MD used in this ex-periment. The MD was fabricated using a square PZT ele-ment with a side length of 35 mm and a thickness of 1 mm.a�Electronic mail: [email protected].
JOURNAL OF APPLIED PHYSICS 105, 084903 �2009�
0021-8979/2009/105�8�/084903/4/$25.00 © 2009 American Institute of Physics105, 084903-1
Downloaded 26 Apr 2010 to 130.54.110.32. Redistribution subject to AIP license or copyright; see http://jap.aip.org/jap/copyright.jsp
A Self-archived copy inKyoto University Research Information Repository
https://repository.kulib.kyoto-u.ac.jp
The seven elements were sintered with the Ag electrode afew �m thick that was deposited on the surfaces and the totalthickness of the MD was 7 mm. The electrode on the frontsurface of the MD was grounded and is denoted as G in Fig.1. The other electrodes are indicated as 1–7 from the sidenearest to G, as shown in Fig. 1.
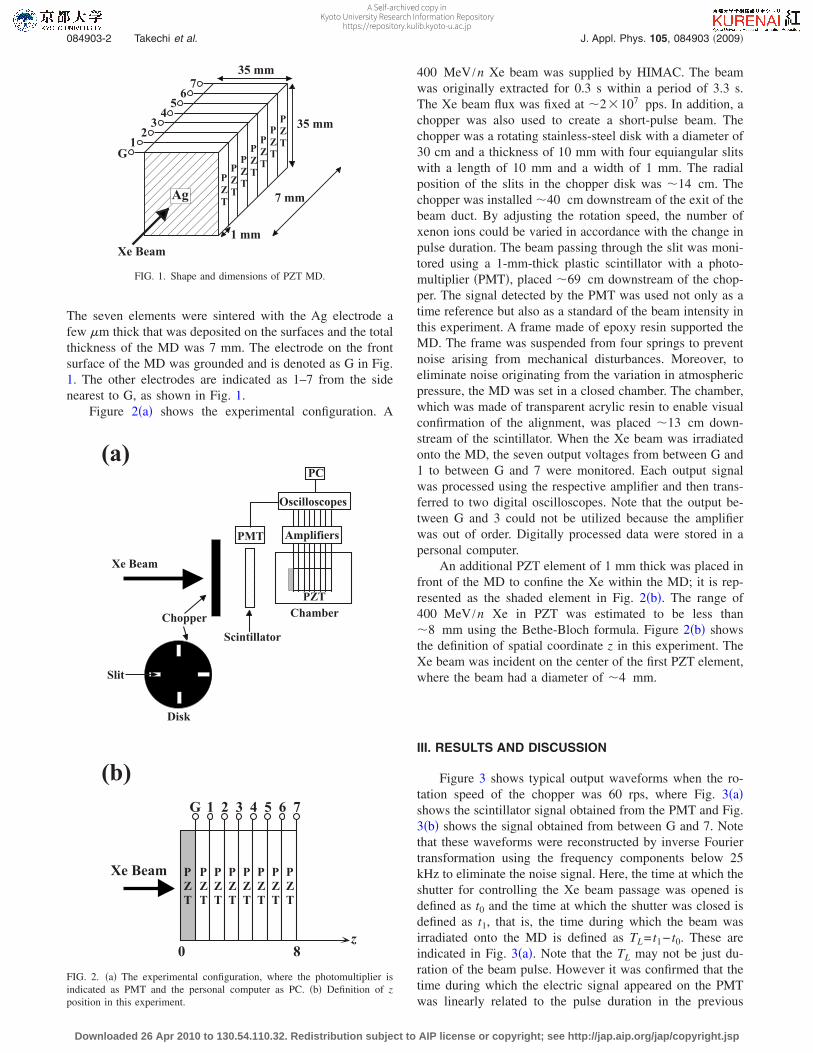
Figure 2�a� shows the experimental configuration. A
400 MeV /n Xe beam was supplied by HIMAC. The beamwas originally extracted for 0.3 s within a period of 3.3 s.The Xe beam flux was fixed at �2�107 pps. In addition, achopper was also used to create a short-pulse beam. Thechopper was a rotating stainless-steel disk with a diameter of30 cm and a thickness of 10 mm with four equiangular slitswith a length of 10 mm and a width of 1 mm. The radialposition of the slits in the chopper disk was �14 cm. Thechopper was installed �40 cm downstream of the exit of thebeam duct. By adjusting the rotation speed, the number ofxenon ions could be varied in accordance with the change inpulse duration. The beam passing through the slit was moni-tored using a 1-mm-thick plastic scintillator with a photo-multiplier �PMT�, placed �69 cm downstream of the chop-per. The signal detected by the PMT was used not only as atime reference but also as a standard of the beam intensity inthis experiment. A frame made of epoxy resin supported theMD. The frame was suspended from four springs to preventnoise arising from mechanical disturbances. Moreover, toeliminate noise originating from the variation in atmosphericpressure, the MD was set in a closed chamber. The chamber,which was made of transparent acrylic resin to enable visualconfirmation of the alignment, was placed �13 cm down-stream of the scintillator. When the Xe beam was irradiatedonto the MD, the seven output voltages from between G and1 to between G and 7 were monitored. Each output signalwas processed using the respective amplifier and then trans-ferred to two digital oscilloscopes. Note that the output be-tween G and 3 could not be utilized because the amplifierwas out of order. Digitally processed data were stored in apersonal computer.
An additional PZT element of 1 mm thick was placed infront of the MD to confine the Xe within the MD; it is rep-resented as the shaded element in Fig. 2�b�. The range of400 MeV /n Xe in PZT was estimated to be less than�8 mm using the Bethe-Bloch formula. Figure 2�b� showsthe definition of spatial coordinate z in this experiment. TheXe beam was incident on the center of the first PZT element,where the beam had a diameter of �4 mm.
III. RESULTS AND DISCUSSION
Figure 3 shows typical output waveforms when the ro-tation speed of the chopper was 60 rps, where Fig. 3�a�shows the scintillator signal obtained from the PMT and Fig.3�b� shows the signal obtained from between G and 7. Notethat these waveforms were reconstructed by inverse Fouriertransformation using the frequency components below 25kHz to eliminate the noise signal. Here, the time at which theshutter for controlling the Xe beam passage was opened isdefined as t0 and the time at which the shutter was closed isdefined as t1, that is, the time during which the beam wasirradiated onto the MD is defined as TL= t1− t0. These areindicated in Fig. 3�a�. Note that the TL may not be just du-ration of the beam pulse. However it was confirmed that thetime during which the electric signal appeared on the PMTwas linearly related to the pulse duration in the previous
�
�
�
�
�
�
�
�
�
�
�
�
�
�
�
�
�
�
�
�
�
� �
�����
� � �
� �
� � �
� � �
� � � � � �
FIG. 1. Shape and dimensions of PZT MD.
� � � �
� � � � � �
� � � �
� � � � � � � � � � � �
� � �
� � � � � �
� ! �
" � � � � � � � � � # � �
� �
� � � # # � �
$ � %
�
�
�
�
�
�
�
�
�
�
�
�
�
�
�
�
�
�
�
�
�
�
�
�
�
& '
� � � � �
� � � � � �
$ %
� � # � � ( � � � �
FIG. 2. �a� The experimental configuration, where the photomultiplier isindicated as PMT and the personal computer as PC. �b� Definition of zposition in this experiment.
084903-2 Takechi et al. J. Appl. Phys. 105, 084903 �2009�
Downloaded 26 Apr 2010 to 130.54.110.32. Redistribution subject to AIP license or copyright; see http://jap.aip.org/jap/copyright.jsp
A Self-archived copy inKyoto University Research Information Repository
https://repository.kulib.kyoto-u.ac.jp
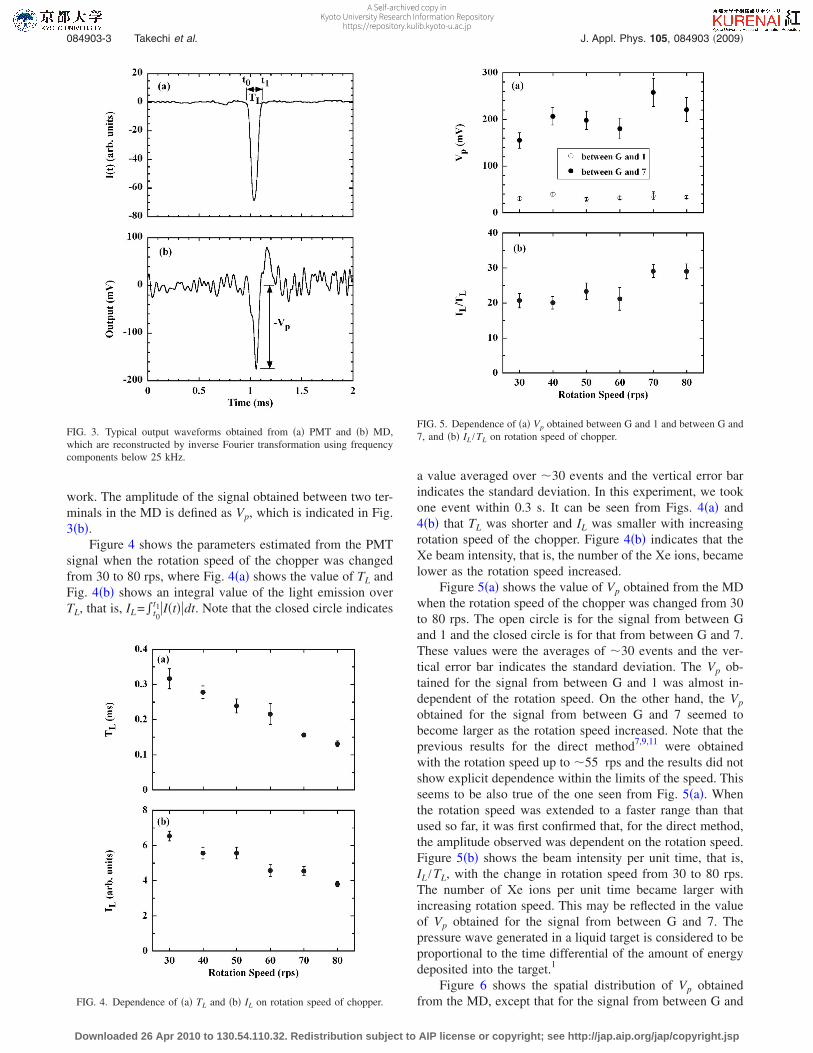
work. The amplitude of the signal obtained between two ter-minals in the MD is defined as Vp, which is indicated in Fig.3�b�.
Figure 4 shows the parameters estimated from the PMTsignal when the rotation speed of the chopper was changedfrom 30 to 80 rps, where Fig. 4�a� shows the value of TL andFig. 4�b� shows an integral value of the light emission overTL, that is, IL=�t0
t1�I�t��dt. Note that the closed circle indicates
a value averaged over �30 events and the vertical error barindicates the standard deviation. In this experiment, we tookone event within 0.3 s. It can be seen from Figs. 4�a� and4�b� that TL was shorter and IL was smaller with increasingrotation speed of the chopper. Figure 4�b� indicates that theXe beam intensity, that is, the number of the Xe ions, becamelower as the rotation speed increased.
Figure 5�a� shows the value of Vp obtained from the MDwhen the rotation speed of the chopper was changed from 30to 80 rps. The open circle is for the signal from between Gand 1 and the closed circle is for that from between G and 7.These values were the averages of �30 events and the ver-tical error bar indicates the standard deviation. The Vp ob-tained for the signal from between G and 1 was almost in-dependent of the rotation speed. On the other hand, the Vp
obtained for the signal from between G and 7 seemed tobecome larger as the rotation speed increased. Note that theprevious results for the direct method7,9,11 were obtainedwith the rotation speed up to �55 rps and the results did notshow explicit dependence within the limits of the speed. Thisseems to be also true of the one seen from Fig. 5�a�. Whenthe rotation speed was extended to a faster range than thatused so far, it was first confirmed that, for the direct method,the amplitude observed was dependent on the rotation speed.Figure 5�b� shows the beam intensity per unit time, that is,IL /TL, with the change in rotation speed from 30 to 80 rps.The number of Xe ions per unit time became larger withincreasing rotation speed. This may be reflected in the valueof Vp obtained for the signal from between G and 7. Thepressure wave generated in a liquid target is considered to beproportional to the time differential of the amount of energydeposited into the target.1
Figure 6 shows the spatial distribution of Vp obtainedfrom the MD, except that for the signal from between G and
FIG. 3. Typical output waveforms obtained from �a� PMT and �b� MD,which are reconstructed by inverse Fourier transformation using frequencycomponents below 25 kHz.
FIG. 4. Dependence of �a� TL and �b� IL on rotation speed of chopper.
FIG. 5. Dependence of �a� Vp obtained between G and 1 and between G and7, and �b� IL /TL on rotation speed of chopper.
084903-3 Takechi et al. J. Appl. Phys. 105, 084903 �2009�
Downloaded 26 Apr 2010 to 130.54.110.32. Redistribution subject to AIP license or copyright; see http://jap.aip.org/jap/copyright.jsp
A Self-archived copy inKyoto University Research Information Repository
https://repository.kulib.kyoto-u.ac.jp
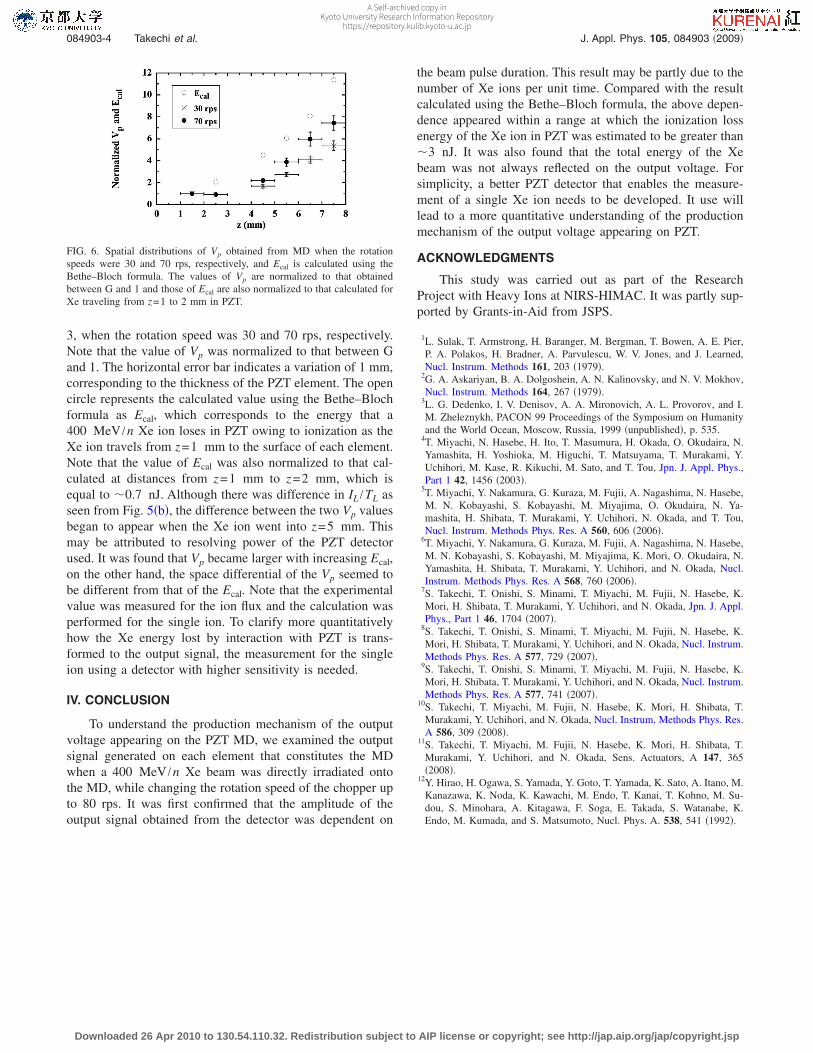
3, when the rotation speed was 30 and 70 rps, respectively.Note that the value of Vp was normalized to that between Gand 1. The horizontal error bar indicates a variation of 1 mm,corresponding to the thickness of the PZT element. The opencircle represents the calculated value using the Bethe–Blochformula as Ecal, which corresponds to the energy that a400 MeV /n Xe ion loses in PZT owing to ionization as theXe ion travels from z=1 mm to the surface of each element.Note that the value of Ecal was also normalized to that cal-culated at distances from z=1 mm to z=2 mm, which isequal to �0.7 nJ. Although there was difference in IL /TL asseen from Fig. 5�b�, the difference between the two Vp valuesbegan to appear when the Xe ion went into z=5 mm. Thismay be attributed to resolving power of the PZT detectorused. It was found that Vp became larger with increasing Ecal,on the other hand, the space differential of the Vp seemed tobe different from that of the Ecal. Note that the experimentalvalue was measured for the ion flux and the calculation wasperformed for the single ion. To clarify more quantitativelyhow the Xe energy lost by interaction with PZT is trans-formed to the output signal, the measurement for the singleion using a detector with higher sensitivity is needed.
IV. CONCLUSION
To understand the production mechanism of the outputvoltage appearing on the PZT MD, we examined the outputsignal generated on each element that constitutes the MDwhen a 400 MeV /n Xe beam was directly irradiated ontothe MD, while changing the rotation speed of the chopper upto 80 rps. It was first confirmed that the amplitude of theoutput signal obtained from the detector was dependent on
the beam pulse duration. This result may be partly due to thenumber of Xe ions per unit time. Compared with the resultcalculated using the Bethe–Bloch formula, the above depen-dence appeared within a range at which the ionization lossenergy of the Xe ion in PZT was estimated to be greater than�3 nJ. It was also found that the total energy of the Xebeam was not always reflected on the output voltage. Forsimplicity, a better PZT detector that enables the measure-ment of a single Xe ion needs to be developed. It use willlead to a more quantitative understanding of the productionmechanism of the output voltage appearing on PZT.
ACKNOWLEDGMENTS
This study was carried out as part of the ResearchProject with Heavy Ions at NIRS-HIMAC. It was partly sup-ported by Grants-in-Aid from JSPS.
1L. Sulak, T. Armstrong, H. Baranger, M. Bergman, T. Bowen, A. E. Pier,P. A. Polakos, H. Bradner, A. Parvulescu, W. V. Jones, and J. Learned,Nucl. Instrum. Methods 161, 203 �1979�.
2G. A. Askariyan, B. A. Dolgoshein, A. N. Kalinovsky, and N. V. Mokhov,Nucl. Instrum. Methods 164, 267 �1979�.
3L. G. Dedenko, I. V. Denisov, A. A. Mironovich, A. L. Provorov, and I.M. Zheleznykh, PACON 99 Proceedings of the Symposium on Humanityand the World Ocean, Moscow, Russia, 1999 �unpublished�, p. 535.
4T. Miyachi, N. Hasebe, H. Ito, T. Masumura, H. Okada, O. Okudaira, N.Yamashita, H. Yoshioka, M. Higuchi, T. Matsuyama, T. Murakami, Y.Uchihori, M. Kase, R. Kikuchi, M. Sato, and T. Tou, Jpn. J. Appl. Phys.,Part 1 42, 1456 �2003�.
5T. Miyachi, Y. Nakamura, G. Kuraza, M. Fujii, A. Nagashima, N. Hasebe,M. N. Kobayashi, S. Kobayashi, M. Miyajima, O. Okudaira, N. Ya-mashita, H. Shibata, T. Murakami, Y. Uchihori, N. Okada, and T. Tou,Nucl. Instrum. Methods Phys. Res. A 560, 606 �2006�.
6T. Miyachi, Y. Nakamura, G. Kuraza, M. Fujii, A. Nagashima, N. Hasebe,M. N. Kobayashi, S. Kobayashi, M. Miyajima, K. Mori, O. Okudaira, N.Yamashita, H. Shibata, T. Murakami, Y. Uchihori, and N. Okada, Nucl.Instrum. Methods Phys. Res. A 568, 760 �2006�.
7S. Takechi, T. Onishi, S. Minami, T. Miyachi, M. Fujii, N. Hasebe, K.Mori, H. Shibata, T. Murakami, Y. Uchihori, and N. Okada, Jpn. J. Appl.Phys., Part 1 46, 1704 �2007�.
8S. Takechi, T. Onishi, S. Minami, T. Miyachi, M. Fujii, N. Hasebe, K.Mori, H. Shibata, T. Murakami, Y. Uchihori, and N. Okada, Nucl. Instrum.Methods Phys. Res. A 577, 729 �2007�.
9S. Takechi, T. Onishi, S. Minami, T. Miyachi, M. Fujii, N. Hasebe, K.Mori, H. Shibata, T. Murakami, Y. Uchihori, and N. Okada, Nucl. Instrum.Methods Phys. Res. A 577, 741 �2007�.
10S. Takechi, T. Miyachi, M. Fujii, N. Hasebe, K. Mori, H. Shibata, T.Murakami, Y. Uchihori, and N. Okada, Nucl. Instrum. Methods Phys. Res.A 586, 309 �2008�.
11S. Takechi, T. Miyachi, M. Fujii, N. Hasebe, K. Mori, H. Shibata, T.Murakami, Y. Uchihori, and N. Okada, Sens. Actuators, A 147, 365�2008�.
12Y. Hirao, H. Ogawa, S. Yamada, Y. Goto, T. Yamada, K. Sato, A. Itano, M.Kanazawa, K. Noda, K. Kawachi, M. Endo, T. Kanai, T. Kohno, M. Su-dou, S. Minohara, A. Kitagawa, F. Soga, E. Takada, S. Watanabe, K.Endo, M. Kumada, and S. Matsumoto, Nucl. Phys. A. 538, 541 �1992�.
FIG. 6. Spatial distributions of Vp obtained from MD when the rotationspeeds were 30 and 70 rps, respectively, and Ecal is calculated using theBethe–Bloch formula. The values of Vp are normalized to that obtainedbetween G and 1 and those of Ecal are also normalized to that calculated forXe traveling from z=1 to 2 mm in PZT.
084903-4 Takechi et al. J. Appl. Phys. 105, 084903 �2009�
Downloaded 26 Apr 2010 to 130.54.110.32. Redistribution subject to AIP license or copyright; see http://jap.aip.org/jap/copyright.jsp
A Self-archived copy inKyoto University Research Information Repository
https://repository.kulib.kyoto-u.ac.jp