Embed Size (px)
Citation preview

Article
Tissue-Specific Optical Mapping Models of SwineAtria Informed by Optical Coherence Tomography
Theresa H. Lye,1 Kevin P. Vincent,2 Andrew D. McCulloch,2 and Christine P. Hendon1,*1Department of Electrical Engineering, Columbia University, New York, New York and 2Department of Bioengineering, University of CaliforniaSan Diego, San Diego, California
ABSTRACT Computational models and experimental optical mapping of cardiac electrophysiology serve as powerful tools toinvestigate the underlying mechanisms of arrhythmias. Modeling can also aid the interpretation of optical mapping signals, whichmay have different characteristicswith respect to the underlying electrophysiological signals they represent. However, despite theprevalenceof atrial arrhythmias suchasatrial fibrillation,models of optical electricalmapping incorporating realistic structure of theatria are lacking. Therefore, we developed image-basedmodels of atrial tissue using structural information extracted from opticalcoherence tomography (OCT), which can provide volumetric tissue characteristics in high resolution. OCT volumetric data of fourswine atrial tissue samples were used to develop models incorporating tissue geometry, tissue-specific myofiber orientation, andablation lesion regions. We demonstrated the use of these models through electrophysiology and photon scattering simulations.Changes in transmural electrical conduction were observed with the inclusion of OCT-derived, depth-resolved fiber orientation.Additionally, the amplitude of optical mapping signals were not found to correspond with lesion transmurality because of lesiongeometry and electrical propagation occurring beyond excitation light penetration. This work established a framework for thedevelopment of tissue-specificmodels of atrial tissue derived fromOCT imaging data, which can be useful in future investigationsof electrophysiology and optical mapping signals with respect to realistic atrial tissue structure.
INTRODUCTION
Atrial fibrillation (AF), the most common cardiacarrhythmia, remains complicated by the complexity of atrialstructures and heterogeneity ofAF across patient populations(1–3). Furthermore, the development of techniques for moni-toring successful radiofrequency ablation (RFA) therapy, acommon treatment for AF that currently has variable success(4), is an active area of research. For these reasons, three-dimensional (3D) imaging of atrial-specific structure, andcorrelation to function and treatment, is an important chal-lenge. Currently, magnetic resonance imaging (MRI) (5–9)and computed tomography (10) are often used for thedetailed, nondestructive imaging and modeling of the atria.However, limitations remain in terms of resolution for com-plete characterization of tissue features, particularly in thinatrial regions. Additionally, these modalities may have longacquisition times (9) or the need for exogenous agents for suf-ficient tissue contrast (10).
Submitted February 14, 2017, and accepted for publication January 30,
2018.
*Correspondence: [email protected]
Editor: Raimond Winslow.
https://doi.org/10.1016/j.bpj.2018.01.035
� 2018 Biophysical Society.
This is an open access article under the CC BY-NC-ND license (http://
creativecommons.org/licenses/by-nc-nd/4.0/).
Optical coherence tomography (OCT), a fast, nondestruc-tive imaging modality with micrometer resolution and atypical imaging depth of 2–3 mm (11,12), can be used inconjunction with other imaging techniques to image theatria. OCT has been shown to be able to image importantfeatures of cardiac tissue, including myofiber orientation(13–16), the Purkinje network (17), regions of ablation le-sions (18), and varying tissue types within the heart wall(19). Although imaging significant portions of the atriamay require a larger field of view than is typical of a singleOCT image volume, this can be mitigated by image stitch-ing of multiple OCT volumes (20,21). To investigate struc-ture-function dynamics with OCT, structural informationfrom OCT has also been used in combination with opticalmapping, an experimental technique for investigating car-diac electrophysiology using voltage-sensitive dyes thatemit fluorescent light proportional to changes in transmem-brane potential (22). In a study by Hucker et al. (23), tissue-specific structure identified by OCT imaging was correlatedto multilayer electrical conduction and the location ofreentry cores during arrhythmia. Different fiber orientationpatterns seen at different depths of the tissue, as imagedby OCT, could be correlated to the electrical activation
Biophysical Journal 114, 1477–1489, March 27, 2018 1477

Lye et al.
patterns observed from optical mapping. Additionally, thelocation of optically mapped reentry cores was associatedwith tissue regions where shifts in dominant fiber angle dis-tributions were identified at different tissue depths by volu-metric OCT imaging. Thus, structural information fromOCT has been demonstrated to assist in the interpretationof optical mapping signals.
The correspondence between optical mapping measure-ments and OCT structural information motivates the devel-opment of OCT-informed computational models for opticalmapping simulation, which may enable more precise corre-lations of experimental two-dimensional optical mappingdata to 3D imaging data. Owing to scattering of fluorescentlight, optical mapping signals can be distorted comparedwith their corresponding electrical signals, including elon-gated optical action potential upstrokes and differences inrepolarization morphology (24). Interpretation of opticalmapping signals may be further complicated by interactionswith heterogeneous tissue structure (25,26). Thus, tissue-specific, computational modeling of optical mapping hasbeen developed to enable a deeper understanding of the in-fluence of structural heterogeneities on the formation of op-tical mapping signals. Previous modeling studies haveinvestigated the effects of ventricular tissue thickness, fiberorientation, and tissue geometry on optical mapping signals.The influence of varying tissue thickness on optical signalmorphology in slab models ranging from 2.5 to 10 mmthickness as well as in models simulating trabeculation ofthe ventricular endocardium have been previously investi-gated (27–29). The effect of ventricular fiber orientation pat-terns has been analyzed in slab models (24,27,30) andcylindrical models (28). Whole rabbit ventricular models,with ventricular anatomy and fiber orientation informedby serial sectioning, have been used to assess the effect oftissue structure on optical signal morphology during pacing,arrhythmia, and defibrillation (25,31,32). Additionally, amodel of a rabbit ventricular wedge, using high-resolutionMRI to inform tissue geometry and histologically informedfiber orientation, has been developed to investigate the effectof tissue structure, specifically vein cavities, on the opticalsignal (26). To the authors’ knowledge, there are currentlyno optical mapping models focusing on atrial structure orutilizing the high-resolution 3D structural information thatcan be offered by OCT.
In this study we present, to our knowledge, the firstuse of high-resolution OCT volumetric data to developtissue-specific atrial models. We developed atrial modelsincluding tissue-specific fiber orientation extracted fromOCT imaging and ablation lesions that utilized OCT todetermine the lesion boundaries within the tissue geometry.Four different swine atrial samples were used to demon-strate the incorporation of OCT-derived structural featuresinto optical mapping models. Finite element electrophysi-ology simulations were combined with Monte Carlo simu-lations of photon scattering to simulate optical mapping
1478 Biophysical Journal 114, 1477–1489, March 27, 2018
and analyze the effects of tissue structure on the modeledsignals.
METHODS
The workflow for simulating optical mapping in OCT-characterized atrial
models is depicted in Fig. 1. First, structural features, including fiber orien-
tation and the location of ablation lesions, were extracted from the OCT
volumetric data of the tissues and used to develop the tissue-specific
models. After construction of the models, electrophysiology and excitation
photon scattering were simulated, and the resulting transmembrane poten-
tial and excitation photon density data were used to generate the fluorescent
sources that produce the optical mapping signal. In the final step, fluores-
cent light propagation was simulated to produce the optical mapping signal
in the atrial tissue models. In this study, four models were developed incor-
porating the tissue geometry and extracted structural features: 1) a model of
left atrial tissue with tissue-specific fiber orientation and tissue geometry as
extracted from OCT; 2) a model of left atrial tissue from a larger stitched
region, including an area of sharp myofiber orientation change; 3) a model
of right atrial tissue with a nontransmural lesion region; and 4) a model of
right atrial tissue with a transmural lesion region. For simplicity, these
models will be referred to as the 1) left atrium-1 model, 2) left atrium-2
model, 3) the nontransmural lesion model, and 4) the transmural lesion
model. The left atrium-1 and left atrium-2 models were developed to inves-
tigate the influence of OCT-derived, tissue-specific fiber orientation on the
transmural electrophysiological propagation and corresponding optical
signal. The lesion models were developed to investigate the behavior of
the optical mapping signal within lesions areas.
Imaging of atrial tissue
Volumetric OCT image sets were acquired from four swine atrial samples,
ex vivo. The atrial tissues had been dissected from healthy swine hearts and
laid flat for imaging. The tissue samples for the left atrium-1 and left
atrium-2 models were acquired from the left atrium and imaged using the
commercial spectral domain OCT system, TELESTO (Thorlabs GmbH,
Dachau, Germany). The TELESTOOCT system has a 15 and 6.5 mm lateral
and axial resolution in air, respectively, and a 2.51 mm imaging depth. The
left atrium-1 data set was acquired from the epicardial side, whereas the left
atrium-2 data set was acquired from the endocardial side. For the lesion
models, two right atrial tissues were first ablated on the endocardial sur-
faces using the commercial RFA system, Stockert 70 (Biosense Webster, Ir-
vine, CA). The image sets for the radiofrequency-ablated tissues were then
acquired from the endocardial side using a custom-built ultrahigh resolution
OCT system, with 5.52 and 2.72 mm lateral and axial resolution in air,
respectively, and 1.78 mm imaging depth (33). This OCT system was
used for imaging the ablated tissues because the TELESTO system did
not capture the birefringence artifact that could be used to detect the abla-
tion lesion in the OCT images, as will be described in further detail in
Extraction of Ablation Lesion Region.
Multiple overlapping imagevolumeswere acquired to cover larger regions
of tissue for the left atrium-2 and lesion models. When necessary, the over-
lapping image volumes were histogram matched to equalize the contrast
between separate volumes and stitched together manually. Consecutive
stitchedB-scanswere averaged by three to improve thevisualization of tissue
features. When necessary, stitched image volumes were downsampled by
three to reduce the computational load during image processing. Trichrome
histology and triphenyltetrazolium chloride staining were carried out on the
ablated tissue samples to reveal lesion characteristics beyond the sampling
depth of the OCT system. Fig. 2 shows the OCT image volumes used to
inform the left atrium-1, nontransmural, and transmural lesion models, dis-
playing the tissue geometry of the data. For the left atrium-2 data, the surface
farthest from the OCT lens was not within the OCT system’s imaging depth,
and fiber orientation could only be observed within a limited region of

Fluorescent Emission Simulation
OUTPUT: Modeled optical mapping signal
norm
aliz
ed
phot
on d
ensi
ty
0
1
Uniform Illumination Simulation
Iex 0 1
Electrophysiology Simulation
Vm 0 1
Tissue Model Generation
Hexahedral Mesh for Finite Element Electrophysiology Simulation
Tetrahedral Mesh for Monte Carlo Photon Scattering Simulation
Image Stitching (when applicable)
Fiber Orientation Extraction (when
applicable)Tissue Segmentation
Fluorescent Source
Synthesis
Fluorescent Emission
Photon Density,Iem ∝ V m∗Iex
Normalized Transmembrane
Potential, Vm
Normalized Excitation Photon
Density, Iex
Input:OCT Volumes
Image Processing
lesionnormal tissue
VVVVVVV
FIGURE 1 Flow diagram for optical mapping
modeling of atrial tissue as derived from OCT im-
ages. Vm is normalized transmembrane potential,
Iex is normalized excitation photon density, and
Iem is fluorescent emission photon density. To see
this figure in color, go online.
Optical Mapping Models Informed by OCT
myocardiumunderneath the endocardial surface. Therefore, the tissuegeom-
etry was not included in the left atrium-2 model and only an electrophysio-
logical simulation was carried out on the left atrium-2 model.
Extraction of atrial tissue structure
Image processing to extract the fiber orientation, tissue geometry, and lesion
location from the OCT volumetric data was implemented in MATLAB (The
MathWorks, Natick, MA). Full details of the fiber orientation extraction al-
gorithm can be found in the paper by Gan et al. (15) but will be briefly
described here. Fiber orientation in three dimensions was extracted from
fresh tissue samples without optical clearing. We used an automated algo-
rithm that first detected the fiber angles in the en face plane and then pro-
jected them to 3D form based on the detected tissue surface orientation.
Identification of the fiber angles in the en face images was carried out by
determining the dominant gradient within small subregions spanning
each en face image. Afterwards, the tissue surface was detected from the
OCT B-scans, and for each voxel, the en face fiber angle was projected
onto a plane parallel to the tissue surface. The fiber orientation data was me-
dian filtered by a 3 � 3 kernel to smooth the angles before fitting to the
models. The extraction of the tissue geometry as well as ablation lesion re-
gions for the ablated samples is described in further detail below.
Extraction of tissue geometry
The surfaces of the cardiac tissueswere detected semiautomatically from the
OCT B-scans to extract the tissue geometry. Surface detection consisted of
image smoothing to reduce the effect of speckle noise and then detection
of the maximal gradient magnitude in the axial direction. Filtering parame-
ters were tuned manually between data sets or different tissue regions
because of varying image quality caused by saturation artifacts, distance
of the varying tissue topology from the imaging surface, use of different im-
aging systems, or image-stitching artifacts. The steps are summarized below,
with further detail on the image processing parameters and extent of manual
corrections provided in the SupportingMaterial. For the left atrium-1 and left
atrium-2 data set, the upper surfaces of the tissues were detected by first
applying a median filter to reduce speckle noise, then computing and detect-
ing the maximum of the gradient magnitude in the axial direction. The endo-
cardium in the left atrium-1 data set, because of being located further from
the image focus, was additionally processed with histogram equalization
to enhance contrast along with an additional series of median filtering and
morphological opening and closing to extract the less visible lower tissue
boundary. The lower boundary of the left atrium-2 data set was not visible
within theOCTsystem’s imaging depth. For detection of the endocardial sur-
face in the ablated tissue data sets, median filtering was applied to reduce
speckle noise along with morphological opening with a rectangular struc-
turing element to reduce the effect of vertical streak-like artifacts. The image
gradient magnitude was then computed and thresholded to detect the tissue
surface. For the ablated tissue data, the tissue surface farthest from the
OCT lens was outside of the OCT system’s imaging depth. Therefore, a
flat bottom surface for the ablated tissue data was assumed. The maximal
thicknesses of the ablated tissueswere approximated fromhistology orwhite
light images of the gross specimen cross section.
Extraction of ablation lesion region
The boundaries of the ablation lesions were identified by the appearance of
the birefringence artifact as well as by changes in the tissue features as visu-
alized by OCT. The birefringence artifact appears as a dark band under-
neath the tissue surface in OCT images of unablated tissue but is not
present in ablated tissue (18,34,35), as seen in Fig. 3, a and b. By detecting
the presence or absence of this artifact within each B-scan, the lateral posi-
tions of the lesion boundaries could be identified. A method based on that
described in (18) was used. The image processing steps are described in
further detail within the Supporting Material. In the OCT image volume
of the transmural lesion, the birefringence artifact could not be seen in
this particular data set. In this case, the decreased contrast between the
Biophysical Journal 114, 1477–1489, March 27, 2018 1479

xz
y birefringence artifact
xy z
xz
y
a
b
c
FIGURE 2 OCT imaging of swine atrial tissues. (a) Left atrial tissue
OCT image volume for the left atrium-1 model is shown. (b) Right atrial
tissue OCT image volume with a nontransmural lesion for the nontransmu-
ral lesion model is shown. (c) Right atrial tissue OCT image volume with a
transmural lesion for the transmural lesion model is shown. The axes and
scale bars indicate 0.5 mm.
endocardium
endocardium
collagen fibers
a
b
c
d
FIGURE 3 Visualization of ablation lesions in OCT. (a) Representative
stitched B-scan from ablated right atrial tissue with birefringence artifact
is shown. Dotted white lines indicate the boundaries of the lesion as de-
tected by the falloff of the birefringence artifact. (b) Corresponding tri-
chrome histology of ablated right atrial tissue is shown. Purple indicates
necrotic tissue, whereas red indicates healthy tissue. (c) Representative
stitched B-scan from ablated right atrial tissue is shown, in which the abla-
tion lesion can be observed by the loss of collagen fiber structure and
decreased contrast between the myocardial and endocardial layers. (d) Cor-
responding trichrome histology is shown. The scale bars indicate 0.5 mm.
To see this figure in color, go online.
Lye et al.
endocardium and myocardium as well as the disappearance of collagen fi-
bers within the lesion was used as a marker for the boundary of the lesion,
as shown in Fig. 3, c and d. The lesion boundary was segmented manually
through visual inspection. Since the depth of the lesions could not be
extracted from the OCT images, the maximal depth of the lesions was
approximated from histology and triphenyltetrazolium chloride staining.
Afterwards, elliptical curves were fit to the lesion location data to approx-
imate the lesion contours in depth.
Electrophysiology simulation
With the tissue geometry, fiber orientation, and RFA lesion location ex-
tracted from the images, the atrial structural data were used to generate
finite element models of the tissues for electrical propagation and light
scattering simulations. The multiscale modeling finite element package
Continuity 6 (36), distributed by the National Biomedical Computation
Resource, was used to carry out the electrophysiology simulations. The
validation of the Continuity 6 software for electrophysiological simulations
has been described in a previous study (36).
Mesh generation for electrophysiology simulation
For the left atrium-1 and lesion models, 3D hexahedral finite element
models corresponding to the tissue geometry were generated from the
1480 Biophysical Journal 114, 1477–1489, March 27, 2018
OCT-derived structural data as seen in Fig. 4. The spatial discretization
for all models was Dx ¼ Dy ¼ 0.1 and Dz % 0.1 mm. For the left
atrium-1 model, the fiber orientation was fitted to the model using the fitting
module within Continuity 6, which uses a least-squares fitting approach.
For the lesion models, conduction was assumed to be isotropic as the fiber
orientation could not be extracted throughout the tissue, limited by imaging
depth or interference from the birefringence artifact. For the lesion models,
the location of the lesions was also fitted to the geometric model via the
fitting module in Continuity 6.
For the left atrium-2 model, a slab tissue geometry with uniform thick-
ness was assumed but incorporated the fiber orientation data within a
9.8 � 5.3 � 0.35 mm volume of myocardium. This volume of myocardium
was extracted from the image volume starting 0.47 mm underneath the
endocardial tissue surface to ensure extraction of information from the
myocardium and not the endocardium. Representative images of the ex-
tracted fiber orientation data from OCT and the fiber orientation fitted to
the model are shown in Fig. 5. Because of the simplistic geometry used,
interpolation of the fiber data to the nodal locations of the model was
deemed sufficient to fit the fiber angles to the model.
To investigate the influence of detailed OCT-derived fiber orientation,
two simplified variants of the left atrium-1 and left atrium-2 models were
developed with less fiber complexity. First, the left atrium-1 and left
atrium-2 models were developed without depth-resolved changes in fiber

xz
y
a
xy z
xz
y
c d
Dmin Dmax
b
FIGURE 4 Finite element, hexahedral models for electrophysiological
simulation, generated from OCT data of atrial tissues. (a) Shown is the
left atrium-1 model, which is shown enlarged in (b) to show fitted fiber
orientation superimposed on the model. (c) Nontransmural lesion model
is shown. (d) Transmural lesion model is shown. For the lesion models,
the fitted ablation lesion region is shown by a color map of assigned diffu-
sivity (D) parameters. Black arrows on the models indicate location of stim-
ulus. To see this figure in color, go online.
Optical Mapping Models Informed by OCT
orientation, hereafter called transmurally uniform fiber orientation. For
these models, the fiber orientation in the uppermost layer of elements on
the model’s stimulated surface was assigned to all layers underneath, thus
retaining the spatial fiber orientation heterogeneity in the lateral dimensions
but creating homogeneous fiber orientation transmurally. Second, the left
atrium-1 and left atrium-2 models were simplified to a uniform fiber orien-
tation. To generate uniform fiber orientation, all fiber angles were aligned to
a b
dc
the y axis in the left atrium-1 model and to the x axis in the left atrium-2
model. This was based on which axis was closer to the dominant fiber orien-
tation direction within each model. Additionally, to investigate the effect of
tissue geometry on the electrical and optical signals, a uniform thickness
model was developed with the same lateral dimensions as the left atrium-1
model and with a uniform thickness equal to the average thickness of the
left atrium-1 model.
Electrophysiology model and simulation parameters
The Fenton Karma ionic model with atrial parameters (37,38) was used
with the monodomain model for all electrophysiology simulations. For
the left atrium-1 and left atrium-2 models—including their variants—aniso-
tropic diffusivity was assigned such that the ratio of the longitudinal to the
transverse conduction velocity was �1.8, based on previous literature
(39,40). For the ablated tissue models, isotropic conduction was assigned.
The longitudinal conduction velocity was adjusted to 0.75 m/s (41), with
diffusivity set to 0.1331 mm2/ms. The transverse conduction velocity was
adjusted to 0.42 m/s, with diffusivity set to 0.0411 mm2/ms. For isotropic
conduction, a conduction velocity of 0.75 m/s was used. For the ablated tis-
sue regions, the diffusivity and Fenton Karma ionic model excitability
parameter, gfi, were reduced to a minimum of �0.1% in the lesion region
to induce the nonconducting property of the lesion. For all electrophysi-
ology simulations, point stimulation was applied on the upper surfaces
of the models. The location of stimulus is shown on the models in
Figs. 4 and 5.
Light scattering simulation
The transmembrane potential data from the electrophysiology simulations
are coupled with simulated excitation photon density data and then used
as input to a fluorescent light scattering simulation to model the optical
mapping signals. The Tetrahedron-Based Inhomogeneous Monte Carlo Op-
tical Simulator (TIM-OS) (42), which has been validated (43) and utilized
for optical mapping models in previous studies (26), was used to compute
light scattering in tetrahedral meshes corresponding to the tissue or rectan-
gular geometry.
Mesh generation for light scattering simulation
A tetrahedral mesh must be input to TIM-OS for the Monte Carlo simula-
tion of photon scattering. Therefore, tetrahedral meshes were generated
from the tissue segmentation images with iso2mesh (44) and corresponded
to the same tissue geometry as the hexahedral models. The tetrahedral
meshes are shown in Fig. S1. The tissue meshes were modeled to be
FIGURE 5 Left atrium-2 slab model incorpo-
rating fitted fiber orientation as extracted from a
9.8 � 5.3 � 0.35 mm volume of myocardium
imaged by OCT. En face OCT images with super-
imposed, extracted fiber angles at depths of (a)
0.47 mm and (c) 0.82 mm from the tissue surface
are shown. Corresponding fiber fields from (a)
and (c) are shown fitted to the model in (b) and
(d), respectively. Black arrow indicates location
of stimulus. To see this figure in color, go online.
Biophysical Journal 114, 1477–1489, March 27, 2018 1481

TABLE 2 Optical Properties of Swine Tissue Models at
Emission Wavelength 669 nm
Tissue Type ma (mm�1) ms (mm�1) g
Myocardium 0.075 13.6 0.95
Ablation lesion 0.104 16.2 0.95
Lye et al.
surrounded by a rectangular region of perfusate as shown in Fig. S1 d. The
optical parameters of the perfusate were set such that the light was not ab-
sorbed within the perfusate region and was only scattered forward in a
straight line, with the anisotropy coefficient g ¼ 1, as has been done in pre-
vious optical mapping models using TIM-OS (26). The refractive index of
atrial tissue was set to 1.4, or 1.46 if within the ablation lesion region to
approximate structural changes such as increased collagen content
(45,46). The refractive index of the perfusate region was set to 1.3. The
models also included a region of air surrounding the perfusate that had a
refractive index of 1. The mean element edge lengths for the left
atrium and uniform thickness models were �0.06 mm, whereas the mean
element edge lengths for the nontransmural and transmural lesion models
were �0.09 and 0.07 mm, respectively.
Simulation of tissue illumination
During optical mapping, the tissue is first illuminated to excite the fluores-
cent dye. To simulate the illumination process, a uniform beam of colli-
mated light was propagated from the flat upper surface of the perfusate
layer to the upper surface of the tissue within each model. The area of
the illumination beam covered the entire tissue upper surface for each
model. The resulting photon density within the tetrahedral elements repre-
sented the illumination intensity within the tissue. The excitation wave-
length, 488 nm, was chosen to match the wavelength of light used to
excite the commonly used voltage-sensitive fluorescent dye, Di-4-ANEPPS
(Thermo Fisher Scientific, Waltham, MA). The optical parameters (absorp-
tion coefficient ma, scattering coefficient ms, and anisotropy coefficient g)
used in the models for 488 nm are shown in Table 1. An approximation
of the optical parameters of ablated and unablated tissue was obtained
experimentally by diffuse reflectance measurements of swine atrial tissue
samples and an inverse Monte Carlo procedure as described in (47). To
investigate the change in excitation photon density distribution caused by
the lesion optical properties, an illumination simulation was also run for
the nontransmural lesion model with the entirety of the model having the
optical parameters of unablated tissue only.
Simulation of fluorescence emission
After illumination, the fluorescence of the voltage-sensitive dye must be
simulated to synthesize the optical mapping signal. The intensity of fluores-
cent emission is proportional to the amount of excitation light and the
change in transmembrane potential. To simulate the fluorescence emissions,
photons were emitted in an isotropic fashion from each tetrahedron in the
mesh. The photon density of emission from each tetrahedron was calculated
by scaling a maximal photon density by the normalized excitation photon
density and normalized transmembrane potential within that tetrahedron.
The emission wavelength, 669 nm, was chosen to match the wavelength
of light commonly measured with the voltage-sensitive fluorescent dye,
Di-4-ANEPPS. The optical parameters used in the models for 669 nm are
shown in Table 2 and were obtained with the same method used to obtain
the optical properties at the excitation wavelength.
Data analysis and computational resources
Activation time, transmural activation time, action potential upstroke dura-
tion, and fractional level of maximum upstroke velocity were computed to
quantify the simulated electrical and optical action potentials. Activation
time was computed as the time of the upstroke’s maximal derivative (48).
Total activation time was defined as the latest activation time. Transmural
TABLE 1 Optical Properties of Swine Tissue Models at
Excitation Wavelength 488 nm
Tissue Type ma (mm�1) ms (mm�1) g
Myocardium 0.62 17.2 0.95
Ablation lesion 0.68 19.2 0.95
1482 Biophysical Journal 114, 1477–1489, March 27, 2018
activation time was defined as the difference between the activation times
on the stimulated surface of the model from the activation times on the
opposing surface of the model. Specifically, the transmural activation
time at a particular x-y coordinate was computed by subtracting the activa-
tion time at the x-y point on the stimulated surface of the model from the
activation time at the point on the opposite surface of the model with
the same x-y coordinates. Action potential duration was calculated as
the time between 10 and 90% depolarization. The action potential upstroke
duration is reported as mean (51 SD). The fractional level of maximum op-
tical upstroke velocity, Vf*, is a parameter that has been established in past
optical mapping studies (28,30) in which it was used to describe changes in
optical upstroke morphology with respect to direction of electrical propaga-
tion. The parameter quantifies the time of the maximum upstroke velocity
and ranges from 0 to 1. A higher value of Vf* indicates the location of the
maximum upstroke velocity is near the apex of the upstroke, whereas a
lower value indicates the maximum upstroke velocity is near the foot of
the upstroke (28,30). Vf* was detected within the 10 to 90% depolarization
interval. To compute the derivatives of the upstroke, the upstrokes were
first interpolated with piecewise cubic polynomials to a discretization
of �6.5 ms before a first order, one-sided finite difference method was
applied. Simulations were run on Columbia University’s Yeti Shared
High Performance Computing Cluster and the Rocce cluster from the
National Biomedical Computation Resource.
RESULTS
Electrophysiology results
Electrical activation maps, transmural electrical activationmaps, and differences between transmural electrical activa-tion maps for the left atrium-1 and left atrium-2 models aregiven in Fig. 6. The difference in surface electrical activationpattern with tissue-specific fiber orientation compared toactivation with uniform fiber orientation is apparent whencomparing Fig. 6, a and c, and Fig. 6, i and k. As expected,the surface activation between the tissue-specific and trans-murally uniform fiber orientation models were nearly iden-tical, as seen in Fig. 6, a, b, i, and j. Total activation timetended to increase with increasing complexity of fiber orien-tation. The left atrium-1 model had a total activation time of7.7mswith tissue-specific fitted fiber orientation, 7.6mswithtransmurally uniform fiber orientation, and 7.3 ms with uni-form fiber orientation. For the left atrium-2 model, the totalactivation time of the model with tissue-specific fitted fiberorientation and transmurally uniform fiber orientation werethe same, with a total activation time of 12.0 ms. The totalactivation time of the left atrium-2 model with uniform fiberorientation was 11.2 ms. For the left atrium-1 model, subtledifferences can be observed between the transmural activa-tion maps of the model’s variants, as shown in Fig. 6, d–f.To more clearly show these differences, Fig. 6, g and hshow the transmural activation times of the simplified fibermodels subtracted from the transmural activation times of

0.0
7.7
-1.2
1.2
-0.4
0.4
ms
ms
ms
0.0
-0.2
-0.2
12.0
0.2
0.2
ms
ms
ms
4 mm
mm
6.3
9.8 mm
5.3
mm
a b c
d e f
g h
i j k
l m n
o p
FIGURE 6 Electrical activation maps, transmural electrical activation maps, and differences between transmural electrical activation maps for the left
atrium-1 model, left atrium-2 model, and their variants. Isochronal activation maps of the stimulated surface for left atrium-1 model with (a) tissue-specific
fitted fiber orientation, (b) transmurally uniform fiber orientation, and (c) uniform fiber orientation are shown. Black isolines indicate 0.5 ms intervals. Trans-
mural activation maps for the left atrium-1 model with (d) tissue-specific fitted fiber orientation, (e) transmurally uniform fiber orientation, and (f) uniform
fiber orientation are shown. Shown is the difference in transmural activation times between the left atrium-1 model with tissue-specific fiber orientation and
(g) transmurally uniform fiber orientation and (h) uniform fiber orientation. Isochronal activation maps of the stimulated surface for left atrium-2 model with
(i) tissue-specific fitted fiber orientation, (j) transmurally uniform fiber orientation, and (k) uniform fiber orientation are shown. Black isolines indicate 0.5 ms
intervals. Transmural activation maps for the left atrium-2 model with (l) tissue-specific fitted fiber orientation, (m) transmurally uniform fiber orientation,
and (n) uniform fiber orientation are shown. Shown is the difference in transmural activation time between the left atrium-2 model with tissue-specific fiber
orientation and with (o) transmurally uniform fiber orientation and (p) uniform fiber orientation. To see this figure in color, go online.
Optical Mapping Models Informed by OCT
the tissue-specific fiber model, showing differences up to�0.4 ms. For the left atrium-2 model, the transmural activa-tion times were low because of the thinness of the mesh.However, the tissue-specific fiber orientation inducednonzero transmural activation time up to �0.2 ms, as seenin Fig. 6 l, whereas the transmurally uniform and uniformfiber orientation models had zero transmural activationtime throughout the majority of the model, as shown inFig. 6, m and n. Accordingly, the difference maps of Fig. 6,o and p closely resemble the transmural activation timemap from the fully fitted left atrium-2 model of Fig. 6 l.
Illumination results
The distribution of excitation photon density was slightlydifferent between the left atrium-1 model containing tissuegeometry and the uniform thickness model. In the epicardialdistributions of excitation photon density as shown in Fig. 7,a and b, the photon density distribution in the tissue-specificmodel was greater toward the left region of the model,whereas it was more symmetric in the uniform thicknessmodel. In transmural cross sections, the illuminating lightwas not fully attenuated through the thin tissues upon reach-ing the endocardial surface of the pictured cross sections, asillustrated in Fig. 7, c and d.
For the nontransmural lesion model, the excitation photonscattering was simulated with and without the lesion regionto determine the effect of the lesion optical properties on thepenetration of excitation light. The difference between theexcitation photon density within the model with and withoutthe lesion, scaled to the maximal excitation photon densityin the model without the lesion, is shown in Fig. 8. The
inclusion of the lesion region, which had increased scat-tering and absorption compared to unablated tissue, causeda slight increase in the excitation photon density close to theablated tissue surface and a decrease throughout the rest ofthe lesion area.
Fluorescent emission results
As in the illumination simulation, the optical mappingsignal amplitude between the tissue-specific left atrium-1model and the uniform thickness model had different distri-butions, reflecting the influence of the thin tissue geometry.The epicardial maps of the optical mapping signals in Fig. 9,a and b show the asymmetric distribution within the tissue-specific model in contrast to the uniform thickness model. Incomparison to the tissue thickness map shown in Fig. 9 c,the signal amplitude in the tissue-specific model was gener-ally lower within approximate regions of thinner tissue andhigher around thicker regions.
Optical activation time maps and distributions of the frac-tional level of maximal upstroke velocity Vf* for the leftatrium-1 model are shown in Fig. 10. The trends of opticalactivation time seen in Fig. 10, a–c correspond to that of theelectrical activation times shown in Fig. 6, a–c. The frac-tional level of maximal upstroke velocity is a parameterthat has been used in previous studies to characterize thecorrelation between the optical upstroke morphology andthe angle of propagation of the subsurface electrical wavefront with respect to the tissue surface (28,30). In agreementwith past studies, the values of Vf* increased from thepoint of stimulation. The pattern of Vf* followed the surfaceactivation pattern from the electrophysiological simulation.
Biophysical Journal 114, 1477–1489, March 27, 2018 1483

Normalized Photon Density
0.95 1
Normalized Photon Density
0 1
x
y
x
z
a b
c d
FIGURE 7 Excitation photon density on the left atrium-1 model and uni-
form thickness model. The photon density is normalized with respect to the
maximum density in each model, exempting values on the lateral bound-
aries of the models due to boundary effects. (a) Epicardial map and (c)
cross-sectional view at y ¼ 1.8 mm on the left atrium-1 model are shown.
(b) Epicardial map and (d) cross-sectional view at y ¼ 1.8 mm on the uni-
form thickness model are shown. The epicardial map color values are
shown starting from 95% of the maximum photon density to enhance the
contrast of the surface photon density distribution. Cross-hairs on the
epicardial maps depict the center of the surface. To see this figure in color,
go online.
Lye et al.
Differences in Vf* up to �60% were observed betweenthe Vf* maps of the tissue-specific fitted fiber model whencompared to the Vf* maps of the transmurally uniform fibermodel or uniform fiber model. These differences were espe-cially apparent at the areas where the propagation of theelectrical wave front transitioned from moving away fromthe stimulated surface to an angle moving toward the stim-ulated surface. Differences were minimal at regions whereVf* had reached a maximum. Comparing Fig. 10, g and hto Fig. 6, g and h, the correlation of the differences in Vf*
FIGURE 8 Cross-sectional view of the difference between the excitation
photon density in the nontransmural lesion model with and without the
lesion region included is shown at y ¼ 1.5 mm. The difference is scaled
to the maximal excitation photon density in the model without the lesion.
To see this figure in color, go online.
1484 Biophysical Journal 114, 1477–1489, March 27, 2018
between the different fiber distributions to the differencesin transmural activation times was not apparent.
For the lesion models, the blurring of optical signals intoregions that were electrically inactivated could be observed.As seen within the optical mapping signal snapshots shownin Fig. 11, a and b, the minimal normalized optical mappingsignal amplitude was higher within the transmural lesion. Tobetter understand the relative contribution of fluorescentsignal throughout the tissue, Fig. 11, c and d show the den-sity of emitted fluorescent photons for the same time pointsas the optical mapping snapshots in a transmural cross sec-tion of the tissue. The density of emitted photons isweighted by the distribution of excitation photon densityand transmembrane potential, and the absence of emittedphotons within the electrically inactivated lesion area canbe seen by the darkened regions near the upper tissue sur-face. The density of emitted photons can also be seen todecrease with depth because of the decay of excitation in-tensity. As seen in Fig. 11 c, electrical propagation occurringunderneath the nontransmural lesion did not contributeheavily to the fluorescent signal because of the low intensityof illumination at that depth.
Optical upstroke prolongation was observed. For the leftatrium-1 model, the electrical upstroke duration was 1.1(50.3) ms, whereas the optical upstroke duration was 3.1(50.3) ms. Upstroke duration was not computed for thelesion models because of complications with differentiatingelectrically activated from inactivated regions.
DISCUSSION
To the authors’ knowledge, this study demonstrated the firstOCT-derived atrial tissue models for electrophysiology andoptical mapping simulations. Four different models weredeveloped containing tissue structural characteristics ex-tracted from OCT imaging, including tissue geometry, fiberorientation, and ablated tissue location. The effects ofthe incorporated tissue structure on the simulated elec-trical and optical signals were analyzed. Our objective fordeveloping tissue-specific atrial models is to facilitatedeeper investigation of the relationship between atrial elec-trophysiological function and detailed tissue-specific struc-ture to improve the understanding and treatment of atrialfibrillation.
OCToffers depth-resolved, micrometer-scale informationon fiber orientation, which can be useful when consideringtransmural electrophysiological dynamics. Depth-resolvedvariation in fiber orientation led to changes in transmuralactivation time. This was observed in the left atrium-1 andleft atrium-2 models by the differences in transmural activa-tion time between the tissue-specific fitted fiber orientationmodels and their simplified fiber variants. With recent inter-est in the difference between epicardial and endocardialelectrical activation during atrial fibrillation (49), high reso-lution and depth-resolved fiber orientation information
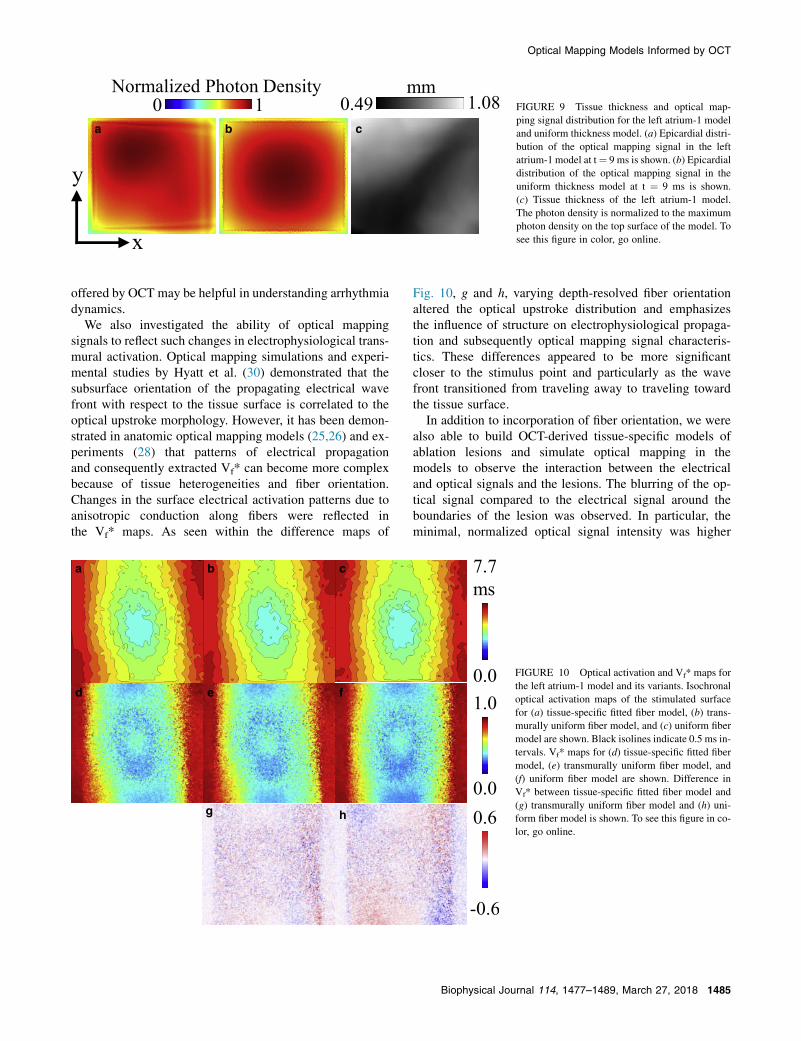
0.49 1.08mm
0 1Normalized Photon Density
x
y
a b c
FIGURE 9 Tissue thickness and optical map-
ping signal distribution for the left atrium-1 model
and uniform thickness model. (a) Epicardial distri-
bution of the optical mapping signal in the left
atrium-1 model at t¼ 9 ms is shown. (b) Epicardial
distribution of the optical mapping signal in the
uniform thickness model at t ¼ 9 ms is shown.
(c) Tissue thickness of the left atrium-1 model.
The photon density is normalized to the maximum
photon density on the top surface of the model. To
see this figure in color, go online.
Optical Mapping Models Informed by OCT
offered by OCT may be helpful in understanding arrhythmiadynamics.
We also investigated the ability of optical mappingsignals to reflect such changes in electrophysiological trans-mural activation. Optical mapping simulations and experi-mental studies by Hyatt et al. (30) demonstrated that thesubsurface orientation of the propagating electrical wavefront with respect to the tissue surface is correlated to theoptical upstroke morphology. However, it has been demon-strated in anatomic optical mapping models (25,26) and ex-periments (28) that patterns of electrical propagationand consequently extracted Vf* can become more complexbecause of tissue heterogeneities and fiber orientation.Changes in the surface electrical activation patterns due toanisotropic conduction along fibers were reflected inthe Vf* maps. As seen within the difference maps of
a b c
d e f
hg
Fig. 10, g and h, varying depth-resolved fiber orientationaltered the optical upstroke distribution and emphasizesthe influence of structure on electrophysiological propaga-tion and subsequently optical mapping signal characteris-tics. These differences appeared to be more significantcloser to the stimulus point and particularly as the wavefront transitioned from traveling away to traveling towardthe tissue surface.
In addition to incorporation of fiber orientation, we werealso able to build OCT-derived tissue-specific models ofablation lesions and simulate optical mapping in themodels to observe the interaction between the electricaland optical signals and the lesions. The blurring of the op-tical signal compared to the electrical signal around theboundaries of the lesion was observed. In particular, theminimal, normalized optical signal intensity was higher
0.0
7.7ms
0.0
1.0
-0.6
0.6
FIGURE 10 Optical activation and Vf* maps for
the left atrium-1 model and its variants. Isochronal
optical activation maps of the stimulated surface
for (a) tissue-specific fitted fiber model, (b) trans-
murally uniform fiber model, and (c) uniform fiber
model are shown. Black isolines indicate 0.5 ms in-
tervals. Vf* maps for (d) tissue-specific fitted fiber
model, (e) transmurally uniform fiber model, and
(f) uniform fiber model are shown. Difference in
Vf* between tissue-specific fitted fiber model and
(g) transmurally uniform fiber model and (h) uni-
form fiber model is shown. To see this figure in co-
lor, go online.
Biophysical Journal 114, 1477–1489, March 27, 2018 1485

Normalized Photon Density0 1
Optical Mapping Signal
Fluorescent Source Distribution
x
y
x
z
ab
dc
FIGURE 11 Optical mapping results in the lesion models. (a) Endocar-
dial map of optical mapping signal distribution and (c) transmural cross sec-
tion of emitted fluorescent photon density distribution at y ¼ 1.5 mm and
t ¼ 23 ms in the nontransmural lesion model is shown. (b) Endocardial
map of optical mapping signal distribution and (d) transmural cross section
of emitted fluorescent photon density distribution at y ¼ 1.2 mm and
t ¼ 21 ms in the transmural lesion model is shown. The optical mapping
signal photon density is normalized to the maximal photon density on the
top surfaces of the models. The emitted fluorescent photon density distribu-
tion is normalized to the maximal photon density within the cross section.
Black arrows indicate the location of the transmural cross sections along the
y axis. To see this figure in color, go online.
FIGURE 12 Representative SS-OCT B-scan from a swine left atrial sam-
ple optically cleared by a 2,2’-thiodiethanol-based aqueous solution. Scale
bar indicates 0.5 mm.
Lye et al.
in the transmural lesion within our simulations. There wasa low contribution to the optical mapping signal from theelectrical propagation occurring underneath the nontrans-mural lesion because of the decay of excitation intensity.Thus, the lateral scattering from the regions surroundingthe lesion contributed more significantly to the opticalmapping signal. Because of the smaller diameter of thetransmural lesion, this can explain the higher optical signalintensity within the transmural lesion and emphasizes theneed to be aware of the origin of the optical signal whenrelating lesion depth to optical signal amplitude. Modelingof light propagation in tissue-specific conditions couldassist in the development of optical techniques to monitorlesion formation such as those using endogenous nico-tinamide adenine dinucleotide fluorescence (50) or nearinfrared-spectroscopy (47). Tissue-specific ablation modelscould be used to evaluate and analyze the behavior ofthe optical techniques in a realistic model containing het-erogeneities that would otherwise complicate use of thetechniques.
This study demonstrated a framework for developingOCT-derived atrial tissue models and showed influencesof OCT-derived structural features on the electrophysiolog-ical and optical signals. However, a larger imaged tissueregion would be helpful to enable a more thorough inves-tigation of arrhythmia dynamics in large animals or humanhearts and the influences on electrical and optical signalswith respect to detailed structural information. The lateralfield of view can be enlarged by stitching a larger number
1486 Biophysical Journal 114, 1477–1489, March 27, 2018
of OCT volumes, whereas the imaging depth of OCT couldbe expanded by imaging and stitching both sides of the tis-sue, imaging thick serial sections of the tissue, or throughoptical clearing combined with imaging by a swept-source(SS)-OCT system. SS-OCT systems offer higher imagingdepths because of the use of longer wavelength light sour-ces. Fig. 12 shows a B-scan of swine left atrial tissueoptically cleared by a 2,2’-thiodiethanol-based aqueous so-lution (51) and imaged by a custom-built SS-OCT system(52), showing tissue contrast throughout the tissue thick-ness of �2 mm. Combined with increased optical depthpenetration induced by optical clearing, imaging with anSS-OCT system could enable high-resolution imaging ofdeeper tissue structure without complications of imageregistration or potential artifacts from sectioning. However,future work remains in obtaining the best balance betweentissue contrast and depth penetration with optical clearing.
Limitations of this study include lack of experimentalvalidation, which would require registration of opticalmapping data from the tissue to its OCT-derived model.Although the optical mapping signal characteristicsobserved within this study, such as the optical signal blur-ring and morphology changes, are in line with previousexperimental and modeling results, direct experimentalcomparison would be necessary to fully validate tissue-specific effects and parameters. In this study, the electro-physiological parameters were informed by literature.Additionally, although the optical absorption and scatteringparameters were obtained from a swine tissue samplethrough an inverse Monte Carlo method, the reduced scat-tering coefficient, as opposed to the scattering coefficient,was obtained. The scattering coefficient was estimatedfrom the reduced scattering coefficient and an approximatevalue of the anisotropy coefficient, near the range foundin previous literature (54), because of the lack of existing

Optical Mapping Models Informed by OCT
information on swine atrial optical properties. The tissuewas also not stained with voltage-sensitive dye when the op-tical parameters were measured. With regards to lesion im-aging and modeling, OCT was unable to detect the lesiondepth. Furthermore, changes in endocardial and myocardialcontrast as the marker for lesion boundaries may vary inalignment between the lesion necrotic core and borderzone. Establishing a more accurate framework for electro-physiological and optical modeling of the lesion in detailis a focus for future investigation. Lastly, because of thedifferent algorithms used for generation of the hexahedraland tetrahedral meshes and different simulation approachesof the electrical and light propagation, registration betweenthe two models have slight differences, primarily in thelesion model that has a smoothly transitioning lesion bound-ary in the electrophysiological model but a sharp boundarywithin the photon scattering model.
The next steps for OCT-derived optical mappingatrial models include the modeling of larger tissue regions(including the incorporation of varying tissue types, such ascollagen, adipose tissue, and fibrosis (53)) and ultimatelyworking toward a comprehensive visualization and modelof the whole atria utilizing stitched OCT image volumes.Future studies will also include further study of OCT-derived lesion models, including simulation of electricalpropagation with multiple ablation lesions of varying sizesand configurations, and inclusion of transmural myofiberorientation to allow a more detailed understanding of vary-ing electrophysiological conduction and block around abla-ted areas in different conditions. OCT-derived atrial modelshave the potential to provide additional, high-resolution,tissue-specific structural detail in simulations of cardiacelectrophysiology and optical mapping. In the future,OCT imaging could be registered with MRI or computedtomography-derived data for a multimodality imagingapproach. In conclusion, this study has laid the frameworkfor OCT-derived tissue-specific, optical mapping models ofthe atria, which has the potential to enable a more directcomparison between simulation and experimental results.Optical mapping models of atrial tissue as derived fromOCT have the potential to guide further investigation ofthe relationship between cardiac function and specific tis-sue structure.
SUPPORTING MATERIAL
Supporting Materials and Methods and one figure are available at http://
www.biophysj.org/biophysj/supplemental/S0006-3495(18)30195-4.
AUTHOR CONTRIBUTIONS
C.P.H. conceived the research aims and secured funding. T.H.L.
designed and performed the study, including model creation, running of
simulations, and data processing and analysis. K.P.V. contributed software
components and assisted in model creation and simulation. A.D.M. and
K.P.V. provided expertise. T.H.L. wrote the manuscript. C.P.H., A.D.M.,
and K.P.V. provided feedback and edits to the manuscript.
ACKNOWLEDGMENTS
The authors thank Yu Gan, Xinwen Yao, Rajinder Singh-Moon, Christopher
Villongco, Jeff Van Dorn, Yuye Ling, and Zhuhao Wu for their technical
assistance.
This study was funded by the National Institutes of Health 1DP2HL127776-
01 (C.P.H.), National Science Foundation Career Award 1454365 (C.P.H.),
the Feldstein Medical Foundation (C.P.H.), the Columbia University Fu
Foundation School of Engineering andApplied Science Presidential Fellow-
ship (T.H.L.), the SheldonWeinig Scholars Program (T.H.L.) National Insti-
tutes of Health grant R01 HL105242 (A.D.M.), and the National Biomedical
Computation Resource grant 8P41GM103426 (A.D.M.).
A.D.M. is a cofounder of and has an equity interest in Insilicomed, Inc., and
he serves on the scientific advisory board. Some of his research grants,
including those acknowledged here, have been identified for conflict of in-
terest management based on the overall scope of the project and its potential
benefit to Insilicomed, Inc. The author is required to disclose this relation-
ship in publications acknowledging the grant support; however, the research
subject and findings reported here did not involve the company in any way
and have no relationship with the business activities or scientific interests of
the company. The terms of this arrangement have been reviewed and
approved by the University of California San Diego in accordance with
its conflict of interest policies.
REFERENCES
1. Ho, S. Y., R. H. Anderson, and D. Sanchez-Quintana. 2002. Atrialstructure and fibres: morphologic bases of atrial conduction. Cardio-vasc. Res. 54:325–336.
2. Allessie, M. A., N. M. de Groot, ., H. J. Crijns. 2010. Electropatho-logical substrate of long-standing persistent atrial fibrillation in patientswith structural heart disease: longitudinal dissociation. Circ ArrhythmElectrophysiol. 3:606–615.
3. Schotten, U., S. Verheule, ., A. Goette. 2011. Pathophysiologicalmechanisms of atrial fibrillation: a translational appraisal. Physiol.Rev. 91:265–325.
4. Ganesan, A. N., N. J. Shipp,., P. Sanders. 2013. Long-term outcomesof catheter ablation of atrial fibrillation: a systematic review and meta-analysis. J. Am. Heart Assoc. 2:e004549.
5. McDowell, K. S., F. Vadakkumpadan, ., N. A. Trayanova. 2012.Methodology for patient-specific modeling of atrial fibrosis as a sub-strate for atrial fibrillation. J. Electrocardiol. 45:640–645.
6. McDowell, K. S., F. Vadakkumpadan, ., N. A. Trayanova. 2013.Mechanistic inquiry into the role of tissue remodeling in fibrotic lesionsin human atrial fibrillation. Biophys. J. 104:2764–2773.
7. McDowell, K. S., S. Zahid,., N. A. Trayanova. 2015. Virtual electro-physiological study of atrial fibrillation in fibrotic remodeling. PLoSOne. 10:e0117110.
8. Aslanidi, O. V., M. A. Colman, ., H. Zhang. 2011. 3D virtual humanatria: a computational platform for studying clinical atrial fibrillation.Prog. Biophys. Mol. Biol. 107:156–168.
9. Pashakhanloo, F., D. A. Herzka,., E. R. McVeigh. 2016. Myofiber ar-chitecture of the human atria as revealed by submillimeter diffusiontensor imaging. Circ Arrhythm Electrophysiol. 9:e004133.
10. Aslanidi, O. V., M. A. Colman,., H. Zhang. 2013. Heterogeneous andanisotropic integrative model of pulmonary veins: computational studyof arrhythmogenic substrate for atrial fibrillation. Interface Focus.3:20120069.
11. Huang, D., E. A. Swanson,., C. A. Puliafito. 1991. Optical coherencetomography. Science. 254:1178–1181.
Biophysical Journal 114, 1477–1489, March 27, 2018 1487
Lye et al.
12. Fujimoto, J., and W. Drexler. 2008. Introduction to optical coherencetomography. In Optical Coherence Tomography: Technology and Ap-plications. W. Drexler and J. G. Fujimoto, eds. Springer Berlin Heidel-berg, pp. 1–45.
13. Fleming, C. P., C. M. Ripplinger, ., A. M. Rollins. 2008. Quantifica-tion of cardiac fiber orientation using optical coherence tomography.J. Biomed. Opt. 13:030505.
14. Goergen, C. J., H. Radhakrishnan, ., V. J. Srinivasan. 2012. Opticalcoherence tractography using intrinsic contrast. Opt. Lett. 37:3882–3884.
15. Gan, Y., and C. P. Fleming. 2013. Extracting three-dimensional orien-tation and tractography of myofibers using optical coherence tomogra-phy. Biomed. Opt. Express. 4:2150–2165.
16. Wang, Y., K. Zhang, ., G. Yao. 2014. Histology validation ofmapping depth-resolved cardiac fiber orientation in fresh mouseheart using optical polarization tractography. Biomed. Opt. Express.5:2843–2855.
17. Jenkins, M., R. S. Wade, ., I. R. Efimov. 2005. Optical coherence to-mography imaging of the purkinje network. J. Cardiovasc. Electrophy-siol. 16:559–560.
18. Fleming, C. P., K. J. Quan, ., A. M. Rollins. 2010. In vitro character-ization of cardiac radiofrequency ablation lesions using optical coher-ence tomography. Opt. Express. 18:3079–3092.
19. Gan, Y., D. Tsay, ., C. P. Hendon. 2016. Automated classification ofoptical coherence tomography images of human atrial tissue.J. Biomed. Opt. 21:101407.
20. Gan, Y., W. Yao,., C. P. Hendon. 2014. An automated 3D registrationmethod for optical coherence tomography volumes. In Proceedings ofthe 2014 36th Annual International Conference of the IEEE Engineer-ing in Medicine and Biology Society. IEEE Engineering in Medicineand Biology Society, pp. 3873–3876.
21. Gan, Y., W. Yao,., C. P. Hendon. 2015. Analyzing three-dimensionalultrastructure of human cervical tissue using optical coherence tomog-raphy. Biomed. Opt. Express. 6:1090–1108.
22. Efimov, I. R., V. P. Nikolski, and G. Salama. 2004. Optical imaging ofthe heart. Circ. Res. 95:21–33.
23. Hucker, W. J., C. M. Ripplinger, ., I. R. Efimov. 2008. Bimodal bio-photonic imaging of the structure-function relationship in cardiac tis-sue. J. Biomed. Opt. 13:054012.
24. Hyatt, C. J., S. F. Mironov, ., A. M. Pertsov. 2003. Synthesis ofvoltage-sensitive fluorescence signals from three-dimensional myocar-dial activation patterns. Biophys. J. 85:2673–2683.
25. Bishop, M. J., B. Rodriguez, ., D. J. Gavaghan. 2006. Synthesis ofvoltage-sensitive optical signals: application to panoramic optical map-ping. Biophys. J. 90:2938–2945.
26. Bishop, M. J., and G. Plank. 2014. Simulating photon scattering effectsin structurally detailed ventricular models using a Monte Carloapproach. Front. Physiol. 5:338.
27. Hyatt, C. J., C. W. Zemlin,., O. Bernus. 2008. Reconstructing subsur-face electrical wave orientation from cardiac epi-fluorescence record-ings: Monte Carlo versus diffusion approximation. Opt. Express.16:13758–13772.
28. Zemlin, C. W., O. Bernus,., A. M. Pertsov. 2008. Extracting intramu-ral wavefront orientation from optical upstroke shapes in whole hearts.Biophys. J. 95:942–950.
29. Bernus, O., K. S. Mukund, and A. M. Pertsov. 2007. Detection of intra-myocardial scroll waves using absorptive transillumination imaging.J. Biomed. Opt. 12:014035.
30. Hyatt, C. J., S. F. Mironov, ., A. M. Pertsov. 2005. Optical action po-tential upstroke morphology reveals near-surface transmural propaga-tion direction. Circ. Res. 97:277–284.
31. Bishop, M. J., B. Rodriguez, ., N. A. Trayanova. 2007. The role ofphoton scattering in optical signal distortion during arrhythmia anddefibrillation. Biophys. J. 93:3714–3726.
1488 Biophysical Journal 114, 1477–1489, March 27, 2018
32. Bishop, M. J., D. J. Gavaghan, ., B. Rodriguez. 2007. Photon scat-tering effects in optical mapping of propagation and arrhythmogenesisin the heart. J. Electrocardiol. 40 (6, Suppl):S75–S80.
33. Yao, X., Y. Gan, ., C. P. Hendon. 2016. Myocardial imaging usingultrahigh-resolution spectral domain optical coherence tomography.J. Biomed. Opt. 21:61006.
34. Fleming, C. P., H. Wang, ., A. M. Rollins. 2010. Real-time moni-toring of cardiac radio-frequency ablation lesion formation using anoptical coherence tomography forward-imaging catheter. J. Biomed.Opt. 15:030516.
35. Fleming, C. P., K. J. Quan, and A. M. Rollins. 2010. Toward guidanceof epicardial cardiac radiofrequency ablation therapy using opticalcoherence tomography. J. Biomed. Opt. 15:041510.
36. Vincent, K. P., M. J. Gonzales,., A. D. McCulloch. 2015. High-orderfinite element methods for cardiac monodomain simulations. Front.Physiol. 6:217.
37. Fenton, F., and A. Karma. 1998. Vortex dynamics in three-dimensionalcontinuous myocardium with fiber rotation: filament instability andfibrillation. Chaos. 8:20–47.
38. Goodman, A. M., R. A. Oliver, ., P. D. Wolf. 2005. A membranemodel of electrically remodelled atrial myocardium derived fromin vivo measurements. Europace. 7 (Suppl 2):135–145.
39. Roberts-Thomson, K. C., I. Stevenson, ., J. M. Kalman. 2009. Therole of chronic atrial stretch and atrial fibrillation on posterior left atrialwall conduction. Heart Rhythm. 6:1109–1117.
40. Maesen, B., S. Zeemering, ., U. Schotten. 2013. Rearrangement ofatrial bundle architecture and consequent changes in anisotropy of con-duction constitute the 3-dimensional substrate for atrial fibrillation.Circ Arrhythm Electrophysiol. 6:967–975.
41. Rahme, M. M., B. Cotter, ., G. K. Feld. 1999. Electrophysiologicaland antiarrhythmic effects of the atrial selective 5-HT(4) receptorantagonist RS-100302 in experimental atrial flutter and fibrillation.Circulation. 100:2010–2017.
42. Shen, H., and G. Wang. 2010. A tetrahedron-based inho-mogeneous Monte Carlo optical simulator. Phys. Med. Biol.55:947–962.
43. Shen, H., and G. Wang. 2011. Reply to ‘‘Comment on ‘A study on tet-rahedron-based inhomogeneous Monte-Carlo optical simulation’’’.Biomed. Opt. Express. 2:1265–1267.
44. Fang, Q., and D. A. Boas. 2009. Tetrahedral mesh generation fromvolumetric binary and grayscale images. In 2009 IEEE InternationalSymposium on Biomedical Imaging: From Nano to Macro, 1142–1145.
45. Kovoor, P., M. Daly, ., D. L. Ross. 2006. Change in size of lesionsover 3 weeks after radiofrequency ablation of left ventricle.J. Cardiovasc. Electrophysiol. 17:411–414.
46. Meglinski, I., and A. Doronin. 2013. Monte Carlo modeling of photonmigration for the needs of biomedical optics and biophotonics. InAdvanced Biophotonics: Tissue Optical Sectioning. R. K. Wang andV. V. Tuchin, eds. Taylor & Francis, pp. 1–72.
47. Singh-Moon, R. P., C. C. Marboe, and C. P. Hendon. 2015. Near-infrared spectroscopy integrated catheter for characterization ofmyocardial tissues: preliminary demonstrations to radiofrequencyablation therapy for atrial fibrillation. Biomed. Opt. Express. 6:2494–2511.
48. Walton, R. D., R. M. Smith,., A. M. Pertsov. 2012. Extracting surfaceactivation time from the optically recorded action potential in three-dimensional myocardium. Biophys. J. 102:30–38.
49. Hansen, B. J., J. Zhao,., V. V. Fedorov. 2015. Atrial fibrillation drivenby micro-anatomic intramural re-entry revealed by simultaneous sub-epicardial and sub-endocardial optical mapping in explanted humanhearts. Eur. Heart J. 36:2390–2401.
50. Mercader, M., L. Swift, ., N. Sarvazyan. 2012. Use of endogenousNADH fluorescence for real-time in situ visualization of epicardial ra-diofrequency ablation lesions and gaps. Am. J. Physiol. Heart Circ.Physiol. 302:H2131–H2138.

Optical Mapping Models Informed by OCT
51. Staudt, T., M. C. Lang, ., S. W. Hell. 2007. 2,20-thiodiethanol: a newwater soluble mounting medium for high resolution optical micro-scopy. Microsc. Res. Tech. 70:1–9.
52. Ling, Y., X. Yao, and C. P. Hendon. 2017. Highly phase-stable 200 kHzswept-source optical coherence tomography based on KTN electro-optic deflector. Biomed. Opt. Express. 8:3687–3699.
53. Yao, X., Y. Gan,., C. P. Hendon. 2017. Multicontrast endomyocardialimaging by single-channel high-resolution cross-polarization opticalcoherence tomography. J. Biophotonics..
54. Ding, L., R. Splinter, and S. B. Knisley. 2001. Quantifying spatiallocalization of optical mapping using Monte Carlo simulations. IEEETrans Biomed Eng. 48:1098–1107.
Biophysical Journal 114, 1477–1489, March 27, 2018 1489