Embed Size (px)
Citation preview
on November 12, 2017http://rsif.royalsocietypublishing.org/Downloaded from
rsif.royalsocietypublishing.org
Research
Cite this article: Zarei V, Zhang S,
Winkelstein BA, Barocas VH. 2017 Tissue
loading and microstructure regulate the
deformation of embedded nerve fibres:
predictions from single-scale and multiscale
simulations. J. R. Soc. Interface 14: 20170326.
http://dx.doi.org/10.1098/rsif.2017.0326
Received: 5 May 2017
Accepted: 11 September 2017
Subject Category:Life Sciences – Engineering interface
Subject Areas:bioengineering, biomathematics, biomechanics
Keywords:axon, matrix – matrix interaction,
collagen fibres, ECM structure,
discrete-fibre model, multiscale modelling
Author for correspondence:Victor H. Barocas
e-mail: [email protected]
Electronic supplementary material is available
online at https://dx.doi.org/10.6084/m9.
figshare.c.3887812.
& 2017 The Author(s) Published by the Royal Society. All rights reserved.
Tissue loading and microstructureregulate the deformation of embeddednerve fibres: predictions from single-scaleand multiscale simulations
Vahhab Zarei1, Sijia Zhang3, Beth A. Winkelstein3 and Victor H. Barocas2
1Department of Mechanical Engineering, and 2Department of Biomedical Engineering, University of Minnesota,Minneapolis, MN 55455, USA3Department of Bioengineering, University of Pennsylvania, Philadelphia, PA 19104-6321, USA
VZ, 0000-0003-4557-887X; VHB, 0000-0003-4964-2533
Excessive deformation of nerve fibres (axons) in the spinal facet capsular
ligaments (FCLs) can be a cause of pain. The axons are embedded in the
fibrous extracellular matrix (ECM) of FCLs, so understanding how local
fibre organization and micromechanics modulate their mechanical behaviour
is essential. We constructed a computational discrete-fibre model of an axon
embedded in a collagen fibre network attached to the axon by distinct
fibre–axon connections. This model was used to relate the axonal deformation
to the fibre alignment and collagen volume concentration of the surrounding
network during transverse, axial and shear deformations. Our results showed
that fibre alignment affects axonal deformation only during transverse and
axial loading, but higher collagen volume concentration results in larger over-
all axonal strains for all loading cases. Furthermore, axial loading leads to the
largest stretch of axonal microtubules and induces the largest forces on axon’s
surface in most cases. Comparison between this model and a multiscale con-
tinuum model for a representative case showed that although both models
predicted similar averaged axonal strains, strain was more heterogeneous in
the discrete-fibre model.
1. IntroductionLow back and neck pain are major health issues, and despite much effort across
many different fields of study, their aetiology is still poorly defined [1,2]. One
common cause of spine pain and disability is excessive nerve fibre deformation
during joint overuse and/or trauma [3]. The facet capsular ligaments (FCLs),
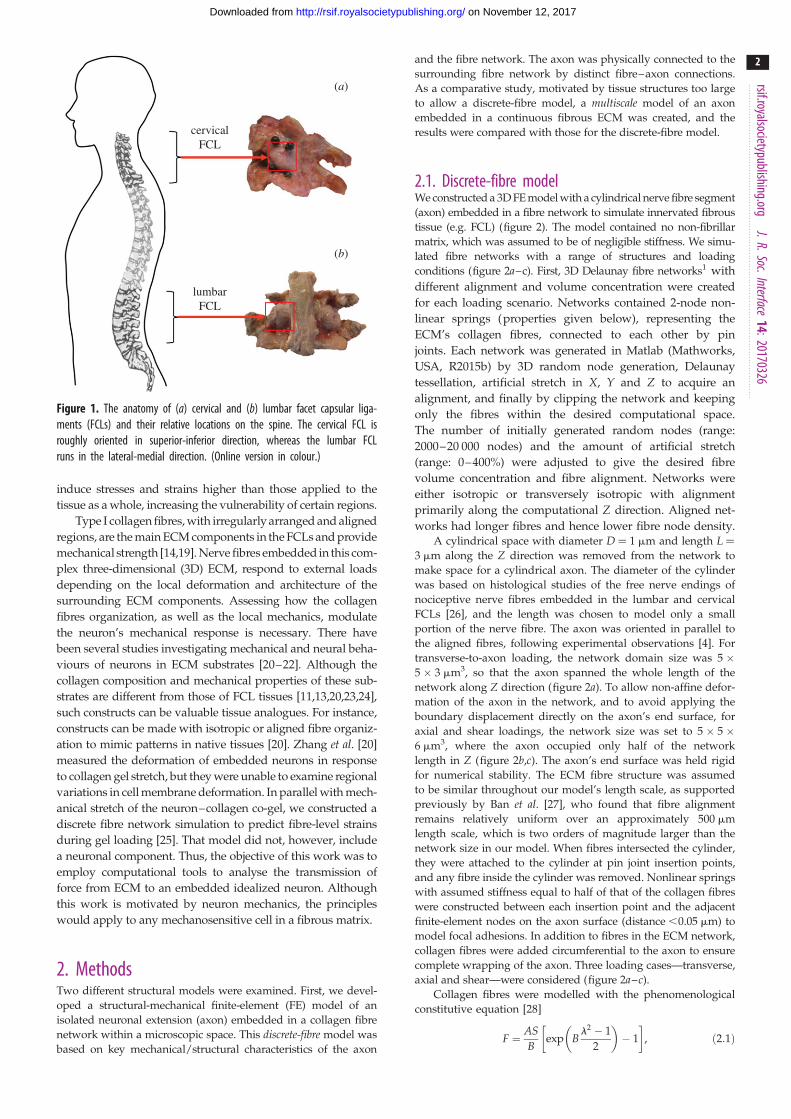
which enclose the bilateral facet joints throughout the spine (figure 1), are
highly innervated and are increasingly recognized as sources of lower back and
neck pain [4–7]. Nerve fibres embedded in the FCL can be activated by its
deformation during repeated physiological or injurious motions, leading to
pain [7–9]. On the macroscale, spinal motion causes heterogeneous and localized
deformation of the FCLs [10–12]. Even uniform displacement of the FCL’s
boundaries during simple ex vivo mechanical tests results in heterogeneous defor-
mation, attributable to the non-uniform fibre structure of their extracellular matrix
(ECM) [13–15]. On the microscale, the ECM fibres in these ligaments rotate,
deform, and transmit local forces and deformations to the embedded sensory
components, which can trigger their neural response.
The axonal cytoskeleton is composed of axial stiff microtubules laterally
reinforced by microfilaments and neurofilaments, and the axon physically connects
to its environment via adhesive foci, such as focal adhesions [16]. These adhesions
transmit forces and deformations from ECM to neurons, and could serve as regions
where strains and stresses are concentrated [17]. Localized neuron deformation can
open stretch-gated membrane channels [18] and directly or indirectly, result in the
generation of pain signals. In addition, the localized mechanical response can
cervicalFCL
lumbarFCL
(a)
(b)
Figure 1. The anatomy of (a) cervical and (b) lumbar facet capsular liga-ments (FCLs) and their relative locations on the spine. The cervical FCL isroughly oriented in superior-inferior direction, whereas the lumbar FCLruns in the lateral-medial direction. (Online version in colour.)
rsif.royalsocietypublishing.orgJ.R.Soc.Interface
14:20170326
2
on November 12, 2017http://rsif.royalsocietypublishing.org/Downloaded from
induce stresses and strains higher than those applied to the
tissue as a whole, increasing the vulnerability of certain regions.
Type I collagen fibres, with irregularly arranged and aligned
regions, are the main ECM components in the FCLs and provide
mechanical strength [14,19]. Nerve fibres embedded in this com-
plex three-dimensional (3D) ECM, respond to external loads
depending on the local deformation and architecture of the
surrounding ECM components. Assessing how the collagen
fibres organization, as well as the local mechanics, modulate
the neuron’s mechanical response is necessary. There have
been several studies investigating mechanical and neural beha-
viours of neurons in ECM substrates [20–22]. Although the
collagen composition and mechanical properties of these sub-
strates are different from those of FCL tissues [11,13,20,23,24],
such constructs can be valuable tissue analogues. For instance,
constructs can be made with isotropic or aligned fibre organiz-
ation to mimic patterns in native tissues [20]. Zhang et al. [20]
measured the deformation of embedded neurons in response
to collagen gel stretch, but they were unable to examine regional
variations in cell membrane deformation. In parallel with mech-
anical stretch of the neuron–collagen co-gel, we constructed a
discrete fibre network simulation to predict fibre-level strains
during gel loading [25]. That model did not, however, include
a neuronal component. Thus, the objective of this work was to
employ computational tools to analyse the transmission of
force from ECM to an embedded idealized neuron. Although
this work is motivated by neuron mechanics, the principles
would apply to any mechanosensitive cell in a fibrous matrix.
2. MethodsTwo different structural models were examined. First, we devel-
oped a structural-mechanical finite-element (FE) model of an
isolated neuronal extension (axon) embedded in a collagen fibre
network within a microscopic space. This discrete-fibre model was
based on key mechanical/structural characteristics of the axon
and the fibre network. The axon was physically connected to the
surrounding fibre network by distinct fibre–axon connections.
As a comparative study, motivated by tissue structures too large
to allow a discrete-fibre model, a multiscale model of an axon
embedded in a continuous fibrous ECM was created, and the
results were compared with those for the discrete-fibre model.
2.1. Discrete-fibre modelWe constructed a 3D FE model with a cylindrical nerve fibre segment
(axon) embedded in a fibre network to simulate innervated fibrous
tissue (e.g. FCL) (figure 2). The model contained no non-fibrillar
matrix, which was assumed to be of negligible stiffness. We simu-
lated fibre networks with a range of structures and loading
conditions (figure 2a–c). First, 3D Delaunay fibre networks1 with
different alignment and volume concentration were created
for each loading scenario. Networks contained 2-node non-
linear springs (properties given below), representing the
ECM’s collagen fibres, connected to each other by pin
joints. Each network was generated in Matlab (Mathworks,
USA, R2015b) by 3D random node generation, Delaunay
tessellation, artificial stretch in X, Y and Z to acquire an
alignment, and finally by clipping the network and keeping
only the fibres within the desired computational space.
The number of initially generated random nodes (range:
2000–20 000 nodes) and the amount of artificial stretch
(range: 0–400%) were adjusted to give the desired fibre
volume concentration and fibre alignment. Networks were
either isotropic or transversely isotropic with alignment
primarily along the computational Z direction. Aligned net-
works had longer fibres and hence lower fibre node density.A cylindrical space with diameter D ¼ 1 mm and length L ¼
3 mm along the Z direction was removed from the network to
make space for a cylindrical axon. The diameter of the cylinder
was based on histological studies of the free nerve endings of
nociceptive nerve fibres embedded in the lumbar and cervical
FCLs [26], and the length was chosen to model only a small
portion of the nerve fibre. The axon was oriented in parallel to
the aligned fibres, following experimental observations [4]. For
transverse-to-axon loading, the network domain size was 5 �5 � 3 mm3, so that the axon spanned the whole length of the
network along Z direction (figure 2a). To allow non-affine defor-
mation of the axon in the network, and to avoid applying the
boundary displacement directly on the axon’s end surface, for
axial and shear loadings, the network size was set to 5 � 5 �6 mm3, where the axon occupied only half of the network
length in Z (figure 2b,c). The axon’s end surface was held rigid
for numerical stability. The ECM fibre structure was assumed
to be similar throughout our model’s length scale, as supported
previously by Ban et al. [27], who found that fibre alignment
remains relatively uniform over an approximately 500 mm
length scale, which is two orders of magnitude larger than the
network size in our model. When fibres intersected the cylinder,
they were attached to the cylinder at pin joint insertion points,
and any fibre inside the cylinder was removed. Nonlinear springs
with assumed stiffness equal to half of that of the collagen fibres
were constructed between each insertion point and the adjacent
finite-element nodes on the axon surface (distance ,0.05 mm) to
model focal adhesions. In addition to fibres in the ECM network,
collagen fibres were added circumferential to the axon to ensure
complete wrapping of the axon. Three loading cases—transverse,
axial and shear—were considered (figure 2a–c).
Collagen fibres were modelled with the phenomenological
constitutive equation [28]
F ¼ ASB
exp Bl2 � 1
2
� �� 1
� �, ð2:1Þ
transverse
axial
shear
collagen fibres (CF)
microtubules (MT)
focal adhesions (FA)
non-MT component (NMT)
NMTMT
FA
CF
ZY
X
(a)
(b)
(c)
(d)
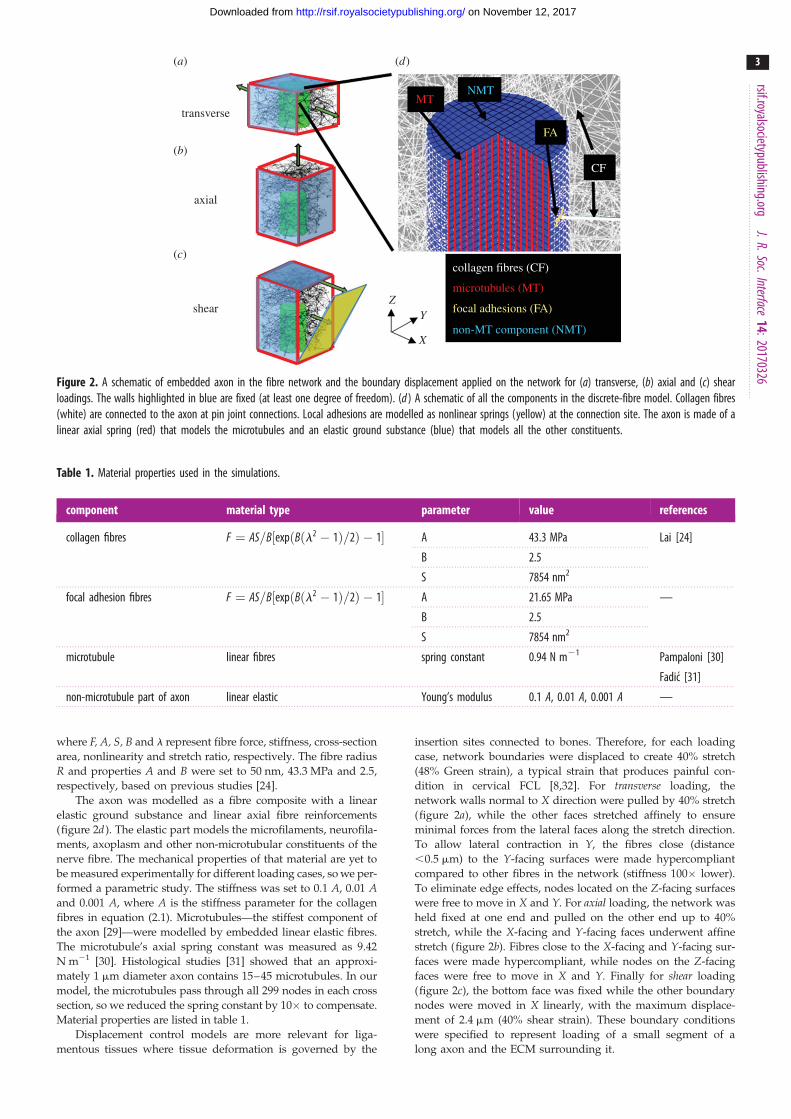
Figure 2. A schematic of embedded axon in the fibre network and the boundary displacement applied on the network for (a) transverse, (b) axial and (c) shearloadings. The walls highlighted in blue are fixed (at least one degree of freedom). (d ) A schematic of all the components in the discrete-fibre model. Collagen fibres(white) are connected to the axon at pin joint connections. Local adhesions are modelled as nonlinear springs (yellow) at the connection site. The axon is made of alinear axial spring (red) that models the microtubules and an elastic ground substance (blue) that models all the other constituents.
Table 1. Material properties used in the simulations.
component material type parameter value references
collagen fibres F ¼ AS=B½expðBðl2 � 1Þ=2Þ � 1� A 43.3 MPa Lai [24]
B 2.5
S 7854 nm2
focal adhesion fibres F ¼ AS=B½expðBðl2 � 1Þ=2Þ � 1� A 21.65 MPa —
B 2.5
S 7854 nm2
microtubule linear fibres spring constant 0.94 N m21 Pampaloni [30]
Fadic [31]
non-microtubule part of axon linear elastic Young’s modulus 0.1 A, 0.01 A, 0.001 A —
rsif.royalsocietypublishing.orgJ.R.Soc.Interface
14:20170326
3
on November 12, 2017http://rsif.royalsocietypublishing.org/Downloaded from
where F, A, S, B and l represent fibre force, stiffness, cross-section
area, nonlinearity and stretch ratio, respectively. The fibre radius
R and properties A and B were set to 50 nm, 43.3 MPa and 2.5,
respectively, based on previous studies [24].
The axon was modelled as a fibre composite with a linear
elastic ground substance and linear axial fibre reinforcements
(figure 2d). The elastic part models the microfilaments, neurofila-
ments, axoplasm and other non-microtubular constituents of the
nerve fibre. The mechanical properties of that material are yet to
be measured experimentally for different loading cases, so we per-
formed a parametric study. The stiffness was set to 0.1 A, 0.01 Aand 0.001 A, where A is the stiffness parameter for the collagen
fibres in equation (2.1). Microtubules—the stiffest component of
the axon [29]—were modelled by embedded linear elastic fibres.
The microtubule’s axial spring constant was measured as 9.42
N m21 [30]. Histological studies [31] showed that an approxi-
mately 1 mm diameter axon contains 15–45 microtubules. In our
model, the microtubules pass through all 299 nodes in each cross
section, so we reduced the spring constant by 10� to compensate.
Material properties are listed in table 1.
Displacement control models are more relevant for liga-
mentous tissues where tissue deformation is governed by the
insertion sites connected to bones. Therefore, for each loading
case, network boundaries were displaced to create 40% stretch
(48% Green strain), a typical strain that produces painful con-
dition in cervical FCL [8,32]. For transverse loading, the
network walls normal to X direction were pulled by 40% stretch
(figure 2a), while the other faces stretched affinely to ensure
minimal forces from the lateral faces along the stretch direction.
To allow lateral contraction in Y, the fibres close (distance
,0.5 mm) to the Y-facing surfaces were made hypercompliant
compared to other fibres in the network (stiffness 100� lower).
To eliminate edge effects, nodes located on the Z-facing surfaces
were free to move in X and Y. For axial loading, the network was
held fixed at one end and pulled on the other end up to 40%
stretch, while the X-facing and Y-facing faces underwent affine
stretch (figure 2b). Fibres close to the X-facing and Y-facing sur-
faces were made hypercompliant, while nodes on the Z-facing
faces were free to move in X and Y. Finally for shear loading
(figure 2c), the bottom face was fixed while the other boundary
nodes were moved in X linearly, with the maximum displace-
ment of 2.4 mm (40% shear strain). These boundary conditions
were specified to represent loading of a small segment of a
long axon and the ECM surrounding it.
neo-Hookean matrix fibre network
macroscopic element
RVE
symmetryboundarycondition
fixed in Zfixed in ZZ X
Y
Poisson’s effect
imposeddisplacement
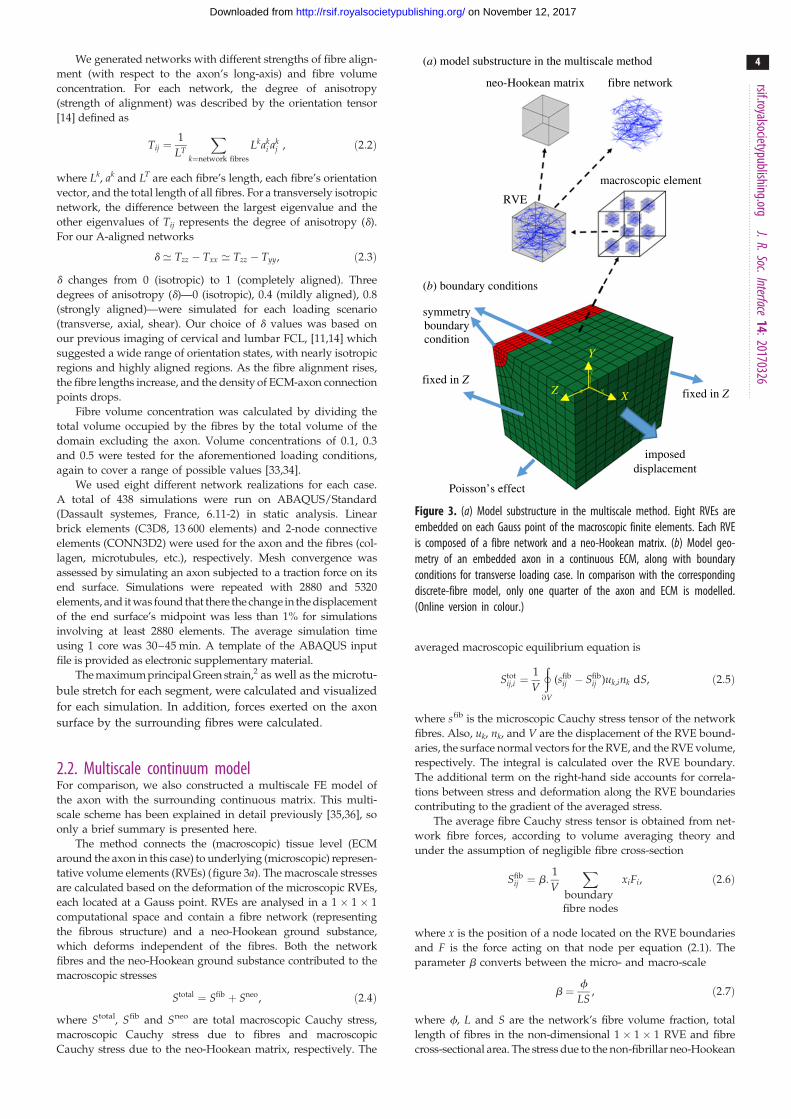
(a) model substructure in the multiscale method
(b) boundary conditions
Figure 3. (a) Model substructure in the multiscale method. Eight RVEs areembedded on each Gauss point of the macroscopic finite elements. Each RVEis composed of a fibre network and a neo-Hookean matrix. (b) Model geo-metry of an embedded axon in a continuous ECM, along with boundaryconditions for transverse loading case. In comparison with the correspondingdiscrete-fibre model, only one quarter of the axon and ECM is modelled.(Online version in colour.)
rsif.royalsocietypublishing.orgJ.R.Soc.Interface
14:20170326
4
on November 12, 2017http://rsif.royalsocietypublishing.org/Downloaded from
We generated networks with different strengths of fibre align-
ment (with respect to the axon’s long-axis) and fibre volume
concentration. For each network, the degree of anisotropy
(strength of alignment) was described by the orientation tensor
[14] defined as
Tij ¼1
LT
Xk¼network fibres
Lkaki ak
j , ð2:2Þ
where Lk, ak and LT are each fibre’s length, each fibre’s orientation
vector, and the total length of all fibres. For a transversely isotropic
network, the difference between the largest eigenvalue and the
other eigenvalues of Tij represents the degree of anisotropy (d).
For our A-aligned networks
d ≃ Tzz � Txx ≃ Tzz � Tyy, ð2:3Þ
d changes from 0 (isotropic) to 1 (completely aligned). Three
degrees of anisotropy (d)—0 (isotropic), 0.4 (mildly aligned), 0.8
(strongly aligned)—were simulated for each loading scenario
(transverse, axial, shear). Our choice of d values was based on
our previous imaging of cervical and lumbar FCL, [11,14] which
suggested a wide range of orientation states, with nearly isotropic
regions and highly aligned regions. As the fibre alignment rises,
the fibre lengths increase, and the density of ECM-axon connection
points drops.
Fibre volume concentration was calculated by dividing the
total volume occupied by the fibres by the total volume of the
domain excluding the axon. Volume concentrations of 0.1, 0.3
and 0.5 were tested for the aforementioned loading conditions,
again to cover a range of possible values [33,34].
We used eight different network realizations for each case.
A total of 438 simulations were run on ABAQUS/Standard
(Dassault systemes, France, 6.11-2) in static analysis. Linear
brick elements (C3D8, 13 600 elements) and 2-node connective
elements (CONN3D2) were used for the axon and the fibres (col-
lagen, microtubules, etc.), respectively. Mesh convergence was
assessed by simulating an axon subjected to a traction force on its
end surface. Simulations were repeated with 2880 and 5320
elements, and it was found that there the change in the displacement
of the end surface’s midpoint was less than 1% for simulations
involving at least 2880 elements. The average simulation time
using 1 core was 30–45 min. A template of the ABAQUS input
file is provided as electronic supplementary material.
The maximum principal Green strain,2 as well as the microtu-
bule stretch for each segment, were calculated and visualized
for each simulation. In addition, forces exerted on the axon
surface by the surrounding fibres were calculated.
2.2. Multiscale continuum modelFor comparison, we also constructed a multiscale FE model of
the axon with the surrounding continuous matrix. This multi-
scale scheme has been explained in detail previously [35,36], so
only a brief summary is presented here.
The method connects the (macroscopic) tissue level (ECM
around the axon in this case) to underlying (microscopic) represen-
tative volume elements (RVEs) (figure 3a). The macroscale stresses
are calculated based on the deformation of the microscopic RVEs,
each located at a Gauss point. RVEs are analysed in a 1 � 1 � 1
computational space and contain a fibre network (representing
the fibrous structure) and a neo-Hookean ground substance,
which deforms independent of the fibres. Both the network
fibres and the neo-Hookean ground substance contributed to the
macroscopic stresses
Stotal ¼ Sfib þ Sneo, ð2:4Þ
where Stotal, Sfib and Sneo are total macroscopic Cauchy stress,
macroscopic Cauchy stress due to fibres and macroscopic
Cauchy stress due to the neo-Hookean matrix, respectively. The
averaged macroscopic equilibrium equation is
Stotij,i ¼
1
V
þ@V
(sfibij � Sfib
ij )uk,ink dS, ð2:5Þ
where sfib is the microscopic Cauchy stress tensor of the network
fibres. Also, uk, nk, and V are the displacement of the RVE bound-
aries, the surface normal vectors for the RVE, and the RVE volume,
respectively. The integral is calculated over the RVE boundary.
The additional term on the right-hand side accounts for correla-
tions between stress and deformation along the RVE boundaries
contributing to the gradient of the averaged stress.
The average fibre Cauchy stress tensor is obtained from net-
work fibre forces, according to volume averaging theory and
under the assumption of negligible fibre cross-section
Sfibij ¼ b:
1
V
Xboundaryfibre nodes
xiFi, ð2:6Þ
where x is the position of a node located on the RVE boundaries
and F is the force acting on that node per equation (2.1). The
parameter b converts between the micro- and macro-scale
b ¼ f
LS, ð2:7Þ
where f, L and S are the network’s fibre volume fraction, total
length of fibres in the non-dimensional 1 � 1 � 1 RVE and fibre
cross-sectional area. The stress due to the non-fibrillar neo-Hookean
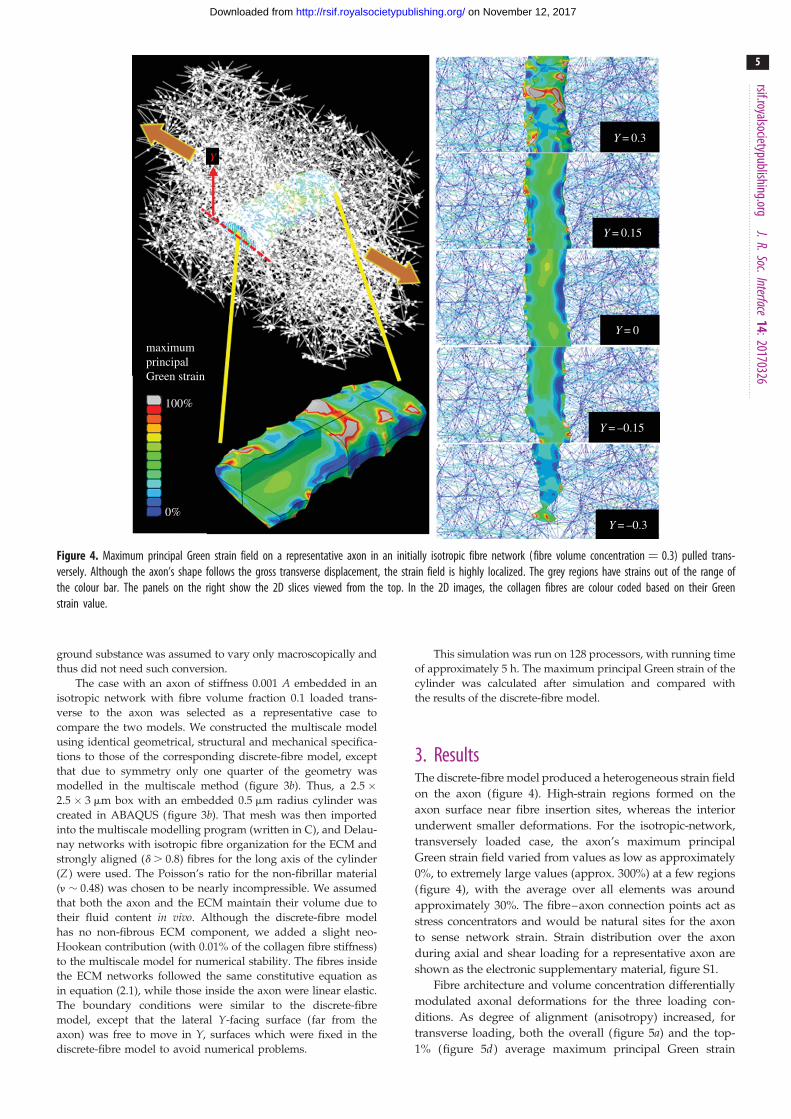
Y
maximumprincipalGreen strain
Y = 0.3
Y = 0.15
Y = 0
Y = –0.15
Y = –0.3
100%
0%
Figure 4. Maximum principal Green strain field on a representative axon in an initially isotropic fibre network (fibre volume concentration ¼ 0.3) pulled trans-versely. Although the axon’s shape follows the gross transverse displacement, the strain field is highly localized. The grey regions have strains out of the range ofthe colour bar. The panels on the right show the 2D slices viewed from the top. In the 2D images, the collagen fibres are colour coded based on their Greenstrain value.
rsif.royalsocietypublishing.orgJ.R.Soc.Interface
14:20170326
5
on November 12, 2017http://rsif.royalsocietypublishing.org/Downloaded from
ground substance was assumed to vary only macroscopically and
thus did not need such conversion.
The case with an axon of stiffness 0.001 A embedded in an
isotropic network with fibre volume fraction 0.1 loaded trans-
verse to the axon was selected as a representative case to
compare the two models. We constructed the multiscale model
using identical geometrical, structural and mechanical specifica-
tions to those of the corresponding discrete-fibre model, except
that due to symmetry only one quarter of the geometry was
modelled in the multiscale method (figure 3b). Thus, a 2.5 �2.5 � 3 mm box with an embedded 0.5 mm radius cylinder was
created in ABAQUS (figure 3b). That mesh was then imported
into the multiscale modelling program (written in C), and Delau-
nay networks with isotropic fibre organization for the ECM and
strongly aligned (d . 0.8) fibres for the long axis of the cylinder
(Z ) were used. The Poisson’s ratio for the non-fibrillar material
(n � 0.48) was chosen to be nearly incompressible. We assumed
that both the axon and the ECM maintain their volume due to
their fluid content in vivo. Although the discrete-fibre model
has no non-fibrous ECM component, we added a slight neo-
Hookean contribution (with 0.01% of the collagen fibre stiffness)
to the multiscale model for numerical stability. The fibres inside
the ECM networks followed the same constitutive equation as
in equation (2.1), while those inside the axon were linear elastic.
The boundary conditions were similar to the discrete-fibre
model, except that the lateral Y-facing surface (far from the
axon) was free to move in Y, surfaces which were fixed in the
discrete-fibre model to avoid numerical problems.
This simulation was run on 128 processors, with running time
of approximately 5 h. The maximum principal Green strain of the
cylinder was calculated after simulation and compared with
the results of the discrete-fibre model.
3. ResultsThe discrete-fibre model produced a heterogeneous strain field
on the axon (figure 4). High-strain regions formed on the
axon surface near fibre insertion sites, whereas the interior
underwent smaller deformations. For the isotropic-network,
transversely loaded case, the axon’s maximum principal
Green strain field varied from values as low as approximately
0%, to extremely large values (approx. 300%) at a few regions
(figure 4), with the average over all elements was around
approximately 30%. The fibre–axon connection points act as
stress concentrators and would be natural sites for the axon
to sense network strain. Strain distribution over the axon
during axial and shear loading for a representative axon are
shown as the electronic supplementary material, figure S1.
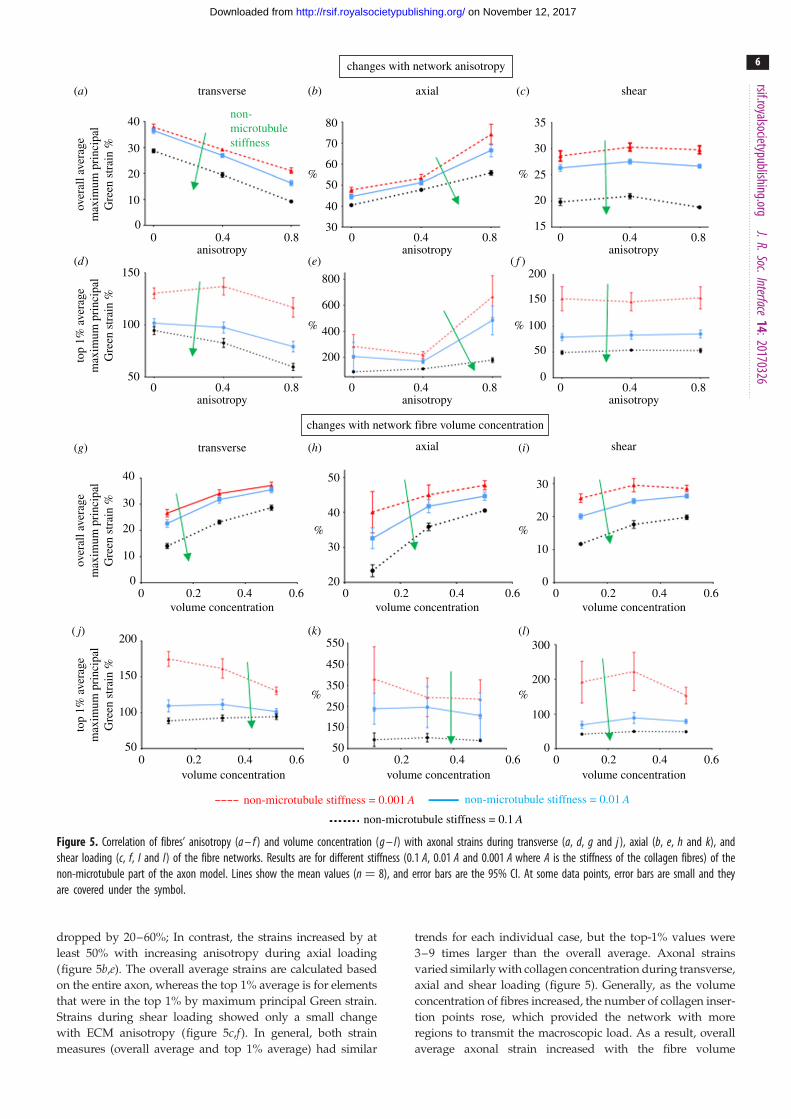
Fibre architecture and volume concentration differentially
modulated axonal deformations for the three loading con-
ditions. As degree of alignment (anisotropy) increased, for
transverse loading, both the overall (figure 5a) and the top-
1% (figure 5d) average maximum principal Green strain
changes with network anisotropy
transverse
40 80 35
30
25
20
15
70
60
50
40
% %
30
non-microtubulestiffness30
20
over
all a
vera
gem
axim
um p
rinc
ipal
Gre
en s
trai
n %
top
1% a
vera
gem
axim
um p
rinc
ipal
Gre
en s
trai
n %
top
1% a
vera
gem
axim
um p
rinc
ipal
Gre
en s
trai
n %
over
all a
vera
gem
axim
um p
rinc
ipal
Gre
en s
trai
n %
10
0
150 800 200
150
100
50
0
600
400% %
200
100
50
40 50 30
20
10
0
40
30
20
30
20
10
00 0.2 0.4
volume concentration0.6 0 0.2 0.4
volume concentration0.60 0.2 0.4
volume concentration0.6
0 0.2 0.4volume concentration
non-microtubule stiffness = 0.001 A non-microtubule stiffness = 0.01 A
non-microtubule stiffness = 0.1 A
0.6 0 0.2 0.4volume concentration
0.60 0.2 0.4volume concentration
0.6
200 550 300
200
100
0
450
350% %
% %
250
150
50
150
100
50
0 0.4 0.8anisotropy
0 0.4 0.8anisotropy
0 0.4 0.8anisotropy
0 0.4 0.8anisotropy
changes with network fibre volume concentration
0 0.4 0.8anisotropy
0 0.4 0.8anisotropy
axial shear
transverse axial shear
(b)(a) (c)
(d) (e) ( f )
(g) (h) (i)
( j) (k) (l)
Figure 5. Correlation of fibres’ anisotropy (a – f ) and volume concentration (g – l) with axonal strains during transverse (a, d, g and j ), axial (b, e, h and k), andshear loading (c, f, I and l) of the fibre networks. Results are for different stiffness (0.1 A, 0.01 A and 0.001 A where A is the stiffness of the collagen fibres) of thenon-microtubule part of the axon model. Lines show the mean values (n ¼ 8), and error bars are the 95% CI. At some data points, error bars are small and theyare covered under the symbol.
rsif.royalsocietypublishing.orgJ.R.Soc.Interface
14:20170326
6
on November 12, 2017http://rsif.royalsocietypublishing.org/Downloaded from
dropped by 20–60%; In contrast, the strains increased by at
least 50% with increasing anisotropy during axial loading
(figure 5b,e). The overall average strains are calculated based
on the entire axon, whereas the top 1% average is for elements
that were in the top 1% by maximum principal Green strain.
Strains during shear loading showed only a small change
with ECM anisotropy (figure 5c,f ). In general, both strain
measures (overall average and top 1% average) had similar
trends for each individual case, but the top-1% values were
3–9 times larger than the overall average. Axonal strains
varied similarly with collagen concentration during transverse,
axial and shear loading (figure 5). Generally, as the volume
concentration of fibres increased, the number of collagen inser-
tion points rose, which provided the network with more
regions to transmit the macroscopic load. As a result, overall
average axonal strain increased with the fibre volume
(a)
(b)
volume concentration
transverse axial shear
0
0 0.4 0.8
1.0
1.0
2.0
1.5
1.2
1.4
1.6
1.8
0.2 0.4 0.6
anisotropy
volume concentration = 0.5
top
1% a
vera
gem
icro
tubu
le s
tret
chto
p 1%
ave
rage
mic
rotu
bule
str
etch
isotropic network
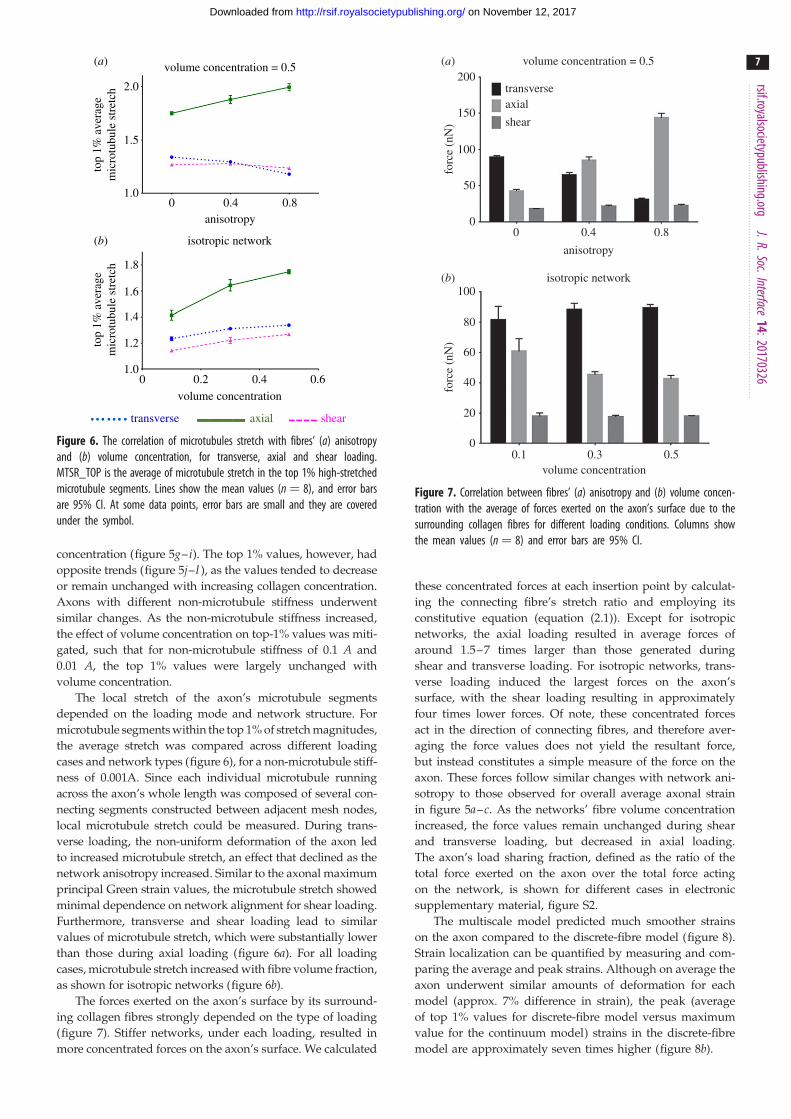
Figure 6. The correlation of microtubules stretch with fibres’ (a) anisotropyand (b) volume concentration, for transverse, axial and shear loading.MTSR_TOP is the average of microtubule stretch in the top 1% high-stretchedmicrotubule segments. Lines show the mean values (n ¼ 8), and error barsare 95% CI. At some data points, error bars are small and they are coveredunder the symbol.
(a)
(b)
volume concentration0.1
0 0.4
anisotropy
volume concentration = 0.5
isotropic network
0.8
0
0
50
100
150
200
20
40
60
80
100
forc
e (n
N)
forc
e (n
N)
0.3 0.5
transverseaxial
shear
Figure 7. Correlation between fibres’ (a) anisotropy and (b) volume concen-tration with the average of forces exerted on the axon’s surface due to thesurrounding collagen fibres for different loading conditions. Columns showthe mean values (n ¼ 8) and error bars are 95% CI.
rsif.royalsocietypublishing.orgJ.R.Soc.Interface
14:20170326
7
on November 12, 2017http://rsif.royalsocietypublishing.org/Downloaded from
concentration (figure 5g– i). The top 1% values, however, had
opposite trends (figure 5j– l ), as the values tended to decrease
or remain unchanged with increasing collagen concentration.
Axons with different non-microtubule stiffness underwent
similar changes. As the non-microtubule stiffness increased,
the effect of volume concentration on top-1% values was miti-
gated, such that for non-microtubule stiffness of 0.1 A and
0.01 A, the top 1% values were largely unchanged with
volume concentration.
The local stretch of the axon’s microtubule segments
depended on the loading mode and network structure. For
microtubule segments within the top 1% of stretch magnitudes,
the average stretch was compared across different loading
cases and network types (figure 6), for a non-microtubule stiff-
ness of 0.001A. Since each individual microtubule running
across the axon’s whole length was composed of several con-
necting segments constructed between adjacent mesh nodes,
local microtubule stretch could be measured. During trans-
verse loading, the non-uniform deformation of the axon led
to increased microtubule stretch, an effect that declined as the
network anisotropy increased. Similar to the axonal maximum
principal Green strain values, the microtubule stretch showed
minimal dependence on network alignment for shear loading.
Furthermore, transverse and shear loading lead to similar
values of microtubule stretch, which were substantially lower
than those during axial loading (figure 6a). For all loading
cases, microtubule stretch increased with fibre volume fraction,
as shown for isotropic networks (figure 6b).
The forces exerted on the axon’s surface by its surround-
ing collagen fibres strongly depended on the type of loading
(figure 7). Stiffer networks, under each loading, resulted in
more concentrated forces on the axon’s surface. We calculated
these concentrated forces at each insertion point by calculat-
ing the connecting fibre’s stretch ratio and employing its
constitutive equation (equation (2.1)). Except for isotropic
networks, the axial loading resulted in average forces of
around 1.5–7 times larger than those generated during
shear and transverse loading. For isotropic networks, trans-
verse loading induced the largest forces on the axon’s
surface, with the shear loading resulting in approximately
four times lower forces. Of note, these concentrated forces
act in the direction of connecting fibres, and therefore aver-
aging the force values does not yield the resultant force,
but instead constitutes a simple measure of the force on the
axon. These forces follow similar changes with network ani-
sotropy to those observed for overall average axonal strain
in figure 5a–c. As the networks’ fibre volume concentration
increased, the force values remain unchanged during shear
and transverse loading, but decreased in axial loading.
The axon’s load sharing fraction, defined as the ratio of the
total force exerted on the axon over the total force acting
on the network, is shown for different cases in electronic
supplementary material, figure S2.
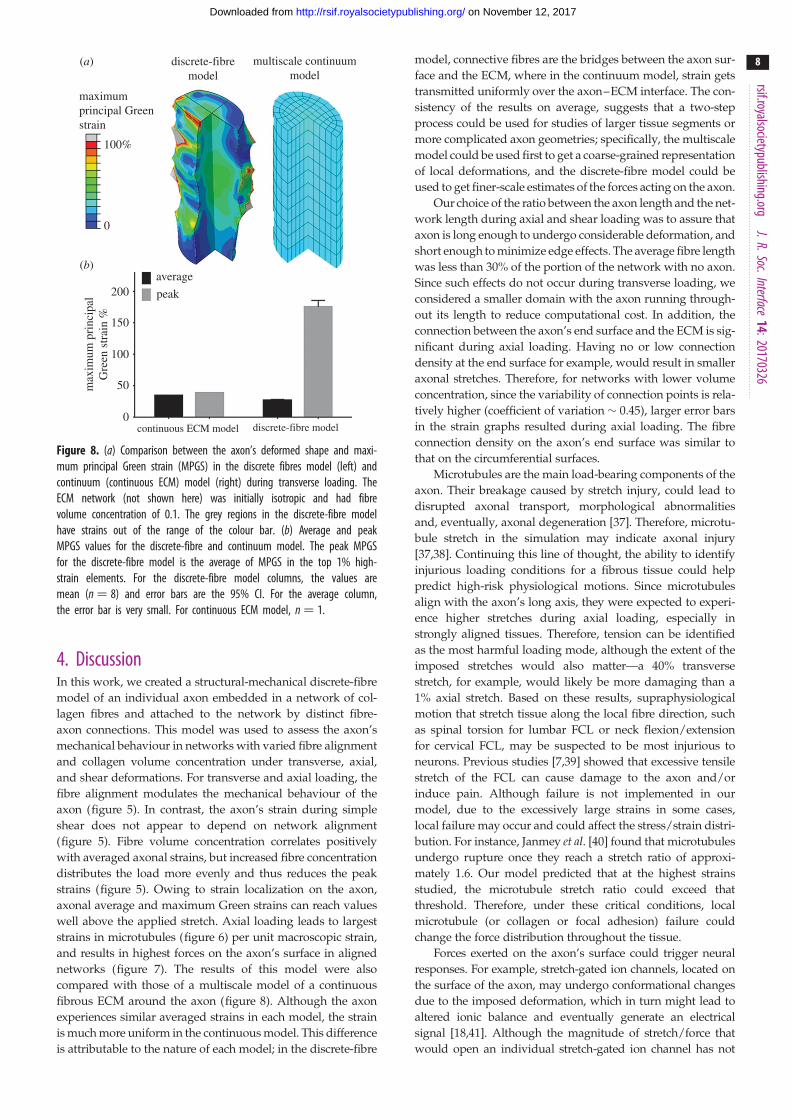
The multiscale model predicted much smoother strains
on the axon compared to the discrete-fibre model (figure 8).
Strain localization can be quantified by measuring and com-
paring the average and peak strains. Although on average the
axon underwent similar amounts of deformation for each
model (approx. 7% difference in strain), the peak (average
of top 1% values for discrete-fibre model versus maximum
value for the continuum model) strains in the discrete-fibre
model are approximately seven times higher (figure 8b).
discrete-fibremodel
(a)
(b)
discrete-fibre model
multiscale continuummodel
maximumprincipal Greenstrain
max
imum
pri
ncip
alG
reen
str
ain
%
100%
200
150
100
50
0continuous ECM model
average
peak
0
Figure 8. (a) Comparison between the axon’s deformed shape and maxi-mum principal Green strain (MPGS) in the discrete fibres model (left) andcontinuum (continuous ECM) model (right) during transverse loading. TheECM network (not shown here) was initially isotropic and had fibrevolume concentration of 0.1. The grey regions in the discrete-fibre modelhave strains out of the range of the colour bar. (b) Average and peakMPGS values for the discrete-fibre and continuum model. The peak MPGSfor the discrete-fibre model is the average of MPGS in the top 1% high-strain elements. For the discrete-fibre model columns, the values aremean (n ¼ 8) and error bars are the 95% CI. For the average column,the error bar is very small. For continuous ECM model, n ¼ 1.
rsif.royalsocietypublishing.orgJ.R.Soc.Interface
14:20170326
8
on November 12, 2017http://rsif.royalsocietypublishing.org/Downloaded from
4. DiscussionIn this work, we created a structural-mechanical discrete-fibre
model of an individual axon embedded in a network of col-
lagen fibres and attached to the network by distinct fibre-
axon connections. This model was used to assess the axon’s
mechanical behaviour in networks with varied fibre alignment
and collagen volume concentration under transverse, axial,
and shear deformations. For transverse and axial loading, the
fibre alignment modulates the mechanical behaviour of the
axon (figure 5). In contrast, the axon’s strain during simple
shear does not appear to depend on network alignment
(figure 5). Fibre volume concentration correlates positively
with averaged axonal strains, but increased fibre concentration
distributes the load more evenly and thus reduces the peak
strains (figure 5). Owing to strain localization on the axon,
axonal average and maximum Green strains can reach values
well above the applied stretch. Axial loading leads to largest
strains in microtubules (figure 6) per unit macroscopic strain,
and results in highest forces on the axon’s surface in aligned
networks (figure 7). The results of this model were also
compared with those of a multiscale model of a continuous
fibrous ECM around the axon (figure 8). Although the axon
experiences similar averaged strains in each model, the strain
is much more uniform in the continuous model. This difference
is attributable to the nature of each model; in the discrete-fibre
model, connective fibres are the bridges between the axon sur-
face and the ECM, where in the continuum model, strain gets
transmitted uniformly over the axon–ECM interface. The con-
sistency of the results on average, suggests that a two-step
process could be used for studies of larger tissue segments or
more complicated axon geometries; specifically, the multiscale
model could be used first to get a coarse-grained representation
of local deformations, and the discrete-fibre model could be
used to get finer-scale estimates of the forces acting on the axon.
Our choice of the ratio between the axon length and the net-
work length during axial and shear loading was to assure that
axon is long enough to undergo considerable deformation, and
short enough to minimize edge effects. The average fibre length
was less than 30% of the portion of the network with no axon.
Since such effects do not occur during transverse loading, we
considered a smaller domain with the axon running through-
out its length to reduce computational cost. In addition, the
connection between the axon’s end surface and the ECM is sig-
nificant during axial loading. Having no or low connection
density at the end surface for example, would result in smaller
axonal stretches. Therefore, for networks with lower volume
concentration, since the variability of connection points is rela-
tively higher (coefficient of variation � 0.45), larger error bars
in the strain graphs resulted during axial loading. The fibre
connection density on the axon’s end surface was similar to
that on the circumferential surfaces.
Microtubules are the main load-bearing components of the
axon. Their breakage caused by stretch injury, could lead to
disrupted axonal transport, morphological abnormalities
and, eventually, axonal degeneration [37]. Therefore, microtu-
bule stretch in the simulation may indicate axonal injury
[37,38]. Continuing this line of thought, the ability to identify
injurious loading conditions for a fibrous tissue could help
predict high-risk physiological motions. Since microtubules
align with the axon’s long axis, they were expected to experi-
ence higher stretches during axial loading, especially in
strongly aligned tissues. Therefore, tension can be identified
as the most harmful loading mode, although the extent of the
imposed stretches would also matter—a 40% transverse
stretch, for example, would likely be more damaging than a
1% axial stretch. Based on these results, supraphysiological
motion that stretch tissue along the local fibre direction, such
as spinal torsion for lumbar FCL or neck flexion/extension
for cervical FCL, may be suspected to be most injurious to
neurons. Previous studies [7,39] showed that excessive tensile
stretch of the FCL can cause damage to the axon and/or
induce pain. Although failure is not implemented in our
model, due to the excessively large strains in some cases,
local failure may occur and could affect the stress/strain distri-
bution. For instance, Janmey et al. [40] found that microtubules
undergo rupture once they reach a stretch ratio of approxi-
mately 1.6. Our model predicted that at the highest strains
studied, the microtubule stretch ratio could exceed that
threshold. Therefore, under these critical conditions, local
microtubule (or collagen or focal adhesion) failure could
change the force distribution throughout the tissue.
Forces exerted on the axon’s surface could trigger neural
responses. For example, stretch-gated ion channels, located on
the surface of the axon, may undergo conformational changes
due to the imposed deformation, which in turn might lead to
altered ionic balance and eventually generate an electrical
signal [18,41]. Although the magnitude of stretch/force that
would open an individual stretch-gated ion channel has not
rsif.royalsocietypublishing.orgJ.R.Soc.Interface
14:20170326
9
on November 12, 2017http://rsif.royalsocietypublishing.org/Downloaded from
been quantified experimentally, our results provide a controlled
comparison to identify the loading modes more likely to open
these channels. Based on our results, axial deformation applies
the largest forces to the axon’s surface in aligned ECM networks
(figure 7). Force values in figure 7 are per ECM-axon connection
point. Therefore, our results correlating this force with fibre
volume concentration suggest that although the total force on
the axon varies linearly with number of ECM-axon connection
points during transverse and shear loading, during axial load-
ing, however, the force does not rise as much when the number
of connection points increases. The average force values ranged
from approximately 15 nN to approximately 150 nN, com-
parable to forces reported previously for cells/axons in
stretchable substrates (range from 0 to 40 nN) [42,43]. These
results are particularly significant for the cervical FCL, which
undergoes large axial deformation in the joint direction
during neck flexion/extension. The lumbar FCL contains col-
lagen fibres mainly aligned in the facet joint direction, and it
undergoes axial tension during spine motion [44] (e.g. torsion)
as well.
Owing to heterogeneous fibre structure and loading in the
spinal FCLs, accurately determining how fibres are loaded
requires experimental observations or realistic structure-based
models. In the cervical FCL, for example, there is a wide range
of fibre orientation with various degrees of anisotropy [11].
Therefore, even gross axial loading during neck flexion might
lead to shear or transverse loadings of some fibres (with respect
to their direction), and other modes of neck motion, such as tor-
sion, might also lead to axial loading of some fibres. In the case
of lumbar FCL, however, since the fibres are primarily oriented
in the joint direction [14], estimating the loading of fibres during
different physiological motions is easier.
Comparison between our discrete-fibre and multiscale con-
tinuum models reveals the inherent capabilities and limitations
of each. On one hand, the multiscale model cannot predict
heterogenous axonal deformation due to non-continuous con-
nections between the axon and its surrounding fibres. The
multiscale model can, however, perform more robustly, in
terms of numerical stability, for more complicated geometries
and loadings or for very large problems, a feature that could
be a concern for the discrete-fibre model. Therefore, these
methods are complementary and must be used together.
There are several methodological considerations regard-
ing our discrete-fibre model. First, the axon was simplified
as a cylinder with axial linear microtubules in a linearly elas-
tic ground substance. The modelled microtubules spanned
the entire cross section of the axon, and they also elongated
through the entire length of our axon segment. In vivo, how-
ever, the axon has a more complicated structure with
multiple interconnected constituents. For instance, axonal
microtubules have been shown to have an average length of
4 mm and to be arranged in polarized arrays in each cross sec-
tion [45,46]. We homogenized the axon structure in our model
by having more microtubules with lower stiffness than the real
axon does. In addition, lumping all of the non-microtubule
constituents of the axon into a linear elastic material may
have oversimplified the axon’s complex internal structure.
Owing to the lack of experimental data on the properties of
non-microtubule components of the axon, especially during
transverse loading where microtubules are not loaded, we con-
sidered a range stiffness values. This sensitivity analysis does
not ensure the accuracy of the simulation. In fact, our results
from the continuum model for a transversely loaded isotropic
network suggest that the ECM may experience higher strains
than the axon, which is not consistent with the fact that neurons
have higher compliance compared to the surrounding ECM
[24,47]. Owing to low cost for fibre reorientation and the
fibres’ inability to bear moments, as well as possible inconsis-
tency of material properties between axon and ECM since
they are from different sources, this inconsistency is not entirely
unexpected. Improved models with more detailed axon struc-
ture could be used to study the regulation of axonal
cytoskeleton in response to tissue loading.
The collagen fibre network structure and the axon-fibre
connections are also idealizations. Focal adhesions are compli-
cated structures with many components [16]. In our model,
however, we modelled them as simple nonlinear springs that
distributed the collagen fibre forces on insertion points
between the axon and the fibre network. These nonlinear
springs were assumed to behave similar to collagen fibres,
with half of the stiffness. This assumption is not supported
by any experimental observation and was chosen merely to
provide a bridge between collagen fibres and the axon. Focal
adhesion springs distribute the fibre forces between adjacent
nodes at the connection site, so having more compliant focal
adhesions would result in sharper strain transmission. Also,
increasing the length of these springs would enlarge the
axon–ECM interacting area and result in more uniform
axonal strains. Reportedly, the size of focal adhesions correlates
with ECM stiffness [48], so relating the adhesion stiffness to the
ECM stiffness might be necessary. Further experimental obser-
vations, such as high-resolution imaging, are necessitated to
validate our assumption of focal adhesion’s size and proper-
ties. Lastly, the non-fibrous components of the ECM may also
contribute, depending on the tissue and the loading configur-
ation. Since these components contain water content, they
might be significant during rapid compressive loading. Also,
a non-fibrous component could facilitate strain transmission
to the axon and reduce strain localization. Although, this com-
ponent might elevate the overall stiffness of the matrix, by
limiting the extent of the fibre reorientation. The mechanical be-
haviour of fibrous tissues is modulated by fibre reorientations
in response to external loading. It is thus essential to recruit
detailed material models that effectively incorporate fibre
architecture [49,50]. Efficient structural models enable robust
computational simulations of complex geometries [51–54]
and altered tissue states [55].
A complementary study with experimental validation of
the discussed computational models would be very useful.
Fine tuning the material properties, geometries and structures
requires comparison with a set of experimental observations
at the axon’s scale. For instance, tracking individual axon
deformations during their displacement would provide greater
insight into mechanical properties of axons, structure of
binding sites, etc.
Regardless of these limitations, the discrete-fibre model can
serve as a tool to study the relationships between a fibrous
tissue’s microstructure and the mechanical responses of the
innervating nerves. The model shows how different local
ECM loading could be critical in modulating the mechanical be-
haviour of the nerve endings. Innervated fibrous tissues, such as
the facet capsular ligament, undergo complex deformations
during daily activities [10,44]. Complicated macroscopic
deformation patterns within the tissues, along with their non-
uniform microstructure, impose complex loading on the nerve
fibres. Our model could help identify vulnerable regions in
rsif.royalsocietypublishing.orgJ.R.Soc.Interface
14:20170326
10
on November 12, 2017http://rsif.royalsocietypublishing.org/Downloaded from
heterogeneous fibrous tissues and injurious loading conditions
in vivo, which are otherwise difficult to probe experimentally.
Our results suggest that this utility requires realistic characteriz-
ation of nerve–ECM connection if one considers vulnerability
in terms of local behaviour of the nerve. Our two models
show two likely different limits of nerve–ECM interaction,
and the actual connection is potentially somewhere between
these two approaches. The discrete-fibre and multiscale conti-
nuum models, each and/or together, can serve as tools to
bridge between gross tissue motion and the sensory response.
At one end of the bridge, tying this model to local fibre architec-
ture and also local macroscale tissue deformation—obtained
experimentally [13,44] or by modelling approaches [10,14]—
during supraphysiological motions could provide us with a
better estimate of the how damaging loads are transmitted to
the nerves. At the other end, using the mechanical response
of the nerves to predict their electrical response could yield
insights on how different body motions could induce injury
or pain.
Data accessibility. Data have been uploaded as ESM.
Authors’ contributions. V.Z., S.Z., B.A.W. and V.H.B. designed this studyand contributed to writing of the manuscript. V.Z. conducted the
research implementation, computer modelling and data analysis.S.Z. contributed with model set-up. B.A.W. and V.H.B. supervisedthe whole work and contributed to interpretation of results.
Competing interests. The authors declare no competing interests.
Funding. This work was supported by the National Institutes of Health(U01EB016638) (V.H.B. and B.A.W.), AMTI Force and Motion Scho-larship (S.Z.), and a National Science Foundation training grant(#1548571) (S.Z.).
Acknowledgements. We acknowledge the Minnesota SupercomputingInstitute (MSI) at the University of Minnesota for providing resourcesused for our computational methods. We extend our thanks toMr Weston Fiebiger for his contributions in helping in post-processingparts of simulations.
Endnotes1The Delaunay tessellation is formed by connecting points in a pointcloud to form tetrahedra such that the sphere circumscribing anytetrahedron contains none of the original points except for thetetrahedron’s vertices.2The Green strain is a common quadratic strain measurement for softtissues, where large displacements result in inaccuracies in linearstrain metrics.
References
1. Strine TW, Hootman JM. 2007 US nationalprevalence and correlates of low back and neck painamong adults. Arthritis Rheum. 57, 656 – 665.(doi:10.1002/art.22684)
2. Deyo RA, Mirza SK, Martin BI. 2006 Back painprevalence and visit rates: estimates from U.S. nationalsurveys, 2002. Spine (Phila. Pa. 1976) 31, 2724–2727. (doi:10.1097/01.brs.0000244618.06877.cd)
3. Jaumard NV, Welch WC, Winkelstein BA. 2011Spinal facet joint biomechanics andmechanotransduction in normal, injury anddegenerative conditions. J. Biomech. Eng. 133,71010. (doi:10.1115/1.4004493)
4. Kallakuri S. 2012 Innervation of cervical ventralfacet joint capsule: histological evidence. WorldJ. Orthop. 3, 10. (doi:10.5312/wjo.v3.i2.10)
5. Lee KE, Davis MB, Mejilla RM, Winkelstein BA. 2004In vivo cervical facet capsule distraction: mechanicalimplications for whiplash and neck pain. Stapp CarCrash J. 48, 373 – 395.
6. Bogduk N. 2011 On cervical zygapophysial jointpain after whiplash. Spine (Phila. Pa. 1976) 36,194 – 199. (doi:10.1097/BRS.0b013e3182387f1d)
7. Cavanaugh JM, Lu Y, Chen C, Kallakuri S. 2006 Paingeneration in lumbar and cervical facet joints.J. Bone Joint Surg. Am. 88(Suppl. 2), 63 – 67.(doi:10.2106/JBJS.E.01411)
8. Kallakuri S, Singh A, Lu Y, Chen C, Patwardhan A,Cavanaugh JM. 2008 Tensile stretching of cervicalfacet joint capsule and related axonal changes. Eur.Spine J. 17, 556 – 563. (doi:10.1007/s00586-007-0562-0)
9. Lu Y, Chen C, Kallakuri S, Patwardhan A, CavanaughJM. 2005 Neural response of cervical facet jointcapsule to stretch: a study of whiplash painmechanism. Stapp Car Crash J. 49, 49 – 65.
10. Claeson AA, Barocas VH. 2016 Computer simulationof lumbar flexion shows shear of the facet capsularligament. Spine J. 17, 109 – 119. (doi:10.1016/j.spinee.2016.08.014)
11. Quinn KP, Winkelstein BA. 2008 Altered collagenfiber kinematics define the onset of localizedligament damage during loading. J. Appl. Physiol.105, 1881 – 1888. (doi:10.1152/japplphysiol.90792.2008)
12. Zhang S, Bassett DS, Winkelstein BA. 2016Stretch-induced network reconfiguration of collagenfibres in the human facet capsular ligament.J. R. Soc. Interface 13, 20150883. (doi:10.1098/rsif.2015.0883)
13. Claeson AA, Barocas VH. 2017 Planar biaxialextension of the lumbar facet capsular ligamentreveals significant in-plane shear forces. J. Mech.Behav. Biomed. Mater. 65, 127 – 136. (doi:10.1016/j.jmbbm.2016.08.019)
14. Zarei V, Liu CJ, Claeson AA, Akkin T, Barocas VH.2017 Image-based multiscale mechanical modelingshows the importance of structural heterogeneity inthe human lumbar facet capsular ligament.Biomech. Model. Mechanobiol. 16, 1425 – 1438.(doi:10.1007/s10237-017-0896-4)
15. Zhang S, Zarei V, Winkelstein BA, Barocas VH. 2017Multiscale mechanics of the cervical facet capsularligament, with particular emphasis on anomalousfiber realignment prior to tissue failure. Biomech.Model. Mechanobiol. 1 – 13. (doi:10.1007/s10237-017-0949-8)
16. Critchley DR. 2000 Focal adhesions—thecytoskeletal connection. Curr. Opin. Cell Biol. 12,133 – 139. (doi:10.1016/S0955-0674(99)00067-8)
17. Cullen DK, Lessing MC, Laplaca MC. 2007 Collagen-dependent neurite outgrowth and response to
dynamic deformation in three-dimensional neuronalcultures. Ann. Biomed. Eng. 35, 835 – 846. (doi:10.1007/s10439-007-9292-z)
18. Janmey PA. 1998 The cytoskeleton and cellsignaling: component localization and mechanicalcoupling. Physiol. Rev. 78, 763 – 781. (doi:10.1002/(sici)1097-4644(19960616)61:4,514::aid-jcb4.3.0.co)
19. Quinn KP, Winkelstein BA. 2009 Vector correlationtechnique for pixel-wise detection of collagen fiberrealignment during injurious tensile loading.J. Biomed. Opt. 14, 54010-1 – 54010-10. (doi:10.1117/1.3227037)
20. Zhang S, Cao X, Stablow A, Shenoy V, WinkelsteinBA. 2015 Tissue strain reorganizes collagen with aswitch-like response that regulates neuronal ERKphosphorylation in vitro: implications forligamentous injury and mechanotransduction.J. Biomech. Eng. 138, 1 – 12. (doi:10.1115/1.4031975)
21. Bernal R, Pullarkat PA, Melo F. 2007 Mechanicalproperties of axons. Phys. Rev. Lett. 99, 18301.(doi:10.1103/PhysRevLett.99.018301)
22. Cullen DK, LaPlaca MC. 2006 Neuronal responseto high rate shear deformation depends onheterogeneity of the local strain field.J. Neurotrauma 23, 1304 – 1319. (doi:10.1089/neu.2006.23.1304)
23. Miller EJ, Gay S. 1982 Collagen: an overview.Methods Enzymol. 82, 3 – 32. (doi:10.1016/0076-6879(82)82058-2)
24. Lai VK, Lake SP, Frey CR, Tranquillo RT, Barocas VH.2012 Mechanical behavior of collagen-fibrin co-gelsreflects transition from series to parallel interactionswith increasing collagen content. J. Biomech. Eng.134, 11004. (doi:10.1115/1.4005544)
rsif.royalsocietypublishing.orgJ.R.Soc.Interface
14:20170326
11
on November 12, 2017http://rsif.royalsocietypublishing.org/Downloaded from
25. Abhilash AS, Baker BM, Trappmann B, Chen CS,Shenoy VB. 2014 Remodeling of fibrous extracellularmatrices by contractile cells: Predictions fromdiscrete fiber network simulations. Biophys. J. 107,1829 – 1840. (doi:10.1016/j.bpj.2014.08.029)
26. McLain RF. 1993 Mechanoreceptor endings inhuman cervical facet joints. Iowa Orthop. J. 13,149 – 154.
27. Ban E, Zhang S, Zarei V, Barocas VH, Winkelstein BA,Picu CR. 2017 Collagen organization in facetcapsular ligaments varies with spinal region andwith ligament deformation. J. Biomech. Eng. 139,1 – 37. (doi:10.1115/1.4036019)
28. Billiar KL, Sacks MS. 2000 Biaxial mechanicalproperties of the native and glutaraldehyde-treatedaortic valve cusp: part II—a structural constitutivemodel. J. Biomech. Eng. 122, 327. (doi:10.1115/1.1287158)
29. Ouyang H, Nauman E, Shi R. 2013 Contribution ofcytoskeletal elements to the axonal mechanicalproperties. J. Biol. Eng. 7, 21. (doi:10.1186/1754-1611-7-21)
30. Pampaloni F, Lattanzi G, Jonas A, Surrey T, Frey E,Florin E-L. 2006 Thermal fluctuations of graftedmicrotubules provide evidence of a length-dependent persistence length. Proc. Natl Acad. Sci.USA 103, 10 248 – 10 253. (doi:10.1073/pnas.0603931103)
31. Fadic R, Vergara J, Alvarez J. 1985 Microtubules andcaliber of central and peripheral processes ofsensory axons. J. Comp. Neurol. 236, 258 – 264.(doi:10.1002/cne.902360209)
32. Lee KE, Winkelstein BA. 2009 Joint distractionmagnitude is associated with different behavioraloutcomes and substance p levels for cervical facetjoint loading in the rat. J. Pain 10, 436 – 445.(doi:10.1016/j.jpain.2008.11.009)
33. Wren TA, Carter DR. 1998 A microstructural modelfor the tensile constitutive and failure behavior ofsoft skeletal connective tissues. J. Biomech. Eng.120, 55 – 61. (doi:10.1115/1.2834307)
34. Hurschler C, Loitz-Ramage B, Vanderby R. 1997A structurally based stress-stretch relationship fortendon and ligament. J. Biomech. Eng. 119, 392.(doi:10.1115/1.2798284)
35. Chandran PL, Barocas VH. 2007 Deterministicmaterial-based averaging theory model of collagengel micromechanics. J. Biomech. Eng. 129,137 – 147. (doi:10.1115/1.2472369)
36. Stylianopoulos T, Barocas VH. 2007 Volume-averagingtheory for the study of the mechanics of collagen
networks. Comput. Methods Appl. Mech. Eng. 196,2981 – 2990. (doi:10.1016/j.cma.2006.06.019)
37. Tang-Schomer MD, Patel AR, Baas PW, Smith DH.2010 Mechanical breaking of microtubules in axonsduring dynamic stretch injury underlies delayedelasticity, microtubule disassembly, and axondegeneration. FASEB J. 24, 1401 – 1410. (doi:10.1096/fj.09-142844)
38. Tang-Schomer MD, Johnson VE, Baas PW, StewartW, Smith DH. 2012 Partial interruption of axonaltransport due to microtubule breakage accounts forthe formation of periodic varicosities after traumaticaxonal injury. Exp. Neurol. 233, 364 – 372. (doi:10.1016/j.expneurol.2011.10.030)
39. Lee KE, Davis MB, Winkelstein BA. 2008 Capsularligament involvement in the development ofmechanical hyperalgesia after facet joint loading:behavioral and inflammatory outcomes in a rodentmodel of pain. J. Neurotrauma 25, 1383 – 1393.(doi:10.1089/neu.2008.0700)
40. Janmey PA, Euteneuer U, Traub P, Unit H, HospitalMG, Biology C. 1991 Viscoelastic properties ofvimentin compared with other filamentousbiopolymer networks. J. Cell Biol. 113, 155 – 160.(doi:10.1083/jcb.113.1.155)
41. Vogel V, Sheetz M. 2006 Local force and geometrysensing regulate cell functions. Nat. Rev. Mol. CellBiol. 7, 265 – 275. (doi:10.1038/nrm1890)
42. Hemphill MA, Dabiri BE, Gabriele S, Kerscher L,Franck C, Goss JA, Alford PW, Parker KK. 2011 Apossible role for integrin signaling in diffuse axonalinjury. PLoS ONE 6, e22899. (doi:10.1371/journal.pone.0022899)
43. Tan JL, Tien J, Pirone DM, Gray DS, Bhadriraju K,Chen CS. 2003 Cells lying on a bed of microneedles:an approach to isolate mechanical force. Proc. NatlAcad. Sci. USA 100, 1484 – 1489. (doi:10.1073/pnas.0235407100)
44. Ianuzzi A, Little JS, Chiu JB, Baitner A, Kawchuk G,Khalsa PS. 2004 Human lumbar facet joint capsulestrains: I. During physiological motions. Spine J. 4,141 – 152. (doi:10.1016/j.spinee.2003.07.008)
45. Conde C, Caceres A. 2009 Microtubule assembly,organization and dynamics in axons and dendrites. Nat.Rev. Neurosci. 10, 319 – 332. (doi:10.1038/nrn2631)
46. Yu W, Baas PW. 1994 Changes in microtubulenumber and length during axon differentiation.J. Neurosci. 14, 2818 – 2829. (doi:10.1083/JCB.200201029)
47. Spedden E, White JD, Naumova EN, Kaplan DL, StaiiC. 2012 Elasticity maps of living neurons measured
by combined fluorescence and atomic forcemicroscopy. Biophys. J. 103, 868 – 877. (doi:10.1016/j.bpj.2012.08.005)
48. Cao X, Lin Y, Driscoll TP, Franco-Barraza J,Cukierman E, Mauck RL, Shenoy VB. 2015 Achemomechanical model of matrix and nuclearrigidity regulation of focal adhesion size. Biophys. J.109, 1807 – 1817. (doi:10.1016/j.bpj.2015.08.048)
49. Drach A, Khalighi AH, Sacks MS. 2017 Acomprehensive pipeline for multi-resolutionmodeling of the mitral valve: validation,computational efficiency, and predictive capability.Int. J. Numer. Method. Biomed. Eng. e2921. (doi:10.1002/cnm.2921)
50. Rego BV, Sacks MS. 2017 A functionally gradedmaterial model for the transmural stress distributionof the aortic valve leaflet. J. Biomech. 54, 88 – 95.(doi:10.1016/j.jbiomech.2017.01.039)
51. Khalighi AH, Drach A, ter Huurne FM, Lee C-H,Bloodworth C, Pierce EL, Jensen MO, YoganathanAP, Sacks MS. 2015 A comprehensive framework forthe characterization of the complete mitral valvegeometry for the development of a population-averaged model. In Functional imaging andmodeling of the heart (eds H. van Assen, P.Bovendeerd, T. Delhaas T), pp. 164 – 171. FIMH2015. Lecture Notes in Computer Science, vol. 9126.Cham, Switzerland: Springer. (doi:10.1007/978-3-319-20309-6_19))
52. Khalighi AH, Drach A, Bloodworth CH, Pierce EL,Yoganathan AP, Gorman RC, Gorman JH, Sacks MS.2017 Mitral valve chordae tendineae: topologicaland geometrical characterization. Ann. Biomed. Eng.45, 378 – 393. (doi:10.1007/s10439-016-1775-3)
53. Bloodworth CH, Pierce EL, Easley TF, Drach A,Khalighi AH, Toma M, Jensen MO, Sacks MS,Yoganathan AP. 2017 Ex vivo methods for informingcomputational models of the mitral valve. Ann.Biomed. Eng. 45, 496 – 507. (doi:10.1007/s10439-016-1734-z)
54. Drach A, Khalighi AH, ter Huurne FM, Lee C-H,Bloodworth C, Pierce EL, Jensen MO, YoganathanAP, Sacks MS. 2015 Population-averaged geometricmodel of mitral valve from patient-specific imagingdata. J. Med. Dev. 9, 30952. (doi:10.1115/1.4030582)
55. Sacks MS, Rego BV, Wells SM, Lee C-H. 2016 Mitralvalve leaflet remodelling during pregnancy: insightsinto cell-mediated recovery of tissue homeostasis.J. R. Soc. Interface 13, 20160709. (doi:10.1098/rsif.2016.0709)