Embed Size (px)
Citation preview
TISS-DSF EMISSIONSMODELTejal KanitkarTata Institute of Social Sciences, Mumbai
Presentation at the Conference on ‘Global Carbon Budgets and Equity in Climate Change, TISS, 28-29 June 2010
PRODUCT OF A TATA INSTITUTE OFSOCIAL SCIENCES (TISS) – DELHISOCIAL SCIENCES (TISS) DELHISCIENCE FORUM (DSF) COLLABORATION
AUTHORS:
TEJAL KANITKAR, T. JAYARAMAN, MARIO D'SOUZA, MUKUL SANWAN, MARIO D SOUZA, MUKUL SANWAN, PRABIR PURKAYASTHA, RAJBANSTALWAR AND D. RAGHUNANDAN
FRAMEWORK FOR THE MODEL
Nature imposes a global carbon budgetMitigation efforts must begin with recognition of physical constraints on emissions
The atmosphere is to be regarded as a global commonsco o s
Validates equity as the basic rule for the partitioning of global carbon budget
Dual Character of CO2 emissions Both ‘pollution’ and ‘necessity’
RULE I - EQUITY BASED RULES FORPARTITIONING REMAINING CARBON SPACE
Countries cut ``consumption emissions'' if pcurrent share > fair share of carbon space. Countries are allowed ``development'' emissions if current share < fair share of carbon space. Reduction in emissions even for those developing countries that can reach fair share at end of time countries that can reach fair share at end of time period
Objective – Minimize (negative) deviation from fair share
HISTORICAL RESPONSIBILITY
Current Total Stock of Carbon in the Atmosphere p(from base year to 2009) Total contribution of each country/region to t h i t katmospheric stock
Possible base yearPossible base year1850 – Start of emissions (post industrial revolution)1970 – CO2 emissions monitoring recognized by 1972 in the UN Stockholm conference on the Human Environment
HISTORICAL EMISSIONS
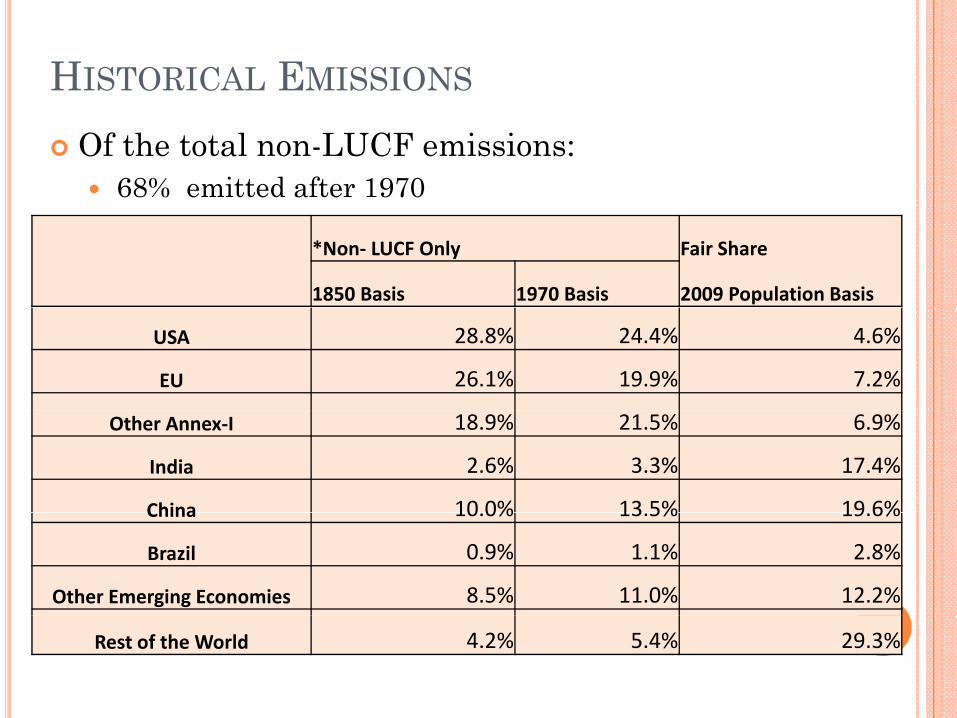
Of the total non-LUCF emissions:68% emitted after 1970
*Non‐ LUCF Only Fair Share
1850 Basis 1970 Basis 2009 Population Basis
USA 28.8% 24.4% 4.6%
EU 26.1% 19.9% 7.2%
Other Annex‐I 18.9% 21.5% 6.9%
India 2.6% 3.3% 17.4%
China 10 0% 13 5% 19 6%China 10.0% 13.5% 19.6%
Brazil 0.9% 1.1% 2.8%
Other Emerging Economies 8.5% 11.0% 12.2%
Rest of the World 4.2% 5.4% 29.3%
SHIFT OF BASE YEAR
Over-occupation not a result of early p yindustrialisation
Improvement in efficiency not equal to emissions reductions. Independent efforts required by Annex-IAnnex I
Loss of ground for China and ‘Other Emerging Economies’ (but close to fair share attained nonetheless)
RULE II – FIXING THE GLOBAL CARBONBUDGET
Dependent on degree of riskp g2ºC over pre-industrial levels generally acceptedRange of probabilities for given carbon budget
Between 2000 and 20501000 GtCO2 P b bilit b t 10% d 1000 GtCO2 Probability between 10% and 42% of exceeding a 2 deg C rise1440 GtCO2 Probability between 29% and 0 G CO o a y e wee 9% a 70% of exceeding a 2 deg C rise(Meinshausen et al.)
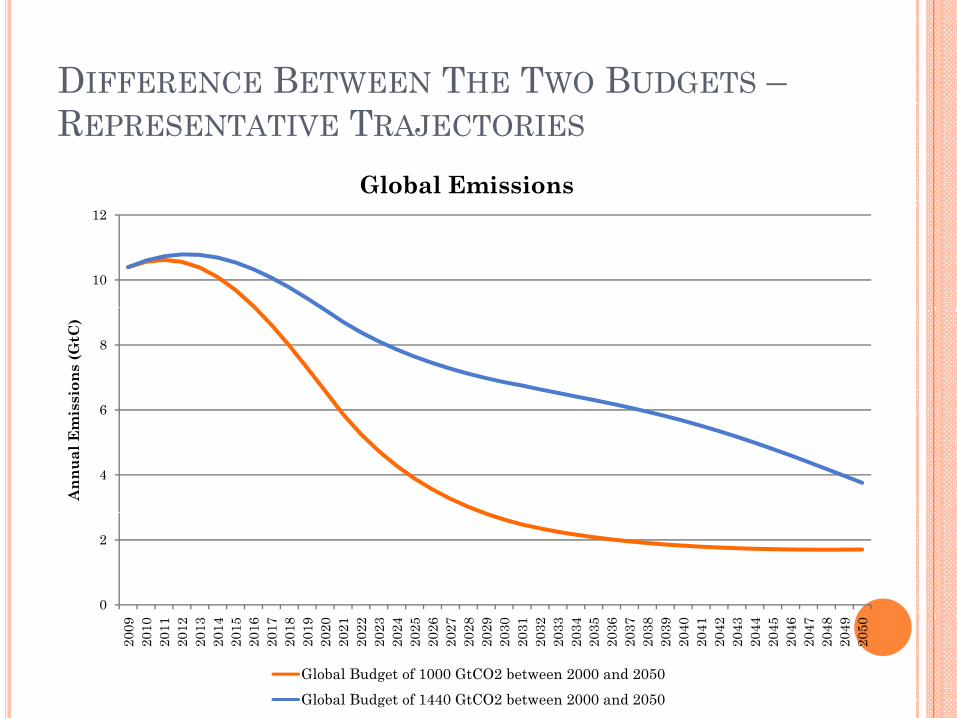
DIFFERENCE BETWEEN THE TWO BUDGETS –REPRESENTATIVE TRAJECTORIES
Global Emissions
10
12
6
8
ssio
ns (G
tC)
4
6
Ann
ual E
mi
0
2
2009
2010
2011
2012
2013
2014
2015
2016
2017
2018
2019
2020
2021
2022
2023
2024
2025
2026
2027
2028
2029
2030
2031
2032
2033
2034
2035
2036
2037
2038
2039
2040
2041
2042
2043
2044
2045
2046
2047
2048
2049
2050
Global Budget of 1000 GtCO2 between 2000 and 2050Global Budget of 1440 GtCO2 between 2000 and 2050
RULE III – PER CAPITA ANNUAL FLOWS
Countries with per capita emissions above specified thresholds must do more
Objective – Minimize (negative) deviation from specified threshold of per capita from specified threshold of per capita emissions
Rule I, Rule II, Rule III – weighted 10:10:3(More weight to violating equity in stock and the global
carbon budget)ca bo budget)
EMISSIONS AND GROWTH RATES
Current Emissions (2009)( )Non-LUCF (Land Use Change and Forestry) + LUCF
C t R t f G th f E i iCurrent Rate of Growth of EmissionsAverage rate of growth of total emissions (LUCF + non-LUCF) for the last 5 years
PopulationConstant Population 2009Moving Population Projections from the UN WPP Moving Population Projections from the UN WPP till 2050
THE EMISSIONS MODEL
Dynamically implement rules I-III as “soft y y pconstraints”
For each milestone year maximum rate of reduction and maximum rate of growth specified in common for all countriesin common for all countries
16 Region GAMS based non-linear model produces region/country wise carbon allocations based on Rules I, II and III
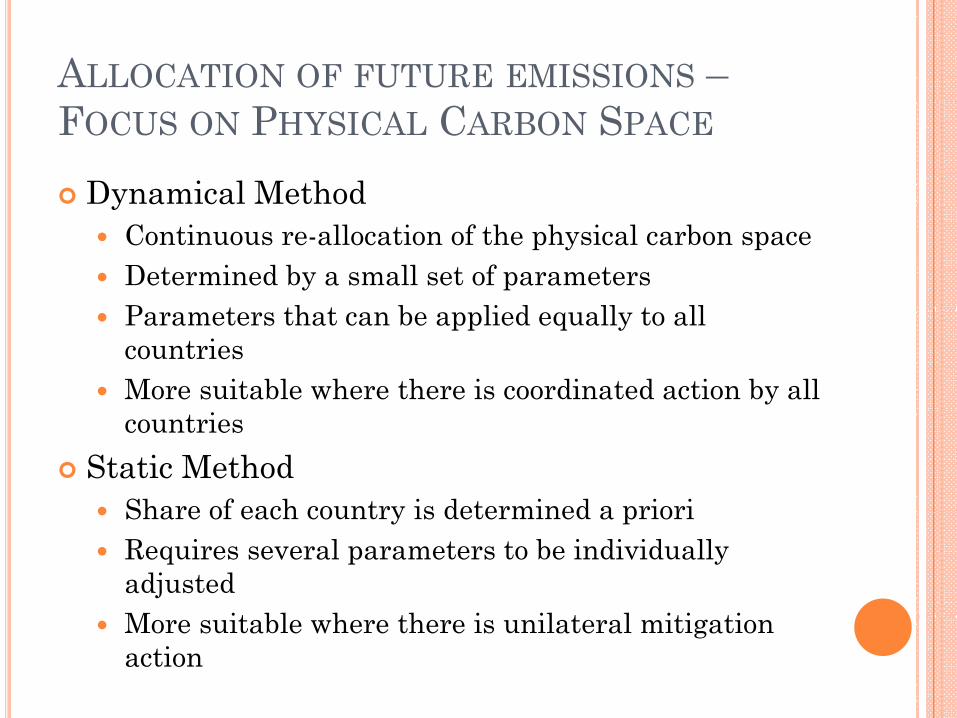
ALLOCATION OF FUTURE EMISSIONS –FOCUS ON PHYSICAL CARBON SPACE
Dynamical MethodyContinuous re-allocation of the physical carbon spaceDetermined by a small set of parametersP t th t b li d ll t ll Parameters that can be applied equally to all countriesMore suitable where there is coordinated action by all countries
Static MethodShare of each country is determined a prioriShare of each country is determined a prioriRequires several parameters to be individually adjustedM it bl h th i il t l iti ti More suitable where there is unilateral mitigation action
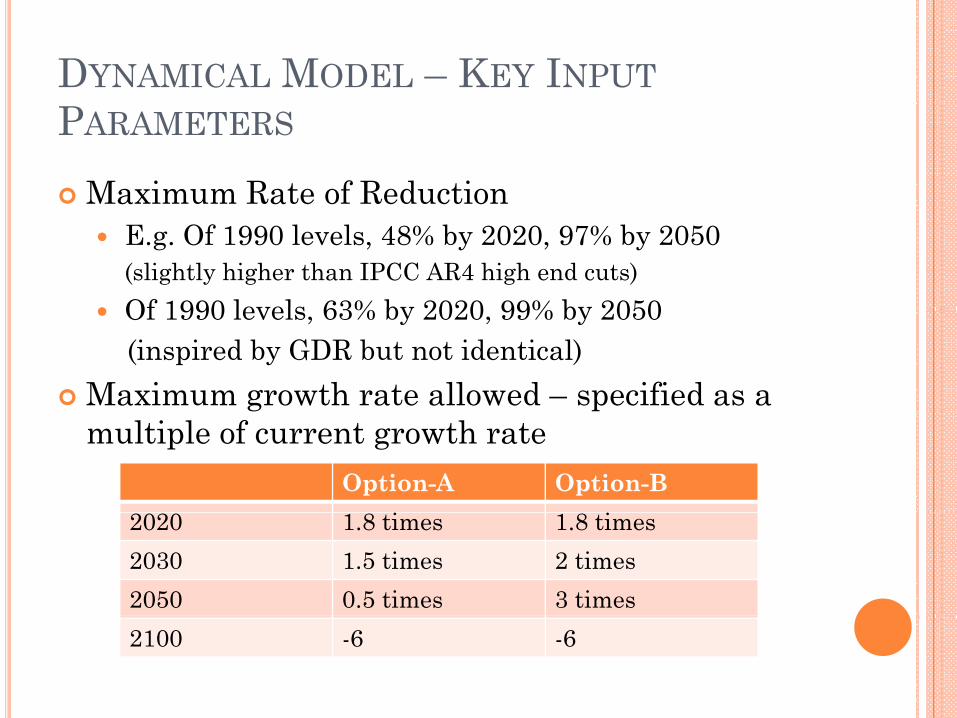
DYNAMICAL MODEL – KEY INPUTPARAMETERS
Maximum Rate of ReductionE.g. Of 1990 levels, 48% by 2020, 97% by 2050 (slightly higher than IPCC AR4 high end cuts)Of 1990 levels 63% by 2020 99% by 2050Of 1990 levels, 63% by 2020, 99% by 2050(inspired by GDR but not identical)
Maximum growth rate allowed – specified as a g pmultiple of current growth rate
Option-A Option-B i i2020 1.8 times 1.8 times
2030 1.5 times 2 times2050 0.5 times 3 times2100 -6 -6
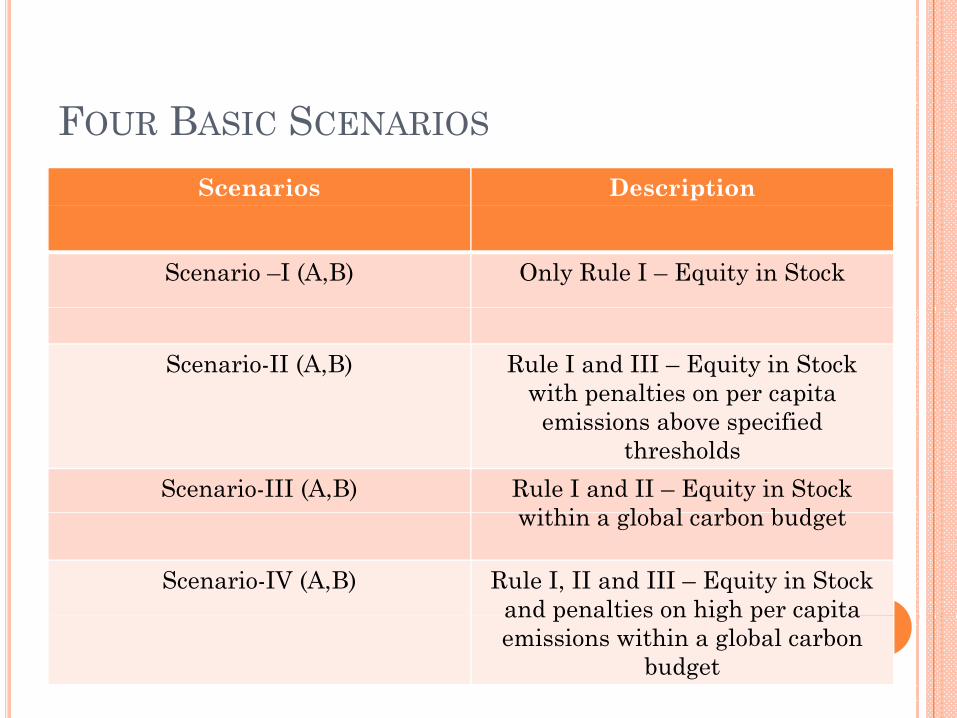
FOUR BASIC SCENARIOS
Scenarios Description
Scenario –I (A,B) Only Rule I – Equity in Stock
Scenario-II (A,B) Rule I and III – Equity in Stockwith penalties on per capita
emissions above specified thresholds
Scenario-III (A,B) Rule I and II – Equity in Stock ithi l b l b b d twithin a global carbon budget
Scenario-IV (A,B) Rule I, II and III – Equity in Stock and penalties on high per capita and penalties on high per capita emissions within a global carbon
budget
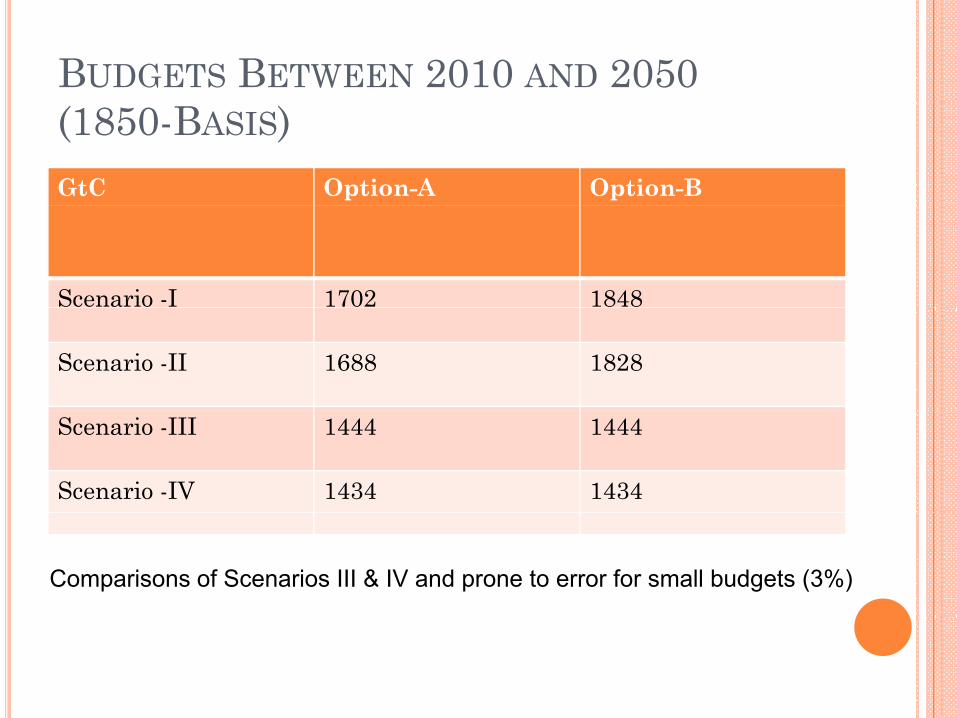
BUDGETS BETWEEN 2010 AND 2050 (1850-BASIS)GtC Option-A Option-B
Scenario -I 1702 1848
Scenario -II 1688 1828
Scenario -III 1444 1444
Scenario -IV 1434 1434
Comparisons of Scenarios III & IV and prone to error for small budgets (3%)
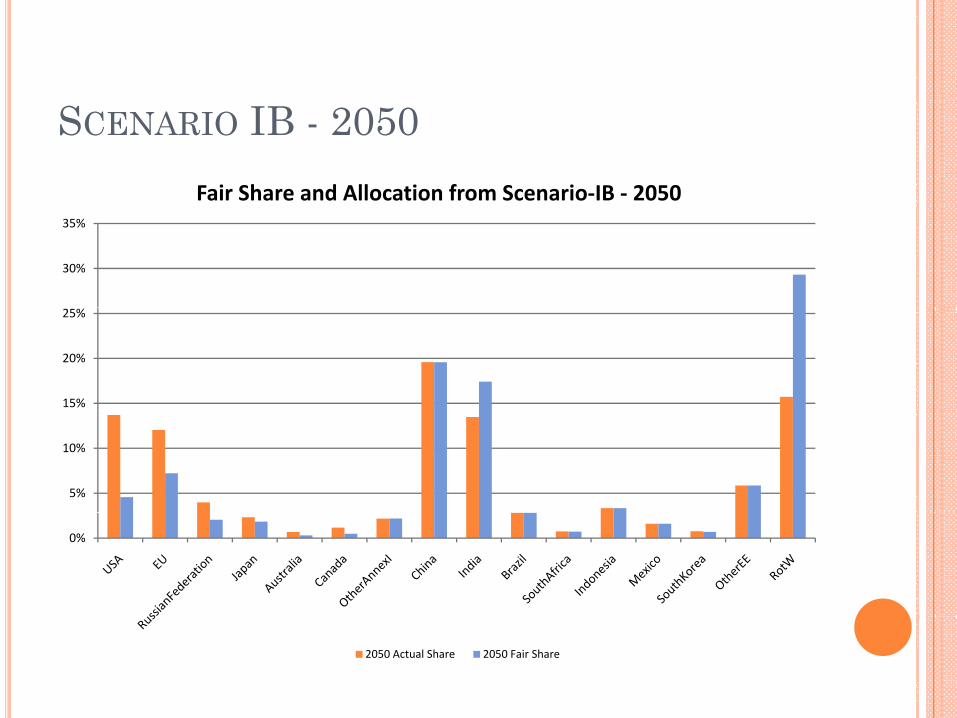
SCENARIO IB - 2050Fair Share and Allocation from Scenario‐IB ‐ 2050
30%
35%
15%
20%
25%
5%
10%
0%
2050 Actual Share 2050 Fair Share
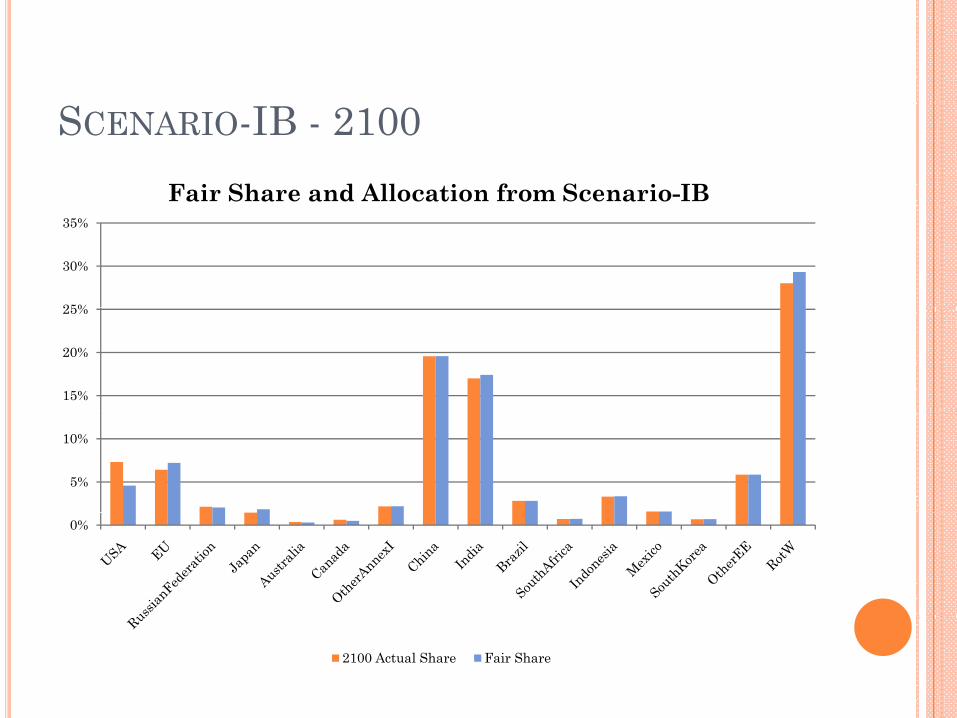
SCENARIO-IB - 2100Fair Share and Allocation from Scenario-IB
25%
30%
35%
15%
20%
25%
5%
10%
0%
2100 Actual Share Fair Share
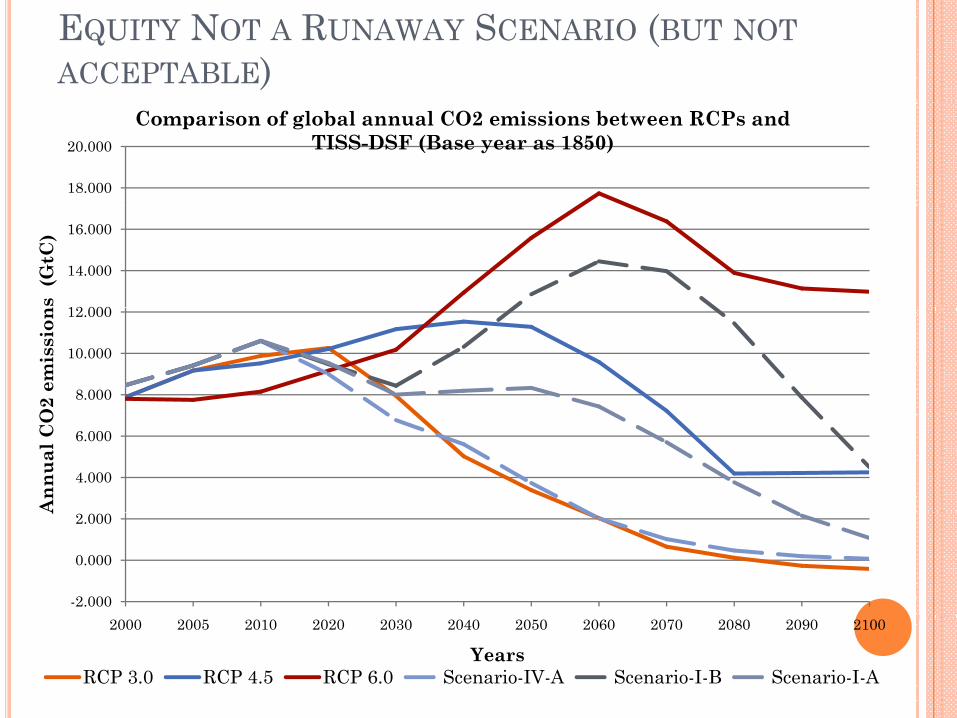
EQUITY NOT A RUNAWAY SCENARIO (BUT NOTACCEPTABLE)
18.000
20.000Comparison of global annual CO2 emissions between RCPs and
TISS-DSF (Base year as 1850)
12 000
14.000
16.000
ns (
GtC
)
8.000
10.000
12.000
O2
emis
sion
4.000
6.000
Ann
ual C
O
-2.000
0.000
2.000A
2000 2005 2010 2020 2030 2040 2050 2060 2070 2080 2090 2100
YearsRCP 3.0 RCP 4.5 RCP 6.0 Scenario-IV-A Scenario-I-B Scenario-I-A
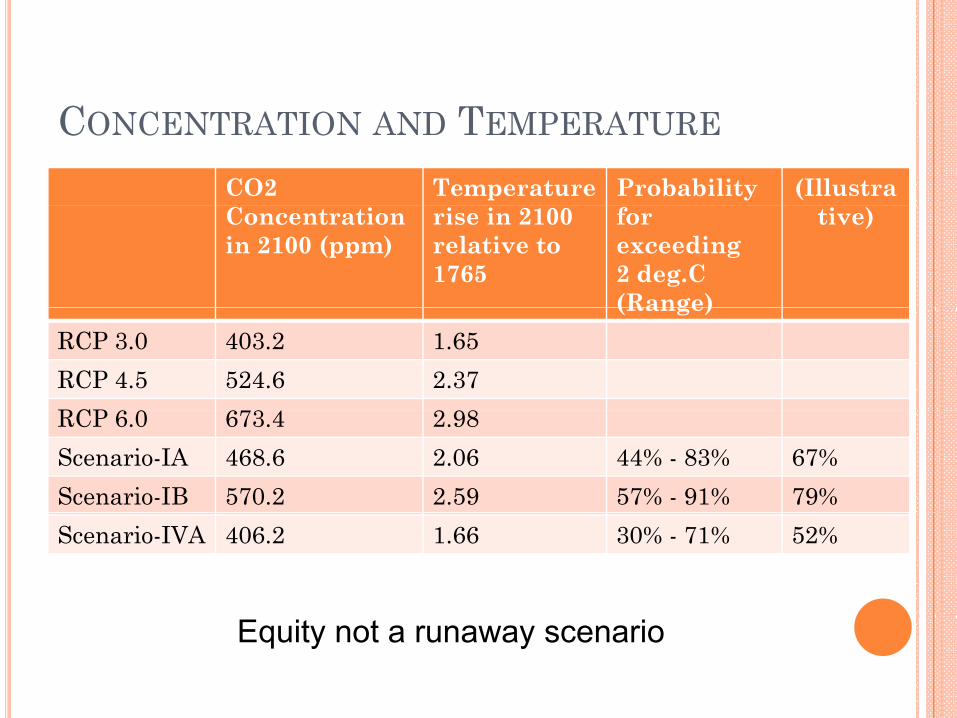
CONCENTRATION AND TEMPERATURE
CO2 Temperature Probability (IllustraConcentrationin 2100 (ppm)
rise in 2100 relative to 1765
for exceeding 2 deg.C(Range)
tive)
(Range)RCP 3.0 403.2 1.65RCP 4.5 524.6 2.37RCP RCP 6.0 673.4 2.98Scenario-IA 468.6 2.06 44% - 83% 67%Scenario-IB 570.2 2.59 57% - 91% 79%Scenario-IVA 406.2 1.66 30% - 71% 52%
Equity not a runaway scenario
Thank you
Tejal KanitkarCenter for Science Technology and SocietyTata Institute of Social Science, [email protected]
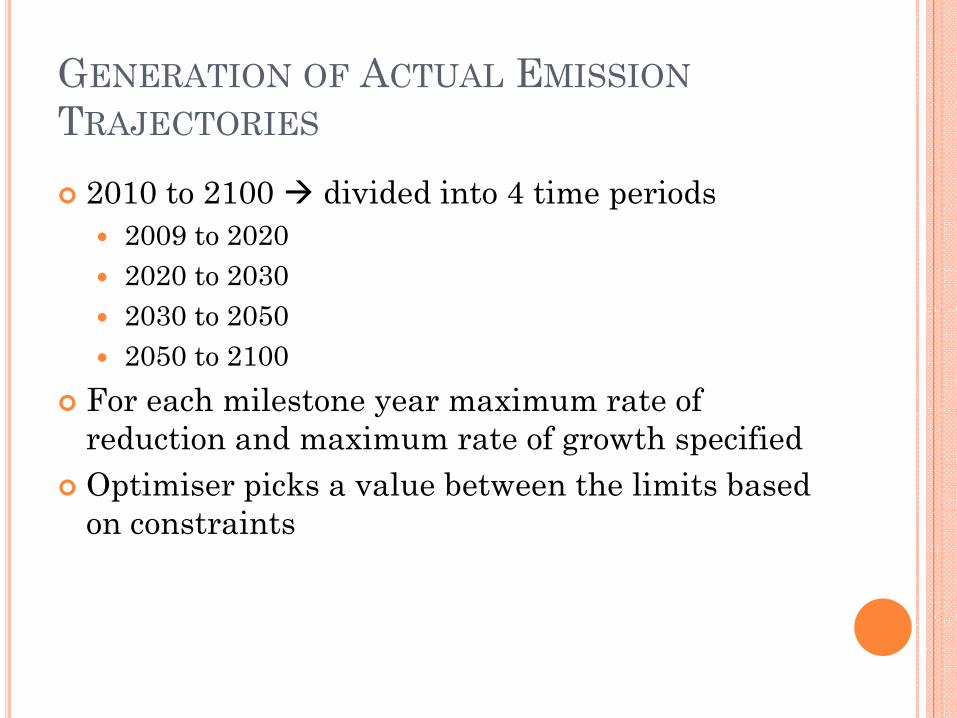
GENERATION OF ACTUAL EMISSIONTRAJECTORIES
2010 to 2100 divided into 4 time periodsp2009 to 20202020 to 20302030 t 20502030 to 20502050 to 2100
For each milestone year maximum rate of For each milestone year maximum rate of reduction and maximum rate of growth specifiedOptimiser picks a value between the limits based
i on constraints
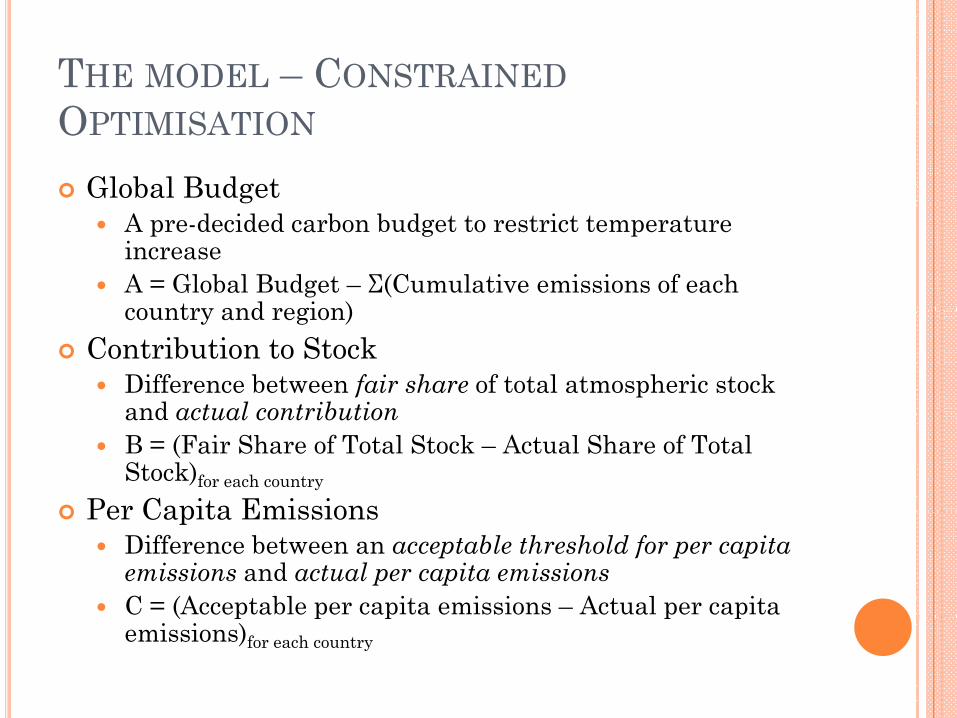
THE MODEL – CONSTRAINEDOPTIMISATION
Global BudgetA pre-decided carbon budget to restrict temperature increaseA = Global Budget – Σ(Cumulative emissions of each
t d i ) country and region) Contribution to Stock
Difference between fair share of total atmospheric stock and actual contributionand actual contributionB = (Fair Share of Total Stock – Actual Share of Total Stock)for each country
Per Capita EmissionsPer Capita EmissionsDifference between an acceptable threshold for per capita emissions and actual per capita emissionsC = (Acceptable per capita emissions – Actual per capita ( p p p p pemissions)for each country
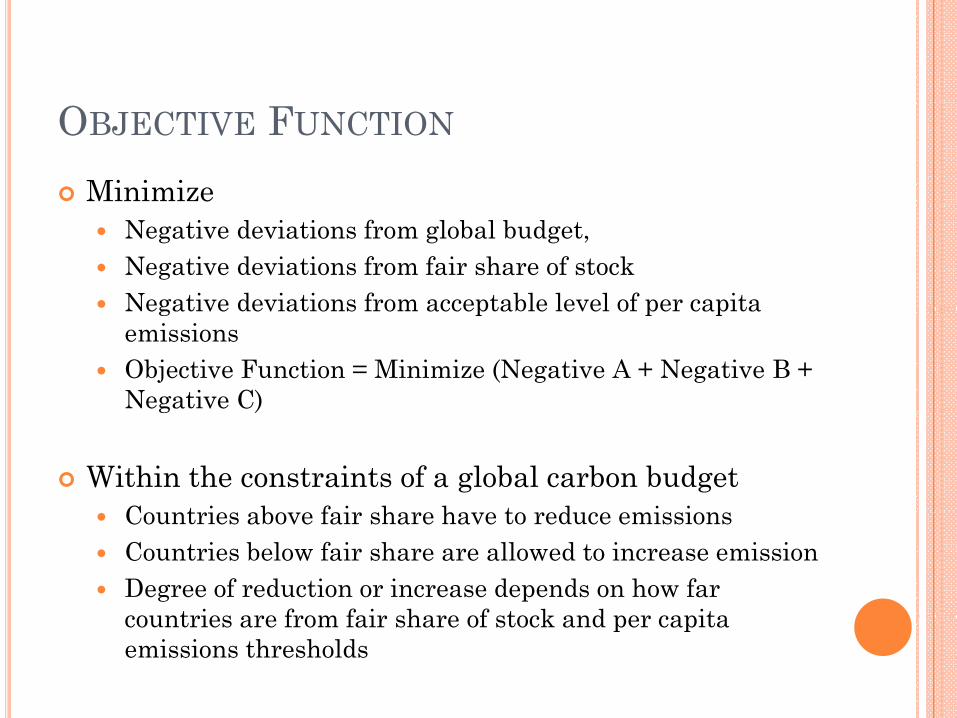
OBJECTIVE FUNCTION
MinimizeNegative deviations from global budget, Negative deviations from fair share of stock Negative deviations from acceptable level of per capita Negative deviations from acceptable level of per capita emissionsObjective Function = Minimize (Negative A + Negative B + Negative C)g )
Within the constraints of a global carbon budgetCountries above fair share have to reduce emissionsCountries above fair share have to reduce emissionsCountries below fair share are allowed to increase emissionDegree of reduction or increase depends on how far
t i f f i h f t k d it countries are from fair share of stock and per capita emissions thresholds
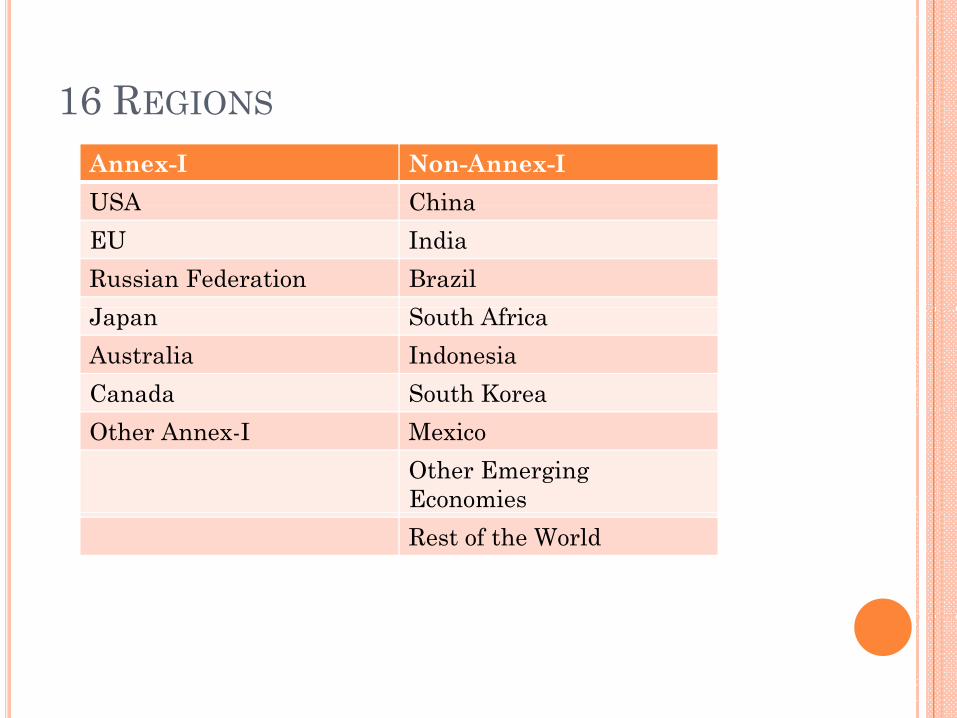
16 REGIONS16 REGIONS
Annex-I Non-Annex-IUSA ChinaUSA ChinaEU IndiaRussian Federation Brazil
S AfJapan South AfricaAustralia IndonesiaCanada South KoreaOther Annex-I Mexico
Other Emerging EconomiesRest of the World
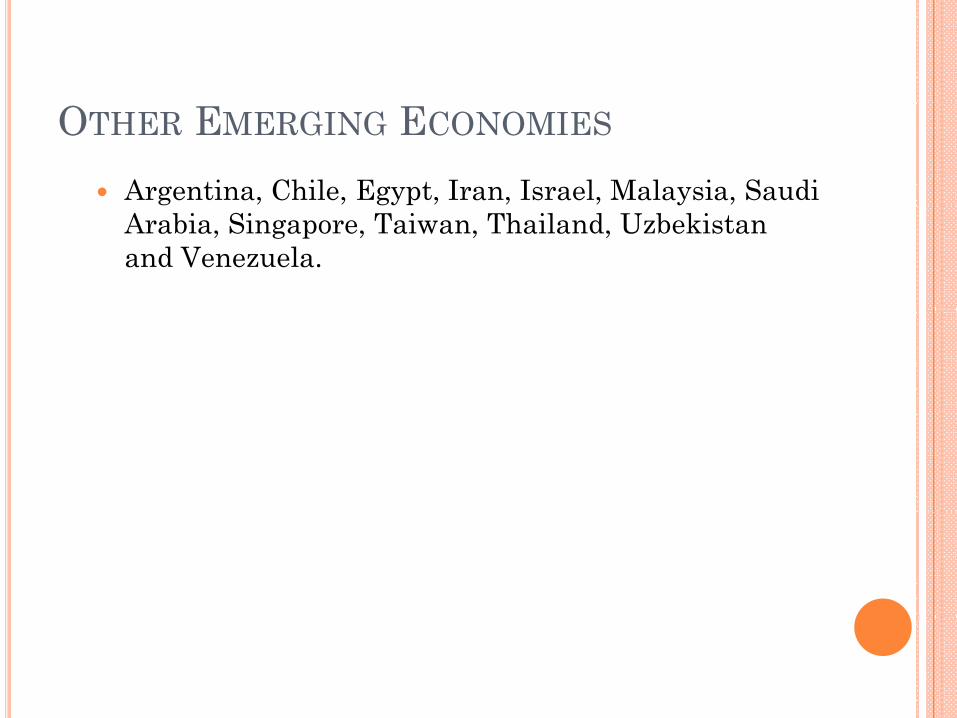
OTHER EMERGING ECONOMIES
Argentina, Chile, Egypt, Iran, Israel, Malaysia, Saudi g gyp yArabia, Singapore, Taiwan, Thailand, Uzbekistan and Venezuela.