Embed Size (px)
Citation preview

1
Page 1
Tips and Tricks of Faster LC Analysis Without Capital InvestmentIt may be easier than you think!
Agilent Technologies
Page 2
Tips and Tricks of HPLC System Troubleshooting
Agilent Technologies
2
Page 3
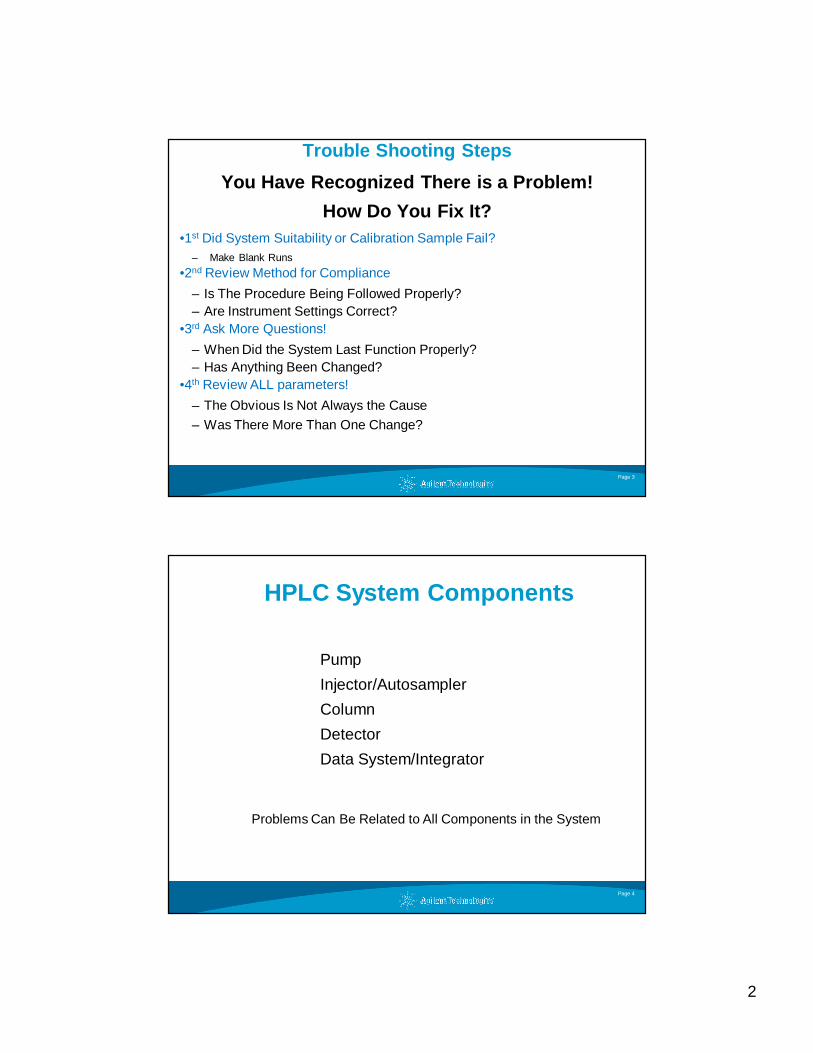
Trouble Shooting Steps
You Have Recognized There is a Problem!
How Do You Fix It?•1st Did System Suitability or Calibration Sample Fail?
– Make Blank Runs
•2nd Review Method for Compliance
– Is The Procedure Being Followed Properly?– Are Instrument Settings Correct?
•3rd Ask More Questions!
– When Did the System Last Function Properly?– Has Anything Been Changed?
•4th Review ALL parameters!
– The Obvious Is Not Always the Cause
– Was There More Than One Change?
Page 4
Pump
Injector/Autosampler
Column
Detector
Data System/Integrator
HPLC System Components
Problems Can Be Related to All Components in the System
3
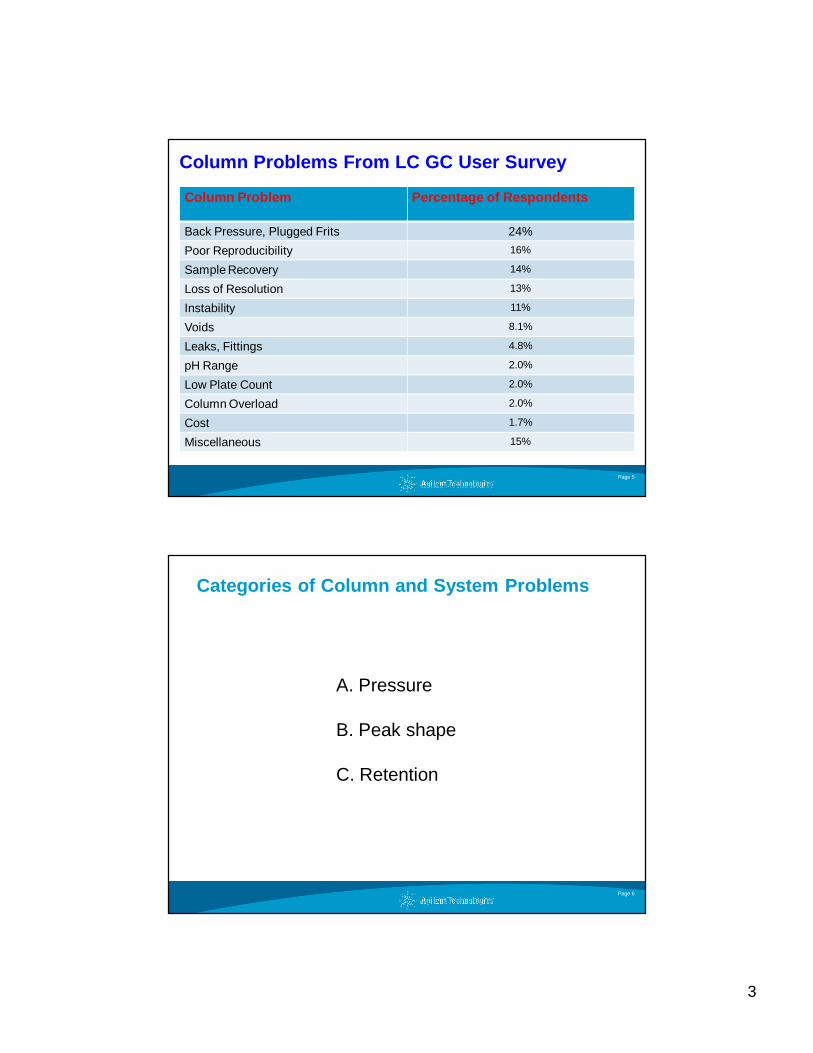
Column Problems From LC GC User Survey
Column Problem Percentage of Respondents
Back Pressure, Plugged Frits 24%
Poor Reproducibility 16%
Sample Recovery 14%
Loss of Resolution 13%
Instability 11%
Voids 8.1%
Leaks, Fittings 4.8%
pH Range 2.0%
Low Plate Count 2.0%
Column Overload 2.0%
Cost 1.7%
Miscellaneous 15%
Page 5
Page 6
Categories of Column and System Problems
A. Pressure
B. Peak shape
C. Retention
4
Page 7
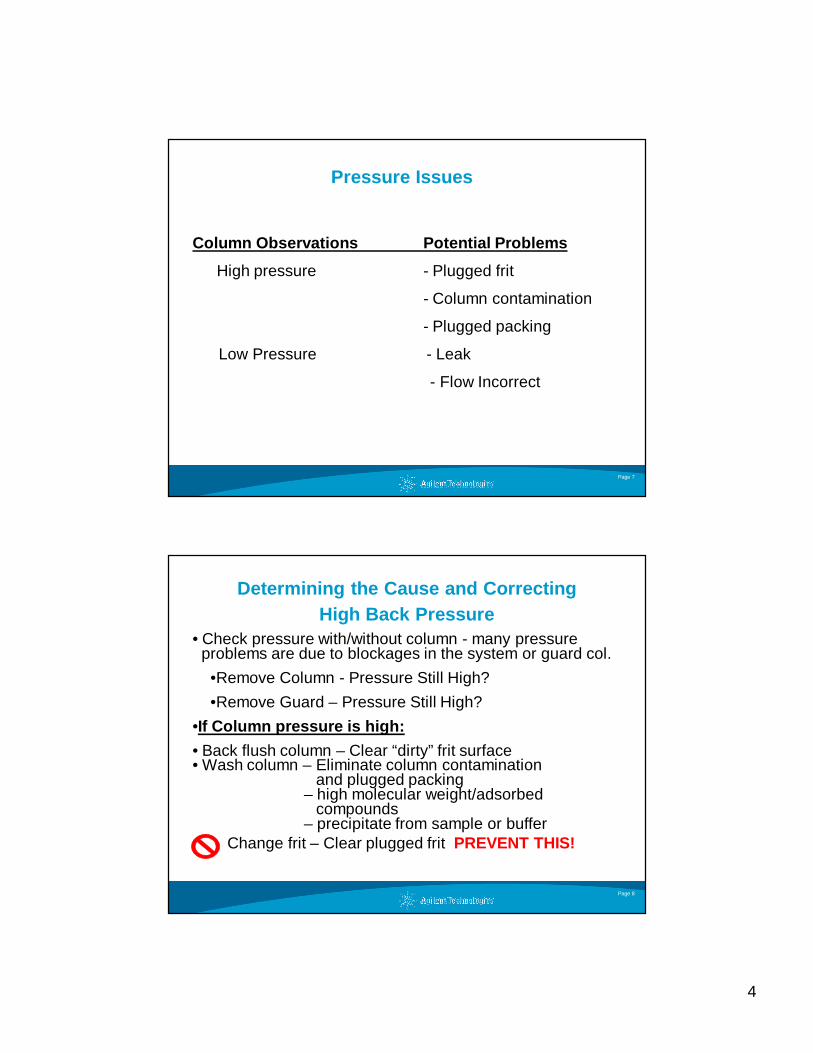
Column Observations Potential Problems
High pressure - Plugged frit
- Column contamination
- Plugged packing
Low Pressure - Leak
- Flow Incorrect
Pressure Issues
Page 8
Determining the Cause and Correcting High Back Pressure
• Check pressure with/without column - many pressure problems are due to blockages in the system or guard col.
•Remove Column - Pressure Still High?
•Remove Guard – Pressure Still High?
•If Column pressure is high:
• Back flush column – Clear “dirty” frit surface • Wash column – Eliminate column contamination
and plugged packing– high molecular weight/adsorbed
compounds– precipitate from sample or buffer
Change frit – Clear plugged frit PREVENT THIS!
5
Page 9
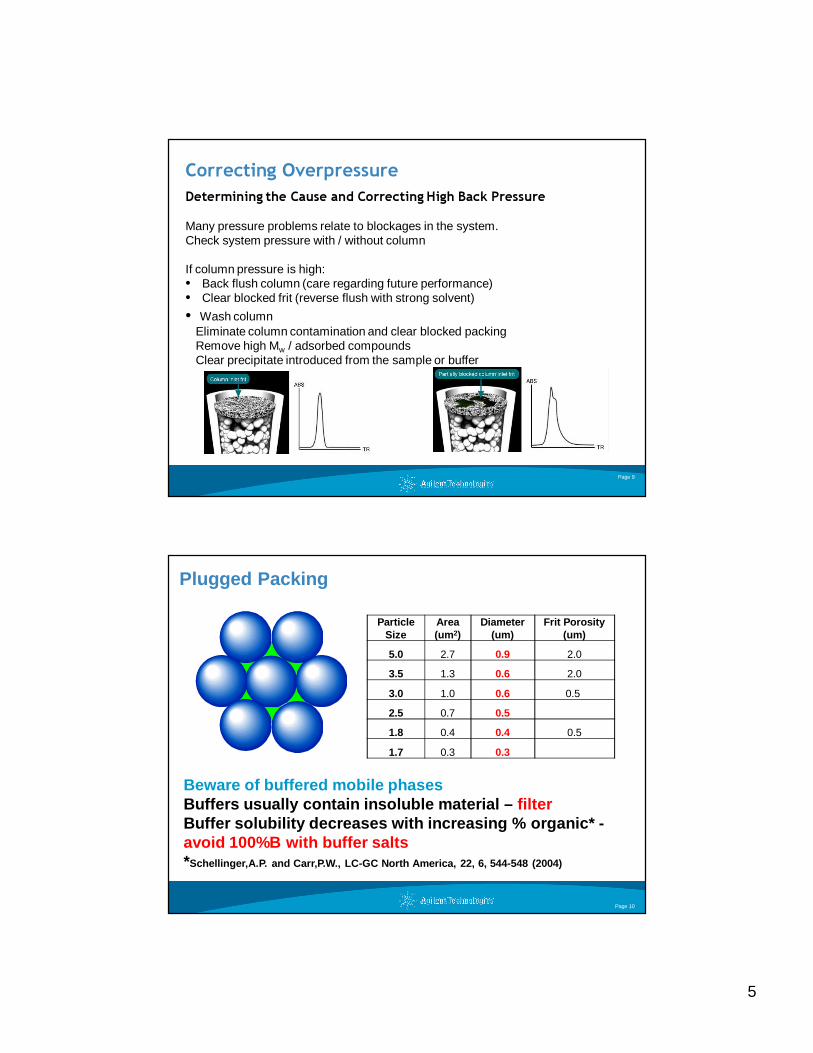
Determining the Cause and Correcting High Back PressureMany pressure problems relate to blockages in the system.Check system pressure with / without column
If column pressure is high:• Back flush column (care regarding future performance)• Clear blocked frit (reverse flush with strong solvent)
• Wash columnEliminate column contamination and clear blocked packingRemove high Mw / adsorbed compoundsClear precipitate introduced from the sample or buffer
Correcting Overpressure
Page 10
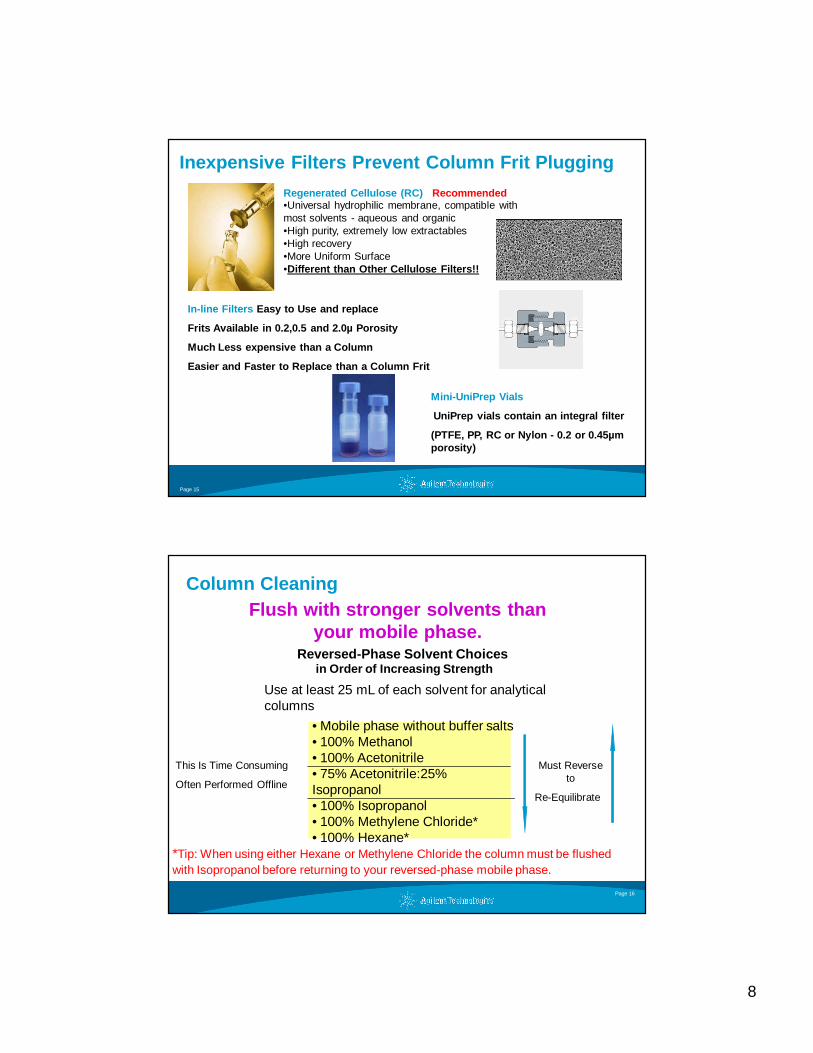
Plugged Packing
Particle Size
Area(um2)
Diameter (um)
Frit Porosity (um)
5.0 2.7 0.9 2.0
3.5 1.3 0.6 2.0
3.0 1.0 0.6 0.5
2.5 0.7 0.5
1.8 0.4 0.4 0.5
1.7 0.3 0.3
Beware of buffered mobile phasesBuffers usually contain insoluble material – filterBuffer solubility decreases with increasing % organ ic* -avoid 100%B with buffer salts*Schellinger,A.P. and Carr,P.W., LC-GC North America , 22, 6, 544-548 (2004)

6
Buffer solubility
Page 11
Table I presents an estimate of the soluble concentration of the least soluble buffer (potassium phosphate at pH 7.0) in three organic cosolvents
Solubility of five buffers in mixtures with (a) methanol, (b) acetonitrile, and (c) tetrahydrofuran
Page 12
Solubility of five buffers in mixtures with (a) methanol, (b) acetonitrile, and (c) tetrahydrofuran, where — represents ammonium acetate at pH 5.0, •••• repres ents ammonium phosphate at pH 3.0, --- represents potassium phosphate at pH 3.0,–••– represents ammonium phosphate at pH 7.0, and – – represents potassium phosphate at pH 7.0. The 95% confidence level intervals are 3.3 mM.
methanolacetonitrile THF

7
Page 13
Changing a Frit May Not Be a Good IdeaMay not be possible with new generation columns
May damage high performance columns
ColumnInlet Fri t
CompressionFerrule
Column Body
Female End Fitting
Male End Fitting
Wear gloves
Do not allow bed to dry
Do not touch the column -
body heat will extrude packing
Do not overtighten
Tip: Prevention is a Much Better Idea!
Page 14
The Trick: Prevention Techniques - A Better Choice!
• Use column protection- In-line filters - Guard columns
• Filter samples
• Filter buffered mobile phases
• Sample clean-up (i.e. SPE)
• Appropriate column flushing
Easy
Not As Easy
8
Page 15
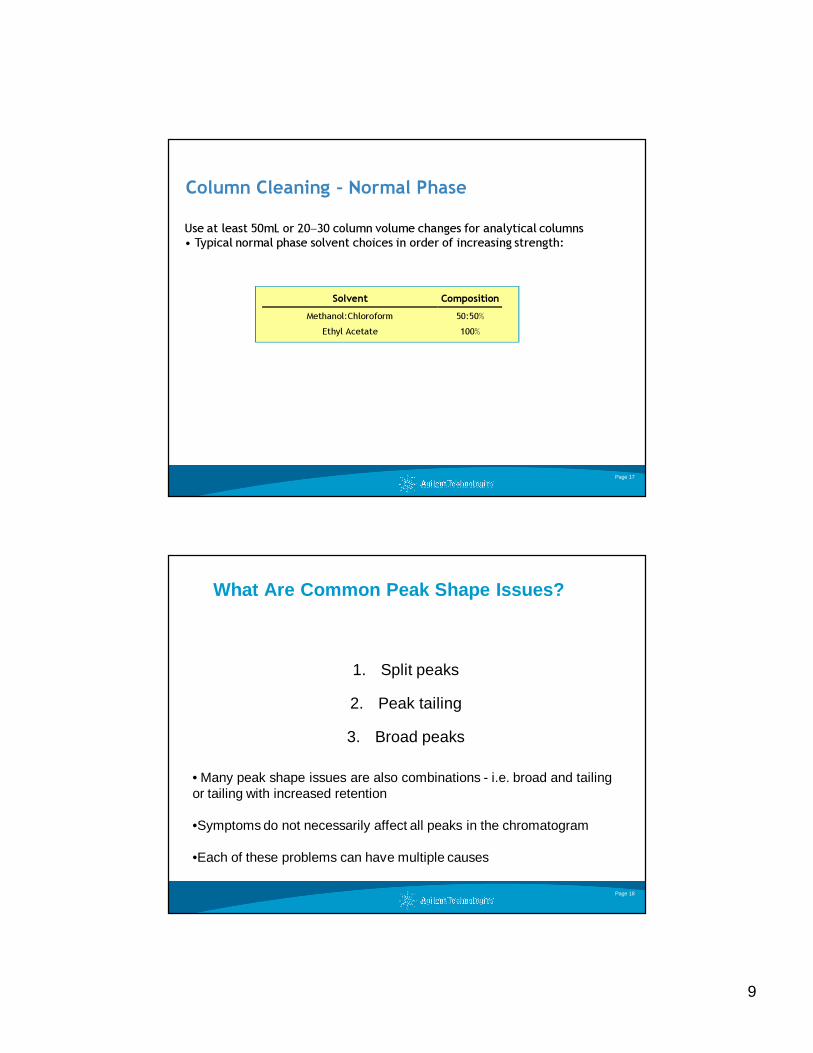
Inexpensive Filters Prevent Column Frit Plugging
Regenerated Cellulose (RC) Recommended•Universal hydrophilic membrane, compatible with most solvents - aqueous and organic•High purity, extremely low extractables•High recovery•More Uniform Surface•Different than Other Cellulose Filters!!
In-line Filters Easy to Use and replace
Frits Available in 0.2,0.5 and 2.0µ Porosity
Much Less expensive than a Column
Easier and Faster to Replace than a Column Frit
Mini-UniPrep Vials
UniPrep vials contain an integral filter
(PTFE, PP, RC or Nylon - 0.2 or 0.45µm porosity)
Page 16
Column Cleaning
Use at least 25 mL of each solvent for analytical columns
Flush with stronger solvents than your mobile phase.
Reversed-Phase Solvent Choices in Order of Increasing Strength
• Mobile phase without buffer salts• 100% Methanol• 100% Acetonitrile• 75% Acetonitrile:25% Isopropanol• 100% Isopropanol• 100% Methylene Chloride* • 100% Hexane*
*Tip: When using either Hexane or Methylene Chloride the column must be flushed with Isopropanol before returning to your reversed-phase mobile phase.
Must Reverse to
Re-Equilibrate
This Is Time Consuming
Often Performed Offline
9
Page 17
Use at least 50mL or 20−30 column volume changes for analytical columns• Typical normal phase solvent choices in order of increasing strength:
Solvent Composition
Methanol:Chloroform 50:50% Ethyl Acetate 100%
Column Cleaning – Normal Phase
Page 18
What Are Common Peak Shape Issues?
1. Split peaks
2. Peak tailing
3. Broad peaks
• Many peak shape issues are also combinations - i.e. broad and tailing or tailing with increased retention
•Symptoms do not necessarily affect all peaks in the chromatogram
•Each of these problems can have multiple causes
10
Page 19
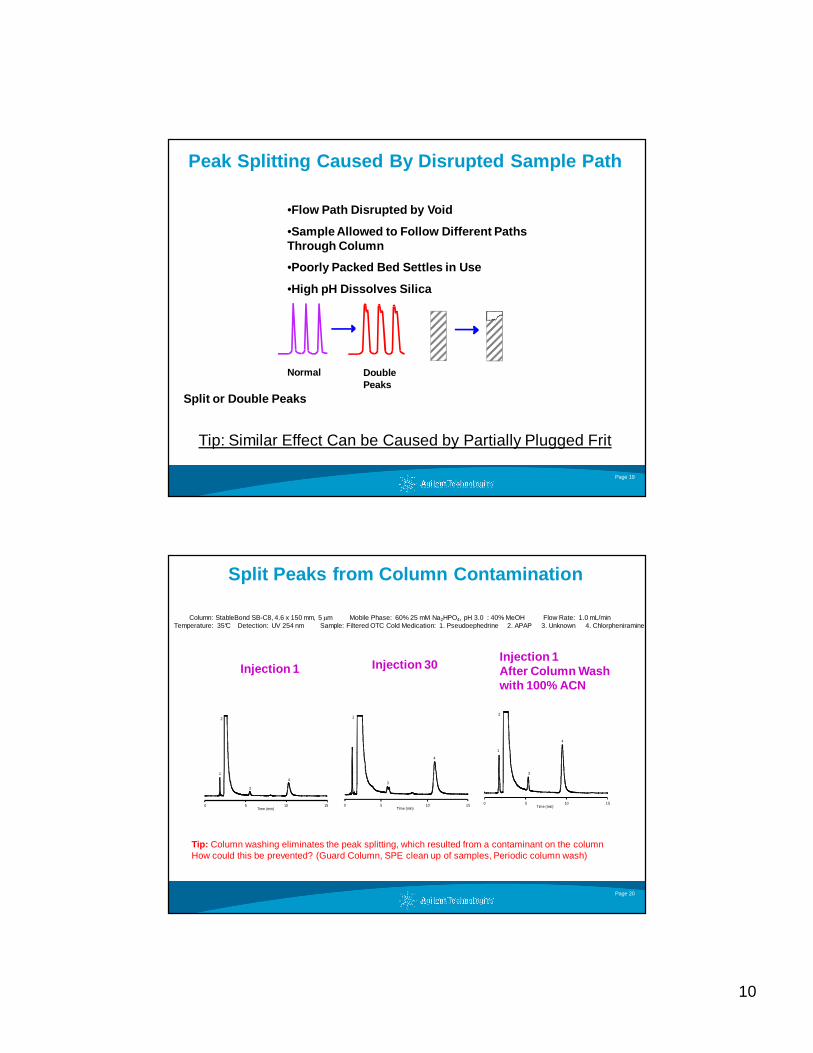
Peak Splitting Caused By Disrupted Sample Path
Split or Double Peaks
Normal Double Peaks
Tip: Similar Effect Can be Caused by Partially Plugged Frit
•Flow Path Disrupted by Void
•Sample Allowed to Follow Different Paths Through Column
•Poorly Packed Bed Settles in Use
•High pH Dissolves Silica
Page 20
0 5 10 15
1
3
4
2
Time (min)0 5 10 15
1
3
4
2
Time (min)0 5 10 15
1
3
4
2
Time (min)
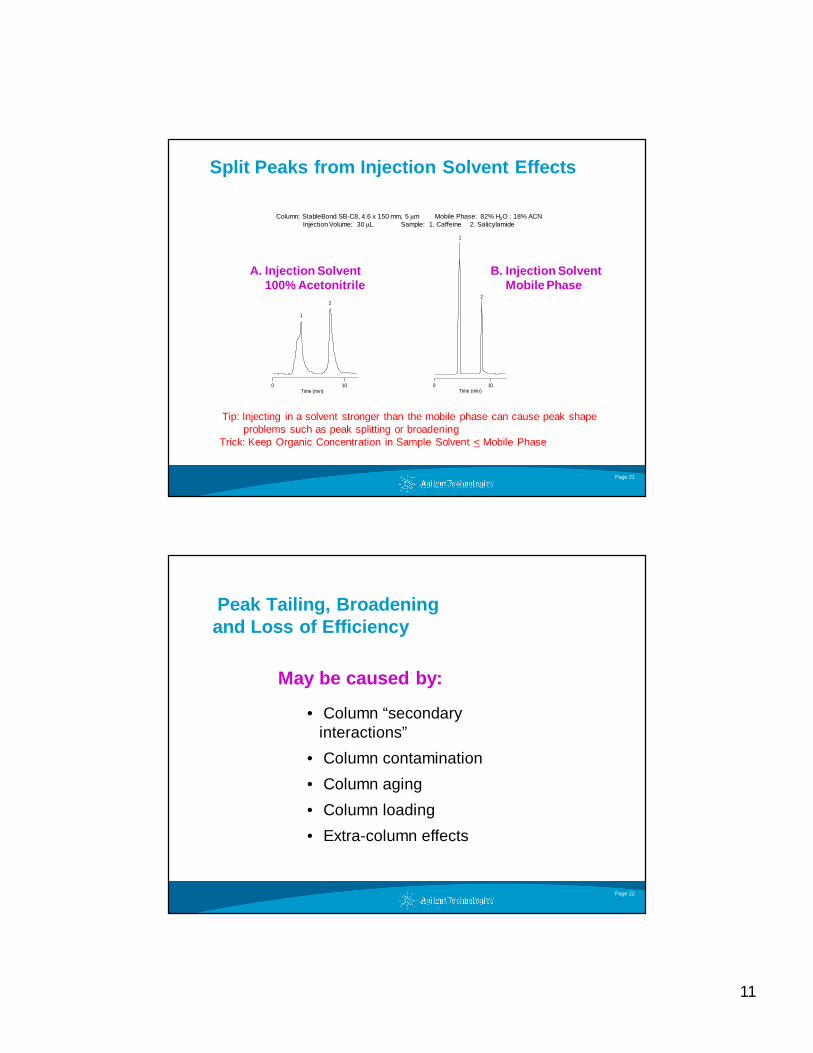
Split Peaks from Column Contamination
Column: StableBond SB-C8, 4.6 x 150 mm, 5 µm Mobile Phase: 60% 25 mM Na2HPO4, pH 3.0 : 40% MeOH Flow Rate: 1.0 mL/min Temperature: 35°C Detection: UV 254 nm Sample: Filtered OTC Cold Medication: 1. Pseudoephedrine 2. APAP 3. Unknown 4. Chlorpheniramine
Injection 1 Injection 30Injection 1After Column Washwith 100% ACN
Tip: Column washing eliminates the peak splitting, which resulted from a contaminant on the columnHow could this be prevented? (Guard Column, SPE clean up of samples, Periodic column wash)
11
Page 21
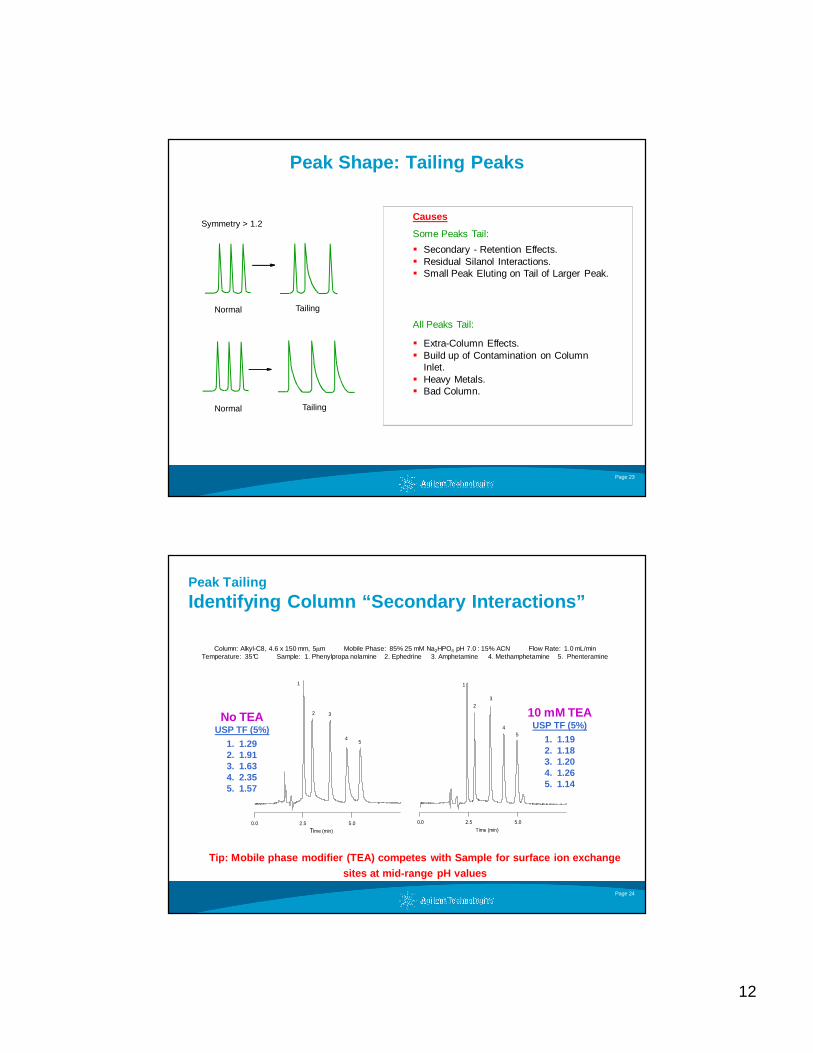
Split Peaks from Injection Solvent Effects
Column: StableBond SB-C8, 4.6 x 150 mm, 5 µm Mobile Phase: 82% H2O : 18% ACNInjection Volume: 30 µL Sample: 1. Caffeine 2. Salicylamide
A. Injection Solvent100% Acetonitrile
B. Injection SolventMobile Phase
Tip: Injecting in a solvent stronger than the mobile phase can cause peak shape problems such as peak splitting or broadening
Trick: Keep Organic Concentration in Sample Solvent < Mobile Phase
0 10Time (min)
1
2
0 10Time (min)
1
2
Page 22
Peak Tailing, Broadeningand Loss of Efficiency
May be caused by:
• Column “secondary interactions”
• Column contamination
• Column aging
• Column loading
• Extra-column effects
12
Page 23
Normal Tailing
Normal Tailing
Symmetry > 1.2
All Peaks Tail:
� Extra-Column Effects.� Build up of Contamination on Column
Inlet.� Heavy Metals.� Bad Column.
Causes
Some Peaks Tail:
� Secondary - Retention Effects.� Residual Silanol Interactions.� Small Peak Eluting on Tail of Larger Peak.
Peak Shape: Tailing Peaks
Page 24
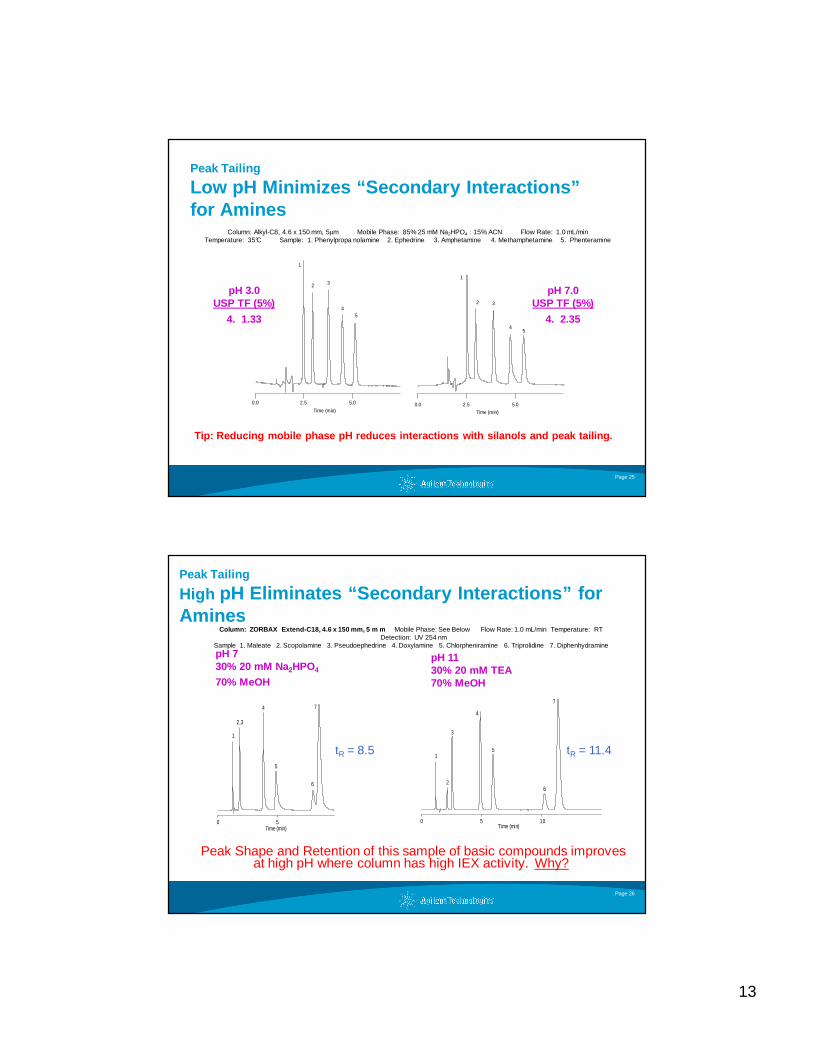
Peak Tailing
Identifying Column “Secondary Interactions”
Tip: Mobile phase modifier (TEA) competes with Sampl e for surface ion exchange sites at mid-range pH values
Column: Alkyl-C8, 4.6 x 150 mm, 5µm Mobile Phase: 85% 25 mM Na2HPO4 pH 7.0 : 15% ACN Flow Rate: 1.0 mL/minTemperature: 35°C Sample: 1. Phenylpropa nolamine 2. Ephedrine 3. Amphetamine 4. Methamphetamine 5. Phenteramine
No TEAUSP TF (5%)
1. 1.292. 1.913. 1.634. 2.355. 1.57
10 mM TEAUSP TF (5%)
1. 1.192. 1.183. 1.204. 1.265. 1.14
TIme (min) Time (min)0.0 2.5 5.0
54
32
1
54
32
1
0.0 2.5 5.0
13
Page 25
Peak Tailing
Low pH Minimizes “Secondary Interactions” for Amines
Column: Alkyl-C8, 4.6 x 150 mm, 5µm Mobile Phase: 85% 25 mM Na2HPO4 : 15% ACN Flow Rate: 1.0 mL/minTemperature: 35°C Sample: 1. Phenylpropa nolamine 2. Ephedrine 3. Amphetamine 4. Methamphetamine 5. Phenteramine
pH 3.0USP TF (5%)
4. 1.33
pH 7.0USP TF (5%)
4. 2.35
Tip: Reducing mobile phase pH reduces interactions with silanols and peak tailing.
Time (min)
0.0 2.5 5.0
54
32
1
54
32
1
Time (min)
0.0 2.5 5.0
Page 26
0 5
1
2,3
4
5
Time (min)
7
6
0 5 10
1
2
3
4
Time (min)
6
5
7
Peak Tailing
High pH Eliminates “Secondary Interactions” for Amines
Peak Shape and Retention of this sample of basic compounds improves at high pH where column has high IEX activity. Why?
Column: ZORBAX Extend-C18, 4.6 x 150 mm, 5 m m Mobile Phase: See Below Flow Rate: 1.0 mL/min Temperature: RT Detection: UV 254 nm
Sample: 1. Maleate 2. Scopolamine 3. Pseudoephedrine 4. Doxylamine 5. Chlorpheniramine 6. Triprolidine 7. DiphenhydraminepH 730% 20 mM Na2HPO4
70% MeOH
pH 1130% 20 mM TEA70% MeOH
tR = 8.5 tR = 11.4
14
Page 27
0.0 2.5 5.0
2
41
3
Time (min)
2
41
3
0.0 2.5 5.0Time (min)
2
41
3
0.0 2.5 5.0Time (min)
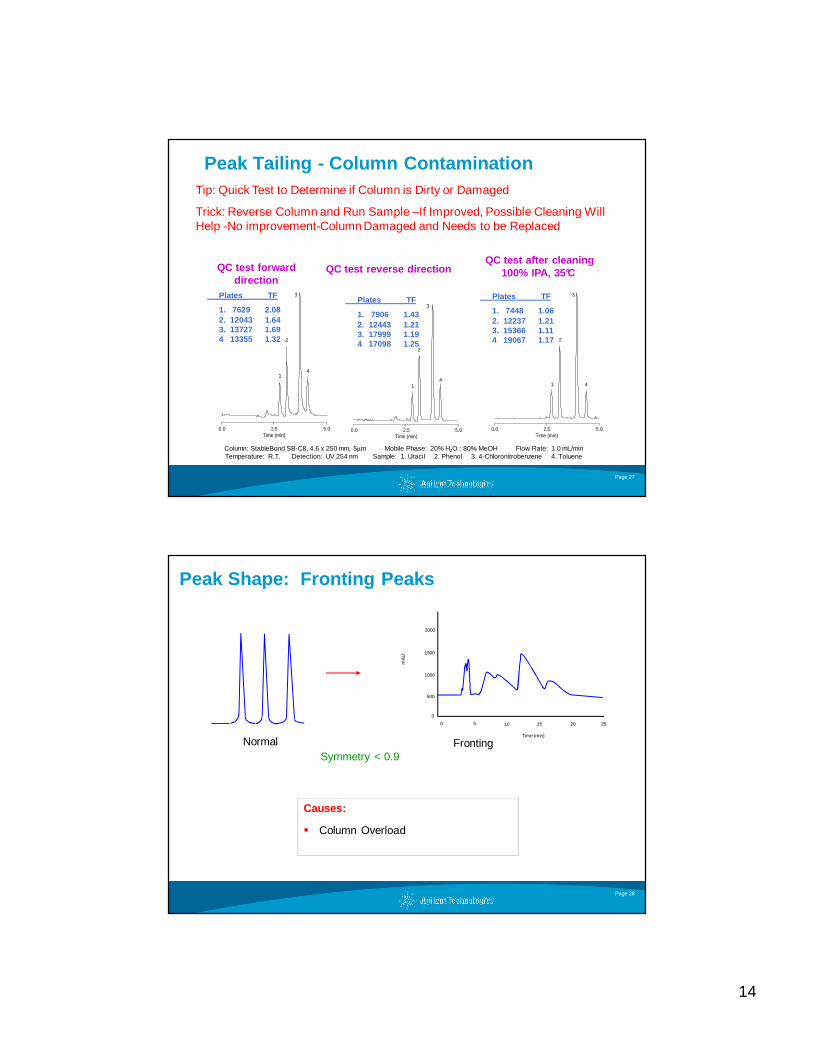
Peak Tailing - Column Contamination
Column: StableBond SB-C8, 4.6 x 250 mm, 5µm Mobile Phase: 20% H2O : 80% MeOH Flow Rate: 1.0 mL/minTemperature: R.T. Detection: UV 254 nm Sample: 1. Uracil 2. Phenol 3. 4-Chloronitrobenzene 4. Toluene
Plates TF
1. 7629 2.082. 12043 1.643. 13727 1.694 13355 1.32
Plates TF
1. 7906 1.432. 12443 1.213. 17999 1.194 17098 1.25
Plates TF
1. 7448 1.062. 12237 1.213. 15366 1.114 19067 1.17
QC test forward direction
QC test reverse directionQC test after cleaning
100% IPA, 35°C
Tip: Quick Test to Determine if Column is Dirty or Damaged
Trick: Reverse Column and Run Sample –If Improved, Possible Cleaning Will Help -No improvement-Column Damaged and Needs to be Replaced
Page 28
Causes:
� Column Overload
Normal FrontingSymmetry < 0.9
2000
1500
1000
500
0
0 5 10 15 20 25
Time (min)
mA
U
Peak Shape: Fronting Peaks
15
Page 29
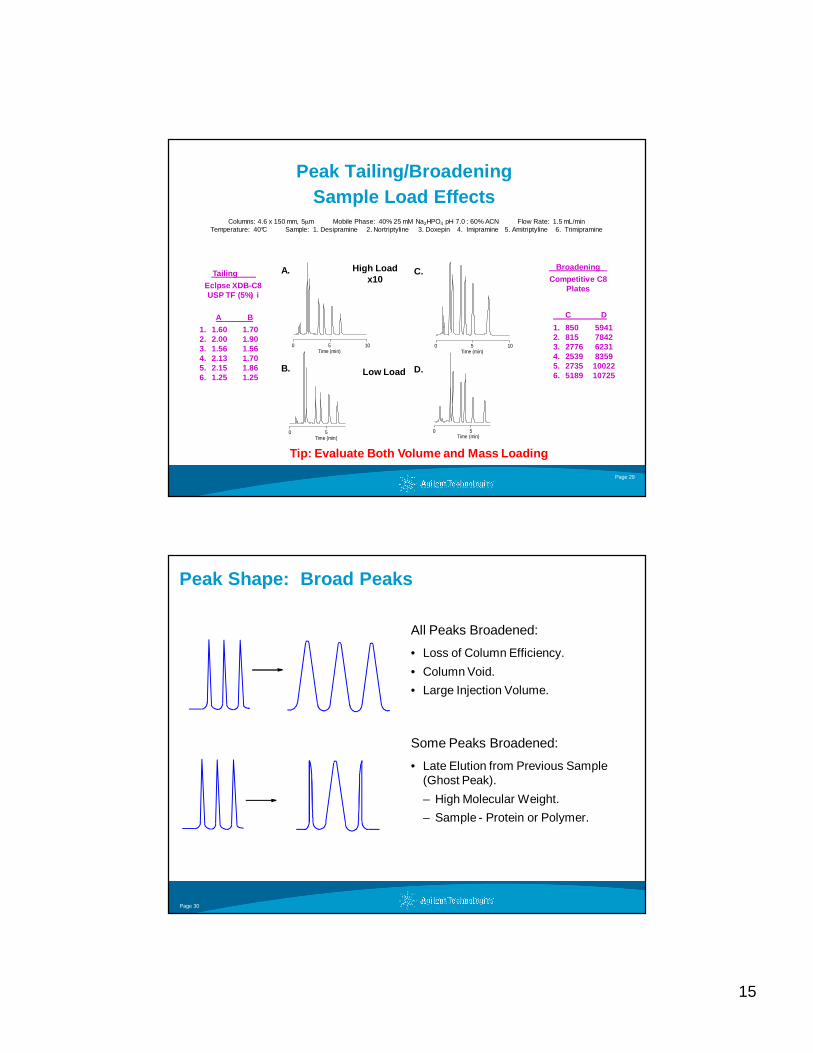
Peak Tailing/Broadening Sample Load Effects
Columns: 4.6 x 150 mm, 5µm Mobile Phase: 40% 25 mM Na2HPO4 pH 7.0 : 60% ACN Flow Rate: 1.5 mL/minTemperature: 40°C Sample: 1. Desipramine 2. Nortriptyline 3. Doxepin 4. Imipramine 5. Amitriptyline 6. Trimipramine
Broadening
Competitive C8Plates
A.
B.
C.
D.
High Loadx10
Low Load
C D
1. 850 59412. 815 78423. 2776 62314. 2539 83595. 2735 100226. 5189 10725
Tailing
Eclpse XDB-C8USP TF (5%) i
A B
1. 1.60 1.702. 2.00 1.903. 1.56 1.564. 2.13 1.705. 2.15 1.866. 1.25 1.25
0 5 10Time (min)
0 5 10Time (min)
0 5Time (min)
0 5Time (min)
Tip: Evaluate Both Volume and Mass Loading
Page 30
Peak Shape: Broad Peaks
All Peaks Broadened:
• Loss of Column Efficiency.
• Column Void.
• Large Injection Volume.
Some Peaks Broadened:
• Late Elution from Previous Sample (Ghost Peak).
– High Molecular Weight.
– Sample - Protein or Polymer.
16
Page 31
Time (min)
3
1
2
0 5 10 15
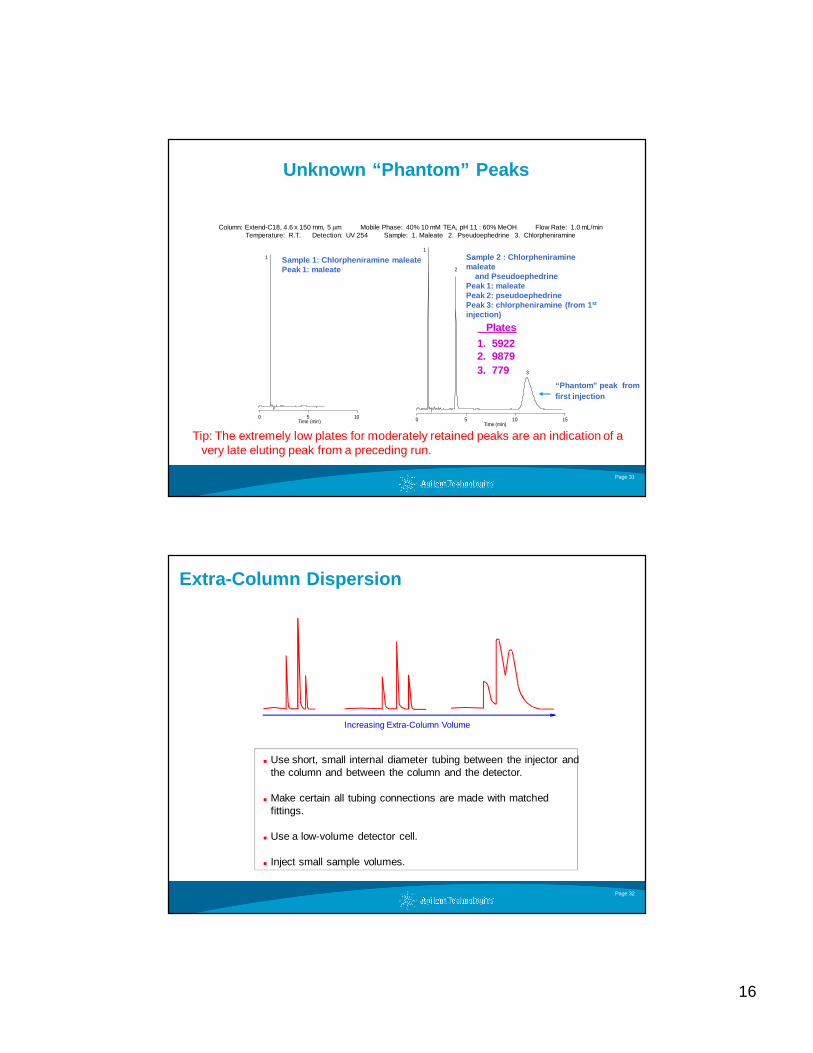
Unknown “Phantom” Peaks
Column: Extend-C18, 4.6 x 150 mm, 5 µm Mobile Phase: 40% 10 mM TEA, pH 11 : 60% MeOH Flow Rate: 1.0 mL/minTemperature: R.T. Detection: UV 254 Sample: 1. Maleate 2. Pseudoephedrine 3. Chlorpheniramine
Plates
1. 59222. 98793. 779
Tip: The extremely low plates for moderately retained peaks are an indication of a very late eluting peak from a preceding run.
Time (min)
1
0 5 10
Sample 1: Chlorpheniramine maleatePeak 1: maleate
Sample 2 : Chlorpheniramine maleate
and PseudoephedrinePeak 1: maleatePeak 2: pseudoephedrinePeak 3: chlorpheniramine (from 1 st
injection)
“Phantom” peak fromfirst injection
Page 32
� Use short, small internal diameter tubing between the injector and the column and between the column and the detector.
� Make certain all tubing connections are made with matched fittings.
� Use a low-volume detector cell.
� Inject small sample volumes.
Increasing Extra-Column Volume
Extra-Column Dispersion

17
Page 33
Peak Broadening Extra-Column Volume
Column: StableBond SB-C18, 4.6 x 30 mm, 3.5 µm Mobile Phase: 85% H2O with 0.1% TFA : 15% ACN Flow Rate: 1.0 mL/min Temperature: 35°C Sample: 1. Phenylalan ine 2. 5-benzyl-3,6-dioxo-2-piperazine acetic acid 3. Asp-phe 4. Aspartame
10 mL extra-columnvolume
50 mL extra-columnvolume (tubing)
Time (min)0.0 0.5 1.0 1.5 2.0
4
32
1
Time (min)0.0 0.5 1.0 1.5 2.0
4
32
1
Page 34
Tip: Poorly Made HPLC System Connections Can Cause Peak Broadening
The System Has Been Optimized and :
– All Tubing Lengths Are Minimum
– Smallest Diameter Tubing Used
– Proper Flow Cell Volume
Symptom Still Seems to Have Too Much Extra-Column
Volume
What Is Wrong?
Have You Made the Connections Properly?
18
Page 35
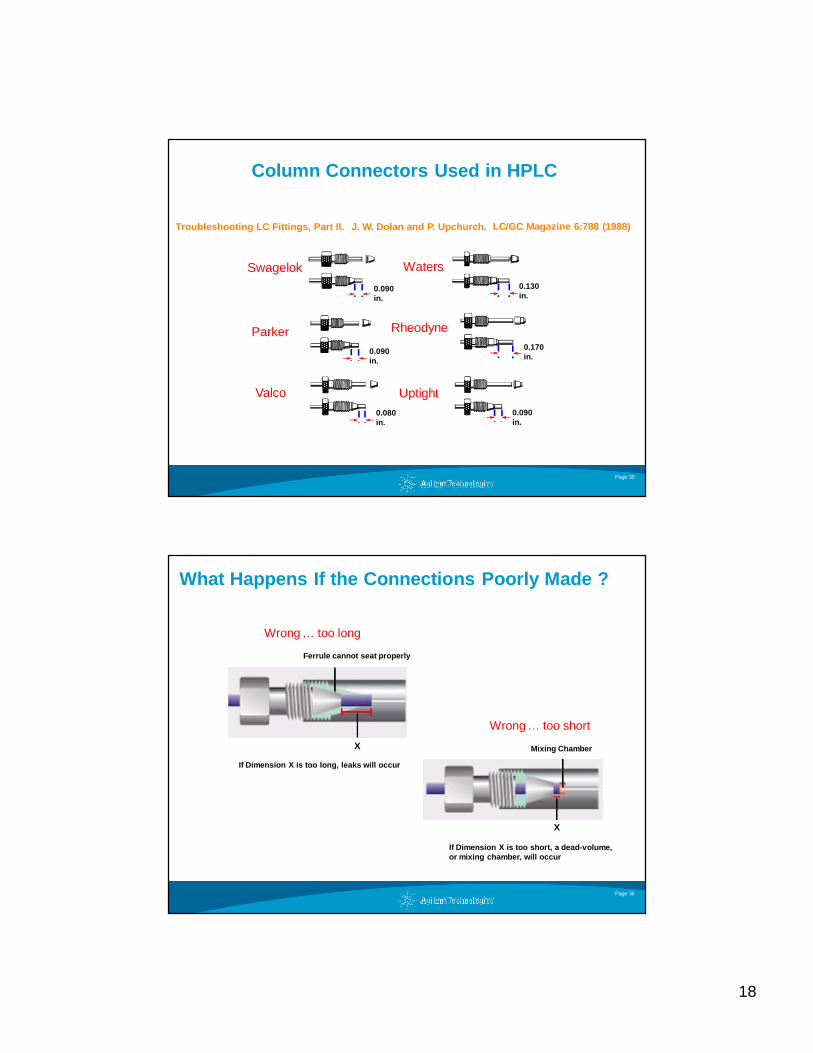
Column Connectors Used in HPLC
0.090 in.
0.130 in.
0.090 in.
0.170 in.
Swagelok Waters
Parker Rheodyne
Valco Uptight0.090 in.
0.080 in.
Troubleshooting LC Fittings, Part II. J. W. Dolan and P. Upchurch. LC/GC Magazine 6:788 (1988)
Page 36
What Happens If the Connections Poorly Made ?
If Dimension X is too long, leaks will occur
Ferrule cannot seat properly
Mixing Chamber
If Dimension X is too short, a dead-volume, or mixing chamber, will occur
Wrong … too long
Wrong … too short
X
X
19
Page 37
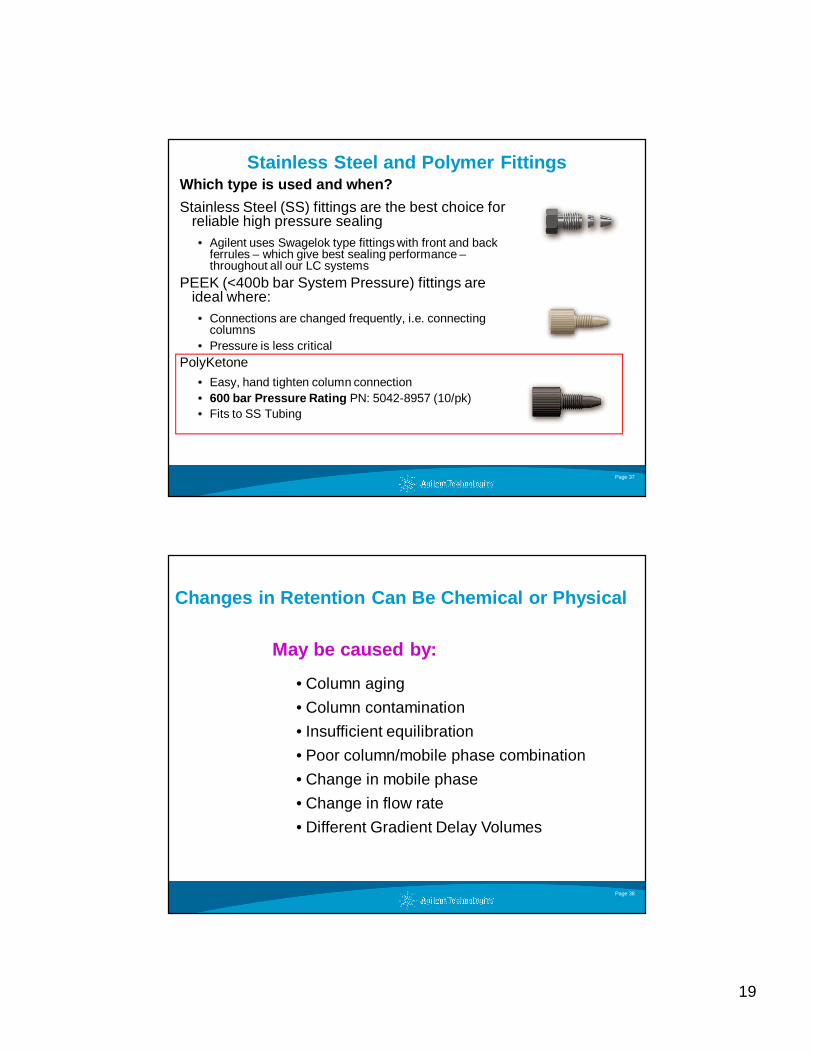
Stainless Steel and Polymer FittingsWhich type is used and when?
Stainless Steel (SS) fittings are the best choice for reliable high pressure sealing• Agilent uses Swagelok type fittings with front and back
ferrules – which give best sealing performance –throughout all our LC systems
PEEK (<400b bar System Pressure) fittings are ideal where:• Connections are changed frequently, i.e. connecting
columns• Pressure is less critical
PolyKetone
• Easy, hand tighten column connection • 600 bar Pressure Rating PN: 5042-8957 (10/pk)• Fits to SS Tubing
Page 38
Changes in Retention Can Be Chemical or Physical
May be caused by:
• Column aging
• Column contamination
• Insufficient equilibration
• Poor column/mobile phase combination
• Change in mobile phase
• Change in flow rate
• Different Gradient Delay Volumes
20
Page 39
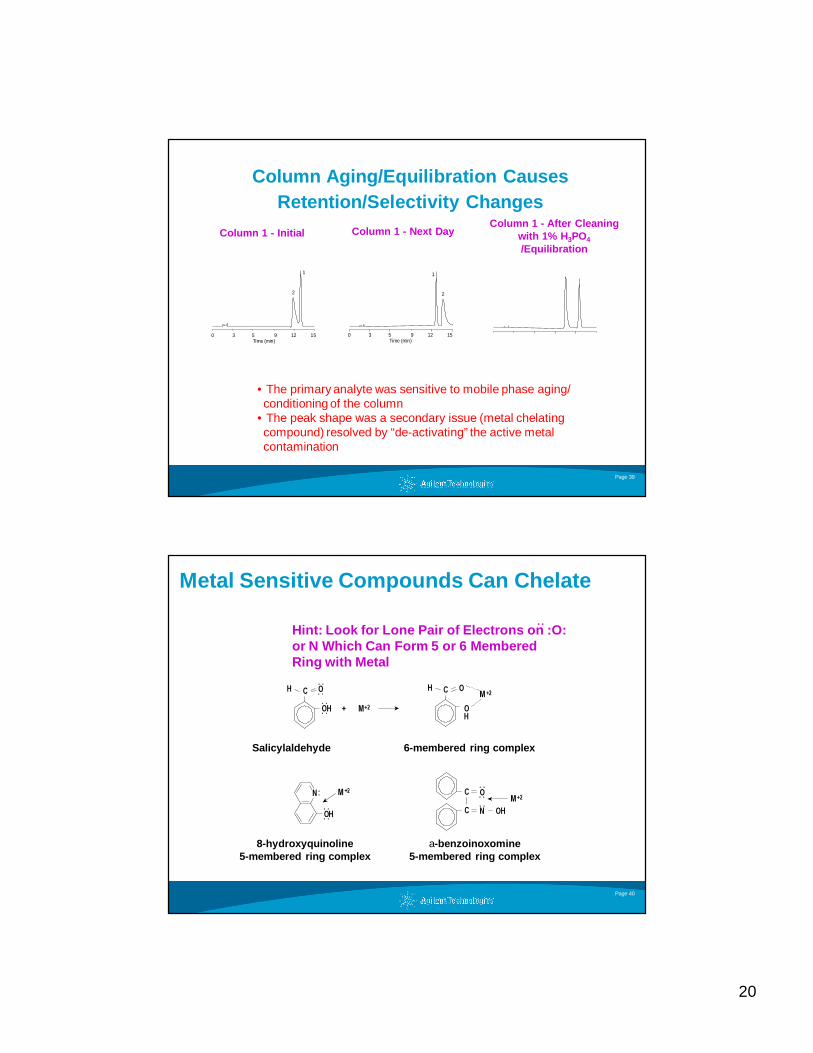
Column Aging/Equilibration CausesRetention/Selectivity Changes
Column 1 - After Cleaning with 1% H 3PO4
/Equilibration
• The primary analyte was sensitive to mobile phase aging/ conditioning of the column
• The peak shape was a secondary issue (metal chelating compound) resolved by “de-activating” the active metal contamination
Column 1 - Next DayColumn 1 - Initial
0 3 5 9 12 15Time (min)
2
1
0 3 5 9 12 15Time (min)
2
1
Page 40
Metal Sensitive Compounds Can Chelate
C O
OH
H M +2
OH
::
M +2C O
OHC N
N: M +2 ::
:
O
:
OH + M+2
CH ::
:
Hint: Look for Lone Pair of Electrons on :O: or N Which Can Form 5 or 6 Membered Ring with Metal
:
Salicylaldehyde 6-membered ring complex
8-hydroxyquinoline5-membered ring complex
a-benzoinoxomine5-membered ring complex
21
Page 41
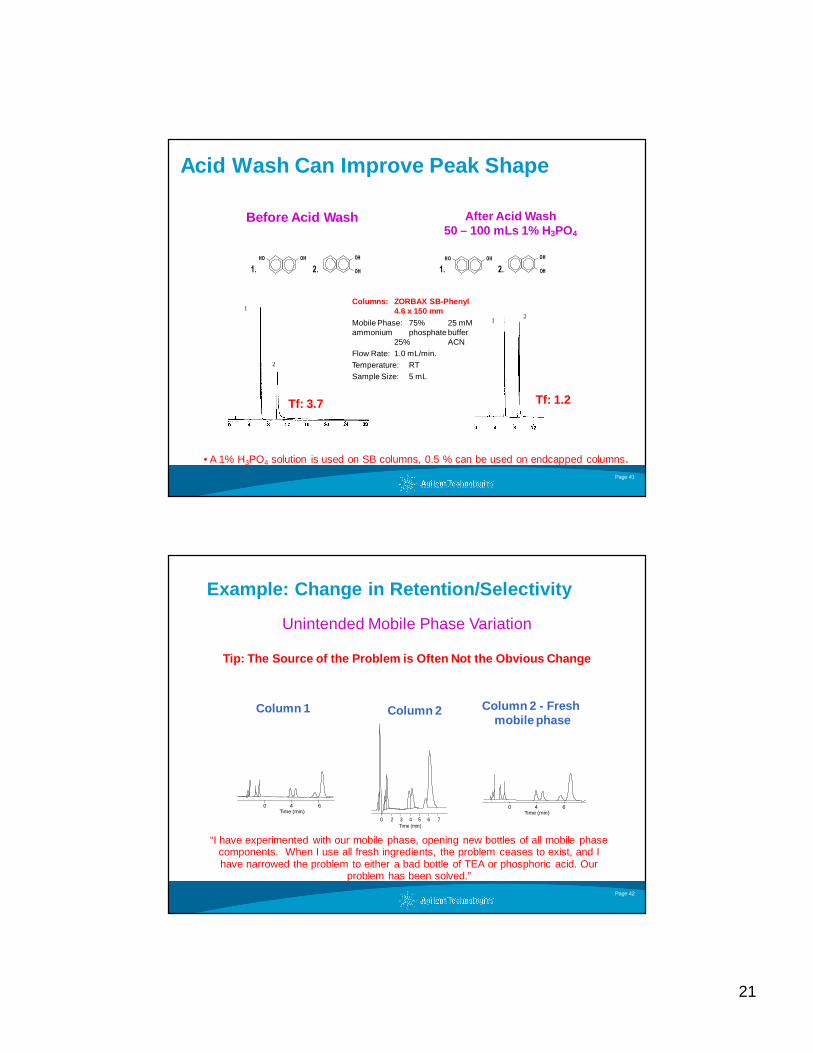
Acid Wash Can Improve Peak Shape
OH
OH
OHHOOHHO OH
OH1. 2. 1. 2.
Columns: ZORBAX SB-Phenyl4.6 x 150 mm
Mobile Phase: 75% 25 mM ammonium phosphate buffer
25% ACNFlow Rate: 1.0 mL/min.Temperature: RTSample Size: 5 mL
1
1
2
2
Tf: 1.2Tf: 3.7
Before Acid Wash After Acid Wash50 – 100 mLs 1% H 3PO4
• A 1% H3PO4 solution is used on SB columns, 0.5 % can be used on endcapped columns.
Page 42
Example: Change in Retention/Selectivity
Unintended Mobile Phase Variation
Tip: The Source of the Problem is Often Not the Obv ious Change
“I have experimented with our mobile phase, opening new bottles of all mobile phase components. When I use all fresh ingredients, the problem ceases to exist, and I have narrowed the problem to either a bad bottle of TEA or phosphoric acid. Our
problem has been solved.”
Column 1 Column 2 - Fresh mobile phase
Column 2
0 4 6Time (min)
0 2 3 4 5 6 7Time (min)
0 4 6Time (min)
22
Page 43
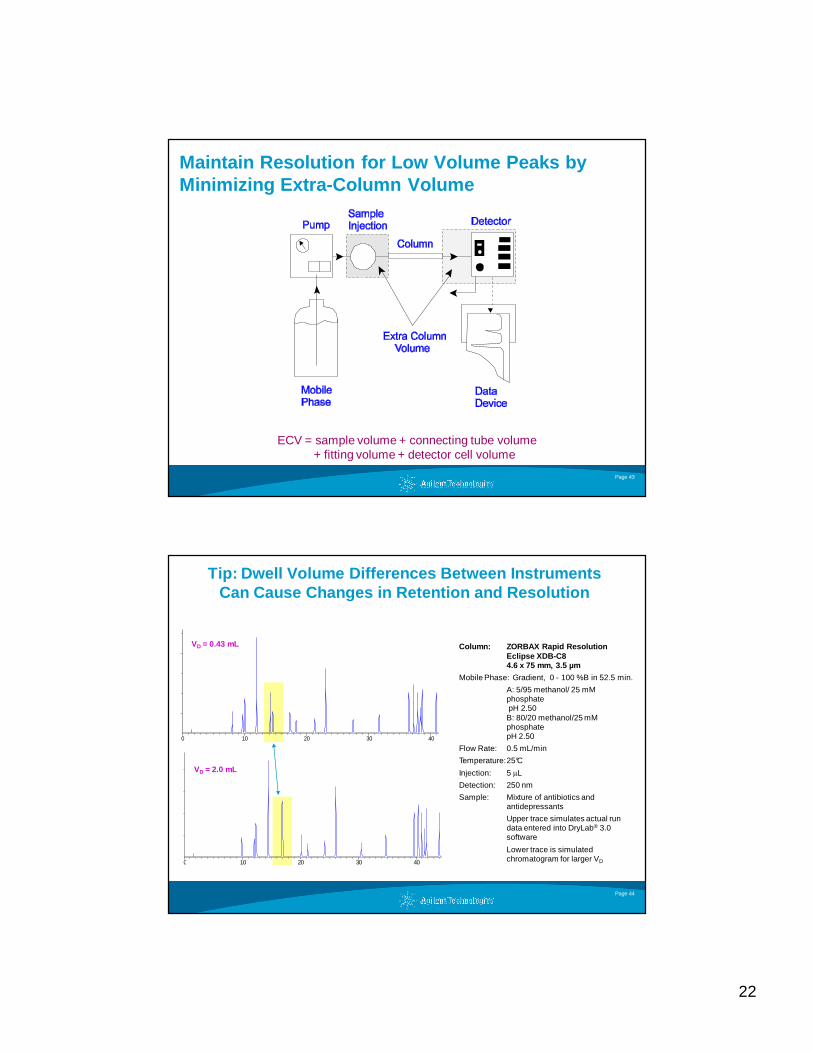
Maintain Resolution for Low Volume Peaks by Minimizing Extra-Column Volume
ECV = sample volume + connecting tube volume + fitting volume + detector cell volume
Page 44
0 10 20 30 40
Tip: Dwell Volume Differences Between Instruments Can Cause Changes in Retention and Resolution
0 10 20 30 40
VD = 0.43 mL Column: ZORBAX Rapid Resolution Eclipse XDB-C84.6 x 75 mm, 3.5 µm
Mobile Phase: Gradient, 0 - 100 %B in 52.5 min.
A: 5/95 methanol/ 25 mM phosphatepH 2.50 B: 80/20 methanol/25 mM phosphatepH 2.50
Flow Rate: 0.5 mL/min
Temperature:25°C
Injection: 5 µLDetection: 250 nm
Sample: Mixture of antibiotics and antidepressants
Upper trace simulates actual run data entered into DryLab® 3.0 software
Lower trace is simulated chromatogram for larger VD
VD = 2.0 mL
23
Page 45
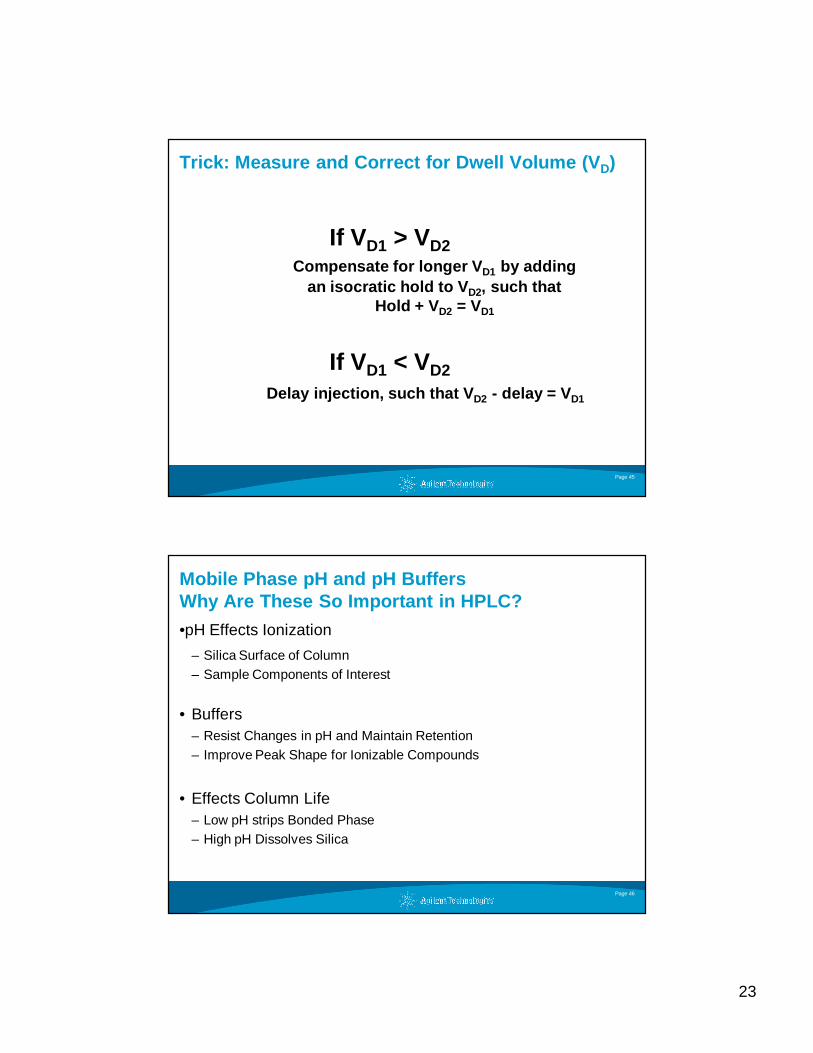
If VD1 > VD2Compensate for longer V D1 by adding
an isocratic hold to V D2, such thatHold + V D2 = VD1
If VD1 < VD2Delay injection, such that V D2 - delay = V D1
Trick: Measure and Correct for Dwell Volume (V D)
Page 46
Mobile Phase pH and pH BuffersWhy Are These So Important in HPLC?
•pH Effects Ionization
– Silica Surface of Column– Sample Components of Interest
• Buffers– Resist Changes in pH and Maintain Retention– Improve Peak Shape for Ionizable Compounds
• Effects Column Life– Low pH strips Bonded Phase– High pH Dissolves Silica
24
Page 47
Minimize Change in Retention/SelectivityLot-to-Lot
• All causes of column-to-column change*
• Method ruggedness (buffers/ionic strength)
• pH sensitivity (sample/column interactions)
*All causes of column-to-column change should be considered first,especially when only one column from a lot has been tested.
Evaluate :
Page 48
0 2 4 6 8 10 12 14 16 18Time (min)
2-Base
3
4-Base
1
0 2 4 6 8 10 12 14 16 18Time (min)
2
3
4
1
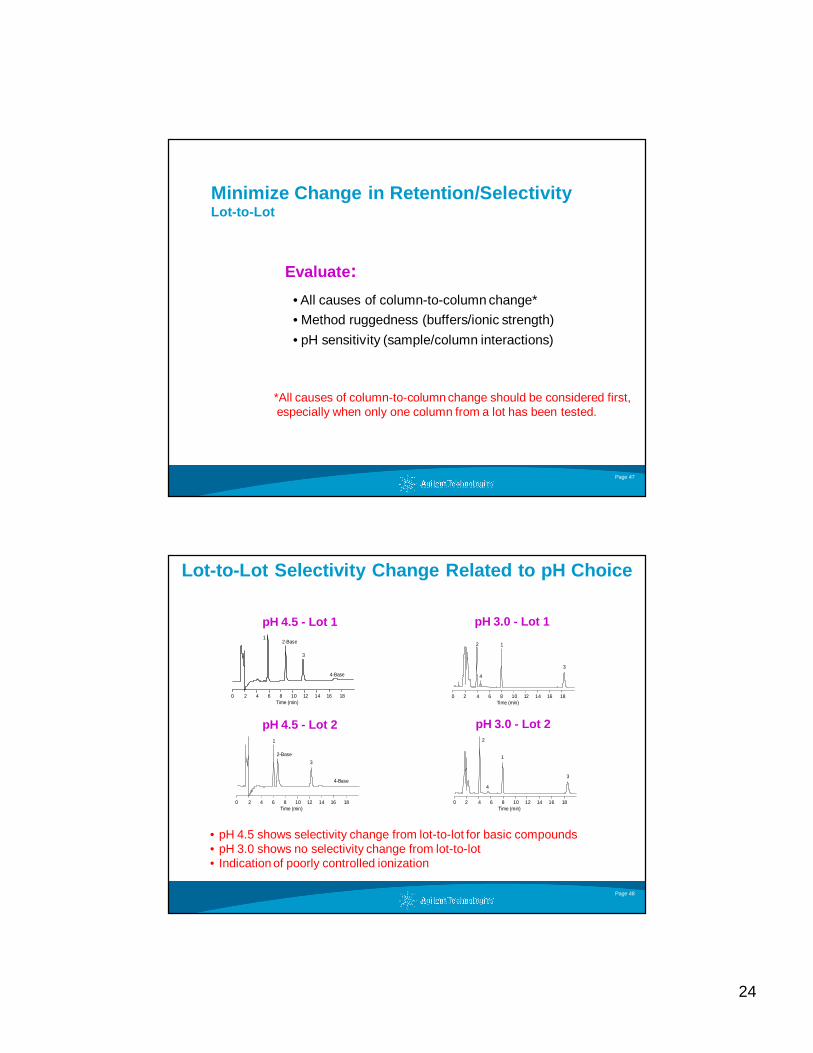
Lot-to-Lot Selectivity Change Related to pH Choice
• pH 4.5 shows selectivity change from lot-to-lot for basic compounds• pH 3.0 shows no selectivity change from lot-to-lot• Indication of poorly controlled ionization
pH 4.5 - Lot 1 pH 3.0 - Lot 1
pH 4.5 - Lot 2 pH 3.0 - Lot 2
0 2 4 6 8 10 12 14 16 18Time (min)
2-Base
3
4-Base
1
0 2 4 6 8 10 12 14 16 18Time (min)
2
3
4
1
25
Page 49
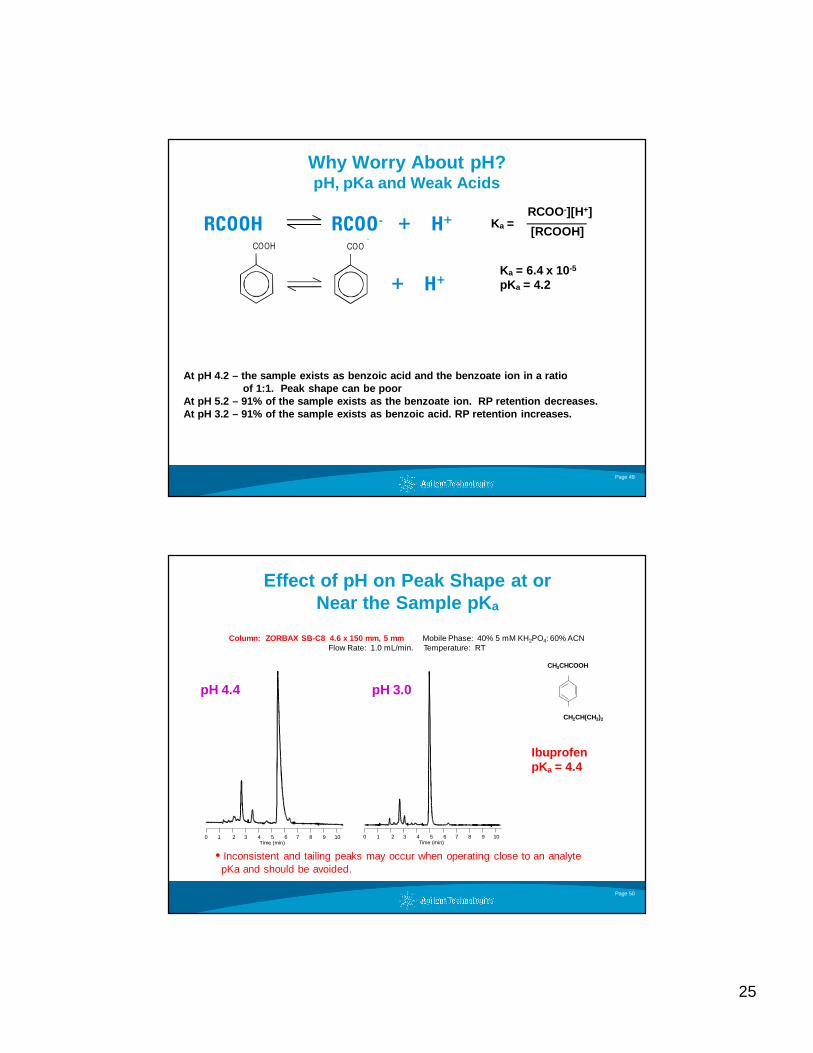
Why Worry About pH?pH, pKa and Weak Acids
At pH 4.2 – the sample exists as benzoic acid and th e benzoate ion in a ratioof 1:1. Peak shape can be poor
At pH 5.2 – 91% of the sample exists as the benzoate ion. RP retention decreases.At pH 3.2 – 91% of the sample exists as benzoic acid . RP retention increases.
RCOOH RCOO- + H+
Ka = 6.4 x 10⁻⁵
pKa = 4.2
Ka =[RCOO-][H+]
[RCOOH]
+ H+
COOH COO_
Page 50
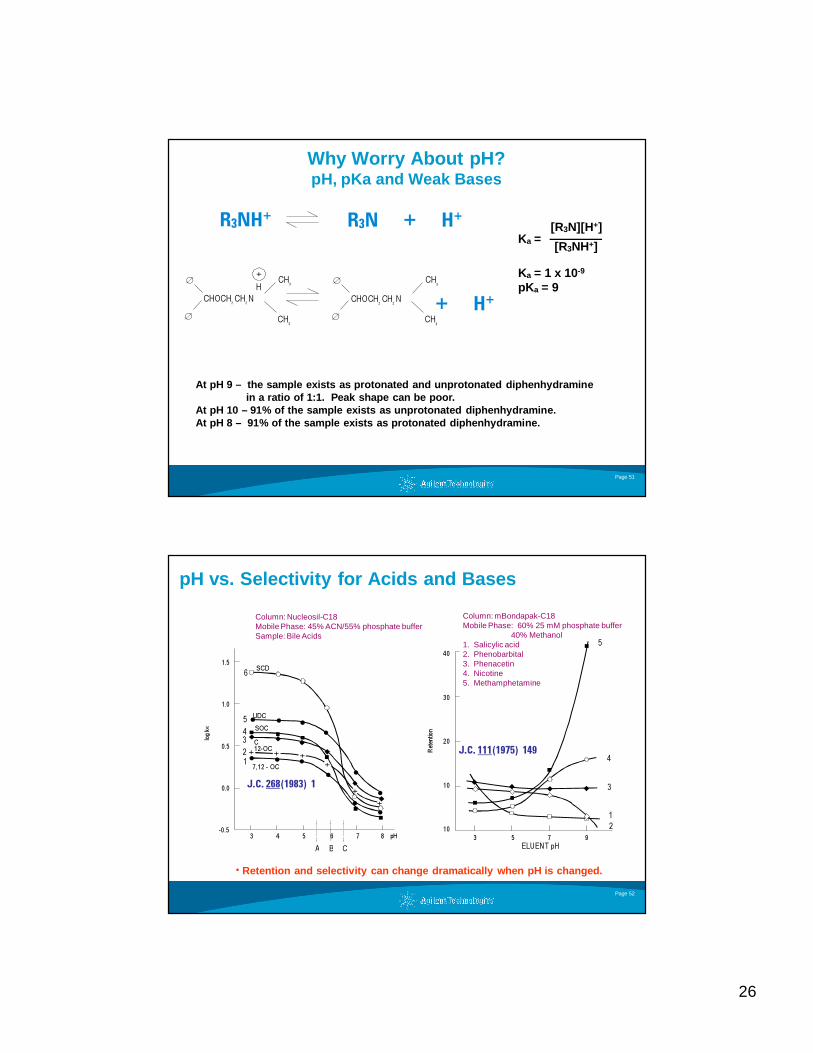
Effect of pH on Peak Shape at or Near the Sample pK a
0 1 2 3 4 5 6 7 8 9 10 0 1 2 3 4 5 6 7 8 9 10Time (min) Time (min)
Column: ZORBAX SB-C8 4.6 x 150 mm, 5 mm Mobile Phase: 40% 5 mM KH2PO4: 60% ACN Flow Rate: 1.0 mL/min. Temperature: RT
pH 4.4 pH 3.0
IbuprofenpKa = 4.4
CH3CHCOOH
CH2CH(CH3)2
• Inconsistent and tailing peaks may occur when operating close to an analytepKa and should be avoided.
26
Page 51
Why Worry About pH?pH, pKa and Weak Bases
At pH 9 – the sample exists as protonated and unprot onated diphenhydramine in a ratio of 1:1. Peak shape can be poor.
At pH 10 – 91% of the sample exists as unprotonated diphenhydramine.At pH 8 – 91% of the sample exists as protonated dip henhydramine.
Ka =[R3N][H+]
[R3NH+]
Ka = 1 x 10⁻⁹
pKa = 9
R3NH+ R3N + H+
CHOCH CH N2 2
CH3
CH3
∅
∅
+H
CH3
CH3
∅
∅
CHOCH CH N2 2 + H+
Page 52
pH vs. Selectivity for Acids and Bases
5
SCD
+
+
2 +
1
1.5
1.0
0.5
0.0
-0.5
log k«
3 4 5 6 7 8 pHA B C
2
4
5
3
3 5 7 9ELUENT pH
40
30
20
10
10
Reten
tion
+++
3
1 7,12 - OC
UDCSOC4
6
C12-OC
J.C. 268(1983) 1
J.C. 111(1975) 149
Column: Nucleosil-C18Mobile Phase: 45% ACN/55% phosphate bufferSample: Bile Acids
Column: mBondapak-C18Mobile Phase: 60% 25 mM phosphate buffer
40% Methanol1. Salicylic acid2. Phenobarbital3. Phenacetin4. Nicotine5. Methamphetamine
• Retention and selectivity can change dramatically w hen pH is changed.
27
Page 53
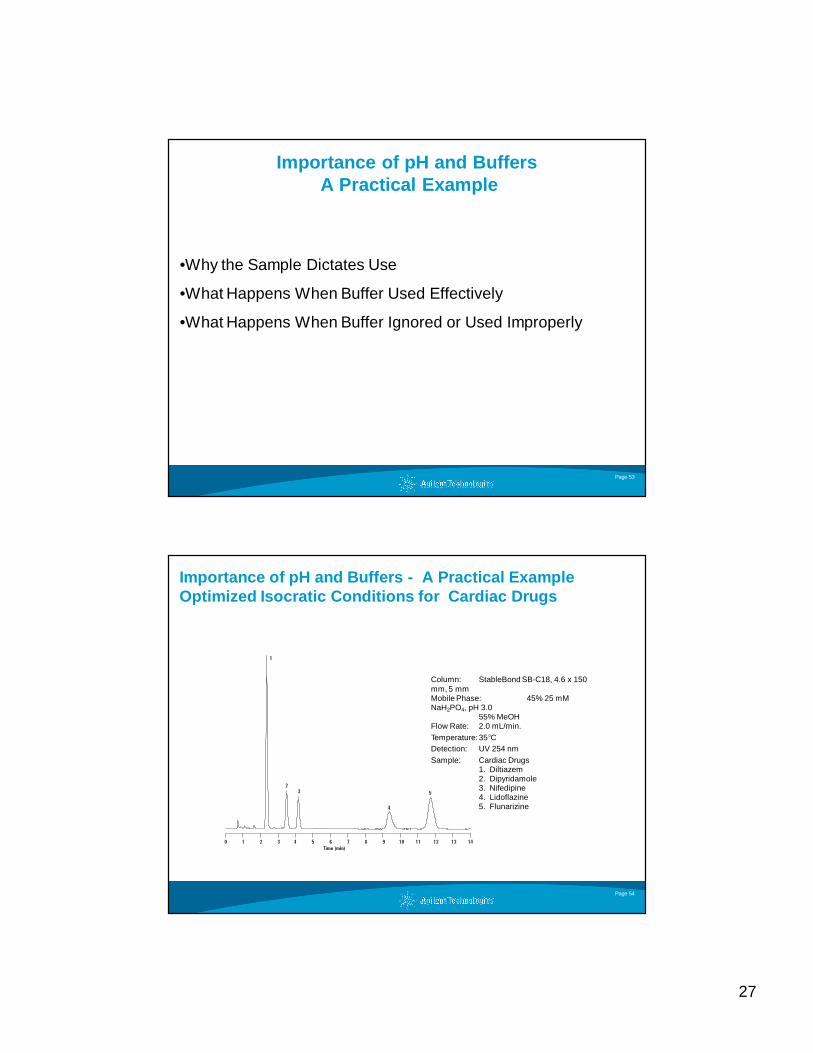
Importance of pH and Buffers A Practical Example
•Why the Sample Dictates Use
•What Happens When Buffer Used Effectively
•What Happens When Buffer Ignored or Used Improperly
Page 54
Importance of pH and Buffers - A Practical Example Optimized Isocratic Conditions for Cardiac Drugs
0 1 2 3 4 5 6 7 8 9 10 11 12 13 14Time (min)
5
4
32
1
Column: StableBond SB-C18, 4.6 x 150 mm, 5 mmMobile Phase: 45% 25 mM NaH2PO4, pH 3.0
55% MeOHFlow Rate: 2.0 mL/min.Temperature:35°CDetection: UV 254 nmSample: Cardiac Drugs
1. Diltiazem2. Dipyridamole3. Nifedipine4. Lidoflazine5. Flunarizine
28
Page 55
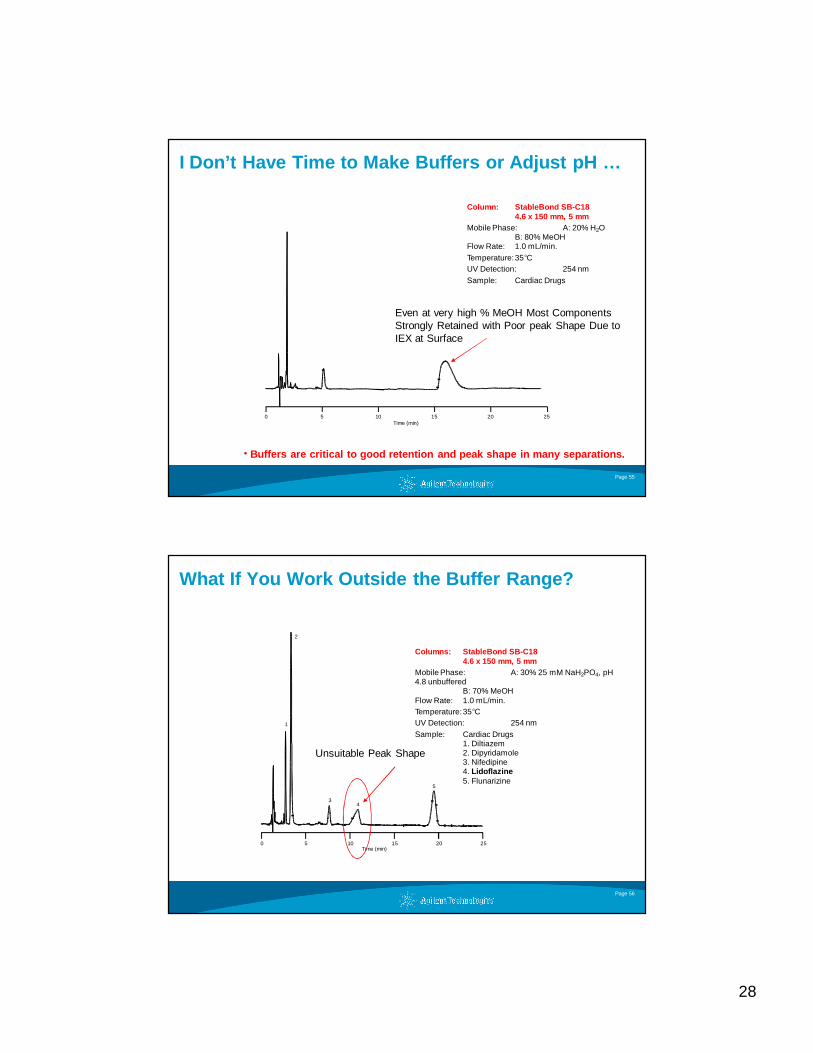
I Don’t Have Time to Make Buffers or Adjust pH …
0 5 10 15 20 25Time (min)
Column: StableBond SB-C184.6 x 150 mm, 5 mm
Mobile Phase: A: 20% H2OB: 80% MeOH
Flow Rate: 1.0 mL/min.Temperature:35°CUV Detection: 254 nmSample: Cardiac Drugs
• Buffers are critical to good retention and peak sha pe in many separations.
Even at very high % MeOH Most Components Strongly Retained with Poor peak Shape Due to IEX at Surface
Page 56
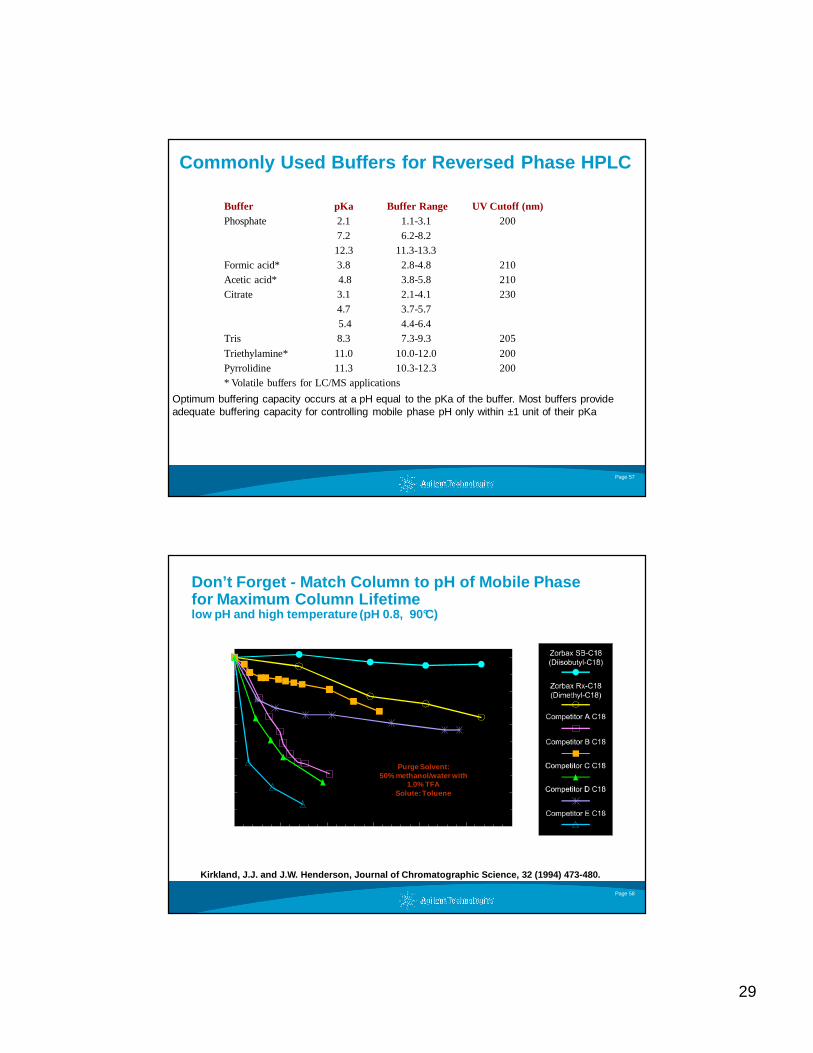
What If You Work Outside the Buffer Range?
0 5 10 15 20 25
5
1
2
34
Time (min)
Columns: StableBond SB-C184.6 x 150 mm, 5 mm
Mobile Phase: A: 30% 25 mM NaH2PO4, pH 4.8 unbuffered
B: 70% MeOHFlow Rate: 1.0 mL/min.Temperature:35°CUV Detection: 254 nmSample: Cardiac Drugs
1. Diltiazem2. Dipyridamole3. Nifedipine4. Lidoflazine5. Flunarizine
Unsuitable Peak Shape
29
Commonly Used Buffers for Reversed Phase HPLC
Buffer pKa Buffer Range UV Cutoff (nm)Phosphate 2.1 1.1-3.1 200
7.2 6.2-8.212.3 11.3-13.3
Formic acid* 3.8 2.8-4.8 210 Acetic acid* 4.8 3.8-5.8 210Citrate 3.1 2.1-4.1 230
4.7 3.7-5.75.4 4.4-6.4
Tris 8.3 7.3-9.3 205
Triethylamine* 11.0 10.0-12.0 200Pyrrolidine 11.3 10.3-12.3 200* Volatile buffers for LC/MS applications
Page 57
Optimum buffering capacity occurs at a pH equal to the pKa of the buffer. Most buffers provide adequate buffering capacity for controlling mobile phase pH only within ±1 unit of their pKa
Page 58
Don’t Forget - Match Column to pH of Mobile Phase for Maximum Column Lifetimelow pH and high temperature (pH 0.8, 90°C)
Purge Solvent: 50% methanol/water with
1.0% TFASolute: Toluene
Kirkland, J.J. and J.W. Henderson, Journal of Chrom atographic Science, 32 (1994) 473-480.

30
Page 59
Don’t Forget - Match Column to pH of Mobile Phase for Maximum Column LifetimeHigh pH and Room Temperature (pH 11 RT)
Tip: Use Columns Designed for chosen pH
Mobile Phase: 50%ACN: 50% Water : 0.2% TEA(~ pH 11)
After 30 injections
Initial
Page 60
Detection Issues
Recognize Where the Problem Originates
• Is it a consequence of technique?
• Is It expected due to use of certain mobile phase components?
• Can it be corrected by adjusting detector parameters?
• Answers Will Help Find a Solution!
Let’s Explore Some Problems and Solutions
31
Page 61
Causes:
� Absorbance of sample is less than the mobile phase.� Equilibrium disturbance when sample solvent passes through the
column.� Normal with Refractive Index Detectors.
Normal Negative
Peak Shape: Negative Peaks
Page 62
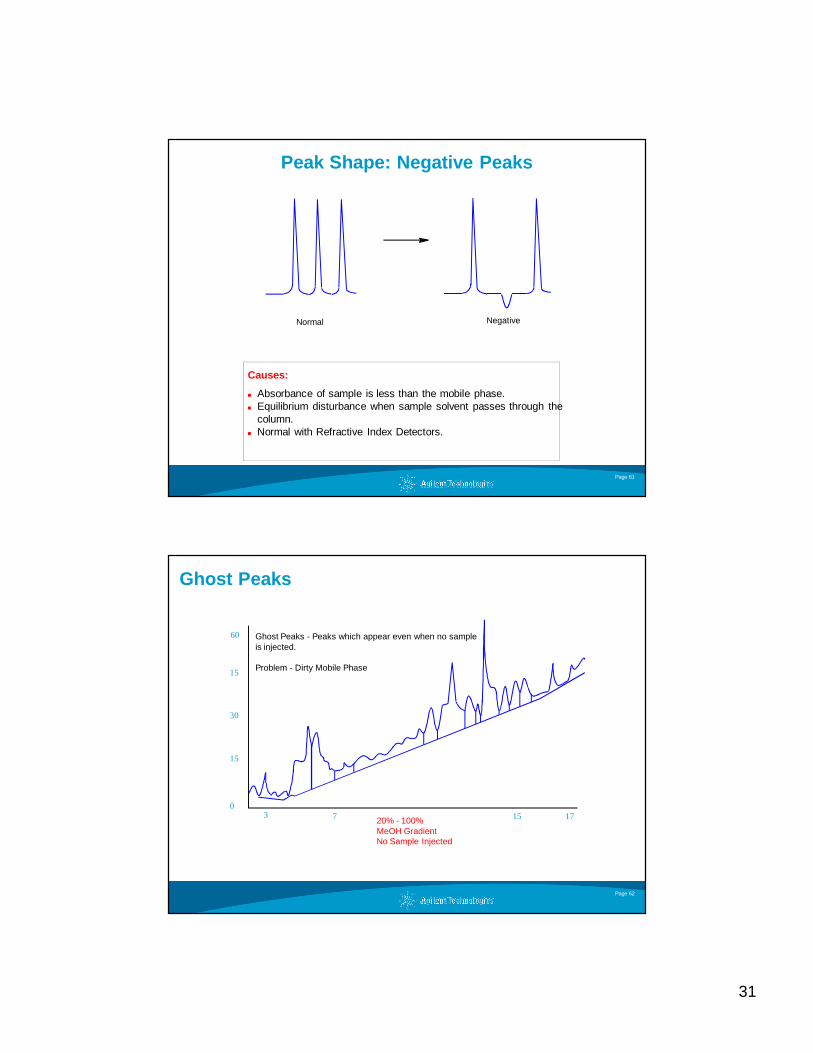
Ghost Peaks
20% - 100% MeOH GradientNo Sample Injected
Ghost Peaks - Peaks which appear even when no sample is injected.
Problem - Dirty Mobile Phase
60
15
30
15
03 7 15 17
32
Page 63
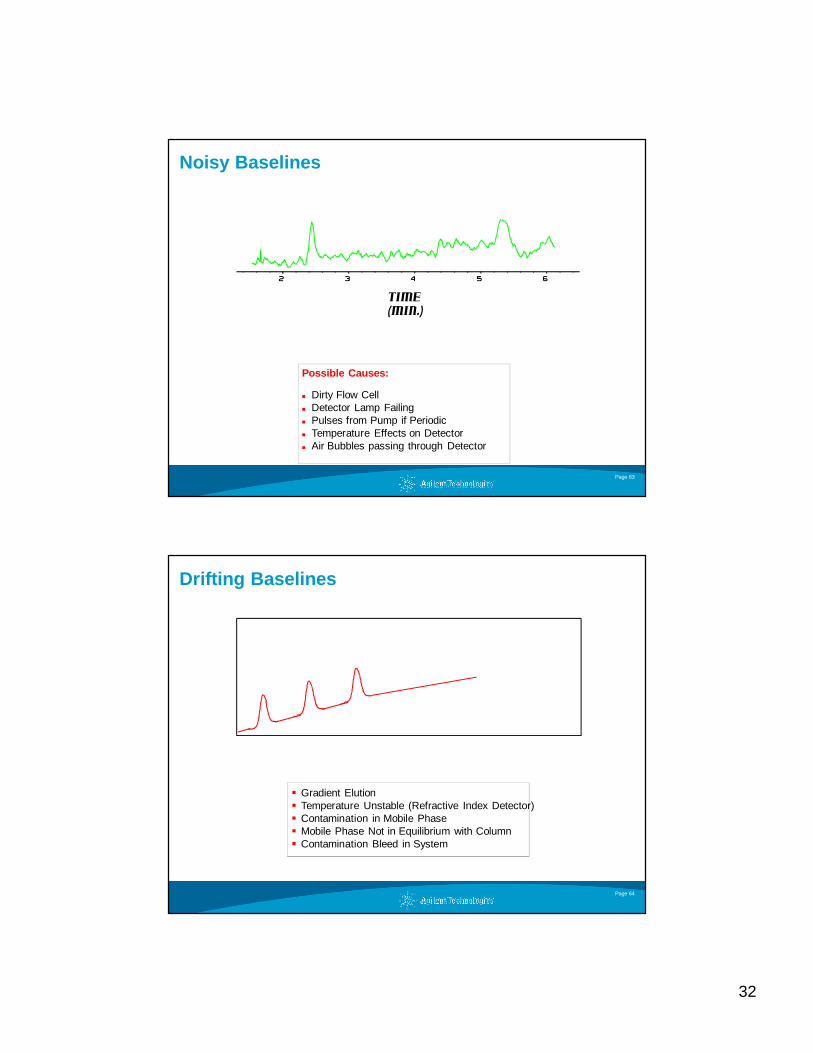
Noisy Baselines
Possible Causes:
� Dirty Flow Cell� Detector Lamp Failing� Pulses from Pump if Periodic� Temperature Effects on Detector� Air Bubbles passing through Detector
Time (min.)
Page 64
� Gradient Elution� Temperature Unstable (Refractive Index Detector)� Contamination in Mobile Phase� Mobile Phase Not in Equilibrium with Column� Contamination Bleed in System
Drifting Baselines

33
Page 65
Chromatographic Results with “Wrong” Lamp at 214 nm Wavelength
OEM LampOEM Lamp
Lamp from Generic SourceLamp from Generic Source
Tip: Could also be a symptom of aging lamp
Page 66
Expanded View of Chromatographic Results Generic Source Lamp at 214 nm Wavelength
OEM Lamp OEM Lamp
Lamp from Generic SourceLamp from Generic Source
Peak 1Peak 1 S/N = 150S/N = 150
Peak 2Peak 2 S/N = 400S/N = 400
Peak 3Peak 3 S/N = 300S/N = 300
Peak 1Peak 1 S/N = 15S/N = 15
Peak 2Peak 2 S/N = 50S/N = 50
Peak 3Peak 3 S/N = 50S/N = 50
Tip: Poor S/N makes it difficult to detect low level impurities
34
Page 67
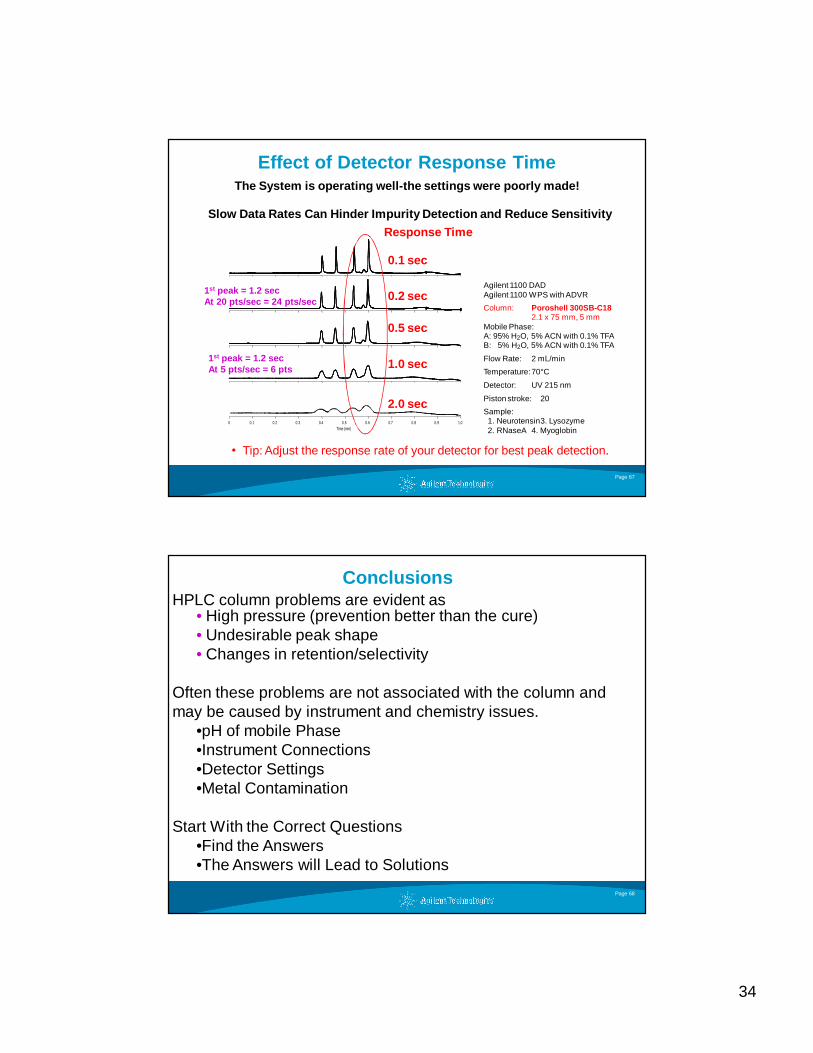
Effect of Detector Response Time
0 0.1 0.2 0.3 0.4 0.5 0.6 0.7 0.8 0.9Time (min)
1.0
Agilent 1100 DADAgilent 1100 WPS with ADVR
Column: Poroshell 300SB-C182.1 x 75 mm, 5 mm
Mobile Phase:A: 95% H2O, 5% ACN with 0.1% TFAB: 5% H2O, 5% ACN with 0.1% TFA
Flow Rate: 2 mL/min
Temperature:70°C
Detector: UV 215 nm
Piston stroke: 20
Sample:1. Neurotensin3. Lysozyme2. RNaseA 4. Myoglobin
0.1 sec
0.2 sec
0.5 sec
1.0 sec
1st peak = 1.2 secAt 20 pts/sec = 24 pts/sec
Response Time
2.0 sec
1st peak = 1.2 secAt 5 pts/sec = 6 pts
• Tip: Adjust the response rate of your detector for best peak detection.
The System is operating well-the settings were poor ly made!
Slow Data Rates Can Hinder Impurity Detection and R educe Sensitivity
Page 68
Conclusions
• High pressure (prevention better than the cure) • Undesirable peak shape• Changes in retention/selectivity
Often these problems are not associated with the column and may be caused by instrument and chemistry issues.
•pH of mobile Phase•Instrument Connections•Detector Settings•Metal Contamination
Start With the Correct Questions•Find the Answers•The Answers will Lead to Solutions
HPLC column problems are evident as