Embed Size (px)
Citation preview

Tip-burn stress detection of lettuce canopy grown in Plant Factories
Riccardo Gozzovelli ⋆, Benjamin Franchetti◦, Malik Bekmurat⋆, Fiora Pirri⋆
⋆ University of Rome Sapienza, ◦ Agricola Moderna
Abstract
A compelling effort has been made in recent years toface several kinds of plant stresses using a variety of sen-sors and deep learning methods. Yet most of the datasetsare based on single leaves or on single plants, exhibitingexplicit diseases. In this work we present a new methodfor stress detection which can deal with a dense canopy ofplants, grown in Plant Factories under artificial lights. Ourapproach combining both classification and segmentationwith self supervised masks, and WGAN based data aug-mentation, has the significant advantage of using normalrgb low cost cameras, simple data aquisition for trainingand it can both localize and detect the tip-burn stress on theplant canopy with very good accuracy as shown in the re-sults. We have tested our results also on datasets availableon tensorflow.org.
1. Introduction
Plant stress detection is a long standing research fieldand, among the stresses, tip-burn affecting particularly let-tuce has been intensively studied, see for example [44, 26,13]. Nowadays, the combination of new methods arisingfrom computer vision and deep learning, the availability ofnew low cost sensors together with an increased attentionon the transparency, quality and healthiness of the farm tofork process are making plant stress analysis a challeng-ing research topic. New data-sets are being created suchas PlantLeaves [11], PlantsDoc [41], PlantsVillage [19] andPlantae-K [47] made available as tensorflow datasets at ten-sorflow.org. These new data-sets and their ease of acces-sibility have thrived the research improving deep learningmodels for the stress detection application.
A limit of the currently available dataset is their in-adequateness for stress analysis in Controlled Environ-ment Agriculture (CEA) and specifically in Plant Facto-ries , where plants are grown indoors under artificial lights,densely packed together and stacked on multiple layers. Insuch highly dense growing conditions the plants are com-pacted on tables of trays and stress problems need to bestudied from this specific perspective, as shown in Figure
Figure 1. On the left, rolling tables collecting trays at the end ofthe growth cycle. On the right, inside the production cells in aPlant Factory.
Figure 2. Lettuce canopy and detected tip-burn as a heat map. Thebar on the right indicates the color code of the probability the net-work assigns to the detected regions of being affected by tip-burn.The image has size 4640× 6960.
1 and Figure 2. The detection and localization of stressin Plant Factories has to deal with complex surfaces ag-glomerating several plants, where the single leaf shape isnot specifically relevant, and at the same time stresses suchas tip-burn occur on the leaf tip (see Figure 3). Moreover,typically plants affected by tip-burn are few, sparse and hid-den in the canopy of other healthy leaves. The underlyingcause of tip-burn is a lack of calcium intake by the plants.This however, is a result of multiple factors such as: lackof airflow, high humidity, excessive lighting and inadequatewatering and nutrient supply. A key advantage of grow-ing plants indoors is the possibility to control all aspectsof the plant growth including the light recipe and climate,thereby providing the optimal mix of conditions to optimiseplant development and quality. However, high-density cropproduction, limited dimensions, lack of natural ventilationand the need for artificial lighting for photosynthesis makesplants grown in plant factories especially vulnerable to tip-burn. Consequently, tip-burn has become a metric for thehealthiness of the plants and being able to monitor its advent
1259

Figure 3. Image of a single leaf taken for data collection purpose(left) and in a real-life environment and growing condition (right).
is extremely relevant in indoor growing conditions. By au-tomatically detecting tip-burn the vertical farm control soft-ware can adjust the growing recipes in real time to providethe plants with the optimal growing conditions.
In this work we propose a novel, and first, model for tip-burn detection in lettuce that fills the gap between alreadyexplored techniques of DL applied to plant stress detectionand their practical implementation in Plant Factories. Ourwork includes the realization of an adequate data-set madeof real and generated images. Yet, we have tested our modelalso on other data-sets.
2. State of the art on stress detection and tip-burn
In the past decade Computer Vision and Deep Learningbecame the new standard for many plant phenotyping tasks,in particular for stress and disease detection and analysis.
Disease Detection Plant disease detection in most recentstudies focus on single leaves images, and use hyperspectralcameras. Nagasubramanian et al. [28] achieved charcoal rotdisease identification in soybean leaves by implementing a3D Deep-CNN with an hyperspectral camera. Zhang et al.[49] carried out a similar study using high-resolution hy-perspectral images, to detect the presence of yellow rust inwinter wheat. Digital cameras are used by [14] and [39].Dechant et al. [14] consider the classification of the North-ern Leaf Blight in maize plants, taking images of leaves inthe field. Shrivastava et al. [39] studied the strength oftransfer learning for the identification of three different riceplant diseases. A review on computer vision and machinelearning methods for disease detection is done in [8].
Tip-Burn studies Tip-burn studies date back long ago[26, 44, 12], essentially exploring causes induced by lackof nutrients absorption, such as in [42] and [48]. As faras we know only [38] conducted tip-burn identification inPFALS using GoogLeNet, for binary classification of singlelettuce images. Their work is incomparable with our work,as they check from manually collected images of a singleplant whether it has or not tip-burn.
Disease detection on public datasets So far, severaldatasets have been proposed and well specified for deeplearning studies. PlantVillage [19] contains more than 50Klow-resolution images of 14 different plant species with 26stress conditions. In such a case, not only the images of sin-gle leaves are taken on a solid background labeled only by aclass name (Figure 3), but they also show visible stress con-ditions at a stage when the leaf is beyond recovery. Agarwalet al. [1] trained a CNN on tomato leaves images taken fromthe PlantVillage dataset [19] and Saleem et al. [36] realizeda comparative evaluation study between multiple CNNs andoptimizers - trained again on PlantVillage - for the taskof plant disease classification, in order to find the com-bination with the best performances. Similar to PlantVil-lage there is PlantLeaves[11] with 4502 high resolution im-ages of healthy and unhealthy leaves divided into 22 cate-gories. Another dataset is PlantDoc[41] in which sampleshave been collected in a quite realistic setting, with leavesbeing heavily affected by diseases. A plant diseases datasetusing offline augmentation from earlier datasets has beenuploaded on Kaggle. This new dataset consists of about87K images of healthy and diseased crop leaves.
Plants data augmentation with generative modelsSeveral studies on plant stress analysis are based on localdata collection. An in depth analysis of factors such as lackof adequate datasets influencing the use of deep learningfor plants disease detection has been addressed in [6, 7] andsome data augmentation methods have been described in[4]. Data augmentation is routinely used in deep learning[24] and augmenting data using GAN has been typicallyused also for balancing data [27] and cross domain adapta-tion [18]. In 2017, Odena et al. [30] addressed the problemby proposing AC-GAN. Few years later, a more robust andreliable improvement was presented with CEGAN[43], inwhich a classifier is trained in combination with a GAN.The presence of the classifier guarantees that the Generatorcan learn to produce samples that are consistent with theirtarget class. Other specific approaches for data augmenta-tion with GAN have been proposed in [2, 45]. The first in-troduced DAGAN, while the latter introduced DAG, a dataaugmentation optimized GAN.
Considerations As far as we know there are no publiclyavailable studies on stress detection of plant canopies grownin Plant Factories. In particular, the only research on tip-burn we found is about binary classification on single let-tuce images. Most of the works on plant diseases are carriedout just for classification or single leaf disease detection. Asa consequence no publicly available canopy datasets existsso far.
3. MethodThere are two possible kinds of settings for tip-burn de-
tection: either inside the growing cell (Figure 1) right) or
1260

Figure 4. On the left, distribution of class samples in collecteddataset. On the right, distribution of class samples after No Stressclass grouping.
at harvest (Figure 1 left). We choose to do tip-burn detec-tion at harvest, at the end of the growing cycle. Taking asreference Figure 2, it is easy to see that at the end of thegrowth cycle the task of identifying tip-burn on large mostlyhealthy canopy is rather hard, also because tip-burn type ofstress affects a very small region of a leaf with respect to itswhole area, as shown in Figure 3 (right).
To detect and localize tip-burn on quite large images oflettuce canopies, not having the images labeled, we tile theimage into patches, which are used for both samples gener-ation and prediction. In fact, the real problem for tip-burnprediction is not only the lack of labeling but also the un-balanced dataset due to the scarcity of tip-burn samples withrespect to healthy plants, as it is shown in the histogram inFigure 4. Our contribution is along two main research lines:
-Samples generation based on Wasserstein Gans, tore-equilibrate the dataset. We show that according to themetric to evaluate quality and coverage of the samplesproduced by GANs, as defined in [25], our method obtainsa high value of realism score. The method we provide cangenerate any amount of patch samples of lettuce with andwithout tip-burn.
- Tip-burn segmentation of canopy. The probability dis-tribution of each patch, being affected by tip-burn, is es-timated via YoloV2 backbone darknet-19 [33]. The clas-sification network generates patch-level labels from whichwe obtain, with further processing and random fields, moreaccurate labeled regions. From here, with a U-net type seg-mentation of partial trays into healthy and tip-burn stressedplants, we obtain pixel-level classification leading to a fur-ther accurate tip-burn prediction.
Results and ablation studies in Section 6 prove the good-ness of our approach, for such a hard problem. Not havingavailable other approaches to compare with, we have usedthe PlantLeaves dataset [11] and the PlantsVillage dataset[19] to prove the generalization of our method to differentsettings.
3.1. Data generation
Since tip-burn manifests on the leaves tip, it is manda-tory to acquire images with a top view of the whole table.
(a) Real (b) Synthetic
Figure 5. Real and synthetic images generated by the proposedWGAN
We do so by taking images with a HR digital camera fixedabove the rolling table. A table is the base on which plantsare grown. Each table assembles 18 trays, which in turns arefurther divided into 104 cells where plant seeds are placed.The image of a table has size (4640 × 6960) for 3 chan-nels. Each image is tiled into patches of size (28× 28× 3),forming a set of about 41K patches. For tip-burn predic-tion for the lettuce species, 43 table images have been col-lected. From these images, only 137 trays were affectedby tip-burn. To approximately measure the data unbalancewe have sampled from this set about 12200 patches and di-vided them into four classes: Healthy, Stress, Backgroundand Dark-background. The distribution of samples in eachclass is shown in Figure 4.
The histogram clearly shows the disproportion: 98.3%of all samples belong to one class only. If we considerHealthy, Background and Dark-background to be a singleclass, for easiness let us call it No Stress, the percentagereaches 99.36%.
Solving the class imbalance problem The problem ofdata imbalance in DL is not entirely new and one promisingtechnique that is being widely used for the generation ofsynthetic samples in real-life datasets are GANs[15]. In-spired by the CEGAN approach [30], we train our ownGAN to generate synthetic images of tip-burn and solve theimbalance problem. To our knowledge, this is the first timethat such a solution has been tested in the field of plant phe-notyping.
The GAN architecture developed follows a DCGAN-likestructure[31], but with some differences. First, three stridedconvolutions, not four, are used for both the generator andthe discriminator. Further, we resorted to the WassersteinGAN[3], or WGAN. We recall that a WGAN, introduces acritic (the discriminator) for the Earth-Mover distance be-tween the distributions of true and generated images, whichamounts to measure the cost of transporting one probabil-ity on the other. The advantage of the WGAN is that they
1261

Best
Wor
st
Figure 6. Image patches (28 × 28) showing the realism score forbest 1.9 and worst 0.4, R score
do not require balancing generator and discriminator as thecritic (discriminator) does not saturate and can be trained tooptimality so that the estimate of the quality of the imagefrom the critic can only improve.
The number of images in which stress occurs and onwhich the WGAN is trained is 744. An example of the typeof images generated at the end of the training procedure,can be seen in Figure 5, where real and synthetic samplesare shown side-by-side.
At a first glance, the visual aspect of the synthetic im-ages closely resemble the original ones. However, simplevisual quality is not enough to assess the correctness of thegenerated samples and thus, we explored how to solve thisproblem in a systematic way.
3.2. Metric assessment of generated data
Recent evaluation metrics for GAN measure the ℓ2 dis-tance between the real and generated distributions by takinga non-linear embedding η of the real and generated images.The embedding is usually obtained by a CNN pretrainednetwork classifier on ImageNet [37, 16, 35, 25]. Among thedifferent methods comparing the distributions, such as theInception scores [37], the Frechet Inception distance [16],the Kernel Inception distance [9] and the recent improved(with respect to [35]) precision and recall metric of [25],we have been using this last because it provides also a real-ism score, which turns out to be relevant for our domain ofimages, formed by patches showing tip-burn on lettuce.
In [25] samples for the distributions are taken via anon-linear embedding, as gathered above, and the non-parametric densities are estimated by the kNN-distance (thek-nearest neighbour). They use the embedded feature vec-tors A and B to estimate two manifolds M(A), M(B) sep-arately (see algorithm 1 in [25]). Namely, they estimate anapproximation of M(A) according to a k+1-minimum dis-tance δ between all feature vectors a, a′ ∈ A, with a = a′
and then compute the number nB of feature vectors in Bthat are within the estimated manifold M(A), returningNB = nB/|B| , | · | being the cardinality of the set. Thenthey repeat the process to estimate M(B) and the numberNA of feature vectors in A that are within the estimated
manifold M(B) returning NA = nA/|A|. Letting A be-ing the feature vectors from real images, B the feature vec-tors of generated images and f(X,Y ) the indicator functionwhich has value 1 if the estimated manifold M(X) for thefeatures vectors in X return a non-zero NY and 0 otherwise,then the precision and recall are defined as:
precision(A,B) =1
|B|
|B|∑k=1
f(A,B)
recall(A,B) =1
|A|
|A|∑k=1
f(B,A)
(1)
Therefore precision, according to the improved measure of[25], computes the average number of feature vectors fromgenerated images that are found in the estimated manifoldof the real images embedding, and the recall computes theaverage number of feature vectors from real images that arein the estimated manifold of the generated images embed-ding.
We have fine-tuned VGG-16 network pre-trained on Im-ageNet to classify real and synthetic stress samples. Adataset of 200 patches is collected and used to train thenetwork for 40 epochs. The feature space is obtained byretrieving the output of the second convolutional layer inVGG-16. The manifold estimation, as described above, isobtained using k = 3 nearest neighbour, which is consid-ered a robust choice, while |A| = |B| = 50176.
The final precision and recall are then calculated by com-paring batches of real and synthetic sample with size 12 andcomputing the average over all the samples. The syntheticimages obtain 39% for precision and 40% for recall. The re-sults obtained confirm that more than 1/3 of the generatedimages are realistic and of good quality.
We have also computed the realism score R that in-creases according to the inverse distance between an imageand the manifold, namely the above defined indicator func-tion f(B,A) = 1 iff R(B,A) ≥ 1, that is, at least a fea-ture vector from the embedding of generated images is inthe estimated manifold of the real images. In Figure 6 areshown examples of images achieving the highest realismscore R = 1.9 (top row) and the minimum realism scoreR = 0.4. Since the higher the score the closer is a sampleto the manifold estimated from real images, we augmentedthe original stress dataset only with those images achievinga realism score over a threshold τ ≥ 1.1.
4. Tip-burn predictionTip-burn prediction, in the absence of labels, requires
two steps: 1) a two class classifier returning the tip-burnlocalization, according to the patch localization in the im-age, and its probability distribution within the canopy; 2)from patch-level to pixel-level segmentation for a two class
1262

Figure 7. On the left the patches with dark spots and on the rightthe patches without dark spots.
segmentation of the lettuce canopy.
4.1. Patch-level localization and detection
For the first step we take at most 60K patches as input,in equilibrium between the stressed and non-stressed ones,where the stressed samples were generated as described inprevious sections. Yet, we had to split this dataset into twosets the darkSpots and the non-darkSpots, since the darkspots, due to factors such as light, background, tables colorand reflectance, affect the classifier reducing its accuracy,see the Results section for accurate explanations and Fig-ure 7. To separate the dataset into two clusters we usedKMeans. For clustering we have considered edge featuresextracted with the Sobel edge detector, color features and,finally, the feature vectors obtained by scattering the Haarwavelets [46]. For detection and localization we imple-ment a two class-classifier architecture highly inspired fromDarkNet-19, YOLOv2 backbone[32], and replicate it for thestress VS darkSpots and stress VS non-darkSpots classifica-tion, see Section 5 for more details.
4.2. Mask generation
As noted in Section 3.1 each image is tiled into about41K patches of size 28× 28 along the three channels. Theclassification network generates patch level annotations as-signing to each patch a probability which is proportional tothe number of pixels on which tip-burn appears. We wantto obtain a segmentation mask for each patch classified asstressed, at pixel level.
Each patch has index i, j, specifying its position on thecomplete image of the canopy. Since tip-burn occurs alongthe borders of the leaf we use the Sobel edge detector al-ready used for clusterization. Let P (pij) and E(pij) beresp. the probability map of the patch and the computededges map, we obtain for patch pij the activation mapMij = P (pij)⊙E(pij), with ⊙ the component-wise prod-uct between matrices. A map Mij of a patch pij can betiled into n mini-patches denoted by piu,jv , with u, v ∈{1, . . ., n} and n≤28. For example, if u, v ∈ {1, . . ., 4}, weget a tiling of the map Mij into 16 mini-patches (or super-pixels) of size 7×7. Each mini-patch value is computed as
Color coded probability
Detected edges
Recomposed 8-neighborhoodof patch pij
pij
Patch with high probability oftip-burn
pij
Classifier
Label mask
CRF
Segmentation
Split &Threshold
Component wise combination
Figure 8. Prediction: unsupervised tip-burn mask generation bymerging probability outcomes from classification and detectededges, CRF and segmentation.
follows:
Viu,jv =1
K
∑x,y∈piu,jv
wMij(x, y), u, v ∈ {1, . . ., n}
(2)Here x, y indicate the pixel values of the mini-patch, w isa mini-patch specific weight reinforcing the contribution ofedges, and K=maxMij . The label map of a patch pij tiledinto n mini patches has tile-level n, and it is defined by asquare n× n matrix thresholding the values defined in (2):
LMn(pij) = η([Viu,jv ]n×n) (3)
Here η : [Viu,jv ]n×n 7→ {0, 1}n×n is a thresholding op-
eration based on the max value of the matrix [Viu,jv ]n×n
quantization. LMn labels each pixel (or superpixel depend-ing on the tiling level chosen) according to whether it ismost likely healthy or stressed (see Figure 8).
Given a label map LMn of a patch, we combine la-bel maps into a patch neighborhood system. The N -neighborhood of a patch is defined by the N=8 patches atdistance δ1, or by the N=24 patches at distance δ2, andso on. Therefore, a label map induced by a patch has sizeN+1. In Figure 8 we show, within the tip-burn predictionprocess, the simple computation to obtain a refined labelmap for a N -neighborhood with N=8. Given a choice ofN we refine the obtained masks by a random field (CRF),where the objective is to predict a label xp ∈ {0, 1} for eachpixel (or superpixel) p. Forming unary and binary potentialsand ignoring the partition function, the energy function ofthe CRF decomposes into nodes (the pixels p) and edges:
E(xp) =∑i
φi(xpi) +
∑i,j∈LMn
φi,j(xpi, xpj
) (4)
Here, the potential φi(xpi) encodes the probability that thepixel pi denotes either stress or health, and it is encodedby a classifier, while φi,j(xpi
, xpj) enforces the labels to
1263

be the same if the pixels are similar and it is encoded bya distance. Inference is done by MAP minimization of theenergy function:
argminxp
E(xp) (5)
In our case the energy function is of class F2 [23] and it isgraph-cut representable. In this case it is known that graphcut gives an optimal solution for the minimization [22], alsoremoving noise from the training labels built as describedabove. These refined masks are then used for training thepixel-level segmentation described below.
4.3. Pixel-level segmentation
Tip-burn prediction amounts to obtain the image shownin Figure 2 where tip-burn regions occurring in the imageof a canopy are segmented. Since the work of [34] manyfurther progress have been made on U-shaped segmenta-tion models based on convolution and deconvolution [29].The idea behind a deep segmentation model is to have anetwork built by an encoder and decoder for labeling eachpixel. The encoder contracts the spatial resolution of theimage up to a single vector, which forms the bottleneck,learning more and more abstract features in this contrac-tion process. Beyond the bottleneck, deconvolution layersrestore the original image resolution by upsampling layers[20]. Since DenseNet [17] skip connections have signedthe U-Net evolution enhancing models for recovering fine-grained details of the target, improving the flow betweenlayers by connecting each layer to all subsequent ones.
In our case we have to cope with very small regions withstrong shape variation, imposing a relatively shallow net.Input to the net is a binary image [0, 1]196×196 with N = 48and the corresponding RGB image cropped from the imageof full canopy, tiled into tray images, to which we appliedonly random jittering, as flipping is not necessary, due to themask being deformable. The implementation is essentiallya relatively shallow U-net, as described in Section 5. Mapswhose sum is zero are not considered in either training andvalidation.
5. ExperimentsHere, we explore more in-depth the key implementation
details of the models used for our experiments. All our net-works are implemented in Tensorflow 2.3 and training areperformed on a RTX-GPU 2080 and on a GTX 1050Ti. Re-ported values and thresholds for training are established em-pirically within a standard range.WGAN implementation for sample generation. TheGenerator and the Critic are deep CNN architectures. Re-garding the training procedure, we apply to every samplesfrom two to three random rotations to increase the origi-nal dataset dimension and use batch size of 62. The im-
CONV_BLOCK_i (filter, kernel)
CONV (filter, kernel)
LEAKY_RELU (0.1)
CONV_BLOCK_1 (4, 3)
INPUT
MAX POOLING_1
CONV_BLOCK_2 (8,3)
CONV_BLOCK_3 (16,3)
OUTPUT
MAX POOLING_2
PADDING
CONV_BLOCK_4 (8,1)
CONV_BLOCK_5 (16,3)
MAX POOLING_3
CONV_BLOCK_6 (32,3)
PADDING
CONV_BLOCK_7 (16,1)
CONV_BLOCK_8 (32,3)
MAX POOLING_4
CONV_BLOCK_9 (64,3)
PADDING
CONV_BLOCK_10 (32,1)
CONV_BLOCK_11 (64,3)
CONV_BLOCK_12 (32,1)
CONV_BLOCK_13 (64,3)
MAX POOLING_5
CONV_BLOCK_14 (128,3)
PADDING
CONV_BLOCK_15 (64,1)
CONV_BLOCK_16 (128,3)
CONV_BLOCK_17 (64,1)
CONV_BLOCK_18 (128,3)
FLATTEN
DENSE (1024, ‘relu’)
DROPOUT (0.5)
DENSE (1, ‘sigmoid’)
BATCH NORMALIZATION
Figure 9. Patch-level classification network (Stress vs darkSpot).
ages are also normalized in the range [−1, 1]. The noisedimension for the Generator is set to 256. We use standardRMSprop with learning rate 1e−5 for both the Generatorand the Critic. The networks are trained for 1500 epochswith the Critic being updated 5 times more than the Gen-erator during each step. The convergence of the WGANdepends on a clipping value c. Formally, c enforces a Lips-chitz constraint that makes the computation of the Wasser-stein distance to be tractable [3]. Practically, if set too lowor too high, vanishing and exploding gradients respectivelycan occur. In our case, we empirically devised that setting cequal to 0.02 is a good compromise between network con-vergence and training time.VGG-16 for generated data metric. We use the VGG-16pretrained model on the ImageNet dataset, provided by ten-sorflow.org. The base network implementation [40] workswith inputs of size (224×224×3). Tensorflow allows to cre-ate links between different model layers. We exploit this tomake the base VGG-16 accept smaller inputs, up to a mini-mum of (32×32×3), requiring us to rescale the images. Wealso convert them to the BGR format and zero-center eachchannel with respect to the ImageNet dataset. We freeze thebase model and train only the head for 30 epochs, with batchsize of 32 and Adam optimizer with learning rate scheduledon epochs, starting from 1e−3. At last, we unfreeze thebase model with a learning rate set to 1e−5.Patch-level classification networks. Both the two class-classifier architectures use their own DarkNet-19 networkas backbone (Figure 9). The head of the network is re-placed with two dense layers with relu and sigmoid func-tions respectively, a dropout of 0.5 in-between them, andL2 weight regularization in each convolutional block. Thestructural difference between the Stress VS no-darkSpotsand the Stress VS darkSpots lies in the number of param-eters used: the former has 4 times the number of parametersin each convolutional block than the latter. Both the archi-tectures are trained from scratch, using a total of 60k im-ages evenly divided between the two class categories. Thedataset is split into training and validation sets with a ra-tio of 90/10. We use batch size of 64 and normalize the
1264

Table 1. Performance metric of the proposed CNN models for patch-level and pixel-level detection and segmentation tasksMetric Patch-level detection Pixel-level detection Patch-level detection Pixel-level
(healthy class split) (via patch classification only) (Ablation: no healthy class split) segmentationValidation Test Test Validation Test Test
Accuracy 96.01% 87.05% 86.51% 74.65% 49.23% -Recall 96.52% 40.45% 65.12% 98.02% 98.02% -Precision 95.68% 8.34% 67.74% 69.04% 2.12% -F1 96.10% 13.83% 64.80% 81.01% 4.15% -mAP - - - - - 87.00%IOU - - - - - 77.20%Dice score - - - - - 75.02%
images in the range [0, 1]. We use SGD with Nesterov Mo-mentum and learning rate 1e−5 to train the Stress VS dark-Spots model for 38 epochs. The training process automati-cally stops if, after 5 consecutive epochs, the validation lossdoes not show meaningful improvements. The Stress VSno-darkSpots model is trained for 32 epochs. SGD withNesterov Momentum is again used but the learning rate isnow set smaller, to a value of 6e−6. Batch size and the earlystopping criteria are the same as the previous model.Pixel-level segmentation network. The network follows aU-net structure with 4 convolution layers, both for the en-coder and the decoder, with kernels of size 3 and leaky-reluas activation functions. Instance normalization and dropout,with a value of 0.3, are applied respectively before and af-ter the max-pooling operation to reduce overfitting. We usebatch size of 1 and Adam optimizer with learning rate set to1e−4. We train the model for 50 epochs with binary cross-entropy as loss function. As for the metrics, we use both theintersection over union and the dice coefficient. The inter-section over union is computed as the ratio between the areaof overlap among the ground truth and the predicted mask,and the union of ground truth and predicted mask, in pixels.The dice coefficient is defined as:
2× |Gt(mask)| ∩ |Pred(mask)||Gt(mask)|+ |Pred(mask)|
(6)
and it benchmarks the similarity between two samples.
6. ResultsIn Table 1, the Patch-level detection column shows the
combined performances of the two class-classifiers on thevalidation and test set, respectively. Let τ be a threshold (inour case set to 0.37):
predicted(pij) =
{stress if P (pij) > τhealthy otherwise
(7)
Here we consider TPs all the patches labeled as stressedand predicted as stress. FPs are all the samples labeled ashealthy and predicted as stress, FNs all patches labeled asstress, and predicted as healthy. TNs all patches labeled
and predicted as healthy. The huge drop in both preci-sion and recall for the test set shows that patch-level detec-tion, despite its flexibility, needs further refinement to re-move FPs. In fact, the two patch-level models predict about[1000 − 4500] more stress samples than there actually are.To check pixel-level accuracy, we collect a test set of 10canopy images where tip-burn masks have been manuallyextracted by the agronomists. First we tested the pixel-levelaccuracy of the Patch-level detection, shown in Table 1 (col-umn Pixel level-detection), by computing TP, FP, TN, FNvia the intersection of patches and test masks, we see thatprecision and recall actually improve. Then we tested thetip-burn segmentation, obtained by unsupervised labeling,CRF and U-Net segmentation. Table 1 column Pixel-levelsegmentation shows the IOU and Dice score metrics for thetest obtaining values higher than 75%.
6.1. Ablation study
An ablation study is motivated by the specific decision ofsplitting the healthy class into two subsets, taken during theexperiments. We conduct the ablation study by training athird CNN classifier avoiding the informative sampling forthe healthy class, hence no split is made between darkSpotor no-darkSpot type. The settings and hyper-parametersused for training are the same as the one presented forthe other two networks. In such a scenario, the validationloss starts oscillating immediately after 7 epochs until themodel completely overfits the training dataset in less than30 epochs. Stopping the model before that, leads to the per-formance metrics shown in Table 1, column Patch-level de-tection (Ablation:..). A drop for both the validation and testsets, most notably precision, is visible. Increasing networkcapacity, learning rate scheduling and loss and weights reg-ularization were unsuccessful. We noticed that most of themisclassified samples were of the darkSpot type. Increasingthe importance of these misclassified samples via cost sen-sitive learning proved unsatisfactory yet again. We stronglybelieve that this issue can be overcome even without split-ting the samples in two categories. Simply increasing thenumber of samples given as input could do the trick, wereserve the search for a better solution in a future study.
1265
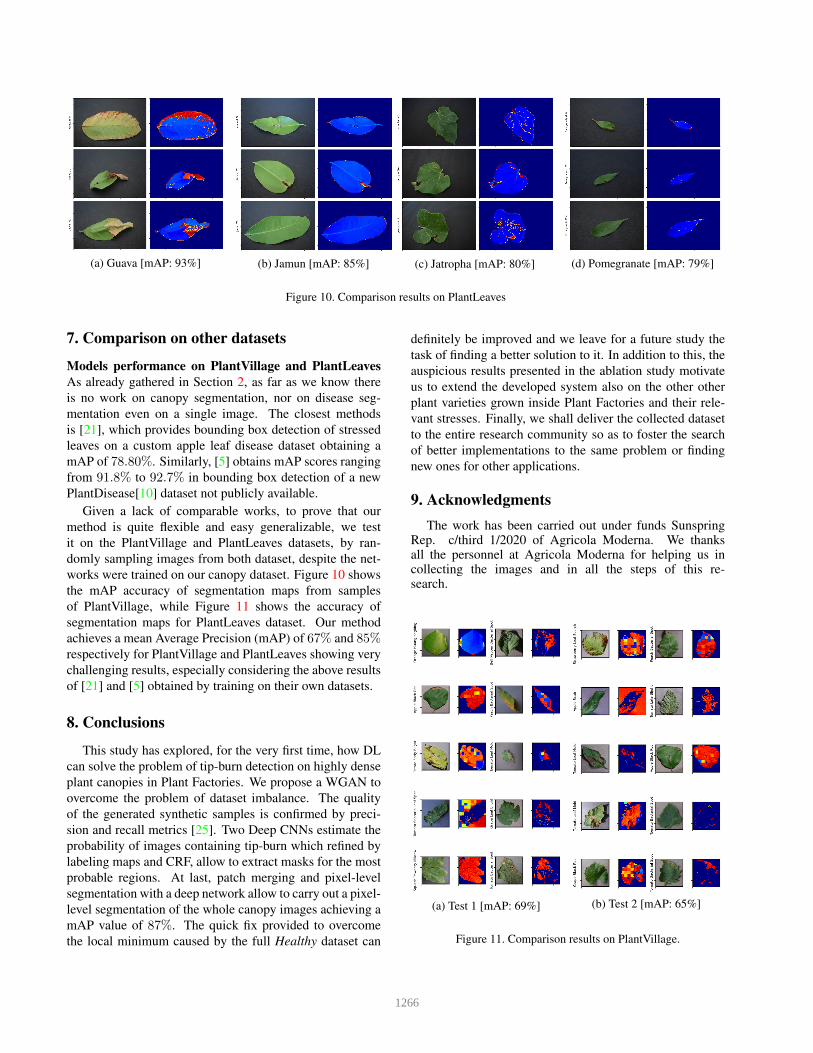
(a) Guava [mAP: 93%] (b) Jamun [mAP: 85%] (c) Jatropha [mAP: 80%] (d) Pomegranate [mAP: 79%]
Figure 10. Comparison results on PlantLeaves
7. Comparison on other datasets
Models performance on PlantVillage and PlantLeavesAs already gathered in Section 2, as far as we know thereis no work on canopy segmentation, nor on disease seg-mentation even on a single image. The closest methodsis [21], which provides bounding box detection of stressedleaves on a custom apple leaf disease dataset obtaining amAP of 78.80%. Similarly, [5] obtains mAP scores rangingfrom 91.8% to 92.7% in bounding box detection of a newPlantDisease[10] dataset not publicly available.
Given a lack of comparable works, to prove that ourmethod is quite flexible and easy generalizable, we testit on the PlantVillage and PlantLeaves datasets, by ran-domly sampling images from both dataset, despite the net-works were trained on our canopy dataset. Figure 10 showsthe mAP accuracy of segmentation maps from samplesof PlantVillage, while Figure 11 shows the accuracy ofsegmentation maps for PlantLeaves dataset. Our methodachieves a mean Average Precision (mAP) of 67% and 85%respectively for PlantVillage and PlantLeaves showing verychallenging results, especially considering the above resultsof [21] and [5] obtained by training on their own datasets.
8. Conclusions
This study has explored, for the very first time, how DLcan solve the problem of tip-burn detection on highly denseplant canopies in Plant Factories. We propose a WGAN toovercome the problem of dataset imbalance. The qualityof the generated synthetic samples is confirmed by preci-sion and recall metrics [25]. Two Deep CNNs estimate theprobability of images containing tip-burn which refined bylabeling maps and CRF, allow to extract masks for the mostprobable regions. At last, patch merging and pixel-levelsegmentation with a deep network allow to carry out a pixel-level segmentation of the whole canopy images achieving amAP value of 87%. The quick fix provided to overcomethe local minimum caused by the full Healthy dataset can
definitely be improved and we leave for a future study thetask of finding a better solution to it. In addition to this, theauspicious results presented in the ablation study motivateus to extend the developed system also on the other otherplant varieties grown inside Plant Factories and their rele-vant stresses. Finally, we shall deliver the collected datasetto the entire research community so as to foster the searchof better implementations to the same problem or findingnew ones for other applications.
9. AcknowledgmentsThe work has been carried out under funds Sunspring
Rep. c/third 1/2020 of Agricola Moderna. We thanksall the personnel at Agricola Moderna for helping us incollecting the images and in all the steps of this re-search.
(a) Test 1 [mAP: 69%] (b) Test 2 [mAP: 65%]
Figure 11. Comparison results on PlantVillage.
1266

References[1] Mohit Agarwal, Abhishek Singh, Siddhartha Arjaria, Amit
Sinha, and Suneet Gupta. ToLeD: Tomato leaf disease detec-tion using convolution neural network. Procedia ComputerScience, 167:293–301, 2020. International Conference onComputational Intelligence and Data Science. 2
[2] Antreas Antoniou, Amos Storkey, and Harrison Edwards.Data augmentation generative adversarial networks. arXivpreprint arXiv:1711.04340, 2017. 2
[3] Martin Arjovsky, Soumith Chintala, and Leon Bottou.Wasserstein gan, 2017. 3, 6
[4] Marko Arsenovic, Mirjana Karanovic, Srdjan Sladojevic,Andras Anderla, and Darko Stefanovic. Solving current lim-itations of deep learning based approaches for plant diseasedetection. Symmetry, 11(7):939, 2019. 2
[5] Marko Arsenovic, Mirjana Karanovic, Srdjan Sladojevic,Andras Anderla, and Darko Stefanovic. Solving current lim-itations of deep learning based approaches for plant diseasedetection. Symmetry, 11(7), 2019. 8
[6] Jayme GA Barbedo. Factors influencing the use of deeplearning for plant disease recognition. Biosystems engineer-ing, 172:84–91, 2018. 2
[7] Jayme Garcia Arnal Barbedo. Impact of dataset size and va-riety on the effectiveness of deep learning and transfer learn-ing for plant disease classification. Computers and electron-ics in agriculture, 153:46–53, 2018. 2
[8] Jayme Garcia Arnal Barbedo. Detection of nutrition defi-ciencies in plants using proximal images and machine learn-ing: A review. Computers and Electronics in Agriculture,162:482–492, 2019. 2
[9] Mikołaj Binkowski, Danica J Sutherland, Michael Arbel, andArthur Gretton. Demystifying mmd gans. arXiv preprintarXiv:1801.01401, 2018. 4
[10] Med Brahimi, Marko Arsenovic, Sohaib Laraba, SrdjanSladojevic, Boukhalfa Kamel, and Abdelouahab Moussaoui.Deep Learning for Plant Diseases: Detection and SaliencyMap Visualisation. 06 2018. 8
[11] Siddharth Chouhan, Ajay Koul, Dr. Uday Singh, and SanjeevJain. A data repository of leaf images: Practice towards plantconservation with plant pathology. 11 2019. 1, 2, 3
[12] EF Cox and JMT McKee. A comparison of tipburn suscepti-bility in lettuce under field and glasshouse conditions. Jour-nal of Horticultural Science, 51(1):117–122, 1976. 2
[13] EF Cox, JMT McKee, and AS Dearman. The effect ofgrowth rate on tipburn occurrence in lettuce. Journal of Hor-ticultural Science, 51(3):297–309, 1976. 1
[14] Chad DeChant, Tyr Wiesner-Hanks, Siyuan Chen, EthanStewart, Jason Yosinski, Michael Gore, Rebecca Nelson,and Hod Lipson. Automated identification of northern leafblight-infected maize plants from field imagery using deeplearning. Phytopathology, 107:1426–1432, 06 2017. 2
[15] Ian J. Goodfellow, Jean Pouget-Abadie, Mehdi Mirza, BingXu, David Warde-Farley, Sherjil Ozair, Aaron Courville, andYoshua Bengio. Generative adversarial networks, 2014. 3
[16] Martin Heusel, Hubert Ramsauer, Thomas Unterthiner,Bernhard Nessler, and Sepp Hochreiter. Gans trained by a
two time-scale update rule converge to a local nash equilib-rium. Advances in neural information processing systems,30, 2017. 4
[17] Gao Huang, Zhuang Liu, Laurens Van Der Maaten, and Kil-ian Q Weinberger. Densely connected convolutional net-works. In Proceedings of the IEEE conference on computervision and pattern recognition, pages 4700–4708, 2017. 6
[18] Sheng-Wei Huang, Che-Tsung Lin, Shu-Ping Chen, Yen-YiWu, Po-Hao Hsu, and Shang-Hong Lai. Auggan: Cross do-main adaptation with gan-based data augmentation. In Pro-ceedings of the European Conference on Computer Vision(ECCV), pages 718–731, 2018. 2
[19] David. P. Hughes and Marcel Salathe. An open access repos-itory of images on plant health to enable the development ofmobile disease diagnostics, 2016. 1, 2, 3
[20] Simon Jegou, Michal Drozdzal, David Vazquez, AdrianaRomero, and Yoshua Bengio. The one hundred layerstiramisu: Fully convolutional densenets for semantic seg-mentation. In Proceedings of the IEEE conference on com-puter vision and pattern recognition workshops, pages 11–19, 2017. 6
[21] Peng Jiang, Yuehan Chen, Bin Liu, Dongjian He, and Chun-quan Liang. Real-time detection of apple leaf diseases us-ing deep learning approach based on improved convolutionalneural networks. IEEE Access, 7:59069–59080, 2019. 8
[22] Daphne Koller and Nir Friedman. Probabilistic graphicalmodels: principles and techniques. MIT press, 2009. 6
[23] Vladimir Kolmogorov and Ramin Zabin. What energy func-tions can be minimized via graph cuts? IEEE transactions onpattern analysis and machine intelligence, 26(2):147–159,2004. 6
[24] Alex Krizhevsky, Ilya Sutskever, and Geoffrey E Hinton.Imagenet classification with deep convolutional neural net-works. Communications of the ACM, 60(6):84–90, 2017. 2
[25] Tuomas Kynkaanniemi, Tero Karras, Samuli Laine, JaakkoLehtinen, and Timo Aila. Improved precision and recallmetric for assessing generative models. arXiv preprintarXiv:1904.06991, 2019. 3, 4, 8
[26] Benjamin Franklin Lutman. Tip burn of the potato and otherplants. Vermont Agricultural Experiment Station, 1919. 1, 2
[27] Giovanni Mariani, Florian Scheidegger, Roxana Istrate,Costas Bekas, and Cristiano Malossi. Bagan: Data augmen-tation with balancing gan. arXiv preprint arXiv:1803.09655,2018. 2
[28] Koushik Nagasubramanian, Sarah Jones, Asheesh Singh,Arti Singh, Baskar Ganapathysubramanian, and SoumikSarkar. Explaining hyperspectral imaging based plant dis-ease identification: 3d cnn and saliency maps. 04 2018. 2
[29] Hyeonwoo Noh, Seunghoon Hong, and Bohyung Han.Learning deconvolution network for semantic segmentation.In Proceedings of the IEEE international conference on com-puter vision, pages 1520–1528, 2015. 6
[30] Augustus Odena, Christopher Olah, and Jonathon Shlens.Conditional image synthesis with auxiliary classifier gans,2017. 2, 3
[31] Alec Radford, Luke Metz, and Soumith Chintala. Unsuper-vised representation learning with deep convolutional gener-ative adversarial networks, 2016. 3
1267

[32] Joseph Redmon and Ali Farhadi. Yolo9000: Better, faster,stronger, 2016. 5
[33] Joseph Redmon and Ali Farhadi. Yolov3: An incrementalimprovement, 2018. 3
[34] O. Ronneberger, P.Fischer, and T. Brox. U-net: Convolu-tional networks for biomedical image segmentation. In Med-ical Image Computing and Computer-Assisted Intervention(MICCAI), volume 9351 of LNCS, pages 234–241. Springer,2015. (available on arXiv:1505.04597 [cs.CV]). 6
[35] Mehdi SM Sajjadi, Olivier Bachem, Mario Lucic, OlivierBousquet, and Sylvain Gelly. Assessing generative modelsvia precision and recall. arXiv preprint arXiv:1806.00035,2018. 4
[36] Muhammad Hammad Saleem, Johan Potgieter, andKhalid Mahmood Arif. Plant disease classification: Acomparative evaluation of convolutional neural networksand deep learning optimizers. Plants, 9(10), 2020. 2
[37] Tim Salimans, Ian Goodfellow, Wojciech Zaremba, VickiCheung, Alec Radford, and Xi Chen. Improved techniquesfor training gans. Advances in neural information processingsystems, 29:2234–2242, 2016. 4
[38] Shigeharu Shimamura, Kenta Uehara, and Seiichi Koakutsu.Automatic identification of plant physiological disorders inplant factories with artificial light using convolutional neuralnetworks. International Journal of New Computer Architec-tures and Their Applications, 9(1):25–31, 2019. 2
[39] Vimal Shrivastava, Monoj Pradhan, S. Minz, and M. Thakur.Rice plant disease classification using transfer learning ofdeep convolution neural network. ISPRS - InternationalArchives of the Photogrammetry, Remote Sensing and Spa-tial Information Sciences, XLII-3/W6:631–635, 07 2019. 2
[40] Karen Simonyan and Andrew Zisserman. Very deep convo-lutional networks for large-scale image recognition, 2015. 6
[41] Davinder Singh, Naman Jain, Pranjali Jain, Pratik Kayal,Sudhakar Kumawat, and Nipun Batra. Plantdoc. Proceed-ings of the 7th ACM IKDD CoDS and 25th COMAD, Jan2020. 1, 2
[42] Jung Eek Son and Tadashi Takakura. Effect of ec of nutri-ent solution and light condition on transpiration and tipburninjury of lettuce in a plant factory. Journal of AgriculturalMeteorology, 44(4):253–258, 1989. 2
[43] Sungho Suh, Haebom Lee, Paul Lukowicz, and Yong Lee.Cegan: Classification enhancement generative adversarialnetworks for unraveling data imbalance problems. NeuralNetworks, 133:69–86, 01 2021. 2
[44] GP Termohlen and AP vd Hoeven. Tipburn symptoms inlettuce. In Symposium on Vegetable Growing under Glass 4,pages 105–110, 1965. 1, 2
[45] Ngoc-Trung Tran, Viet-Hung Tran, Ngoc-Bao Nguyen,Trung-Kien Nguyen, and Ngai-Man Cheung. On data aug-mentation for gan training. IEEE Transactions on Image Pro-cessing, 30:1882–1897, 2021. 2
[46] Michael Unser. Texture classification and segmentation us-ing wavelet frames. IEEE Transactions on image processing,4(11):1549–1560, 1995. 5
[47] Sakshi Arora Vippon Preet Kour. Plantaek: A leaf databaseof native plants of jammu and kashmir. Mendeley Data,2019. 1
[48] Ukrit Watchareeruetai, Pavit Noinongyao, Chaiwat Wattana-paiboonsuk, Puriwat Khantiviriya, and Sutsawat Duangsri-sai. Identification of plant nutrient deficiencies using con-volutional neural networks. In 2018 International ElectricalEngineering Congress (iEECON), pages 1–4. IEEE, 2018. 2
[49] Xin Zhang, Liangxiu Han, Yingying Dong, Yue Shi, Wen-jiang Huang, Lianghao HAN, Pablo Gonzalez-Moreno,Huiqin Ma, Huichun Ye, and Tam Sobeih. A deep learning-based approach for automated yellow rust disease detec-tion from high-resolution hyperspectral uav images. RemoteSensing, 11:1554, 06 2019. 2
1268