Embed Size (px)
Citation preview

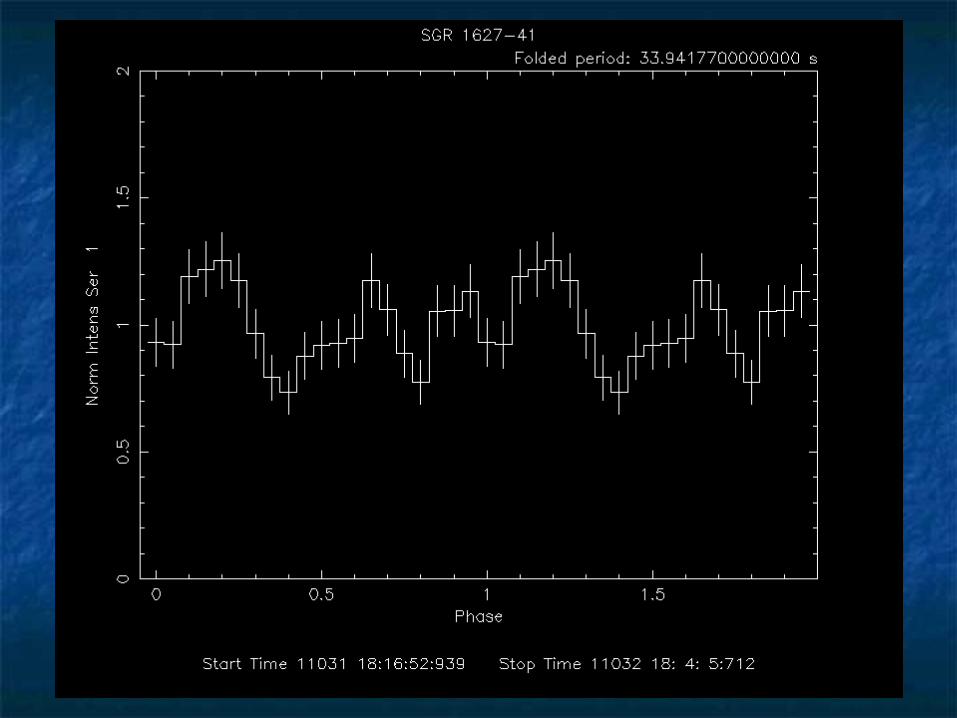
Timing analysis of Timing analysis of SGR 1627-41SGR 1627-41
Liang, Jau-ShianLiang, Jau-ShianDep. of Physics, NTHUDep. of Physics, NTHU
2004/3/112004/3/11

OutlineOutline
IntroductionIntroduction
(1).SGR 1627-41(1).SGR 1627-41
(2).epoch folding,H-test(2).epoch folding,H-test Data Reduction and AnalysisData Reduction and Analysis Future workFuture work
introductionintroduction
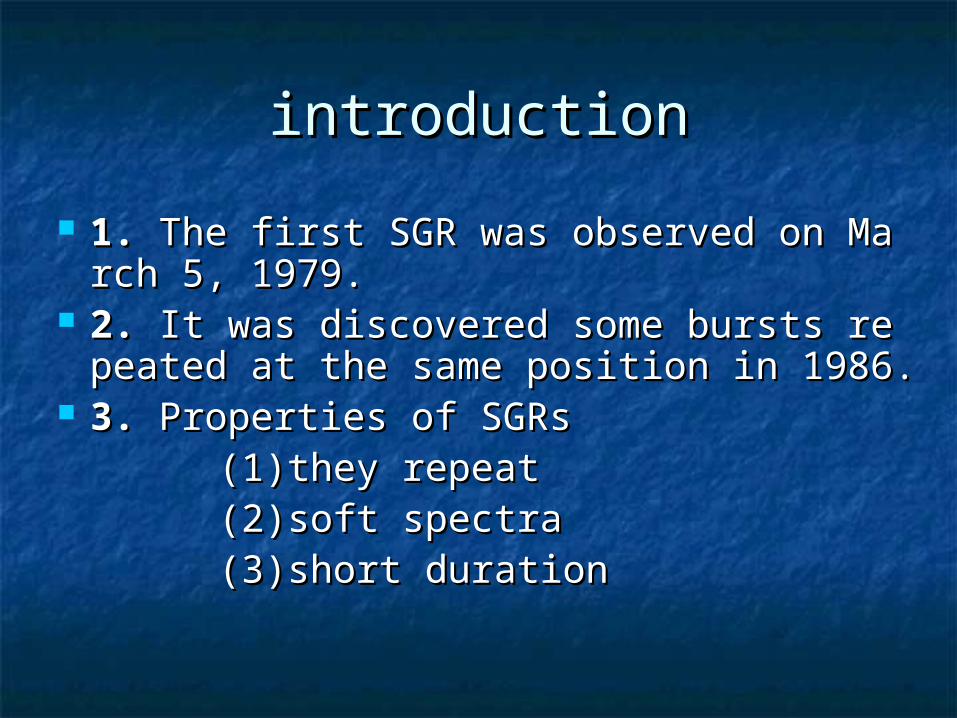
1. 1. The first SGR was observed on March The first SGR was observed on March 5, 1979.5, 1979.
2. 2. It was discovered some bursts repeatIt was discovered some bursts repeated at the same position in 1986.ed at the same position in 1986.
3. 3. Properties of SGRsProperties of SGRs (1)they repeat(1)they repeat (2)soft spectra(2)soft spectra (3)short duration(3)short duration

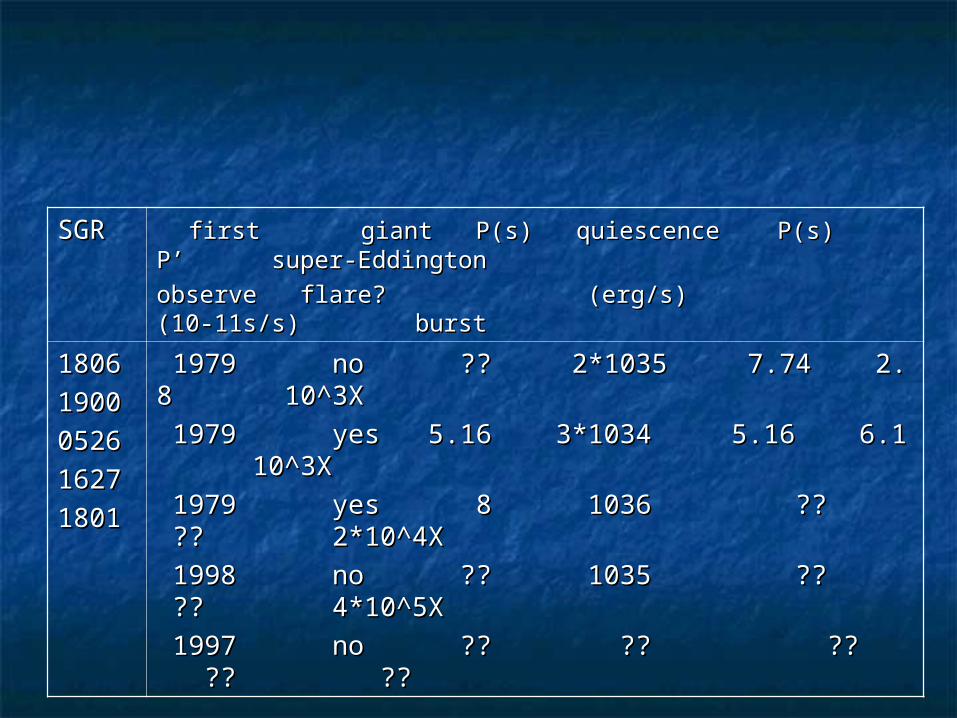
SGR SGR first giant P(s) quiescence P(s) P’ super-Eddingtonfirst giant P(s) quiescence P(s) P’ super-Eddingtonobserve flare? (erg/s) (10-11s/s) burst observe flare? (erg/s) (10-11s/s) burst
18061806
19001900
05260526
16271627
1801 1801
1979 no ?? 2*1035 7.74 2.8 10^3X1979 no ?? 2*1035 7.74 2.8 10^3X 1979 yes 5.16 3*1034 5.16 6.1 10^3X 1979 yes 5.16 3*1034 5.16 6.1 10^3X 1979 yes 8 1036 ?? ?? 2*10^4X 1979 yes 8 1036 ?? ?? 2*10^4X 1998 no ?? 1035 ?? ?? 4*10^5X 1998 no ?? 1035 ?? ?? 4*10^5X 1997 no ?? ?? ?? ?? ?? 1997 no ?? ?? ?? ?? ??
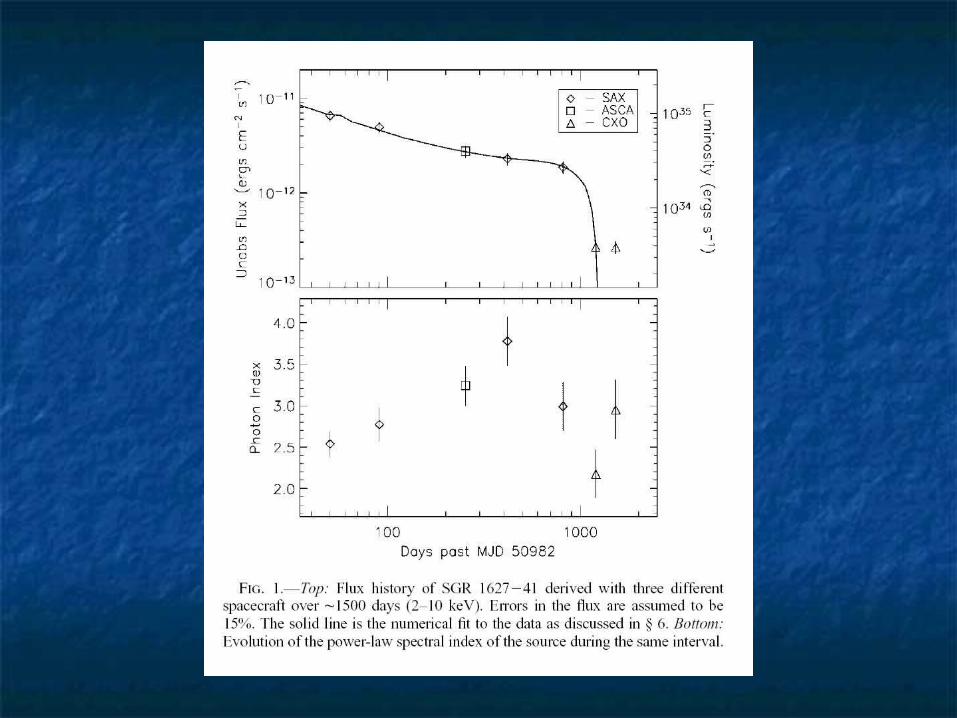
SGR 1627-41SGR 1627-41
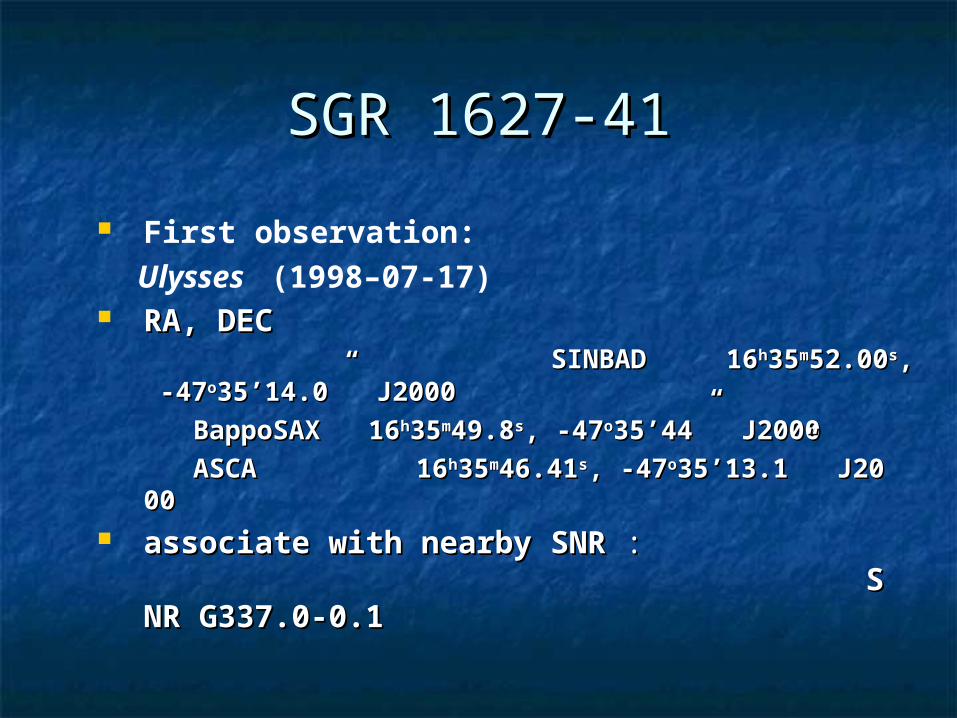
First observation: Ulysses (1998–07-17) RA, DEC RA, DEC SINBAD SINBAD
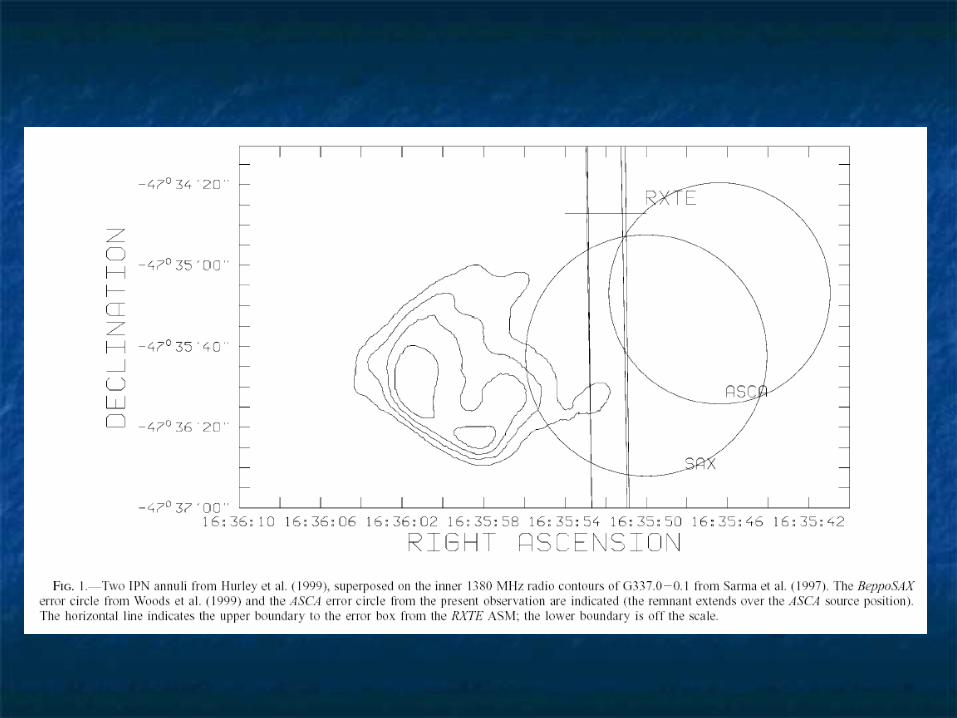
16 16hh3535mm52.0052.00ss, -47, -47oo35’14.0”35’14.0” J2000J2000 BappoSAX 16BappoSAX 16hh3535mm49.849.8ss, -47, -47oo35’44”35’44” J2000J2000 ASCA 16ASCA 16hh3535mm46.4146.41ss, -47, -47oo35’13.1”35’13.1” J2000J2000 associate with nearby SNRassociate with nearby SNR : :
SNR G337.0-0.1SNR G337.0-0.1
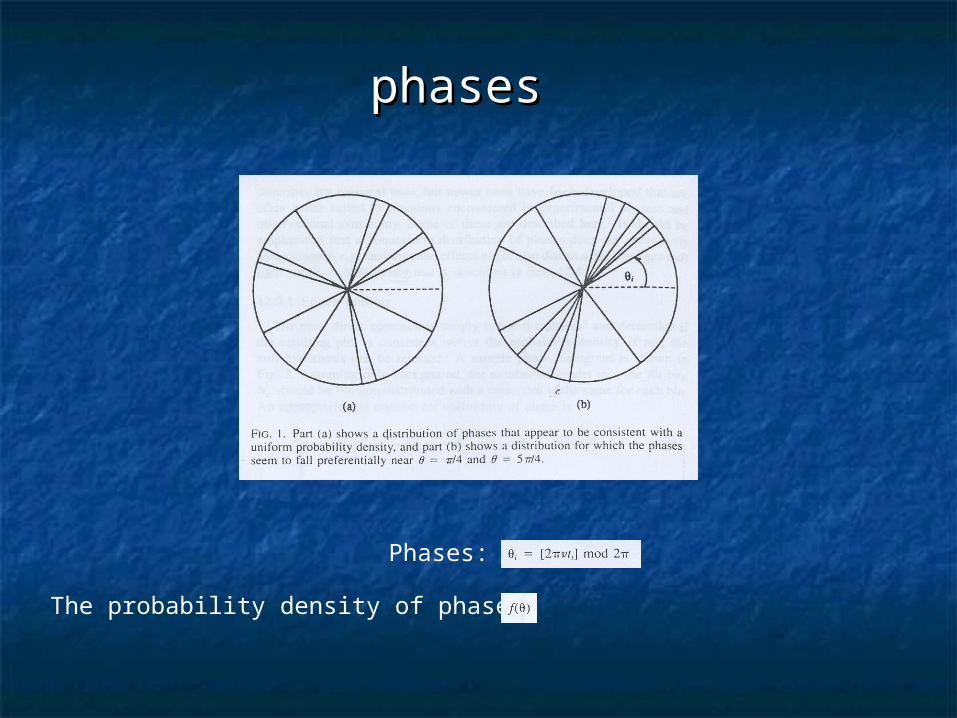
phasesphases
Phases:
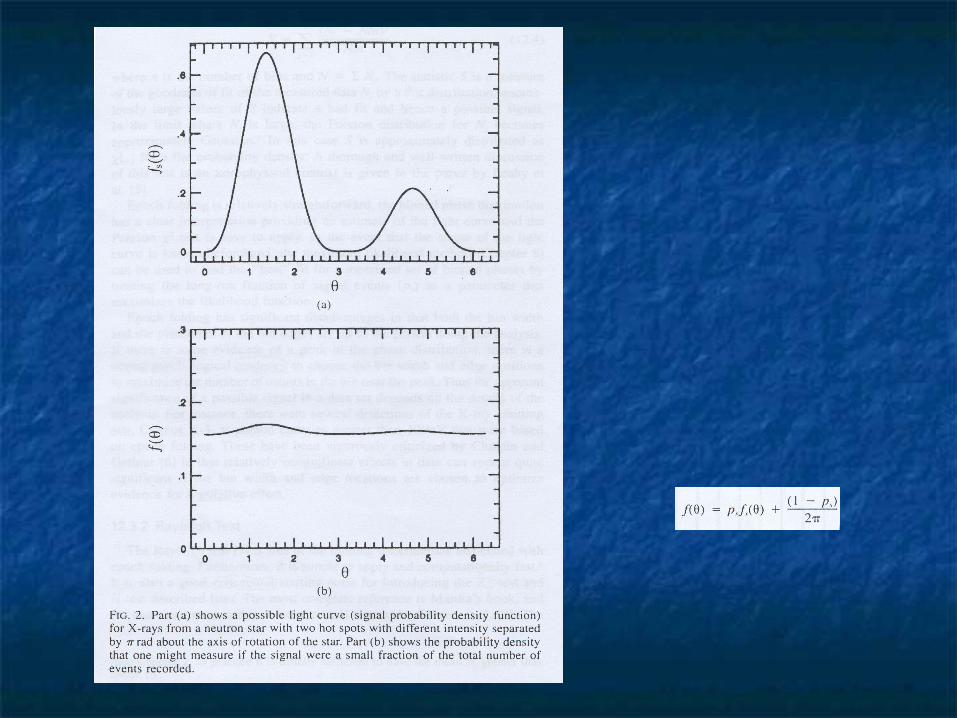
The probability density of phases:
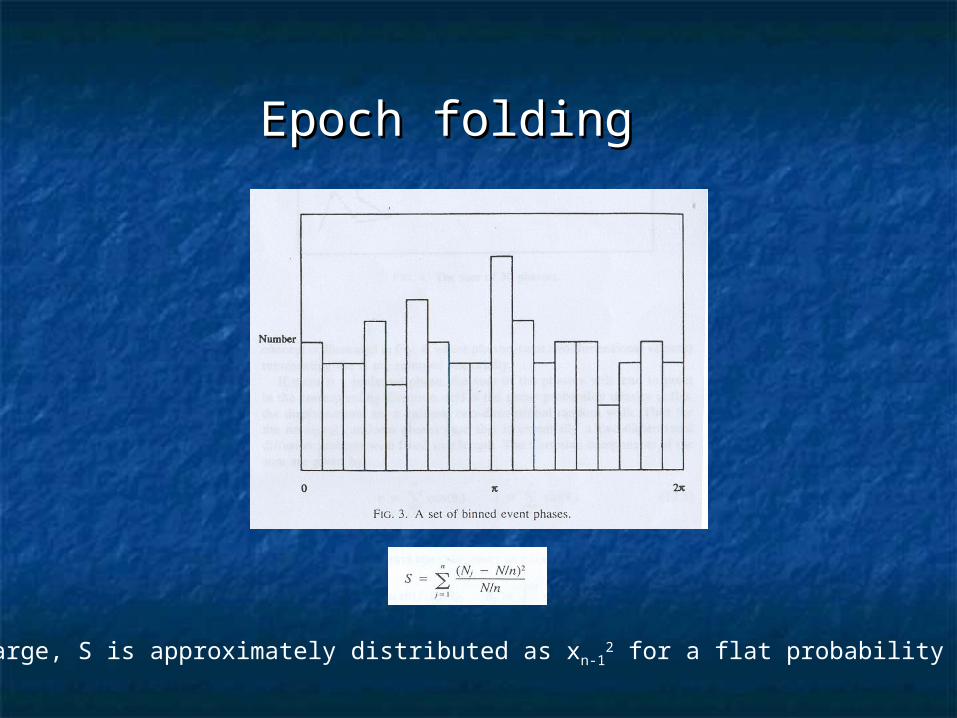
Epoch foldingEpoch folding
If Nj is large, S is approximately distributed as xn-12 for a flat probability density.
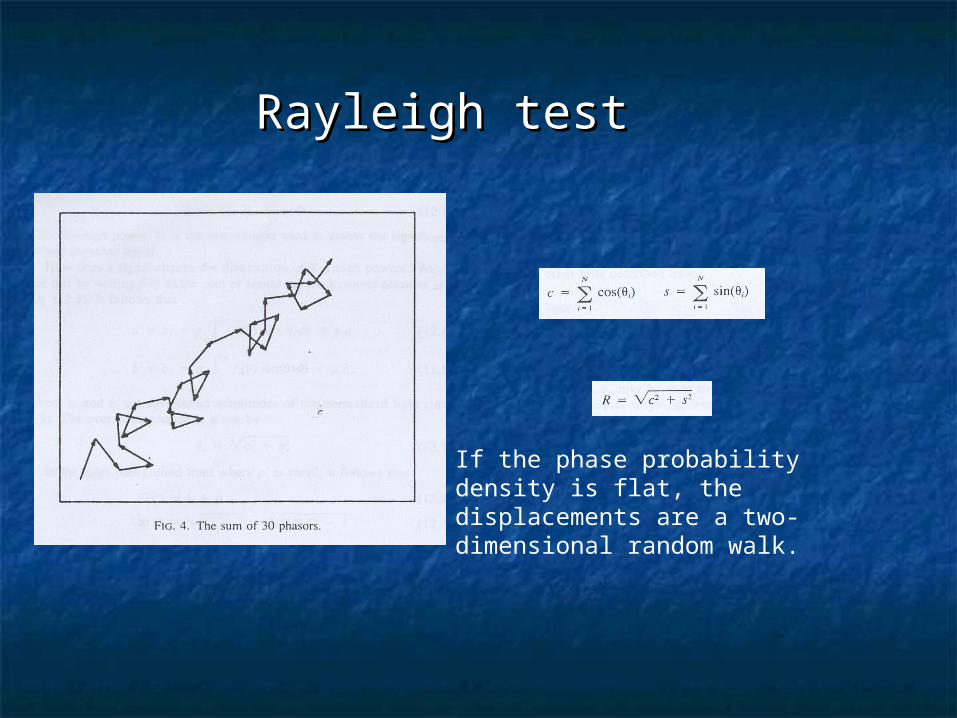
Rayleigh testRayleigh test
If the phase probability density is flat, the displacements are a two-dimensional random walk.
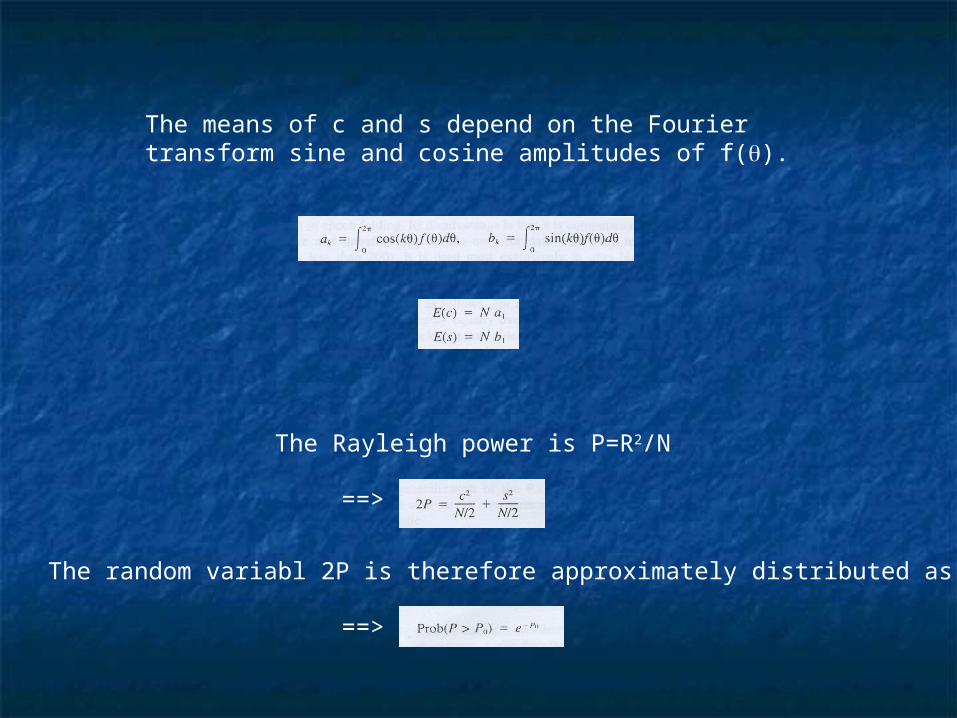
The means of c and s depend on the Fourier transform sine and cosine amplitudes of f().
The Rayleigh power is P=R2/N
==>
The random variabl 2P is therefore approximately distributed as x22.
==>

ZZmm2 2 -test and H-test-test and H-test
A generalization of the Rayleigh test:
Include the effect of a zealous obser in the caculation of significance:
Compare FFT with Epoch Compare FFT with Epoch FoldingFolding
Epoch folding is more sensitive to the noEpoch folding is more sensitive to the nonsinusoidal pulse shapes characteristics nsinusoidal pulse shapes characteristics of X-ray pulsars.of X-ray pulsars.
Epoch folding provides a straightforwarEpoch folding provides a straightforward approach to handling gaps which routid approach to handling gaps which routinely appear in data.nely appear in data.
Epoch folding is extremely time-consumEpoch folding is extremely time-consuming on the computer.ing on the computer.
Compare H-test with Epoch Compare H-test with Epoch FoldingFolding
Epoch folding is more sensitive to the noEpoch folding is more sensitive to the nonsinusoidal pulse shapes characteristics nsinusoidal pulse shapes characteristics of X-ray pulsars.of X-ray pulsars.
The H-test is free of the binning uncertaiThe H-test is free of the binning uncertainties associated with epoch folding.nties associated with epoch folding.
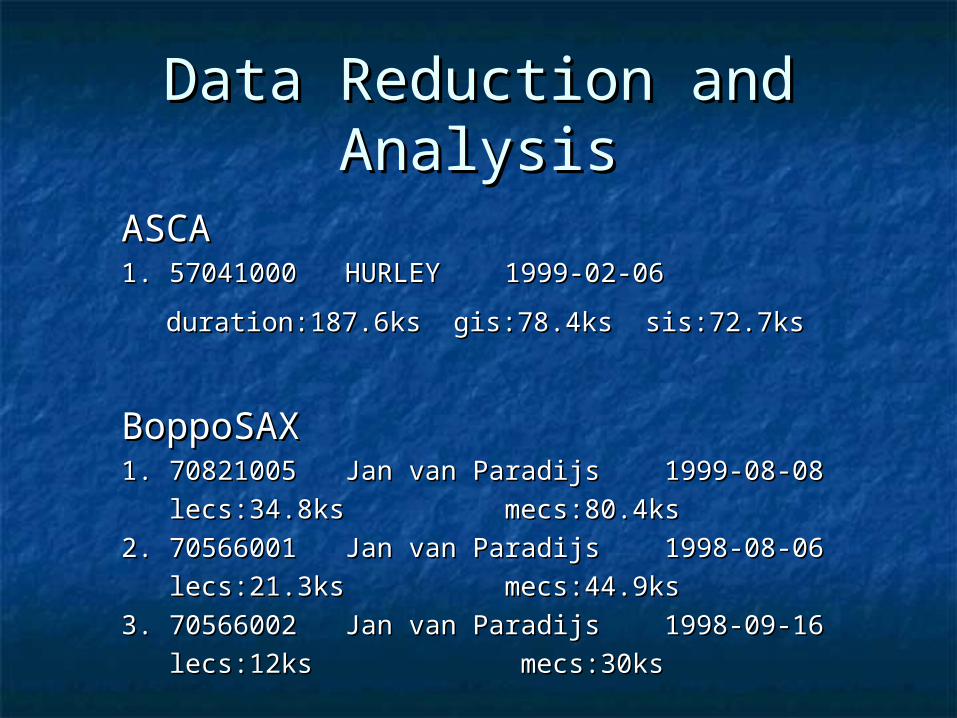
Data Reduction and Data Reduction and AnalysisAnalysis
ASCAASCA1. 57041000 HURLEY 1999-02-061. 57041000 HURLEY 1999-02-06
duration:187.6ks gis:78.4ks sis:72.7ksduration:187.6ks gis:78.4ks sis:72.7ks
BoppoSAXBoppoSAX1. 70821005 Jan van Paradijs 1999-08-081. 70821005 Jan van Paradijs 1999-08-08 lecs:34.8ks mecs:80.4kslecs:34.8ks mecs:80.4ks2. 70566001 Jan van Paradijs 1998-08-062. 70566001 Jan van Paradijs 1998-08-06 lecs:21.3ks mecs:44.9kslecs:21.3ks mecs:44.9ks3. 70566002 Jan van Paradijs 1998-09-163. 70566002 Jan van Paradijs 1998-09-16 lecs:12ks mecs:30kslecs:12ks mecs:30ks
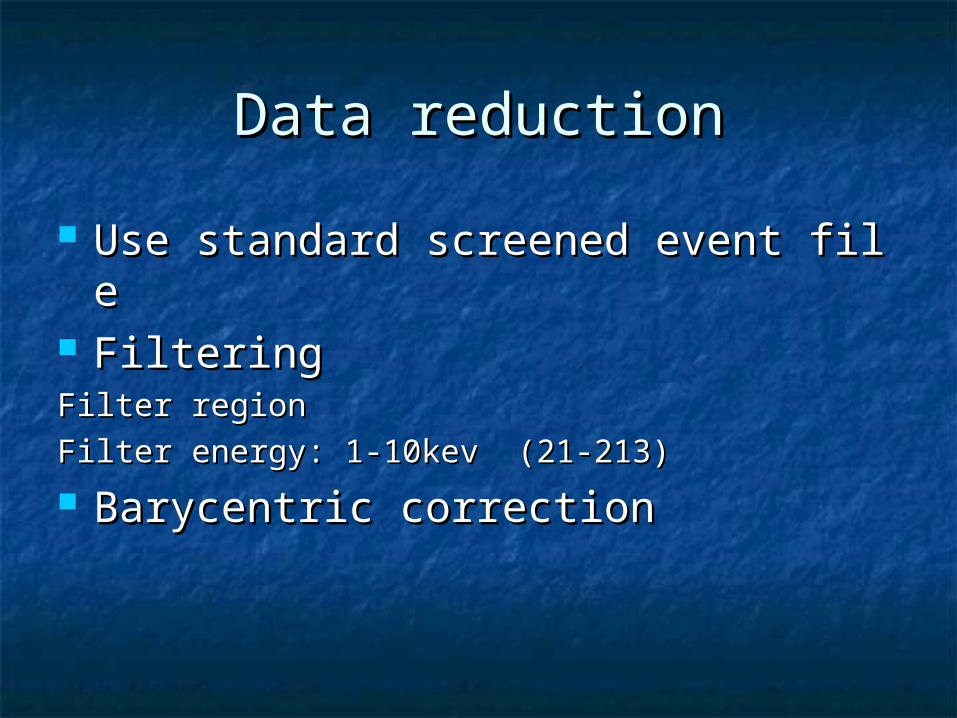
Data reductionData reduction
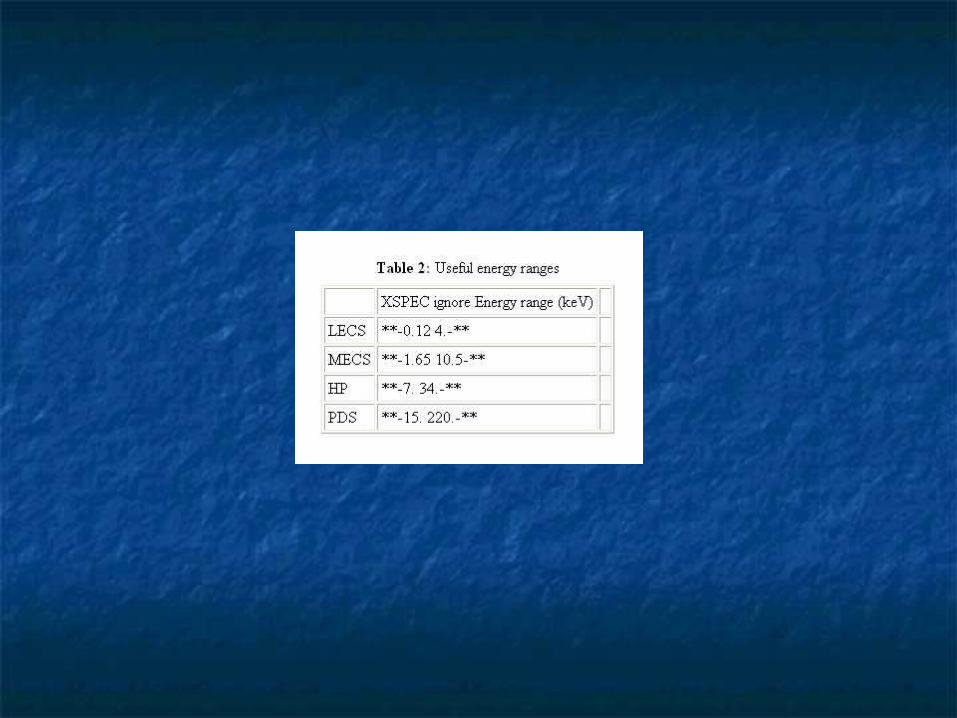
Use standard screened event fileUse standard screened event file FilteringFilteringFilter regionFilter regionFilter energy: 1-10kev (21-213)Filter energy: 1-10kev (21-213) Barycentric correctionBarycentric correction
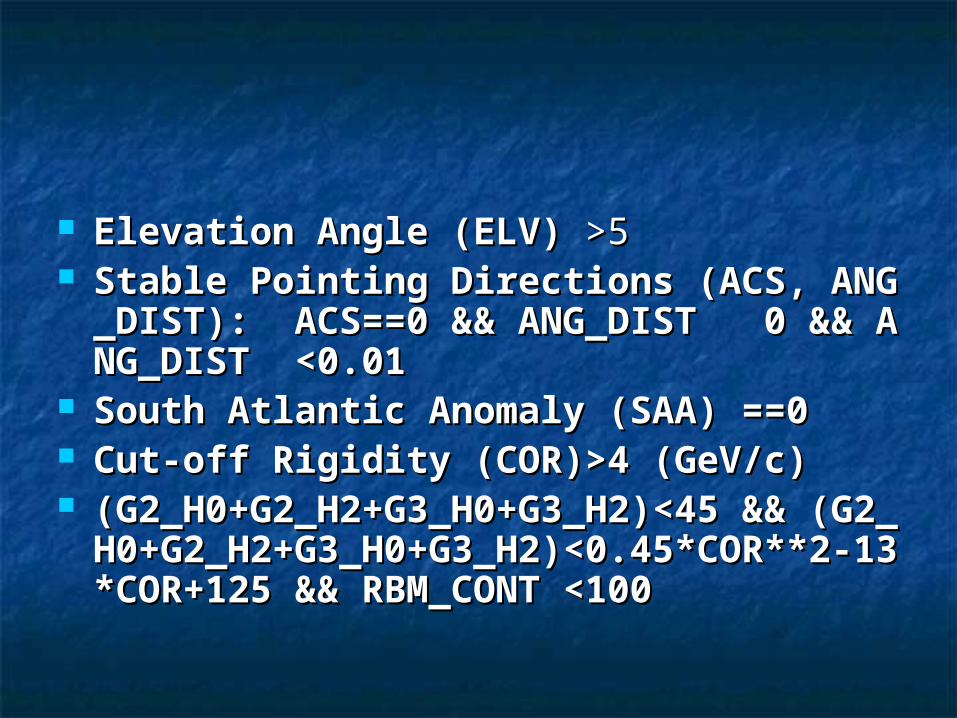
Elevation Angle (ELV) Elevation Angle (ELV) >5>5 Stable Pointing Directions (ACS, ANG_DIST): Stable Pointing Directions (ACS, ANG_DIST):
ACS==0 && ANG_DIST 0 && ANG_DIST <0.0 ACS==0 && ANG_DIST 0 && ANG_DIST <0.011
South Atlantic Anomaly (SAA) ==0South Atlantic Anomaly (SAA) ==0 Cut-off Rigidity (COR)>4 (GeV/c) Cut-off Rigidity (COR)>4 (GeV/c) (G2_H0+G2_H2+G3_H0+G3_H2)<45 && (G2_(G2_H0+G2_H2+G3_H0+G3_H2)<45 && (G2_
H0+G2_H2+G3_H0+G3_H2)<0.45*COR**2-13*H0+G2_H2+G3_H0+G3_H2)<0.45*COR**2-13*COR+125 && RBM_CONT <100 COR+125 && RBM_CONT <100

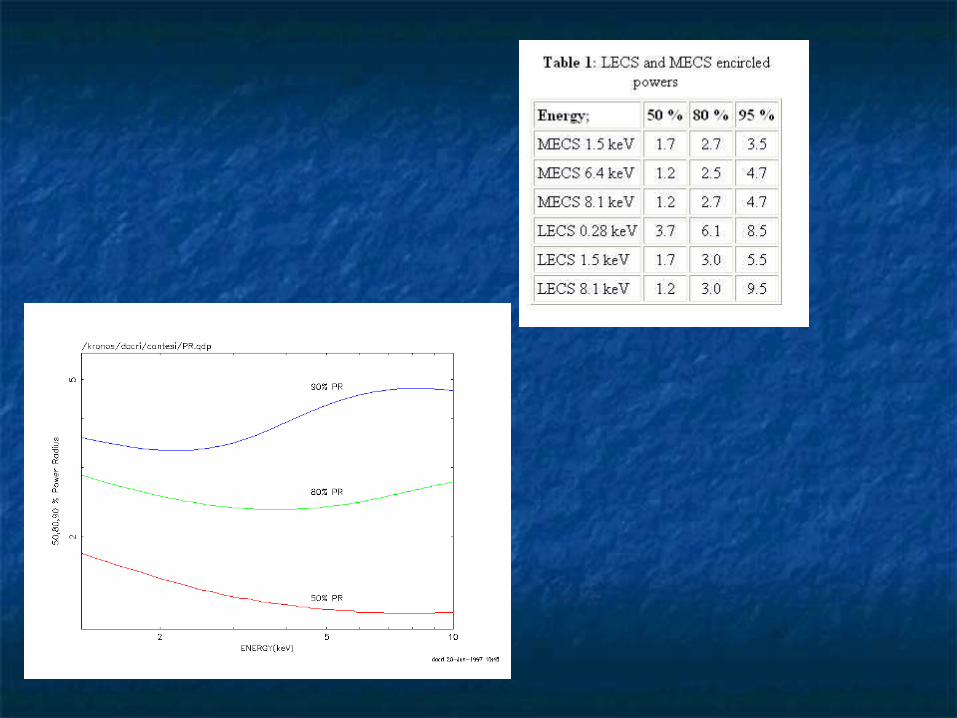
The recommended region filter radius foThe recommended region filter radius for bright sources in the GIS is 6 arcmin (24 r bright sources in the GIS is 6 arcmin (24 pixels). pixels).
For weak sources smaller regions could For weak sources smaller regions could be used to reduce the background.be used to reduce the background.
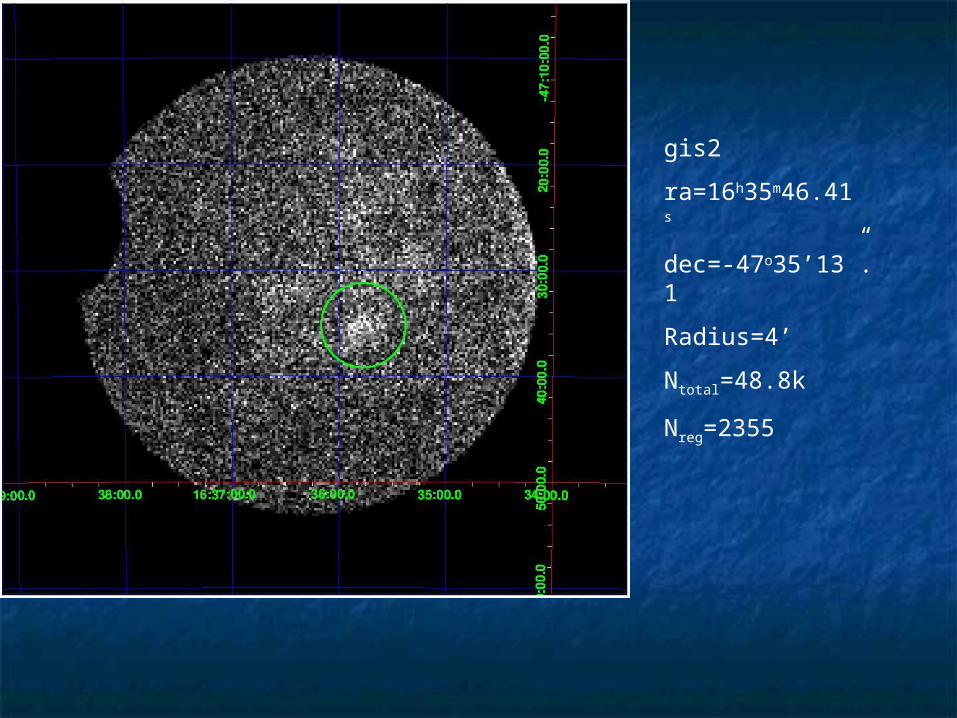
gis2
ra=16h35m46.41s
dec=-47o35’13”.1
Radius=4’
Ntotal=48.8k
Nreg=2355
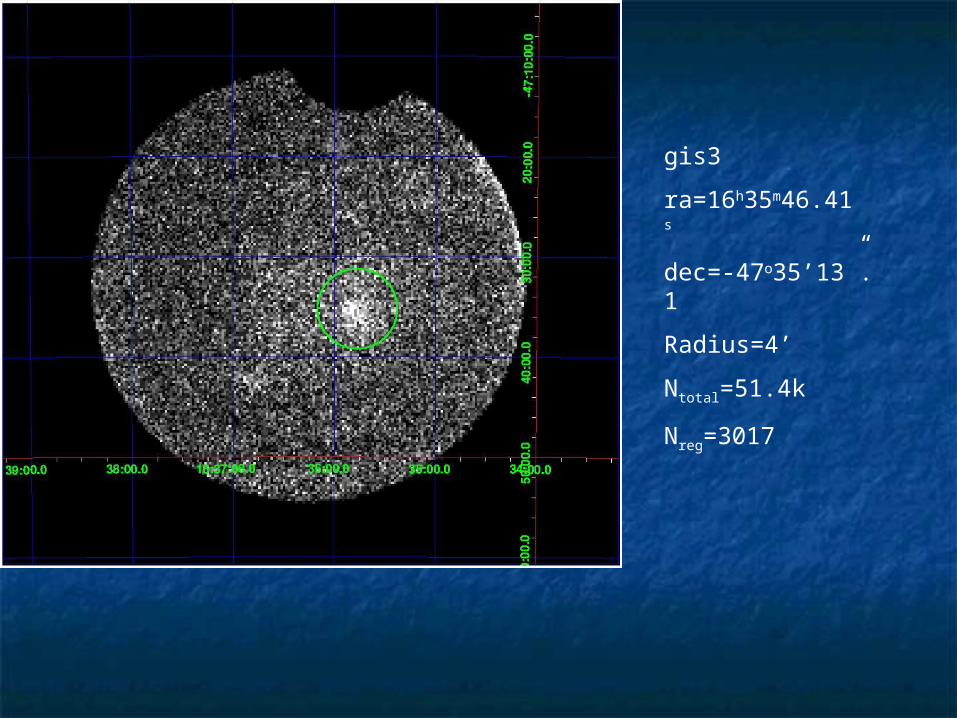
gis3
ra=16h35m46.41s
dec=-47o35’13”.1
Radius=4’
Ntotal=51.4k
Nreg=3017
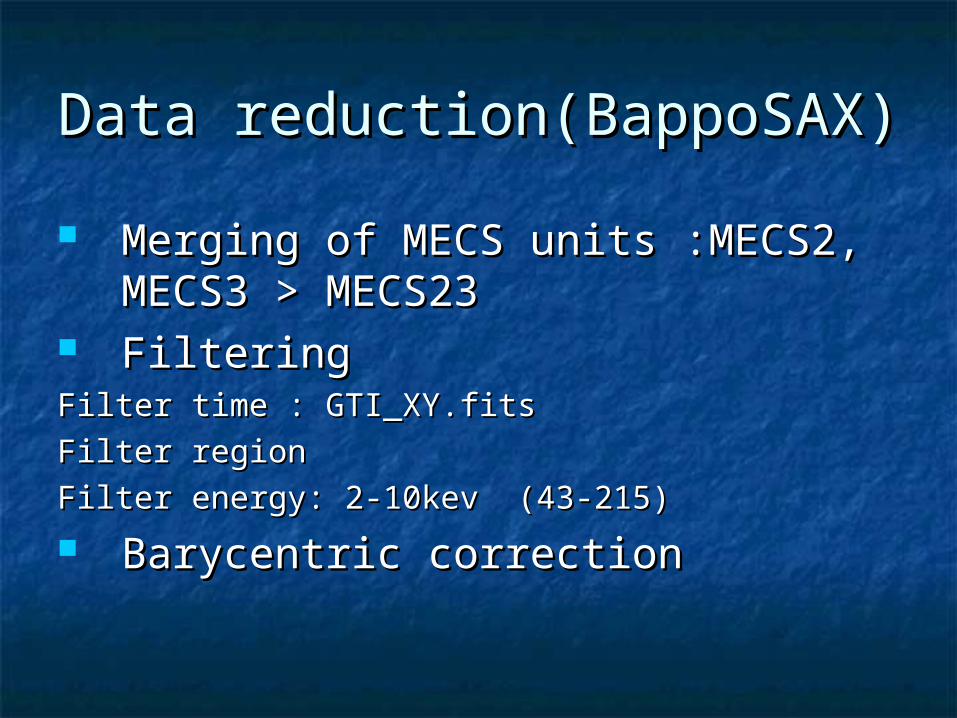
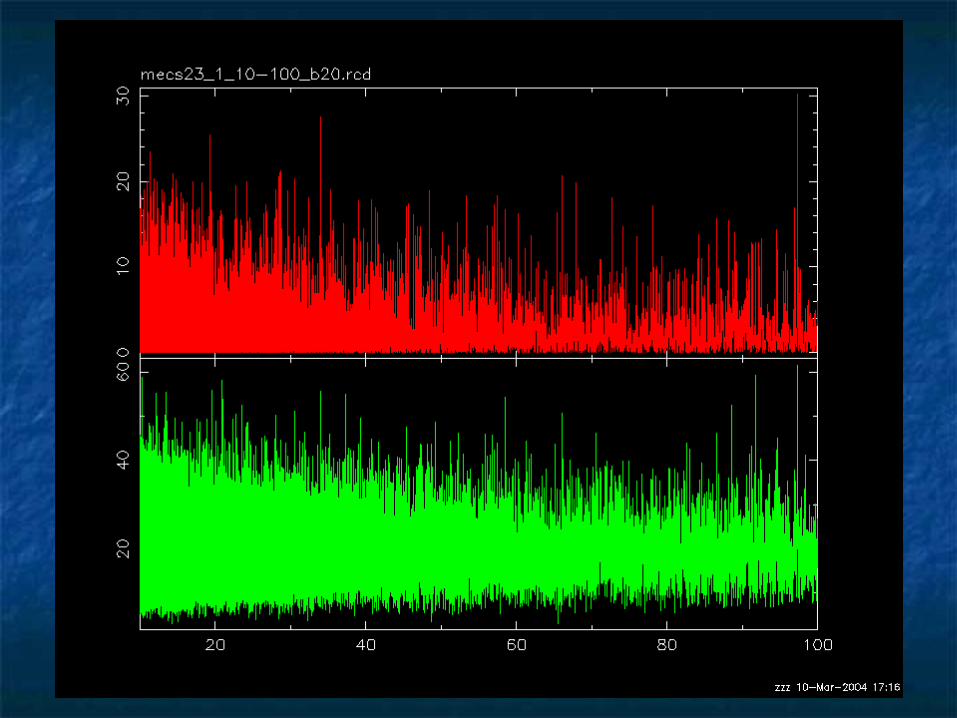
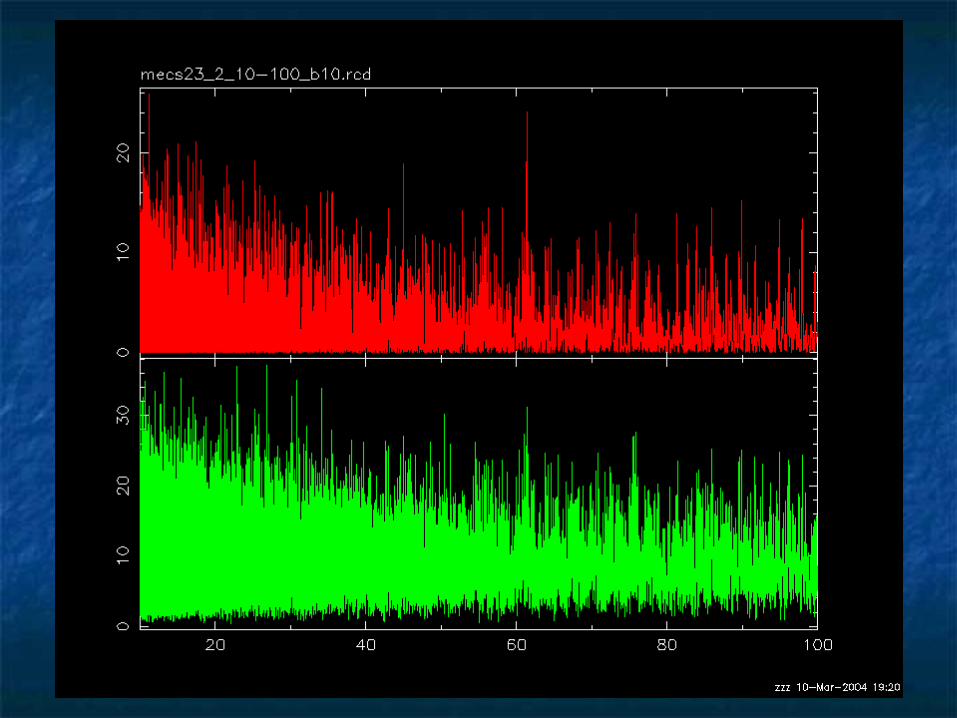
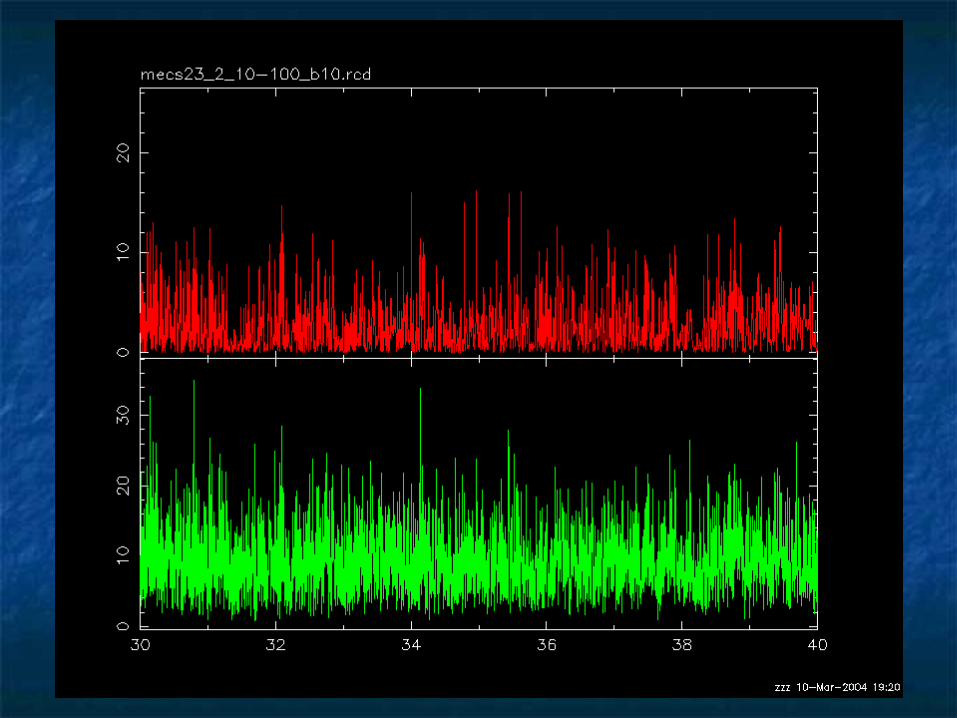
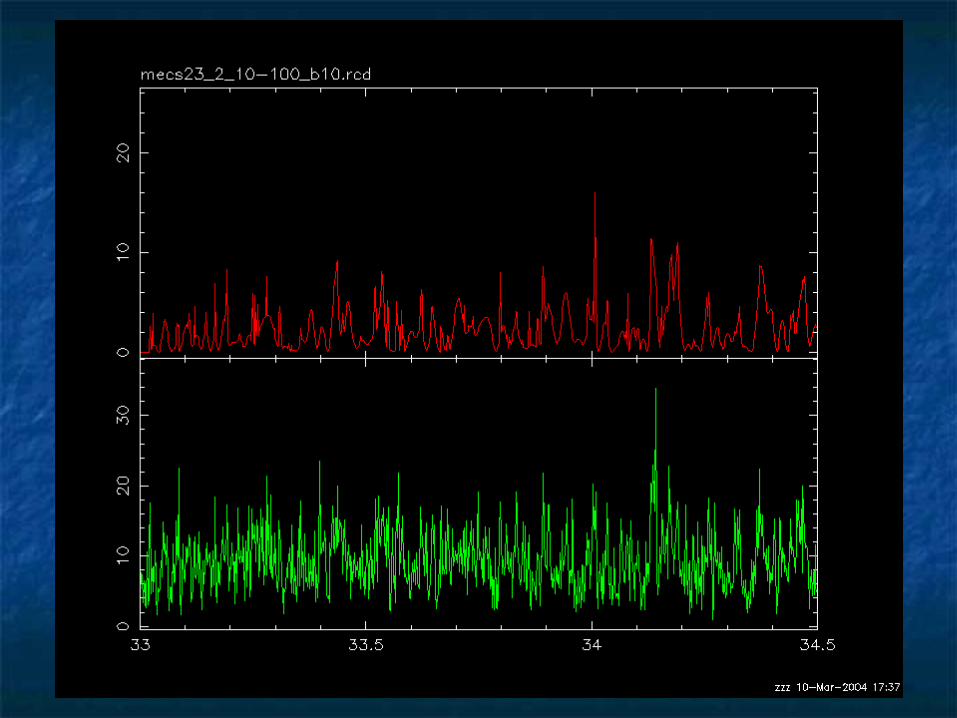
Merging of MECS unitsMerging of MECS units :MECS2, MECS3 :MECS2, MECS3 > MECS23> MECS23
FilteringFilteringFilter time : GTI_XY.fitsFilter time : GTI_XY.fitsFilter regionFilter regionFilter energy: 2-10kev (43-215)Filter energy: 2-10kev (43-215) Barycentric correctionBarycentric correction
Data reduction(BappoSAX)Data reduction(BappoSAX)
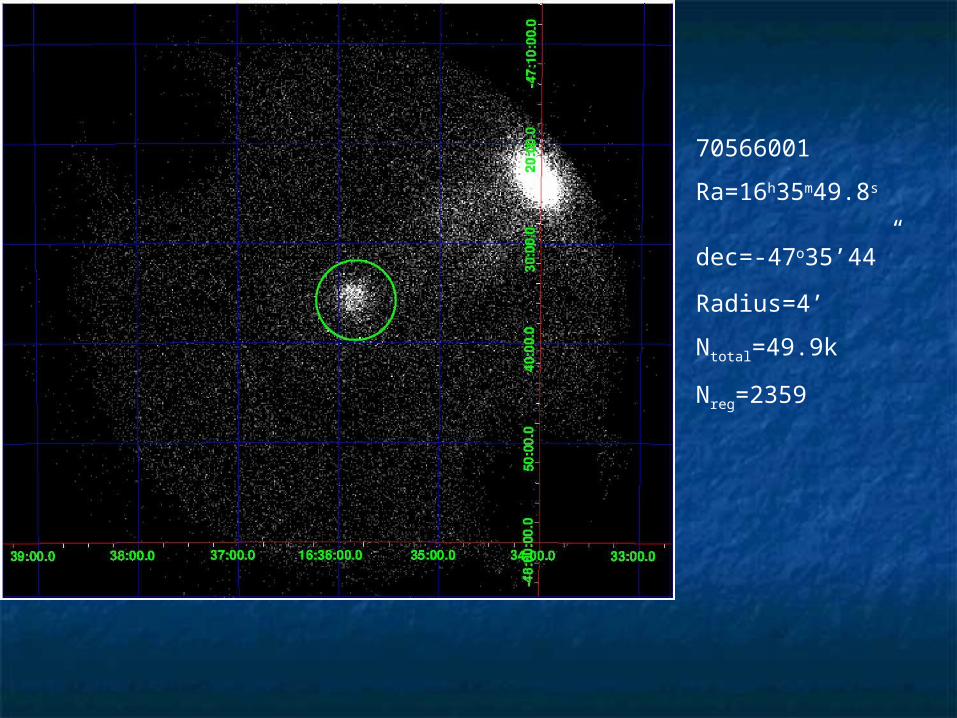
70566001
Ra=16h35m49.8s
dec=-47o35’44” Radius=4’
Ntotal=49.9k
Nreg=2359
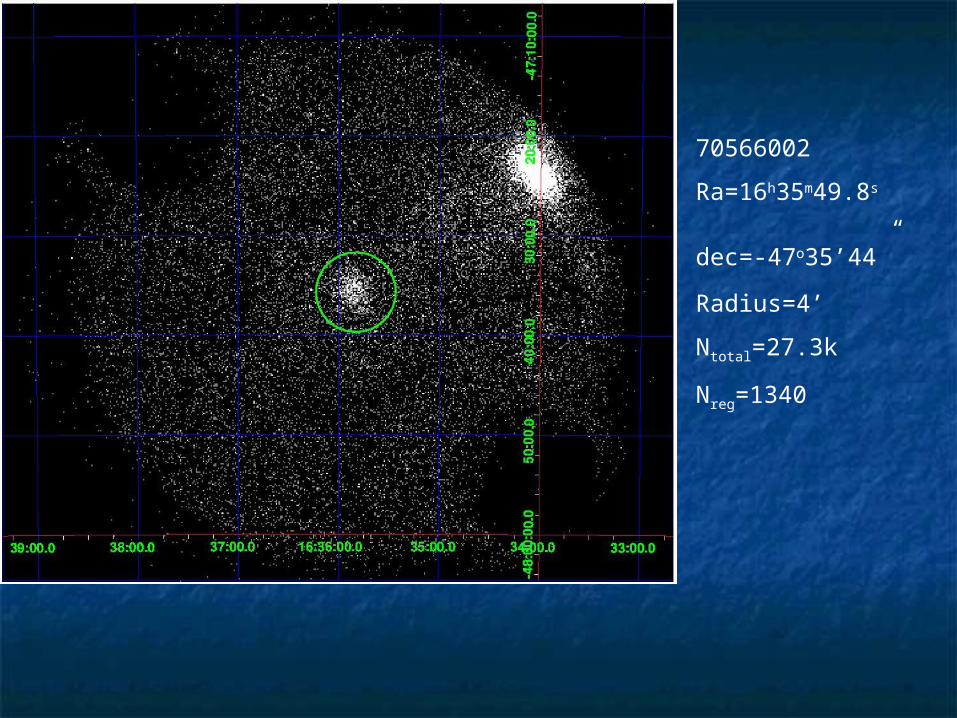
70566002
Ra=16h35m49.8s
dec=-47o35’44” Radius=4’
Ntotal=27.3k
Nreg=1340
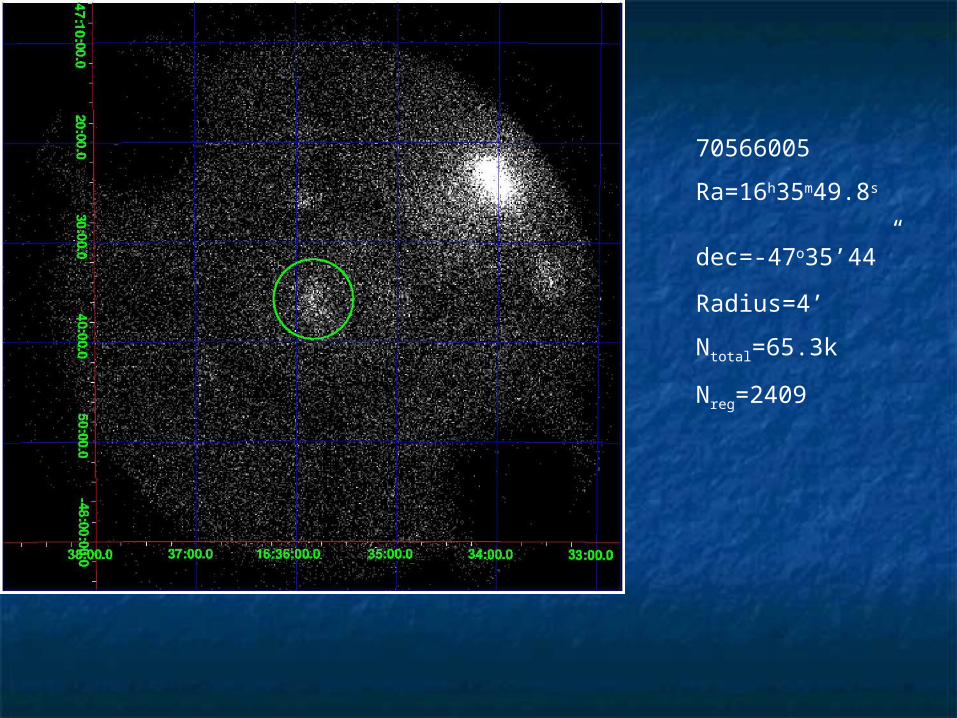
70566005
Ra=16h35m49.8s
dec=-47o35’44” Radius=4’
Ntotal=65.3k
Nreg=2409
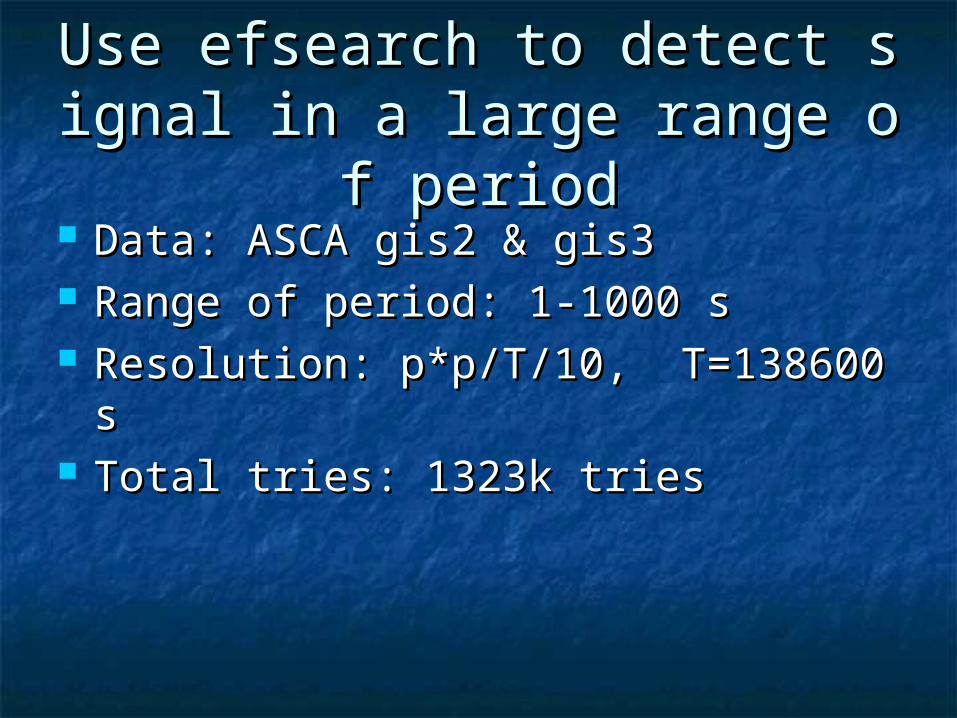
Use efsearch to detect signal iUse efsearch to detect signal in a large range of periodn a large range of period
Data: ASCA gis2 & gis3Data: ASCA gis2 & gis3 Range of period: 1-1000 sRange of period: 1-1000 s Resolution: p*p/T/10, T=138600 sResolution: p*p/T/10, T=138600 s Total tries: 1323k triesTotal tries: 1323k tries
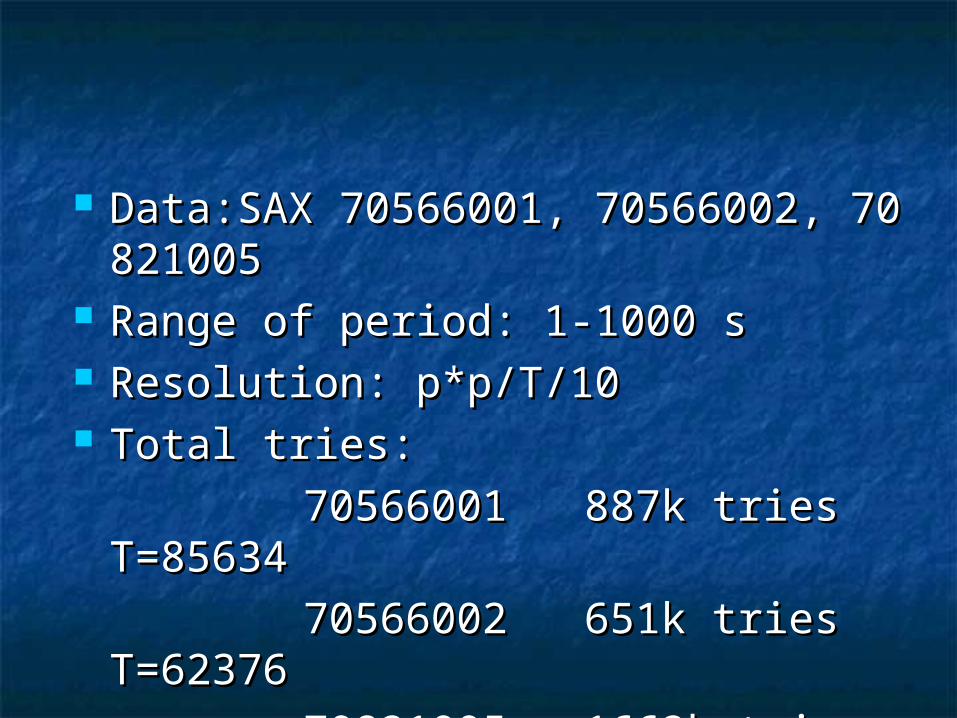
Data:SAX 70566001, 70566002, 70821005Data:SAX 70566001, 70566002, 70821005 Range of period: 1-1000 sRange of period: 1-1000 s Resolution: p*p/T/10Resolution: p*p/T/10 Total tries: Total tries: 70566001 887k tries T=8563470566001 887k tries T=85634 70566002 651k tries T=6237670566002 651k tries T=62376 70821005 1662k tries T=16364270821005 1662k tries T=163642
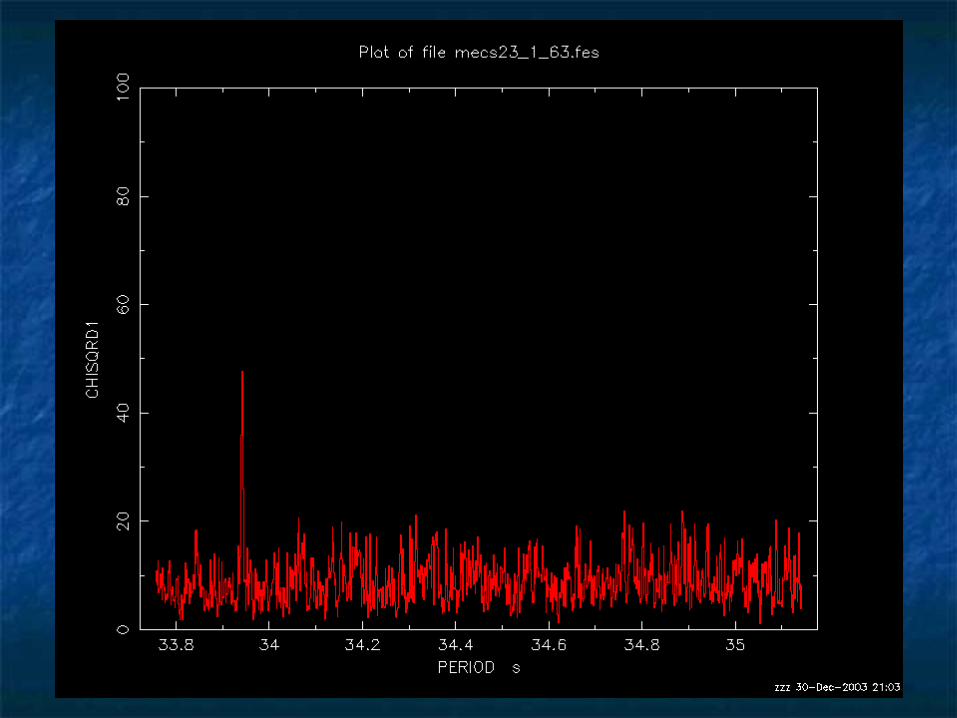
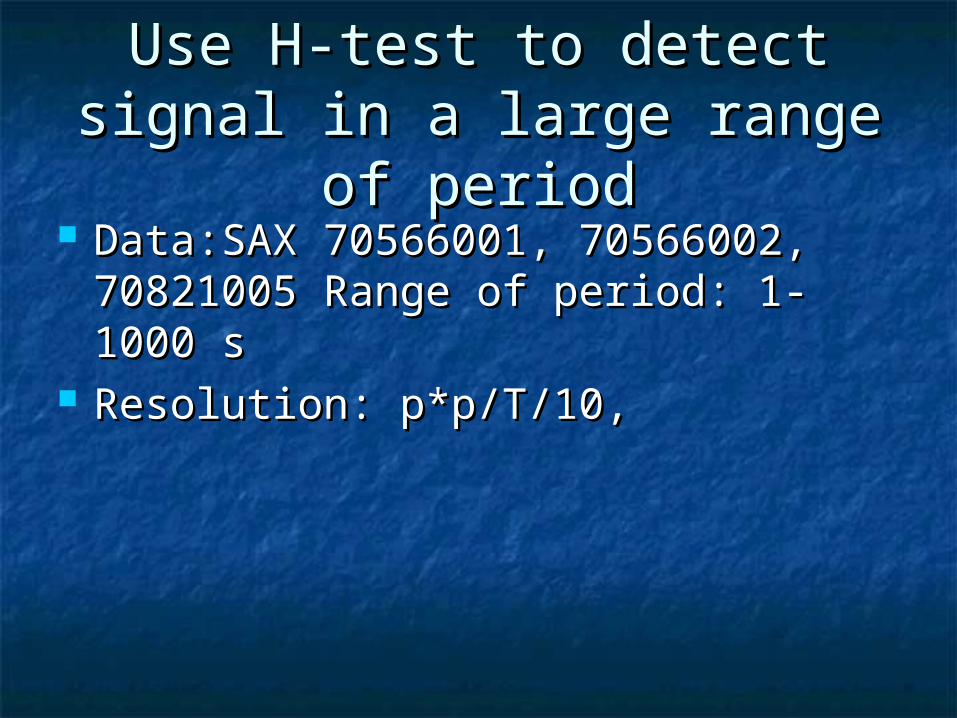
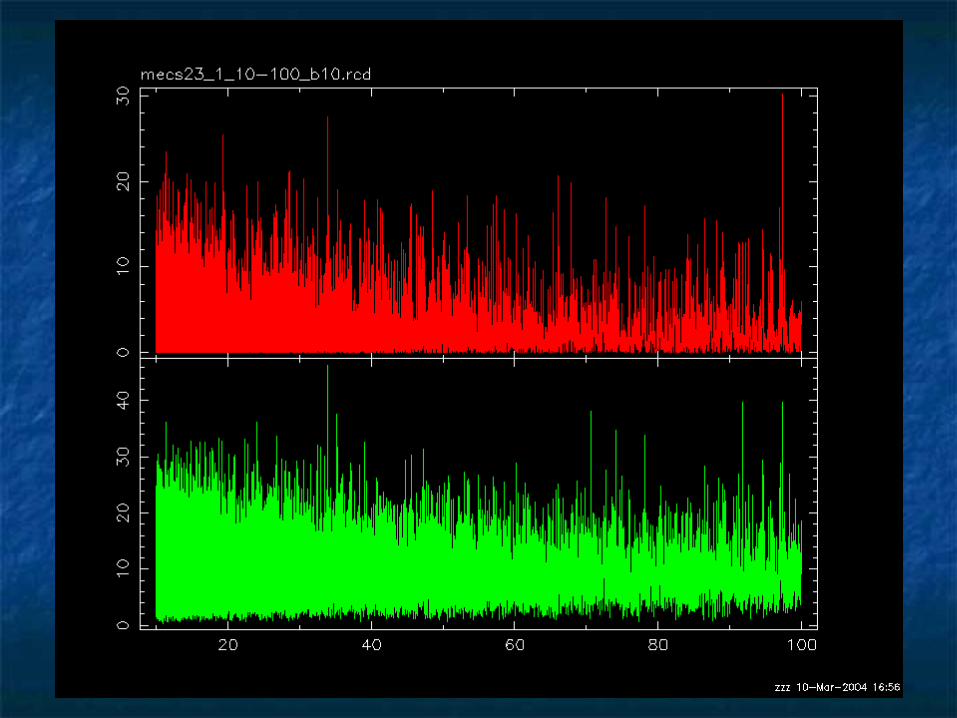
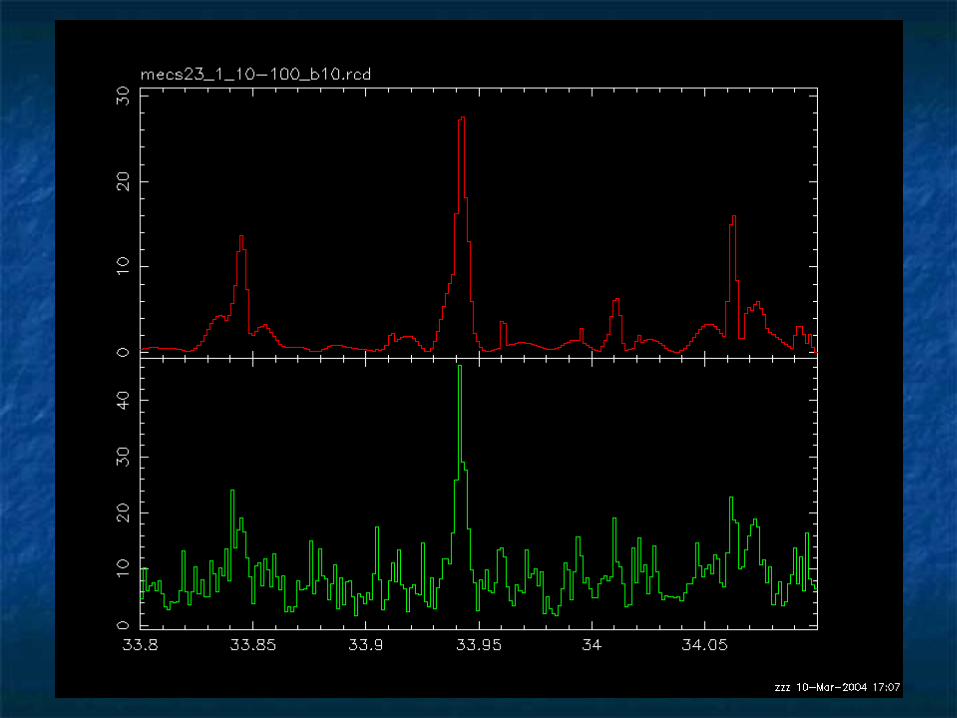
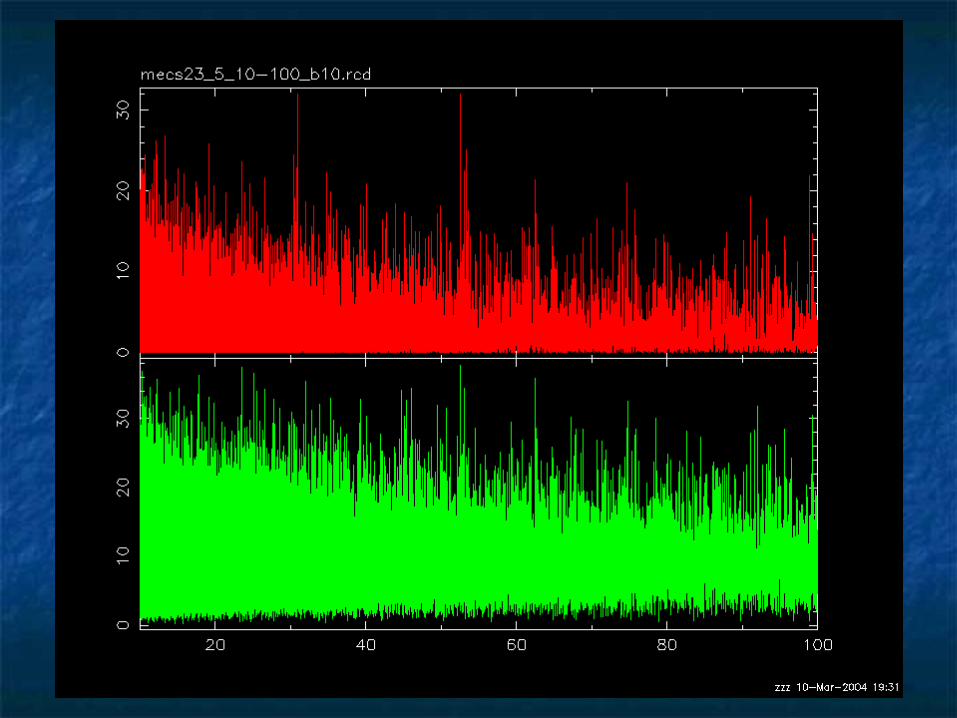
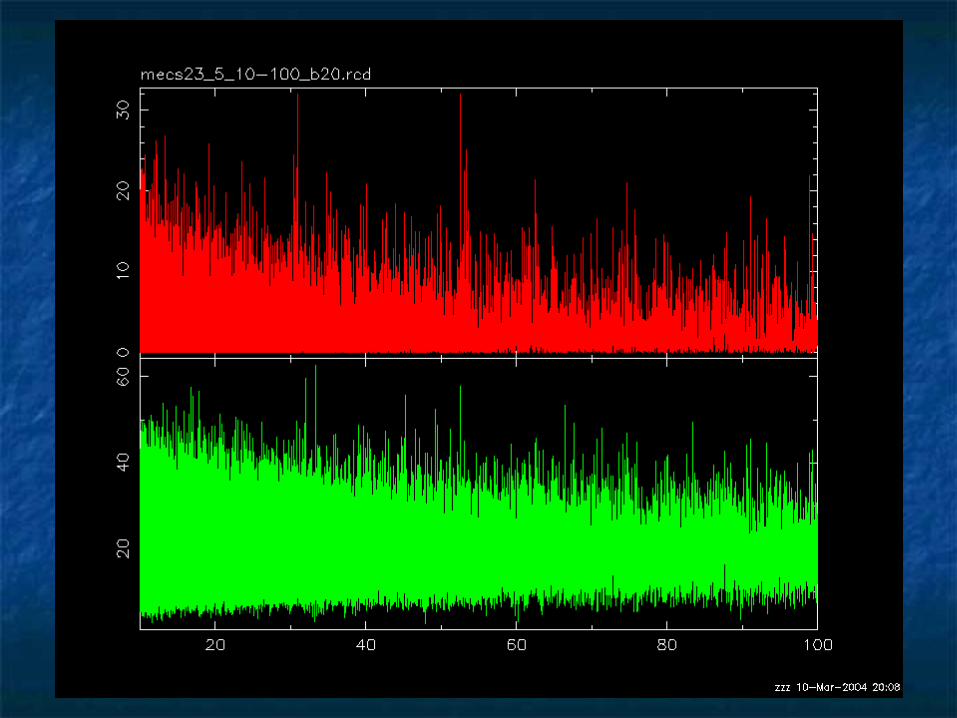
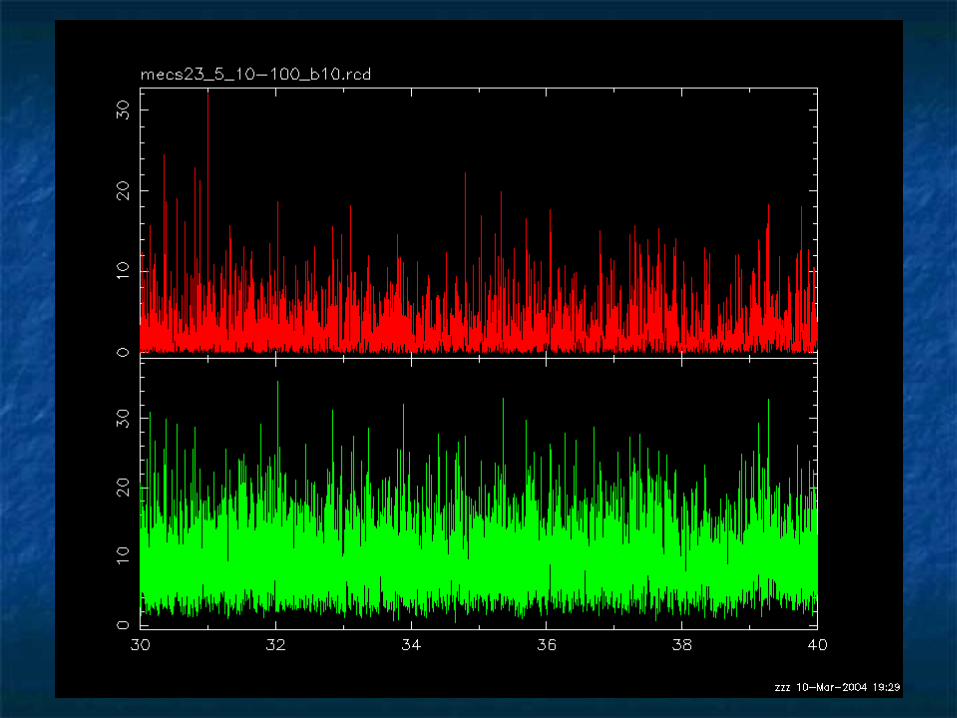
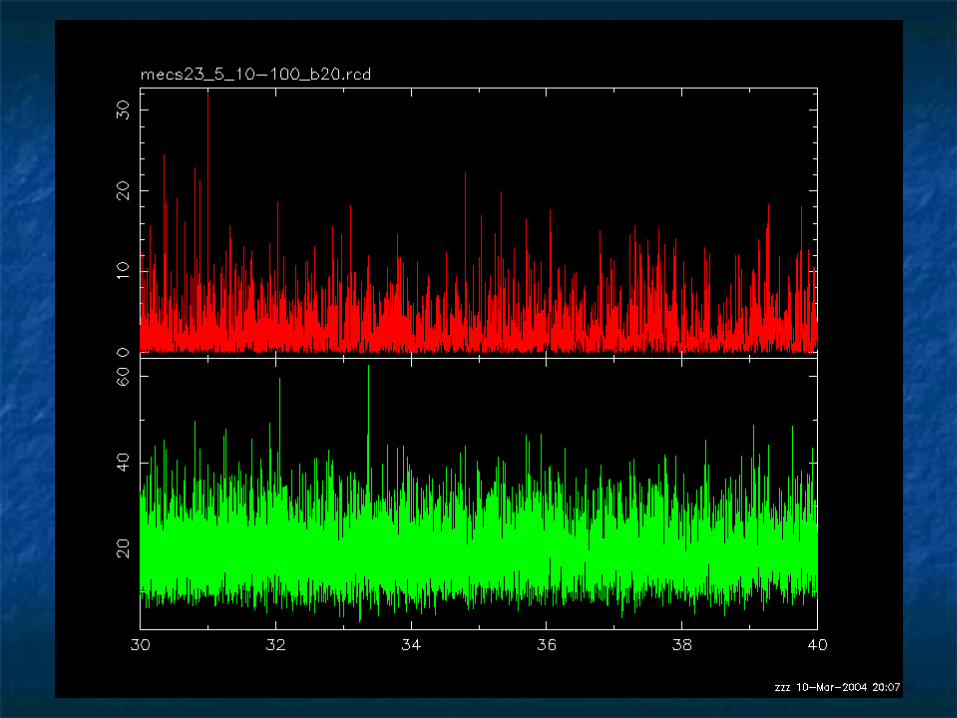
Use H-test to detect signal Use H-test to detect signal in a large range of periodin a large range of period
Data:SAX 70566001, 70566002, Data:SAX 70566001, 70566002, 70821005 Range of period: 1-1000 s70821005 Range of period: 1-1000 s
Resolution: p*p/T/10,Resolution: p*p/T/10,

Future workFuture work
Combine more data: XTE dataCombine more data: XTE data Search other range of period: 0.01-1 Search other range of period: 0.01-1
ss Estimate upper limitEstimate upper limit