Embed Size (px)
Citation preview
Time-varying Model Averaging∗
Yuying Sun1,2,3, Yongmiao Hong4,5, Tae-Hwy Lee6, Shouyang Wang1,2,3 and Xinyu Zhang1,2
1Academy of Mathematics and Systems Science, Chinese Academy of Sciences2Center for Forecasting Science, Chinese Academy of Sciences
3School of Economics and Management, University of Chinese Academy of Sciences4Department of Economics and Department of Statistics Sciences, Cornell University
5MOE Key Laboratory of Econometrics, Xiamen University6Department of Economics, University of California, Riverside
SUMMARY
Structural changes often occur in economics and finance due to changes in preferences,
technologies, institutional arrangements, policies, crises, etc. Improving forecast accuracy of
economic time series with structural changes is a long-standing problem. Model averaging
aims at providing an insurance against selecting a poor forecast model. All existing model
averaging approaches in the literature are designed with constant (non-time-varying) com-
bination weights. Little attention has been paid to time-varying model averaging, which is
more realistic in economics under structural changes. This paper proposes a novel model
averaging estimator which selects optimal time-varying combination weights by minimizing
a local jackknife criterion. It is shown that the proposed time-varying jackknife model av-
eraging (TVJMA) estimator is asymptotically optimal in the sense of achieving the lowest
possible local squared error loss in a class of time-varying model averaging estimators. Un-
der a set of regularity assumptions, the TVJMA estimator is√Th-consistent. A simulation
study and an empirical application highlight the merits of the proposed TVJMA estimator
relative to a variety of popular estimators with constant model averaging weights and model
selection.
KEY WORDS: Asymptotic optimality; Forecast combination; Local stationarity; Model
averaging; Structural change; Time-varying model averaging.
JEL Classification Codes: C2, C13.
∗We thank two referees, an associate editor, Oliver Linton (co-editor), Cheng Hsiao, Qingfeng Liu, Zudi
Lu, Whitney Newey, Aman Ullah, Alan Tze-Kin Wan, and workshop participants at Shanghai University
of Finance and Economics, UC Riverside, 2nd International Conference on Econometrics and Statistics
(EcoSta 2018) at Hong Kong, 4th Guangzhou Econometrics Workshop, and 2nd Annual Forum for Chinese
Econometricians at Beijing for their comments and suggestions. All remaining errors are solely ours. We
acknowledge financial support from National Natural Science Foundation of China (No. 71703156) and
Fujian Provincial Key Laboratory of Statistics, Xiamen University (No. 201601).
1
1 Introduction
Structural instability is a long-standing problem in time series econometrics (e.g., Stock &
Watson (1996, 2002, 2005), Rossi (2006), and Rossi & Sekhposyan (2011)). Macroeconomic
and financial time series, especially over a long period, are likely to be affected by structural
instability due to changes in preferences, technologies, policies, crises, etc. For example,
Stock & Watson (1996) find substantial instability in 76 representative US monthly post-
war macroeconomic time series. Rossi & Sekhposyan (2011) argue that due to structural
breaks, most forecast models for output growth lost their predictive ability in the mid-1970s,
and became essentially useless over the last two decades. In finance, Welch & Goyal (2008)
confirm that the predictive regressions of excess stock returns perform poorly in out-of-
sample forecast of the U.S. equity premium, and Rapach & Zhou (2013) argue that model
instability and uncertainty seriously impair the forecasting ability of individual predictive
regression models. In labor economics, Hansen (2001) finds “strong evidence of a structural
break in U.S. labor productivity between 1992 and 1996, and weaker evidence of a structural
break in the 1960s and the early 1980s”. Thus, it is crucial to take into account such model
instability and uncertainty in economic forecasting.
An approach to reducing the adverse impact of model instability and uncertainty is model
averaging, which compromises across the competing models and yields an insurance against
selecting a poor model. There has existed a relatively large literature on Bayesian model
averaging; see Hoeting et al. (1999) for a comprehensive review. In recent years, frequentist
model averaging has received growing attention in econometrics and statistics (e.g., Buckland
et al. (1997), Yang (2001), Hjort & Claeskens (2003), Yuan & Yang (2005), Hansen (2007,
2008), Wan et al. (2010), Liu & Okui (2013), Liu (2015)). Most of the works focus on model
averaging weights determination, related inference, and asymptotic optimality. Recently,
Hansen & Racine (2012) have proposed a jackknife model averaging (JMA) which selects
model averaging weights by minimizing a cross-validation criterion. The advantage of the
JMA estimator mainly lies in that the asymptotic optimality theory is established under
heteroskedastic error settings. Zhang et al. (2013) broaden Hansen & Racine’s (2012) scope
of asymptotic optimality of the JMA estimator to encompass models with a non-spherical
error covariance structure and lagged dependent variables, thus allowing for dependent data
and dynamic regression models.
However, a potential problem with the aforementioned model averaging approaches is
that, one predictive regression model may yield the best forecast in one period but can be
dominated by other models in another period. This implies that optimal model averaging
weights should change over time. There are various reasons for adopting this potentially
useful time-varying approach. First, a time series model may suffer from structural instability
in economics and finance. Therefore, as Stock & Watson (2003) point out, a predictor
useful in one period does not guarantee its forecasting performance in other periods. The
2
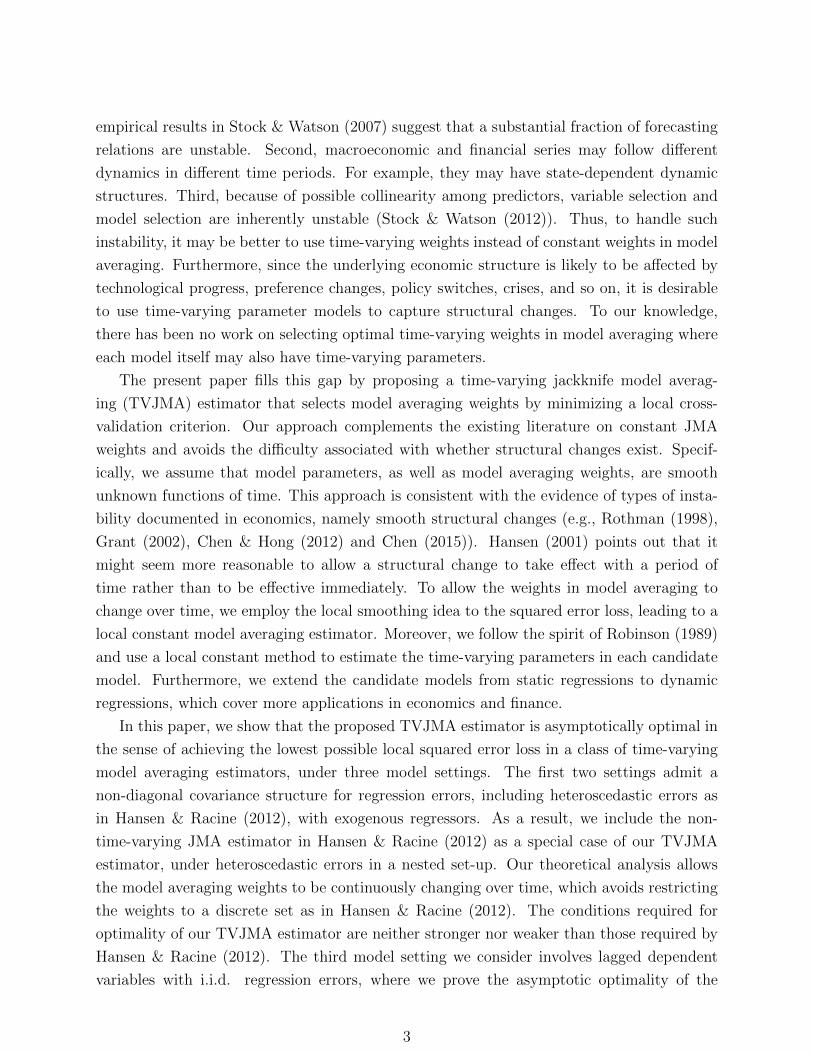
empirical results in Stock & Watson (2007) suggest that a substantial fraction of forecasting
relations are unstable. Second, macroeconomic and financial series may follow different
dynamics in different time periods. For example, they may have state-dependent dynamic
structures. Third, because of possible collinearity among predictors, variable selection and
model selection are inherently unstable (Stock & Watson (2012)). Thus, to handle such
instability, it may be better to use time-varying weights instead of constant weights in model
averaging. Furthermore, since the underlying economic structure is likely to be affected by
technological progress, preference changes, policy switches, crises, and so on, it is desirable
to use time-varying parameter models to capture structural changes. To our knowledge,
there has been no work on selecting optimal time-varying weights in model averaging where
each model itself may also have time-varying parameters.
The present paper fills this gap by proposing a time-varying jackknife model averag-
ing (TVJMA) estimator that selects model averaging weights by minimizing a local cross-
validation criterion. Our approach complements the existing literature on constant JMA
weights and avoids the difficulty associated with whether structural changes exist. Specif-
ically, we assume that model parameters, as well as model averaging weights, are smooth
unknown functions of time. This approach is consistent with the evidence of types of insta-
bility documented in economics, namely smooth structural changes (e.g., Rothman (1998),
Grant (2002), Chen & Hong (2012) and Chen (2015)). Hansen (2001) points out that it
might seem more reasonable to allow a structural change to take effect with a period of
time rather than to be effective immediately. To allow the weights in model averaging to
change over time, we employ the local smoothing idea to the squared error loss, leading to a
local constant model averaging estimator. Moreover, we follow the spirit of Robinson (1989)
and use a local constant method to estimate the time-varying parameters in each candidate
model. Furthermore, we extend the candidate models from static regressions to dynamic
regressions, which cover more applications in economics and finance.
In this paper, we show that the proposed TVJMA estimator is asymptotically optimal in
the sense of achieving the lowest possible local squared error loss in a class of time-varying
model averaging estimators, under three model settings. The first two settings admit a
non-diagonal covariance structure for regression errors, including heteroscedastic errors as
in Hansen & Racine (2012), with exogenous regressors. As a result, we include the non-
time-varying JMA estimator in Hansen & Racine (2012) as a special case of our TVJMA
estimator, under heteroscedastic errors in a nested set-up. Our theoretical analysis allows
the model averaging weights to be continuously changing over time, which avoids restricting
the weights to a discrete set as in Hansen & Racine (2012). The conditions required for
optimality of our TVJMA estimator are neither stronger nor weaker than those required by
Hansen & Racine (2012). The third model setting we consider involves lagged dependent
variables with i.i.d. regression errors, where we prove the asymptotic optimality of the
3
TVJMA estimator by allowing the regressors to be locally stationary, in the sense of Ing &
Wei (2003) and Vogt (2012).
In a simulation study and an empirical application, we compare forecast performance of
the TVJMA estimator with several other model averaging estimators, including the Mallow
model averaging (MMA) of Hansen (2007), JMA, a smoothed Akaike information crite-
rion (SAIC) model averaging (Buckland et al. (1997)), a smoothed Bayesian information
criterion (SBIC) model averaging, a nonparametric version of bias-corrected AIC model se-
lection (Cai & Tiwari (2000), AICc), and a smoothed AICc (SAICc) model averaging. It is
documented that for various structural changes, our TVJMA estimator outperforms these
competing estimators under strictly exogenous regressors with ARMA and GARCH-type
errors. Additionally, for dynamic models, the TVJMA estimator remains to be superior to
other estimators under consideration.
Compared with the existing model averaging literature, our proposed approach has a
number of appealing features. First, we extend conventional constant weight model averaging
to time-varying weight model averaging. In particular, we propose a novel time-varying
jackknife model averaging approach by exploring local information at each time point instead
of over the whole sample period. The TVJMA weights selected by our method are allowed
to change smoothly over time, which is consistent with evolutionary instability of economic
relationships. Our result includes the constant JMA estimator in Hansen & Racine (2012)
as a special case. Second, we also allow parameters in each candidate model to change
smoothly over time. A nonparametric approach is used to estimate the time-varying model
parameters, avoiding a potentially misspecified functional form of time-varying parameters
by any parametric approach (e.g., time-varying smooth transition regression). Third, we
allow regressors to be locally stationary (Dahlhaus (1996, 1997), Vogt (2012)), and as a result,
time-varying parameter dynamic regression models (e.g., time-varying parameter models
with lagged dependent variables) can be included as candidate models.
The remainder of this paper is organized as follows. Section 2 introduces the local
jackknife criterion and develops the asymptotic optimality theory of the proposed TVJMA
estimator for a general nonlinear model with heteroscedasticity. In Section 3, we consider
a special class of local constant TVJMA estimators for a time-varying parameter model.
Section 4 develops an asymptotic optimality theory of the TVJMA estimator for a time-
varying parameter regression model with lagged dependent variables. Section 5 presents a
simulation study under constant and time-varying parameter linear regressions respectively.
Section 6 examines the empirical forecast performance of the TVJMA estimator for S&P 500
stock returns. Section 7 concludes. Throughout, all convergences occur when the sample
size T →∞. All mathematical proofs are given in an Online Appendix.
4
2 Model Averaging Estimator
We consider a general nonlinear data generating process (DGP)
Yt = µt + εt = ft(Xt) + εt, t = 1, · · · , T, (1)
where Yt is a dependent variable, Xt = (X1t, X2t, · · · ) is possibly countably infinite, εt is
an unobservable disturbance with E(εt|Xt) = 0 almost surely (a.s.), ft(x) is an unknown
smooth function of time t, and T is the sample size. Note that when the functional form of
ft(·) is known up to some finite dimensional parameters, e.g., ft(x) = x′βt, the conditional
mean of Yt given Xt is parametrically specified, where parameter βt is possibly time-varying.
A time-varying parameter regression with ft(x) = x′βt will be considered in Section 3. The
conventional constant parameter linear models are included as a special case if we assume
that ft(·) = f(·) is linear. When the functional form of ft(·) is unknown, we can estimate
ft(·) using nonparametric methods, such as the Nadaraya-Watson estimator or the local lin-
ear estimator. For notational simplicity, we let Y = (Y1, · · · , YT )′, µ = (µ1, · · · , µT )′ and
X = (X ′1, X′2, · · · , X ′T )′. Furthermore, we assume that E(ε|X) = 0 where ε = (ε1, · · · , εT )′
so that µ = E(Y|X). We denote var(ε|X) = Ω, where Ω is a positive definite symmetric ma-
trix. This setup allows a non-diagonal covariance structure for regression errors. Therefore,
heteroscedastic and autocorrelated errors are allowed.
2.1 Model Framework and Jackknife Criterion
Consider a sequence of candidate models indexed by m = 1, · · · ,MT , which are allowed to be
misspecified for the underlying DGP. The number of models, MT , may depend on the sample
size T . For different models, explanatory variables may be different. Let µ1, · · · , µMT be
a set of nonparametric estimators of µ. Specifically, for the m-th model, the estimator of µ
may be written as µm = PmY, where Pm is a T ×T matrix, which depends on both Kt and
X but not on Y. For instance, Pm is defined in (18) below when a local constant estimator
is used, and so µm is a local estimator for the conditional mean. For each time t = 1, · · · , T ,
let w = (w1, · · · , wMT )′ be a weight vector which satisfies
HT =
w ∈ [0, 1]MT :
MT∑m=1
wm = 1
. (2)
Given w, an averaging estimator at any time point t for the conditional mean is
µt(w) ≡MT∑m=1
wmµmt =
MT∑m=1
wmetPmY = etP(w)Y, (3)
where et is a 1×T vector, in which the t-th element is 1 and all others are zero, µmt = etPmY
and P(w) =∑MT
m=1wmPm. Then the model averaging estimator of µ can be fitted as
µ(w) = (µ1(w), · · · , µT (w))′.
5
Denote µm = (µm1 , · · · , µmT )′ as the jackknife estimator of µ for the m-th model, where µmtis the estimator µmt obtained with the t-th observation (Yt,Xt) removed from the sample, the
so-called “leave-one-out” estimator. Then, we obtain µm = PmY, where Pm has zeros on
the diagonal and depends on Kt and X; see (19) below for an example in a special setup. The
jackknife model averaging estimator of µt, which smooths across the MT jackknife estimators
at time point t, is obtained as
µt(w) =
MT∑m=1
wmµmt = et
MT∑m=1
wmPmY = etP(w)Y, (4)
where P(w) =∑MT
m=1wmPm.
Set µ(w) = (µ1(w), · · · , µT (w))′. Let Kt = diagk1t, · · · , kTt, where kst = k( s−tTh
), the
kernel k(·) : [−1, 1]→ R+ is a prespecified symmetric probability density, and h ≡ h(T ) is a
bandwidth which depends on the sample size T such that h → 0 and Th → ∞ as T → ∞.
We shall minimize the local cross-validation (CV) squared error criterion,
CVt,T (w) = (Y − µ(w))′Kt(Y − µ(w)). (5)
We obtain the optimal time-varying weight vector wt = argminw∈HTCVt,T (w), which mini-
mizes CVt,T (w). The TVJMA estimator of µt for any given time point t is µt(wt).
The jackknife (or CV) criterion is widely used in selecting regression models (e.g., Allen
(1974), Stone (1974) and Geisser (1975)), and the asymptotic optimality of model selection
using the CV criterion is established by Li (1987) for homoskedastic regression and by An-
drews (1991) for heteroskedastic regression, respectively. In this paper, the CV criterion
defined above is locally weighted by Kt at each time point. This local CV criterion chooses
the optimal weights by generating the smallest CV value over the local sample leaving out
the observation (Xt, Yt) at time t. Thus, the time-varying weight vector wt is essentially
a constant weight in the neighborhood of any fixed time point t, which combines different
models to yield the lowest local squared error loss.
Note that there are two key differences between our TVJMA estimator and the JMA esti-
mators proposed by Hansen & Racine (2012) and Zhang et al. (2013). One major difference
is that we allow the model averaging weights to change with time smoothly. In contrast,
Hansen & Racine (2012) and Zhang et al. (2013) restrict the weights to be constant in a
discrete set or a continuous set. We extend constant wights to time-varying weights, which
can accommodate time-varying predictive power of candidate models. Another difference
is that the models in Hansen & Racine (2012) and Zhang et al. (2013) are linear regres-
sions, while in the present paper, ft(·) can be nonlinear, and parameters in each candidate
model are allowed to be unknown smooth functions of time. Theoretically, we establish the
asymptotic optimality of the TVJMA estimator based on a set of smoothly time-varying pa-
rameter models. Simulation studies show that the proposed TVJMA estimator outperforms
6
the existing model averaging methods in the presence of smooth structural changes as well
as recurrent breaks.
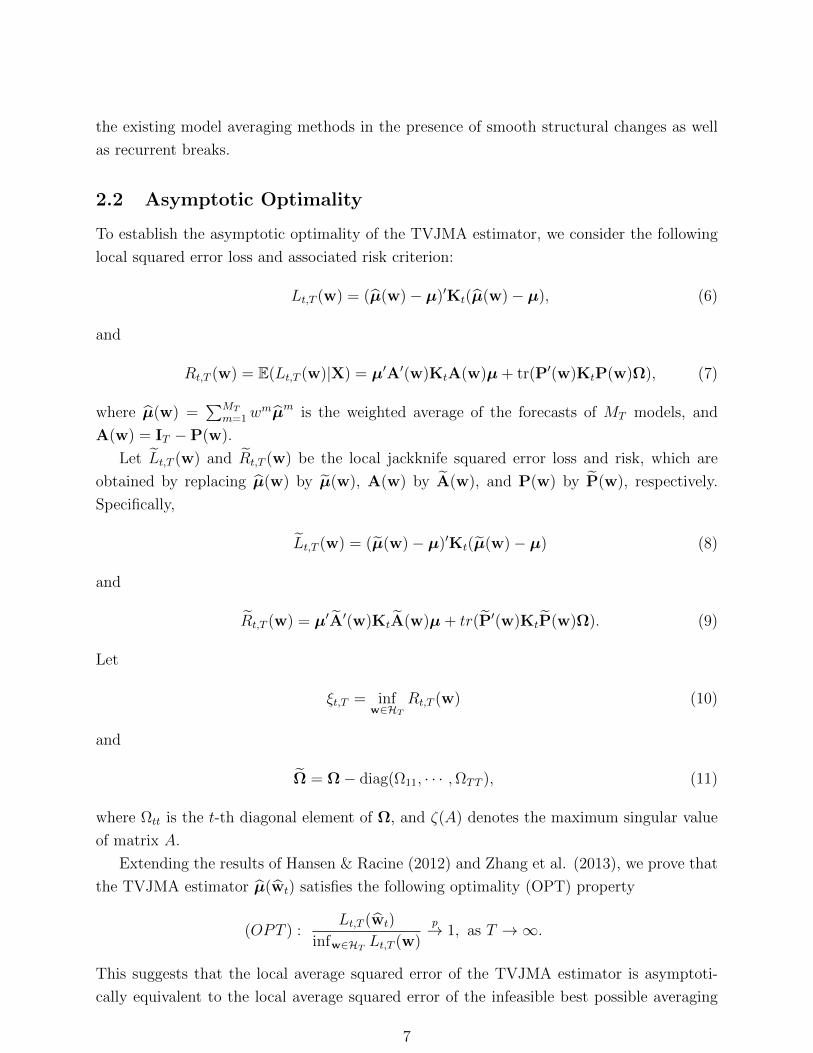
2.2 Asymptotic Optimality
To establish the asymptotic optimality of the TVJMA estimator, we consider the following
local squared error loss and associated risk criterion:
Lt,T (w) = (µ(w)− µ)′Kt(µ(w)− µ), (6)
and
Rt,T (w) = E(Lt,T (w)|X) = µ′A′(w)KtA(w)µ+ tr(P′(w)KtP(w)Ω), (7)
where µ(w) =∑MT
m=1wmµm is the weighted average of the forecasts of MT models, and
A(w) = IT −P(w).
Let Lt,T (w) and Rt,T (w) be the local jackknife squared error loss and risk, which are
obtained by replacing µ(w) by µ(w), A(w) by A(w), and P(w) by P(w), respectively.
Specifically,
Lt,T (w) = (µ(w)− µ)′Kt(µ(w)− µ) (8)
and
Rt,T (w) = µ′A′(w)KtA(w)µ+ tr(P′(w)KtP(w)Ω). (9)
Let
ξt,T = infw∈HT
Rt,T (w) (10)
and
Ω = Ω− diag(Ω11, · · · ,ΩTT ), (11)
where Ωtt is the t-th diagonal element of Ω, and ζ(A) denotes the maximum singular value
of matrix A.
Extending the results of Hansen & Racine (2012) and Zhang et al. (2013), we prove that
the TVJMA estimator µ(wt) satisfies the following optimality (OPT) property
(OPT ) :Lt,T (wt)
infw∈HTLt,T (w)
p→ 1, as T →∞.
This suggests that the local average squared error of the TVJMA estimator is asymptoti-
cally equivalent to the local average squared error of the infeasible best possible averaging
7
estimator. This optimality property is the same as that in Zhang et al. (2013), except that
we now allow the weights to change smoothly over time.
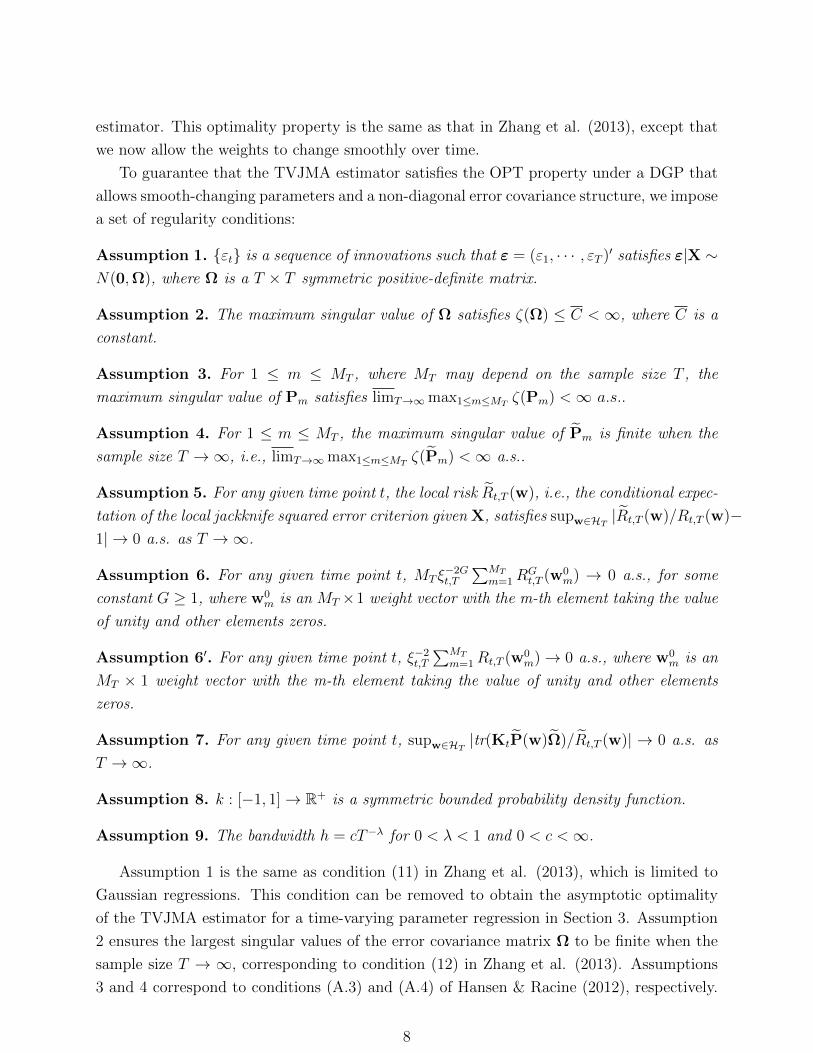
To guarantee that the TVJMA estimator satisfies the OPT property under a DGP that
allows smooth-changing parameters and a non-diagonal error covariance structure, we impose
a set of regularity conditions:
Assumption 1. εt is a sequence of innovations such that ε = (ε1, · · · , εT )′ satisfies ε|X ∼N(0,Ω), where Ω is a T × T symmetric positive-definite matrix.
Assumption 2. The maximum singular value of Ω satisfies ζ(Ω) ≤ C <∞, where C is a
constant.
Assumption 3. For 1 ≤ m ≤ MT , where MT may depend on the sample size T , the
maximum singular value of Pm satisfies limT→∞max1≤m≤MTζ(Pm) <∞ a.s..
Assumption 4. For 1 ≤ m ≤ MT , the maximum singular value of Pm is finite when the
sample size T →∞, i.e., limT→∞max1≤m≤MTζ(Pm) <∞ a.s..
Assumption 5. For any given time point t, the local risk Rt,T (w), i.e., the conditional expec-
tation of the local jackknife squared error criterion given X, satisfies supw∈HT|Rt,T (w)/Rt,T (w)−
1| → 0 a.s. as T →∞.
Assumption 6. For any given time point t, MT ξ−2Gt,T
∑MT
m=1RGt,T (w0
m) → 0 a.s., for some
constant G ≥ 1, where w0m is an MT ×1 weight vector with the m-th element taking the value
of unity and other elements zeros.
Assumption 6′. For any given time point t, ξ−2t,T∑MT
m=1Rt,T (w0m)→ 0 a.s., where w0
m is an
MT × 1 weight vector with the m-th element taking the value of unity and other elements
zeros.
Assumption 7. For any given time point t, supw∈HT|tr(KtP(w)Ω)/Rt,T (w)| → 0 a.s. as
T →∞.
Assumption 8. k : [−1, 1]→ R+ is a symmetric bounded probability density function.
Assumption 9. The bandwidth h = cT−λ for 0 < λ < 1 and 0 < c <∞.
Assumption 1 is the same as condition (11) in Zhang et al. (2013), which is limited to
Gaussian regressions. This condition can be removed to obtain the asymptotic optimality
of the TVJMA estimator for a time-varying parameter regression in Section 3. Assumption
2 ensures the largest singular values of the error covariance matrix Ω to be finite when the
sample size T → ∞, corresponding to condition (12) in Zhang et al. (2013). Assumptions
3 and 4 correspond to conditions (A.3) and (A.4) of Hansen & Racine (2012), respectively.
8
Both of them are rather mild, because typical estimators satisfy the regularity conditions
that the maximum singular values of the corresponding matrixes are bounded.
Assumption 5 imposes the condition that the leave-one-out estimator is asymptotically
equivalent to the local risk of the regular estimator µ(w), uniformly over the class of av-
eraging estimators. This is a standard condition for the application of cross-validation and
almost the same as condition (10) in Zhang et al. (2013), except that the continuous time-
varying set HT is used here instead of the continuous constant set Hn in Zhang et al. (2013).
In Section 3, we will consider time-varying parameter regressions as candidate models, where
Assumption 5 is ensured by more primitive conditions; see (A.18) in Appendix.
Assumption 6 requires MT
∑MT
m=1RGt,T (w0
m)→∞ at a rate slower than ξ2Gt,T →∞ as T →∞. Assumption 6′ is weaker than Assumption 6, when G is set to 1. To gain further insight
into Assumptions 6 and 6′, we define ηt,T = max1≤m≤MTRt,T (w0
m). Then, we obtain more
primitive conditions for Assumptions 6 and 6′ that M2T ξ−2Gt,T ηGt,T → 0 a.s. and MT ξ
−2t,Tηt,T → 0
a.s., respectively. These conditions restrict the rates of MT →∞, ξt,T →∞ and ηt,T →∞; in
particular they require that the infimum risk ξt,T explode quickly enough and the maximum
risk of an individual model do not explode very quickly. Note that ξt,T → ∞ is obviously
necessary for Assumptions 6 and 6′ to hold, which is pointed out by Hansen (2007) that
this is no finite approximating model for which the bias is zero in linear regression as well
as nonparametric regression. Like Ando & Li (2014), we consider a case with ξt,T ∼ T 1−δ
for δ < 1/2. From Assumptions 2, 3 and 8, we can obtain ηt,T = Op(T ). Given ξt,T → ∞with the rate T 1−δ, MT → ∞ with a slower rate than TG−δG and ηt,T = Op(T ), and so
Assumptions 6 and 6′ hold. Assumption 6 is required for the asymptotic optimality of all
MMA and JMA estimators; see more discussions in Wan et al. (2010) and Zhang et al.
(2013).
Assumption 7 restricts the correlation strength among unobservable disturbances and
can be removed when disturbances are not correlated. Under the set-up of linear DGP,
Assumption 7 can be simplified to supw∈HT|tr(P(w)Ω)/Rt,T (w)| → 0 a.s. as T → ∞,
which is the same as condition (14) in Zhang et al. (2013). If all candidate models are linear
regressions with constant parameters, it can be shown that supw∈HT|tr(P(w)Ω)/Rt,T (w)| ≤
ξ−1t,Tγmax1≤m≤MTζ(PmΩ), where γ is the number of regressors. It follows that condition (14)
boils down to condition (22) in Zhang et al. (2013), which assumes that the growth rate
of the number of regressors in the largest model must be slower than the rate at which
ξt,T → ∞. In this paper, under the linear regression setting with time-varying parameters
in Section 3, we can establish the asymptotic optimality without Assumption 7.
In Assumption 8, the kernel is symmetric and bounded, and has a compact support
[−1, 1]. It usually discounts the observations whose values are far away from the time point
of interest. This implies that kmax ≡ maxs,t kst <∞, which is used in our proof. A commonly
used kernel function, the Epanechnikov kernel k(u) = 0.75(1− u2)I(|u| ≤ 1), is employed in
9
this paper, where I(·) is the indicator function. Assumption 9 implies h→ 0 and Th→∞as T → ∞, which is a standard condition for the bandwidth; see Chen and Hong (2012).
Assumption 9 includes the optimal bandwidth h ∝ T−1/5, which minimizes the integrated
mean squared error (MSE) of a smoothed nonparametric estimator; see more discussions in
Cai (2007) and Chen & Hong (2012).
We now state the main result of this section.
Theorem 1. Suppose Assumptions 1-9 hold. Then for any given time point t, the TVJMA
estimator µt(wt) satisfies the asymptotic optimality (OPT) property, i.e.,
Lt,T (wt)
infw∈HTLt,T (w)
p→ 1.
Theorem 1 shows that the local squared error loss obtained from the time-varying com-
bination weight vector wt is asymptotically equivalent to the infeasible optimal combination
weight vector at any time point t. This implies that the TVJMA estimator is asymptotically
optimal in the class of time-varying model averaging estimators based on possibly nonlinear
models where the weight vector w is restricted to the set HT , which allows the combination
weights to change smoothly over time.
3 Time-varying Parameter Regression
In this section, we focus on a set of candidate models with a specific form, i.e., time-varying
parameter linear regressions. This is a special case of the general candidate models in Section
2. Consider the m-th time-varying parameter regression model
Yt = Xmt β
mt + εmt , t = 1, · · · , T, m = 1, · · · ,MT , (12)
where Xmt is a 1× qm vector of explanatory variables, βmt is a qm × 1 possibly time-varying
parameter vector, εmt is an unobservable disturbance, and qm is a positive integer that may
be infinite. Note that we allow E(εmt |Xmt ) 6= 0 in the set of candidate models, which arises
when the m-th model is misspecified for E(Yt|Xmt ).
As Hansen (2001) points out, “it may seem unlikely that a structural break could be
immediate and might seem more reasonable to allow a structural change to take a period
of time to take effect”. We are thus interested in the following m-th smooth time-varying
parameter model:
Yt = Xmt β
m
(t
T
)+ εmt , t = 1, · · · , T, (13)
where βm : [0, 1] → Rqm is a qm-dimensional vector-valued function on [0, 1]. In the neigh-
borhood of each time point, the model is locally stationary but it is globally nonstationary.
10
Various smooth time-varying parameter models have been considered to capture the evo-
lutionary behavior of economic time series. For example, a smooth transition regression
(STR) model is proposed by Chan & Tong (1986) and further studied by Lin & Terasvirta
(1994), which allows both the intercept and the slope to change smoothly over time. If
the parameter function is correctly specified, parametric models for time-varying parame-
ters can be consistently estimated with the root-T convergence rate. However, there is no
economic theory to justify any concrete functional form assumption for these time-varying
parameters, and the choice of a particular functional form for time-varying parameters is
somewhat arbitrary, probably leading to serious misspecification. Robinson (1989, 1991)
considers a nonparametric time-varying parameter model and it is further studied by Blun-
dell et al. (1998), Cai (2007) and Chen & Hong (2012). One advantage of the nonparametric
approach is that little or restrictive prior information is required for the functional forms
of time-varying parameters, except for the regularity assumption that they evolve over time
smoothly. In the present context, for the time-varying parameter βm(t/T ), we follow the
spirit of the smoothed nonparametric estimation in Robinson (1989).
Instead of specifying a parameterization for βm(t/T ), which may lead to serious bias, we
assume that βm(·) is a smooth time-varying function of the ratio t/T . This assumption is
based upon a common scaling scheme in the literature (e.g., Robinson (1989)). To reduce
the bias and variance of a smoothed nonparametric estimator for βmt at any fixed time point
t, it is necessary to balance the increase between the sample size T and the amount of local
information at time point t. One possible solution, as suggested in Robinson (1989) and Cai
(2007), is to assume a smooth function β(·) on an equally spaced grid over [0,1] and consider
estimation of βm(u) at fixed points u ∈ [0, 1]. We note that the parameter βmt depends on
the sample size T , so that new information accumulates at time point t when T increases.
This ensures the consistency of parameter βmt at any time point t (Cai (2007), Chen & Hong
(2012)).
For any s in a neighborhood of a fixed time point t, βms follows a Taylor expansion:
βms ≈ βmt , s ∈ [t− Th, t+ Th]. (14)
Define K−t = diagk1t, k2t, · · · , k(t−1)t, 0, k(t+1)t, · · · , kTt as the weights for Jackknife esti-
mation. Thus for every time point t, we obtain a local constant estimator βm
t for βmt , and
so a local least square estimator µmt and a Jackknife estimator µmt for the m-th candidate
model respectively:
βm
t = (Xm′KtXm)−1Xm′KtY, (15)
µmt = Xmt (Xm′KtX
m)−1Xm′KtY (16)
and
µmt = Xmt (Xm′K−tX
m)−1Xm′K−tY. (17)
11
Based on the expressions of µmt and µmt , it is straightforward to obtain
Pm =
Xm
1 (Xm′K1Xm)−1Xm′K1
Xm2 (Xm′K2X
m)−1Xm′K2
· · ·XmT (Xm′KTXm)−1Xm′KT
(18)
and
Pm =
Xm
1 (Xm′K−1Xm)−1Xm′K−1
Xm2 (Xm′K−2X
m)−1Xm′K−2
· · ·XmT (Xm′K−TXm)−1Xm′K−T
. (19)
Thus, Pm = Dm(Pm − IT ) + IT , where Dm is a diagonal matrix with the t-th diagonal
element (1− hmtt )−1, and hmtt is the (t, t) element in Pm.
To establish the asymptotic optimality property of µ(w), we impose the following regu-
larity conditions:
Assumption 10. For any given time point t, supw∈HTtr(P′(w)P(w))ξ−1t,T = op(1).
Assumption 11. For any given time point t, the local average of µ2t is bounded, i.e.,
1Thµ′Ktµ = O(1) a.s. as T →∞.
Assumption 12. For any given time point t, h∗ = O(T−1h−1) and h−1ξ−1t,T → 0 a.s. as
T →∞, where ξt,T is defined in (10) and h∗ = max1≤m≤MTmax1≤t≤T h
mtt .
As pointed out by a referee, Assumption 10 implies that the bias part dominates the
risk since tr(P′(w)P(w)) is related to the variance part of the risk. Typically, the risk is
minimized by equating its bias part and its variance part. One way to make Assumption 10
hold is to restrict the set for weights. Another way is to restrict the number of candidate
models or the number of variables in candidate models. Assumption 10 is the price for
allowing a dependent and non-normal random error εt. When Assumption 1 (normal errors)
is imposed or it is assumed that ε is a vector of independent variables as in the existing
literature on JMA (e.g., Hansen & Racine (2012) and Ando & Li (2014)), Assumption 10
is no longer needed. Since Theorem 1 has considered normal errors, Theorem 2′ below will
consider the situations where ε is a vector of independent variables without using Assumption
10.
Given Kt, we have 1Thµ′Ktµ = 1
Th(µ1, · · · , µT )′Kt(µ1, · · · , µT ) = 1
Th
∑Ts=1 kstµ
2sa.s.→ Eµ2
t ,
as T → ∞. Thus, Assumption 11 implies that the local average of µ2t is bounded. This is
similar to condition (11) in Wan et al. (2010) and condition (23) in Zhang et al. (2013), which
concern the average of µ2t over the whole sample period. Finally, the first part of Assumption
12
12 is rather mild, which corresponds to condition (C.2) in Zhang (2015) and equation (5.2) in
Andrews (1991). The second part of Assumption 12 excludes extremely unbalanced designs.
This condition is reasonable and typical for the application of cross-validation; see Li (1987),
Hansen & Racine (2012) and Zhang et al. (2013) for more discussions.
Theorem 2. Suppose Assumptions 2, 3, 6′ and 8-12 hold. Then for any given time point t,
µt(wt) satisfies the asymptotic optimality (OPT) property.
Theorem 2 shows that the TVJMA estimator is asymptotically optimal in the class of
time-varying weighted average estimators.
Next, we establish the asymptotic optimality (OPT) result without Assumption 10. The-
orem 2′ below addresses the asymptotic optimality of µt(wt).
Theorem 2′. Suppose ε is a vector of independent variables and Assumptions 2, 3, 4, 6′, 8-9
and 11-12 hold. Then for any given time point t, µt(wt) satisfies the asymptotic optimality
(OPT) property.
Finally, we consider asymptotic properties of the time-varying parameter averaging esti-
mator. Suppose the DGP is a linear time-varying parameter regression, i.e., Yt = Xtβt + εt,
where Xt is a 1 × q vector of explanatory variables, βt ≡ β(t/T ) is a q × 1 smooth time-
varying parameter vector, and β : [0, 1] → Rq is an unknown smooth function except for
a finite number of points on [0, 1]. Here, q is a fixed integer, and εt is an unobservable
disturbance with E(εt|Xt) = 0 almost surely. A model including only all regressors with
nonzero parameters is called a true model; see Zhang (2015). Any candidate model omitting
regressors with nonzero parameters is called an under-fitted model; see more discussions in
Zhang (2015) and Zhang & Liu (2018). It is not required that the true model be one of the
candidate models. However, at least one candidate model should not be under-fitted. This
implies that one candidate model must include all these regressors with nonzero parameters
and may have some redundant regressors as well. From (15), the time-varying model aver-
aging estimator of parameter βt is βt(w) =∑MT
m=1wmΠ′mβ
m
t , where Πm = (Iqm ,0qm×(q−qm))
(i.e., a column permutation thereof) and the maximum number of columns of Xm in all
candidate models (i.e., max1≤m≤MTqm) is bounded.
Next, we impose the following regularity conditions:
Assumption 13. For each j = 1, · · · , q, the j-th element of β(·) is continuously differen-
tiable over the unit interval [0, 1].
Assumption 14. For any given time point t, Ψt,T ≡ T−1h−1∑T
s=1 kstXsX′s
p→ Ψ as T →∞, where Ψ is a q×q symmetric, bounded and positive definite matrix, and T−1/2h−1/2
∑Ts=1 kst
X′tεt = Op(1).
13
Assumption 13 places a smoothness condition on parameters, which is commonly im-
posed in the literature; see Robinson (1989, 1991). Assumption 14 can be obtained from
Proposition A.1 in Chen & Hong (2012) and Lemma 3 in Cai (2007). The following the-
orem shows that the TVJMA parameter estimator βt(wt) is√Th-consistent under these
regularity assumptions.
Theorem 3. Suppose Assumptions 3, 8 and 12-14 hold, and h = cT−λ for 15≤ λ < 1,
where 0 < c < ∞. Then for any given time point t in the interior region t ∈ [Th, T − Th],√Th(βt(wt)− βt) = Op(1) as T →∞.
A similar result holds for the boundary regions [1, Th]∪[T−Th, T ] if we assume h = cT−λ
for 13≤ λ < 1, where 0 < c <∞. This happens because the local constant estimator suffers
from the well-known boundary effect problem in smoothed nonparametric estimation. As
shown in Cai (2007), the convergence rate of the asymptotic bias with the local constant
estimator is h2 in the interior region, but only h in the boundary regions.
4 Asymptotic Optimality of TVJMA with Lagged De-
pendent Variables
In this section, we develop an asymptotic optimality theory for the TVJMA estimator based
on time-varying parameter regression models that include lagged dependent variables as
regressors. Dynamic regressions are widely used in macroeconomic forecasts. It is highly
desirable to extend the TVJMA estimator from static regressions to dynamic regressions.
Consider the following DGP
Yt =∞∑j=1
βjtYt−j + εt, t = 1, · · · , T, (20)
where εt is i.i.d. with mean zero and variance σ2. This is a special case of the DGP in
Section 2.
More generally, exogenous regressors can be added to the candidate models with finitely
many lagged dependent variables. This yields an augmented regression model
Yt =
r1∑j=1
βjtYt−j +
r2∑j=1
β(r1+j)tX∗tj + εft , t = 1, · · · , T, (21)
where X∗tj is an exogenous variable, εft is the innovation, r1 is the maximal lag order, and r2
is the number of exogenous regressors. Let r1 be allowed to increase and r2 be fixed when T
increases. Denote Y = (Y1, · · · , YT )′, YLt = (Yt−1, · · · , Yt−r1), and let YL = (Y ′L1, · · · , Y ′LT )′
be a T × r1 matrix containing T observations of r1 lagged dependent regressors, X∗ =
14
(X∗1 , X∗2 , · · · , X∗T ) with X∗t = (X∗t1, · · · , X∗tr2) be a T × r2 matrix containing observations
of r2 exogenous regressors, X = (YL,X∗) be a T × γ matrix with rank γ = r1 + r2, and
εf = (εf1 , · · · , εfT )′. The regressor matrix Xm of the m-th candidate model is formed by
combining the columns of X. Define P in a similar way to Pm with Xm replaced by X.
Note that Xm is the regressor matrix in the m-th candidate model and qm is the number of
regressors in Xm. Regressors are allowed to be locally stationary (Dahlhaus (1996, 1997)).
Thus, our framework covers AR as well as ARX models with time-varying parameters. For
each candidate model, time-varying parameters are estimated by a local constant method,
which is the same as (15) in Section 3.
We impose the following regularity conditions:
Assumption 15. Yt is a locally stationary process, X∗t is a strictly stationary process,
and both Yt and X∗t are β-mixing processes with mixing coefficients β(j) satisfying∑∞j=1 j
2β(j)δ/(1+δ) < C < ∞, supt E||Yt||4 < C and E||X∗t ||4 < ∞ for some constant 0 <
δ < 1 and C > 0.
Assumption 16. Tq−1m hmtt = Op(1), t = 1, · · · , T, m = 1, · · · ,MT , and for any given
time point t, T−1h−1µ′Ktµ = Op(1), γξ∗−1t,T = op(1), and γµ′µξ∗−2t,T = op(1), where ξ∗t,T =
infw∈HTVt,T (w) and Vt,T (w) = µ′A′(w)KtA(w)µ+ σ2tr(P′(w)KtP(w)).
Assumption 17. For any given time point t, ζ(T−1h−1X∗′KtX
∗) = Op(1), X∗′Ktε/
√Th
d→N(0,∆), and ζ((T−1X∗
′MtX
∗)−1) = Op(1), where ∆ is a symmetric, bounded and positive
definite matrix, and Mt ≡ Kt −KtYL(Y′LKtYL)−1Y′L.
Assumption 18. The innovation process εt is an i.i.d. sequence with mean 0 and variance
σ2, and satisfies that with some positive constants α1, α2 and α3,
|Ft(d1)− Ft(d2)| ≤ α1|d1 − d2|α2 ,
for all t when |d1 − d2| ≤ α3, where F (·) is the distribution function of εt.
Assumption 19. r6+α41 = O(T ) for some α4 > 0 and supt Eε4t <∞.
In Assumption 15, local stationarity is weaker than strict stationarity. Intuitively, local
stationarity implies that when the standardized time tT
is in a neighborhood of any fixed
point τ ∈ [0, 1], the behavior of time series Yt can be approximated up to a certain high
order by a strictly stationary process Yt(τ), and it holds that ||Yt − Yt(τ)|| = Op
(h+ 1
T
),
where h is a bandwidth such that h → 0 as T → ∞; see Dahlhaus (1996, 1997) and Vogt
(2012) for details. Thus, the autocovariance function of Yt for all times t, with tT
in the
neighborhood of τ , can be approximated arbitrarily well by that of the strictly stationary
time series Yt(τ).Assumption 16 is analogous to Assumptions 10-12, which are used for time-varying pa-
rameter regression models when Xt is assumed to be strictly stationary. The first part
15
of Assumption 16 is a counterpart of Assumption 12 and excludes extremely unbalanced
designs. The second part of Assumption 16 concerns the local average behavior of µ2t for
any given time point t. Like in Shao (1997) and Wan et al. (2010), if Yt,Xt is a strictly
stationary process, this is the average behavior of µ2t over the whole sample period. By
µ′µ/T = Op(1) and Assumption 3, a sufficient condition of the fourth part of Assumption
16 is γTξ∗−2t,T = op(1). By comparing the expression of Vt,T (w) with the risk Rt,T (w) defined
in (7), we can view Vt,T (w) as a kind of risk as well, which may be called as a pseudo-risk.
Hence, the third and fourth parts of Assumption 16 impose a restriction on the relationship
among the number of regressors γ, the sample size T , and the infimum pseudo-risk ξ∗t,T .
Similar assumptions are used in Zhang et al. (2013), Liu & Okui (2013) and Ando & Li
(2014).
When X∗′t εt is a stationary ergodic martingale difference sequence with finite fourth
moments and T−1X∗′X∗ converges to a symmetric positive definite matrix in probability,
the first part of Assumption 17 holds. The second part of Assumption 17 can be ensured
by more primitive conditions; see more discussions in equation (A.7) in Cai (2007). Here,
X = (X∗′
1 , · · · ,X∗′T )′, with X∗t = (X∗t1, · · · , X∗tr2), is a T × r2 matrix containing observations
of r2 exogenous regressors. In this paper, we assume that r2 is fixed when T increases. It is
conceivable that we could allow r2 to increase with T at the cost of more tedious proof and
other assumptions. Assumption 18 is a mild condition which is the same as condition (K.2)
of Ing & Wei (2003). It holds for any distribution with a bounded probability density. This
assumption is also used to prove Lemma 1 in the Mathematical Appendix. Assumption 19 is
a reiteration of assumptions in Lemma 4 in the Mathematical Appendix. It can be replaced
by the conditions of r2+α41 = O(T ) and sup−∞<t<∞ E|εt|S <∞ for all S = 1, 2, · · · .
Next, we impose conditions on the strictly stationary process Yt(τ) indexed by τ ∈[0, 1].
Assumption 20. For any τ ∈ [0, 1] and q > 0, Yt(τ) is strictly stationary with E|Yt(τ)|q <∞ and Yt(τ) +
∑∞j=1 ajYt−j(τ) = εt, t = · · · ,−1, 0, 1, · · · , where the roots of A(z) = 1 +∑∞
j=1 ajzj = 0 lie outside the unit circle |z| = 1, and εt is a sequence of independent
random variables with mean 0 and variance σ2.
Assumption 21. For any τ ∈ [0, 1], Yt(τ) is a stationary β−mixing process with mixing
coefficients β(j) satisfying∑∞
j=1 j2β(j)δ/(1+δ) < C for some 0 < δ < 1 and 0 < c <∞.
Assumption 20 is a standard condition for ARMA models; see more discussions in Ing
& Wei (2003). The mixing condition in Assumption 21 imposes a restriction on temporal
dependence in Yt(τ), which is commonly used in the literature (e.g., Cai (2007), Chen and
Hong (2012)).
16
Theorem 4. Suppose Assumptions 3, 8, 9 and 15-21 hold. Then for any given time point
t, the TVJMA estimator µt(wt) in this section satisfies the asymptotic optimality (OPT)
property.
As a main contribution, Theorem 4 extends Theorem 2 for the asymptotic optimality
property of the TVJMA estimator from static regression models with constant parameter-
s to the dynamic regression models with time-varying parameters and locally stationary
regressors.
5 Monte Carlo Simulation
To examine the finite sample performance of the proposed TVJMA estimator, we consider
the following DGPs:
DGP 1 (Smooth Structural Changes):
Yt = µt + εt =∞∑j=1
θjF (τ)Xtj + εt, t = 1, · · · , T
where τ = t/T , F (τ) = τ 3, Xt1 = 1, and observations on all other regressors Xtj, j ≥2 are generated from i.i.d.N(0, 1) sequences. Following Hansen & Racine (2012), θj =
c√
2αj−α−1/2, with c > 0 and α = 1.5, and the coefficient c is selected to control the
population coefficient of determination R2 = c2/(1 + c2) to vary on a grid from 0.1 to 0.9.
To examine robustness of the TVJMA estimator, we consider three cases for εt: Case
(i) εt ∼ i.i.d.N(0, 1); Case (ii) εt = et,1 + et,2, et,1 ∼ N(0, X2t2), et,2 = φet−1,2 + ut, ut ∼
i.i.d.N(0, 1) and φ = 0.5. This error process is the same as that of Zhang et al. (2013); Case
(iii) εt =√htut, ht = 0.2 + 0.5X2
t2, ut ∼ i.i.d.N(0, 1), which follows the error structure in
Chen and Hong (2012). Note that var(εt|Xt2) 6= σ2 under Case (iii).
We compare (1) the TVJMA estimator with a variety of popular model averaging es-
timators, namely (2) the nonparametric version of bias-corrected AIC in Cai & Tiwari
(2000) (AICc); (3) a smoothed AICc (SAICc); (4) the JMA of Hansen & Racine (2012);
(5) the MMA of Hansen (2007); (6) a smoothed Akaike information criterion (SAIC); and
(7) a smoothed Bayesian information criterion (SBIC). The AICc for order selection is
AICc = ln RSS + (T + tr(S∗))/ (T − (tr(S∗) + 2)), where RSS =∑T
t=1(Yt − Yt)2 is based
on a local constant regression and tr(S∗) is the number of parameters in the model, which
penalizes extra parameters for a larger value of tr(S∗). For the definition of S∗, see more
discussions in Cai & Tiwari (2000). The SAICc method is the model averaging estimator
with the weight wm = exp(−12AICcm)/
∑MT
m=1 exp(−12AICcm), where AICcm is obtained from
Cai & Tiwari (2000) for the m-th candidate model. The other four model averaging esti-
mators are based on linear regressions with constant combination weights, including JMA,
17
MMA, SAIC and SBIC. SAIC, proposed by Buckland et al. (1997), is the least squares mod-
el averaging estimator with the weight wm = exp(−12AICm)/
∑MT
m=1 exp(−12AICm), where
AICm = T ln σ2m + 2m. SBIC is a simplified form of the Bayesian model averaging with the
weight wm = exp(−12BICm) /
∑MT
m=1 exp(−12BICm), where BICm = T ln σ2
m +m lnT .
The number of candidate models is determined by the rule in Hansen & Racine (2012),
i.e., MT = [3T 1/3], the nearest integer of 3T 1/3. This yields MT = 11, 14, 15 and 18 for T =
50, 75, 100 and 200, respectively. The candidate models are Yt =∑m
j=1 βmj (τ)Xtj + εmt , t =
1, · · · , T, m = 1, · · · ,MT . For our TVJMA estimator, parameters in these candidate models
are estimated by the local constant method described in Section 3. For the JMA, MMA,
SAIC and SBIC methods, the parameters βmj (τ) in candidate models are assumed to be
constant (i.e., they do not depend on τ = t/T ), and as a result, the candidate models are
simplified to Yt =∑m
j=1 βmj Xtj + εmt , t = 1, · · · , T, m = 1, · · · ,MT .
For the TVJMA and AICc methods, we use the Epanechnikov kernel in smoothed non-
parametric estimation; this kernel has been shown to be the optimal kernel for density
estimation (Epanechnikov (1969)) and robust regression (Lehmann & Casella (2006)), al-
though our experience suggests that the choice of k(·) has little impact on the performance
of our TVJMA estimator. For space, we report results based on a rule-of-thumb bandwidth
h = 2.34T−1/5, which attains the optimal rate for MSE (see, e.g., Chen & Hong (2012)).
We generate N = 1000 data sets from the random sample Yt, X ′tTt=1 of size T , and use the
following MSE criterion to assess the accuracy of forecasts:
1
N
N∑n=1
||µ(w)(n) − µ(n)||2, (22)
where µ(w)(n) and µ(n) denote the forecast value and the true value of the conditional
expectation of Y in the n-th replication, where n = 1, · · · , N . To simplify comparisons, the
risk (i.e., expected squared error loss) of all model averaging estimators are normalized by
the MSE of the infeasible optimal least squares model averaging estimator, which is the same
as in Hansen & Racine (2012). For space, we report the Monte Calo results in graphical
forms.
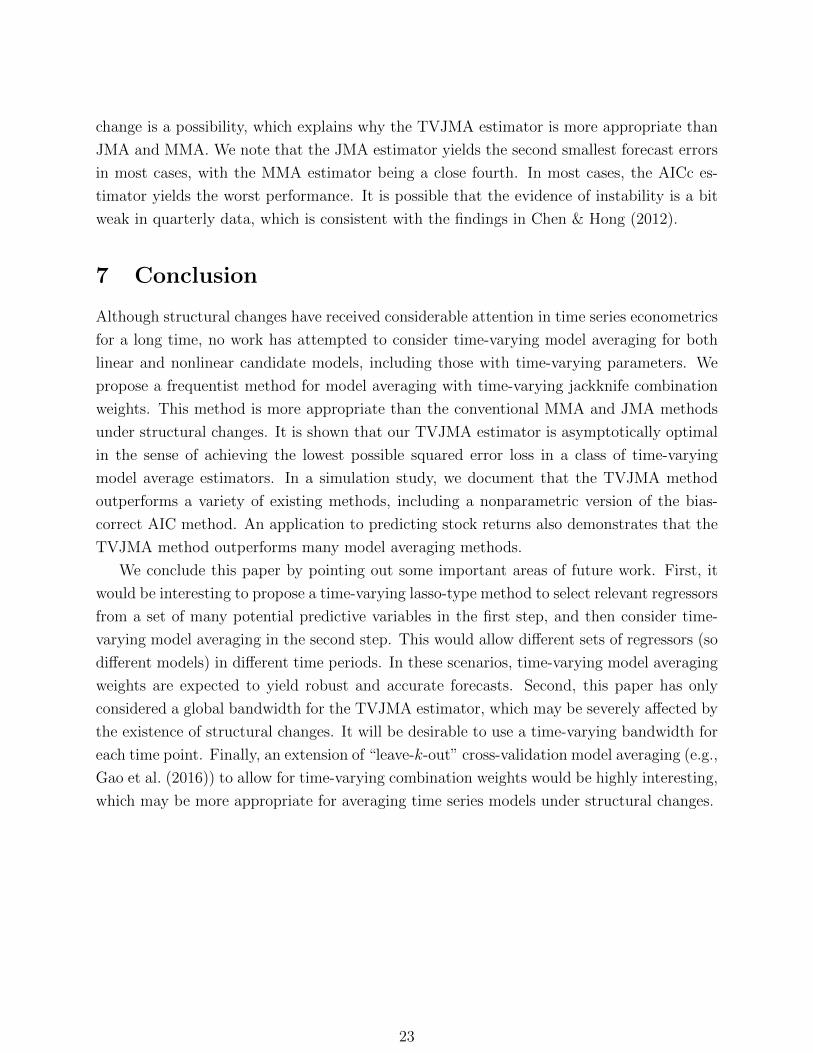
Figures 1-3 report the results of simulations under DGP 1. Some MSE plots are not shown
in these figures, because these methods perform so poorly that their results are beyond
the range of the y-axis. In most cases, the TVJMA estimator delivers the most precise
forecasts among all estimators considered, especially when R2 is relatively large. Under
both conditionally heteroscedastic errors and autocorrelated errors, our method displays the
best performance in terms of the risk, as is expected. Also, when the sample size T is large
enough, the AICc and SAICc estimators are sometimes marginally similar to the TVJMA
estimator in the cases of large R2. This happens because the parameters in DGP 1 are
changing over time and the candidate models are time-varying parameter models as well. In
most cases, the TVJMA estimator is preferred to any of the four estimators based on linear
18
least squares, although occasionally small to moderate reductions in MSE can be achieved
for the MMA and JMA estimators with small R2 and small T ; see T = 50 for example. We
note that in some cases the TVJMA performances are a bit sensitive to bandwidth selection.
The selection of an optimal bandwidth to estimate the time-varying combination weights
is an important issue for future study. A possible solution is to consider model averaging
bandwidths; see Henderson & Parmeter (2016) and Zhu et al. (2017).
Next, we consider a special case of time-varying parameter dynamic models that contain
lagged dependent variables as regressors:
DGP 2 (Dynamic Regression with Smooth Structural Changes):
Yt =∞∑j=1
θjF (τ)Yt−j + εt,
where θj = 1/√
2αj−α−1/2, F (τ) = τ , εt =√R2
cεt, c =
∑∞j=1 θ
2j , εt ∼ i.i.d.N(0, 1) and
α = 1.5. We allow R2 to vary on a grid from 0.1 to 0.9.
Furthermore, to investigate the finite sample performance of the TVJMA estimator under
DGPs with various structural changes, we consider following three DGPs with Case (ii) for
εt. For DGPs 3-5 below, θj = c√
2αj−α−1/2, with various values of c > 0 and α = 1.5.
These parameter values are the same as those in DGP 1:
DGP 3 (Single Structural Break):
Yt =∞∑j=1
θjF (τ)Xtj + εt,
where F (τ) = 0.5I(τ ≤ 0.3) + I(τ > 0.3) and τ = t/T .
DGP 4 (Smooth Transition Regression):
Yt =∞∑j=1
θjF (τ)Xtj + εt,
where F (τ) = 1.5− 1.5 exp(−3(τ − 0.3)2) and τ = t/T .
DGP 5 (Smooth Structural Changes with Periodicity):
Yt =∞∑j=1
θjF (τ)Xtj + εt,
where F (τ) = sin(πτ 2) and τ = t/T .
For each of DGPs 2-5, we generate N data sets of the random sample Xt, YtTt=1 for
each sample size T = 50, 75, 100 and 200, where Xt1 = 1 and observations on all other
regressors Xtj, j ≥ 2 are generated from i.i.d.N(0, 1) sequences. The candidate models
and their parameter estimation methods under DGPs 2-5 are the same as those under DGP
1. Specifically, DGP 2 is a dynamic linear regression model with time-varying parameters,
19
which is based on Section 4. DGPs 3-5 are based on the same set-up as that of DGP 1,
except that DGPs 3-5 focus on various structural changes with Case (ii) for εt. The results
are reported in Figures 4-7.
In Figure 4, we consider the dynamic regression model with smooth time-varying param-
eters under DGP 2. When the sample size T is large enough, the TVJMA estimator yields
a smaller risk than all other four estimators. This is even more clear for small R2.
In Figure 5, we consider the deterministic single break under DGP 3, namely, a single
break with a given breakpoint and size. The TVJMA estimator, not surprisingly, outper-
forms all other estimators when the sample size T is larger than 50 for all R2, while AICc
and SAICc yield smaller risks than SAIC and SBIC respectively; see, for example, the case
with T = 200 and R2 > 0.4.
In Figure 6, we consider the smooth transition regression with nonmonotonic smooth
structural changes under DGP 4. This is considered in Lin & Terasvirta (1994), which is
further studied by Cai (2007) and Chen (2015). The smooth transition function is a second-
order logistic function. The TVJMA estimator dominates all other estimators. We note that
in most cases, the AICc estimator is similar to the SAICc estimator for large T and large R2,
while both of them have a higher risk than the TVJMA estimator. SAIC achieves a lower
risk for a smaller R2 and SBIC is the least accurate estimator for large R2.
In Figure 7, we consider DGP 5, which has periodic structural changes, covering long
or short period cycles; see Twrdy & Batista (2016) for an example of container throughput
forecasting. The TVJMA estimator outperforms all other estimators. The SAICc estimator
is the worst performing estimator when R2 < 0.3, while its performance improves as R2
increases and yields the second smallest risk when R2 ≥ 0.7.
To sum up, the TVJMA estimator achieves the lowest risk among all the model averaging
estimators under various DGPs. When the sample size T increases, even for small R2, the
TVJMA appears to be the best estimator. When R2 is large, the SAICc estimator achieves a
lower risk than the AICc model selection, which is consistent with the findings in the earlier
literature. However, both of them perform worse than the TVJMA estimator for large T
and all R2. We also consider a benchmark nonparametric local constant estimator without
any model selection. It is shown that the local constant model without model selection
performs quite poorly relative to other methods in most cases. Furthermore, following a
referee’s suggestion, we also compare the TVJMA estimator with a time-varying leave-k-out
cross-validation model averaging (LkoMA) method (e.g., Gao et al. (2016)). We find that
when R2 is small, the TVJMA estimator outperforms the time-varying LkoMA estimator
under different DGPs, especially DGP 2. Nevertheless, when R2 is large, the time-varying
LkoMA estimator achieves a slightly lower risk than the TVJMA estimator except for DGP
2. Developing optimal time-varying leave-k-out cross-validation weight selection methods
and extending the proof technique for the asymptotic optimality property are important
20
topics for future research.
6 Empirical Application
It is widely accepted that stock return predictability is an important yet controversial issue
in empirical finance. The conventional wisdom, studied by Campbell (1990) and Cochrane
(1996), is that aggregate dividend yields strongly forecast excess stock return, even at longer
horizons. Other commonly used predictive variables are financial ratios, such as dividend-
price ratio, earnings-price ratio, and book-to-market ratio (Rozeff (1984), Fama & French
(1988), Campbell & Shiller (1988), Lewellen (2004)), as well as corporate payout and financ-
ing activity (Lamont (1998), Baker & Wurgler (2000)). However, Wang (2003) and Welch
& Goyal (2008) show that predictive regressions of excess stock returns perform poorly in
out-of-sample forecasts of the U.S. equity premium while historical average returns generate
superior forecasts, which causes vigorous debates in the literature (Campbell & Thompson
(2008)). It is possible that the presence of structural changes leads to a changing predictive
relationship. Indeed, Pesaran & Timmermann (2007) find that the size of parameter varia-
tions between the break points in models is considerably large, and the parameter estimates
of dividend yields take even opposite signs before and after 1991. Chen & Hong (2012)
find strong evidence against stability in univariate and multivariate predictor regressions for
both the postwar and post-oil-shock sample periods. Furthermore, Rapach & Zhou (2013)
point out that model instability and uncertainty seriously impair the forecasting ability of
predictive regression models.
The sensitivity of empirical results to model parameter estimation highlights the need
of time-varying combination weights in model averaging. In this section, we compare the
performance of stock return forecasts using our TVJMA method and existing methods. The
key distinction between these methods lies in that we allow model combination weights to
change over time in combining time-varying parameter predictive models.
We employ Campbell and Thompson’s (2008) popular dataset, which is used in Chen &
Hong (2012), Jin et al. (2014) and Lu & Su (2015), among many others. We consider the
following predictive regression model:
Yt+1 = αt + β′tXt + εt+1,
where Yt+1 = ln[(Pt+1+Dt+1)/Pt]−rt, Pt is the S&P 500 price index, Dt is the dividend paid
on the S&P 500 price index, rt is the 3-month treasury bill rates, Xt is a set of predictive
variables, i.e., Xt = (Xt1, · · · , Xtp)′, and p is the number of predictive variables. Quarterly
variables from Welch & Goyal (2008) are available for 1927:01-2005:12, since quarterly stock
returns before 1927 are constructed by interpolation of lower-frequency data, which may be
not reliable.
21
Following Welch & Goyal (2008) and Rapach et al. (2010), we consider 14 financial and
economic variables, sorted by relevance to Y: default yield spread (X1), treasury bill rate
(X2), net equity expansion (X3), term spread (X4), log dividend price ratio (X5), log earnings
price ratio (X6), long-term yield (X7), book-to-market ratio (X8), inflation (X9), log dividend
yield (X10), log dividend payout ratio (X11), stock variance (X12), long-term return (X13),
default return spread (X14). For simplicity, we consider the following 14 nested candidate
models: 1, X1, 1, X1, X2, · · · , 1, X1, · · · , X14. All candidate models are time-varying
parameter linear regression models, and parameters are estimated by the local constant
method in (15) in Section 3.
The estimation sample starts from 1947Q1 and our estimation is based on subsamples
with size T1 = 80, 92, 104, 116, 128, 140, 152, 164, 176, 188, 200, 212 and 224, respectively.
The remaining observations are used for out-of-sample recursive forecast accuracy assess-
ment. For example, we use the model averaging weights for the time period T1, wT1 , to
construct a forecast of YT1+1. After that we input a new observation and recalculate new
model averaging weights for the time period T1+1 and then obtain a forecast of YT1+2. Thus,
the out-of-sample forecast periods begins from 1967Q1, 1970Q1, 1973Q1, 1976Q1, 1979Q1,
1982Q1, 1985Q1, 1988Q1, 1991Q1, 1994Q1, 1997Q1, 2000Q1 and 2003Q1, respectively, and
all end at 2005Q4. The postwar sample, covering 1947Q1-2005Q4, and the post-oil-shock
subsample, covering 1976Q1-2005Q4, are commonly used in the literature, e.g., Welch &
Goyal (2008),Chen & Hong (2012), etc. The bandwidth employed in TVJMA, AICc and
smoothed AICc is set to be 2.34T−0.21 . Following Ullah et al. (2017), we use the out-of-sample
R2 measure:
R2 = 1−∑T−1
t=T1(Yt+1 − Yt+1)
2∑T−1t=T1
(Yt+1 − Y )2,
where Yt+1 is the prediction of Yt+1 based on a given forecast method, and Y is the historical
average of Yt over the T1 observations. This measure represents the relative difference in
squared error predictive risks. The negative (positive) value of R2 suggests that Y yields a
larger (smaller) sum of squared one-period forecast errors than the historical average method.
Another measure we use is the mean square predictive error (MSPE), which is widely
used in the literature (e.g., Sun et al. (2018)).
MSPE =1
T − T1
T−1∑t=T1
(Yt+1 − Yt+1)2. (23)
Tables 1 and 2 compare R2 and MSPE between the TVJMA estimator and other estima-
tors. We find that in most cases, the TVJMA estimator is almost always the best estimator
among all methods considered. Our finding supports the argument of Chen & Hong (2012)
that instability exists in univariate predictor models for stock returns and smooth structural
22
change is a possibility, which explains why the TVJMA estimator is more appropriate than
JMA and MMA. We note that the JMA estimator yields the second smallest forecast errors
in most cases, with the MMA estimator being a close fourth. In most cases, the AICc es-
timator yields the worst performance. It is possible that the evidence of instability is a bit
weak in quarterly data, which is consistent with the findings in Chen & Hong (2012).
7 Conclusion
Although structural changes have received considerable attention in time series econometrics
for a long time, no work has attempted to consider time-varying model averaging for both
linear and nonlinear candidate models, including those with time-varying parameters. We
propose a frequentist method for model averaging with time-varying jackknife combination
weights. This method is more appropriate than the conventional MMA and JMA methods
under structural changes. It is shown that our TVJMA estimator is asymptotically optimal
in the sense of achieving the lowest possible squared error loss in a class of time-varying
model average estimators. In a simulation study, we document that the TVJMA method
outperforms a variety of existing methods, including a nonparametric version of the bias-
correct AIC method. An application to predicting stock returns also demonstrates that the
TVJMA method outperforms many model averaging methods.
We conclude this paper by pointing out some important areas of future work. First, it
would be interesting to propose a time-varying lasso-type method to select relevant regressors
from a set of many potential predictive variables in the first step, and then consider time-
varying model averaging in the second step. This would allow different sets of regressors (so
different models) in different time periods. In these scenarios, time-varying model averaging
weights are expected to yield robust and accurate forecasts. Second, this paper has only
considered a global bandwidth for the TVJMA estimator, which may be severely affected by
the existence of structural changes. It will be desirable to use a time-varying bandwidth for
each time point. Finally, an extension of “leave-k-out” cross-validation model averaging (e.g.,
Gao et al. (2016)) to allow for time-varying combination weights would be highly interesting,
which may be more appropriate for averaging time series models under structural changes.
23
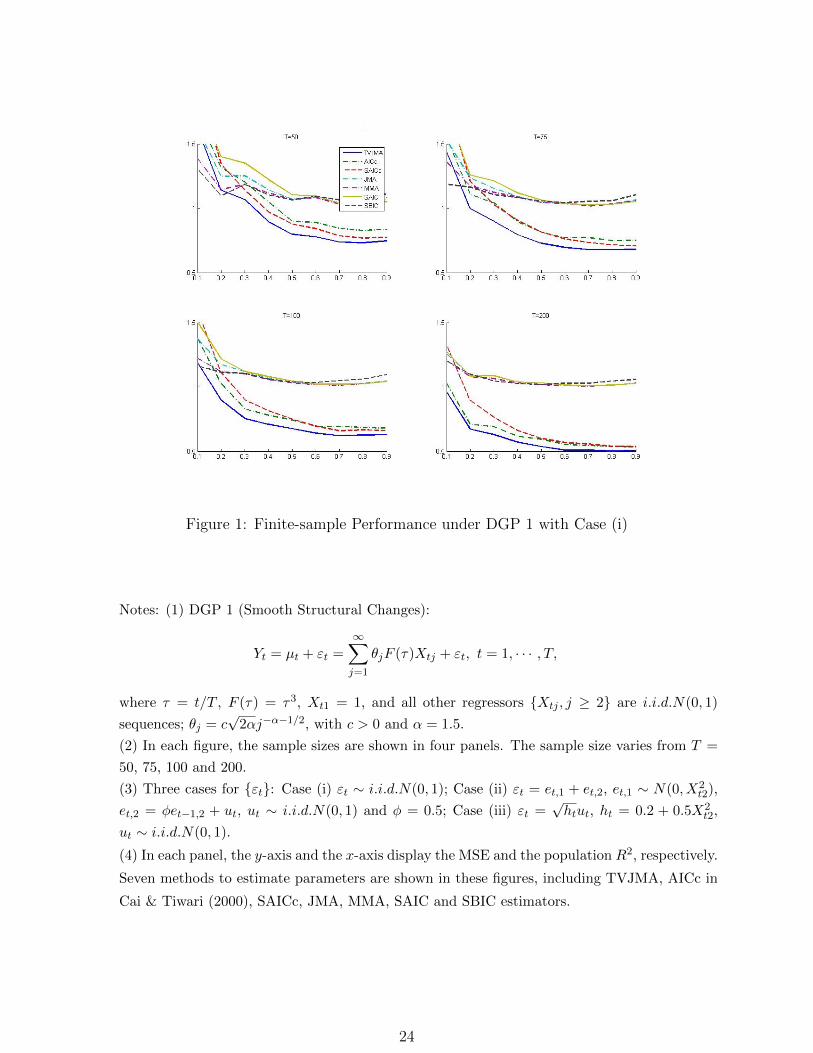
Figure 1: Finite-sample Performance under DGP 1 with Case (i)
Notes: (1) DGP 1 (Smooth Structural Changes):
Yt = µt + εt =∞∑j=1
θjF (τ)Xtj + εt, t = 1, · · · , T,
where τ = t/T , F (τ) = τ3, Xt1 = 1, and all other regressors Xtj , j ≥ 2 are i.i.d.N(0, 1)
sequences; θj = c√
2αj−α−1/2, with c > 0 and α = 1.5.
(2) In each figure, the sample sizes are shown in four panels. The sample size varies from T =
50, 75, 100 and 200.
(3) Three cases for εt: Case (i) εt ∼ i.i.d.N(0, 1); Case (ii) εt = et,1 + et,2, et,1 ∼ N(0, X2t2),
et,2 = φet−1,2 + ut, ut ∼ i.i.d.N(0, 1) and φ = 0.5; Case (iii) εt =√htut, ht = 0.2 + 0.5X2
t2,
ut ∼ i.i.d.N(0, 1).
(4) In each panel, the y-axis and the x-axis display the MSE and the population R2, respectively.
Seven methods to estimate parameters are shown in these figures, including TVJMA, AICc in
Cai & Tiwari (2000), SAICc, JMA, MMA, SAIC and SBIC estimators.
24
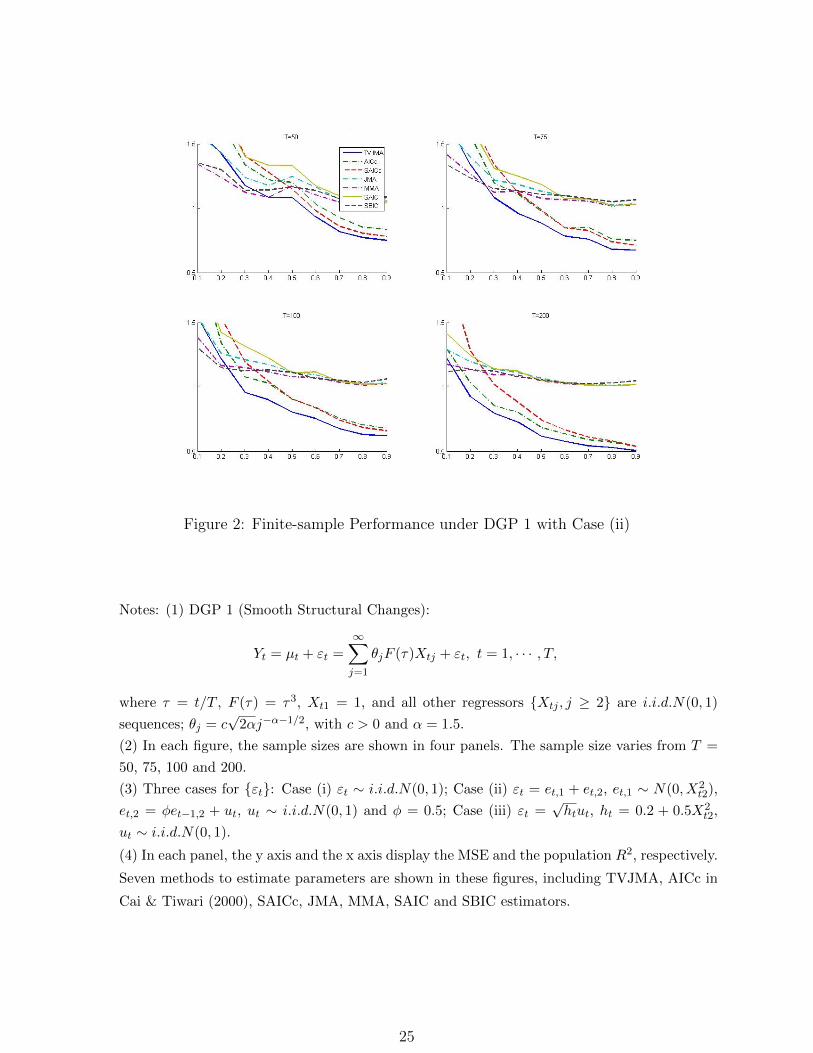
Figure 2: Finite-sample Performance under DGP 1 with Case (ii)
Notes: (1) DGP 1 (Smooth Structural Changes):
Yt = µt + εt =∞∑j=1
θjF (τ)Xtj + εt, t = 1, · · · , T,
where τ = t/T , F (τ) = τ3, Xt1 = 1, and all other regressors Xtj , j ≥ 2 are i.i.d.N(0, 1)
sequences; θj = c√
2αj−α−1/2, with c > 0 and α = 1.5.
(2) In each figure, the sample sizes are shown in four panels. The sample size varies from T =
50, 75, 100 and 200.
(3) Three cases for εt: Case (i) εt ∼ i.i.d.N(0, 1); Case (ii) εt = et,1 + et,2, et,1 ∼ N(0, X2t2),
et,2 = φet−1,2 + ut, ut ∼ i.i.d.N(0, 1) and φ = 0.5; Case (iii) εt =√htut, ht = 0.2 + 0.5X2
t2,
ut ∼ i.i.d.N(0, 1).
(4) In each panel, the y axis and the x axis display the MSE and the population R2, respectively.
Seven methods to estimate parameters are shown in these figures, including TVJMA, AICc in
Cai & Tiwari (2000), SAICc, JMA, MMA, SAIC and SBIC estimators.
25
Figure 3: Finite-sample Performance under DGP 1 with Case (iii)
Notes: (1) DGP 1 (Smooth Structural Changes):
Yt = µt + εt =∞∑j=1
θjF (τ)Xtj + εt, t = 1, · · · , T,
where τ = t/T , F (τ) = τ3, Xt1 = 1, and all other regressors Xtj , j ≥ 2 are i.i.d.N(0, 1)
sequences; θj = c√
2αj−α−1/2, with c > 0 and α = 1.5.
(2) In each figure, the sample sizes are shown in four panels. The sample size varies from T =
50, 75, 100 and 200.
(3) Three cases for εt: Case (i) εt ∼ i.i.d.N(0, 1); Case (ii) εt = et,1 + et,2, et,1 ∼ N(0, X2t2),
et,2 = φet−1,2 + ut, ut ∼ i.i.d.N(0, 1) and φ = 0.5; Case (iii) εt =√htut, ht = 0.2 + 0.5X2
t2,
ut ∼ i.i.d.N(0, 1).
(4) In each panel, the y-axis and the x-axis display the MSE and the population R2, respectively.
Seven methods to estimate parameters are shown in these figures, including TVJMA, AICc in
Cai & Tiwari (2000), SAICc, JMA, MMA, SAIC and SBIC estimators.
26
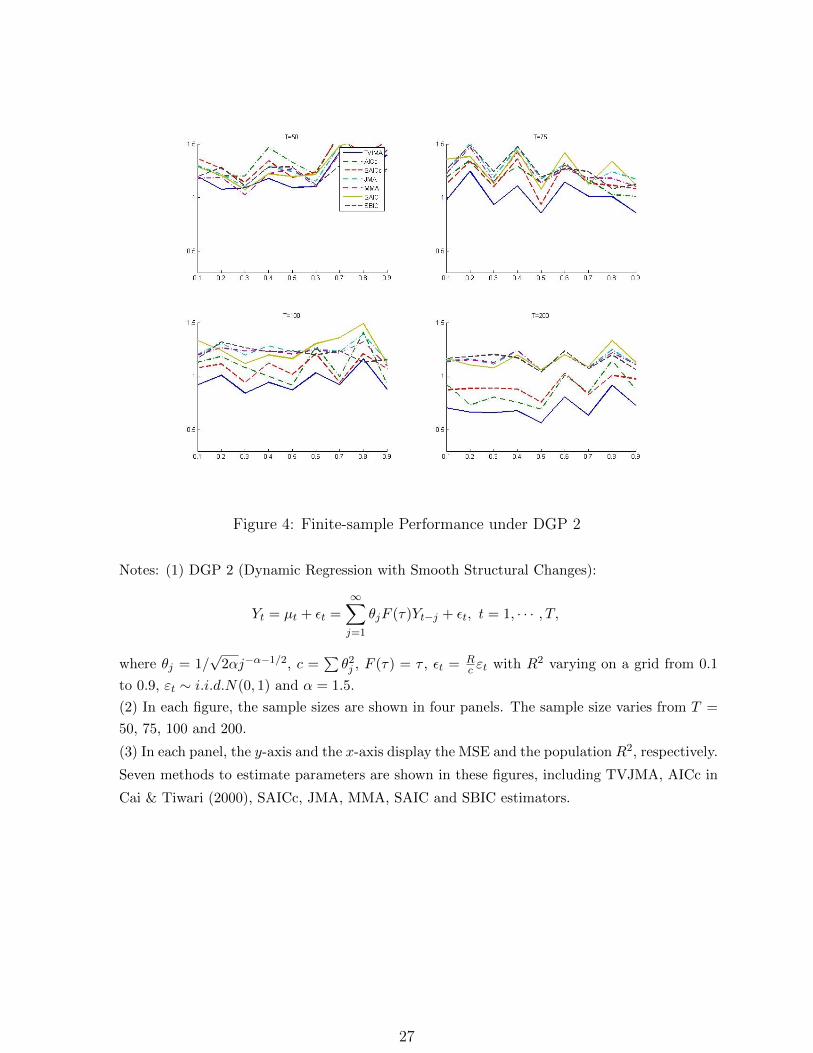
Figure 4: Finite-sample Performance under DGP 2
Notes: (1) DGP 2 (Dynamic Regression with Smooth Structural Changes):
Yt = µt + εt =∞∑j=1
θjF (τ)Yt−j + εt, t = 1, · · · , T,
where θj = 1/√
2αj−α−1/2, c =∑θ2j , F (τ) = τ , εt = R
c εt with R2 varying on a grid from 0.1
to 0.9, εt ∼ i.i.d.N(0, 1) and α = 1.5.
(2) In each figure, the sample sizes are shown in four panels. The sample size varies from T =
50, 75, 100 and 200.
(3) In each panel, the y-axis and the x-axis display the MSE and the population R2, respectively.
Seven methods to estimate parameters are shown in these figures, including TVJMA, AICc in
Cai & Tiwari (2000), SAICc, JMA, MMA, SAIC and SBIC estimators.
27
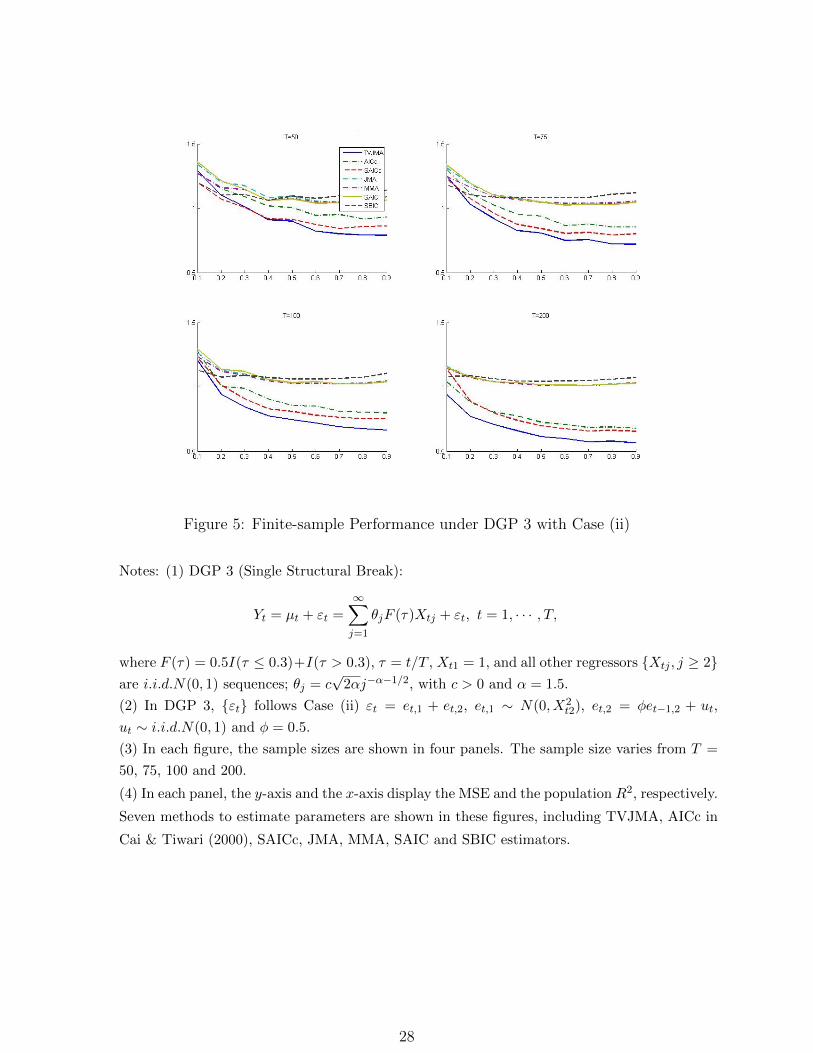
Figure 5: Finite-sample Performance under DGP 3 with Case (ii)
Notes: (1) DGP 3 (Single Structural Break):
Yt = µt + εt =
∞∑j=1
θjF (τ)Xtj + εt, t = 1, · · · , T,
where F (τ) = 0.5I(τ ≤ 0.3)+I(τ > 0.3), τ = t/T , Xt1 = 1, and all other regressors Xtj , j ≥ 2are i.i.d.N(0, 1) sequences; θj = c
√2αj−α−1/2, with c > 0 and α = 1.5.
(2) In DGP 3, εt follows Case (ii) εt = et,1 + et,2, et,1 ∼ N(0, X2t2), et,2 = φet−1,2 + ut,
ut ∼ i.i.d.N(0, 1) and φ = 0.5.
(3) In each figure, the sample sizes are shown in four panels. The sample size varies from T =
50, 75, 100 and 200.
(4) In each panel, the y-axis and the x-axis display the MSE and the population R2, respectively.
Seven methods to estimate parameters are shown in these figures, including TVJMA, AICc in
Cai & Tiwari (2000), SAICc, JMA, MMA, SAIC and SBIC estimators.
28
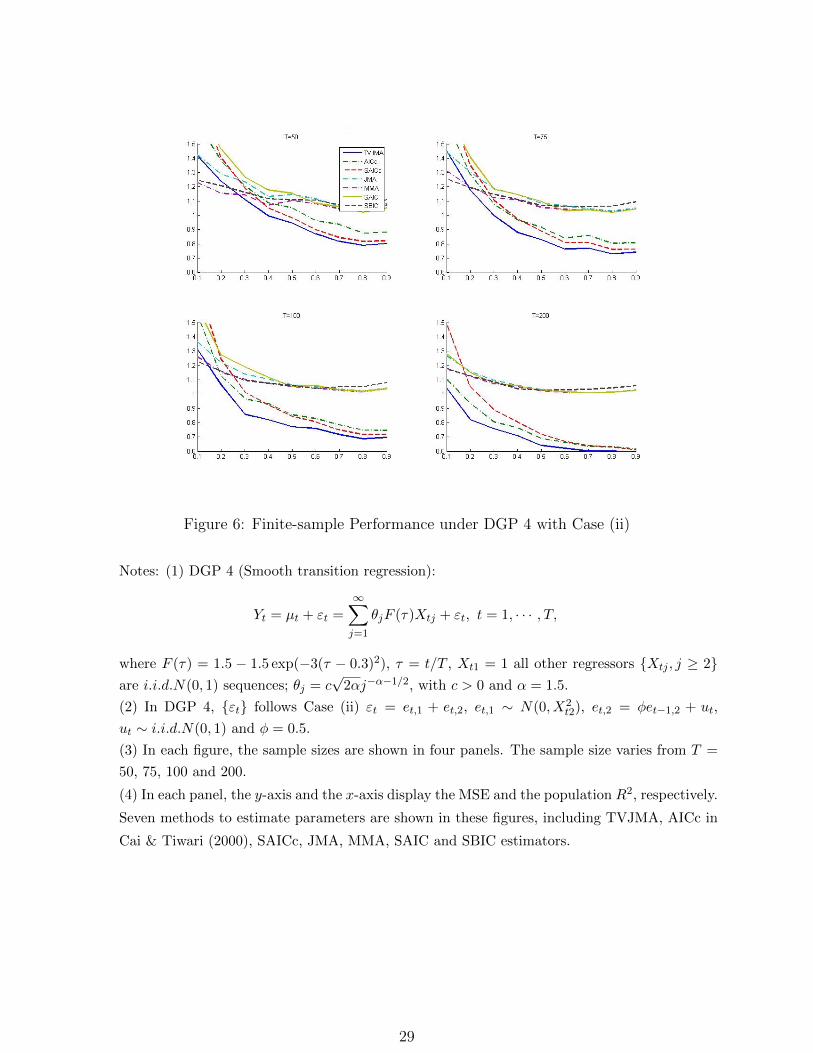
Figure 6: Finite-sample Performance under DGP 4 with Case (ii)
Notes: (1) DGP 4 (Smooth transition regression):
Yt = µt + εt =
∞∑j=1
θjF (τ)Xtj + εt, t = 1, · · · , T,
where F (τ) = 1.5 − 1.5 exp(−3(τ − 0.3)2), τ = t/T , Xt1 = 1 all other regressors Xtj , j ≥ 2are i.i.d.N(0, 1) sequences; θj = c
√2αj−α−1/2, with c > 0 and α = 1.5.
(2) In DGP 4, εt follows Case (ii) εt = et,1 + et,2, et,1 ∼ N(0, X2t2), et,2 = φet−1,2 + ut,
ut ∼ i.i.d.N(0, 1) and φ = 0.5.
(3) In each figure, the sample sizes are shown in four panels. The sample size varies from T =
50, 75, 100 and 200.
(4) In each panel, the y-axis and the x-axis display the MSE and the population R2, respectively.
Seven methods to estimate parameters are shown in these figures, including TVJMA, AICc in
Cai & Tiwari (2000), SAICc, JMA, MMA, SAIC and SBIC estimators.
29
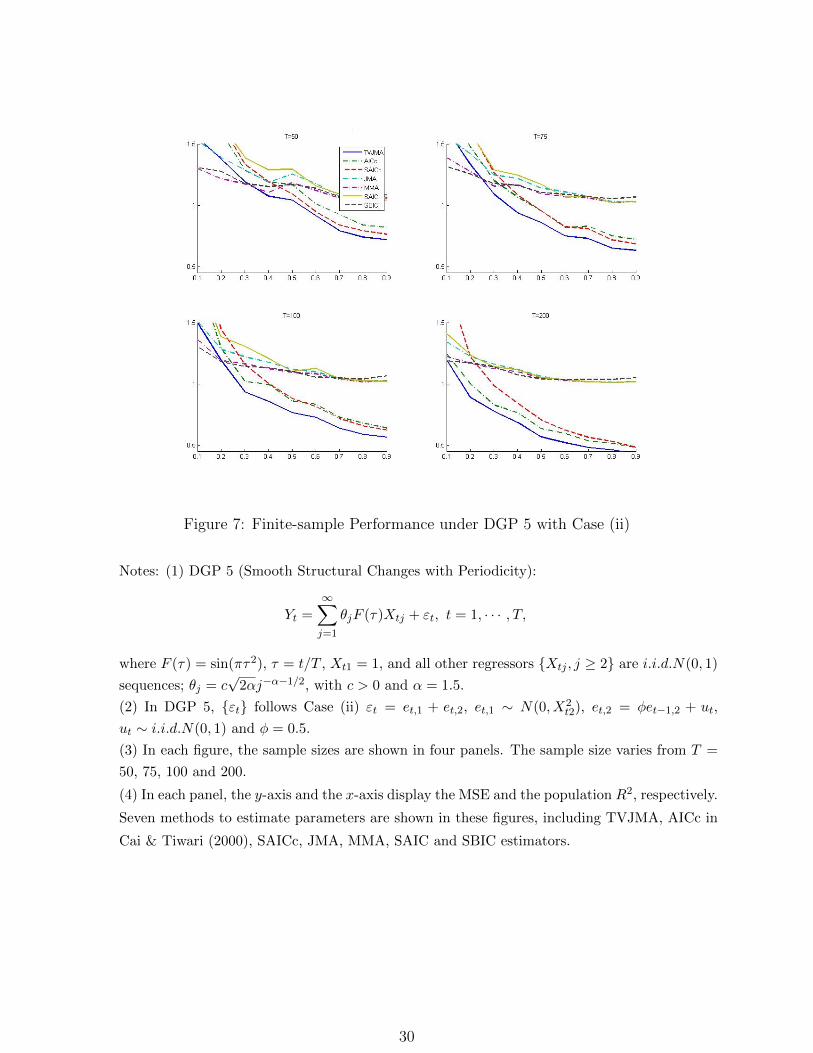
Figure 7: Finite-sample Performance under DGP 5 with Case (ii)
Notes: (1) DGP 5 (Smooth Structural Changes with Periodicity):
Yt =
∞∑j=1
θjF (τ)Xtj + εt, t = 1, · · · , T,
where F (τ) = sin(πτ2), τ = t/T , Xt1 = 1, and all other regressors Xtj , j ≥ 2 are i.i.d.N(0, 1)
sequences; θj = c√
2αj−α−1/2, with c > 0 and α = 1.5.
(2) In DGP 5, εt follows Case (ii) εt = et,1 + et,2, et,1 ∼ N(0, X2t2), et,2 = φet−1,2 + ut,
ut ∼ i.i.d.N(0, 1) and φ = 0.5.
(3) In each figure, the sample sizes are shown in four panels. The sample size varies from T =
50, 75, 100 and 200.
(4) In each panel, the y-axis and the x-axis display the MSE and the population R2, respectively.
Seven methods to estimate parameters are shown in these figures, including TVJMA, AICc in
Cai & Tiwari (2000), SAICc, JMA, MMA, SAIC and SBIC estimators.
30
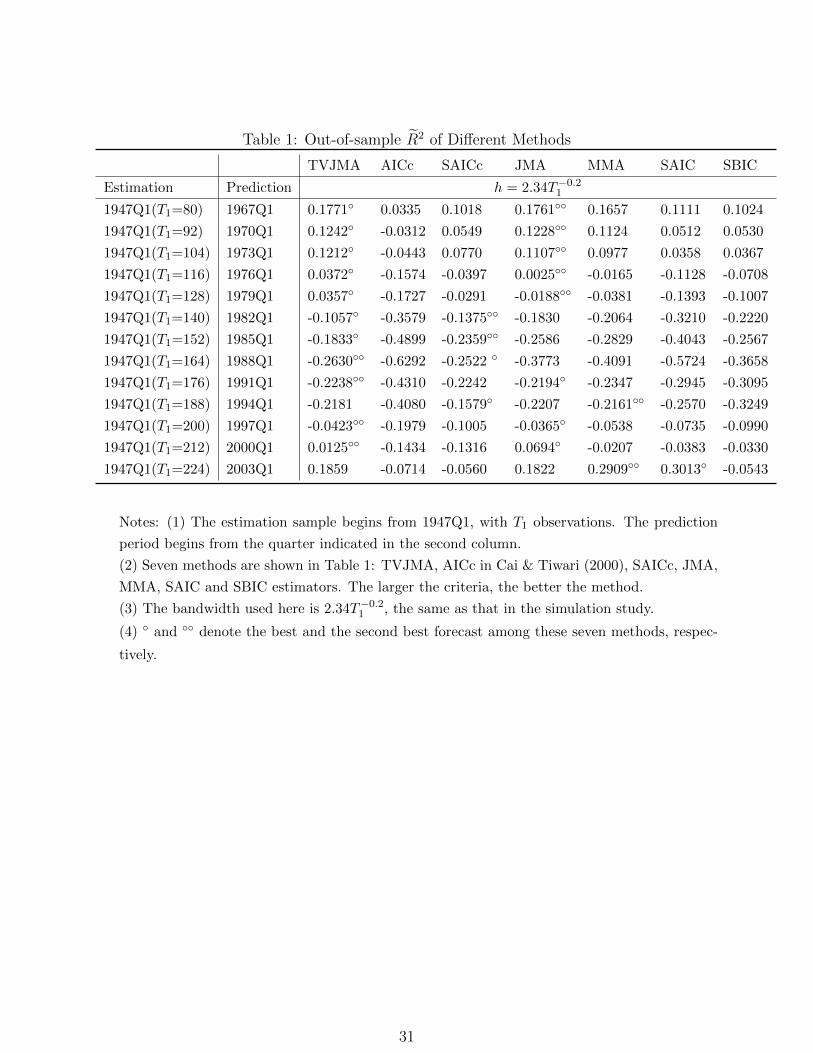
Table 1: Out-of-sample R2 of Different Methods
TVJMA AICc SAICc JMA MMA SAIC SBIC
Estimation Prediction h = 2.34T−0.21
1947Q1(T1=80) 1967Q1 0.1771 0.0335 0.1018 0.1761 0.1657 0.1111 0.1024
1947Q1(T1=92) 1970Q1 0.1242 -0.0312 0.0549 0.1228 0.1124 0.0512 0.0530
1947Q1(T1=104) 1973Q1 0.1212 -0.0443 0.0770 0.1107 0.0977 0.0358 0.0367
1947Q1(T1=116) 1976Q1 0.0372 -0.1574 -0.0397 0.0025 -0.0165 -0.1128 -0.0708
1947Q1(T1=128) 1979Q1 0.0357 -0.1727 -0.0291 -0.0188 -0.0381 -0.1393 -0.1007
1947Q1(T1=140) 1982Q1 -0.1057 -0.3579 -0.1375 -0.1830 -0.2064 -0.3210 -0.2220
1947Q1(T1=152) 1985Q1 -0.1833 -0.4899 -0.2359 -0.2586 -0.2829 -0.4043 -0.2567
1947Q1(T1=164) 1988Q1 -0.2630 -0.6292 -0.2522 -0.3773 -0.4091 -0.5724 -0.3658
1947Q1(T1=176) 1991Q1 -0.2238 -0.4310 -0.2242 -0.2194 -0.2347 -0.2945 -0.3095
1947Q1(T1=188) 1994Q1 -0.2181 -0.4080 -0.1579 -0.2207 -0.2161 -0.2570 -0.3249
1947Q1(T1=200) 1997Q1 -0.0423 -0.1979 -0.1005 -0.0365 -0.0538 -0.0735 -0.0990
1947Q1(T1=212) 2000Q1 0.0125 -0.1434 -0.1316 0.0694 -0.0207 -0.0383 -0.0330
1947Q1(T1=224) 2003Q1 0.1859 -0.0714 -0.0560 0.1822 0.2909 0.3013 -0.0543
Notes: (1) The estimation sample begins from 1947Q1, with T1 observations. The prediction
period begins from the quarter indicated in the second column.
(2) Seven methods are shown in Table 1: TVJMA, AICc in Cai & Tiwari (2000), SAICc, JMA,
MMA, SAIC and SBIC estimators. The larger the criteria, the better the method.
(3) The bandwidth used here is 2.34T−0.21 , the same as that in the simulation study.
(4) and denote the best and the second best forecast among these seven methods, respec-
tively.
31
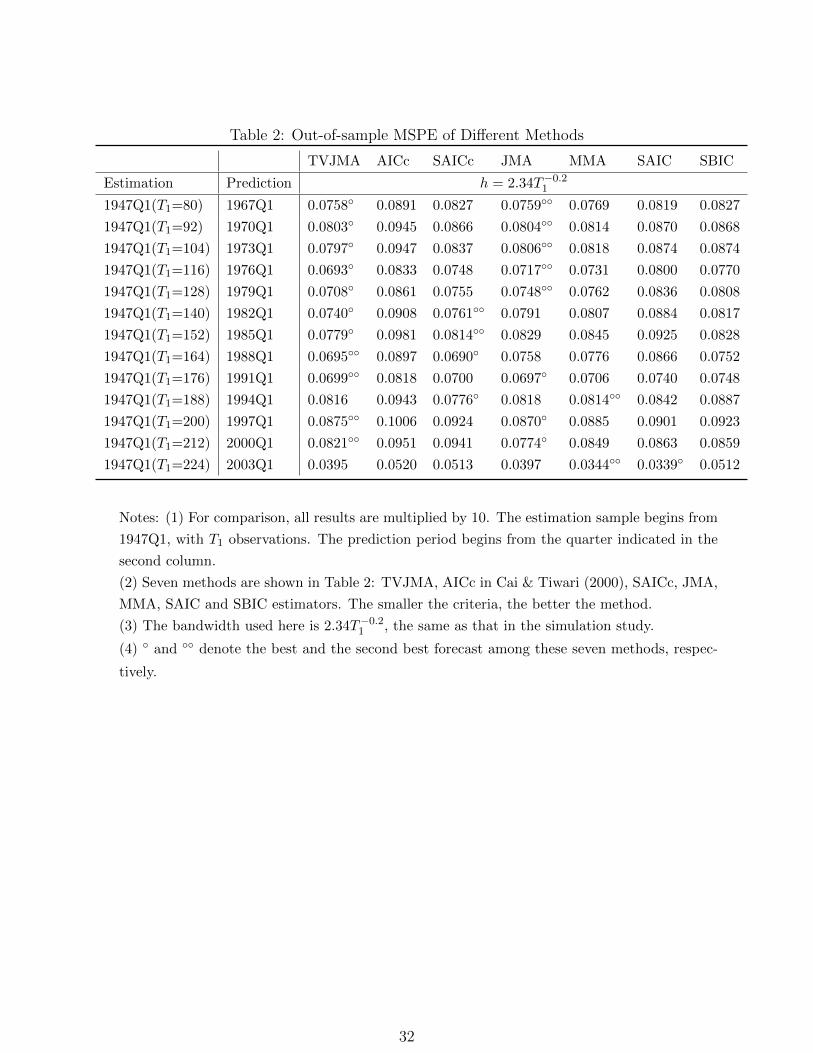
Table 2: Out-of-sample MSPE of Different Methods
TVJMA AICc SAICc JMA MMA SAIC SBIC
Estimation Prediction h = 2.34T−0.21
1947Q1(T1=80) 1967Q1 0.0758 0.0891 0.0827 0.0759 0.0769 0.0819 0.0827
1947Q1(T1=92) 1970Q1 0.0803 0.0945 0.0866 0.0804 0.0814 0.0870 0.0868
1947Q1(T1=104) 1973Q1 0.0797 0.0947 0.0837 0.0806 0.0818 0.0874 0.0874
1947Q1(T1=116) 1976Q1 0.0693 0.0833 0.0748 0.0717 0.0731 0.0800 0.0770
1947Q1(T1=128) 1979Q1 0.0708 0.0861 0.0755 0.0748 0.0762 0.0836 0.0808
1947Q1(T1=140) 1982Q1 0.0740 0.0908 0.0761 0.0791 0.0807 0.0884 0.0817
1947Q1(T1=152) 1985Q1 0.0779 0.0981 0.0814 0.0829 0.0845 0.0925 0.0828
1947Q1(T1=164) 1988Q1 0.0695 0.0897 0.0690 0.0758 0.0776 0.0866 0.0752
1947Q1(T1=176) 1991Q1 0.0699 0.0818 0.0700 0.0697 0.0706 0.0740 0.0748
1947Q1(T1=188) 1994Q1 0.0816 0.0943 0.0776 0.0818 0.0814 0.0842 0.0887
1947Q1(T1=200) 1997Q1 0.0875 0.1006 0.0924 0.0870 0.0885 0.0901 0.0923
1947Q1(T1=212) 2000Q1 0.0821 0.0951 0.0941 0.0774 0.0849 0.0863 0.0859
1947Q1(T1=224) 2003Q1 0.0395 0.0520 0.0513 0.0397 0.0344 0.0339 0.0512
Notes: (1) For comparison, all results are multiplied by 10. The estimation sample begins from
1947Q1, with T1 observations. The prediction period begins from the quarter indicated in the
second column.
(2) Seven methods are shown in Table 2: TVJMA, AICc in Cai & Tiwari (2000), SAICc, JMA,
MMA, SAIC and SBIC estimators. The smaller the criteria, the better the method.
(3) The bandwidth used here is 2.34T−0.21 , the same as that in the simulation study.
(4) and denote the best and the second best forecast among these seven methods, respec-
tively.
32
References
Allen, D. M. (1974). The relationship between variable selection and data agumentation
and a method for prediction. Technometrics 16, 125–127.
Ando, T. & Li, K.-C. (2014). A model-averaging approach for high-dimensional regression.
Journal of American Statistical Association 109, 254–265.
Andrews, D. W. (1991). Asymptotic optimality of generalized CL, cross-validation, and
generalized cross-validation in regression with heteroskedastic errors. Journal of Econo-
metrics 47, 359–377.
Baker, M. & Wurgler, J. (2000). The equity share in new issues and aggregate stock
returns. Journal of Finance 55, 2219–2257.
Blundell, R., Duncan, A. & Pendakur, K. (1998). Semiparametric estimation and
consumer demand. Journal of Applied Econometrics 13, 435–461.
Buckland, S. T., Burnham, K. P. & Augustin, N. H. (1997). Model selection: an
integral part of inference. Biometrics 53, 603–618.
Cai, Z. (2007). Trending time-varying coefficient time series models with serially correlated
errors. Journal of Econometrics 136, 163–188.
Cai, Z. & Tiwari, R. C. (2000). Application of a local linear autoregressive model to bod
time series. Environmetrics 11, 341–350.
Campbell, J. Y. (1990). A variance decomposition for stock returns. Economic Journal
101, 157–179.
Campbell, J. Y. & Shiller, R. J. (1988). The dividend-price ratio and expectations of
future dividends and discount factors. Review of Financial Studies 1, 195–228.
Campbell, J. Y. & Thompson, S. B. (2008). Predicting excess stock returns out of
sample: can anything beat the historical average? Review of Financial Studies 21, 1509–
1531.
Chan, K. S. & Tong, H. (1986). On estimating thresholds in autoregressive models.
Journal of Time Series Analysis 7, 179–190.
Chen, B. (2015). Modeling and testing smooth structural changes with endogenous regres-
sors. Journal of Econometrics 185, 196–215.
Chen, B. & Hong, Y. (2012). Testing for smooth structural changes in time series models
via nonparametric regression. Econometrica 80, 1157–1183.
Cochrane, J. H. (1996). A cross-sectional test of an investment-based asset pricing model.
Journal of Political Economy 104, 572–621.
33
Dahlhaus, R. (1996). On the Kullback-Leibler information divergence of locally stationary
processes. Stochastic Processes and Their Applications 62, 139–168.
Dahlhaus, R. (1997). Fitting time series models to nonstationary processes. Annals of
Statistics 25, 1–37.
Epanechnikov, V. A. (1969). Non-parametric estimation of a multivariate probability
density. Theory of Probability & Its Applications 14, 153–158.
Fama, E. F. & French, K. R. (1988). Dividend yields and expected stock returns. Journal
of Financial Economics 22, 3–25.
Gao, Y., Zhang, X. & Wang, S. (2016). Model averaging based on leave-subject-out
cross-validation. Journal of Econometrics 192, 139–151.
Geisser, S. (1975). The predictive sample reuse method with applications. Journal of
American Statistical Association 70, 320–328.
Grant, A. P. (2002). Time-varying estimates of the natural rate of unemployment: a
revisitation of Okun’s law. Quarterly Review of Economics and Finance 42, 95–113.
Hansen, B. E. (2001). The new econometrics of structural change: dating breaks in US
labor productivity. Journal of Economic Perspectives 15, 117–128.
Hansen, B. E. (2007). Least squares model averaging. Econometrica 75, 1175–1189.
Hansen, B. E. (2008). Least-squares forecast averaging. Journal of Econometrics 146,
342–350.
Hansen, B. E. & Racine, J. S. (2012). Jackknife model averaging. Journal of Econo-
metrics 167, 38–46.
Henderson, D. J. & Parmeter, C. F. (2016). Model averaging over nonparametric
estimators. Advances in Econometrics 36, 539–560.
Hjort, N. L. & Claeskens, G. (2003). Frequentist model average estimators. Journal of
American Statistical Association 98, 879–899.
Hoeting, J. A., Madigan, D., Raftery, A. E. & Volinsky, C. T. (1999). Bayesian
model averaging: a tutorial. Statistical Science 14, 382–401.
Ing, C. K. & Wei, C. Z. (2003). On same-realization prediction in an infinite-order
autoregressive process. Journal of Multivariate Analysis 85, 130–155.
Jin, S., Su, L. & Ullah, A. (2014). Robustify financial time series forecasting with
bagging. Econometric Reviews 33, 575–605.
Lamont, O. (1998). Earnings and expected returns. Journal of Finance 53, 1563–1587.
34
Lehmann, E. L. & Casella, G. (2006). Theory of point estimation. Springer Science &
Business Media.
Lewellen, J. (2004). Predicting returns with financial ratios. Journal of Financial Eco-
nomics 74, 209–235.
Li, K. C. (1987). Asymptotic optimality for Cp, CL, cross-validation and generalized cross-
validation: discrete index set. Annals of Statistics 15, 958–975.
Lin, C. F. J. & Terasvirta, T. (1994). Testing the constancy of regression parameters
against continuous structural change. Journal of Econometrics 62, 211–228.
Liu, C.-A. (2015). Distribution theory of the least squares averaging estimator. Journal of
Econometrics 186, 142–159.
Liu, Q. & Okui, R. (2013). Heteroskedasticity-robust Cp model averaging. Econometrics
Journal 16, 462–473.
Lu, X. & Su, L. (2015). Jackknife model averaging for quantile regressions. Journal of
Econometrics 188, 40–58.
Pesaran, M. H. & Timmermann, A. (2007). Selection of estimation window in the
presence of breaks. Journal of Econometrics 137, 134–161.
Rao, C. R. (1973). Linear statistical inference and its applications. New York: Wiley 2.
Rapach, D. E., Strauss, J. K. & Zhou, G. (2010). Out-of-sample equity premium
prediction: Combination forecasts and links to the real economy. Review of Financial
Studies 23, 821–862.
Rapach, D. E. & Zhou, G. (2013). Forecasting stock returns. Handbook of Economic
Forecasting 2, 328–383.
Robinson, P. M. (1989). Nonparametric estimation of time-varying parameters. Statistical
Analysis and Forecasting of Economic Structural Change 19, 253–264.
Robinson, P. M. (1991). Consistent nonparametric entropy-based testing. Review of
Economic Studies 58, 437–453.
Rossi, B. (2006). Are exchange rates really random walks? Some evidence robust to
parameter instability. Macroeconomic Dynamics 10, 20–38.
Rossi, B. & Sekhposyan, T. (2011). Understanding models forecasting performance.
Journal of Econometrics 164, 158–172.
Rothman, P. (1998). Forecasting asymmetric unemployment rates. Review of Economics
and Statistics 80, 164–168.
35
Rozeff, M. S. (1984). Dividend yields are equity risk premiums. Journal of Portfolio
Management 11, 68–75.
Shao, J. (1997). An asymptotic theory for linear model selection. Statistica Sinica 7,
221–242.
Stock, J. H. & Watson, M. W. (1996). Evidence on structural instability in macroeco-
nomic time series relations. Journal of Business & Economic Statistics 14, 11–30.
Stock, J. H. & Watson, M. W. (2002). Has the business cycle changed and why? NBER
Macroeconomics Annual 17, 159–218.
Stock, J. H. & Watson, M. W. (2003). Forecasting output and inflation: the role of
asset prices. Journal of Economic Literature 41, 788–829.
Stock, J. H. & Watson, M. W. (2005). Understanding changes in international business
cycle dynamics. Journal of European Economic Association 3, 968–1006.
Stock, J. H. & Watson, M. W. (2007). Why has US inflation become harder to forecast?
Journal of Money, Credit and Banking 39, 3–33.
Stock, J. H. & Watson, M. W. (2012). Generalized shrinkage methods for forecasting
using many predictors. Journal of Business & Economic Statistics 30, 481–493.
Stone, M. (1974). Cross-validatory choice and assessment of statistical predictions. Journal
of Royal Statistical Society. Series B (Methodological) 36, 111–147.
Sun, Y., Hong, Y. & Wang, S. (2018). Selection of an optimal rolling window in time-
varying predictive regression. Manuscript, Cornell University .
Twrdy, E. & Batista, M. (2016). Modeling of container throughput in northern adriatic
ports over the period 1990–2013. Journal of Transport Geography 52, 131–142.
Ullah, A., Wan, A. T., Wang, H., Zhang, X. & Zou, G. (2017). A semiparametric
generalized ridge estimator and link with model averaging. Econometric Reviews 36,
370–384.
Vogt, M. (2012). Nonparametric regression for locally stationary time series. Annals of
Statistics 40, 2601–2633.
Wan, A. T., Zhang, X. & Zou, G. (2010). Least squares model averaging by Mallows
criterion. Journal of Econometrics 156, 277–283.
Wang, K. Q. (2003). Asset pricing with conditioning information: a new test. Journal of
Finance 58, 161–196.
Welch, I. & Goyal, A. (2008). A comprehensive look at the empirical performance of
equity premium prediction. Review of Financial Studies 21, 1455–1508.
36
Yang, Y. (2001). Adaptive regression by mixing. Journal of American Statistical Associa-
tion 96, 574–588.
Yuan, Z. & Yang, Y. (2005). Combining linear regression models: when and how? Journal
of American Statistical Association 100, 1202–1214.
Zhang, X. (2015). Consistency of model averaging estimators. Economics Letters 130,
120–123.
Zhang, X. & Liu, C.-A. (2018). Inference after model averaging in linear regression
models. Econometric Theory , DOI:10.1017/S0266466618000269.
Zhang, X., Wan, A. T. & Zou, G. (2013). Model averaging by jackknife criterion in
models with dependent data. Journal of Econometrics 174, 82–94.
Zhu, R., Zhang, X., Wan, A. T. & Zou, G. (2017). Kernel averaging estimators.
Working Paper .
37
Appendix
1 Appendix A.1
Proof of Theorem 1. First we show
Lt,T (wt)/ infw∈HT
Lt,T (w)p→ 1 (A.1)
with Assumptions 1 - 7.
Note that
CVt,T (w) = Lt,T (w) + ε′Ktε+ 2ε′KtA(w)µ− 2ε′KtP(w)ε
= Lt,T (w) + ε′Ktε+ 2ε′KtA(w)µ− 2(ε′KtP(w)ε− tr(KtP(w)Ω))− 2tr(KtP(w)Ω).
With Assumption 7, (A.1) is valid if the following results hold: as T →∞,
supw∈HT
∣∣∣∣∣ε′KtA(w)µ
Rt,T (w)
∣∣∣∣∣ p→ 0, (A.2)
supw∈HT
∣∣∣∣∣ε′KtP(w)ε− tr(KtP(w)Ω)
Rt,T (w)
∣∣∣∣∣ p→ 0, (A.3)
and
supw∈HT
∣∣∣∣∣ Lt,T (w)
Rt,T (w)− 1
∣∣∣∣∣ p→ 0. (A.4)
(A.2)-(A.4) will be verified later.
We next show that
supw∈HT
∣∣∣∣Lt,T (w)
Rt,T (w)− 1
∣∣∣∣ p→ 0. (A.5)
It is straightforward to obtain that
Lt,T (w)−Rt,T (w)
= µ′A′(w)KtA(w)µ+ ε′P′(w)KtP(w)ε− 2µ′A(w)′KtP(w)ε
−[µ′A′(w)KtA(w)µ+ tr(P′(w)KtP(w)Ω)]
= ε′P′(w)KtP(w)ε− tr(P(w)′KtP(w)Ω)− 2µ′A′(w)KtP(w)ε
= D1(w)−D2(w),
where D1(w) = ε′P′(w)KtP(w)ε − tr(P(w)′KtP(w)Ω) and D2(w) = 2µ′A′(w)KtP(w)ε.
Thus, to prove (A.5), we only need to verify the following two results:
supw∈HT
∣∣∣∣ D1(w)
Rt,T (w)
∣∣∣∣ p→ 0. (A.6)
38
and
supw∈HT
∣∣∣∣ D2(w)
Rt,T (w)
∣∣∣∣ p→ 0. (A.7)
Because of the normality assumption, Ω−1/2ε is a vector of independent variables, and this
allows us to use Theorem 2 in Whittle (1960). Thus, based on the Chebyshev’s inequality,
Theorem 2 in Whittle (1960) and Assumption 1, we have, when X is nonstochastic, for any
δ > 0,
Pr
(sup
w∈HT
∣∣∣∣ε′P′(w)KtP(w)ε− tr(P′(w)KtP(w)Ω)
Rt,T (w)
∣∣∣∣ > δ
)≤ Pr( sup
w∈HT
|ε′P′(w)KtP(w)ε− tr(P′(w)KtP(w)Ω)| > δξt,T )
≤ Pr
(sup
w∈HT
MT∑k=1
MT∑m=1
wkwm|ε′P′kKtPmε− tr(P′kKtPmΩ)| > δξt,T
)
≤ Pr
(max
1≤k≤MT
max1≤m≤MT
|ε′P′kKtPmε− tr(P′kKtPm)Ω)| > δξt,T
)= Pr (|ε′P′1KtP1ε− tr(P′1KtP1Ω)| > δξt,T ) ∪
(|ε′P′1KtP2ε− tr(P′1KtP2Ω)| > δξt,T ) ∪ · · · ∪
(|ε′P′1KtPMTε− tr(P′1KtPMT
Ω)| > δξt,T ) ∪
(|ε′P′2KtP1ε− tr(P′2KtP1Ω)| > δξt,T ) ∪ · · · ∪(|ε′P′MT
KtPMTε− tr(P′MT
KtPMTΩ)| > δξt,T
)≤
MT∑k=1
MT∑m=1
Pr (|ε′P′kKtPmε− tr(P′kKtPmΩ)| > δξt,T )
≤MT∑k=1
MT∑m=1
E
[(ε′P′kKtPmε− tr(P′kKtPmΩ))2G
δ2Gξ2Gt,T
]
≤ C4δ−2Gξ−2Gt,T
MT∑k=1
MT∑m=1
[tr(
(P′kKtPmΩ)2)]G
≤ C4δ−2Gξ−2Gt,T
MT∑k=1
MT∑m=1
[ζ(PmΩP′m)kmaxtr(P′kKtPkΩ)]
G
≤ C ′4δ−2Gξ−2Gt,T MT
MT∑m=1
(Rt,T
(w0m
))G, (A.8)
where w0m defines the weight with the m-th element 1 and others 0, and C4 and C ′4 are some
constants. Thus, given Assumption 6, (A.6) with non-stochastic X is verified.
To prove (A.7), we have ||µ′A′kKtPm||2 ≤ ζ2 (Pm) kmaxµ′A′kKtAkµ ≤ Cµ′A′kKtAkµ,
1 ≤ k ≤ MT , 1 ≤ m ≤ MT with Assumption 3. Based on the Chebyshev’s inequality,
39
Theorem 2 in Whittle (1960) and Assumption 1, for any δ > 0, we have
Pr
sup
w∈HT
∣∣∣∣µ′A′(w)KtPt(w)ε
Rt,T (w)
∣∣∣∣ > δ
≤ Pr
sup
w∈HT
∑1≤m≤MT
∑1≤k≤MT
wkwm|µ′(IT −Pk)′KtPmε| > δξt,T
≤ Pr
max
1≤k≤MT
max1≤m≤MT
|µ′(IT −Pk)′KtPmε| > δξt,T
= Pr (|µ′(IT −P1)
′KtP1ε| > δξt,T ) ∪
(|µ′(IT −P′1)KtP2ε| > δξt,T ) ∪ · · · ∪
(|µ′(IT −P1)′KtPMT
ε| > δξt,T ) ∪
(|µ′(IT −P2)′KtP1ε| > δξt,T ) ∪ · · · ∪
(|µ′(IT −PMT)′KtPMT
ε| > δξt,T )
≤∑
1≤k≤MT
∑1≤m≤MT
E
[(µ′(IT −Pk)
′KtPmε)2G
δ2Gξ2Gt,T
]≤ C5δ
−2Gξ−2Gt,T
∑1≤k≤MT
∑1≤m≤MT
||µ′(IT −Pk)′KtPm||2G
≤ C ′5δ−2Gξ−2Gt,T
∑1≤k≤MT
∑1≤m≤MT
(µ′A′kKtAmµ)G
≤ C ′5δ−2Gξ−2Gt,T MT
MT∑m=1
(Rt,T (w0
m))G, (A.9)
where C5 and C ′5 are some constants. Given Assumption 6, (A.7) with non-stochastic X is
verified.
Besides, for the case of random X, based on the dominated convergence theorem, As-
sumption 5 and (A.2), the results in (A.6) and (A.7) are obtained from (A.8) and (A.9),
respectively.
Define
Vt,T (wt) = µ′A′(wt)KtA(wt)µ+ tr(P′(wt)KtP(wt)Ω),
and
Vn(wt) = µ′A′(wt)KtA(wt)µ+ tr(P′(wt)KtP(wt)Ω).
Next, we follow the spirit in Zhang et al. (2013) to obtain
Lt,T (wt)
infw∈HTLt,T (w)
− 1 = supw∈HT
(Lt,T (wt)
Lt,T (w)− 1
)= sup
w∈HT
(Lt,T (wt)
Vt,T (wt)
Rt,T (w)
Lt,T (w)
Rt,T (w)
Rt,T (w)
Vt,T (wt)
Vt,T (wt)
40
× Vt,T (wt)
Lt,T (wt)
Lt,T (w)
Rt,T (w)
Lt,T (wt)
Lt,T (w)− 1
)
≤ supw∈HT
(Lt,T (w)
Rt,T (w)
)sup
w∈HT
(Rt,T (w)
Lt,T (w)
)sup
w∈HT
(Rt,T (w)
Rt,T (w)
)
× supw∈HT
(Rt,T (w)
Rt,T (w)
)sup
w∈HT
(Rt,T (w)
Lt,T (w)
)sup
w∈HT
(Lt,T (w)
Rt,T (w)
)Lt,T (wt)
infw∈HTLt,T (w)
− 1.
Thus, given (A.2)-(A.4), Theorem 1 holds.
Next, we only need to verify (A.2)-(A.4). Denote ξt,T = infw∈HTRt,T (w). If supw∈HT
∣∣∣ Rt,T (w)
Rt,T (w)
−1| ≤ 1, we have
ξ2Gt,T
[MT∑m=1
(Rt,T (w0m))G
]−1
=
[inf
w∈Ht,T
(Rt,T (w)
Rt,T (w)
Rt,T (w)
)]2G MT∑m=1
(Rt,T (w0m))G
(Rt,T (w0
m)
Rt,T (w0m)
)G−1
≥ ξ2Gt,T
[inf
w∈Ht,T
Rt,T (w)
Rt,T (w)
]2G [max
1≤m≤MT
Rt,T (w0m)
Rt,T (w0m)
]−G [MT∑m=1
(Rt,T (w0m))G
]−1
≥ ξ2Gt,T
[1 + inf
w∈HT
(Rt,T (w)
Rt,T (w)− 1
)]2G [sup
w∈HT
(Rt,T (w)
Rt,T (w)− 1
)+ 1
]−G [MT∑m=1
(Rt,T (w0m))G
]−1
≥ ξ2Gt,T
[1− sup
w∈HT
∣∣∣∣∣Rt,T (w)
Rt,T (w)− 1
∣∣∣∣∣]2G [
supw∈HT
∣∣∣∣∣Rt,T (w)
Rt,T (w)− 1
∣∣∣∣∣+ 1
]−G
×
[MT∑m=1
(Rt,T (w0m))G
]−1. (A.10)
Given Assumptions 5 and 6, we obtain the following result from (A.10):
MT ξ−2Gt,T
MT∑m=1
(Rt,T (w0m))G
a.s.→ 0. (A.11)
To prove (A.2), by using the Chebyshev inequality, Theorem 2 of Whittle (1960) and
Assumptions 1-2, we have, for any δ > 0:
Pr
sup
w∈HT
∣∣∣∣∣ε′KtA(w)µ
Rt,T (w)
∣∣∣∣∣ > δ
≤ Pr
sup
w∈HT
M∑m=1
wm|ε′KtA(w0m)µ| > δξt,T
= Pr
max
1≤m≤MT
|ε′KtA(w0m)µ| > δξt,T
41
= Pr
(|ε′KtA(w01)µ| > δξt,T ) ∪ · · · ∪ (|ε′KtA(w0
MT)µ| > δξt,T )
≤
MT∑m=1
Pr|ε′KtA(w0
m)µ| > δξt,T
≤ δ−2Gξ−2Gt,T
MT∑m=1
E(µ′A′(w0m)Ktε)
2G
≤ C1δ−2Gξ−2Gt,T
MT∑m=1
[µ′A′(w0m)KtΩKtA(w0
m)µ]G
≤ C1δ−2Gξ−2Gt,T δG(Ω)
MT∑m=1
(tr(KtA(w0m)µµ′A′(w0
m)Kt))
≤ C1δ−2Gξ−2Gt,T δG(Ω)kmax
MT∑m=1
[µ′A′(w0m)KtA(w0
m)µ]G,
where C1 is a positive constant. Then from (A.11) and Assumptions 2 and 4, we have
supw∈HT
∣∣∣ε′KtA(w)µ
Rt,T (w)
∣∣∣ p→ 0.
Next, we verify (A.3).
Pr
sup
w∈HT
∣∣∣∣∣ε′KtP(w)ε− tr(KtP(w)Ω)
Rt,T (w)
∣∣∣∣∣ > δ
≤MT∑m=1
Pr
sup
∣∣∣∣∣ε′KtP(w0m)ε− tr(KtP(w0
m)Ω)
Rt,T (w0m)
∣∣∣∣∣ > δ
≤ δ−2Gξ−2Gt,T
MT∑m=1
E[|ε′KtP(w0m)ε− tr(KtP(w0
m)Ω)|]2G
≤ C2δ−2Gξ−2Gt,T
MT∑m=1
[tr(Ω
12 P(w0
m)KtΩKtP(w0m)Ω
12
)]≤ C2δ
−2Gξ−2Gt,T ζ(Ω)
MT∑m=1
[tr(P(w0
m)KtP(w0m)Ω
)]≤ C2δ
−2Gξ−2Gt,T ζ(Ω)kmax
MT∑m=1
[tr(P′(w0
m)KtP(w0m)Ω
)],
where C2 is a positive constant. Then from Assumptions 2, 4 and (A.11), we obtain that
supw∈HT
∣∣∣ε′KtP(w)ε−tr(KtP(w)Ω)
Rt,T (w)
∣∣∣ p→ 0.
Finally, we will complete the proof of Theorem 1 by verifying (A.4). Note that
|Lt,T (w)− Rt,T (w)|
= |e′P′(w)KtP(w)e− tr(P′(w)KtP(w)Ω)− 2ε′P′(w)KtA(w)µ|.
42
We only need to prove the following results:
supw∈HT
∣∣∣∣∣ε′P′(w)KtA(w)µ
Rt,T (w)
∣∣∣∣∣ p→ 0 (A.12)
and
supw∈HT
∣∣∣∣∣ε′P′(w)KtP(w)ε− tr(P′(w)KtP(w)Ω)
Rt,T (w)
∣∣∣∣∣ p→ 0. (A.13)
For (A.12), we have that
Pr
(sup
w∈HT
∣∣∣∣∣ε′P′(w)KtA(w)µ
Rt,T (w)
∣∣∣∣∣ > δ
)
≤ Pr
(sup
w∈HT
|ε′P′(w)KtA(w)µ| > δξt,T
)≤
MT∑m=1
Pr(∣∣∣ε′P′(w0
m)KtA(w0m)µ
∣∣∣ > δξt,T
)≤ δ−2Gξ−2Gt,T
MT∑m=1
E|ε′P′(w0m)KtA(w0
m)µ|2G
≤ δ−2Gξ−2Gt,T max1≤m≤MT
P′(w0m
) (µ′A′(w0
m)KtΩKtA(w0m)µ
)G≤ δ−2Gξ−2Gt,T Ckmaxζ (Ω)
(µ′A′
(w0m
)KtA
(w0m
)µ)G
.
Then from (A.11) and Assumptions 2 and 4, supw∈HT
∣∣∣ε′P′(w)KtA(w)µ
Rt,T (w)
∣∣∣ p→ 0. The proof of
(A.13) is similar to that of (A.12), and thus the proof is omitted. It follows that the proof
of (A.3) is completed.
2 Appendix A.2
Proof of Theorem 2. Denote the maximum singular values of matrixes Bi, i = 1, 2, by
ζ(B1) and ζ(B2). It is known that for any square matrices B1 and B2 with identical dimen-
sions, the following simple inequalities are obtained:
ζ(B1B2) ≤ ζ(B1)ζ(B2), (A.14)
and
ζ(B1 +B2) ≤ ζ(B1) + ζ(B2). (A.15)
See more discussions of these inequalities in proof of Theorem 5.2 in Li (1987) and proof of
Theorem 2.2 in Zhang et al. (2013).
43
Let h = h∗
1−h∗ . By Assumption 12, we have h∗ = O(T−1h−1) a.s., h = O(T−1h−1) a.s.,
and then given Assumption 9, we have
h∗ → 0 and h→ 0, a.s.. (A.16)
Let Qm be a T × T diagonal matrix with the (t, t)-th elementhmtt
1−hmtt. Then it is easy to
obtain that Pm = Pm −QmAm, and Am = Am + QmAm. Denote Q(w) =∑MT
m=1wmQm,
Tm = QmPm and T(w) =∑MT
m=1wmTm. To prove Theorem 2, we only need to verify the
following results:
supw∈HT
∣∣∣∣Lt,T (w)
Rt,T (w)− 1
∣∣∣∣ p→ 0, (A.17)
supw∈HT
∣∣∣∣∣Rt,T (w)
Rt,T (w)− 1
∣∣∣∣∣ p→ 0, (A.18)
supw∈HT
∣∣∣∣∣ Lt,T (w)
Rt,T (w)− 1
∣∣∣∣∣ p→ 0, (A.19)
supw∈HT
∣∣∣∣∣µ′A(w)Ktε
Rt,T (w)
∣∣∣∣∣ p→ 0, (A.20)
supw∈HT
∣∣∣∣∣ε′P(w)Ktε
Rt,T (w)
∣∣∣∣∣ p→ 0. (A.21)
Intuitively, (A.17), (A.19) and (A.20) are similar to (A.5), (A.4) and (A.2) in proof of
Theorem 1. To prove (A.17), we have:
supw∈HT
|Lt,T (w)−Rt,T (w)|Rt,T (w)
≤ supw∈HT
|ε′P′(w)KtP(w)ε|Rt,T (w)
+ supw∈HT
|µ′A′(w)KtP(w)ε|Rt,T (w)
+ supw∈HT
tr (P′(w)KtP(w)Ω)
Rt,T (w)
≡ ∆11 + ∆12 + ∆13.
We next show that ∆11 = op(1), ∆12 = op(1) and ∆13 = op(1). For ∆11, we have
|ε′P′(w)KtP(w)ε| ≤ kmaxε′P′(w)P(w)ε. (A.22)
For ∆12, we have
|µ′A′(w)KtP(w)ε|Rt,T (w)
44
≤[kmax
ε′P′(w)P(w)ε
Rt,T (w)
µ′A′(w)KtA(w)µ
Rt,T (w)
] 12
≤[kmax
ε′P′(w)P(w)ε
Rt,T (w)
] 12
. (A.23)
Moreover, it is straightforward to obtain that
Pr
(sup
w∈HT
∣∣∣∣ε′P′(w)P(w)ε− tr(P′(w)P(w)Ω)
Rt,T (w)
∣∣∣∣ > δ
)≤ Pr( sup
w∈HT
|ε′P′(w)P(w)ε− tr(P′(w)P(w)Ω)| > δξt,T )
≤ Pr
(sup
w∈HT
MT∑k=1
MT∑m=1
wkwm|ε′P′kPmε− tr(P′kPmΩ)| > δξt,T
)
≤ Pr
(max
1≤k≤MT
max1≤m≤MT
|ε′P′kPmε− tr(P′kPm)Ω)| > δξt,T
)= Pr (|ε′P′1P1ε− tr(P′1P1Ω)| > δξt,T ) ∪
(|ε′P′1P2ε− tr(P′1P2Ω)| > δξt,T ) ∪ · · · ∪
(|ε′P′1PMTε− tr(P′1PMT
Ω)| > δξt,T ) ∪
(|ε′P′2P1ε− tr(P′2P1Ω)| > δξt,T ) ∪ · · · ∪(|ε′P′MT
PMTε− tr(P′MT
PMTΩ)| > δξt,T
)≤
MT∑k=1
MT∑m=1
Pr (|ε′P′kPmε− tr(P′kPmΩ)| > δξt,T )
≤MT∑k=1
MT∑m=1
E
[(ε′P′kPmε− tr(P′kPmΩ))2
δ2ξ2Gt,T
]
≤ Cδ−2ξ−2t,T
MT∑k=1
MT∑m=1
tr(
(P′kPmΩ)2)
≤ C ′δ−2ξ−2t,TMT
MT∑m=1
(Rt,T
(w0m
)), (A.24)
where C and C ′ are some constants. Then given Assumptions 2 and 10, we have
Pr
(sup
w∈HT
tr(P′(w)P(w)Ω)
Rt,T (w)≥ δ
)≤ Pr
(sup
w∈HT
tr(P′(w)P(w)Ω) ≥ ξt,T δ
)≤ Pr
(ζ(Ω) sup
w∈HT
tr(P′(w)P(w))ξ−1t,T ≥ δ
)→ 0.
Combining this result with (A.22), (A.23) and (A.24), we have ∆11 = op(1) and ∆12 = op(1).
45
For ∆13, we have:
tr(P′(w)KtP(w)Ω)
≤ kmaxtr[P(w)ΩP′(w)]
≤ kmaxζ(Ω)tr(P′(w)P(w)).
Then given Assumptions 2 and 10, we have
Pr
(sup
w∈HT
tr(P′(w)KtP(w)Ω)
Rt,T (w)≥ δ
)≤ Pr
(sup
w∈HT
tr(P′(w)KtP(w)Ω) ≥ ξt,T δ
)≤ Pr
(kmaxζ(Ω) sup
w∈HT
tr(P′(w)P(w))ξ−1t,T ≥ δ
)→ 0,
then ∆13 = op(1). Thus, the proof of (A.17) is completed.
To prove (A.18), we have:
supw∈HT
∣∣∣Rt,T (w)−Rt,T (w)∣∣∣
Rt,T (w)≤ sup
w∈HT
∣∣∣µ′A′(w)KtA(w)µ− µ′A′(w)KtA(w)µ∣∣∣
Rt,T (w)
+ supw∈HT
∣∣∣tr(P(w)KtP′(w)Ω)
∣∣∣Rt,T (w)
+ supw∈HT
|tr(P(w)KtP′(w)Ω)|
Rt,T (w)
≡ ∆21 + ∆22 + ∆23.
Because the matrix P′(w)ΩP(w) is symmetric, ∆23 = ∆13 = op(1). Then we only need to
verify ∆21 = op(1) and ∆22 = op(1). For ∆22,
tr(P(w)KtP
′(w)Ω)
≤ tr (P(w)KtP′(w)Ω) + tr (Q(w)KtQ
′(w)Ω)
+tr (T(w)KtT′(w)Ω) + 2|tr (Q(w)KtP
′(w)Ω) |
+2 |tr (Q(w)KtT′(w)Ω)|+ 2|tr (T(w)KtP
′(w)Ω) |. (A.25)
Given rank(Pm) ≤ T , h∗ = O(T−1h−1) a.s. and h = O(T−1h−1) a.s., terms on the right side
of (A.25) follow that
|tr(Q(w)KtQ′(w)Ω)| ≤ ζ(Q(w))kmax|tr (Q(w)Ω) |
≤ hkmax|tr (Q(w)Ω) |
≤ h
1− h∗ζ(Ω)kmax
MT∑m=1
wm|tr(Pm)|
46
≤ h
1− h∗ζ(Ω)kmax max
1≤m≤MT
rank(Pm) max1≤m≤MT
ζ(Pm)
= O
(h−1ζ(Ω)kmax max
1≤m≤MT
ζ(Pm)
)and
|tr(Q(w)KtP′(w)Ω)| ≤ rank(P(w))ζ(Q(w)KtP
′(w)Ω)
≤ rank(P(w))hkmaxζ(Ω) max1≤m≤MT
ζ(Pm)
= O
(h−1ζ(Ω)kmax max
1≤m≤MT
ζ(Pm)
).
Similarly, for T(w) we have
|tr(T(w)KtP′(w)Ω)| ≤ rank(P(w))ζ (T(w)KtP
′(w)Ω)
≤ rank(P(w))kmaxζ(T(w))ζ(P′(w))ζ(Ω)
≤ rank(P(w))kmaxζ(
MT∑m=1
wmPmQm)ζ(P′(w))ζ(Ω)
≤ hkmaxζ(Ω)rank(P(w)) max1≤m≤MT
ζ2(Pm),
= O
(h−1ζ(Ω)kmax max
1≤m≤MT
ζ2(Pm)
),
|tr(T(w)KtQ′(w)Ω)| ≤ ζ(Ω)h2kmaxrank(P(w)) max
1≤m≤MT
ζ(Pm),
= O
(T−1h−2ζ(Ω)kmax max
1≤m≤MT
ζ(Pm)
),
and
|tr(T(w)KtT′(w)Ω)| ≤ ζ(Ω)h2kmaxrank(P(w)) max
1≤m,k≤MT
ζ2(Pm)
= O
(T−1h−2ζ(Ω)kmax max
1≤m≤MT
ζ2(Pm)
).
Then given Assumption 12, we have Pr
supw∈HT
∣∣∣tr(P(w)KtP(w)Ω)Rt,T (w)
∣∣∣ > δ→ 0. Thus, ∆22 =
op(1).
For ∆21, we have∣∣∣µ′A′(w)KtA(w)µ− µ′A′(w)KtA(w)µ∣∣∣ /Rt,T (w)
=
∣∣∣∣∣MT∑k=1
MT∑m=1
wkwm
(µ′A′kKtAmµ− µ′A′kKtAmµ
)∣∣∣∣∣ /Rt,T (w)
47
=
∣∣∣∣∣MT∑k=1
MT∑m=1
wkwm [µ′(Ak + QkAk)
′Kt(Am + QmAm)µ− µ′A′kKtAmµ]∣∣∣∣∣ /Rt,T (w)
=
∣∣∣∣∣MT∑k=1
MT∑m=1
wkwm [µ′A′kQ′kKtQ
′mµ] + 2
MT∑k=1
MT∑m=1
wkwmµ′A′kQ′kKtAmµ
∣∣∣∣∣ /Rt,T (w),
∣∣∣∣∣MT∑k=1
MT∑m=1
wkwmµ′A′kQ′kKtAmµ
∣∣∣∣∣ /Rt,T (w)
=
∣∣∣∣∣MT∑k=1
wkµ′A′kQ′kKtA(w)µ
∣∣∣∣∣ /Rt,T (w)
≤
[µ′
MT∑m=1
wmAmQm
MT∑k=1
wkQkAkµµ′A(w)K2
tA(w)µ/R2t,T (w)
] 12
≤
[kmax
MT∑k=1
MT∑m=1
wkwmµ′AkQkQmAmµ′/Rt,T (w)
] 12
,
and
MT∑k=1
MT∑m=1
wkwmµ′AkQkKtQmAmµ/Rt,T (w)
≤ 2kmaxξ−1t,T
MT∑k=1
MT∑m=1
wkwmµ′(AkQkQmAm + AmQmQkAk)µ
≤ kmaxξ−1t,Tµ
′µ max1≤k≤MT
max1≤m≤MT
ζ(AkQkQmAm)
≤ kmaxξ−1t,T h
2µ′µ→ 0.
Then ∆21 = op(1) and thus (A.18) is proved.
For (A.19),
Lt,T (w)− Rt,T (w) = ε′P′(w)KtP(w)ε− 2µ′A′(w)KtP(w)ε− tr(P(w)′KtP(w)Ω
)≡ ∆31 + ∆32 + ∆33.
Firstly, for ∆32, ∣∣∣∣∣µ′A′(w)KtP(w)ε
Rt,T (w)
∣∣∣∣∣≤
[ε′P(w)′KtP(w)ε(µ′A(w)′KtA(w)µ)
R2t,T (w)
] 12
≤
[ε′P′(w)KtP(w)ε
Rt,T (w)
] 12
.
48
Besides, we can obtain that
ε′P′(w)KtP(w)ε
≤ ε′P′(w)KtP(w)ε+ ε′Q′(w)KtQ(w)ε
+ε′T′(w)KtT(w)ε+ 2|ε′P(w)KtT(w)ε|
+2|ε′P(w)KtQ(w)ε|+ 2|ε′Q(w)KtT(w)ε|. (A.26)
Terms on the right side of (A.26) follow that:
2|ε′P(w)KtT(w)ε| ≤ [ε′P′(w)KtP(w)εε′T′(w)KtT(w)ε]12 ,
2|ε′P(w)KtQ(w)ε| ≤ [ε′P′(w)KtP(w)εε′Q′(w)KtQ(w)ε]12 ,
2|ε′Q(w)KtT(w)ε| ≤ [ε′T′(w)KtT(w)εε′Q(w)KtQ(w)ε]12 .
Furthermore,
ε′Q′(w)KtQ(w)ε =
MT∑k=1
MT∑m=1
wkwmε′QkKtQmε
≤MT∑m=1
MT∑m=1
wkwmε′εζ(QkKtQm) ≤ kmaxh2ε′ε.
Similarly, ε′T′(w)KtT(w)ε ≤ kmax max1≤m≤MTζ(Pm)h2ε′ε. Combining the proof of ∆11 in
(A.17), we obtain ∆31 and ∆32 are both op(1). The proof of ∆33 is similar to that of (A.18)
and is omitted here. Thus, (A.19) is proved.
For (A.20), given Assumption 6′ and (A.15), we have
Pr
sup
w∈HT
∣∣∣∣∣µ′A(w)Ktε
Rt,T (w)
∣∣∣∣∣ > δ
≤ Pr
sup
w∈HT
∣∣∣µ′A(w)Ktε∣∣∣ > δξt,T
≤
MT∑m=1
Pr∣∣∣µ′A′t(w0
m)Ktε∣∣∣ > δξt,T
≤ δ−2ξ−2t,T
MT∑m=1
E(µ′A′(w0
m)Ktε)2
= δ−2ξ−2t,T
MT∑m=1
tr(µ′A′(w0
m)KtΩKtA′(w0
m)µ)
≤ kmaxδ−2ξ−2t,T ζ(Ω)
MT∑m=1
RT (w0m)→ 0.
Thus, (A.20) is proved. And the proof of (A.21) is similar and is omitted here. Given
(A.17)-(A.21), Theorem 2 is valid.
49
3 Appendix A.3
Proof of Theorem 2′. First recall that the normality assumption in the proof of Theorem
1 is to make Ω−1/2ε be a vector of independent variables. Now, we directly assume that ε is a
vector of independent variables. From the proof steps in Appendix A.1, it is straightforward
to know that when the normality assumption in Theorem 1 is replaced by the assumption that
ε is a vector of independent variables, the conclusion of Theorem 1 still holds. In addition,
when ε is a vector of independent variables, Ω is a diagonal matrix and so Assumption 7
holds automatically. Hence, to prove Theorem 2′, we need only to verify Assumption 5.
It is seen that
supw∈HT
∣∣∣Rt,T (w)−Rt,T (w)∣∣∣
Rt,T (w)≤ sup
w∈HT
∣∣∣µ′A′(w)KtA(w)µ− µ′A′(w)KtA(w)µ∣∣∣
Rt,T (w)
+ supw∈HT
∣∣∣tr(P(w)KtP′(w)Ω)− tr(P(w)KtP
′(w)Ω)∣∣∣
Rt,T (w)
≡ ∆5 + ∆6. (A.27)
From the proof of ∆21 = op(1) in Appendix A.2, we have
∆5 = o(1), a.s.. (A.28)
In addition,
tr(P(w)KtP′(w)Ω)− tr(P(w)KtP
′(w)Ω)
= tr((P(w)−Q(w) + T(w))Kt(P(w)−Q(w) + T(w))′Ω)− tr(P(w)KtP′(w)Ω),
which, along with Assumptions 6′, 8 and 12, implies
∆6 = o(1), a.s.. (A.29)
From (A.27)-(A.29), we can verify Assumption 5. This completes the proof.
4 Appendix A.4
Proof of Theorem 3. For TVJMA, we have D ≡∑MT
m=1wmDm = Q(w)+IT . Denote Xmc
as a matrix consisting of columns of X except for Xm, i.e, Xmc = XΠ′mc with a selection
matrix Πmc , βmt = Πmβt, and βmct = Πmcβt. Then, let Ξ be an MT ×MT matrix with the
(i, j)-th element:
Ξij = (ε+ Xicβict )′(IT −Pi)(QiKt + KtQj + QiKtQj)(IT −Pj)(ε+ Xjcβ
jct ),
50
and thus
CVt,T (w) = (Y −P(w)Y)′Kt(Y −P(w)Y) + w′Ξw
≡ CMt,T (w) + w′Ξw,
where CMt,T (w) ≡ (Y−P(w)Y)′Kt(Y−P(w)Y). Based on (A.14)-(A.15) and Assumptions
3, 12-14, we have
(ε+ Xicβict )′(IT −Pi)(QiKt + KtQj + QmKtQj)(IT −Pj)(ε+ Xjcβ
jct )
≤∣∣∣∣(ε+ Xicβ
ict )∣∣∣∣ ∣∣∣∣ε+ Xjcβ
jct
∣∣∣∣× ζ (IT −Pi)(QiKt + KtQj + QmKtQj)(IT −Pj)
≤∣∣∣∣(ε+ Xicβ
ict )∣∣∣∣ ∣∣∣∣ε+ Xjcβ
jct
∣∣∣∣ kmax
2h∗ + (h∗)2
(1 + max
1≤m≤MT
ζ(Pm))2
= Op(1).
Thus, for any w, w′Ξw = Op(1).
Next, we will show that ||√Th(βt(wt)− βt)|| = Op(1). It is seen that
CMt,T (w) = (Y −P(w)Y)′Kt(Y −P(w)Y)
= (µ+ ε−Xβt(w))′Kt(µ+ ε−Xβt(w))
= ε′Ktε+ (βt(w)− βt)′X′KtX(βt(w)− βt)− 2ε′KtX(βt(w)− βt).
When wj = 1 (j /∈ U) for any fixed time point t, we have CMt,T (w) = ε′Ktε + ηjt,T , where
U is a set of under-fitted models and ηjt,T ≡ (βj
t − βt)′X′KtX(βj
t − βt)− 2ε′KtX(βj
t − βt).With Assumptions 8, 13-14 and Proposition A.1 of Chen & Hong (2012), it is shown that
βj
t − βt = Π′j(Xj′KtX
j)−1Xj′KtY − βt
= Π′j(Xj′KtX
j)−1Xj′Kt
(X
(βt +
s− tTβ
(1)t +O(h2)
)+ ε
)− βt
= Π′j(Xj′KtX
j)−1Xj′Ktε+ h
∫ 1
−1k(u)uduOp(ζ(ΠjEXtX
′t)) +O(h2)
= Op(1/√Th) +O(h2), t ∈ [Th, T − Th],
where β(1)t is the first derivative of βt. Then, we have
ηjt,T = ((Xj′KtXj)−1Xj′Ktε+O(h2))′ΠjX
′KtXΠ′j((Xj′KtX
j)−1Xj′Ktε+O(h2))
−2ε′KtXΠ′j((Xj′KtX
j)−1Xj′Ktε+O(h2))
= −ε′KtXj(Xj′KtX
j)−1Xj′Ktε+Op(h4ζ(Xj′KtX
j))
= Op(1) +Op(Th5) = Op(1),
based on h = cT−λ for 15≤ λ < 1, where 0 < c < ∞. If t in the interior region [Th, T −
Th],∫ 1
−1 k(u)udu = 0 with Assumption 8. If t in the right boundary region [T − Th, T ],
51
∫ c−1 k(u)udu 6= 0 with Assumption 8, and thus we have β
j
t − βt = Π′j(Xj′KtX
j)−1Xj′Ktε+
h∫ c−1 k(u)uduOp(ζ(ΠjEXtX
′t))+O(h2) = Op(1/
√Th)+O(h), and ηjt,T = Op(1)+Op(Th
3) =
Op(1), which is based on h = cT−λ for 13≤ λ < 1, where 0 < c <∞. The similar result holds
for the left boundary region [1, Th]. Thus, CMt,T (wt) ≤ ε′Ktε+ηjt,T +Op(1) for t/T ∈ [0, 1].
This implies that
ηjt,T ≥ CMt,T (wt)− ε′Ktε
= (βt(wt)− βt)′X′KtX(βt(wt)− βt)− 2ε′KtX(βt(wt)− βt). (A.30)
From (A.30), we have
ζmin(Ψt,T )||√Th(βt(wt)− βt)||2
≤ (βt(wt)− βt)′X′KtX(βt(wt)− βt)
≤ ηjt,T + 2ε′KtX(βt(wt)− βt)
≤ ηjt,T + 2∣∣∣∣T−1/2h−1/2ε′KtX
∣∣∣∣ ∣∣∣∣∣∣√Th(βt(wt)− βt)∣∣∣∣∣∣ ,
and thus
ζmin(Ψt,T )[∣∣∣∣∣∣√Th(βt(wt)− βt)
∣∣∣∣∣∣− ζ−1min(Ψt,T )∣∣∣∣T−1/2h−1/2ε′KtX
∣∣∣∣]2≤ ηjt,T + ζ−1min(Ψt,T )
∣∣∣∣T−1/2h−1/2ε′KtX∣∣∣∣2 . (A.31)
From (A.31), we have
√Th||βt(wt)− βt|| ≤
ζ−1min(Ψt,T )
[ηjt,T + ζ−1min(Ψt,T )||T−1/2h−1/2ε′KtX||2
]1/2+ζ−1min(Ψt,T )||T−1/2h−1/2ε′KtX||,
and
√Th||βt(wt)− βt|| ≥ −
ζ−1min(Ψt,T )
[ηjt,T + ζ−1min(Ψt,T )||T−1/2h−1/2ε′KtX||2
]1/2+ζ−1min(Ψt,T )||T−1/2h−1/2ε′KtX||.
Therefore, we have√Th||βt(wt)− βt|| = Op(1), with Assumption 14.
5 Appendix A.5
Following Vogt (2012), the process Yt is locally stationary if for each rescaled time point
τ ∈ [0, 1] there exists an associated strictly stationary process Yt(τ) with ||Yt − Yt(τ)|| =
Op(h + 1T
). Thus, for every time t, we can replace YL, in the neighbourhood of t (i.e.,
[t − Th, t + Th]), by a strictly stationary process Yt(τ) with a small cost Op(h + 1T
), where
τ = t/T . We replace Yt(τ) with xt to simplify the notation. Denote λmin(A) and λmax(A) as
the minimum and maximum eigenvalues of matrix A, respectively.
Before proving Theorem 4, we need to prove the following four lemmas:
52
Lemma 1. Under Assumptions 18 and 20, for any q > 0 and all θ > 0,
Eλ−qmin
(Rt,T (r1)
)= O(r
(2+θ)q1 ), (A.32)
where Rt,T (r1) = 1(T−r1)h
∑T−1j=r1
x(r1)j kjtx
(r1)′
j and x(r1)j ≡ (xj, · · · , xj−r1+1)
′ in the augmented
regression model.
Proof of Lemma 1. For notational simplicity, define xj = x(r1)j and A =
1 a1 · · · ar1−1
0 1...
.... . . a1
0 · · · 0 1
.
Following the spirit of Lemma 1 in Ing and Wei (2003), we consider the following trans-
formation of xj, φj = Ak1/2jt xj = Btxj = %j + ςj for any fixed time point t, where
%j = (%j, · · · , %j−r1+1)′, and ςj = (ςj1 , · · · , ςjr1 )′ with ςji , 1 ≤ i ≤ r1, being a linear combina-
tion of %l, l ≤ j − r1. It is easy to obtain the following results:
(F1) %j is independent of ς l1 ,%l2 for l1 ≤ j and l2 ≤ j − r1,(F2) λ−1min(
∑T−1j=r1
xjkjtx′j) ≤ λmax(B
′tBt)λ
−1min(
∑T−1j=r1
φjφ′j),
(F3) λmax(B′tBt) = O(1) for any fixed time point t.
In view of (F2) and (F3), (A.32) follows from
E
((T − r1)q hqλ−qmin
(T−1∑j=r1
φjφ′j
))≤ C
(r(2+θ)1
)q, (A.33)
which is the same as Eq (2.6) in Ing and Wei (2003). With (F1), the proof of (A.33) is similar
to Eq (2.6) in Ing and Wei (2003). To save the space, we omit the proof of (A.33).
Denote Rt(r1) = Extx′t and ||C||2 = λmax(C
′C) as the maximum eigenvalue of the matrix
C′C.
Lemma 2. Under Assumptions 20 and 21, and sup−∞<t<∞ E|εt|2q <∞ for some q ≥ 2, we
have
E||Rt,T (r1)−Rt(r1)||q ≤ C
(r21
(T − r1)h
)q/2, (A.34)
where C is some positive constant.
Proof of Lemma 2. Note that
E||Rt,T (r1)−Rt(r1)||q ≤rq1r21
r1∑i=1
r1∑j=1
E|γi,j,t − γi−j,t|q, (A.35)
53
where γi,j,t and γi−j,t denote the (i, j) components of Rt,T (r1) and Rt(r1), respectively. With
Proposition 1 in Mathematical Appendix of Chen and Hong (2012), we obtain that
E|γi,j,t − γi−j,t| = E
∣∣∣∣∣T−1∑s=r1
xs−i+1kstxs−j+1 −T−1∑s=r1
Exs−i+1kstxs−j+1
∣∣∣∣∣ = O(((T − r1)h)−1/2).
Then E||Rt,T (r1) − Rt(r1)||q ≤ Crq1r21r21O(((T − r1)h)−q/2) = C
(r21
(T−r1)h
)q/2. This proof is
completed.
Lemma 3. Under Assumption 20, if sup−∞<t<∞ E(|εt|q) <∞ for q ≥ 2, then for 1 ≤ pm ≤r1 with r1 ≤ T − 1,
E
∥∥∥∥∥ 1√(T − r1)h
T−1∑j=r1
kjtx(m)j εj+1
∥∥∥∥∥q
≤ C(pm)q/2,
where C is some positive constant, and pm is the lag order of dependent variables in mth
candidate model.
Proof of Lemma 3. Following the spirit of Eq (3.8) in Ing and Wei (2003), it is shown
that
E
∥∥∥∥∥ 1√T − r1
T−1∑j=r1
kjtx(m)j εj+1
∥∥∥∥∥q
≤ pq/2m p−1m
k−1∑l=0
E
((T − r1)h)−
q2
∣∣∣∣∣T−1∑j=r1
kjtxj−1εj+1
∣∣∣∣∣q
.
With Assumption 12 and the convexity of xq/2, x > 0, there exists some constant C satisfying
E
(1
(T − r1)h
T−1∑j=r1
x2j−l
)q/2
≤ 1
T − r1
T−1∑j=r1
E|xj−l|q ≤ C.
Thus, this lemma is proved.
Lemma 4. If Assumptions 15, 18 and 19 hold, r6+δ1 = O(T ) for some δ > 0, and
sup−∞<t<∞ E(|εt|2q1) < ∞ for some q1 ≥ 2, then for any 0 < q < q1, E∥∥∥R−1t,T (r1)
∥∥∥q ≤ C,
and E∥∥∥R−1t,T (r1)−R−1t (r1)
∥∥∥q/2 ≤ C(
r21(T−r1)h
)q/4, where C is some positive constant.
Proof of Lemma 4. Given Lemma 1, we obtain that∥∥∥R−1t,T (r1)−R−1t (r1)∥∥∥q ≤ ∥∥∥R−1t,T (r1)
∥∥∥q ∥∥∥Rt,T (r1)−Rt(r1)∥∥∥q ∥∥R−1t (r1)
∥∥q ,almost surely for large T . Based on the Holder’s inequality and Lemma 2, we have
E∥∥∥R−1t,T (r1)−R−1t (r1)
∥∥∥q ≤ C(E∥∥∥Rt,T (r1)−Rt(r1)
∥∥∥q1)q/q1 (r2+θ1 )q ≤ C
(r6+2θ1
(T − r1)h
)q/2,
54
for sufficiently large T . Set 2θ ≤ δ, and with the assumption that r6+δ1 = O(T ), E||R−1t,T (r1)|| ≤C is obtained. Moreover, since the Cauchy-Schwarz inequality gives
E||R−1t,T (r1)−R−1t (r1)||q/2 ≤ C(E||R−1t,T (r1)||q)1/2(E||Rt,T (r1)−Rt(r1)||q)1/2,
Lemma 4 is proved.
Proof of Theorem 4. The proof of Theorem 4 is similar to the proof of Theorem 3.1 in
Zhang et al. (2013). First, substitute Vt,T (w), Vt,T (w), ξ∗t,T , ξ∗t,T , σ2IT and “in probability”,
for Rt,T (w), Rt,T (w), ξt,T , ξt,T , Ω and “a.s.”, respectively in Theorem 2 and its proof. To
prove Theorem 4, we need to verify that
ξ∗−1t,T hε′ε = op(1), (A.36)
supw∈HT
ξ∗−1t,T ε′KtP(w)′P(w)Ktε = op(1), (A.37)
supw∈HT
ξ∗−1t,T ε′KtP(w)ε = op(1), (A.38)
and
supw∈HT
∣∣∣∣∣µ′A(w)Ktε
Vt,T (w)
∣∣∣∣∣ = op(1). (A.39)
Since µ′Ktε is unrelated to w, we can equally prove
supw∈HT
∣∣∣∣∣µ′P(w)Ktε
Vt,T (w)
∣∣∣∣∣ = op(1), (A.40)
instead of (A.39). According to (A.19), for proving (A.40), we only need to verify
ξ∗−1t,T supw∈HT
∣∣∣µ′P(w)Ktε∣∣∣ = op(1). (A.41)
Considering that ε1, . . . , εT is i.i.d and Eε4i < ∞, we have that ε′ε = Op(T ). Then
given (A.16) and Assumption 16, (A.36) is proved.
Before the proof of (A.37), we verify some equations first. With Lemma 3 and Assump-
tions 18-19, we have
T−1h−1E(ε′KtYLY′LKtε)
= T−1h−1E[ε′Kt
(YL(τ) +Op(h+
1
T)
)(YL(τ) +Op
(h+
1
T
))′Ktε
]= T−1h−1E (ε′KtYL(τ)Y′L(τ)Ktε) +O
(h+
1
T
)
55
= O(r1) +O
(h+
1
T
)= O(r1). (A.42)
Uniformly for m = 1, · · · ,MT , (A.42) is valid in mth candidate model at any given time
point t. Thus by Markov’s inequality,
T−1h−1r−11 ε′KtYLY′LKtε
′ = Op(1). (A.43)
Also, by Assumption 17, we have
T−1h−1ε′KtX∗X∗
′Ktε = Op(1). (A.44)
Thus we have
T−1h−1γ−1ε′KtXX′Ktε = Op(1). (A.45)
By Lemma 4 and Assumptions 18-19, we have
ThE(ζ((Y′LKtYL)−1)
)= ThE
[ζ
((Y′L(τ)KtYL(τ) +O
(h+
1
T
))−1)]= O(1).
(A.46)
By Markov’s equality, we have
Thζ(
(Y′LKtYL)−1)
= Op(1). (A.47)
Let Jt = (Y′LKtYL)−1Y′LKtX∗(X∗
′MtX
∗)−1/2. By Rao (1973), it can be shown that
(X′KtX)−1 =
((Y′LKtYL)−1 + JtJ
′t −Jt(X
∗′MtX∗)−1/2
−(X∗′MtX
∗)−1/2Jt (X∗′MtX
∗)−1
)
=
((Y′LKtYL)−1 0
0 0
)+ 2
(JtJ
′t 0
0 (X∗′MtX
∗)−1
)
−
(JtJ
′t Jt(X
∗′MtX∗)−1/2
(X∗′MtX
∗)−1/2Jt (X∗′MtX
∗)−1
). (A.48)
Thus
ζ(
(X′KtX)−1)≤ ζ
((Y′LKtYL)
−1)
+ 2 max
ζJtJ
′t, ζ
((X∗′MtX
∗)−1)
≤ ζ(
(Y′LKtYL)−1)
+ 2 maxζ(
(Y′LKtYL)−1)ζ(T−1(X∗
′KtX
∗))ζ(T−1(X∗
′MtX
∗)−1),
T−1ζ
(T−1
(X∗′MtX
∗)−1)
. (A.49)
Combining (A.47) and (A.49), we have
Thζ(
(X′KtX)−1)
= Op(1). (A.50)
56
Getting back to the proof of (A.37), we notice that KtP′PKt = zij1≤i,j≤T , where
zij ≡ kitkjtXi
T∑s=1
(X′KsX)−1X′skiskjsXs(X′KsX)−1X′j.
Notice that for any (i, j) such that |i− t| > 2Th or |j − t| > 2Th, we obtain that zij = 0.
Since 1Th
X′KsXp→ Rs ≡ EX′sXs, we have
zijp→ kitkjtT 2h2
Xi
(T∑s=1
R−1s X′skiskjsXsR−1s
)X′j ≡ z∗ij.
By Assumption 21, it is straightforward to obtain that Rs = Rt + O(|t− s|/T ) and kit = 0
for |i− t| > Th. With the fact that kis = ksi, we have
z∗ij = kitkjtXiR−1t
1
T 2h2
T∑s=1
X′skiskjsXsR−1t X′j +Op
(1
T 2h
)
≤ kmaxkitkjtXiR−1t
1
T 2h2
T∑s=1
X′sksiXsR−1t X′j
p→ kmaxkitkjtXiR−1t
1
ThRiR
−1t X′j
= kmaxkitkjtXiR−1t
1
ThRtR
−1t X′j +Op
(1
T 2h
)=
kmax
ThkitXiR
−1t X′jkjt, if i, j ∈ [t− Th, t+ Th],
and then as T →∞,
ε′KtP′PKtε ≤
k2max
Thε′KtXR−1t X′Ktε ≤
k2maxζ(R−1t )
Thε′KtXX′Ktε.
For R−1t , since 1Th
X′KtXp→ Rt, and combining this with (A.49), we have that
Thζ(R−1t ) = Op(1). (A.51)
Then given (A.45), we have
1
Thγε′KtXR−1t X′Ktε = Op(1). (A.52)
Therefore,
γ−1ε′KtP′PKtε = Op(1). (A.53)
Given Assumption 16 that γξ∗−1t,T = op(1), we have ξ∗−1t,T ε′KtP
′PKtε = op(1). Similarly, we
can obtain
γ−1ε′KtP′mPmKtε = Op(1), (A.54)
57
and ξ∗−1t,T ε′KtP
′mPmKtε = op(1). Then if m 6= j, we have
γ−1ε′KtP′mPjKtε ≤ γ−1ε′Kt(P
′mPm + P′jPj)Ktε/2 = Op(1), (A.55)
and ξ∗−1t,T ε′KtP
′mPjKtε = op(1). Given (A.54) and (A.55), we have
supw∈HT
γ−1ε′KtP′(w)P(w)Ktε = sup
w∈HT
γ−1ε′Kt
MT∑m=1
MT∑j=1
wmwjP′mPjKtε
≤ max1≤j≤MT
max1≤m≤MT
γ−1ε′KtP′mPjKtε = Op(1). (A.56)
This completes the proof of (A.37). Similarly, we obtain (A.38).
For (A.41), we obtain that
supw∈HT
∣∣∣µ′A(w)Ktε∣∣∣
≤ supw∈HT
|µ′P(w)Ktε|+ supw∈HT
|µ′Q(w)Ktε|+ supw∈HT
|µ′T(w)Ktε|
= supw∈HT
|ε′KtP′(w)µ|+ sup
w∈HT
|ε′KtQ(w)µ|+ supw∈HT
|ε′KtT′(w)µ|
≤ supw∈HT
(ε′KtP′(w)P(w)Ktεµ
′µ)1/2 + supw∈HT
(ε′Ktεµ′Q′(w)KtQ(w)µ)1/2
+ supw∈HT
(ε′Ktεµ′T(w)KtT
′(w)µ)1/2
≤ supw∈HT
(ε′KtP′(w)P(w)Ktεµ
′µ)1/2 + (k2maxh2ε′εµ′µ)1/2 + max
1≤m≤MT
ζ(Pm)(k2maxh2ε′εµ′µ)1/2
= supw∈HT
ξ∗t,T ((γξ∗−2t,T µ′µ)γ−1ε′KtP(w)P(w)Ktε)
1/2 +
(1 + max
1≤m≤MT
ζ(Pm)
)(k2maxh
2ε′εµ′µ)1/2
=(ξ∗t,T
((γξ∗−2t,T µ
′µ)×Op(1))1/2)
+
(1 + max
1≤m≤MT
ζ(Pm)
)ξ∗t,T
((Tγ−1h)(k2maxγξ
∗−1t,T )(ξ∗−1t,T hε
′ε)(T−1µ′µ))1/2
, (A.57)
where the last step is based on (A.56). Given Assumption 3, Assumption 16, (A.16), (A.36),
and (A.37), we obtain (A.41). This completes the proof.
58
![Image hiding based on time-averaging moiréto construct digital time-averaged image in Fig. 1 is discussed in detail in [12]. 3. Image hiding based on time-averaging geometric moiré](https://img.pdfslide.us/doc/110x75/60d6cb793bd0d1121d468f1b/image-hiding-based-on-time-averaging-moir-to-construct-digital-time-averaged-image.jpg)


![Time averaging for functional differential equationsdownloads.hindawi.com/journals/jam/2003/424169.pdf · 2019-08-01 · 2 Time averaging for functional differential equations onfinitetimeintervals.Theresultisnotnew(see[10]andthereferences](https://img.pdfslide.us/doc/110x75/5f097d087e708231d42710c6/time-averaging-for-functional-differential-2019-08-01-2-time-averaging-for-functional.jpg)