Embed Size (px)
Citation preview
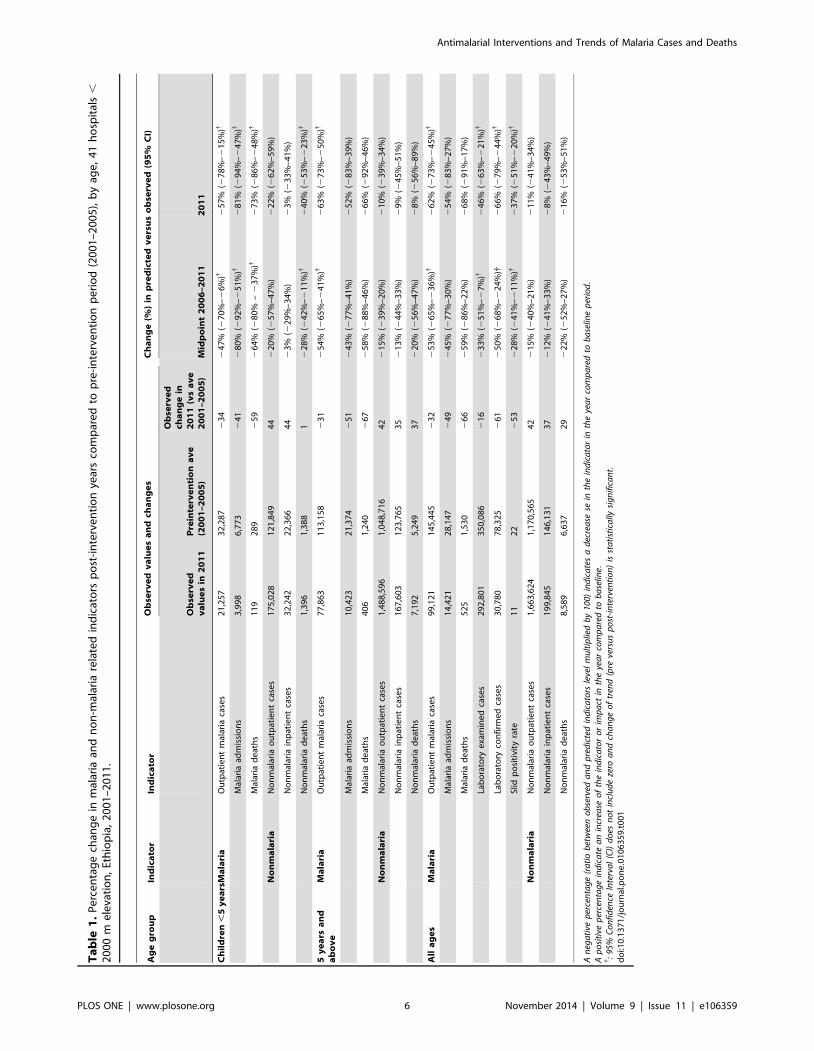
Time Series Analysis of Trends in Malaria Cases andDeaths at Hospitals and the Effect of AntimalarialInterventions, 2001–2011, EthiopiaMaru Aregawi1*, Michael Lynch1, Worku Bekele2, Henok Kebede2, Daddi Jima3, Hiwot Solomon Taffese3,
Meseret Aseffa Yenehun3, Abraham Lilay3, Ryan Williams1, Madeleine Thomson4,
Fatoumata Nafo-Traore2, Kesetebirhan Admasu3, Tedros Adhanom Gebreyesus3, Marc Coosemans5
1 World Health Organization, Global Malaria Program, Geneva, Switzerland, 2 World Health Organization, Country Office, Addis Ababa, Ethiopia, 3 Federal Ministry of
Health, Addis Ababa, Ethiopia, 4 International Research Institute for Climate and Society (IRI), Earth Institute, Columbia University, New York, New York, United States of
America, 5 Institute of Tropical Medicine, Antwerp, Belgium
Abstract
Background: The Government of Ethiopia and its partners have deployed artemisinin-based combination therapies (ACT)since 2004 and long-lasting insecticidal nets (LLINs) since 2005. Malaria interventions and trends in malaria cases and deathswere assessed at hospitals in malaria transmission areas during 2001–2011.
Methods: Regional LLINs distribution records were used to estimate the proportion of the population-at-risk protected byLLINs. Hospital records were reviewed to estimate ACT availability. Time-series analysis was applied to data from 41hospitals in malaria risk areas to assess trends of malaria cases and deaths during pre-intervention (2001–2005) and post-interventions (2006–2011) periods.
Findings: The proportion of the population-at-risk potentially protected by LLINs increased to 51% in 2011. The proportionof facilities with ACTs in stock exceeded 87% during 2006–2011. Among all ages, confirmed malaria cases in 2011 declinedby 66% (95% confidence interval [CI], 44–79%) and SPR by 37% (CI, 20%–51%) compared to the level predicted by pre-intervention trends. In children under 5 years of age, malaria admissions and deaths fell by 81% (CI, 47%–94%) and 73% (CI,48%–86%) respectively. Optimal breakpoint of the trendlines occurred between January and June 2006, consistent with thetiming of malaria interventions. Over the same period, non-malaria cases and deaths either increased or remainedunchanged, the number of malaria diagnostic tests performed reflected the decline in malaria cases, and rainfall remainedat levels supportive of malaria transmission.
Conclusions: Malaria cases and deaths in Ethiopian hospitals decreased substantially during 2006–2011 in conjunction withscale-up of malaria interventions. The decrease could not be accounted for by changes in hospital visits, malaria diagnostictesting or rainfall. However, given the history of variable malaria transmission in Ethiopia, more data would be required toexclude the possibility that the decrease is due to other factors.
Citation: Aregawi M, Lynch M, Bekele W, Kebede H, Jima D, et al. (2014) Time Series Analysis of Trends in Malaria Cases and Deaths at Hospitals and the Effect ofAntimalarial Interventions, 2001–2011, Ethiopia. PLoS ONE 9(11): e106359. doi:10.1371/journal.pone.0106359
Editor: Yoel Lubell, Mahidol-Oxford Tropical Medicine Research Unit, Thailand
Received May 7, 2014; Accepted July 30, 2014; Published November 18, 2014
This is an open-access article, free of all copyright, and may be freely reproduced, distributed, transmitted, modified, built upon, or otherwise used by anyone forany lawful purpose. The work is made available under the Creative Commons CC0 public domain dedication.
Data Availability: The authors confirm that all data underlying the findings are fully available without restriction. The data is provided in a supplementary file.
Funding: The author(s) received no specific funding for this work.
Competing Interests: The authors have declared that no competing interests exist.
* Email: [email protected]
Background
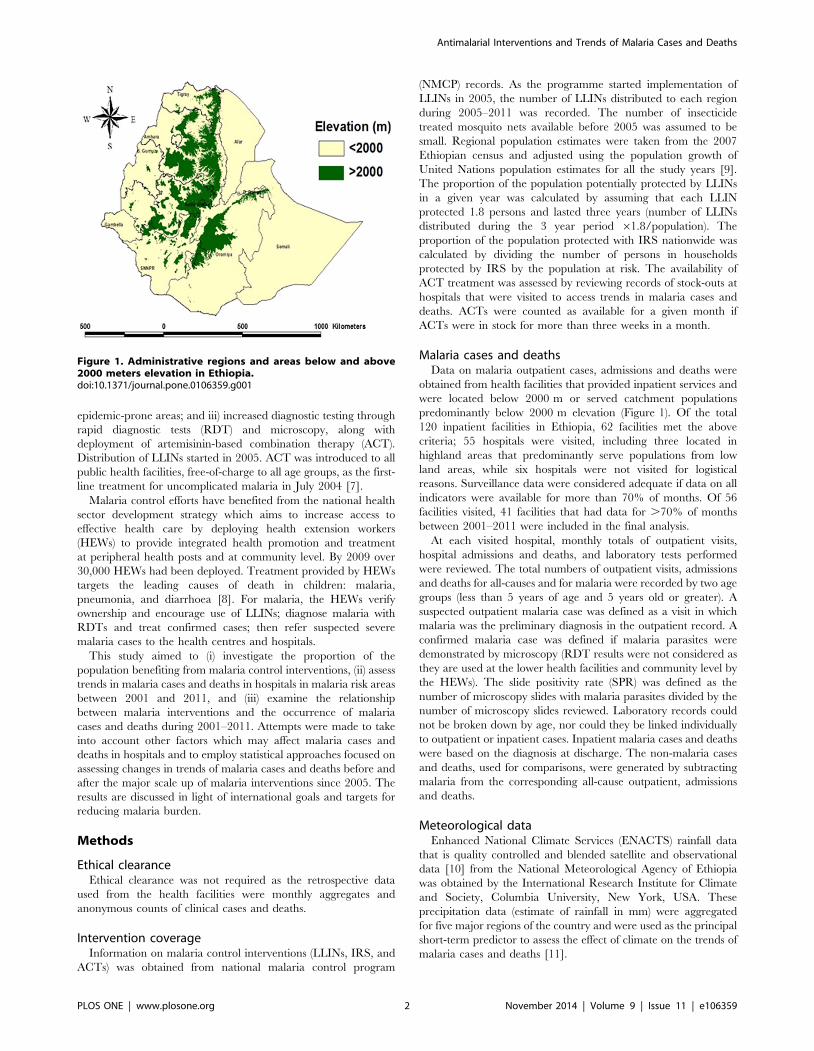
Malaria affects over 68% of the population in Ethiopia, a
country of 94 million people in 2013 [1]. The disease is highly
seasonal with varying intensity of transmission owing to altitudinal
and climatic variations [2]. Across the nine administrative regions,
areas that lie below 2000 m altitude are considered as malarious
(Figure 1) [3]. The occurrence of malaria epidemics in the past
indicates that there is little immunity in the majority of the
population, owing to few infective mosquito bites per person per
year [4,5]. The high transmission season coincides with the
cultivation months; hence malaria has a deleterious effect on
agricultural production. Plasmodium falciparum accounted for
nearly 55% of all malaria cases during 2008–2012 [6].
Malaria control has been one of the major components of the
country’s National Heath Sector Development and Poverty
Reduction Strategy, put forth since 2004 in different phases, the
most recent plan being for the period 2010–2015. With investment
by the Global Fund to Fight HIV/AIDS, Tuberculosis and
Malaria, the USA President’s Malaria Initiative, World Bank and
other development partners, the government has employed three
key antimalarial interventions: i) distribution of long-lasting
insecticidal nets (LLINs) through mass campaigns, to the entire
population at risk; ii) indoor residual spraying (IRS) in designated
PLOS ONE | www.plosone.org 1 November 2014 | Volume 9 | Issue 11 | e106359
epidemic-prone areas; and iii) increased diagnostic testing through
rapid diagnostic tests (RDT) and microscopy, along with
deployment of artemisinin-based combination therapy (ACT).
Distribution of LLINs started in 2005. ACT was introduced to all
public health facilities, free-of-charge to all age groups, as the first-
line treatment for uncomplicated malaria in July 2004 [7].
Malaria control efforts have benefited from the national health
sector development strategy which aims to increase access to
effective health care by deploying health extension workers
(HEWs) to provide integrated health promotion and treatment
at peripheral health posts and at community level. By 2009 over
30,000 HEWs had been deployed. Treatment provided by HEWs
targets the leading causes of death in children: malaria,
pneumonia, and diarrhoea [8]. For malaria, the HEWs verify
ownership and encourage use of LLINs; diagnose malaria with
RDTs and treat confirmed cases; then refer suspected severe
malaria cases to the health centres and hospitals.
This study aimed to (i) investigate the proportion of the
population benefiting from malaria control interventions, (ii) assess
trends in malaria cases and deaths in hospitals in malaria risk areas
between 2001 and 2011, and (iii) examine the relationship
between malaria interventions and the occurrence of malaria
cases and deaths during 2001–2011. Attempts were made to take
into account other factors which may affect malaria cases and
deaths in hospitals and to employ statistical approaches focused on
assessing changes in trends of malaria cases and deaths before and
after the major scale up of malaria interventions since 2005. The
results are discussed in light of international goals and targets for
reducing malaria burden.
Methods
Ethical clearanceEthical clearance was not required as the retrospective data
used from the health facilities were monthly aggregates and
anonymous counts of clinical cases and deaths.
Intervention coverageInformation on malaria control interventions (LLINs, IRS, and
ACTs) was obtained from national malaria control program
(NMCP) records. As the programme started implementation of
LLINs in 2005, the number of LLINs distributed to each region
during 2005–2011 was recorded. The number of insecticide
treated mosquito nets available before 2005 was assumed to be
small. Regional population estimates were taken from the 2007
Ethiopian census and adjusted using the population growth of
United Nations population estimates for all the study years [9].
The proportion of the population potentially protected by LLINs
in a given year was calculated by assuming that each LLIN
protected 1.8 persons and lasted three years (number of LLINs
distributed during the 3 year period 61.8/population). The
proportion of the population protected with IRS nationwide was
calculated by dividing the number of persons in households
protected by IRS by the population at risk. The availability of
ACT treatment was assessed by reviewing records of stock-outs at
hospitals that were visited to access trends in malaria cases and
deaths. ACTs were counted as available for a given month if
ACTs were in stock for more than three weeks in a month.
Malaria cases and deathsData on malaria outpatient cases, admissions and deaths were
obtained from health facilities that provided inpatient services and
were located below 2000 m or served catchment populations
predominantly below 2000 m elevation (Figure 1). Of the total
120 inpatient facilities in Ethiopia, 62 facilities met the above
criteria; 55 hospitals were visited, including three located in
highland areas that predominantly serve populations from low
land areas, while six hospitals were not visited for logistical
reasons. Surveillance data were considered adequate if data on all
indicators were available for more than 70% of months. Of 56
facilities visited, 41 facilities that had data for .70% of months
between 2001–2011 were included in the final analysis.
At each visited hospital, monthly totals of outpatient visits,
hospital admissions and deaths, and laboratory tests performed
were reviewed. The total numbers of outpatient visits, admissions
and deaths for all-causes and for malaria were recorded by two age
groups (less than 5 years of age and 5 years old or greater). A
suspected outpatient malaria case was defined as a visit in which
malaria was the preliminary diagnosis in the outpatient record. A
confirmed malaria case was defined if malaria parasites were
demonstrated by microscopy (RDT results were not considered as
they are used at the lower health facilities and community level by
the HEWs). The slide positivity rate (SPR) was defined as the
number of microscopy slides with malaria parasites divided by the
number of microscopy slides reviewed. Laboratory records could
not be broken down by age, nor could they be linked individually
to outpatient or inpatient cases. Inpatient malaria cases and deaths
were based on the diagnosis at discharge. The non-malaria cases
and deaths, used for comparisons, were generated by subtracting
malaria from the corresponding all-cause outpatient, admissions
and deaths.
Meteorological dataEnhanced National Climate Services (ENACTS) rainfall data
that is quality controlled and blended satellite and observational
data [10] from the National Meteorological Agency of Ethiopia
was obtained by the International Research Institute for Climate
and Society, Columbia University, New York, USA. These
precipitation data (estimate of rainfall in mm) were aggregated
for five major regions of the country and were used as the principal
short-term predictor to assess the effect of climate on the trends of
malaria cases and deaths [11].
Figure 1. Administrative regions and areas below and above2000 meters elevation in Ethiopia.doi:10.1371/journal.pone.0106359.g001
Antimalarial Interventions and Trends of Malaria Cases and Deaths
PLOS ONE | www.plosone.org 2 November 2014 | Volume 9 | Issue 11 | e106359
Statistical methodsStata 11 was used to compile data by year and month and
perform statistical analysis [12]. Trends in confirmed malaria cases
and SPR, malaria inpatient cases, and malaria deaths were
assessed by region. Malaria inpatient cases and malaria deaths
were assessed by the two age groups. Confirmed malaria cases and
SPR were assessed for all ages as these could not be disaggregated
by age. Change in indicators over time was evaluated in three
ways: i) by comparing the mean of annual values of cases and
deaths during 2001–2005 (considered the pre-intervention period)
to the observed value for 2011; ii) using a segmented regression
model of an interrupted time series [13], comparing observed
2011 to predicted values in 2011, assuming a continuation of the
pre-intervention time trend through 2006–2011; and iii) compar-
ing the average for the observed values for 2006–2011 with the
midpoint level predicted using segmented regression, assuming a
continuation of the pre-intervention time trend through 2006–
2011. The magnitude of changes in indicators was expressed as the
relative percent change. For (ii) and (iii), the model adjusts the
estimate for (1) possible time trend of the indicator during the pre-
intervention period; (2) a possible immediate drop or rise of the
indicator following the start of the intervention, and (3) a time
trend on the indicator post-intervention. The 95% confidence
intervals (CI) around the estimates were computed using the CIs
around the regression coefficient estimates. A relative percent
change in an indicator for which the CI does not include zero was
considered statistically significant. In the time-series regression
model for (ii) and iii), an Autoregressive Integrated Moving
Average (ARIMA) model was used. A correlogram and partial
autocorrelation plots were used to guide selection of the best
ARIMA model [14].
To provide insight into whether changes in malaria cases and
deaths were related to the introduction of malaria interventions in
time, a sensitivity analysis was done by dividing the time series into
two segments, a pre-intervention and post-intervention period,
and varying the dividing point and evaluating the segmented
regression model for each break point. The optimal breakpoint, or
the month with the maximum change in the trend line, was
considered to be the point where the amount of variation
accounted for by the segmented regression model (R2) was
greatest [15].
Month-to-month variability in indicators was evaluated using
monthly values of the indicators during pre-and post-intervention
periods using sinusoidal functions. To observe and remove short-
term seasonal fluctuations, the monthly trends were extracted
using a Hodrick-Prescott filter with monthly smoothing parameter
[16]. Spectral analysis was done to detect the fundamental
frequency components of the series. Additionally, month effects
were parametrically modeled by using sinusoidal functions
(Indirect Discrete Fourier Transform (IDFT).
The time trend in monthly rainfall, the principal short-term
predictor of malaria burden [17], was plotted by region.
Results
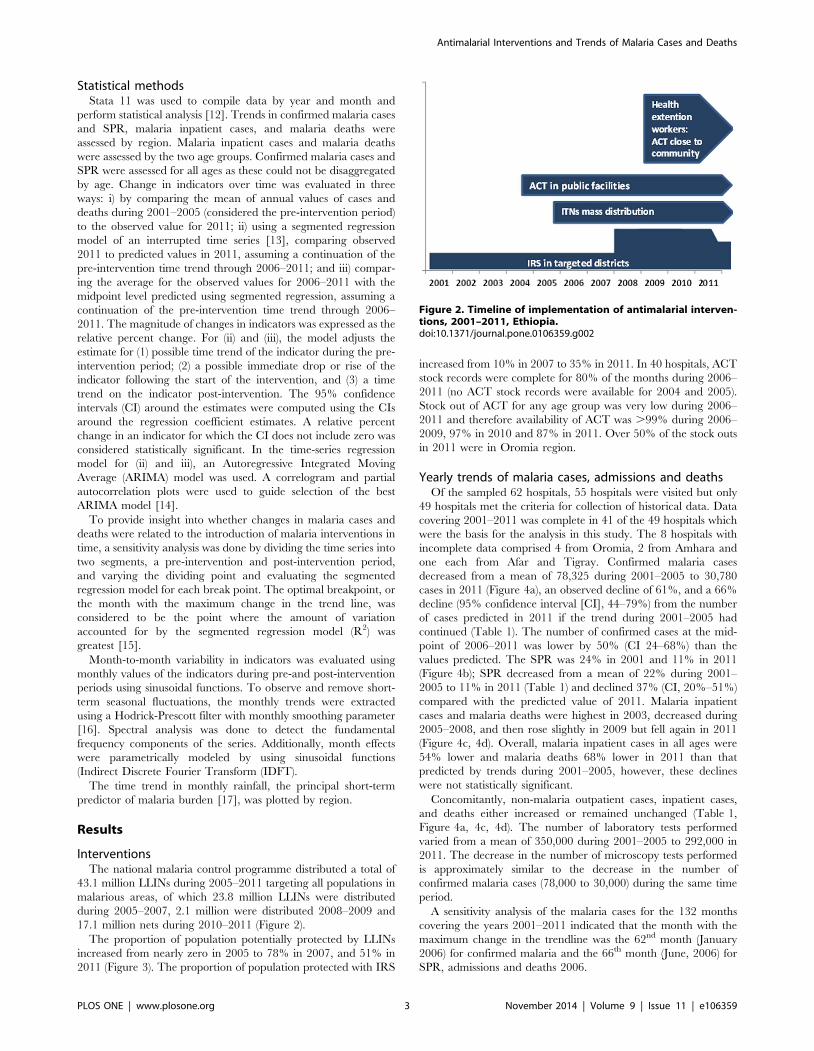
InterventionsThe national malaria control programme distributed a total of
43.1 million LLINs during 2005–2011 targeting all populations in
malarious areas, of which 23.8 million LLINs were distributed
during 2005–2007, 2.1 million were distributed 2008–2009 and
17.1 million nets during 2010–2011 (Figure 2).
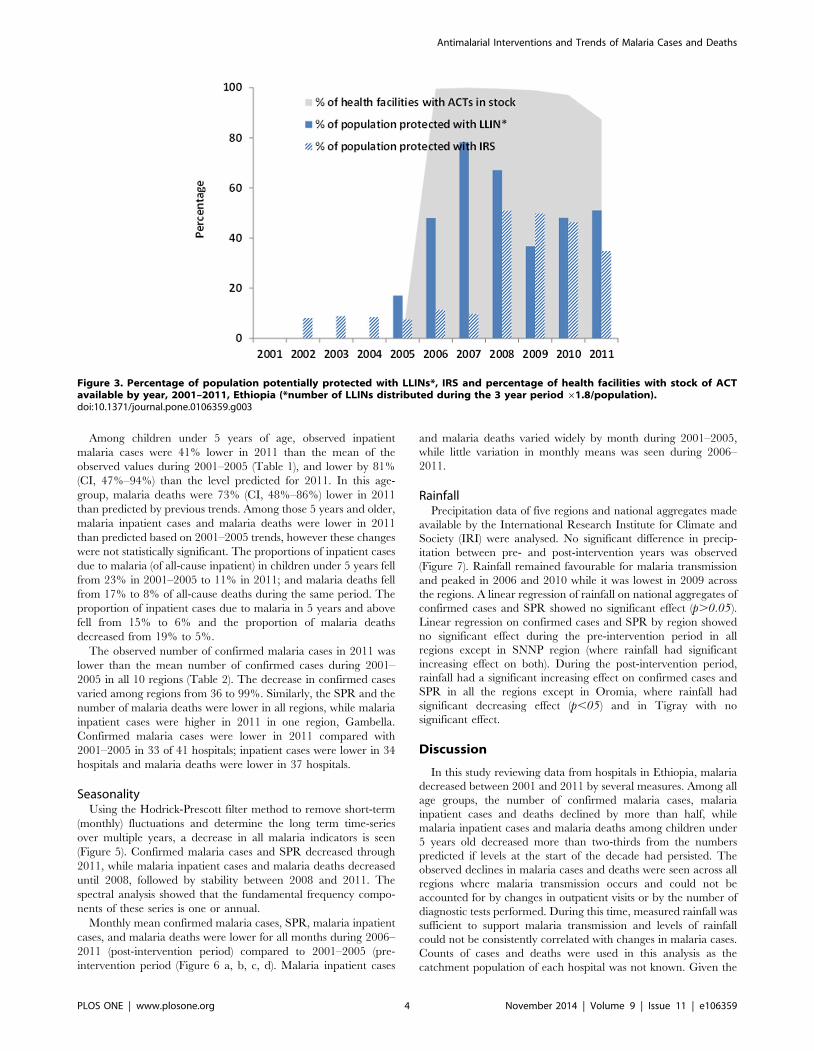
The proportion of population potentially protected by LLINs
increased from nearly zero in 2005 to 78% in 2007, and 51% in
2011 (Figure 3). The proportion of population protected with IRS
increased from 10% in 2007 to 35% in 2011. In 40 hospitals, ACT
stock records were complete for 80% of the months during 2006–
2011 (no ACT stock records were available for 2004 and 2005).
Stock out of ACT for any age group was very low during 2006–
2011 and therefore availability of ACT was .99% during 2006–
2009, 97% in 2010 and 87% in 2011. Over 50% of the stock outs
in 2011 were in Oromia region.
Yearly trends of malaria cases, admissions and deathsOf the sampled 62 hospitals, 55 hospitals were visited but only
49 hospitals met the criteria for collection of historical data. Data
covering 2001–2011 was complete in 41 of the 49 hospitals which
were the basis for the analysis in this study. The 8 hospitals with
incomplete data comprised 4 from Oromia, 2 from Amhara and
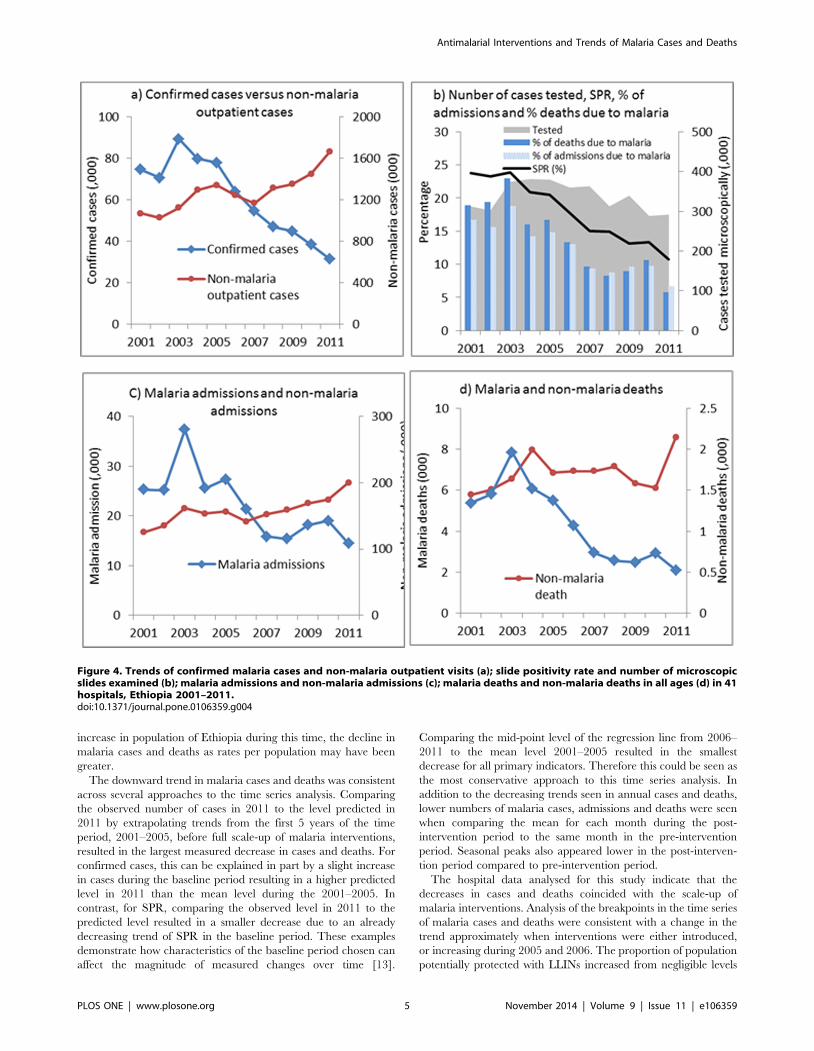
one each from Afar and Tigray. Confirmed malaria cases
decreased from a mean of 78,325 during 2001–2005 to 30,780
cases in 2011 (Figure 4a), an observed decline of 61%, and a 66%
decline (95% confidence interval [CI], 44–79%) from the number
of cases predicted in 2011 if the trend during 2001–2005 had
continued (Table 1). The number of confirmed cases at the mid-
point of 2006–2011 was lower by 50% (CI 24–68%) than the
values predicted. The SPR was 24% in 2001 and 11% in 2011
(Figure 4b); SPR decreased from a mean of 22% during 2001–
2005 to 11% in 2011 (Table 1) and declined 37% (CI, 20%–51%)
compared with the predicted value of 2011. Malaria inpatient
cases and malaria deaths were highest in 2003, decreased during
2005–2008, and then rose slightly in 2009 but fell again in 2011
(Figure 4c, 4d). Overall, malaria inpatient cases in all ages were
54% lower and malaria deaths 68% lower in 2011 than that
predicted by trends during 2001–2005, however, these declines
were not statistically significant.
Concomitantly, non-malaria outpatient cases, inpatient cases,
and deaths either increased or remained unchanged (Table 1,
Figure 4a, 4c, 4d). The number of laboratory tests performed
varied from a mean of 350,000 during 2001–2005 to 292,000 in
2011. The decrease in the number of microscopy tests performed
is approximately similar to the decrease in the number of
confirmed malaria cases (78,000 to 30,000) during the same time
period.
A sensitivity analysis of the malaria cases for the 132 months
covering the years 2001–2011 indicated that the month with the
maximum change in the trendline was the 62nd month (January
2006) for confirmed malaria and the 66th month (June, 2006) for
SPR, admissions and deaths 2006.
Figure 2. Timeline of implementation of antimalarial interven-tions, 2001–2011, Ethiopia.doi:10.1371/journal.pone.0106359.g002
Antimalarial Interventions and Trends of Malaria Cases and Deaths
PLOS ONE | www.plosone.org 3 November 2014 | Volume 9 | Issue 11 | e106359
Among children under 5 years of age, observed inpatient
malaria cases were 41% lower in 2011 than the mean of the
observed values during 2001–2005 (Table 1), and lower by 81%
(CI, 47%–94%) than the level predicted for 2011. In this age-
group, malaria deaths were 73% (CI, 48%–86%) lower in 2011
than predicted by previous trends. Among those 5 years and older,
malaria inpatient cases and malaria deaths were lower in 2011
than predicted based on 2001–2005 trends, however these changes
were not statistically significant. The proportions of inpatient cases
due to malaria (of all-cause inpatient) in children under 5 years fell
from 23% in 2001–2005 to 11% in 2011; and malaria deaths fell
from 17% to 8% of all-cause deaths during the same period. The
proportion of inpatient cases due to malaria in 5 years and above
fell from 15% to 6% and the proportion of malaria deaths
decreased from 19% to 5%.
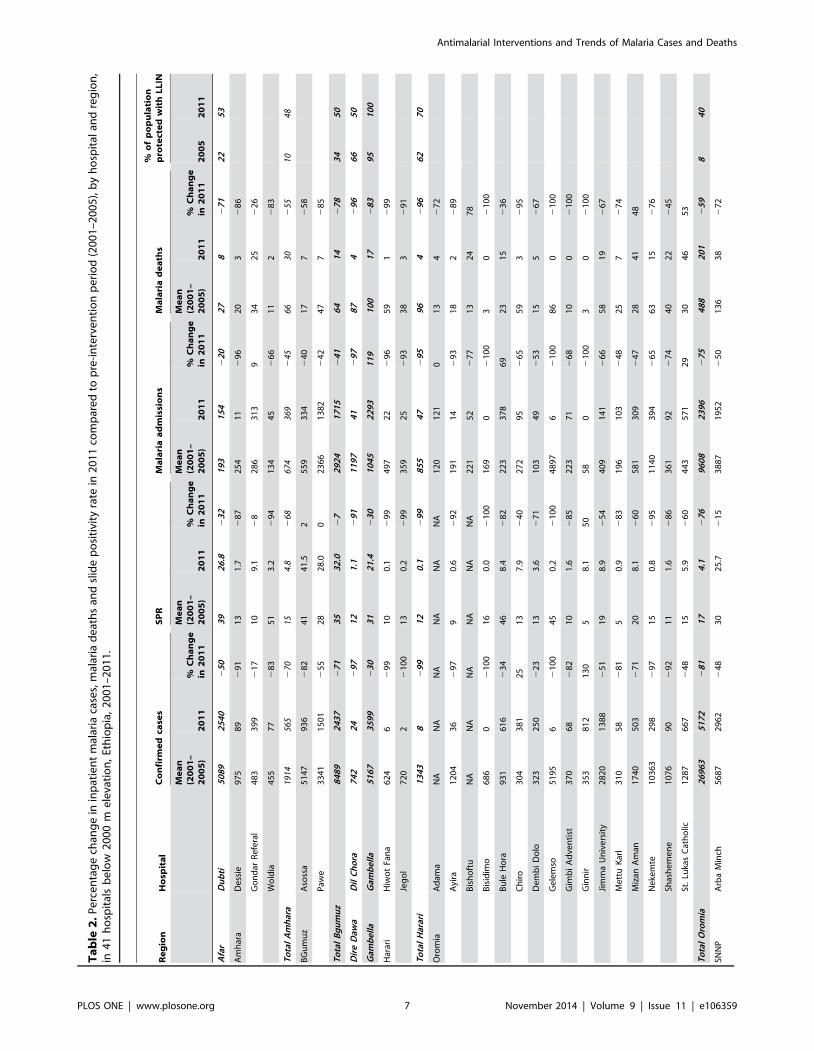
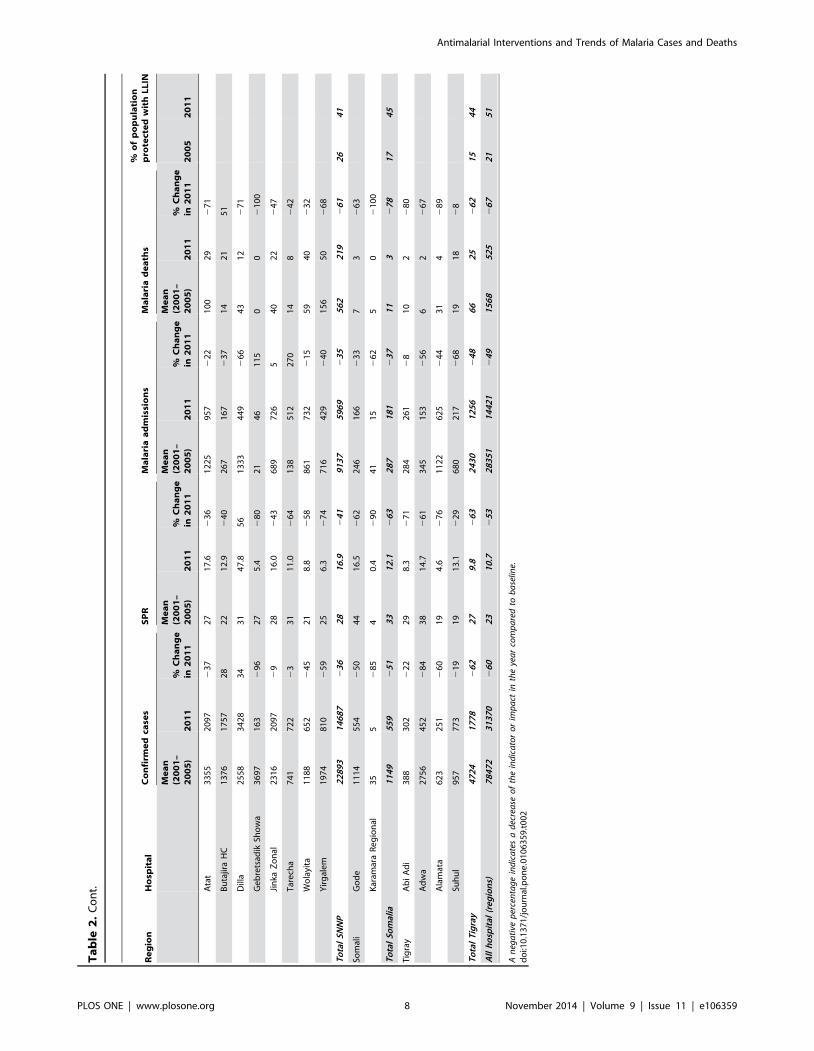
The observed number of confirmed malaria cases in 2011 was
lower than the mean number of confirmed cases during 2001–
2005 in all 10 regions (Table 2). The decrease in confirmed cases
varied among regions from 36 to 99%. Similarly, the SPR and the
number of malaria deaths were lower in all regions, while malaria
inpatient cases were higher in 2011 in one region, Gambella.
Confirmed malaria cases were lower in 2011 compared with
2001–2005 in 33 of 41 hospitals; inpatient cases were lower in 34
hospitals and malaria deaths were lower in 37 hospitals.
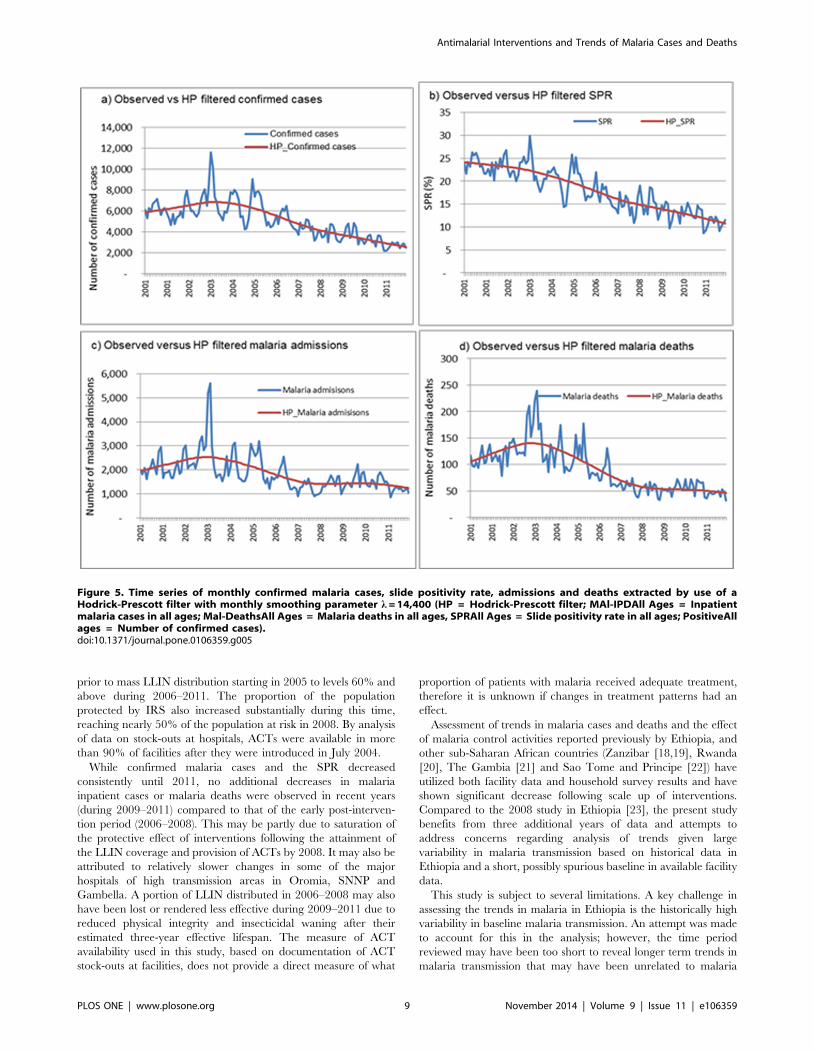
SeasonalityUsing the Hodrick-Prescott filter method to remove short-term
(monthly) fluctuations and determine the long term time-series
over multiple years, a decrease in all malaria indicators is seen
(Figure 5). Confirmed malaria cases and SPR decreased through
2011, while malaria inpatient cases and malaria deaths decreased
until 2008, followed by stability between 2008 and 2011. The
spectral analysis showed that the fundamental frequency compo-
nents of these series is one or annual.
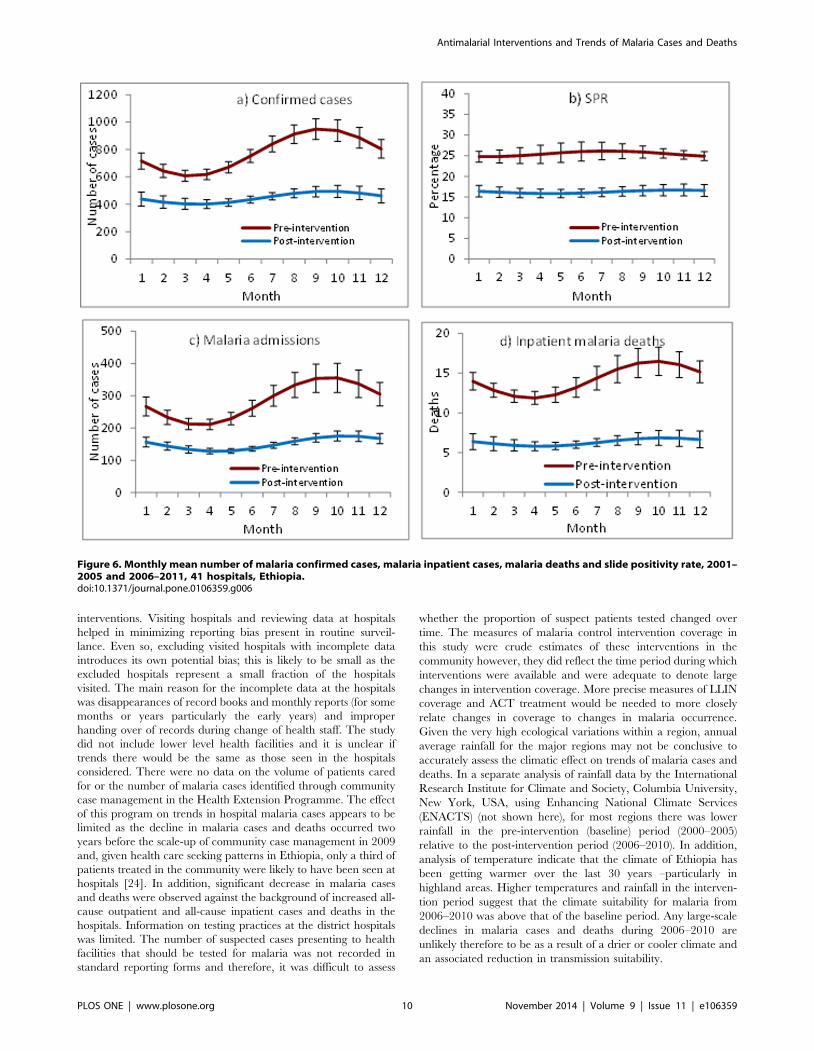
Monthly mean confirmed malaria cases, SPR, malaria inpatient
cases, and malaria deaths were lower for all months during 2006–
2011 (post-intervention period) compared to 2001–2005 (pre-
intervention period (Figure 6 a, b, c, d). Malaria inpatient cases
and malaria deaths varied widely by month during 2001–2005,
while little variation in monthly means was seen during 2006–
2011.
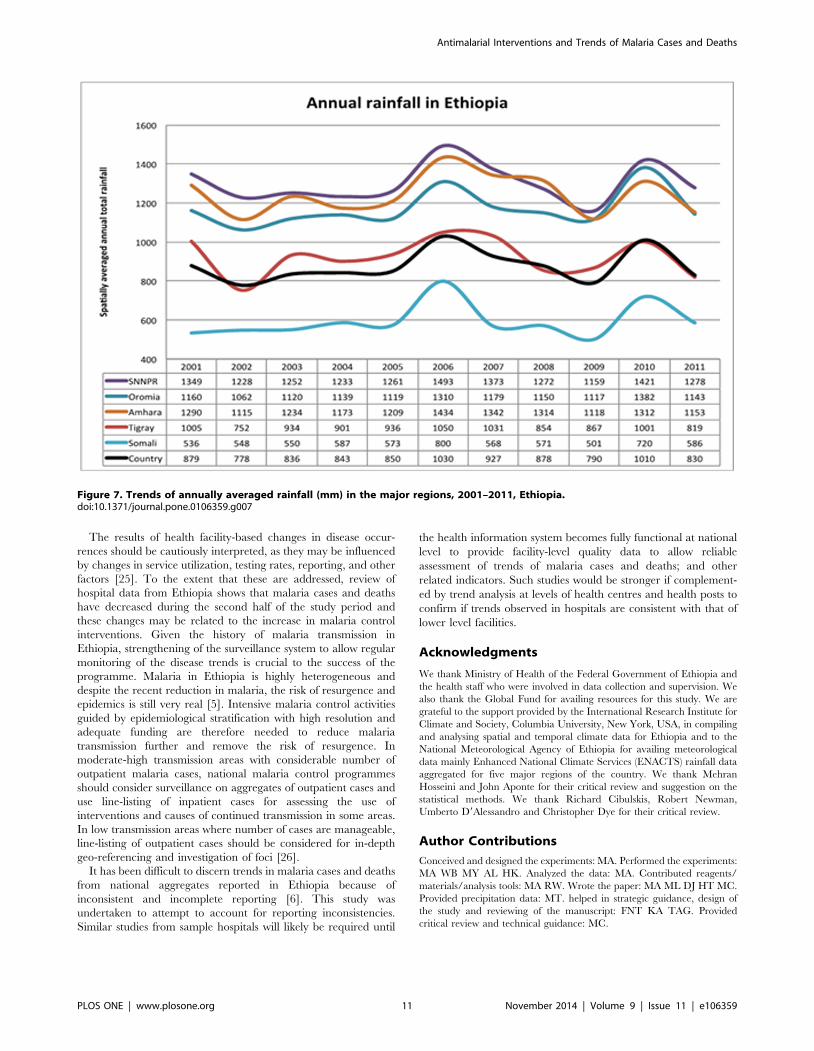
RainfallPrecipitation data of five regions and national aggregates made
available by the International Research Institute for Climate and
Society (IRI) were analysed. No significant difference in precip-
itation between pre- and post-intervention years was observed
(Figure 7). Rainfall remained favourable for malaria transmission
and peaked in 2006 and 2010 while it was lowest in 2009 across
the regions. A linear regression of rainfall on national aggregates of
confirmed cases and SPR showed no significant effect (p.0.05).
Linear regression on confirmed cases and SPR by region showed
no significant effect during the pre-intervention period in all
regions except in SNNP region (where rainfall had significant
increasing effect on both). During the post-intervention period,
rainfall had a significant increasing effect on confirmed cases and
SPR in all the regions except in Oromia, where rainfall had
significant decreasing effect (p,05) and in Tigray with no
significant effect.
Discussion
In this study reviewing data from hospitals in Ethiopia, malaria
decreased between 2001 and 2011 by several measures. Among all
age groups, the number of confirmed malaria cases, malaria
inpatient cases and deaths declined by more than half, while
malaria inpatient cases and malaria deaths among children under
5 years old decreased more than two-thirds from the numbers
predicted if levels at the start of the decade had persisted. The
observed declines in malaria cases and deaths were seen across all
regions where malaria transmission occurs and could not be
accounted for by changes in outpatient visits or by the number of
diagnostic tests performed. During this time, measured rainfall was
sufficient to support malaria transmission and levels of rainfall
could not be consistently correlated with changes in malaria cases.
Counts of cases and deaths were used in this analysis as the
catchment population of each hospital was not known. Given the
Figure 3. Percentage of population potentially protected with LLINs*, IRS and percentage of health facilities with stock of ACTavailable by year, 2001–2011, Ethiopia (*number of LLINs distributed during the 3 year period 61.8/population).doi:10.1371/journal.pone.0106359.g003
Antimalarial Interventions and Trends of Malaria Cases and Deaths
PLOS ONE | www.plosone.org 4 November 2014 | Volume 9 | Issue 11 | e106359
increase in population of Ethiopia during this time, the decline in
malaria cases and deaths as rates per population may have been
greater.
The downward trend in malaria cases and deaths was consistent
across several approaches to the time series analysis. Comparing
the observed number of cases in 2011 to the level predicted in
2011 by extrapolating trends from the first 5 years of the time
period, 2001–2005, before full scale-up of malaria interventions,
resulted in the largest measured decrease in cases and deaths. For
confirmed cases, this can be explained in part by a slight increase
in cases during the baseline period resulting in a higher predicted
level in 2011 than the mean level during the 2001–2005. In
contrast, for SPR, comparing the observed level in 2011 to the
predicted level resulted in a smaller decrease due to an already
decreasing trend of SPR in the baseline period. These examples
demonstrate how characteristics of the baseline period chosen can
affect the magnitude of measured changes over time [13].
Comparing the mid-point level of the regression line from 2006–
2011 to the mean level 2001–2005 resulted in the smallest
decrease for all primary indicators. Therefore this could be seen as
the most conservative approach to this time series analysis. In
addition to the decreasing trends seen in annual cases and deaths,
lower numbers of malaria cases, admissions and deaths were seen
when comparing the mean for each month during the post-
intervention period to the same month in the pre-intervention
period. Seasonal peaks also appeared lower in the post-interven-
tion period compared to pre-intervention period.
The hospital data analysed for this study indicate that the
decreases in cases and deaths coincided with the scale-up of
malaria interventions. Analysis of the breakpoints in the time series
of malaria cases and deaths were consistent with a change in the
trend approximately when interventions were either introduced,
or increasing during 2005 and 2006. The proportion of population
potentially protected with LLINs increased from negligible levels
Figure 4. Trends of confirmed malaria cases and non-malaria outpatient visits (a); slide positivity rate and number of microscopicslides examined (b); malaria admissions and non-malaria admissions (c); malaria deaths and non-malaria deaths in all ages (d) in 41hospitals, Ethiopia 2001–2011.doi:10.1371/journal.pone.0106359.g004
Antimalarial Interventions and Trends of Malaria Cases and Deaths
PLOS ONE | www.plosone.org 5 November 2014 | Volume 9 | Issue 11 | e106359
Ta
ble
1.
Pe
rce
nta
ge
chan
ge
inm
alar
iaan
dn
on
-mal
aria
rela
ted
ind
icat
ors
po
st-i
nte
rve
nti
on
year
sco
mp
are
dto
pre
-in
terv
en
tio
np
eri
od
(20
01
–2
00
5),
by
age
,4
1h
osp
ital
s,
20
00
me
leva
tio
n,
Eth
iop
ia,
20
01
–2
01
1.
Ag
eg
rou
pIn
dic
ato
rIn
dic
ato
rO
bse
rve
dv
alu
es
an
dch
an
ge
sC
ha
ng
e(%
)in
pre
dic
ted
ve
rsu
so
bse
rve
d(9
5%
CI)
Ob
serv
ed
va
lue
sin
20
11
Pre
inte
rve
nti
on
av
e(2
00
1–
20
05
)
Ob
serv
ed
cha
ng
ein
20
11
(vs
av
e2
00
1–
20
05
)M
idp
oin
t2
00
6–
20
11
20
11
Ch
ild
ren
,5
ye
ars
Ma
lari
aO
utp
atie
nt
mal
aria
case
s2
1,2
57
32
,28
72
34
24
7%
(27
0%
–2
6%
){2
57
%(2
78
%–
21
5%
){
Mal
aria
adm
issi
on
s3
,99
86
,77
32
41
28
0%
(29
2%
–2
51
%){
28
1%
(29
4%
–2
47
%){
Mal
aria
de
ath
s1
19
28
92
59
26
4%
(28
0%
–2
37
%){
27
3%
(28
6%
–2
48
%){
No
nm
ala
ria
No
nm
alar
iao
utp
atie
nt
case
s1
75
,02
81
21
,84
94
42
20
%(2
57
%–
47
%)
22
2%
(26
2%
–5
9%
)
No
nm
alar
iain
pat
ien
tca
ses
32
,24
22
2,3
66
44
23
%(2
29
%–
34
%)
23
%(2
33
%–
41
%)
No
nm
alar
iad
eat
hs
1,3
96
1,3
88
12
28
%(2
42
%–
21
1%
){2
40
%(2
53
%–
22
3%
){
5y
ea
rsa
nd
ab
ov
eM
ala
ria
Ou
tpat
ien
tm
alar
iaca
ses
77
,86
31
13
,15
82
31
25
4%
(26
5%
–2
41
%){
26
3%
(27
3%
–2
50
%){
Mal
aria
adm
issi
on
s1
0,4
23
21
,37
42
51
24
3%
(27
7%
–4
1%
)2
52
%(2
83
%–
39
%)
Mal
aria
de
ath
s4
06
1,2
40
26
72
58
%(2
88
%–
46
%)
26
6%
(29
2%
–4
6%
)
No
nm
ala
ria
No
nm
alar
iao
utp
atie
nt
case
s1
,48
8,5
96
1,0
48
,71
64
22
15
%(2
39
%–
20
%)
21
0%
(23
9%
–3
4%
)
No
nm
alar
iain
pat
ien
tca
ses
16
7,6
03
12
3,7
65
35
21
3%
(24
4%
–3
3%
)2
9%
(24
5%
–5
1%
)
No
nm
alar
iad
eat
hs
7,1
92
5,2
49
37
22
0%
(25
6%
–4
7%
)2
8%
(25
6%
–8
9%
)
All
ag
es
Ma
lari
aO
utp
atie
nt
mal
aria
case
s9
9,1
21
14
5,4
45
23
22
53
%(2
65
%–
23
6%
){2
62
%(2
73
%–
24
5%
){
Mal
aria
adm
issi
on
s1
4,4
21
28
,14
72
49
24
5%
(27
7%
–3
0%
)2
54
%(2
83
%–
27
%)
Mal
aria
de
ath
s5
25
1,5
30
26
62
59
%(2
86
%–
22
%)
26
8%
(29
1%
–1
7%
)
Lab
ora
tory
exa
min
ed
case
s2
92
,80
13
50
,08
62
16
23
3%
(25
1%
–2
7%
){2
46
%(2
63
%–
22
1%
){
Lab
ora
tory
con
firm
ed
case
s3
0,7
80
78
,32
52
61
25
0%
(26
8%
–2
24
%){
26
6%
(27
9%
–2
44
%){
Slid
po
siti
vity
rate
11
22
25
32
28
%(2
41
%–
21
1%
){2
37
%(2
51
%–
22
0%
){
No
nm
ala
ria
No
nm
alar
iao
utp
atie
nt
case
s1
,66
3,6
24
1,1
70
,56
54
22
15
%(2
40
%–
21
%)
21
1%
(24
1%
–3
4%
)
No
nm
alar
iain
pat
ien
tca
ses
19
9,8
45
14
6,1
31
37
21
2%
(24
1%
–3
3%
)2
8%
(24
3%
–4
9%
)
No
nm
alar
iad
eat
hs
8,5
89
6,6
37
29
22
2%
(25
2%
–2
7%
)2
16
%(2
53
%–
51
%)
An
ega
tive
per
cen
tag
e(r
ati
ob
etw
een
ob
serv
eda
nd
pre
dic
ted
ind
ica
tors
leve
lm
ult
iplie
db
y10
0)in
dic
ate
sa
dec
rea
sese
inth
ein
dic
ato
rin
the
yea
rco
mp
are
dto
ba
selin
ep
erio
d.
Ap
osi
tive
per
cen
tag
ein
dic
ate
an
incr
ease
of
the
ind
ica
tor
or
imp
act
inth
eye
ar
com
pa
red
tob
ase
line.
{ :95
%C
on
fid
ence
Inte
rva
l(C
I)d
oes
no
tin
clu
de
zero
an
dch
an
ge
of
tren
d(p
reve
rsu
sp
ost
-in
terv
enti
on
)is
sta
tist
ica
llysi
gn
ific
an
t.d
oi:1
0.1
37
1/j
ou
rnal
.po
ne
.01
06
35
9.t
00
1
Antimalarial Interventions and Trends of Malaria Cases and Deaths
PLOS ONE | www.plosone.org 6 November 2014 | Volume 9 | Issue 11 | e106359
Ta
ble
2.
Pe
rce
nta
ge
chan
ge
inin
pat
ien
tm
alar
iaca
ses,
mal
aria
de
ath
san
dsl
ide
po
siti
vity
rate
in2
01
1co
mp
are
dto
pre
-in
terv
en
tio
np
eri
od
(20
01
–2
00
5),
by
ho
spit
alan
dre
gio
n,
in4
1h
osp
ital
sb
elo
w2
00
0m
ele
vati
on
,Et
hio
pia
,2
00
1–
20
11
.
Re
gio
nH
osp
ita
lC
on
firm
ed
case
sS
PR
Ma
lari
aa
dm
issi
on
sM
ala
ria
de
ath
s%
of
po
pu
lati
on
pro
tect
ed
wit
hL
LIN
Me
an
(20
01
–2
00
5)
20
11
%C
ha
ng
ein
20
11
Me
an
(20
01
–2
00
5)
20
11
%C
ha
ng
ein
20
11
Me
an
(20
01
–2
00
5)
20
11
%C
ha
ng
ein
20
11
Me
an
(20
01
–2
00
5)
20
11
%C
ha
ng
ein
20
11
20
05
20
11
Afa
rD
ub
ti5
08
92
54
02
50
39
26
.82
32
19
31
54
22
02
78
27
12
25
3
Am
har
aD
ess
ie9
75
89
29
11
31
.72
87
25
41
12
96
20
32
86
Go
nd
arR
efe
ral
48
33
99
21
71
09
.12
82
86
31
39
34
25
22
6
Wo
ldia
45
57
72
83
51
3.2
29
41
34
45
26
61
12
28
3
To
tal
Am
har
a19
1456
52
7015
4.8
268
674
369
245
6630
255
1048
BG
um
uz
Aso
ssa
51
47
93
62
82
41
41
.52
55
93
34
24
01
77
25
8
Paw
e3
34
11
50
12
55
28
28
.00
23
66
13
82
24
24
77
28
5
To
tal
Bg
um
uz
84
89
24
37
27
13
53
2.0
27
29
24
17
15
24
16
41
42
78
34
50
Dir
eD
awa
Dil
Ch
ora
74
22
42
97
12
1.1
29
11
19
74
12
97
87
42
96
66
50
Gam
be
lla
Gam
be
lla
51
67
35
99
23
03
12
1.4
23
01
04
52
29
31
19
10
01
72
83
95
10
0
Har
ari
Hiw
ot
Fan
a6
24
62
99
10
0.1
29
94
97
22
29
65
91
29
9
Jeg
ol
72
02
21
00
13
0.2
29
93
59
25
29
33
83
29
1
To
tal
Har
ari
13
43
82
99
12
0.1
29
98
55
47
29
59
64
29
66
27
0
Oro
mia
Ad
ama
NA
NA
NA
NA
NA
NA
12
01
21
01
34
27
2
Ayi
ra1
20
43
62
97
90
.62
92
19
11
42
93
18
22
89
Bis
ho
ftu
NA
NA
NA
NA
NA
NA
22
15
22
77
13
24
78
Bis
idim
o6
86
02
10
01
60
.02
10
01
69
02
10
03
02
10
0
Bu
leH
ora
93
16
16
23
44
68
.42
82
22
33
78
69
23
15
23
6
Ch
iro
30
43
81
25
13
7.9
24
02
72
95
26
55
93
29
5
De
mb
iD
olo
32
32
50
22
31
33
.62
71
10
34
92
53
15
52
67
Ge
lem
so5
19
56
21
00
45
0.2
21
00
48
97
62
10
08
60
21
00
Gim
bi
Ad
ven
tist
37
06
82
82
10
1.6
28
52
23
71
26
81
00
21
00
Gin
nir
35
38
12
13
05
8.1
50
58
02
10
03
02
10
0
Jim
ma
Un
ive
rsit
y2
82
01
38
82
51
19
8.9
25
44
09
14
12
66
58
19
26
7
Me
ttu
Kar
l3
10
58
28
15
0.9
28
31
96
10
32
48
25
72
74
Miz
anA
man
17
40
50
32
71
20
8.1
26
05
81
30
92
47
28
41
48
Ne
kem
te1
03
63
29
82
97
15
0.8
29
51
14
03
94
26
56
31
52
76
Shas
he
me
ne
10
76
90
29
21
11
.62
86
36
19
22
74
40
22
24
5
St.
Luka
sC
ath
olic
12
87
66
72
48
15
5.9
26
04
43
57
12
93
04
65
3
To
tal
Oro
mia
26
96
35
17
22
81
17
4.1
27
69
60
82
39
62
75
48
82
01
25
98
40
SNN
PA
rba
Min
ch5
68
72
96
22
48
30
25
.72
15
38
87
19
52
25
01
36
38
27
2
Antimalarial Interventions and Trends of Malaria Cases and Deaths
PLOS ONE | www.plosone.org 7 November 2014 | Volume 9 | Issue 11 | e106359
Ta
ble
2.
Co
nt.
Re
gio
nH
osp
ita
lC
on
firm
ed
case
sS
PR
Ma
lari
aa
dm
issi
on
sM
ala
ria
de
ath
s%
of
po
pu
lati
on
pro
tect
ed
wit
hL
LIN
Me
an
(20
01
–2
00
5)
20
11
%C
ha
ng
ein
20
11
Me
an
(20
01
–2
00
5)
20
11
%C
ha
ng
ein
20
11
Me
an
(20
01
–2
00
5)
20
11
%C
ha
ng
ein
20
11
Me
an
(20
01
–2
00
5)
20
11
%C
ha
ng
ein
20
11
20
05
20
11
Ata
t3
35
52
09
72
37
27
17
.62
36
12
25
95
72
22
10
02
92
71
Bu
tajir
aH
C1
37
61
75
72
82
21
2.9
24
02
67
16
72
37
14
21
51
Dill
a2
55
83
42
83
43
14
7.8
56
13
33
44
92
66
43
12
27
1
Ge
bre
tsad
ikSh
ow
a3
69
71
63
29
62
75
.42
80
21
46
11
50
02
10
0
Jin
kaZ
on
al2
31
62
09
72
92
81
6.0
24
36
89
72
65
40
22
24
7
Tar
ech
a7
41
72
22
33
11
1.0
26
41
38
51
22
70
14
82
42
Wo
layi
ta1
18
86
52
24
52
18
.82
58
86
17
32
21
55
94
02
32
Yir
gal
em
19
74
81
02
59
25
6.3
27
47
16
42
92
40
15
65
02
68
To
tal
SN
NP
22
89
31
46
87
23
62
81
6.9
24
19
13
75
96
92
35
56
22
19
26
12
64
1
Som
ali
Go
de
11
14
55
42
50
44
16
.52
62
24
61
66
23
37
32
63
Kar
amar
aR
eg
ion
al3
55
28
54
0.4
29
04
11
52
62
50
21
00
To
tal
So
mal
ia1
14
95
59
25
13
31
2.1
26
32
87
18
12
37
11
32
78
17
45
Tig
ray
Ab
iA
di
38
83
02
22
22
98
.32
71
28
42
61
28
10
22
80
Ad
wa
27
56
45
22
84
38
14
.72
61
34
51
53
25
66
22
67
Ala
mat
a6
23
25
12
60
19
4.6
27
61
12
26
25
24
43
14
28
9
Suh
ul
95
77
73
21
91
91
3.1
22
96
80
21
72
68
19
18
28
To
tal
Tig
ray
47
24
17
78
26
22
79
.82
63
24
30
12
56
24
86
62
52
62
15
44
All
ho
spit
al(r
eg
ion
s)7
84
72
31
37
02
60
23
10
.72
53
28
35
11
44
21
24
91
56
85
25
26
72
15
1
An
ega
tive
per
cen
tag
ein
dic
ate
sa
dec
rea
seo
fth
ein
dic
ato
ro
rim
pa
ctin
the
yea
rco
mp
are
dto
ba
selin
e.d
oi:1
0.1
37
1/j
ou
rnal
.po
ne
.01
06
35
9.t
00
2
Antimalarial Interventions and Trends of Malaria Cases and Deaths
PLOS ONE | www.plosone.org 8 November 2014 | Volume 9 | Issue 11 | e106359
prior to mass LLIN distribution starting in 2005 to levels 60% and
above during 2006–2011. The proportion of the population
protected by IRS also increased substantially during this time,
reaching nearly 50% of the population at risk in 2008. By analysis
of data on stock-outs at hospitals, ACTs were available in more
than 90% of facilities after they were introduced in July 2004.
While confirmed malaria cases and the SPR decreased
consistently until 2011, no additional decreases in malaria
inpatient cases or malaria deaths were observed in recent years
(during 2009–2011) compared to that of the early post-interven-
tion period (2006–2008). This may be partly due to saturation of
the protective effect of interventions following the attainment of
the LLIN coverage and provision of ACTs by 2008. It may also be
attributed to relatively slower changes in some of the major
hospitals of high transmission areas in Oromia, SNNP and
Gambella. A portion of LLIN distributed in 2006–2008 may also
have been lost or rendered less effective during 2009–2011 due to
reduced physical integrity and insecticidal waning after their
estimated three-year effective lifespan. The measure of ACT
availability used in this study, based on documentation of ACT
stock-outs at facilities, does not provide a direct measure of what
proportion of patients with malaria received adequate treatment,
therefore it is unknown if changes in treatment patterns had an
effect.
Assessment of trends in malaria cases and deaths and the effect
of malaria control activities reported previously by Ethiopia, and
other sub-Saharan African countries (Zanzibar [18,19], Rwanda
[20], The Gambia [21] and Sao Tome and Principe [22]) have
utilized both facility data and household survey results and have
shown significant decrease following scale up of interventions.
Compared to the 2008 study in Ethiopia [23], the present study
benefits from three additional years of data and attempts to
address concerns regarding analysis of trends given large
variability in malaria transmission based on historical data in
Ethiopia and a short, possibly spurious baseline in available facility
data.
This study is subject to several limitations. A key challenge in
assessing the trends in malaria in Ethiopia is the historically high
variability in baseline malaria transmission. An attempt was made
to account for this in the analysis; however, the time period
reviewed may have been too short to reveal longer term trends in
malaria transmission that may have been unrelated to malaria
Figure 5. Time series of monthly confirmed malaria cases, slide positivity rate, admissions and deaths extracted by use of aHodrick-Prescott filter with monthly smoothing parameter l = 14,400 (HP = Hodrick-Prescott filter; MAl-IPDAll Ages = Inpatientmalaria cases in all ages; Mal-DeathsAll Ages = Malaria deaths in all ages, SPRAll Ages = Slide positivity rate in all ages; PositiveAllages = Number of confirmed cases).doi:10.1371/journal.pone.0106359.g005
Antimalarial Interventions and Trends of Malaria Cases and Deaths
PLOS ONE | www.plosone.org 9 November 2014 | Volume 9 | Issue 11 | e106359
interventions. Visiting hospitals and reviewing data at hospitals
helped in minimizing reporting bias present in routine surveil-
lance. Even so, excluding visited hospitals with incomplete data
introduces its own potential bias; this is likely to be small as the
excluded hospitals represent a small fraction of the hospitals
visited. The main reason for the incomplete data at the hospitals
was disappearances of record books and monthly reports (for some
months or years particularly the early years) and improper
handing over of records during change of health staff. The study
did not include lower level health facilities and it is unclear if
trends there would be the same as those seen in the hospitals
considered. There were no data on the volume of patients cared
for or the number of malaria cases identified through community
case management in the Health Extension Programme. The effect
of this program on trends in hospital malaria cases appears to be
limited as the decline in malaria cases and deaths occurred two
years before the scale-up of community case management in 2009
and, given health care seeking patterns in Ethiopia, only a third of
patients treated in the community were likely to have been seen at
hospitals [24]. In addition, significant decrease in malaria cases
and deaths were observed against the background of increased all-
cause outpatient and all-cause inpatient cases and deaths in the
hospitals. Information on testing practices at the district hospitals
was limited. The number of suspected cases presenting to health
facilities that should be tested for malaria was not recorded in
standard reporting forms and therefore, it was difficult to assess
whether the proportion of suspect patients tested changed over
time. The measures of malaria control intervention coverage in
this study were crude estimates of these interventions in the
community however, they did reflect the time period during which
interventions were available and were adequate to denote large
changes in intervention coverage. More precise measures of LLIN
coverage and ACT treatment would be needed to more closely
relate changes in coverage to changes in malaria occurrence.
Given the very high ecological variations within a region, annual
average rainfall for the major regions may not be conclusive to
accurately assess the climatic effect on trends of malaria cases and
deaths. In a separate analysis of rainfall data by the International
Research Institute for Climate and Society, Columbia University,
New York, USA, using Enhancing National Climate Services
(ENACTS) (not shown here), for most regions there was lower
rainfall in the pre-intervention (baseline) period (2000–2005)
relative to the post-intervention period (2006–2010). In addition,
analysis of temperature indicate that the climate of Ethiopia has
been getting warmer over the last 30 years –particularly in
highland areas. Higher temperatures and rainfall in the interven-
tion period suggest that the climate suitability for malaria from
2006–2010 was above that of the baseline period. Any large-scale
declines in malaria cases and deaths during 2006–2010 are
unlikely therefore to be as a result of a drier or cooler climate and
an associated reduction in transmission suitability.
Figure 6. Monthly mean number of malaria confirmed cases, malaria inpatient cases, malaria deaths and slide positivity rate, 2001–2005 and 2006–2011, 41 hospitals, Ethiopia.doi:10.1371/journal.pone.0106359.g006
Antimalarial Interventions and Trends of Malaria Cases and Deaths
PLOS ONE | www.plosone.org 10 November 2014 | Volume 9 | Issue 11 | e106359
The results of health facility-based changes in disease occur-
rences should be cautiously interpreted, as they may be influenced
by changes in service utilization, testing rates, reporting, and other
factors [25]. To the extent that these are addressed, review of
hospital data from Ethiopia shows that malaria cases and deaths
have decreased during the second half of the study period and
these changes may be related to the increase in malaria control
interventions. Given the history of malaria transmission in
Ethiopia, strengthening of the surveillance system to allow regular
monitoring of the disease trends is crucial to the success of the
programme. Malaria in Ethiopia is highly heterogeneous and
despite the recent reduction in malaria, the risk of resurgence and
epidemics is still very real [5]. Intensive malaria control activities
guided by epidemiological stratification with high resolution and
adequate funding are therefore needed to reduce malaria
transmission further and remove the risk of resurgence. In
moderate-high transmission areas with considerable number of
outpatient malaria cases, national malaria control programmes
should consider surveillance on aggregates of outpatient cases and
use line-listing of inpatient cases for assessing the use of
interventions and causes of continued transmission in some areas.
In low transmission areas where number of cases are manageable,
line-listing of outpatient cases should be considered for in-depth
geo-referencing and investigation of foci [26].
It has been difficult to discern trends in malaria cases and deaths
from national aggregates reported in Ethiopia because of
inconsistent and incomplete reporting [6]. This study was
undertaken to attempt to account for reporting inconsistencies.
Similar studies from sample hospitals will likely be required until
the health information system becomes fully functional at national
level to provide facility-level quality data to allow reliable
assessment of trends of malaria cases and deaths; and other
related indicators. Such studies would be stronger if complement-
ed by trend analysis at levels of health centres and health posts to
confirm if trends observed in hospitals are consistent with that of
lower level facilities.
Acknowledgments
We thank Ministry of Health of the Federal Government of Ethiopia and
the health staff who were involved in data collection and supervision. We
also thank the Global Fund for availing resources for this study. We are
grateful to the support provided by the International Research Institute for
Climate and Society, Columbia University, New York, USA, in compiling
and analysing spatial and temporal climate data for Ethiopia and to the
National Meteorological Agency of Ethiopia for availing meteorological
data mainly Enhanced National Climate Services (ENACTS) rainfall data
aggregated for five major regions of the country. We thank Mehran
Hosseini and John Aponte for their critical review and suggestion on the
statistical methods. We thank Richard Cibulskis, Robert Newman,
Umberto D9Alessandro and Christopher Dye for their critical review.
Author Contributions
Conceived and designed the experiments: MA. Performed the experiments:
MA WB MY AL HK. Analyzed the data: MA. Contributed reagents/
materials/analysis tools: MA RW. Wrote the paper: MA ML DJ HT MC.
Provided precipitation data: MT. helped in strategic guidance, design of
the study and reviewing of the manuscript: FNT KA TAG. Provided
critical review and technical guidance: MC.
Figure 7. Trends of annually averaged rainfall (mm) in the major regions, 2001–2011, Ethiopia.doi:10.1371/journal.pone.0106359.g007
Antimalarial Interventions and Trends of Malaria Cases and Deaths
PLOS ONE | www.plosone.org 11 November 2014 | Volume 9 | Issue 11 | e106359
References
1. United Nations, UN Population Division New York (2013) World population
prospects. Available: http://esa.un.org/wpp/Accessed 2014 May 6.2. Zhou G, Minakawa N, Githeko AK, Yan G (2004) Association between climate
variability and malaria epidemics in the East African highlands. Proc Natl AcadSci U S A. 24; 101(8): 2375–80.
3. Fontaine RE, Najjar AE, Prince JS (1961) The 1958 malaria epidemic in
Ethiopia. Am J Trop Med Hyg. 10: 795–803.4. Checchi F, Cox J, Balkan S, Tamrat A, Priotto G, et al. (2006) Malaria
Epidemics and Interventions, Kenya, Burundi, Southern Sudan, and Ethiopia,1999–2004. Emerging Infectious Diseases. CDC. Volume 12.
5. Negash K, Kebede A, Medhin A, Argaw D, Babaniyi O, et al. (2006) Malaria
epidemics in the highlands of Ethiopia. East Afr Med J 82(4): 186–92.6. World Health organization (2013) World Malaria Report 2013. Geneva,
Switzerland. ISBN 978 92 4 156469 4. Available: http://www.who.int/malaria/publications/world_malaria_report_2013/en/Accessed 2014 May 7.
7. Ministry of Health of the Federal Democratic Republic of Ethiopia (2004)Malaria Diagnosis and Treatment Guidelines for Health Workers in Ethiopia,
2nd Edition.
8. Teklehaimanot HD, Teklehaimanot A (2013) Human resource development fora community-based health extension program: a case study from Ethiopia. Hum
Resour Health.20; 11(1): 39.9. United Nations, United Nations Population Division New York (2011) World
population prospects. Available: http://esa.un.org/wpp/unpp/panel_
population.htm. Accessed 2014 Mar 25.10. Dinku T, Hilemariam K, Grimes D, Kidane A, Connor S (2011) Improving
availability, access and use of climate information. WMO Bulletin 60(2)11. Thomson M, Indeje M, Connor S, Dilley M, Ward N (2003) Malaria early
warning in Kenya and seasonal climate forecasts. Lancet. 362(9383): 580.12. STATA website. Data Analysis and Statistical Software. Available: www.stata.
com. Accessed 2014 Mar 25.
13. Wagner AK, Soumerai SB, Zhang F, Ross-Degnan D (2002) Segmentedregression analysis of interrupted time series studies in medication use research. J
Clin Pharm Ther. 27(4): 299–30914. Box GEP, Jenkins G (1976) Time Series Analysis: Forecasting and Control,
Holden-Day.
15. Ryan SE, Porth LS (2007) A tutorial on the piecewise regression approach
applied to bedload transport data. Gen. Tech. Rep. RMRS-GTR-189. FortCollins, CO: U.S. Department of Agriculture, Forest Service, Rocky Mountain
Research Station. 41 p.16. Hodrick RJ, Prescott E (1997) Postwar U.S Business Cycles: An Empirical
Investigation. J Money, Credit, and Banking. 29 (1) pp. 1–16.
17. Thomson M, Indeje M, Connor S, Dilley M, Ward N (2003) Malaria earlywarning in Kenya and seasonal climate forecasts. Lancet 16; 362(9383): 580.
18. Aregawi MW, Ali AS, Al-mafazy A, Molteni F, Katikiti S, et al. (2011).Reductions in malaria and anaemia case and death burden at hospitals following
scale-up of malaria control in Zanzibar, 1999–2008. Malaria J. 10: 46.
19. Bhattarai A, Ali AS, Kachur SP, Martensson A, Abbas AK, et al. (2007) Impactof artemisinin-based combination therapy and insecticide-treated nets on
malaria burden in Zanzibar. PLoS Med 6; 4(11): e309.20. Karema C, Aregawi MW, Rukundo A, Kabayiza A, Mulindahabi M, et al.
(2012) Trends in malaria cases, hospital admissions and deaths following scale-up of anti-malarial interventions, 2000–2010, Rwanda. Malar J 11: 236.
21. Ceesay SJ, Casals-Pascual C, Erskine J, Anya SE, Duah NO, et al. (2008)
Changes in malaria indices between 1999 and 2007 in The Gambia: aretrospective analysis. Lancet 1; 372(9649): 1545–54.
22. Teklehaimanot HD, Teklehaimanot A, Kiszewski A, Rampao HS, Sachs JD(2009). Malaria in Sao Tome and Principe: on the brink of elimination after
three years of effective antimalarial measures. Am J Trop Med Hyg. 80(1): 133–
40.23. Otten M, Aregawi MW, Were W, Karema C, Medhin A, et al. (2009) Initial
evidence of reduction of malaria cases and deaths in Rwanda and Ethiopia dueto rapid scale-up of malaria prevention and treatment. Malar J 14; 8: 14.
24. Central Statistical Agency [Ethiopia], ICF International (2012) EthiopiaDemographic and Health Survey 2011. Addis Ababa, Ethiopia and Calverton,
Maryland, USA: Central Statistical Agency and ICF International.
25. Rowe AK, Kachur SP, Yoon SS, Lynch M, Slutsker L, et al. (2009) Caution isrequired when using health facility-based data to evaluate the health impact of
malaria control efforts in Africa. Malar J 8: 209.26. World Health Organization-Geneva, Switzerland (2012) Global Malaria Disease
surveillance for malaria control. An operational manual. ISBN: 9789241503341.
Antimalarial Interventions and Trends of Malaria Cases and Deaths
PLOS ONE | www.plosone.org 12 November 2014 | Volume 9 | Issue 11 | e106359