Embed Size (px)
Citation preview

Time series analysisand the individual in
psychological research
Ellen HamakerMethods and Statistics
Faculty of Social Sciences
Utrecht University

Outline
History
Problem
Time series analysis
Examples: - academic performance
- extraversion & neuroticism states
- dyadic interaction
Discussion
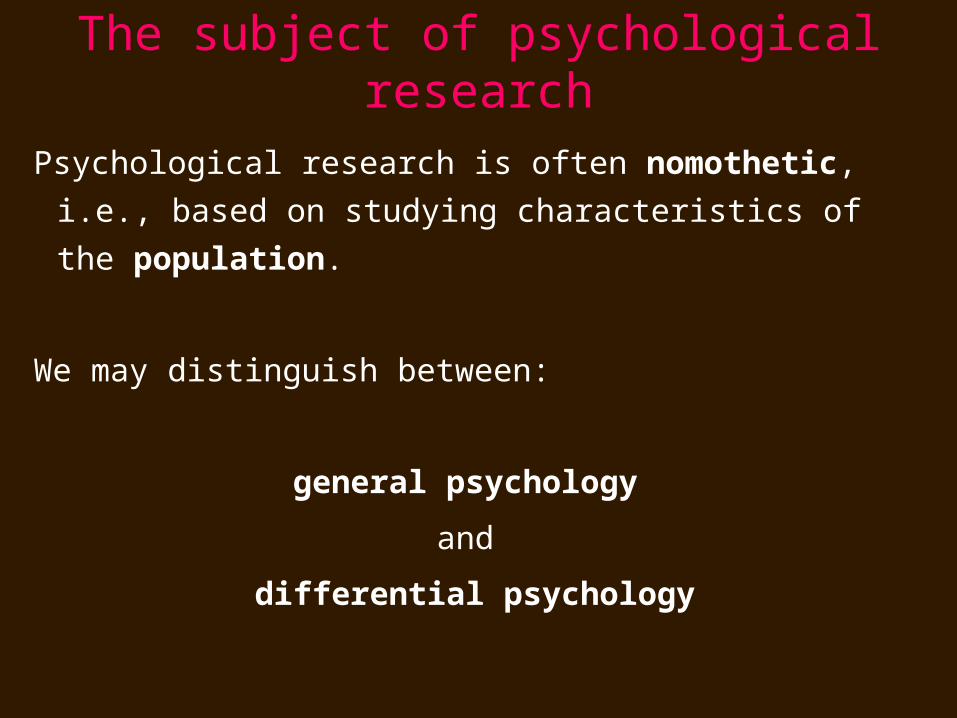
The subject of psychological research
Psychological research is often nomothetic, i.e.,
based on studying characteristics of the population.
We may distinguish between:
general psychology
and
differential psychology
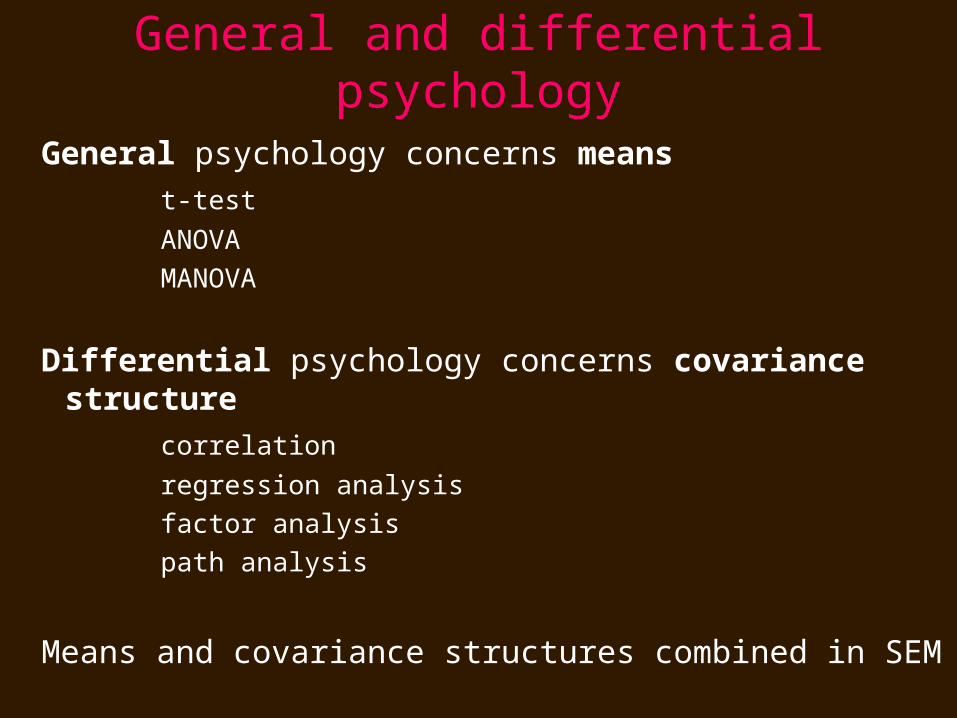
General and differential psychology
General psychology concerns meanst-test
ANOVAMANOVA
Differential psychology concerns covariance structure
correlation
regression analysisfactor analysispath analysis
Means and covariance structures combined in SEM

How did it all start?
1878 Charcot began to demonstrate the effects of hypnosis on hysterical patients.Subject: psychologically disturbed mind
1879 Wundt founded the first psychological laboratory in Leipzig. Subject: general mind
1884 Galton established his anthropometric laboratory and measured mental faculties and physical appearances of 9000 visitors.Subject: variation in the population
Variation in the population
Galton believed most mental and physical features were inherited.
He was worried that the protection of the weak (i.e., the poor) would interfere with the mechanisms of natural selection.
Galton is the founder of eugenics.
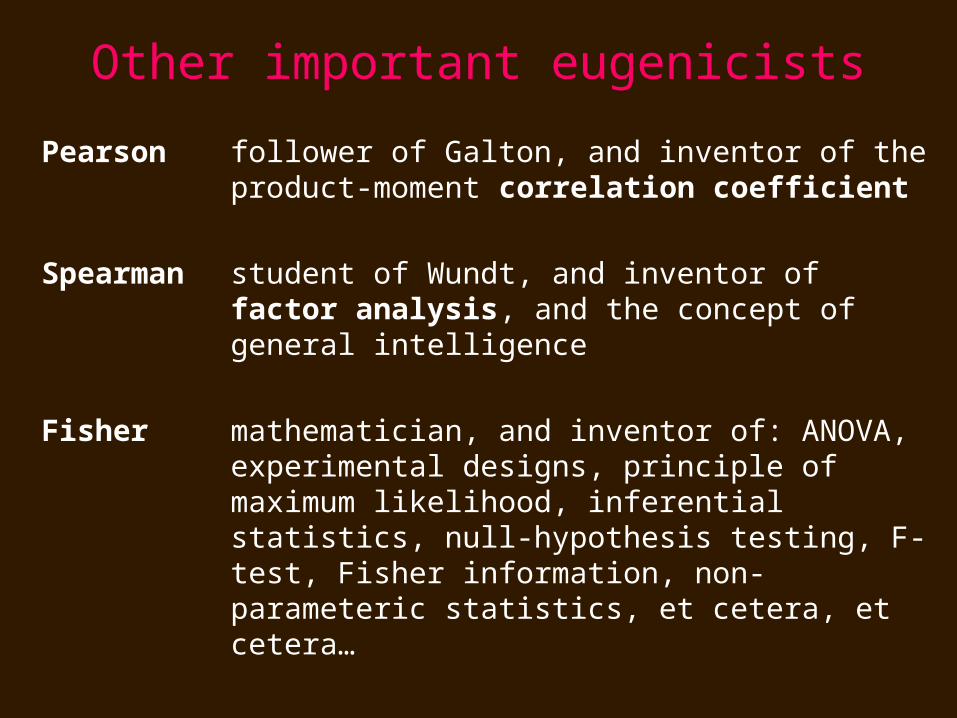
Other important eugenicists
Pearson follower of Galton, and inventor of the product-moment correlation coefficient
Spearman student of Wundt, and inventor of factor analysis, and the concept of general intelligence
Fisher mathematician, and inventor of: ANOVA, experimental designs, principle of maximum likelihood, inferential statistics, null-hypothesis testing, F-test, Fisher information, non-parameteric statistics, et cetera, et cetera…
Mathematical statistics
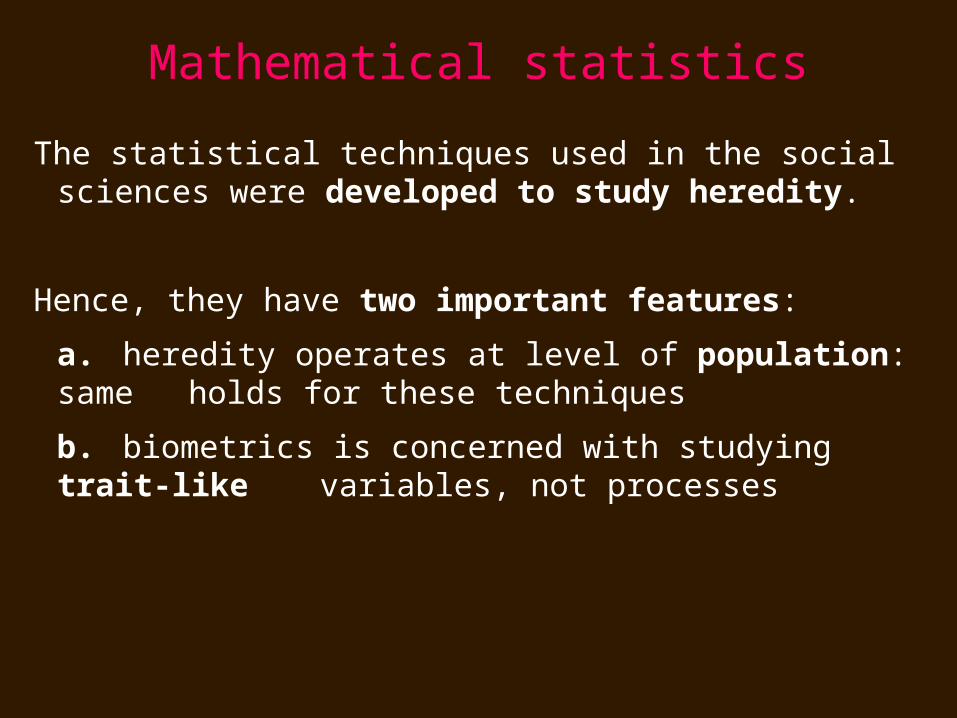
The statistical techniques used in the social sciences were developed to study heredity.
Hence, they have two important features:
a. heredity operates at level of population: same holds for these techniques
b. biometrics is concerned with studying trait-like variables, not processes

Outline
History
Problem
Time series analysis
Examples: - academic performance
- extraversion & neuroticism states
- dyadic interaction
Discussion
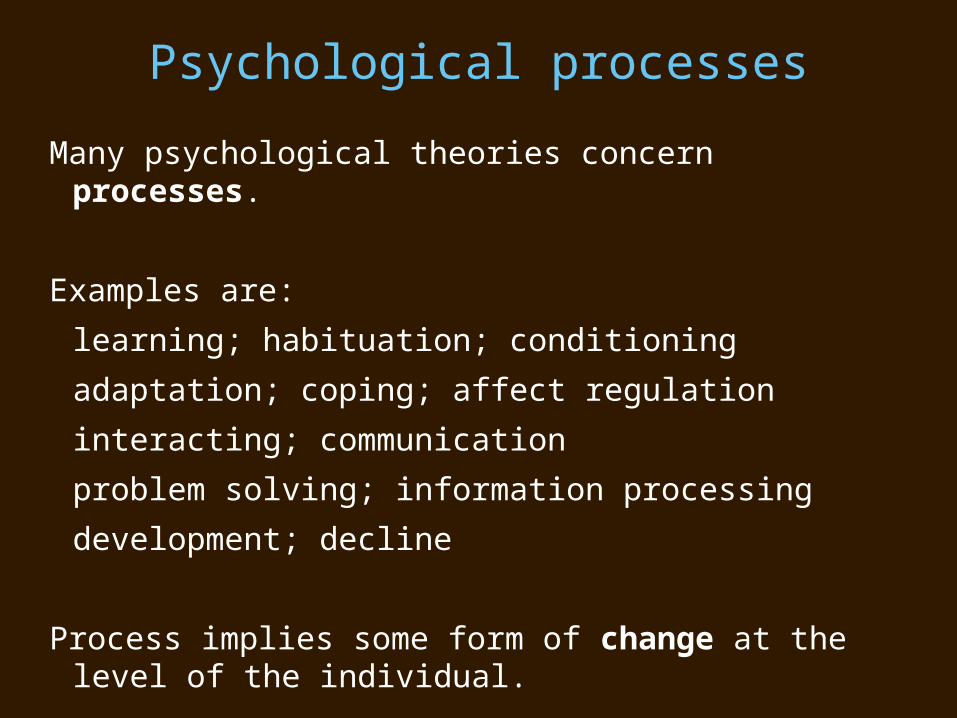
Psychological processes
Many psychological theories concern processes.
Examples are:
learning; habituation; conditioning
adaptation; coping; affect regulation
interacting; communication
problem solving; information processing
development; decline
Process implies some form of change at the level of the individual.
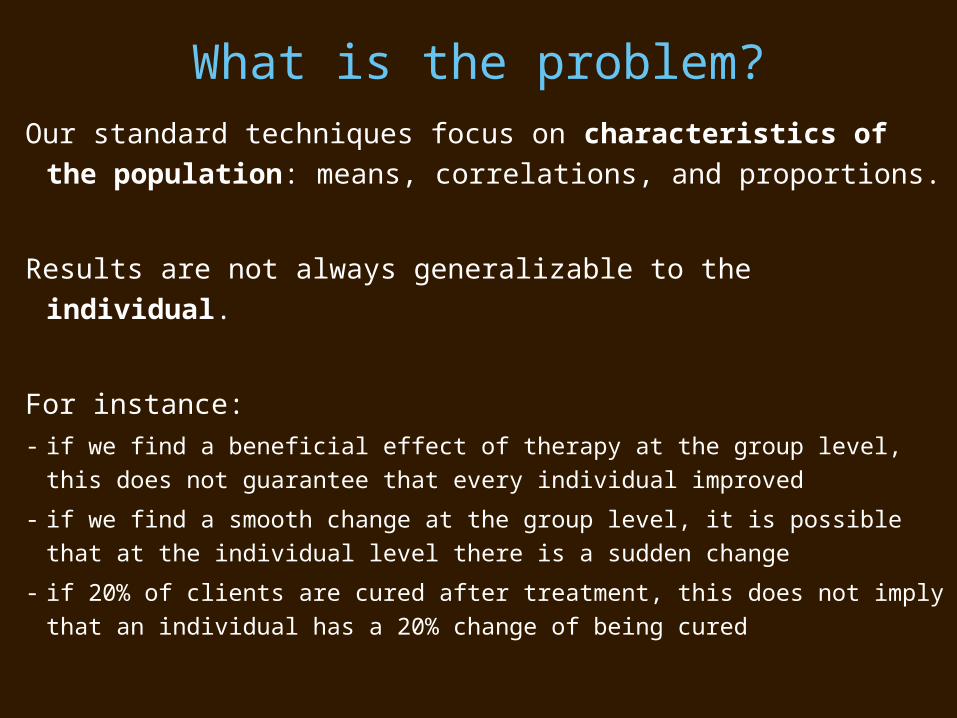
What is the problem?Our standard techniques focus on characteristics of
the population: means, correlations, and proportions.
Results are not always generalizable to the individual.
For instance:- if we find a beneficial effect of therapy at the group level, this does
not guarantee that every individual improved
- if we find a smooth change at the group level, it is possible that at the individual level there is a sudden change
- if 20% of clients are cured after treatment, this does not imply that an individual has a 20% change of being cured
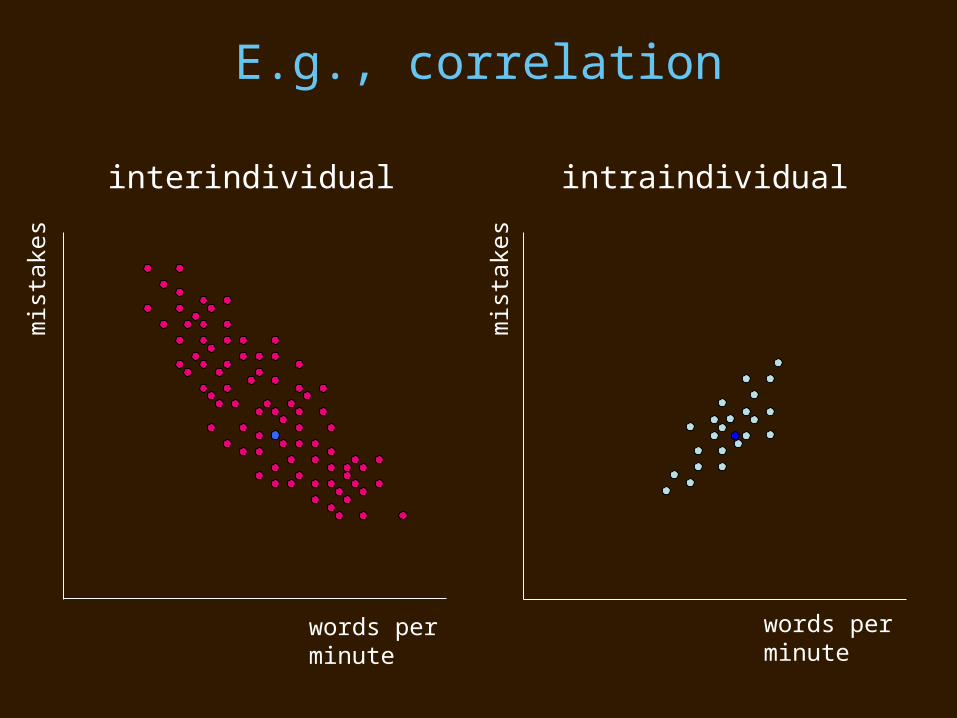
E.g., correlation
words perminute
mis
take
s
words perminute
mis
take
s
interindividual intraindividual
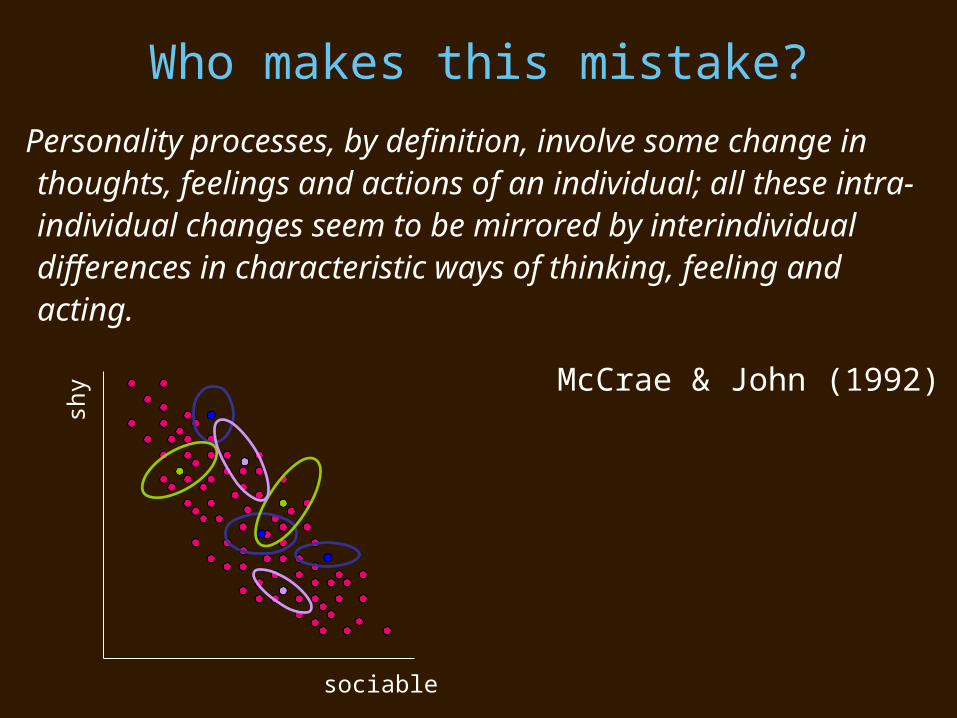
Who makes this mistake?
sociable
shy
Personality processes, by definition, involve some change in thoughts, feelings and actions of an individual; all these intra-individual changes seem to be mirrored by interindividual differences in characteristic ways of thinking, feeling and acting.
McCrae & John (1992)

The same in formulas…
))(( 2,,
2,,
,,,
2222
iyiyixix
ixyiyix
yx
xyxy
2,
2,
,,
iyix
ixyixy
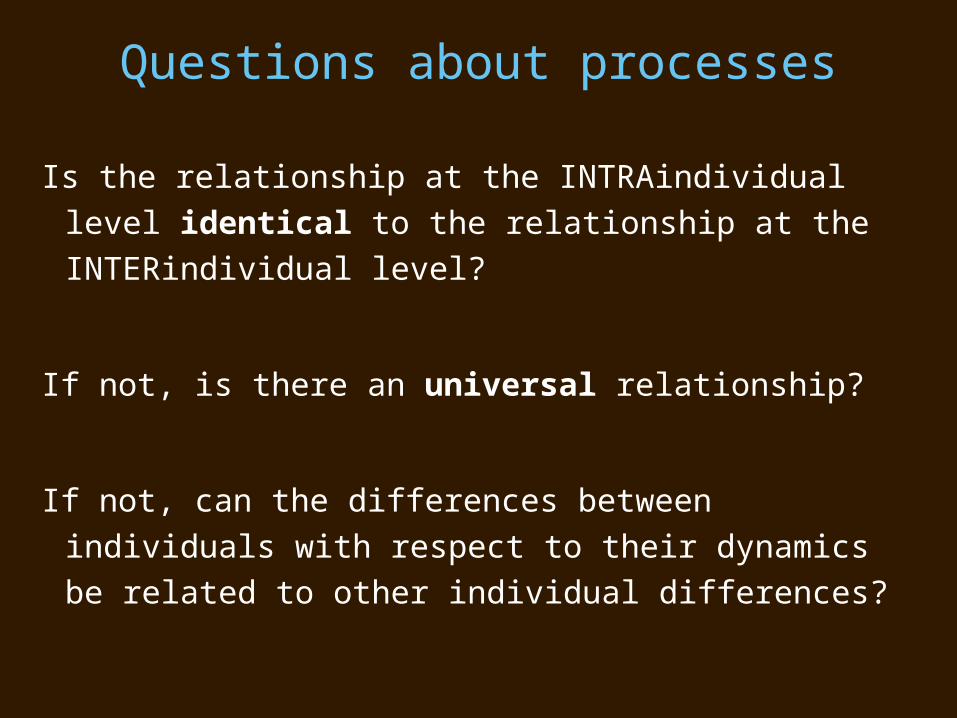
Questions about processes
Is the relationship at the INTRAindividual level identical to the relationship at the INTERindividual level?
If not, is there an universal relationship?
If not, can the differences between individuals with respect to their dynamics be related to other individual differences?
Outline
History
Problem
Time series analysis
Examples: - academic performance
- extraversion & neuroticism states
- dyadic interaction
Discussion
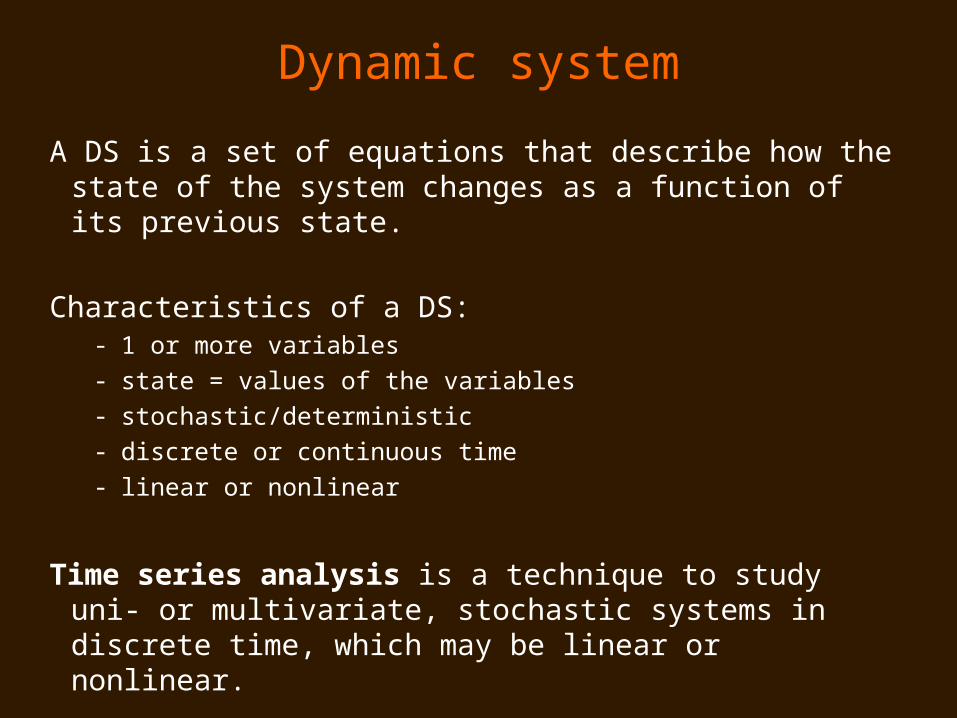
Dynamic system
A DS is a set of equations that describe how the state of the system changes as a function of its previous state.
Characteristics of a DS:- 1 or more variables- state = values of the variables- stochastic/deterministic- discrete or continuous time- linear or nonlinear
Time series analysis is a technique to study uni- or multivariate, stochastic systems in discrete time, which may be linear or nonlinear.
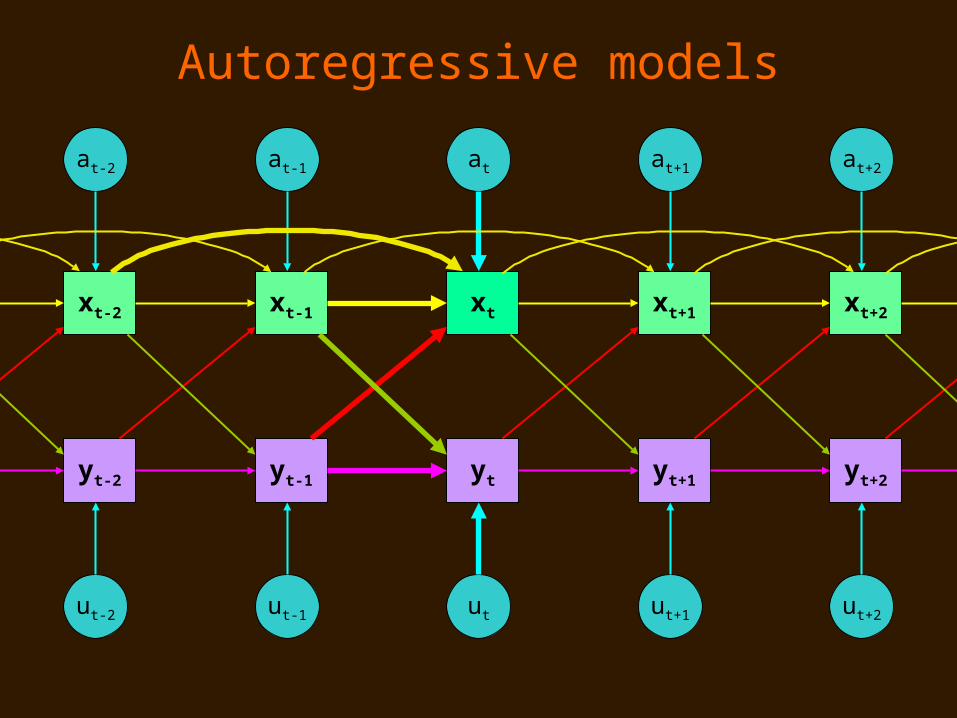
Autoregressive models
xt-2 xt-1 xt xt+1 xt+2
at-2 at-1 at at+1 at+2
yt-2 yt-1 yt yt+1 yt+2
ut-2 ut-1 ut ut+1 ut+2
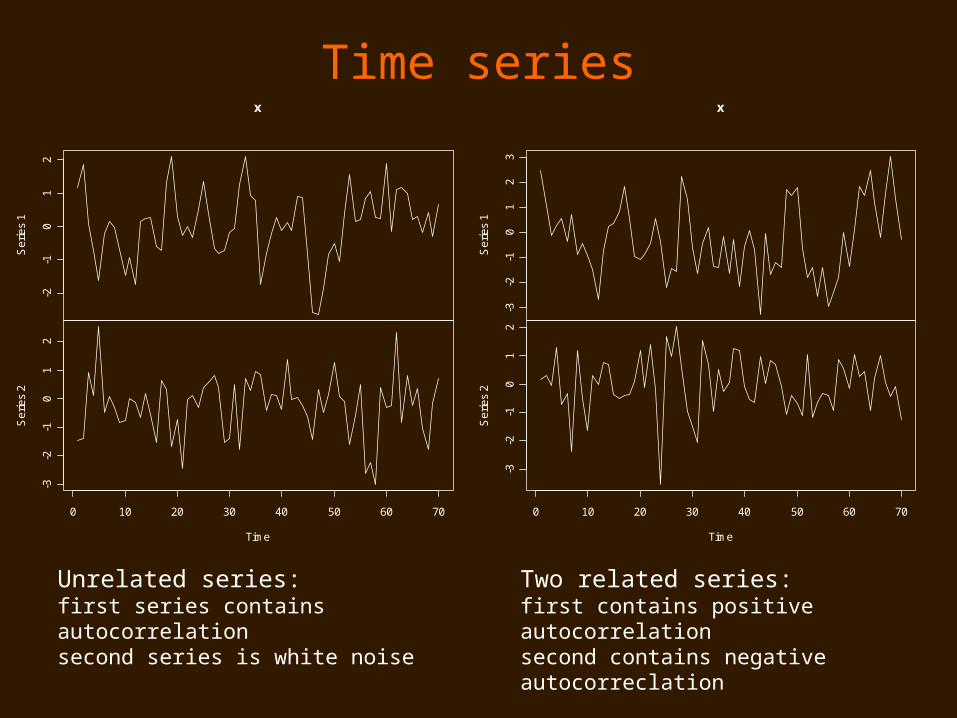
Time series
-3-2
-10
12
3
Se
rie
s 1
-3-2
-10
12
0 10 20 30 40 50 60 70
Se
rie
s 2
Time
x
Unrelated series:first series contains autocorrelation second series is white noise
Two related series:first contains positive autocorrelationsecond contains negative autocorreclation
-2-1
01
2
Se
rie
s 1
-3-2
-10
12
0 10 20 30 40 50 60 70
Se
rie
s 2
Time
x

Stationarity
We can distinguish between two kinds of processes:
- stationary processes:variability but no structural changes
- nonstationary processes: sudden or less sudden changes, which may bereversible or not
Time
c
0 20 40 60 80 100
-3-2
-10
12
3
Time
Se
rie
s 1
0 20 40 60 80 100
-10
-8-6
-4-2
02
Time
Se
rie
s 1
0 20 40 60 80 100
-20
24
6

Outline
History
Problem
Time series analysis
Examples: - academic performance
- extraversion & neuroticism states
- dyadic interaction
Discussion
Example 1
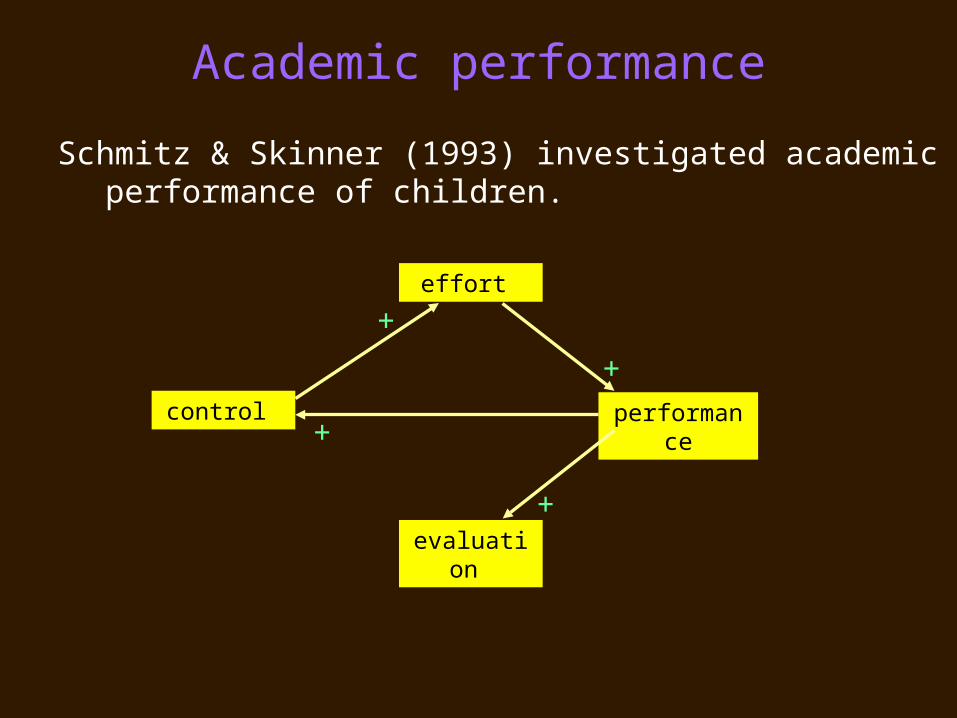
Academic performance
Schmitz & Skinner (1993) investigated academic performance of children.
control
effort
performance
evaluation
+
+
+
+
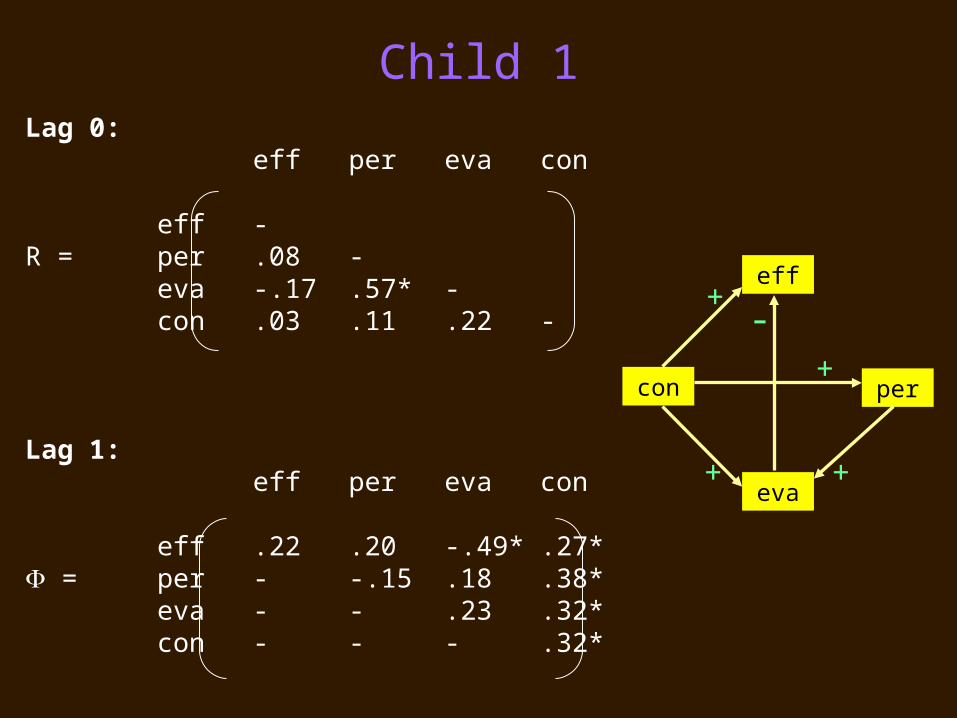
Child 1Lag 0:
eff per eva con
eff -R = per .08 -
eva -.17 .57* -con .03 .11 .22 -
Lag 1:eff per eva con
eff .22 .20 -.49* .27* = per - -.15 .18 .38*
eva - - .23 .32*con - - - .32*
con
eff
per
eva+
+
+
+
-
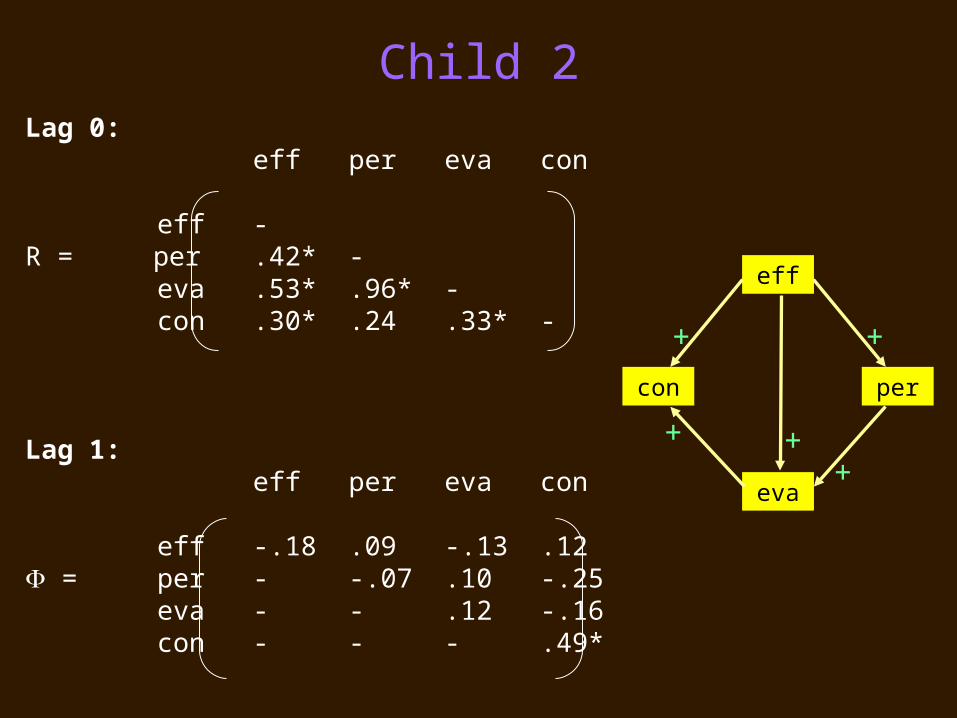
Child 2Lag 0:
eff per eva con
eff -R = per .42* -
eva .53* .96* -con .30* .24 .33* -
Lag 1:eff per eva con
eff -.18 .09 -.13 .12 = per - -.07 .10 -.25
eva - - .12 -.16con - - - .49*
con
eff
per
eva
+
++
+
+
Example 2
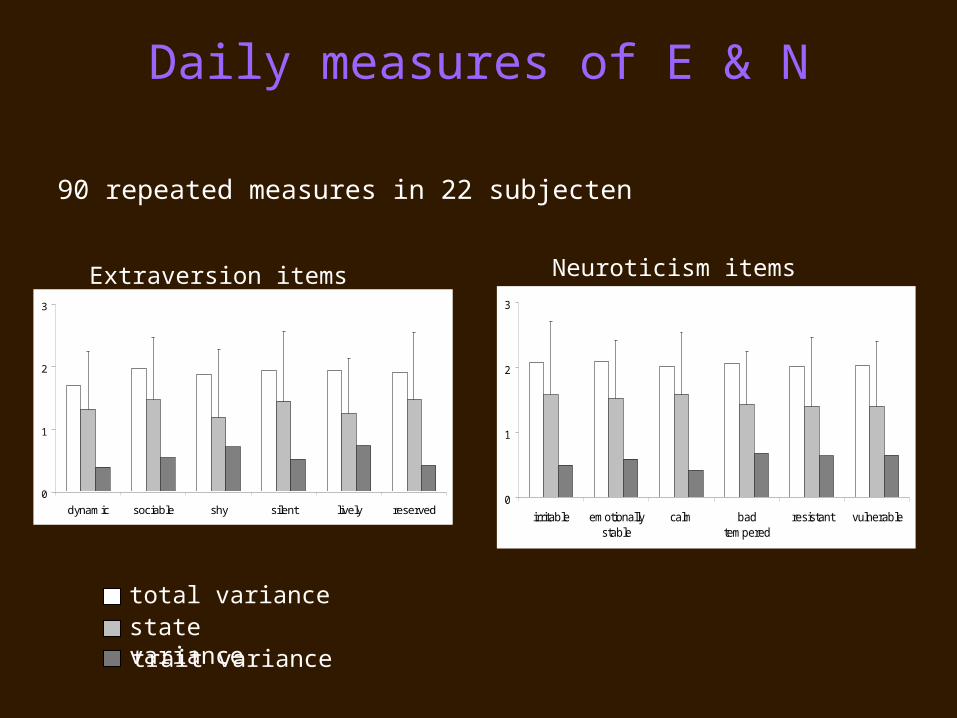
Daily measures of E & N
90 repeated measures in 22 subjecten
0
1
2
3
irritable emotionallystable
calm badtempered
resistant vulnerable
Extraversion items Neuroticism items
total variancestate variancetrait variance
0
1
2
3
dynamic sociable shy silent lively reserved

The model
yt+1 yt+1 yt+1 yt+1 yt+1 yt+1yt yt yt yt yt ytyt-1 yt-1 yt-1 yt-1 yt-1 yt-1
yt+1 yt+1 yt+1 yt+1 yt+1 yt+1yt yt yt yt yt ytyt-1 yt-1 yt-1 yt-1 yt-1 yt-1
Nt Nt+1Nt-1
Et Et+1Et-1
et-1 et-1 et-1 et-1 et-1 et-1 et et et et et et et+1 et+1 et+1 et+1 et+1 et+1
et-1 et-1 et-1 et-1 et-1 et-1 et et et et et et et+1 et+1 et+1 et+1 et+1 et+1
et cetera et cetera
at-1
ut-1
at
ut
at+1
ut+1
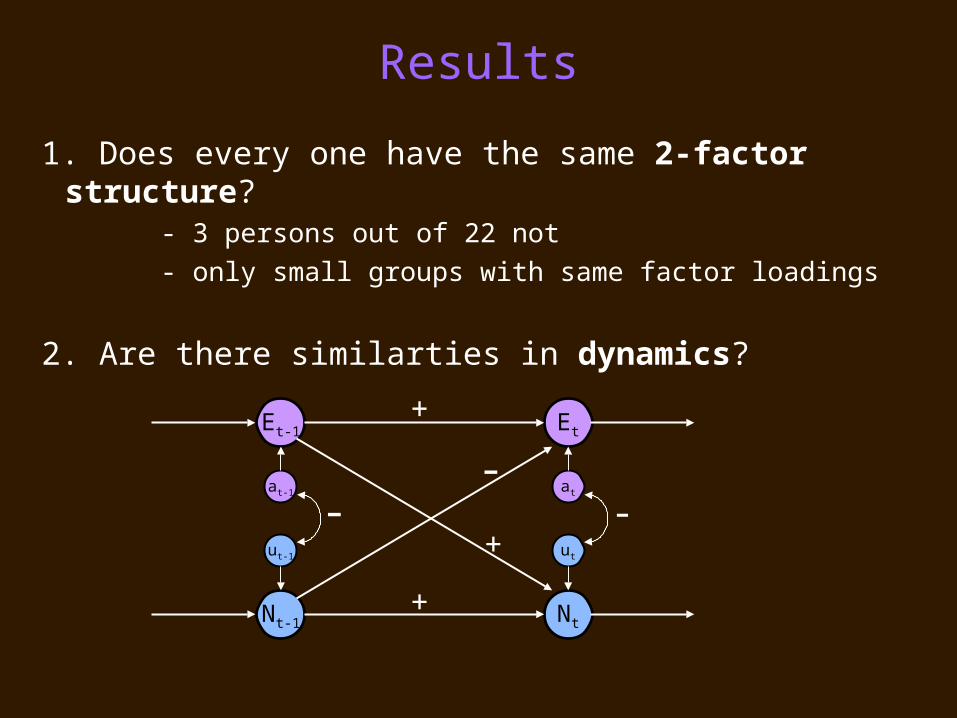
Results
1. Does every one have the same 2-factor structure?- 3 persons out of 22 not- only small groups with same factor loadings
2. Are there similarties in dynamics?
NtNt-1
EtEt-1
at-1
ut-1
at
ut
+
+
--+
-

Example 3

Dyadic interaction
Gottman and Murray study spousal interaction- 15 minutes
- code affect (sum 6 seconds): -24 to +24
- bivariate timeseries of 150 points
W1 W2 W3
H1 H2 H3
f(W1) f(W2)
f(H1) f(H2)
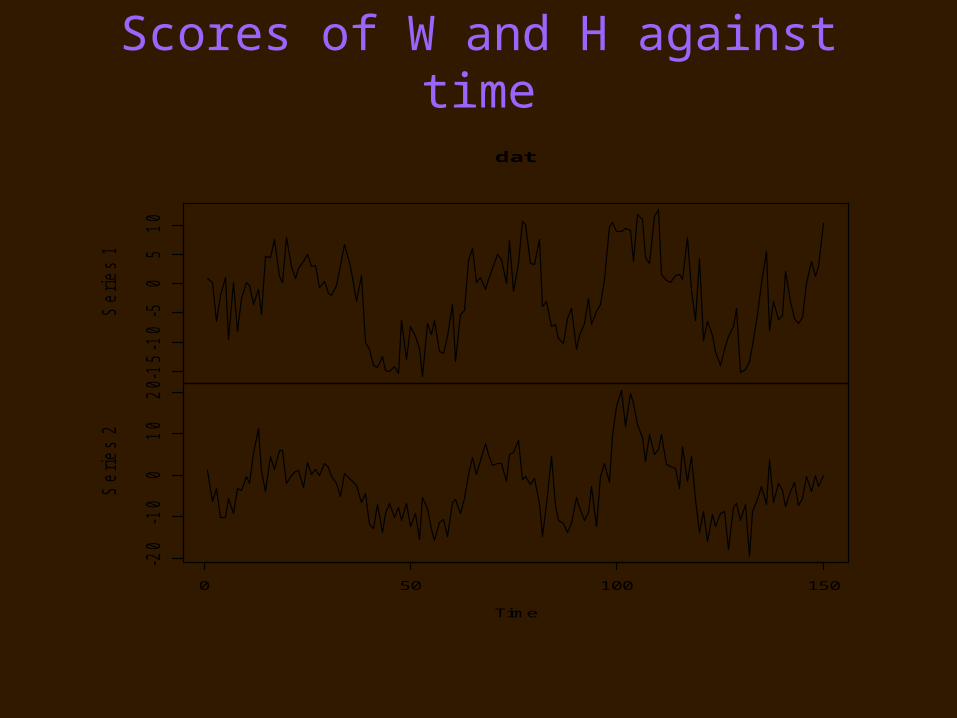
Scores of W and H against time
-15
-10
-50
51
0
Se
rie
s 1
-20
-10
01
02
0
0 50 100 150
Se
rie
s 2
Time
dat
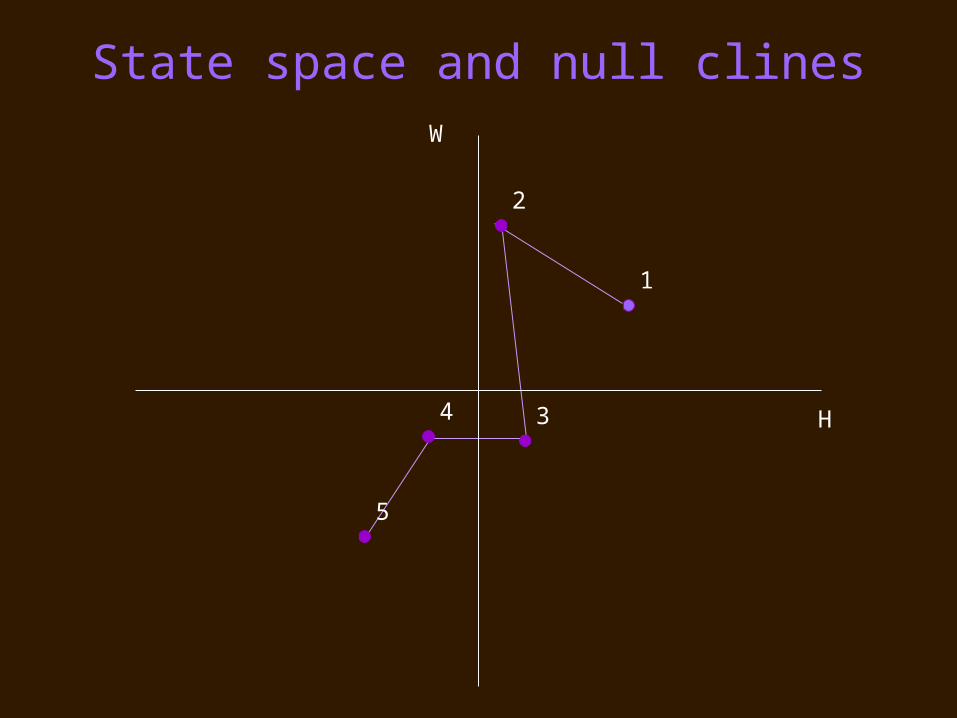
State space and null clines
H
W
1
2
34
5
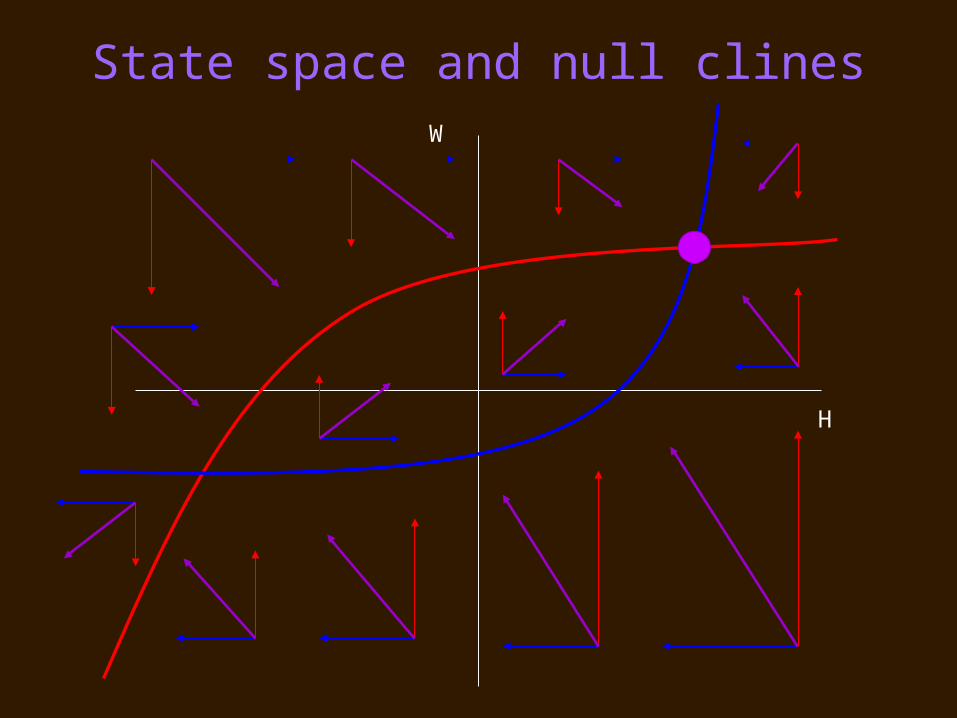
State space and null clines
H
W
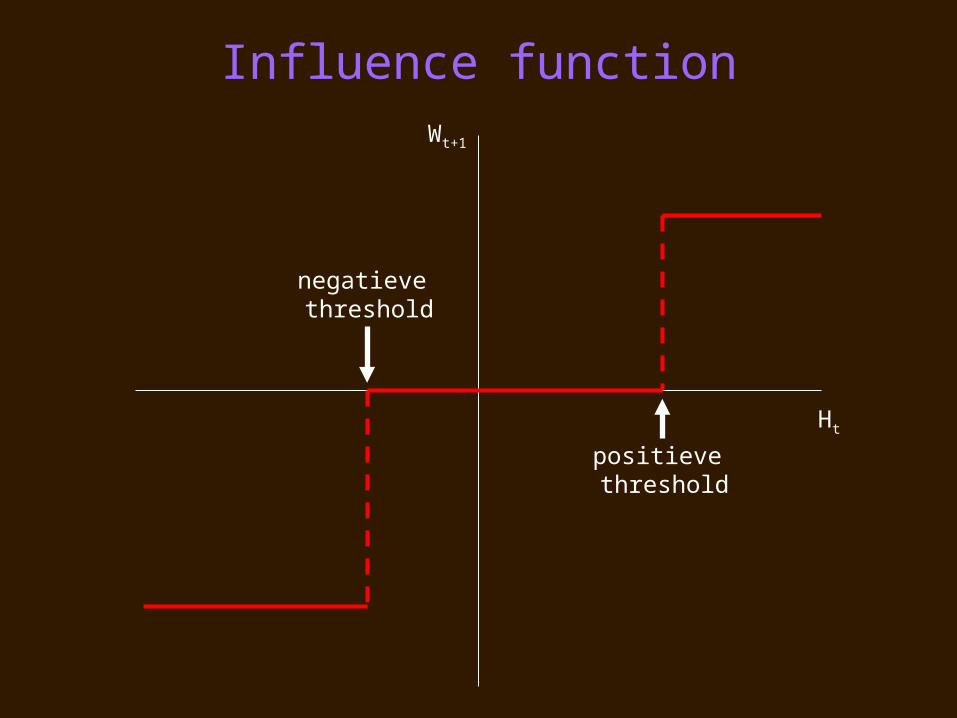
Influence function
Ht
Wt+1
positieve threshold
negatieve threshold

Finding the steady states
H
W
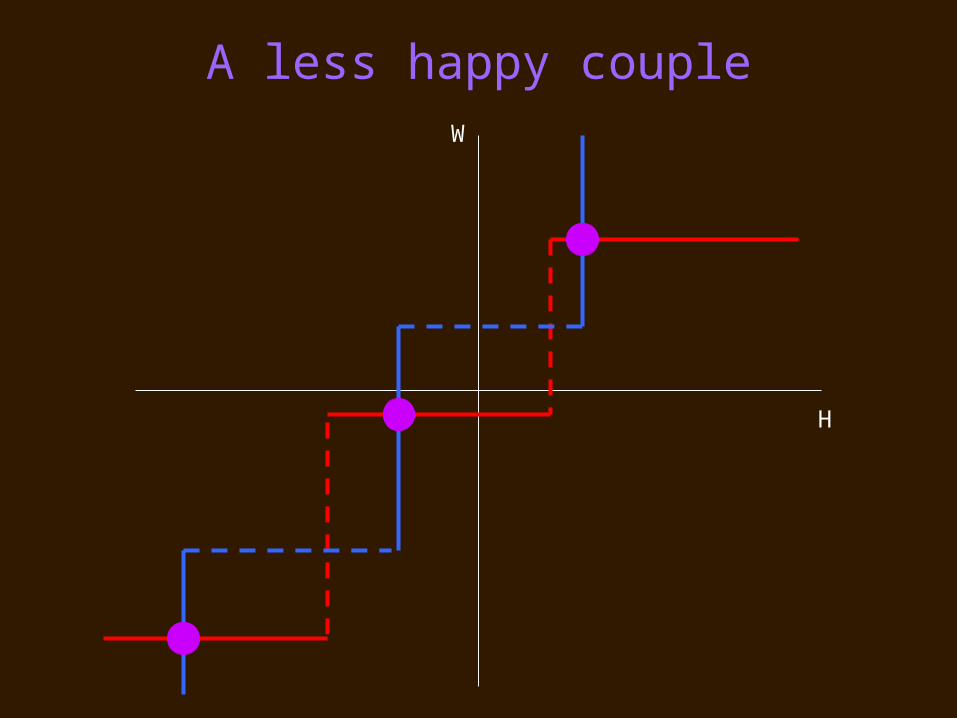
A less happy couple
H
W
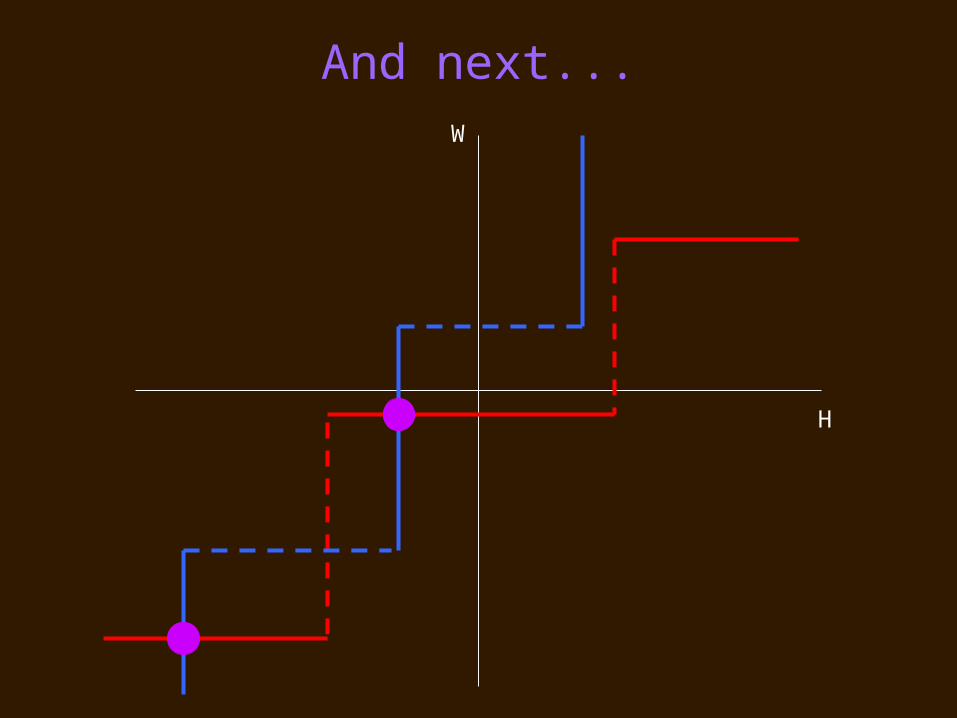
And next...
H
W
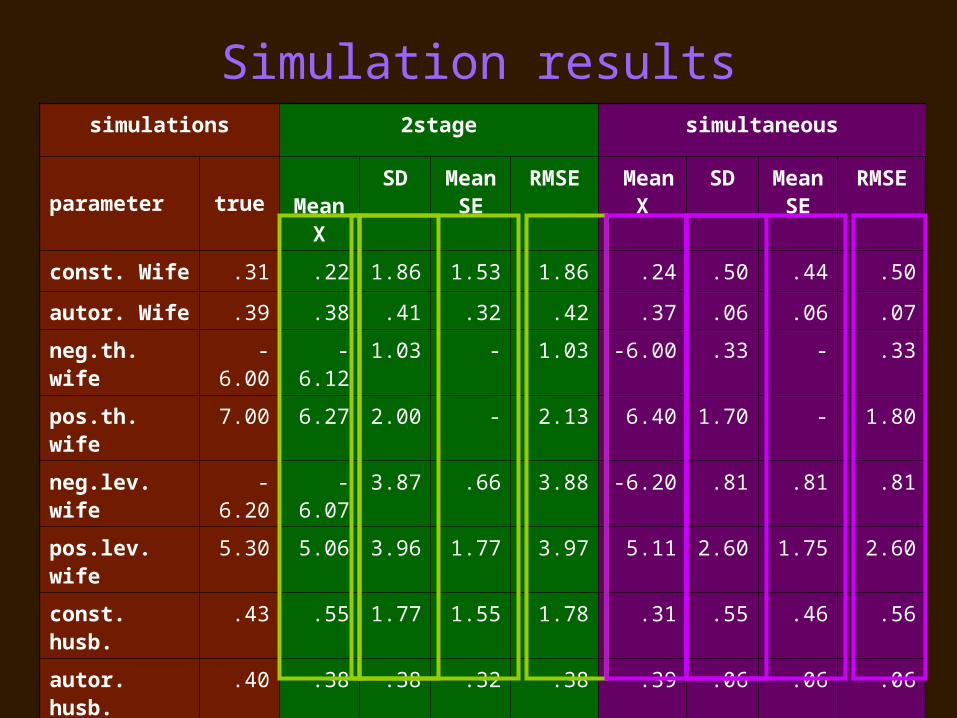
Simulation resultssimulations 2stage simultaneous
parameter true Mean
XSD Mean
SERMSE Mean
XSD Mean
SERMSE
const. Wife .31 .22 1.86 1.53 1.86 .24 .50 .44 .50
autor. Wife .39 .38 .41 .32 .42 .37 .06 .06 .07
neg.th. wife -6.00 -6.12 1.03 - 1.03 -6.00 .33 - .33
pos.th. wife 7.00 6.27 2.00 - 2.13 6.40 1.70 - 1.80
neg.lev. wife -6.20 -6.07 3.87 .66 3.88 -6.20 .81 .81 .81
pos.lev. wife 5.30 5.06 3.96 1.77 3.97 5.11 2.60 1.75 2.60
const. husb. .43 .55 1.77 1.55 1.78 .31 .55 .46 .56
autor. husb. .40 .38 .38 .32 .38 .39 .06 .06 .06
neg.th. husb. -5.00 -5.15 1.26 - 1.27 -5.01 .24 - .24
pos.th. husb. 8.00 6.66 2.51 - 2.84 6.80 2.40 - 2.69
neg.l. husb. -6.50 -6.57 3.30 .64 3.30 -6.39 .86 .80 .87
pos.l. husb. 4.70 4.04 3.92 1.86 3.98 4.38 2.99 1.88 3.01

Outline
History
Problem
Time series analysis
Examples: - academic performance
- extraversion & neuroticism states
- dyadic interaction
Discussion
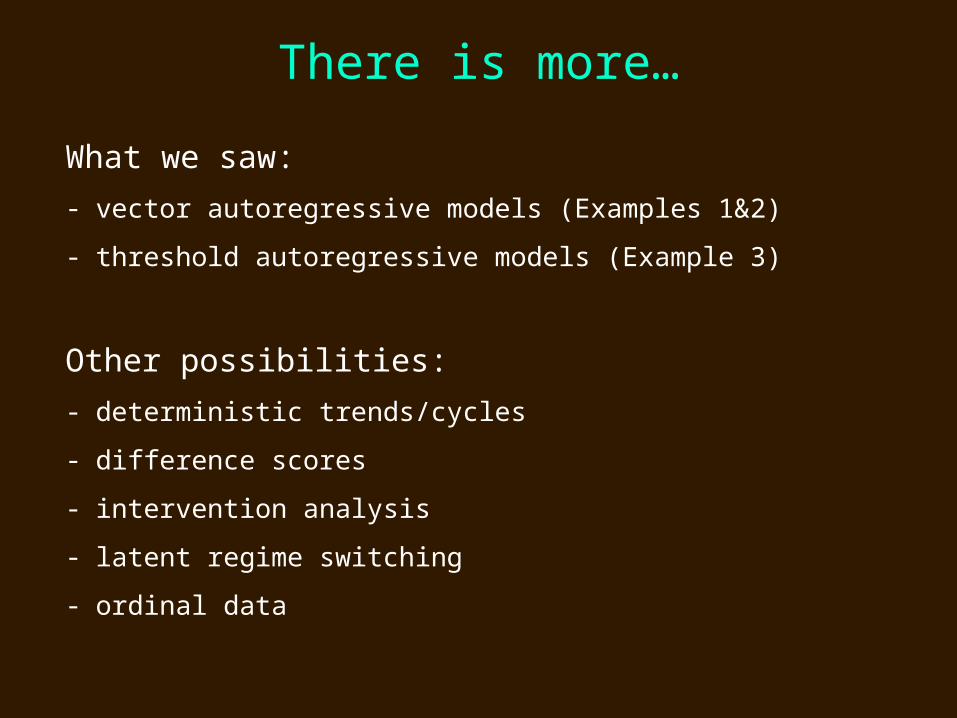
There is more…
What we saw:
- vector autoregressive models (Examples 1&2)
- threshold autoregressive models (Example 3)
Other possibilities:
- deterministic trends/cycles
- difference scores
- intervention analysis
- latent regime switching
- ordinal data
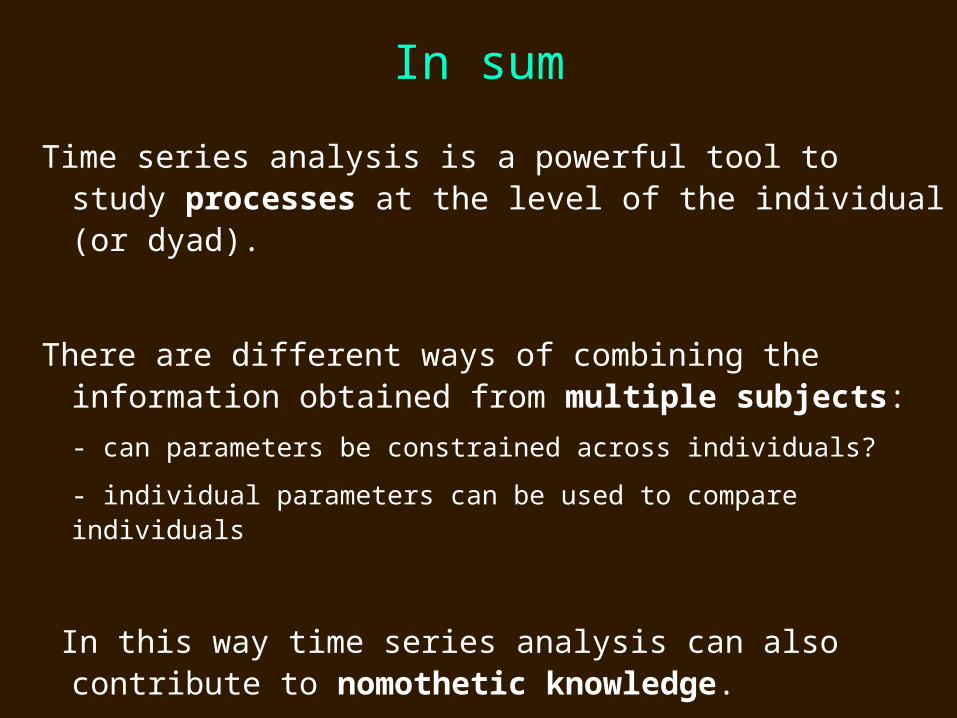
In sum
Time series analysis is a powerful tool to study processes at the level of the individual (or dyad).
There are different ways of combining the information obtained from multiple subjects:
- can parameters be constrained across individuals?
- individual parameters can be used to compare individuals
In this way time series analysis can also contribute to nomothetic knowledge.
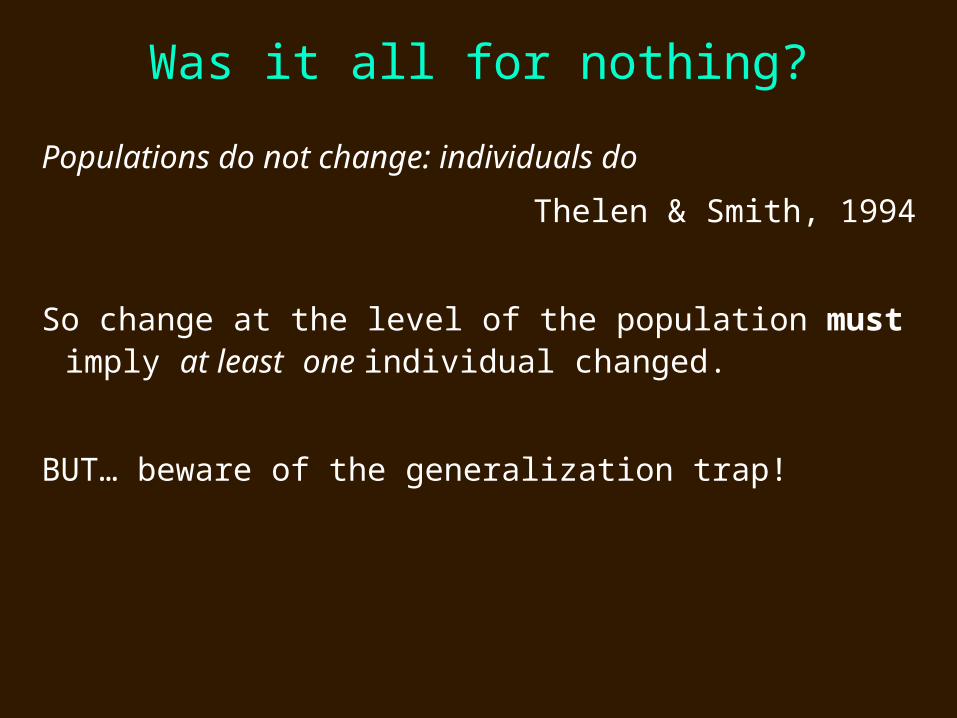
Was it all for nothing?
Populations do not change: individuals do
Thelen & Smith, 1994
So change at the level of the population must imply at least one individual changed.
BUT… beware of the generalization trap!

Thank youemail: [email protected]