Embed Size (px)
Citation preview
Time domain analysis of scattering by a water droplet
Philip Laven9 Russells Crescent, Horley, RH6 7DJ, United Kingdom ([email protected])
Received 23 May 2011; revised 21 July 2011; accepted 21 July 2011;posted 3 August 2011 (Doc. ID 147993); published 23 August 2011
Rainbows, coronas and glories are caused by the scattering of sunlight from water droplets in the atmo-sphere. Although these optical phenomena are seen fairly frequently, even scientifically minded peoplesometimes struggle to provide explanations for their formation. This paper offers explanations of thesephenomena based on numerical computations of the scattering of a 5 fs pulse of red light by a sphericaldroplet of water. The results reveal the intricate details of the various scattering mechanisms, some ofwhich are essentially undetectable except in the time domain. © 2011 Optical Society of AmericaOCIS codes: 010.1290, 240.6690, 290.4020, 320.2250.
1. Introduction
The apparently trivial process of scattering of sun-light by spherical drops of water can produce a widerange of optical phenomena including beautifullycolored rainbows, coronas and glories. Careful obser-vations of such phenomena can provide informationabout the size of the water droplets, but reveal noinformation about the relative importance of variousscattering processes, such as diffraction, reflection,transmission, surface waves, etc.
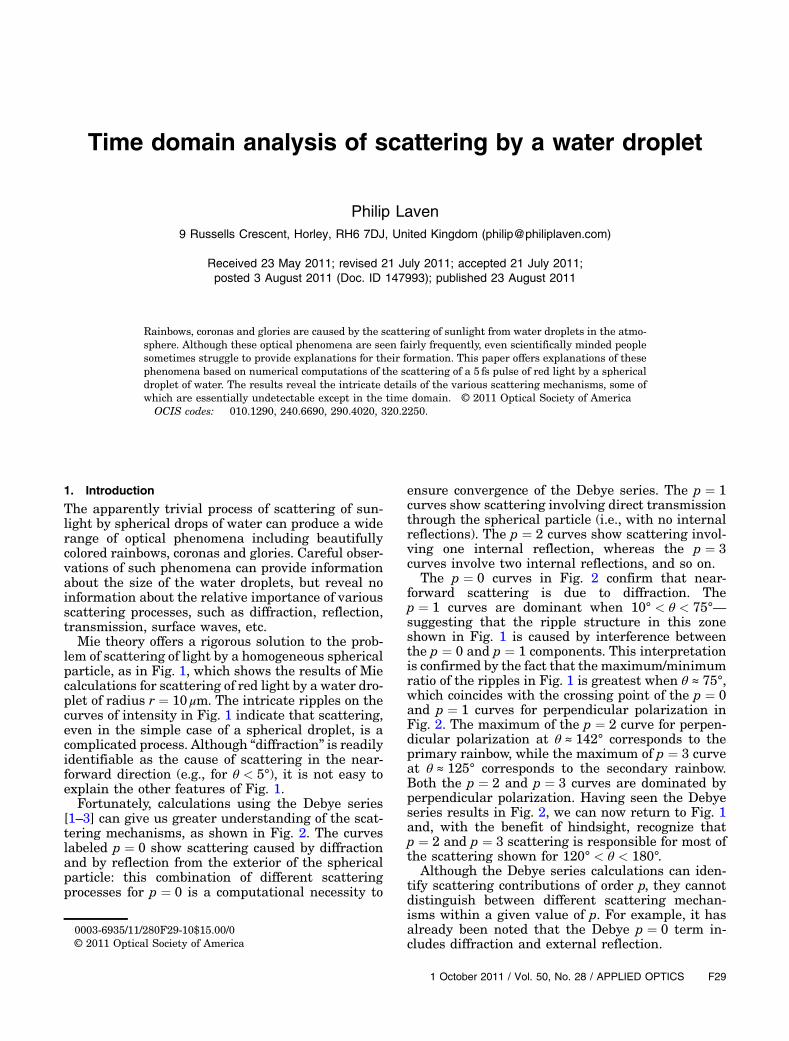
Mie theory offers a rigorous solution to the prob-lem of scattering of light by a homogeneous sphericalparticle, as in Fig. 1, which shows the results of Miecalculations for scattering of red light by a water dro-plet of radius r ¼ 10 μm. The intricate ripples on thecurves of intensity in Fig. 1 indicate that scattering,even in the simple case of a spherical droplet, is acomplicated process. Although “diffraction” is readilyidentifiable as the cause of scattering in the near-forward direction (e.g., for θ < 5°), it is not easy toexplain the other features of Fig. 1.
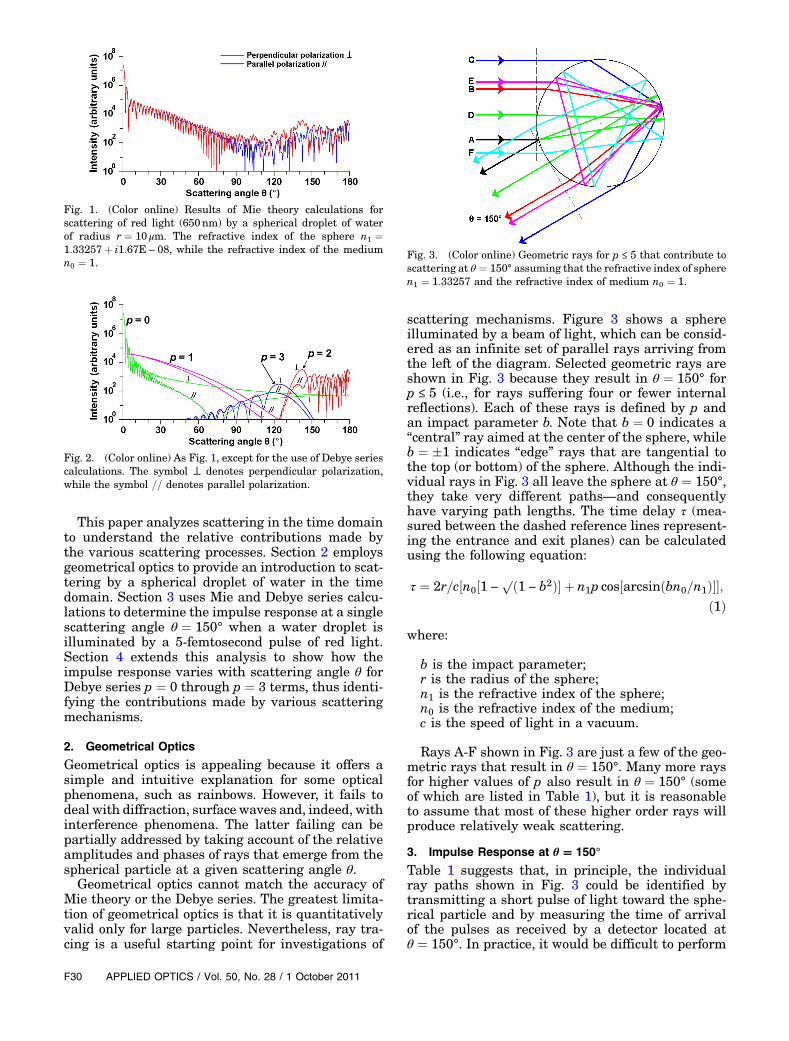
Fortunately, calculations using the Debye series[1–3] can give us greater understanding of the scat-tering mechanisms, as shown in Fig. 2. The curveslabeled p ¼ 0 show scattering caused by diffractionand by reflection from the exterior of the sphericalparticle: this combination of different scatteringprocesses for p ¼ 0 is a computational necessity to
ensure convergence of the Debye series. The p ¼ 1curves show scattering involving direct transmissionthrough the spherical particle (i.e., with no internalreflections). The p ¼ 2 curves show scattering invol-ving one internal reflection, whereas the p ¼ 3curves involve two internal reflections, and so on.
The p ¼ 0 curves in Fig. 2 confirm that near-forward scattering is due to diffraction. Thep ¼ 1 curves are dominant when 10° < θ < 75°—suggesting that the ripple structure in this zoneshown in Fig. 1 is caused by interference betweenthe p ¼ 0 and p ¼ 1 components. This interpretationis confirmed by the fact that the maximum/minimumratio of the ripples in Fig. 1 is greatest when θ ≈ 75°,which coincides with the crossing point of the p ¼ 0and p ¼ 1 curves for perpendicular polarization inFig. 2. The maximum of the p ¼ 2 curve for perpen-dicular polarization at θ ≈ 142° corresponds to theprimary rainbow, while the maximum of p ¼ 3 curveat θ ≈ 125° corresponds to the secondary rainbow.Both the p ¼ 2 and p ¼ 3 curves are dominated byperpendicular polarization. Having seen the Debyeseries results in Fig. 2, we can now return to Fig. 1and, with the benefit of hindsight, recognize thatp ¼ 2 and p ¼ 3 scattering is responsible for most ofthe scattering shown for 120° < θ < 180°.
Although the Debye series calculations can iden-tify scattering contributions of order p, they cannotdistinguish between different scattering mechan-isms within a given value of p. For example, it hasalready been noted that the Debye p ¼ 0 term in-cludes diffraction and external reflection.
0003-6935/11/280F29-10$15.00/0© 2011 Optical Society of America
1 October 2011 / Vol. 50, No. 28 / APPLIED OPTICS F29
This paper analyzes scattering in the time domainto understand the relative contributions made bythe various scattering processes. Section 2 employsgeometrical optics to provide an introduction to scat-tering by a spherical droplet of water in the timedomain. Section 3 uses Mie and Debye series calcu-lations to determine the impulse response at a singlescattering angle θ ¼ 150° when a water droplet isilluminated by a 5-femtosecond pulse of red light.Section 4 extends this analysis to show how theimpulse response varies with scattering angle θ forDebye series p ¼ 0 through p ¼ 3 terms, thus identi-fying the contributions made by various scatteringmechanisms.
2. Geometrical Optics
Geometrical optics is appealing because it offers asimple and intuitive explanation for some opticalphenomena, such as rainbows. However, it fails todeal with diffraction, surface waves and, indeed, withinterference phenomena. The latter failing can bepartially addressed by taking account of the relativeamplitudes and phases of rays that emerge from thespherical particle at a given scattering angle θ.
Geometrical optics cannot match the accuracy ofMie theory or the Debye series. The greatest limita-tion of geometrical optics is that it is quantitativelyvalid only for large particles. Nevertheless, ray tra-cing is a useful starting point for investigations of
scattering mechanisms. Figure 3 shows a sphereilluminated by a beam of light, which can be consid-ered as an infinite set of parallel rays arriving fromthe left of the diagram. Selected geometric rays areshown in Fig. 3 because they result in θ ¼ 150° forp ≤ 5 (i.e., for rays suffering four or fewer internalreflections). Each of these rays is defined by p andan impact parameter b. Note that b ¼ 0 indicates a“central” ray aimed at the center of the sphere, whileb ¼ �1 indicates “edge” rays that are tangential tothe top (or bottom) of the sphere. Although the indi-vidual rays in Fig. 3 all leave the sphere at θ ¼ 150°,they take very different paths—and consequentlyhave varying path lengths. The time delay τ (mea-sured between the dashed reference lines represent-ing the entrance and exit planes) can be calculatedusing the following equation:
τ ¼ 2r=c½n0½1 −pð1 − b2Þ� þ n1p cos½arcsinðbn0=n1Þ��;
ð1Þ
where:
b is the impact parameter;r is the radius of the sphere;n1 is the refractive index of the sphere;n0 is the refractive index of the medium;c is the speed of light in a vacuum.
Rays A-F shown in Fig. 3 are just a few of the geo-metric rays that result in θ ¼ 150°. Many more raysfor higher values of p also result in θ ¼ 150° (someof which are listed in Table 1), but it is reasonableto assume that most of these higher order rays willproduce relatively weak scattering.
3. Impulse Response at θ � 150°
Table 1 suggests that, in principle, the individualray paths shown in Fig. 3 could be identified bytransmitting a short pulse of light toward the sphe-rical particle and by measuring the time of arrivalof the pulses as received by a detector located atθ ¼ 150°. In practice, it would be difficult to perform
Fig. 1. (Color online) Results of Mie theory calculations forscattering of red light (650nm) by a spherical droplet of waterof radius r ¼ 10 μm. The refractive index of the sphere n1 ¼1:33257þ i1:67E − 08, while the refractive index of the mediumn0 ¼ 1.
Fig. 2. (Color online) As Fig. 1, except for the use of Debye seriescalculations. The symbol ⊥ denotes perpendicular polarization,while the symbol == denotes parallel polarization.
Fig. 3. (Color online) Geometric rays for p ≤ 5 that contribute toscattering at θ ¼ 150° assuming that the refractive index of spheren1 ¼ 1:33257 and the refractive index of medium n0 ¼ 1.
F30 APPLIED OPTICS / Vol. 50, No. 28 / 1 October 2011
such an experiment, but numerous authors have per-formed numerical computations using Mie theoryto determine the impulse response of a sphericalparticle at a given value of θ. [4–13] Their resultshave potential applications for particle-sizing anddetermination of refractive index, but the specificaim of this paper is to use such techniques to obtaingreater understanding of the various scatteringmechanisms.
All of the results in this paper have been generatedusing the MiePlot computer program which can bedownloaded free of charge from www.philiplaven.com/mieplot.htm. The MiePlot program first per-forms a fast Fourier transform (FFT) on the pulseshape in the time domain to determine the spectrumof the pulse, which is then multiplied by the resultsof scattering calculations for a range of scattering
angles θ at a number of discrete wavelengths acrossthe bandwidth of the pulse. The results for a givenvalue of θ as a function of wavelength are then sub-jected to another FFT so as to produce the timedomain impulse response for that value of θ. Figure 4shows the calculated impulse response for scatteringangle θ ¼ 150° for the following conditions:
• Nominal wavelength: λ ¼ 650nm;• Pulse duration: t0 ¼ 5 fs (half-amplitude dura-
tion with pulse shape defined by amplitude E ¼0:5½1þ cosðπt=t0Þ� for −t0 < t < t0);
• Pulse bandwidth: 564nm–767nm at −3dBpoints; but the bandwidth of the pulse has been trun-cated at −40dB points (404nm–1664nm);
• Sphere radius r ¼ 10 μm;• Refractive index of sphere: n1 ¼ 1:33257þ
i1:67E − 08 at nominal wavelength λ ¼ 650nm (N.B.The real part of the refractive index of water is 1.344at 404nm and 1.313 at 1664nm, while the imaginarypart is negligible for the current purposes.);
• Refractive index of medium: n0 ¼ 1.
Figures 4(a) and 4(b) have been calculated usingMie theory, while Fig. 4(c) has been calculated usingthe Debye series so as to separate scattering contri-butions for various values of p. Figures 4(b) and 4(c)have been calculated using a fixed value of refractiveindex of the sphere across the bandwidth of the pulse(i.e., n1 ¼ 1:33257þ i1:67E − 08).
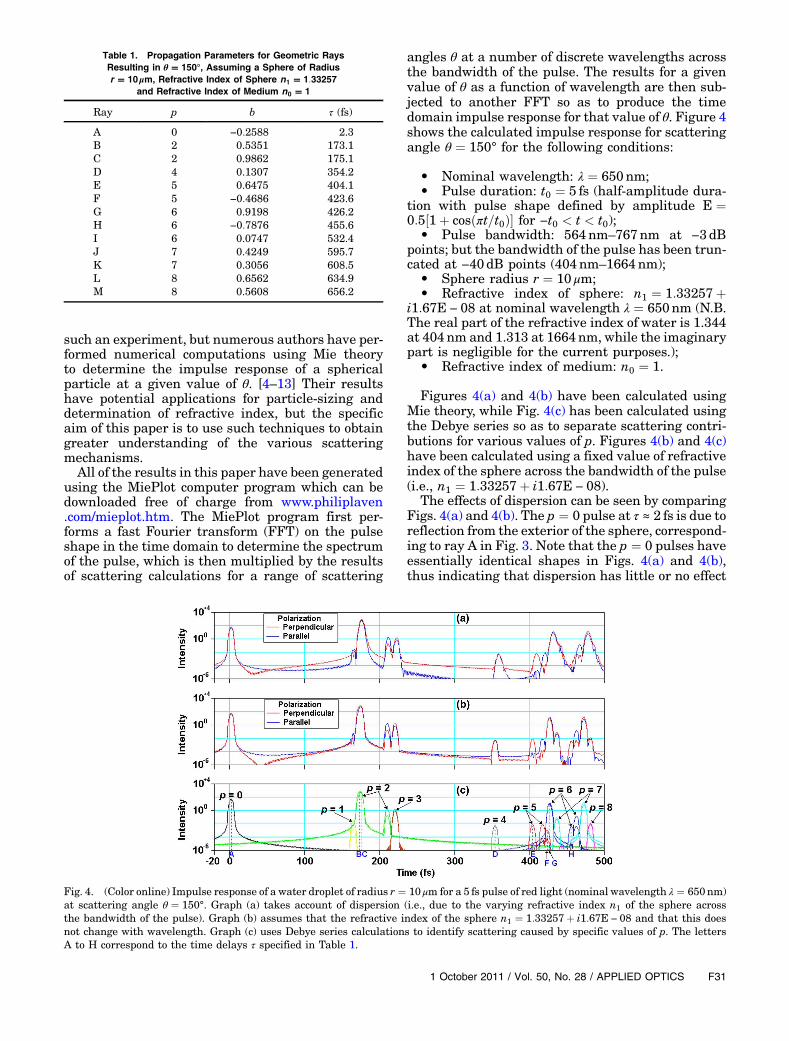
The effects of dispersion can be seen by comparingFigs. 4(a) and 4(b). The p ¼ 0 pulse at τ ≈ 2 fs is due toreflection from the exterior of the sphere, correspond-ing to ray A in Fig. 3. Note that the p ¼ 0 pulses haveessentially identical shapes in Figs. 4(a) and 4(b),thus indicating that dispersion has little or no effect
Table 1. Propagation Parameters for Geometric RaysResulting in θ � 150°, Assuming a Sphere of Radiusr � 10 μm, Refractive Index of Sphere n1 � 1:33257
and Refractive Index of Medium n0 � 1
Ray p b τ (fs)
A 0 −0:2588 2.3B 2 0.5351 173.1C 2 0.9862 175.1D 4 0.1307 354.2E 5 0.6475 404.1F 5 −0:4686 423.6G 6 0.9198 426.2H 6 −0:7876 455.6I 6 0.0747 532.4J 7 0.4249 595.7K 7 0.3056 608.5L 8 0.6562 634.9M 8 0.5608 656.2
Fig. 4. (Color online) Impulse response of a water droplet of radius r ¼ 10 μm for a 5 fs pulse of red light (nominal wavelength λ ¼ 650nm)at scattering angle θ ¼ 150°. Graph (a) takes account of dispersion (i.e., due to the varying refractive index n1 of the sphere acrossthe bandwidth of the pulse). Graph (b) assumes that the refractive index of the sphere n1 ¼ 1:33257þ i1:67E − 08 and that this doesnot change with wavelength. Graph (c) uses Debye series calculations to identify scattering caused by specific values of p. The lettersA to H correspond to the time delays τ specified in Table 1.
1 October 2011 / Vol. 50, No. 28 / APPLIED OPTICS F31
on these pulses. But, for p > 0, the pulses in Fig. 4(a)are broadened and slightly shifted in time relativeto Fig. 4(b). For example, the p ¼ 4 pulses have verydifferent shapes and, furthermore, show maximumintensity at τ ¼ 359:1 fs in Fig. 4(a) and τ ¼ 354:2 fsin Fig. 4(b).
Although the Figs. 4(b) and 4(c) incorrectly assumethat the refractive index of the sphere n1 is indepen-dent of wavelength, several of the pulses in Fig. 4(c)coincide with the timings from Table 1, as indicatedby the dotted vertical lines marked A to H. This closeagreement between the values of τ given by the var-ious independent methods of calculation (i.e., Mie,Debye and ray-tracing) gives considerable confidencein the results.
However, it is also important to acknowledge thatsome of the scattered pulses shown for θ ¼ 150° inFig. 4(c) were not predicted by the ray-tracing exer-cise in Fig. 3—for example, there is a p ¼ 1 pulse atτ ≈ 165:2 fs, a p ¼ 2 pulse at τ ≈ 210 fs, a p ¼ 3 pulseat τ ≈ 220 fs, and a p ¼ 5 pulse at τ ≈ 416 fs. Whatcauses these “nongeometrical” pulses?
4. Impulse Response as a Function of θ
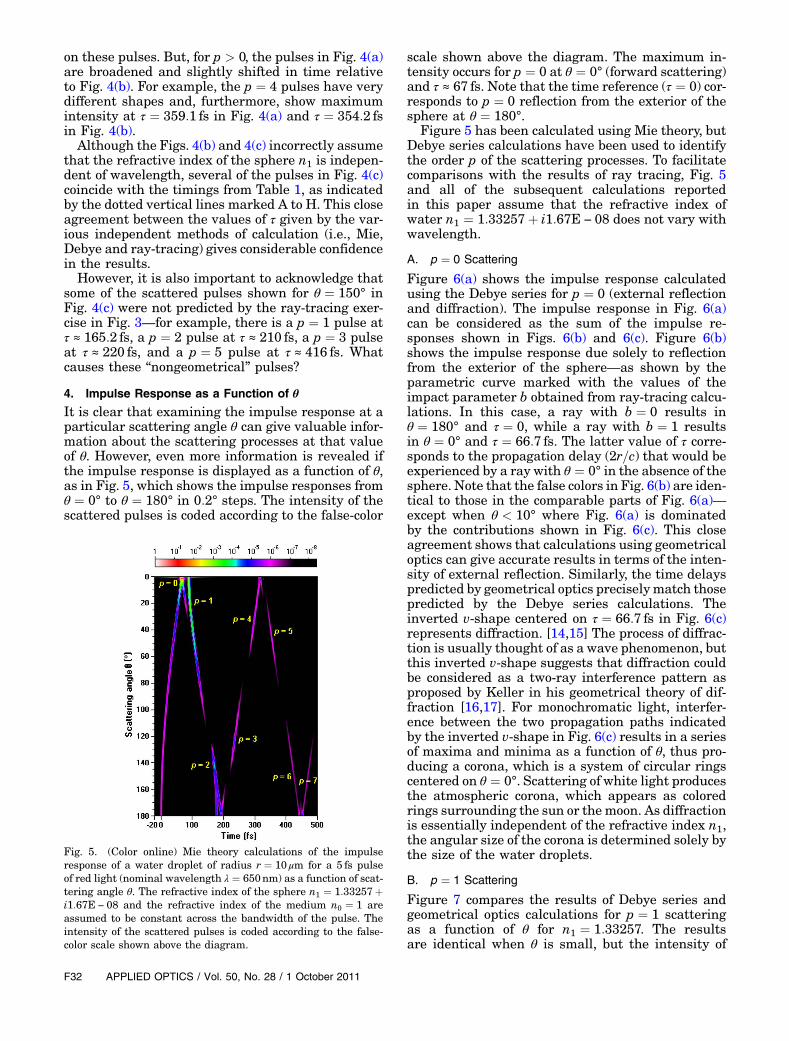
It is clear that examining the impulse response at aparticular scattering angle θ can give valuable infor-mation about the scattering processes at that valueof θ. However, even more information is revealed ifthe impulse response is displayed as a function of θ,as in Fig. 5, which shows the impulse responses fromθ ¼ 0° to θ ¼ 180° in 0:2° steps. The intensity of thescattered pulses is coded according to the false-color
scale shown above the diagram. The maximum in-tensity occurs for p ¼ 0 at θ ¼ 0° (forward scattering)and τ ≈ 67 fs. Note that the time reference (τ ¼ 0) cor-responds to p ¼ 0 reflection from the exterior of thesphere at θ ¼ 180°.
Figure 5 has been calculated using Mie theory, butDebye series calculations have been used to identifythe order p of the scattering processes. To facilitatecomparisons with the results of ray tracing, Fig. 5and all of the subsequent calculations reportedin this paper assume that the refractive index ofwater n1 ¼ 1:33257þ i1:67E − 08 does not vary withwavelength.
A. p ¼ 0 Scattering
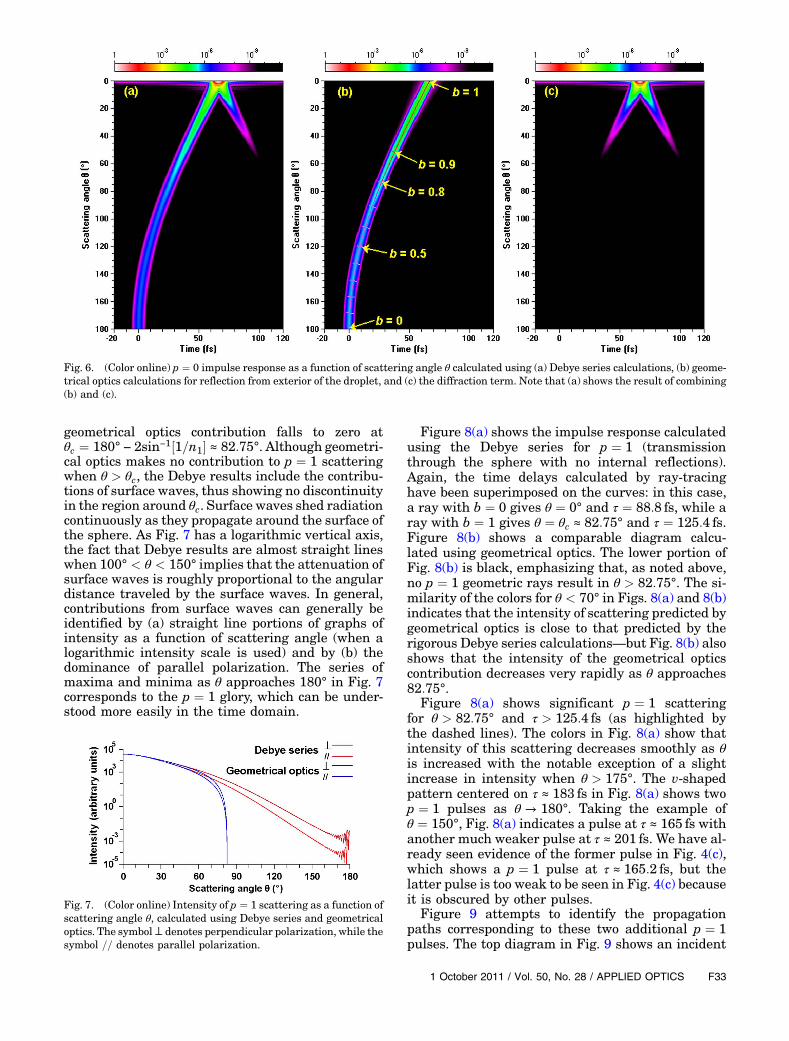
Figure 6(a) shows the impulse response calculatedusing the Debye series for p ¼ 0 (external reflectionand diffraction). The impulse response in Fig. 6(a)can be considered as the sum of the impulse re-sponses shown in Figs. 6(b) and 6(c). Figure 6(b)shows the impulse response due solely to reflectionfrom the exterior of the sphere—as shown by theparametric curve marked with the values of theimpact parameter b obtained from ray-tracing calcu-lations. In this case, a ray with b ¼ 0 results inθ ¼ 180° and τ ¼ 0, while a ray with b ¼ 1 resultsin θ ¼ 0° and τ ¼ 66:7 fs. The latter value of τ corre-sponds to the propagation delay (2r=c) that would beexperienced by a ray with θ ¼ 0° in the absence of thesphere. Note that the false colors in Fig. 6(b) are iden-tical to those in the comparable parts of Fig. 6(a)—except when θ < 10° where Fig. 6(a) is dominatedby the contributions shown in Fig. 6(c). This closeagreement shows that calculations using geometricaloptics can give accurate results in terms of the inten-sity of external reflection. Similarly, the time delayspredicted by geometrical optics preciselymatch thosepredicted by the Debye series calculations. Theinverted v-shape centered on τ ¼ 66:7 fs in Fig. 6(c)represents diffraction. [14,15] The process of diffrac-tion is usually thought of as a wave phenomenon, butthis inverted v-shape suggests that diffraction couldbe considered as a two-ray interference pattern asproposed by Keller in his geometrical theory of dif-fraction [16,17]. For monochromatic light, interfer-ence between the two propagation paths indicatedby the inverted v-shape in Fig. 6(c) results in a seriesof maxima and minima as a function of θ, thus pro-ducing a corona, which is a system of circular ringscentered on θ ¼ 0°. Scattering of white light producesthe atmospheric corona, which appears as coloredrings surrounding the sun or the moon. As diffractionis essentially independent of the refractive index n1,the angular size of the corona is determined solely bythe size of the water droplets.
B. p ¼ 1 Scattering
Figure 7 compares the results of Debye series andgeometrical optics calculations for p ¼ 1 scatteringas a function of θ for n1 ¼ 1:33257. The resultsare identical when θ is small, but the intensity of
Fig. 5. (Color online) Mie theory calculations of the impulseresponse of a water droplet of radius r ¼ 10 μm for a 5 fs pulseof red light (nominal wavelength λ ¼ 650nm) as a function of scat-tering angle θ. The refractive index of the sphere n1 ¼ 1:33257þi1:67E − 08 and the refractive index of the medium n0 ¼ 1 areassumed to be constant across the bandwidth of the pulse. Theintensity of the scattered pulses is coded according to the false-color scale shown above the diagram.
F32 APPLIED OPTICS / Vol. 50, No. 28 / 1 October 2011
geometrical optics contribution falls to zero atθc ¼ 180° − 2sin−1½1=n1� ≈ 82:75°. Although geometri-cal optics makes no contribution to p ¼ 1 scatteringwhen θ > θc, the Debye results include the contribu-tions of surface waves, thus showing no discontinuityin the region around θc. Surface waves shed radiationcontinuously as they propagate around the surface ofthe sphere. As Fig. 7 has a logarithmic vertical axis,the fact that Debye results are almost straight lineswhen 100° < θ < 150° implies that the attenuation ofsurface waves is roughly proportional to the angulardistance traveled by the surface waves. In general,contributions from surface waves can generally beidentified by (a) straight line portions of graphs ofintensity as a function of scattering angle (when alogarithmic intensity scale is used) and by (b) thedominance of parallel polarization. The series ofmaxima and minima as θ approaches 180° in Fig. 7corresponds to the p ¼ 1 glory, which can be under-stood more easily in the time domain.
Figure 8(a) shows the impulse response calculatedusing the Debye series for p ¼ 1 (transmissionthrough the sphere with no internal reflections).Again, the time delays calculated by ray-tracinghave been superimposed on the curves: in this case,a ray with b ¼ 0 gives θ ¼ 0° and τ ¼ 88:8 fs, while aray with b ¼ 1 gives θ ¼ θc ≈ 82:75° and τ ¼ 125:4 fs.Figure 8(b) shows a comparable diagram calcu-lated using geometrical optics. The lower portion ofFig. 8(b) is black, emphasizing that, as noted above,no p ¼ 1 geometric rays result in θ > 82:75°. The si-milarity of the colors for θ < 70° in Figs. 8(a) and 8(b)indicates that the intensity of scattering predicted bygeometrical optics is close to that predicted by therigorous Debye series calculations—but Fig. 8(b) alsoshows that the intensity of the geometrical opticscontribution decreases very rapidly as θ approaches82:75°.
Figure 8(a) shows significant p ¼ 1 scatteringfor θ > 82:75° and τ > 125:4 fs (as highlighted bythe dashed lines). The colors in Fig. 8(a) show thatintensity of this scattering decreases smoothly as θis increased with the notable exception of a slightincrease in intensity when θ > 175°. The v-shapedpattern centered on τ ≈ 183 fs in Fig. 8(a) shows twop ¼ 1 pulses as θ → 180°. Taking the example ofθ ¼ 150°, Fig. 8(a) indicates a pulse at τ ≈ 165 fs withanother much weaker pulse at τ ≈ 201 fs. We have al-ready seen evidence of the former pulse in Fig. 4(c),which shows a p ¼ 1 pulse at τ ≈ 165:2 fs, but thelatter pulse is too weak to be seen in Fig. 4(c) becauseit is obscured by other pulses.
Figure 9 attempts to identify the propagationpaths corresponding to these two additional p ¼ 1pulses. The top diagram in Fig. 9 shows an incident
Fig. 6. (Color online) p ¼ 0 impulse response as a function of scattering angle θ calculated using (a) Debye series calculations, (b) geome-trical optics calculations for reflection from exterior of the droplet, and (c) the diffraction term. Note that (a) shows the result of combining(b) and (c).
Fig. 7. (Color online) Intensity of p ¼ 1 scattering as a function ofscattering angle θ, calculated using Debye series and geometricaloptics. The symbol⊥ denotes perpendicular polarization, while thesymbol == denotes parallel polarization.
1 October 2011 / Vol. 50, No. 28 / APPLIED OPTICS F33
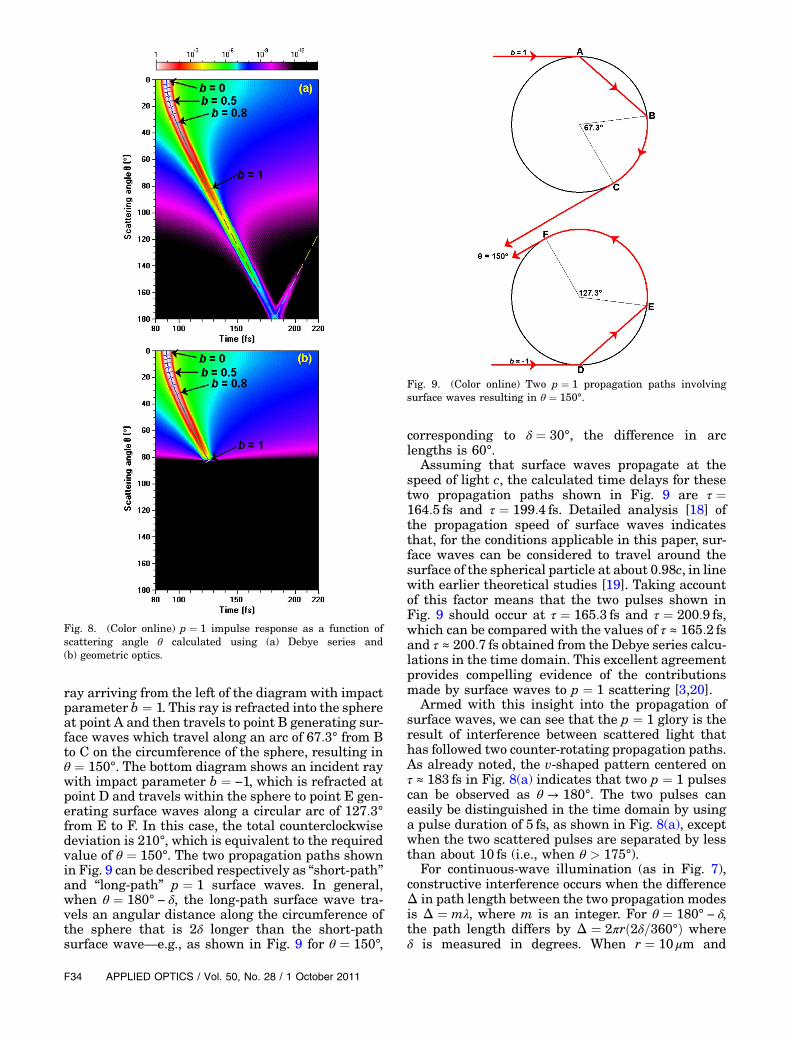
ray arriving from the left of the diagram with impactparameter b ¼ 1. This ray is refracted into the sphereat point A and then travels to point B generating sur-face waves which travel along an arc of 67:3° from Bto C on the circumference of the sphere, resulting inθ ¼ 150°. The bottom diagram shows an incident raywith impact parameter b ¼ −1, which is refracted atpoint D and travels within the sphere to point E gen-erating surface waves along a circular arc of 127:3°from E to F. In this case, the total counterclockwisedeviation is 210°, which is equivalent to the requiredvalue of θ ¼ 150°. The two propagation paths shownin Fig. 9 can be described respectively as “short-path”and “long-path” p ¼ 1 surface waves. In general,when θ ¼ 180° − δ, the long-path surface wave tra-vels an angular distance along the circumference ofthe sphere that is 2δ longer than the short-pathsurface wave—e.g., as shown in Fig. 9 for θ ¼ 150°,
corresponding to δ ¼ 30°, the difference in arclengths is 60°.
Assuming that surface waves propagate at thespeed of light c, the calculated time delays for thesetwo propagation paths shown in Fig. 9 are τ ¼164:5 fs and τ ¼ 199:4 fs. Detailed analysis [18] ofthe propagation speed of surface waves indicatesthat, for the conditions applicable in this paper, sur-face waves can be considered to travel around thesurface of the spherical particle at about 0:98c, in linewith earlier theoretical studies [19]. Taking accountof this factor means that the two pulses shown inFig. 9 should occur at τ ¼ 165:3 fs and τ ¼ 200:9 fs,which can be compared with the values of τ ≈ 165:2 fsand τ ≈ 200:7 fs obtained from the Debye series calcu-lations in the time domain. This excellent agreementprovides compelling evidence of the contributionsmade by surface waves to p ¼ 1 scattering [3,20].
Armed with this insight into the propagation ofsurface waves, we can see that the p ¼ 1 glory is theresult of interference between scattered light thathas followed two counter-rotating propagation paths.As already noted, the v-shaped pattern centered onτ ≈ 183 fs in Fig. 8(a) indicates that two p ¼ 1 pulsescan be observed as θ → 180°. The two pulses caneasily be distinguished in the time domain by usinga pulse duration of 5 fs, as shown in Fig. 8(a), exceptwhen the two scattered pulses are separated by lessthan about 10 fs (i.e., when θ > 175°).
For continuous-wave illumination (as in Fig. 7),constructive interference occurs when the differenceΔ in path length between the two propagation modesis Δ ¼ mλ, where m is an integer. For θ ¼ 180° − δ,the path length differs by Δ ¼ 2πrð2δ=360°Þ whereδ is measured in degrees. When r ¼ 10 μm and
Fig. 8. (Color online) p ¼ 1 impulse response as a function ofscattering angle θ calculated using (a) Debye series and(b) geometric optics.
Fig. 9. (Color online) Two p ¼ 1 propagation paths involvingsurface waves resulting in θ ¼ 150°.
F34 APPLIED OPTICS / Vol. 50, No. 28 / 1 October 2011
λ× ¼ 650 × ×nm, maxima should occur when δ is amultiple of 1:86° (i.e., at θ ¼ 180°, 178:1°, 176:4°and 174:1°) corresponding to the rings of the p ¼ 1glory, confirming the results shown for parallel polar-ization in Fig. 7. As δ increases, the “long-path” sur-face wave contribution becomes much weaker thanthe “short-path” surface wave contribution, thus ex-plaining why the glory appears only when δ is small—i.e., when θ → 180°. Although the Debye calcula-tions for p ¼ 1 scattering show clear evidence of aglory when θ → 180°, this glory is much weaker thanthe scattering for other values of p—and, hence, itcannot be observed in practice. Nevertheless, the p ¼1 glory is worth studying because, as will be seen inthe next section, the atmospheric glory caused by p ¼2 scattering is formed by similar processes.
C. p ¼ 2 Scattering
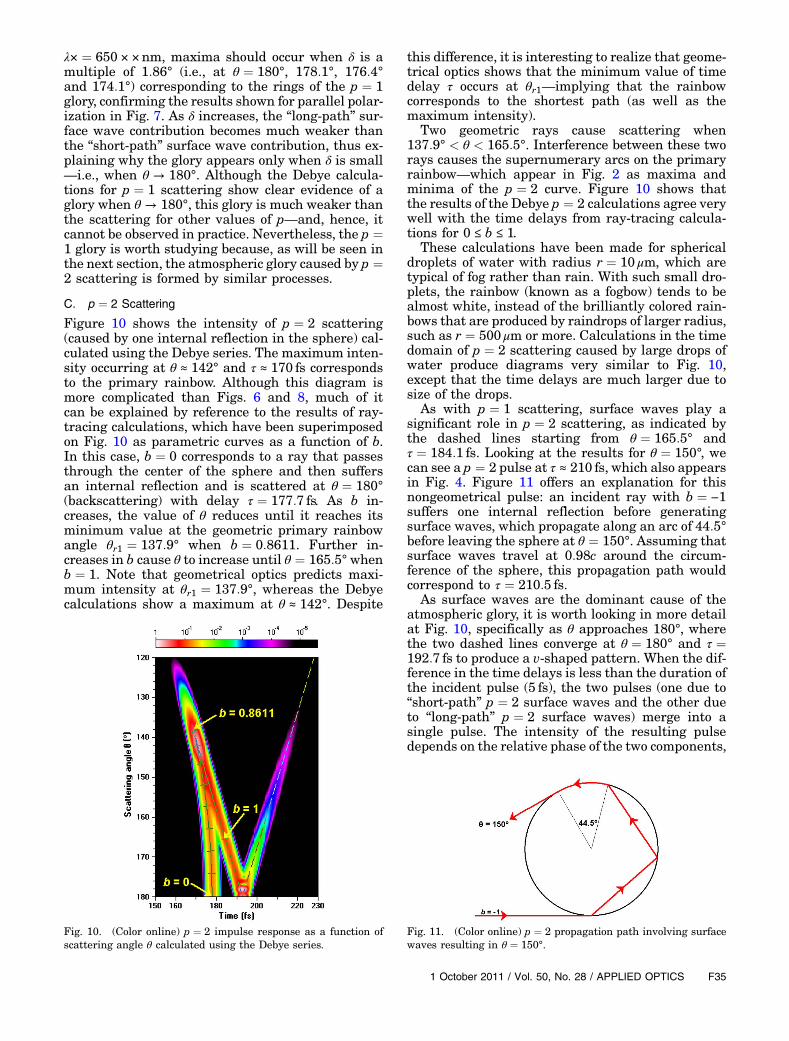
Figure 10 shows the intensity of p ¼ 2 scattering(caused by one internal reflection in the sphere) cal-culated using the Debye series. The maximum inten-sity occurring at θ ≈ 142° and τ ≈ 170 fs correspondsto the primary rainbow. Although this diagram ismore complicated than Figs. 6 and 8, much of itcan be explained by reference to the results of ray-tracing calculations, which have been superimposedon Fig. 10 as parametric curves as a function of b.In this case, b ¼ 0 corresponds to a ray that passesthrough the center of the sphere and then suffersan internal reflection and is scattered at θ ¼ 180°(backscattering) with delay τ ¼ 177:7 fs. As b in-creases, the value of θ reduces until it reaches itsminimum value at the geometric primary rainbowangle θr1 ¼ 137:9° when b ¼ 0:8611. Further in-creases in b cause θ to increase until θ ¼ 165:5° whenb ¼ 1. Note that geometrical optics predicts maxi-mum intensity at θr1 ¼ 137:9°, whereas the Debyecalculations show a maximum at θ ≈ 142°. Despite
this difference, it is interesting to realize that geome-trical optics shows that the minimum value of timedelay τ occurs at θr1—implying that the rainbowcorresponds to the shortest path (as well as themaximum intensity).
Two geometric rays cause scattering when137:9° < θ < 165:5°. Interference between these tworays causes the supernumerary arcs on the primaryrainbow—which appear in Fig. 2 as maxima andminima of the p ¼ 2 curve. Figure 10 shows thatthe results of the Debye p ¼ 2 calculations agree verywell with the time delays from ray-tracing calcula-tions for 0 ≤ b ≤ 1.
These calculations have been made for sphericaldroplets of water with radius r ¼ 10 μm, which aretypical of fog rather than rain. With such small dro-plets, the rainbow (known as a fogbow) tends to bealmost white, instead of the brilliantly colored rain-bows that are produced by raindrops of larger radius,such as r ¼ 500 μm or more. Calculations in the timedomain of p ¼ 2 scattering caused by large drops ofwater produce diagrams very similar to Fig. 10,except that the time delays are much larger due tosize of the drops.
As with p ¼ 1 scattering, surface waves play asignificant role in p ¼ 2 scattering, as indicated bythe dashed lines starting from θ ¼ 165:5° andτ ¼ 184:1 fs. Looking at the results for θ ¼ 150°, wecan see a p ¼ 2 pulse at τ ≈ 210 fs, which also appearsin Fig. 4. Figure 11 offers an explanation for thisnongeometrical pulse: an incident ray with b ¼ −1suffers one internal reflection before generatingsurface waves, which propagate along an arc of 44:5°before leaving the sphere at θ ¼ 150°. Assuming thatsurface waves travel at 0:98c around the circum-ference of the sphere, this propagation path wouldcorrespond to τ ¼ 210:5 fs.
As surface waves are the dominant cause of theatmospheric glory, it is worth looking in more detailat Fig. 10, specifically as θ approaches 180°, wherethe two dashed lines converge at θ ¼ 180° and τ ¼192:7 fs to produce a v-shaped pattern. When the dif-ference in the time delays is less than the duration ofthe incident pulse (5 fs), the two pulses (one due to“short-path” p ¼ 2 surface waves and the other dueto “long-path” p ¼ 2 surface waves) merge into asingle pulse. The intensity of the resulting pulsedepends on the relative phase of the two components,
Fig. 10. (Color online) p ¼ 2 impulse response as a function ofscattering angle θ calculated using the Debye series.
Fig. 11. (Color online) p ¼ 2 propagation path involving surfacewaves resulting in θ ¼ 150°.
1 October 2011 / Vol. 50, No. 28 / APPLIED OPTICS F35
just as it does for illumination by a continuous-wavesource of light. Figure 10 shows increased intensityat θ ≈ 178° due to constructive interference betweenthe two components.
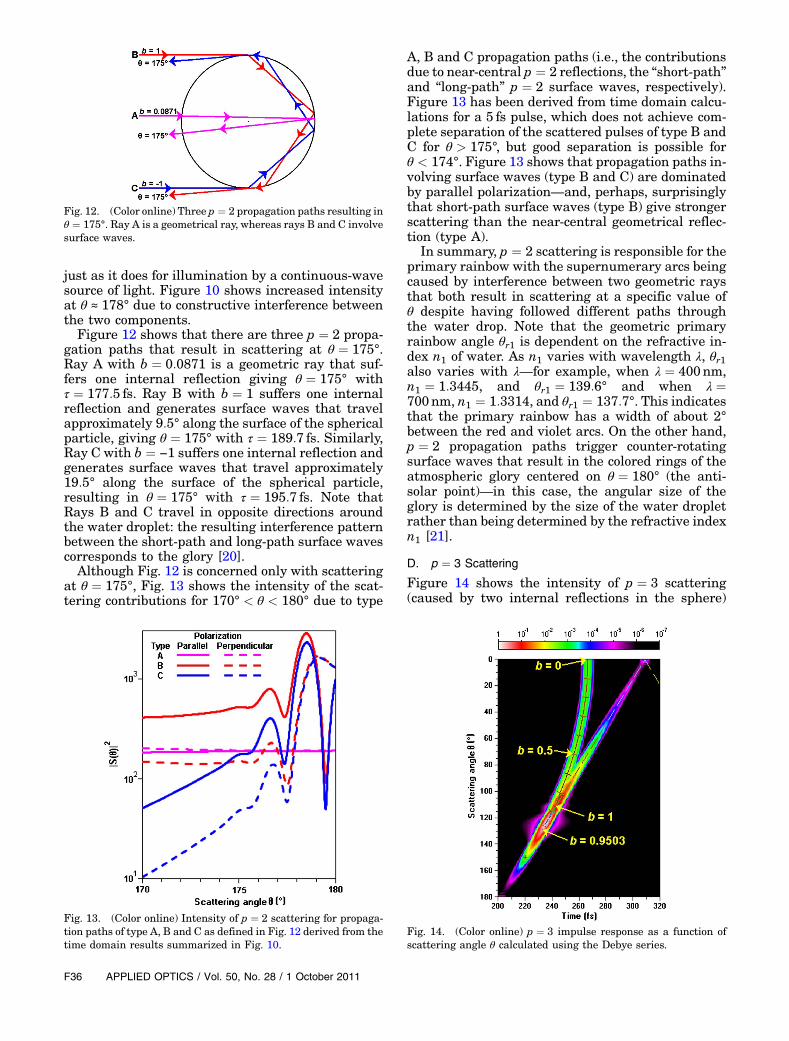
Figure 12 shows that there are three p ¼ 2 propa-gation paths that result in scattering at θ ¼ 175°.Ray A with b ¼ 0:0871 is a geometric ray that suf-fers one internal reflection giving θ ¼ 175° withτ ¼ 177:5 fs. Ray B with b ¼ 1 suffers one internalreflection and generates surface waves that travelapproximately 9:5° along the surface of the sphericalparticle, giving θ ¼ 175° with τ ¼ 189:7 fs. Similarly,Ray C with b ¼ −1 suffers one internal reflection andgenerates surface waves that travel approximately19:5° along the surface of the spherical particle,resulting in θ ¼ 175° with τ ¼ 195:7 fs. Note thatRays B and C travel in opposite directions aroundthe water droplet: the resulting interference patternbetween the short-path and long-path surface wavescorresponds to the glory [20].
Although Fig. 12 is concerned only with scatteringat θ ¼ 175°, Fig. 13 shows the intensity of the scat-tering contributions for 170° < θ < 180° due to type
A, B and C propagation paths (i.e., the contributionsdue to near-central p ¼ 2 reflections, the “short-path”and “long-path” p ¼ 2 surface waves, respectively).Figure 13 has been derived from time domain calcu-lations for a 5 fs pulse, which does not achieve com-plete separation of the scattered pulses of type B andC for θ > 175°, but good separation is possible forθ < 174°. Figure 13 shows that propagation paths in-volving surface waves (type B and C) are dominatedby parallel polarization—and, perhaps, surprisinglythat short-path surface waves (type B) give strongerscattering than the near-central geometrical reflec-tion (type A).
In summary, p ¼ 2 scattering is responsible for theprimary rainbow with the supernumerary arcs beingcaused by interference between two geometric raysthat both result in scattering at a specific value ofθ despite having followed different paths throughthe water drop. Note that the geometric primaryrainbow angle θr1 is dependent on the refractive in-dex n1 of water. As n1 varies with wavelength λ, θr1also varies with λ—for example, when λ ¼ 400nm,n1 ¼ 1:3445, and θr1 ¼ 139:6° and when λ ¼700nm, n1 ¼ 1:3314, and θr1 ¼ 137:7°. This indicatesthat the primary rainbow has a width of about 2°between the red and violet arcs. On the other hand,p ¼ 2 propagation paths trigger counter-rotatingsurface waves that result in the colored rings of theatmospheric glory centered on θ ¼ 180° (the anti-solar point)—in this case, the angular size of theglory is determined by the size of the water dropletrather than being determined by the refractive indexn1 [21].
D. p ¼ 3 Scattering
Figure 14 shows the intensity of p ¼ 3 scattering(caused by two internal reflections in the sphere)
Fig. 12. (Color online) Three p ¼ 2 propagation paths resulting inθ ¼ 175°. Ray A is a geometrical ray, whereas rays B and C involvesurface waves.
Fig. 13. (Color online) Intensity of p ¼ 2 scattering for propaga-tion paths of type A, B and C as defined in Fig. 12 derived from thetime domain results summarized in Fig. 10.
Fig. 14. (Color online) p ¼ 3 impulse response as a function ofscattering angle θ calculated using the Debye series.
F36 APPLIED OPTICS / Vol. 50, No. 28 / 1 October 2011
calculated using the Debye series. The zone of max-imum intensity occurring at θ ≈ 125° and τ ≈ 235 fscorresponds to the secondary rainbow. Many of thefeatures of Fig. 14 can be explained by reference toray-tracing calculations: In this case, b ¼ 0 corre-sponds to a ray that passes through the center ofthe sphere and then suffers two internal reflectionsand is scattered at θ ¼ 0° (forward scattering) witha delay τ ¼ 266:5 fs. As b increases, the value of θincreases until it reaches its maximum value at thegeometric secondary rainbow angle θr2 ¼ 129:2°when b ¼ 0:9503. Further increases in b cause θ todecrease until θ ¼ 111:8° when b ¼ 1. The effects ofp ¼ 3 surface waves are indicated by the dashed linesstarting from θ ¼ 111:8° and τ ¼ 242:8 fs.
Returning to Fig. 4, an unexplained p ¼ 3 pulsewas noted at τ ≈ 220 fs. This is marked in Fig. 14by the þ symbol, which coincides with the diagonal“finger” of intensity associated with the secondaryrainbow at θ ≈ 125° and τ ≈ 235 fs. As rainbowscorrespond to the transition between two rays andzero rays, geometrical optics predicts an abrupt tran-sition to zero intensity in the “unlit” area at θr2. Thisunrealistic transition is softened by the Debye seriescalculations (and by Airy theory), which show de-creasing intensity in the zone with no geometric rays.The p ¼ 3 pulse at θ ¼ 150° and τ ≈ 220 fs is theresult of a “complex ray” [3], which occurs in the zero-ray region as defined by geometrical optics. Complexrays appear on all rainbows—as can be seen byexamination of Fig. 10.
5. Conclusions
Analysis of scattering in the time domain reveals awealth of information about scattering processesthat is simply not available when the scatteringparticle is illuminated by a continuous-wave lightsource. The time domain results reported in thispaper for spherical droplets are based on calculationsusing Mie theory, the Debye series and ray tracing—with excellent agreement among all three methods.Geometrical optics is frequently considered to beinadequate for scattering from small particles, butthis paper’s results for scattering of red light by awater droplet of radius r ¼ 10 μm (correspondingto size parameter x ¼ 2πr=λ ≈ 96) are surprisinglyaccurate.
While ray tracing is obviously an approximation, itcan be used to identify the propagation paths takenby geometrical rays, as well as to confirm the scatter-ing contributions due to surface waves—such as thep ¼ 2 surface waves that cause the atmosphericglory. Similarly, the ray-tracing results show thatthe supernumerary arcs of rainbows are due to inter-ference between pairs of geometric rays that emergefrom the scattering particle at a given scatteringangle θ.
On the other hand, the time domain results forp ¼ 0 show that the diffraction process (which causesthe corona) is marked by a characteristic invertedv-shape pattern when the impulse response is
displayed as a function of θ, suggesting that the dif-fraction can be considered as a two-ray interferencepattern.
More generally, the time domain results reveal theintricate details of the various scattering mechan-isms, some of which are essentially undetectableexcept in the time domain. These results can be usedto provide greater understanding of light scatteringby spherical particles, such as droplets of water.
The author would like to thank the two anony-mous reviewers for their helpful and constructivesuggestions.
References1. P. Debye, “Das elektromagnetische Feld um einen Zylinder
und die Theorie des Regenbogens,” Phys. Z. 9, 775–778(1908).
2. B. Van der Pol and H. Bremmer, “The diffraction of electro-magnetic waves from an electrical point source round afinitely conducting sphere, with applications to radiotelegra-phy and the theory of the rainbow,” Philos. Mag. 24, 825–864(1937).
3. E. A. Hovenac and J. A. Lock, “Assessing the contributionsof surface waves and complex rays to far-field Mie scatteringby use of the Debye series,” J. Opt. Soc. Am. A 9, 781–795(1992).
4. E. E. M. Khaled, D. Q. Chowdhury, S. C. Hill, and P. W. Barber,“Internal and scattered time-dependent intensity of a dielec-tric sphere illuminated with a pulsed Gaussian beam,” J. Opt.Soc. Am. A 11, 2065–2071 (1994).
5. K. S. Schifrin and I. G. Zolotov, “Quasi-stationary scattering ofelectromagnetic pulses by spherical particles,” Appl. Opt. 33,7798–7804 (1994).
6. L. Méès, G. Gouesbet, and G. Gréhan, “Scattering of laserpulses (plane wave and focused Gaussian beam) by spheres,”Appl. Opt. 40, 2546–2550 (2001).
7. L. Méès, G. Gréhan, and G. Gouesbet, “Time-resolved scatter-ing diagrams for a sphere illuminated by plane wave andfocused short pulses,” Opt. Commun. 194, 59–65 (2001).
8. Y. P. Han, L. Méès, K. F. Ren, G. Gréhan, Z. S. Wu, and G.Gouesbet, “Far scattered field from a spheroid under a femto-second pulsed illumination in a generalized Lorenz-Mietheory framework,” Opt. Commun. 231, 71–77 (2004).
9. H. Bech and A. Leder, “Particle sizing by ultrashort laserpulses—numerical simulation,” Optik 115, 205–217 (2004).
10. H. Bech and A. Leder, “Particle sizing by time-resolved Miecalculations—A numerical study,” Optik 117, 40–47 (2006).
11. C. Calba, C. Rozé, T. Girasole, and L. Méès, “Monte Carlosimulation of the interaction between an ultra-short pulseand a strongly scattering medium: The case of large particles,”Opt. Commun. 265, 373–382 (2006).
12. S. Bakić, C. Heinisch, N. Damaschke, T. Tschudi, and C.Tropea, “Time integrated detection of femtosecond laserpulses scattered by small droplets,” Appl. Opt. 47, 523–530(2008).
13. S. Bakić, F. Xu, N. Damaschke, and C. Tropea, “Feasibilityof extending rainbow refractometry to small particles usingfemtosecond laser pulses,” Part. Part. Syst. Charact. 26,34–40 (2009).
14. P. Laven, “Separating diffraction from scattering: the milliondollar challenge,” J. Nanophoton. 4, 041593 (2010).
15. J. A. Lock and P. Laven, “Mie scattering in the timedomain. Part 2. The role of diffraction,” J. Opt. Soc. Am. A28, 1096–1106 (2011).
16. J. B. Keller, “A geometrical theory of diffraction,” inCalculus ofVariations and Its Applications, L. M. Graves, ed., Proceedings
1 October 2011 / Vol. 50, No. 28 / APPLIED OPTICS F37

of Symposia in Applied Mathematics (McGraw-Hill, 1958),Vol. 3, pp. 27–52.
17. J. B. Keller, “Geometrical theory of diffraction,” J. Opt. Soc.Am. 52, 116–130 (1962).
18. J. A. Lock and P. Laven, “Mie scattering in the time domain.Part I. The role of surface waves,” J. Opt. Soc. Am. A 28,1086–1095 (2011).
19. H. M. Nussenzveig, “High-frequency scattering by a transpar-ent sphere. I. Direct reflection and transmission,” J. Math.Phys. 10, 82–124 (1969).
20. P. Laven, “How are glories formed?” Appl. Opt. 44,5675–5683 (2005).
21. P. Laven, “Effects of refractive index on glories,” Appl. Opt. 47,H133–H142 (2008).
F38 APPLIED OPTICS / Vol. 50, No. 28 / 1 October 2011


![Analysis of time-domain scattering by periodic structureslipeijun/paper/2016/GL_JDE... · 2016. 4. 4. · The analysis can be found in [14,28] for the time-domain acoustic and electromagnetic](https://img.pdfslide.us/doc/110x75/6145ba8d07bb162e665fdf7d/analysis-of-time-domain-scattering-by-periodic-structures-lipeijunpaper2016gljde.jpg)