Embed Size (px)
Citation preview

Time Discounting and Economic Decision-making
among the Elderly
David Huffman, Raimond Maurer, and Olivia S. Mitchell
July 2016
PRC WP2016
Pension Research Council Working Paper
Pension Research Council
The Wharton School, University of Pennsylvania
3620 Locust Walk, 3000 SH-DH
Philadelphia, PA 19104-6302
Tel.: 215.898.7620 Fax: 215.573.3418
Email: [email protected]
http://www.pensionresearchcouncil.org
The research reported herein was performed pursuant to a grant from the U.S. Social Security
Administration (SSA) funded as part of the Michigan Retirement Research Center. The authors also
acknowledge support from the Pension Research Council/Boettner Center at the Wharton School of the
University of Pennsylvania. They have also benefited from expert programming assistance of Yong Yu.
Mitchell is a Trustee of the Wells Fargo Advantage Funds and has received research support from TIAA.
The opinions and conclusions expressed herein are solely those of the authors and do not represent the
opinions or policy of SSA, any agency of the Federal Government, or any other institution with which the
authors are affiliated. © 2016 Huffman, Maurer, and Mitchell. All rights reserved.

Time Discounting and Economic Decision-making
among the Elderly
Abstract
This research project evaluates the extent of heterogeneity in time discounting among elderly
Americans, as well as its role in explaining older peoples’ key behaviors. We first show how older
Americans evaluate simple (hypothetical) intertemporal choices in which payments now are
compared with payments in the future. This adds to the literature on time horizon experiments by
focusing on a nationally representative sample of persons age 70+. Using the indicators derived
from this experiment, we show how differences in discounting patterns are associated with
characteristics of particular importance in elderly populations, such as serious health and mental
conditions. We then relate our discounting measure to key outcome variables including wealth, the
timing of retirement, investments in health, and decisions about end of life care.
Keywords: impatience; time preference; self-control; retirement; health; insurance
JEL classifications: D01, D03, D12, D14, D90, E21, G11, I12, I13, J26
David Huffman
Dept of Economics, University of Pittsburgh
4901 Wesley Posvar Hall, 230 South Bouquet Street
Pittsburgh PA 15260
Raimond Maurer
Finance Department, Goethe University
Theodor-W.-Adorno Platz 3
60323 Frankfurt am Main, Germany
Olivia S. Mitchell
The Wharton School of the University of Pennsylvania
Dept of Business Economics & Policy
3620 Locust Walk, St 3000 Steinberg Hall-Dietrich Hall
Philadelphia, PA 19104

1
Time Discounting and Economic Decision-making
among the Elderly
Many economic and psychological studies have sought to explore how people make inter-
temporal decisions, but most previous research on impatience and its impact on economic and
other outcomes has focused mainly on younger individuals (c.f., Burks et al. 2009; Chabris et al.
2008; Schreiber and Weber 2015; Sutter et al. 2013). Yet understanding how older individuals
make decisions with intertemporal dimensions is of importance, inasmuch this is when many
people make critically consequential financial decisions that affect the remainder of their lives.
Examples include how much to save and spend, when to work versus claim Social Security benefits,
whether and how much to invest in health and health insurance, whether to sell one’s home and
move, and many other factors central to retirement well-being.
There is also little known about the extent of heterogeneity in discount rates amount the
elderly, and how such diversity might relate to personal characteristics. If time discounting varies
systematically with demographic or cultural characteristics, this could have important implications
for how economic outcomes vary for the elderly within society. Moreover, discounting could
potentially change in old age, something that can only be studied in with data on elderly individuals.
Aging involves reduced life expectancy, and lower probability of survival could potentially affect
discounting of the future. Empirical evidence on whether and how life expectancy affects
discounting, however, is scarce.1 Some aspects of cognitive functioning also become increasingly
difficult at older ages, in the form of dementia, but little is known about how this might affect
1 One exception is Oster et al. (2013), who show that individuals who are diagnosed with Huntington’s disease at an
early age make decisions consistent with greater discounting of the future.

2
intertemporal decision-making. For all of these reasons, it is of interest to delve into questions
about the determinants of time discounting among the older population.
In this paper we present and analyze time discounting metrics measured in a representative
sample of individuals age 70+. To this end, we use a purpose-built survey module we devised for
the 2014 Health and Retirement Study (HRS) to examine the levels of and heterogeneity in time
discounting among the elderly, and we study how this heterogeneity varies with personal
characteristics. Moreover, we leverage the rich information about retirement, wealth accumulation,
and health behaviors reported in the HRS to evaluate how and whether such heterogeneity helps
explain differences in important economic behaviors across older individuals.
To preview results on heterogeneity and determinants, we show that the mean (median)
value of the implied Internal Rate of Return (IRR) used by our older population to discount future
payments is 0.54 (0.58), with a standard deviation of 0.35.2 Our IRR measures rise with age: thus
a 15-year increase in age from 70 to 85 would be associated with about a standard deviation higher
IRR. This result is robust to a variety of controls. We also show that Whites and the better-educated
have lower IRRs. Serious health conditions, which imply reduced life expectancy, are associated
with 11-30 percent higher IRRs. Cognition scores are not statistically associated with our
impatience measures, controlling for education. An indicator for dementia, however, is associated
with significantly higher IRRs.
When we relate our impatience measures to outcomes of interest using multiple regression
models, several interesting results emerge. Net wealth is significantly lower for the least patient,
probably indicating that the least patient save less and therefore arrive at old age with fewer assets.
We also find that the impatient are much less likely to engage in healthy behaviors and to have
2 The IRR is the interest rate which sets equal the net present value of the future money amount and the money
amount offered today.

3
made provision for end of life challenges. And finally, our analysis shows that Social Security
claiming ages are not significantly related to the IRRs. We check robustness of the results to using
an Impatience Index, which combines the IRR measure with a more subjective measure of
impatience, and reach similar conclusions.
The next section offers a brief literature review. Next we outline our methodology, and the
subsequent section provides descriptive statistics regarding the mean and dispersion of discounting
among the elderly. In a final analytic section we review the association between several economic
and health outcomes, and the measured discount rates we derive. A final section concludes.
Background
Economic theory holds that time discounting plays a crucial role in decision-making about
inter-temporal tradeoffs. Thus over the life cycle, people must decide to consume less than their
incomes when young and save and accumulate retirement assets, which they can then draw down
to support old-age consumption. Nevertheless, everyone is not homogeneous. That is, those who
discount the future more will place a higher value on current versus future consumption, which in
turn will prompt them to save less and possibly run out of money in old age. Similarly, someone
who discounts the future very heavily might claim Social Security benefits earlier, thus committing
himself to lower old-age payments the rest of his life. And people who downweight the future can
also make decisions about their own health, insurance, and other financial products, that may
expose them to greater risks in old age.
Accordingly, we seek to determine the extent of time discounting among the elderly.
Additionally we investigate whether such preferences can help explain heterogeneity in a wide
range of decisions, including how long to work, whether to invest in one’s own health, whether to

4
purchase long-term care or life insurance, and what provisions to make regarding the end of one’s
life. Extreme levels of impatience may also be an indicator of self-control problems, in the sense
of present-biased preferences (Rabin, 2002), so these might help predict preference reversals, for
example individuals stopping work earlier than they had previously planned.
The present research therefore provides evidence on time discounting patterns among
Americans age 70+. With our survey, we also examine the cross-sectional association between
time discounting and respondent characteristics, to explore population heterogeneity in impatience.
To the extent that time individuals’ attitudes toward time discounting are quite persistent over time,
the measures of discounting that we elicit among older respondents may also be useful for
explaining decisions made earlier in life. These include, for example, saving decisions resulting in
more or less wealth in retirement.3
Methods
We have designed and implemented a survey module in the 2014 HRS to elicit time
discounting among older adults. Specifically, we gave respondents over the age of 70 who were
randomly selected to respond to this module a list of money choices where they considered
receiving different payments at different points in time. The decision in the inter-temporal choice
exercise was between “$100 today" and some larger amount $Y that would be received 12 months
in the future (see Online Appendix A for the precise wording of the module).
Everyone taking the survey module first received a choice between a hypothetical payment
of $100 today versus a delayed payment of $154 twelve months from today. If the respondent
responded that he preferred the later payment, he was shown a smaller delayed amount. If, however,
3 Meier and Sprenger (2015) report stability in peoples’ attitudes toward time discounting over a time span of two
years, but Dohmen et al. (2010) report some fluidity over the life cycle.

5
the respondent favored the early payment, he was shown a larger delayed amount. Several such
choices were provided until each respondent had indicated the value of Y (or equivalently, the
implied annual rate of return) to which he was indifferent, when comparing receiving $100 now
versus waiting 12 months. In this way, we obtained an indicator of each respondent’s implied
internal rate of return.4
Our values in the choice exercise were chosen to match the magnitudes of rewards used in
typical intertemporal choice experiments which are the gold standard for measuring time
discounting.5 Falk et al. (2014) showed that the survey measure we use is a strong and significant
predictor of time discounting in such choice experiments.6 Furthermore, Falk et al. (2015) found
that the survey discounting measure they used predicted important outcomes such as savings and
human capital accumulation in young population samples around the world. That evidence
provides confidence that our survey measure does capture a trait that determines behavior under
real stakes, despite the hypothetical payments and particular parameter values.7
Our HRS survey module also asked each respondent questions about his self-reported
Future Oriented Score. This survey measure was also found by Falk et al. (2015) to correlate with
behavior in incentivized intertemporal choice experiments, and add explanatory power when
combined with the choice exercise into a single impatience index. Accordingly, we check
robustness of results to using such an impatience index. The survey also included a question aimed
4 See Online Appendix B for detail on the computation method. 5 See Harrison et al. (2002) for a seminal paper on using choice experiments to measure individual discount rates in a
representative sample. The experiments measure time discounting under a set of assumptions. One key assumption
required for the experiments to provide an index of impatience is that individuals treat the monetary rewards like
consumption opportunities. 6 Falk et al. (2014) had subjects participate in incentivized intertemporal choice experiments and also answer a battery
of different survey questions about time discounting. The survey measure we use is based on one of the best predictors
of choices in those incentivized experiments (a measure that is part of the Falk et al. Preference Survey Module). 7 While the magnitudes of monetary payments used in the measure are small relative to typical lifetime income, it is
well documented that individuals exhibit considerable heterogeneity in their preferences about timing of such rewards,
and this heterogeneity is correlated with large-stakes intertemporal choices (Falk et al. 2015).

6
specifically at capturing present-bias and dynamically inconsistent preferences, which asked about
postponing. The latter measure provides a Procrastinator Score for each respondent.8
To the database of survey module responses, we appended information on several
important socio-economic and demographic variables from the HRS Core dataset.9 These included
age, sex, race/ethnicity, education, marital status, religion, and an indicator of whether the
respondent was relatively optimistic about his subjective life expectancy (compared to the relevant
actuarial age/sex life table). The respondent’s cognitive score was also included as a control,
following Dohmen et al. (2010, 2012) who found a positive correlation between impatience and
cognition for a younger population. In addition we control for variables indicating that the
respondent had been told by a doctor that he had cancer, lung disease, a heart condition, a stroke,
or had been diagnosed with Alzheimers or dementia. In some models we also control on (ln)
household income.10
In what follows, we first offer some descriptive statistics on the time discounting measures
derived using the answers our older respondents provided to the HRS module questions. Next, we
link the IRR measures to key outcome variables of interest in the HRS. For instance, we evaluate
whether people who were more impatient by our measure ended up with less wealth in retirement,
8 The Future Oriented Score is measured by the respondent’s answer to the following question: How do you see
yourself: are you a person who is generally willing to give up something today in order to benefit from that in the
future, or are you not willing to do so? Please use a scale from 0 to 10, where 0 means you are “completely unwilling
to give up something today" and a 10 means you are “very willing to give up something today". Use the values in-
between to indicate where you fall on the scale. The Procrastinator Score is measured by the respondent’s answer to
this question: How well does the following statement describe you as a person? I tend to postpone things even though
it would be better to get them done right away. Use a scale from 0 to 10, where 0 means “does not describe me at all"
and a 10 means “describes me perfectly". Use the values in-between to indicate where you fall on the scale. 9 Most variables were taken from the RAND HRS datafile, though in a few cases we used the 2014 HRS wave which
had not yet been integrated into the RAND file. 10 Means of all variables appear in Appendix A, and more information on variable construction appears in the Online
Appendices.

7
invested less in their own health via various preventive health behaviors, and were less likely to
defer retirement.
Time Discounting Among the Elderly: Results
Figure 1 reports the distribution of measured discount rates, or internal rates of return (IRR),
derived from the respondents’ answers to the questions described above. The mean (median) value
of the IRR for our older population is 0.54 (0.58), with a minimum of 0.03, a maximum of 0.93,
and a standard deviation of 0.35.11
Previous studies have used samples that include younger individuals, and have typically
found average discount rates that are somewhat lower that we observe for the elderly. For example,
using a similar methodology to ours, involving choices between early and delayed monetary
payments, Goda et al. (2015) found an average discount rate of 0.29 for the Rand American Life
Panel and the Understanding America Study, both datasets that are intended to be representative
of US adults. Harrison et al. (2002) find an average discount rate of 0.28 in a representative sample
of the Danish adult population, and Dohmen et al. (2012) reported an average discount rate in the
range of 0.28 to 0.30 for a representative sample of German adults. Warner and Pleeter (2001)
used a different methodology, involving much larger financial stakes than the typical experimental
study: They estimated discount rates from the choices of members of the US army, between
alternative pension schemes. They found a discount rate in the range of 0.10 to 0.19 for officers,
and 0.33 to 0.50 for enlisted soldiers, more or less in line with the previously mentioned
experimental studies. Previous studies have also found indications that IRRs increase over the life
cycle (see Dohmen et al., 2012), helping reconcile the higher discount rates that we observe among
11 These are computed as described in Online Appendix B. In the paper we report all IRR values compounded semi-
annually, since results are not particularly sensitive to different compounding periodicities.

8
the elderly. An interesting open question is what might cause changing discount rates over the life
cycle, something we turn to in later analysis.
Notably, essentially all previous studies that estimate individual discount rates using
experiments or intertemporal choices in other settings have reported estimated discount rates that
were substantially higher than market interest rates. Such results contrast with the prediction of
many economic models that people save only to earn interest, and market interest rates adjust
towards rates of time preference. While the subject remains an area of debate, there are some
reasonable explanations for the discrepancy. One could be a systematic tendency to overestimate
time preference rates, although it is hard to explain the similarity of results across different
methodologies. Another is that the motives behind purchases of financial assets, and the
mechanisms determining interest rates, are not fully understood, particularly when time
preferences are heterogeneous and correlated with other preferences and characteristics.
Figure 1 here
In Table 1 we report linear regressions of time discounting on personal characteristics. IRR
is used in the first three columns, where we see a positive and statistically significant effect of age,
on the order of about 1 point. Compared to the IRR mean of 54 points, this is about a two
percentage point effect. While it is not enormous, it is economically meaningful, and it suggests
that rates of impatience rise with age. Interpreted literally, a 15-year increase in age (say from 70
to 85) would raise the IRR by about a standard deviation. The magnitude is also quite robust to the
inclusion of other controls including sex, race/ethnicity, education, religion, optimism about
longevity, health indicators, and income.
Table 1 here

9
Results also show that Whites have systematically lower IRRs than nonwhites, by about 9
points (11 percent); there is no statistically significant differential effect for Hispanics, ceteris
paribus. The more educated also have lower rates of impatience, such that one additional year of
education is associated with a lower IRR of about one point (2 percentage points) – or roughly the
same as a year of age. Interestingly, scoring higher on the cognitive ability12 measure had no
impact on measured IRRs, controlling for education.13 Including household income does not
change results, in contrast to Carvalho et al. (2016) who focus on the poor and conclude that those
who are cash-constrained are more present-biased.
Adding controls for self-reported health problems, some of them severe enough to imply
reduced life expectancy, boosts the explained variance (R-squared) by about half, and these
additional variables prove to be statistically significant as well. For instance those who had been
told they had cancer or a heart condition had 6-8 points higher IRRs, or 11-15 percent higher.
Economic theory predicts that reduced life expectancy should increase discounting of the future,
but empirical evidence has been scarce. One exception is Oster et al. (2013), who study individuals
diagnosed with Huntington’s disease at an early age; learning about the disease is associated with
changes in behavior such as choosing to retire earlier, which could reflect greater discounting of
the future. Our sample of the elderly provides another opportunity to shed light on this question,
but with direct measures of time discounting, and provides converging evidence with Oster et al.
(2013).
We also find that IRRs are higher for individuals diagnosed with a mental condition
(dementia or Alzheimers): IRRs are 19 points (35 percent) higher than average. The mechanism
12 The measurement of cognition in the HRS is detailed in Fisher et al. (2015). 13 A number of other studies have studied how cognitive ability affects impatience including Benjamin et al. (2013)
and Dohmen et al. (2010), though not for the older population as here.

10
could potentially be reduced life expectancy, or it could reflect a systematic impact of dementia
on decision-making. If dementia leads to more impatient choices, this has important implications
for the outcomes of the elderly who are affected by this condition.
The second three columns of Table 1 use the Impatience Index as the dependent variable,
which is the normalized sum the IRR and the negative of the self-reported Future Oriented Score.
The results are broadly similar to those based on using the IRR measure alone, in that ethnicity,
education, mental acuity, and health conditions are all related to impatience in the same directions.
There are some differences, for example in that cognitive ability is significantly related to the
Impatience Index, while mental shortfall is not, the opposite of the findings for IRR. Also, having
a heart condition is not significantly related to the Impatience Index.
Associations between Time Discounting and Key Economic Behaviors
Tables 2 through 5 show how our IRR and Impatience Index measures are associated with
key outcomes of interest. These include respondents’ net wealth, a Healthy Behaviors Index,14
how well prepared people are for end of life contingencies, and retirement behaviors. For each
outcome, we first regress it on the IRR (or the Impatience Index), and then we add the socio-
demographic controls used above (age, sex, race/ethnicity, years of education, marital status,
cognition score, religion, procrastinator score, and health controls). A final model in each case also
included (ln) household income to evaluate whether the impatience variables are sensitive to its
inclusion.
Tables 2-5 here
14 This is measured as the number of precautionary health practices undertaken by the respondent such as getting a flu
shot, not smoking, not drinking to excess, and having the relevant gender-appropriate annual exams (e.g., prostate
exams, Pap and mammograms).

11
Net Wealth. The first four columns of Table 2 show that, whether we hold other factors constant
or not, there is a strong, statistically significant, and powerful relationship between respondents’
impatience measures and their net wealth (the latter is measured in thousands). Specifically, those
with higher IRRs have lower wealth, and the coefficient magnitudes are large across all four
columns. Focusing on the columns including controls, an IRR coefficient of around -375 suggests
that someone with an IRR one standard deviation above the mean would have 29 percent less
wealth than his counterpart at the mean (=0.35*375/442). Goda et al. (2013) found a large and
significant correlation between time discounting and retirement wealth, for younger age groups.
Our results show that discount rates measured in old age might also be relevant for explaining
variation in retirement wealth.
Smaller but significant negative coefficients are found for the Procrastinator score, while
most health effects are not statistically significant. Interestingly, the education effect is positive
and significant when household income is excluded. The White coefficient is also positive and
consistently significant, suggesting that this group has more net wealth in older years even after
conditioning on other controls. Moreover, estimated magnitudes are comparable to the IRR effect:
that is, being White versus nonwhite is associated with having 32-48 percent more net wealth
($145-210/ 442). Overall, the models account for between 16-20 percent of variation in the IRR
variable.
On the right hand side of Table 2 we run similar regressions, but this time focus on the
Impatience Index. The findings are very similar to those using the IRR. Individuals who are more
impatience according to the index have significantly lower wealth.

12
Health. We next turn to an examination of how the Healthy Behaviors Index varies according to
the IRR and other factors. The first three columns of Table 3 include the IRR as the key variable
of interest, and longer set of controls first excludes, and then includes, the (ln) of household income,
to investigate coefficient sensitivity. Results show that people having higher IRRs are less likely
to engage in healthy behaviors, and the effects are statistically significant. Quantitatively, they are
on the small side: for instance, an individual with a standard deviation higher IRR would have
about 0.1 or two percent more healthy behaviors than average (=0.27*0.35/3.3). Chabris et al.
(2008) document a relationship between IRRs and health behaviors for several samples of
individuals with different age ranges, all much younger than our sample. Sutter et al. (2010) show
similar results for high school age students. Our results show that IRRs also matter for health
behaviors towards the end of life. We find that age also has a positive and significant coefficient
in the regression explaining health behaviors, but the magnitude is again small. People with higher
cognition scores also have more healthy behaviors as measured by our Index.
The next three columns substitute the Impatience Index for the IRR. As shown in column
4, individuals who are more impatient according to the index have significantly lower scores on
the health index, similar to conclusions based on the IRR measure. The relationships are less
precisely estimated and lose statistical significance, however, after controls are added to the
regression in columns 5 and 6.
End of Life Provision. We are also interested in whether impatient people are also less likely to
put into place appropriate precautions around their end of life challenges. Understanding decisions
about end of life care is important, given the large component of end of life care to health care
costs in the United States (see De Nardi et al. 2010). We provide some first evidence on whether
variation in time discounting is relevant for such decisions, or whether they are mainly driven by

13
other factors. Our End of Life Index is a count of the number of affirmative responses each
respondent gave to questions about whether he had long-term care insurance, assigned a power of
attorney, a living will, and had discussed end of life medical care plans with others. The mean
(median) value of this index is 1.7 (2), with a standard deviation of 1.3.
Table 4 shows the results from our descriptive regressions. Our sample size is somewhat
attenuated since almost six percent of the sample did not respond to all the questions comprising
the End of Life Index. The first column confirms a negative and statistically significant
relationship of the IRR with the index, so it impatience is inversely related to taking health
precautions around the end of life. Nevertheless the coefficient is attenuated and significance falls
with the inclusion of other controls. Other significant relationships include the positive and
significant effect of age, where 15 additional years of age would be associated with half a point
increase in the End of Life score, or an improvement of 27% (from the mean of 1.7). Whites also
score about 0.5-0.6 points higher than nonwhites (36 percent), while Hispanics score 0.7 points
(42 percent) lower than non-Hispanics, and both effects are strongly significant. The only other
factor which is notably negative associated with making End of Life provisions is being married,
such that married individuals score 0.3 points (or 17 percent) below their single counterparts.
The next three columns substitute the Impatience Index for the IRR. In this case, the
relationship between impatience and the end of life index remains statistically significant even
with all controls in the regression. Overall, the findings indicate that variation in time discounting
in old age is related to decisions about end of life care
Retirement Behavior. Next we turn to an examination of how retirement patterns vary across
more, versus less, patient HRS respondents. Two outcomes are of interest in Table 5: Panel A
investigates the age at which people initiated their Social Security benefits, or what is often termed

14
the Social Security claiming age, while Panel B focuses on the difference between peoples’ actual
Social Security claiming age and their expected claiming age.15 As before, the first of four models
in each case includes only the impatience factor, and then we add additional controls culminating
with the inclusion of (ln) household income. The goal once again is to evaluate the robustness of
the results across models.
The analysis in Panel A suggests that only age and education are positively and
significantly associated with the respondent’ Social Security claiming age. Of the medical
conditions, only having had a stroke is linked to lower claiming ages. The IRR measure, and the
Impatience Index, are both associated with earlier claiming ages, as would be expected if more
impatient people place less weight on earning money for future, post-retirement consumption, but
these relationships are not statistically significant.
Results in Panel B show that the IRR and Impatience Index are negatively associated with
the difference between actual and expected claiming ages. Though the coefficients are not
statistically significant in our sample, the most impatient people claimed earlier than expected,
which is consistent with the preference reversal behavior of Rabin (2002), mentioned above.
Beyond age, little else is associated with this difference other than being Jewish (negative and
significant) and having been diagnosed with mental problems (also negative and significant).
Our findings regarding retirement outcomes contrast to some extent with evidence from
Schreiber and Weber (2016). They conducted an online survey with roughly 3,000 German
newspaper readers, and find that a measure of present bias is associated with earlier retirement
ages, and a greater discrepancy between planned and actual retirement age, in the direction of
retiring earlier than expected. One possible explanation for the difference is that they used a
15 The respondent’s expected claiming age is taken from the earliest reported HRS wave. Both analyses include only
the subset of HRS respondents with nonmissing and nonzero actual and expected claiming ages.

15
measure of present bias that has a different format from ours. Another possible explanation is that
they used self-reported retirement age, such that respondents offered their own subjective
definition of what it means to be retired. Our approach uses a more objective, although not
necessarily better, approach to measuring retirement, namely social security claiming age.
Conclusions and Policy Implications
Recent policy discussions have focused on what interventions might be designed to address
low savings rates (Ashraf et al. 2006), over-consumption of harmful goods such as smoking and
drinking (Camerer et al. 2003), avoid poverty (Carvalho et al. 2016), increase financial literacy
(Lusardi and Mitchell 2007), and avoid making financial mistakes over the life cycle (Agarwal et
al. 2009). Likewise there is substantial interest in finding ways to encourage people to delay
retirement and thereby enjoy greater Social Security benefits in old age (Alleva 2016; Maurer et
al. 2014). Yet few studies have focused on older adults, impatience, and interesting wealth, health,
and retirement behaviors. Accordingly, we fill this gap by exploring the extent of and factors
associated with impatience in the older population.
Using a purpose-built module in the HRS, we use experimental elicitations of time
preferences for money to show that the mean (median) value of the IRR for our older population
is 0.54 (0.58), with a standard deviation of 0.35. These values are reasonable and confirm to an
all-age survey conducted in Germany. Our IRR measures rise with age: thus a 15-year increase in
age from 70 to 85 would be associated with about a standard deviation higher IRR. This result is
robust to a variety of controls. We also show that Whites and the better educated have lower IRRs,
while those with health conditions have 11-30 percent higher IRRs. Cognition scores are not
statistically associated with our impatience measures.

16
When we relate our impatience measures to outcomes of interest using multiple regression
models, several interesting results emerge. Net wealth is significantly lower for the least patient,
probably indicating that the least patient save less and therefore arrive at old age with fewer assets.
We also find that the impatient are much less likely to engage in healthy behaviors and to have
made provision for end of life challenges. And finally, our analysis shows that Social Security
claiming ages are not significantly related to the IRRs, though impatience is associated with people
claiming benefits earlier than anticipated.
Our findings add to the literature on discounting behavior as well as to the understanding
of older persons’ decision processes. They also have implications for policy. For instance, the
existence of widespread impatience among older Americans suggests that people may be willing
to take less than actuarially fair incentives in exchange for working longer, particularly if they
have access to lump sums. Increasing immediate rewards to other behaviors could also encourage
choices such as investing in one’s health and making end of life decisions in advance of need.
Future work can work can pursue some intriguing questions raised by our findings, about
the determinants of time discounting. Once concerns the explanation for an age effect on IRRs.
Since almost all data sets measuring IRRs are cross sectional, it has not been possible to
disentangle cohort effects from effects of the aging process. Finding that IRRs vary with age in
the relatively narrow age band of our sample casts some doubt on the cohort explanation, although
the evidence is clearly not definitive. If it is the process of aging that affects IRRs, what is the
specific mechanism? One possible mechanism is reduced survival probability, in line with the
finding that diagnosis of serious health conditions is also associated with higher IRRs. The
relationship between mental shortfall and IRRs also hints at a possible, unanticipated consequences

17
of Alzheimers and related conditions, in terms of systematic changes in decision-making,
something that calls for further study.

18
References
Agarwal, S., J.C. Driscoll, X. Gabaix, and D. Laibson. (2009). “The Age of Reason: Financial
Decisions over the Life Cycle and Implications for Regulation.” Brookings Papers on
Economic Activity. (2): 51–101.
Alleva, B. (2016). “Discount Rate Specification and the Social Security Claiming Decision.”
Social Security Bulletin, 76(2): 1-15.
Ashraf, N., D. Karlan, and W. Yin (2006). “Tying Odysseus to the Mast: Evidence from a
Commitment Savings Product in the Philippines.” Quarterly Journal of Economics.
121(2): 635-672.
Benjamin, Daniel J., Sebastian A. Brown, and Jesse M. Shapiro. 2013. “Who is ‘Behavioral?’
Cognitive Ability and Anomalous Preferences.” Journal of the European Economic
Association, 11 (6): 1231–55
Burks, S. V., J. P. Carpenter, L. Goette, and A. Rustichini. (2009). “Cognitive Skills Affect
Economic Preferences, Strategic Behavior, and Job Attachment.” PNAS 106 (19): 7745–
50.
Carvalho, L.S., S. Meier, and S.W. Wang. (2016). “Poverty and Economic Decision-Making:
Eviecne from Changes in Financial Resources at Payday.” American Economic Review
106(2): 260-294.
Chabris, C. F., Laibson, D., Morris, C. L., Schuldt, J. P., and Taubinsky, D. 2008. “Individual
Laboratory-measured Discount Rates Predict Field Behavior.” Journal of Risk and
Uncertainty. 37(2-3): 237 – 269.
De Nardi, M., E. French, und J.B. Jones. 2010. “Why do the Elderly Save? The Role of Medical
Expenses.” Journal of Political Economy. 118(1): 39 – 75.
Dohmen, T., A. Falk, D. Huffman, and U. Sunde. 2012. “Interpreting Time Horizon Effects in
Inter-Temporal Choice,” IZA DP No. 6385.
Dohmen, T., A. Falk, D. Huffman, and U. Sunde. 2010. “Are Risk Aversion and Impatience
Related to Cognitive Ability?” American Economic Review. 100(3): 1238 – 1260.
Falk, A., A. Becker, T. Dohmen, D. Huffman and U. Sunde. (2014). “An Experimentally-
Validated Survey Module of Economic Preferences.” University of Oxford Working Paper.
Falk, A., Becker, A., Dohmen, T. J., Enke, B., Huffman, D., & Sunde, U. (2015). “The Nature and
Predictive Power of Preferences: Global Evidence.” (No. 11006). CEPR Discussion Papers.
Goda, G. S., Levy, M., Manchester, C. F., Sojourner, A., and Tasoff, J. (2015). “The Role of Time
Preferences and Exponential-Growth Bias in Retirement Savings.” NBER WP 21482.
Harrison, G. W., Lau, M. I., & Williams, M. B. (2002). “Estimating Individual Discount Rates in
Denmark: A Field Experiment.” American Economic Review, 92(5), 1606-1617.
Lusardi, A. and O.S. Mitchell. (2007). “Baby Boomer Retirement Security: The Roles of Planning,
Financial Literacy, and Housing Wealth.” Journal of Monetary Economics. 54(1), 205-224.
Maurer, R., O.S. Mitchell, T. Schimetschek, and R. Rogalla. 2014. “Will They Take the Money
and Work? An Empirical Analysis of People’s Willingness to Delay Claiming Social
Security Benefits for a Lump Sum.” NBER Working Paper No. 20614.
Meier, Stephan and Charles Sprenger. 2015. “The Stability of Time Preferences.” Review of
Economics and Statistics. 97(2): 273–286.
O'Donoghue, T., and M. Rabin (1999). “Doing it Now or Later.” American Economic Review.
89(1): 103-124.
19
Oster, E., I. Shoulson, and E.R. Dorsey. (2013). “Optimal Expectations and Limited Medical
Testing: Evidence from Huntington Disease.” American Economic Review. 103(2): 804-
830.
Rabin, M. 2002. “A Perspective on Psychology and Economics.” European Economic Review.
46(4): 657 – 685.
Schreiber, P. and M. Weber. (2016). “The Influence of Time Preferences on Retirement Timing.”
University of Mannheim Discussion Paper.
Schreiber, P. and M. Weber. (2015). “Time Inconsistent Preferences and the Annuitization
Decision.” CEPR Discussion Paper No. DP10383. University of Mannheim.
Sutter, M. and M. G. Kocher. 2013. “Impatience and Uncertainty: Experimental Decisions Predict
Adolescents’ Field Behavior.” American Economic Review. 103(1): 510 – 531.
Warner, J. T., and S. Pleeter. (2001). “The Personal Discount Rate: Evidence from Military
Downsizing Programs.” American Economic Review, 91(1): 33-53.

20
Figure 1. Cumulative Distribution of Measured IRR Values for Older (70+) HRS
Respondents
Note: This figure reports the cumulative distribution function (cdf) of internal rates of return (IRR) for the N = 591
respondents of a survey module implemented in the 2014 HRS.

21
Table 1. Correlates of IRR and Impatience Index Scores among Older HRS Respondents
(OLS)
Note: ** Significant at 0.05 level, *** Significant at 0.01 level. All models include missing value dummies as
appropriate.
Age 0.005 * 0.006 ** 0.007 ** 0.019 * 0.022 ** 0.022 *
(0.003) (0.003) (0.003) (0.011) (0.011) (0.011)
Male -0.005 0.025 0.026 0.155 0.223 0.220
(0.031) (0.031) (0.031) (0.136) (0.139) (0.140)
White -0.094 ** -0.088 ** -0.091 ** -0.335 * -0.312 -0.307
(0.041) (0.040) (0.040) (0.189) (0.190) (0.190)
Hispanic 0.088 * 0.075 0.077 0.152 0.104 0.101
(0.048) (0.049) (0.048) (0.217) (0.227) (0.227)
Education years -0.011 * -0.010 * -0.011 * -0.057 ** -0.054 ** -0.053 **
(0.006) (0.006) (0.006) (0.024) (0.024) (0.025)
Married -0.014 -0.031 -0.032 -0.053 -0.089 -0.085
(0.030) (0.031) (0.032) (0.130) (0.131) (0.140)
Cognition score -0.004 -0.004 -0.004 -0.030 * -0.031 * -0.031 *
(0.004) (0.004) (0.004) (0.016) (0.016) (0.017)
Christian 0.024 0.048 0.054 0.033 0.129 0.119
(0.063) (0.062) (0.062) (0.286) (0.279) (0.282)
Jewish (0.021) (0.013) (0.007) 0.019 0.058 0.049
(0.107) (0.104) (0.104) (0.450) (0.451) (0.452)
Optimistic live to 85+ -0.013 -0.020 -0.019 -0.144 -0.154 -0.157
(0.029) (0.029) (0.029) (0.126) (0.126) (0.127)
Have any cancer (0.077) ** (0.078) ** (0.251) * (0.248) *
(0.032) (0.032) (0.144) (0.145)
Have lung disease (0.006) (0.006) (0.204) (0.206)
(0.044) (0.045) (0.167) (0.169)
Have heart condition (0.059) ** (0.059) ** (0.098) (0.097)
(0.029) (0.029) (0.130) (0.131)
Have stroke 0.030 0.028 0.178 0.180
(0.044) (0.044) (0.212) (0.213)
Mental shortfall 0.188 *** 0.188 *** 0.118 0.120
(0.064) (0.064) (0.454) (0.455)
Ln(HH income) 0.003 (0.007)
(0.014) (0.066)
Intercept 0.429 * 0.332 0.285 0.123 -0.153 -0.063
(0.244) (0.246) (0.286) (1.059) (1.061) (1.222)
N 591 591 591 575 575 575
R-squared 0.084 0.117 0.119 0.075 0.092 0.092
Mean of dep. Var. 0.541 -0.011
Std.dev. of dep. Var. 0.345 1.324
IRR Impatience Index

22
Table 2. Association of Financial Outcomes with IRR among Older HRS Respondents (OLS)
Note: ** Significant at 0.05 level, *** Significant at 0.01 level. All models include missing value dummies as
appropriate.
IRR -534.253 *** -373.473 *** -374.553 *** -379.232 ***
(93.616) (82.211) (84.991) (83.064)
Impatience index -101.944 *** -69.083 *** -71.109 *** -70.453 ***
(19.822) (18.565) (19.123) (18.405)
Age -4.543 -5.249 -3.367 -6.020 -6.479 -4.595
(5.217) (5.544) (5.466) (5.591) (5.929) (5.857)
Male 4.473 17.149 20.415 8.679 20.393 26.997
(74.169) (80.868) (77.941) (75.613) (82.182) (79.154)
White 201.062 *** 208.650 *** 145.593 *** 207.460 *** 209.679 *** 153.888 ***
(39.157) (41.616) (42.608) (42.566) (45.370) (47.310)
Hispanic -48.914 -62.118 36.996 -73.406 -80.509 14.440
(74.061) (78.544) (85.164) (78.752) (83.382) (88.971)
Education years 24.212 ** 23.729 ** 12.923 21.549 * 22.466 * 11.644
(11.304) (11.404) (11.621) (11.998) (12.382) (12.494)
Married 214.471 *** 214.323 *** 103.489 205.885 *** 208.492 *** 100.887
(73.966) (75.943) (74.783) (75.654) (77.160) (75.658)
Cognition score 17.759 *** 17.334 *** 12.688 ** 18.292 *** 17.507 *** 12.935 **
(6.624) (6.558) (6.306) (6.707) (6.712) (6.389)
Christian -33.980 -57.751 -34.915 -50.100 -71.424 -50.172
(216.124) (225.440) (213.825) (217.257) (227.437) (215.542)
Jewish 865.607 821.139 811.538 879.778 836.961 827.451
(675.733) (661.748) (653.156) (681.508) (667.058) (659.946)
Procrastinator score -17.127 * -15.751 * -14.392 * -18.649 * -17.064 * -15.447 *
(9.020) (9.015) (8.667) (9.567) (9.609) (9.263)
Optimistic live to 85+ 10.605 20.117 23.421 2.272 13.090 15.990
(64.979) (65.332) (63.509) (67.826) (68.085) (66.153)
Have any cancer -55.829 -63.720 -75.605 -79.271
(66.461) (65.394) (65.939) (64.675)
Have lung disease -146.141 * -94.842 -150.682 * -98.390
(81.844) (79.866) (83.452) (81.598)
Have heart condition 56.267 58.323 77.853 79.832
(75.584) (73.656) (78.238) (76.348)
Have stroke 77.152 61.938 44.959 38.974
(121.505) (120.456) (125.591) (125.723)
Mental shortfall -240.937 -306.946 * -260.737 -347.245 *
(204.395) (180.615) (216.603) (190.215)
Ln(HH income) 177.980 *** 173.491 ***
(50.826) (50.291)
Intercept 728.558 *** 143.321 223.881 -1446.786 ** 439.801 *** 107.282 157.032 -1482.735 *
(75.790) (517.649) (536.524) (734.990) (33.748) (541.803) (562.036) (756.960)
N 582 582 582 582 566 566 566 566
R-squared 0.051 0.158 0.167 0.214 0.035 0.146 0.156 0.200
Mean of dep. vars 442.356 441.480
Std.dev. of dep. vars 816.981 820.749
Net wealth ($1,000)

23
Table 3. Association of Health Index with IRR among Older HRS Respondents (OLS)
Note: ** Significant at 0.05 level, *** Significant at 0.01 level. All models include missing value dummies as
appropriate.
IRR -0.303 ** -0.273 ** -0.274 **
(0.127) (0.131) (0.131)
Impatience index -0.056 ** -0.039 -0.039
(0.028) (0.029) (0.029)
Age 0.039 *** 0.039 *** 0.038 *** 0.038 ***
(0.008) (0.008) (0.008) (0.008)
Male -0.249 ** -0.249 ** -0.262 *** -0.263 ***
(0.099) (0.100) (0.101) (0.101)
White 0.071 0.073 0.091 0.091
(0.121) (0.122) (0.124) (0.124)
Hispanic 0.008 0.007 0.016 0.015
(0.151) (0.151) (0.149) (0.149)
Education years 0.023 0.024 0.030 * 0.030 *
(0.017) (0.017) (0.017) (0.018)
Married 0.105 0.109 0.126 0.127
(0.092) (0.097) (0.094) (0.098)
Cognition score 0.020 * 0.021 * 0.019 0.019
(0.012) (0.012) (0.012) (0.012)
Christian 0.207 0.207 0.189 0.189
(0.209) (0.209) (0.212) (0.212)
Jewish 0.087 0.087 0.053 0.053
(0.313) (0.314) (0.307) (0.308)
Procrastinator score -0.011 -0.011 -0.008 -0.008
(0.013) (0.013) (0.013) (0.013)
Optimistic live to 85+ -0.115 -0.114 -0.126 -0.126
(0.087) (0.087) (0.089) (0.089)
Ln(HH income) -0.006 -0.001
(0.045) (0.046)
Intercept 3.453 *** -0.551 -0.499 3.287 *** -0.618 -0.608
(0.080) (0.760) (0.857) (0.043) (0.771) (0.864)
N 516 516 516 502 502 502
R-squared 0.011 0.102 0.102 0.007 0.098 0.098
Mean of dep. vars 3.291 3.287
Std.dev. of dep. vars 0.978 0.973
Health Index

24
Table 4. Association of End of Life Index with IRR among Older HRS Respondents (OLS)
Note: ** Significant at 0.05 level, *** Significant at 0.01 level. All models include missing value dummies as
appropriate.
IRR -0.599 *** -0.216 -0.199 -0.196
(0.164) (0.159) (0.162) (0.163)
Impatience index -0.150 *** -0.065 * -0.065 * -0.064 *
(0.036) (0.035) (0.035) (0.035)
Age 0.031 ** 0.027 ** 0.027 ** 0.031 ** 0.028 ** 0.028 **
(0.012) (0.012) (0.012) (0.012) (0.012) (0.012)
Male -0.136 -0.177 -0.178 -0.132 -0.166 -0.166
(0.114) (0.119) (0.119) (0.115) (0.119) (0.119)
White 0.563 *** 0.556 *** 0.549 *** 0.519 *** 0.511 *** 0.504 ***
(0.145) (0.145) (0.145) (0.145) (0.145) (0.145)
Hispanic -0.718 *** -0.698 *** -0.678 *** -0.735 *** -0.715 *** -0.696 ***
(0.159) (0.163) (0.166) (0.157) (0.160) (0.163)
Education years 0.101 *** 0.100 *** 0.097 *** 0.100 *** 0.099 *** 0.098 ***
(0.020) (0.020) (0.020) (0.020) (0.020) (0.020)
Married -0.284 ** -0.262 ** -0.302 ** -0.290 *** -0.267 ** -0.304 **
(0.110) (0.112) (0.122) (0.110) (0.113) (0.123)
Cognition score 0.022 0.021 0.019 0.023 * 0.022 0.020
(0.014) (0.014) (0.014) (0.014) (0.014) (0.014)
Christian 0.326 0.288 0.280 0.320 0.287 0.281
(0.256) (0.248) (0.252) (0.251) (0.245) (0.248)
Jewish 0.634 0.555 0.514 0.631 0.560 0.522
(0.504) (0.503) (0.505) (0.501) (0.503) (0.505)
Procrastinator score -0.008 -0.008 -0.008 -0.008 -0.008 -0.007
(0.015) (0.015) (0.015) (0.015) (0.015) (0.015)
Optimistic live to 85+ -0.015 0.005 0.002 -0.015 0.003 -0.001
(0.107) (0.108) (0.109) (0.108) (0.109) (0.110)
Have any cancer 0.110 0.112 0.071 0.074
(0.117) (0.117) (0.119) (0.119)
Have lung disease -0.068 -0.046 -0.065 -0.046
(0.154) (0.154) (0.154) (0.154)
Have heart condition 0.167 0.161 0.168 0.164
(0.115) (0.116) (0.116) (0.117)
Have stroke -0.068 -0.074 -0.082 -0.088
(0.155) (0.154) (0.159) (0.159)
Mental shortfall 0.302 0.282 0.411 * 0.383
(0.247) (0.241) (0.238) (0.234)
Ln(HH income) 0.053 0.049
(0.060) (0.060)
Intercept 1.973 *** -2.839 *** -2.560 ** -2.987 ** 1.645 *** -2.980 *** -2.695 *** -3.106 **
(0.105) (1.028) (1.028) (1.187) (0.057) (1.043) (1.039) (1.206)
N 487 487 487 487 479 479 479 479
R-squared 0.026 0.247 0.254 0.256 0.032 0.250 0.257 0.258
Mean of dep. var. 1.655 1.649
Std.dev. of dep. var. 1.264 1.265
End of Life Index

25
Table 5. Association of Social Security Claiming Age and Difference between Expected and
Actual Social Security Claiming Age, and Impatience among Older HRS Respondents (OLS)
(cont)
IRR -0.406 -0.443 -0.437 -0.414
(0.273) (0.287) (0.288) (0.288)
Impatience Index -0.055 -0.065 -0.054 -0.052
(0.068) (0.069) (0.069) (0.069)
Age 0.092 *** 0.099 *** 0.097 *** 0.091 *** 0.097 *** 0.097 ***
(0.022) (0.023) (0.023) (0.023) (0.024) (0.024)
Male 0.236 0.288 0.281 0.238 0.277 0.274
(0.204) (0.207) (0.208) (0.207) (0.211) (0.212)
White -0.273 -0.300 -0.302 -0.254 -0.287 -0.299
(0.307) (0.312) (0.316) (0.321) (0.327) (0.330)
Hispanic 0.556 * 0.483 0.489 0.519 0.443 0.452
(0.335) (0.344) (0.347) (0.336) (0.345) (0.347)
Education years 0.120 *** 0.120 *** 0.113 *** 0.120 *** 0.121 *** 0.116 ***
(0.034) (0.035) (0.037) (0.036) (0.036) (0.038)
Married -0.019 -0.032 -0.093 -0.001 -0.012 -0.079
(0.202) (0.205) (0.222) (0.206) (0.210) (0.224)
Cognition score -0.041 -0.039 -0.043 * -0.040 -0.038 -0.042
(0.025) (0.026) (0.026) (0.026) (0.026) (0.026)
Christian -0.415 -0.456 -0.490 -0.421 -0.461 -0.483
(0.394) (0.413) (0.415) (0.394) (0.411) (0.414)
Jewish 1.103 1.141 1.044 1.095 1.124 1.027
(0.915) (0.884) (0.874) (0.907) (0.882) (0.873)
Procrastinator score -0.003 0.005 0.006 -0.004 0.003 0.004
(0.029) (0.028) (0.028) (0.029) (0.028) (0.029)
Optimistic live to 85+ 0.182 0.154 0.144 0.197 0.171 0.158
(0.189) (0.191) (0.191) (0.192) (0.194) (0.194)
Have any cancer 0.152 0.164 0.176 0.188
(0.216) (0.216) (0.226) (0.226)
Have lung disease -0.200 -0.155 -0.206 -0.164
(0.258) (0.259) (0.265) (0.266)
Have heart condition -0.302 -0.300 -0.309 -0.306
(0.206) (0.206) (0.211) (0.211)
Have stroke -0.614 ** -0.611 ** -0.601 ** -0.600 **
(0.252) (0.250) (0.262) (0.260)
Mental shortfall -0.474 -0.544 -0.575 -0.651
(0.736) (0.758) (0.729) (0.751)
Ln(HH income) 0.092 0.097
(0.123) (0.124)
Intercept 63.622 *** 56.207 *** 55.879 *** 55.253 *** 63.410 *** 55.995 *** 55.693 *** 54.944 ***
(0.172) (1.901) (1.961) (2.177) (0.096) (1.947) (2.009) (2.244)
N 464 464 464 464 455 455 455 455
R-squared 0.005 0.098 0.122 0.125 0.002 0.092 0.116 0.119
Mean of dep. vars 63.404 63.411
Std.dev. of dep. vars 2.033 2.045
A. Age received Social Security

26
Table 5 (cont)
Note: ** Significant at 0.05 level, *** Significant at 0.01 level. All models include missing value dummies as
appropriate.
IRR -0.039 -0.111 -0.136 -0.125
(0.370) (0.403) (0.409) (0.409)
Impatience Index -0.013 0.000 -0.006 -0.013
(0.090) (0.092) (0.095) (0.095)
Age 0.092 ** 0.090 ** 0.088 ** 0.090 ** 0.089 ** 0.087 **
(0.043) (0.043) (0.044) (0.043) (0.044) (0.044)
Male -0.159 -0.090 -0.142 -0.201 -0.135 -0.177
(0.304) (0.294) (0.296) (0.306) (0.297) (0.300)
White -0.289 -0.209 -0.148 -0.290 -0.211 -0.150
(0.389) (0.406) (0.407) (0.403) (0.423) (0.423)
Hispanic 0.424 0.268 0.219 0.397 0.253 0.206
(0.550) (0.559) (0.563) (0.551) (0.560) (0.564)
Education years 0.037 0.037 0.045 0.029 0.030 0.040
(0.053) (0.054) (0.055) (0.055) (0.056) (0.057)
Married 0.112 0.069 0.182 0.156 0.105 0.224
(0.323) (0.324) (0.354) (0.324) (0.325) (0.355)
Cognition score 0.024 0.021 0.024 0.031 0.027 0.029
(0.044) (0.044) (0.044) (0.044) (0.045) (0.045)
Christian 0.108 0.149 0.037 0.097 0.134 0.046
(0.503) (0.500) (0.507) (0.507) (0.506) (0.512)
Jewish -2.710 *** -2.781 *** -2.775 *** -2.691 *** -2.758 *** -2.736 ***
(0.960) (1.004) (1.009) (0.962) (1.011) (1.021)
Procrastinator score 0.029 0.031 0.031 0.028 0.030 0.029
(0.044) (0.044) (0.044) (0.044) (0.044) (0.044)
Optimistic live to 85+ 0.342 0.368 0.368 0.366 0.388 0.387
(0.283) (0.286) (0.287) (0.286) (0.289) (0.290)
Have any cancer -0.312 -0.329 -0.264 -0.276
(0.332) (0.331) (0.338) (0.337)
Have lung disease -0.643 -0.687 * -0.592 -0.656
(0.411) (0.409) (0.423) (0.423)
Have heart condition 0.080 0.075 0.051 0.056
(0.284) (0.284) (0.285) (0.286)
Have stroke 0.228 0.212 0.242 0.214
(0.308) (0.312) (0.324) (0.329)
Mental shortfall -2.136 *** -2.115 *** -2.201 *** -2.170 ***
(0.565) (0.600) (0.616) (0.653)
Ln(HH income) -0.131 -0.138
(0.165) (0.164)
Intercept -0.170 -8.408 ** -8.149 ** -6.753 * -0.188 -8.345 ** -8.199 ** -6.790 *
(0.248) (3.433) (3.500) (3.825) (0.134) (3.487) (3.545) (3.882)
N 349 349 349 349 343 343 343 343
R-squared 0.000 0.056 0.071 0.079 0.000 0.054 0.067 0.073
Mean of dep. vars -0.191 -0.188
Std.dev. of dep. vars 2.463 2.469
B. Actual - Expected Soc Sec Claim Age

27
Appendix A. Variables Used in the Analysis
Economic and Health Outcomes
– Net Wealth (All household assets minus debt; includes house)
– Health Index: sum of scores for had flu shot, as appropriate got mammo/Pap smear or
prostate test; nonsmoker; healthy drinker (≤ 1 drink/day)
– End of Life Index: sum of scores for had LTC, had living will, had disability care, had
power of attorney
– Impatience Index sum of normalized IRR and (the negative of) Future Oriented Score
(the latter is measured on a scale from 0 to 10, where 0 means R is “completely unwilling
to give up something today" and a 10 means “very willing to give up something today”).
– Age Received SocSec: Actual age claimed Social Security
– Act-Expected SocSec Claim Age: Actual – expected (at baseline) Social Security claim
age
Preferences and Socio-Demographic Controls
– Internal Rate of Return (IRR): for definition see Appendix B
– Procrastinator Score
– Age
– Male
– Race/ethnicity
– Education (years)
– Married
– Cognition Score
– Christian/Jewish/other
– Optimistic live to 85+
– Have cancer/lung disease/heart condition/stroke
– Mental shortfall
– Ln (HH income)

28
Appendix B. Descriptive stats for Key Variables
Mean St.dev. Min Median Max
IRR 0.54 0.35 0.03 0.58 0.93
Net wealth ($1,000) 442 817 -260 192 7,919
Health Index 3.29 0.98 1 3 5
End of Life Index 1.66 1.26 0 2 4
Impatience index -0.01 1.50 -2.62 -0.01 3.38
Age Received SocSec 63.40 2.03 60 62.8 73.1
Act-Expected SocSec Claim Age -0.19 2.46 -14 0.1 9.1
Age 79.03 5.69 71 78 99
Male 0.38 0.48 0 0 1
White 0.84 0.36 0 1 1
Hispanic 0.10 0.30 0 0 1
Education years 12.37 3.25 0 12 17
Married 0.47 0.50 0 0 1
Cognition score 21.39 4.60 7 22 34
Christian 0.93 0.25 0 1 1
Jewish 0.02 0.13 0 0 1
Procrastinator score 4.75 3.44 0 5 10
Optimistic live to 85+ 0.54 0.50 0 1 1
Have any cancer 0.25 0.43 0 0 1
Have lung disease 0.13 0.34 0 0 1
Have heart condition 0.36 0.48 0 0 1
Have stroke 0.12 0.32 0 0 1
Mental shortfall 0.02 0.12 0 0 1
HH income ($) 44,618 63,219 0 28,372 677,645

29
Online Appendix A. HRS Time Discounting Module
Asked only of nonproxy respondents older than age 70
V051_GIVEUP: FUTURE ORIENTED-- 0 TO 10 (HIGH)
First, how do you see yourself -- are you a person who is generally willing to give up something
today in order to benefit from that in the future, or are you not willing to do so? Please use a scale
from 0 to 10, where 0 means you are “completely unwilling to give up something today" and a 10
means you are “very willing to give up something today". Use the values in-between to indicate
where you fall on the scale.
Scale range 0-10:
98. DK
99. RF
V052_INTRO: INTRODUCTION TO PAYMENT CHOICES
Now, suppose you were given the choice between receiving a payment today or a payment in 12
months. We will now present to you 5 situations. The payment today is the same in each of these
situations. The payment in 12 months differs in every situation. For each of these situations, we
would like to know which you would choose.
V053_100-154: 100 DOLLARS OR 154 DOLLARS
Would you rather receive 100 Dollars today or 154 Dollars in 12 months?
1. TODAY GO TO V069
2. IN 12 MONTHS
8. DK
9. RF
V054_100-125: 100 DOLLARS OR 125 DOLLARS
Would you rather receive 100 Dollars today or 125 Dollars in 12 months?
2. IN 12 MONTHS
8. DK
9. RF
V055_100-112: 100 DOLLARS OR 112 DOLLARS
Would you rather receive 100 Dollars today or 112 Dollars in 12 months?
1. TODAY GO TO V059
2. IN 12 MONTHS
8. DK
9. RF
V056_100-106: 100 DOLLARS OR 106 DOLLARS
Would you rather receive 100 Dollars today or 106 Dollars in 12 months?
1. TODAY GO TO V058
2. IN 12 MONTHS
8. DK
9. RF

30
V057_100-103: 100 DOLLARS OR 103 DOLLARS
Would you rather receive 100 Dollars today or 103 Dollars in 12 months?
1. TODAY
2. IN 12 MONTHS
8. DK
9. RF
--------------------- GO TO V084 ---------------------
V058_100-109: 100 DOLLARS OR 109 DOLLARS
Would you rather receive 100 Dollars today or 109 Dollars in 12 months?
1. TODAY
2. IN 12 MONTHS
8. DK
9. RF
--------------------- GO TO V084---------------------
V059_100-119: 100 DOLLARS OR 119 DOLLARS
Would you rather receive 100 Dollars today or 119 Dollars in 12 months?
1. TODAY
2. IN 12 MONTHS GO TO V061
8. DK
9. RF
V060_100-122: 100 DOLLARS OR 122 DOLLARS
Would you rather receive 100 Dollars today or 122 Dollars in 12 months?
1. TODAY
2. IN 12 MONTHS
8. DK
9. RF
--------------------- GO TO V084---------------------
V061_100-116: 100 DOLLARS OR 116 DOLLARS
Would you rather receive 100 Dollars today or 116 Dollars in 12 months?
1. TODAY
2. IN 12 MONTHS
8. DK
9. RF
--------------------- GO TO V084---------------------
V062_100-139: 100 DOLLARS OR 139 DOLLARS
Would you rather receive 100 Dollars today or 139 Dollars in 12 months?
1. TODAY GO TO V066
2. IN 12 MONTHS
8. DK
9. RF
V063_100-132: 100 DOLLARS OR 132 DOLLARS
Would you rather receive 100 Dollars today or 132 Dollars in 12 months?
1. TODAY GO TO V065

31
2. IN 12 MONTHS
8. DK
9. RF
V064_100-129: 100 DOLLARS OR 129 DOLLARS
Would you rather receive 100 Dollars today or 129 Dollars in 12 months?
1. TODAY
2. IN 12 MONTHS
8. DK
9. RF
--------------------- GO TO V084---------------------
V065_100-136: 100 DOLLARS OR 136 DOLLARS
Would you rather receive 100 Dollars today or 136 Dollars in 12 months?
1. TODAY
2. IN 12 MONTHS
8. DK
9. RF
--------------------- GO TO V084---------------------
V066_100-146: 100 DOLLARS OR 146 DOLLARS
Would you rather receive 100 Dollars today or 146 Dollars in 12 months?
1. TODAY GO TO V068
2. IN 12 MONTHS
8. DK
9. RF
V067_100-143: 100 DOLLARS OR 143 DOLLARS
Would you rather receive 100 Dollars today or 143 Dollars in 12 months?
1. TODAY
2. IN 12 MONTHS
8. DK
9. RF
--------------------- GO TO V084---------------------
V068_100-150: 100 DOLLARS OR 150 DOLLARS
Would you rather receive 100 Dollars today or 150 Dollars in 12 months?
1. TODAY
2. IN 12 MONTHS
8. DK
9. RF
--------------------- GO TO V084 ---------------------
V069_100-185: 100 DOLLARS OR 185 DOLLARS
Would you rather receive 100 Dollars today or 185 Dollars in 12 months?
1. TODAY
2. IN 12 MONTHS GO TO V077
8. DK
9. RF

32
V070_100-202: 100 DOLLARS OR 202 DOLLARS
Would you rather receive 100 Dollars today or 202 Dollars in 12 months?
1. TODAY GO TO V074
2. IN 12 MONTHS
8. DK
9. RF
V071_100-193: 100 DOLLARS OR 193 DOLLARS
Would you rather receive 100 Dollars today or 193 Dollars in 12 months?
1. TODAY
2. IN 12 MONTHS GO TO V073
8. DK
9. RF
V072_100-197: 100 DOLLARS OR 197 DOLLARS
Would you rather receive 100 Dollars today or 197 Dollars in 12 months?
1. TODAY
2. IN 12 MONTHS
8. DK
9. RF
--------------------- GO TO V084 ---------------------
V073_100-189
100 DOLLARS OR 189 DOLLARS
Would you rather receive 100 Dollars today or 189 Dollars in 12 months?
1. TODAY
2. IN 12 MONTHS
8. DK
9. RF
--------------------- GO TO V084 ---------------------
V074_100-210: 100 DOLLARS OR 210 DOLLARS
Would you rather receive 100 Dollars today or 210 Dollars in 12 months?
1. TODAY
2. IN 12 MONTHS GO TO V076
8. DK
9. RF
V075_100-215: 100 DOLLARS OR 215 DOLLARS
Would you rather receive 100 Dollars today or 215 Dollars in 12 months?
1. TODAY
2. IN 12 MONTHS
8. DK
9. RF
--------------------- GO TO V084 ---------------------
V076_100-206: 100 DOLLARS OR 206 DOLLARS
Would you rather receive 100 Dollars today or 206 Dollars in 12 months?
1. TODAY

33
2. IN 12 MONTHS
8. DK
9. RF
--------------------- GO TO V084 ---------------------
V077_100-169: 100 DOLLARS OR 169 DOLLARS
Would you rather receive 100 Dollars today or 169 Dollars in 12 months?
1. TODAY GO TO V081
2. IN 12 MONTHS
8. DK
9. RF
V078_100-161: 100 DOLLARS OR 161 DOLLARS
Would you rather receive 100 Dollars today or 161 Dollars in 12 months?
1. TODAY GO TO V080
2. IN 12 MONTHS
8. DK
9. RF
V079_100-158: 100 DOLLARS OR 158 DOLLARS
Would you rather receive 100 Dollars today or 158 Dollars in 12 months?
1. TODAY
2. IN 12 MONTHS
8. DK
9. RF
--------------------- GO TO V084 ---------------------
V080_100-165: 100 DOLLARS OR 165 DOLLARS
Would you rather receive 100 Dollars today or 165 Dollars in 12 months?
1. TODAY
2. IN 12 MONTHS
8. DK
9. RF
--------------------- GO TO V084 ---------------------
V081_100-177: 100 DOLLARS OR 177 DOLLARS
Would you rather receive 100 Dollars today or 177 Dollars in 12 months?
1. TODAY GO TO V083
2. IN 12 MONTHS
8. DK
9. RF
V082_100-173: 100 DOLLARS OR 173 DOLLARS
Would you rather receive 100 Dollars today or 173 Dollars in 12 months?
1. TODAY
2. IN 12 MONTHS
8. DK
9. RF
--------------------- GO TO V084 ---------------------

34
V083_100-181: 100 DOLLARS OR 181 DOLLARS
Would you rather receive 100 Dollars today or 181 Dollars in 12 months?
1. TODAY
2. IN 12 MONTHS
8. DK
9. RF
ASK EVERYONE
V084_POSTPONER: DO YOU POSTPONE 0 TO 10-HIGH
How well does the following statement describe you as a person? I tend to postpone things even
though it would be better to get them done right away. Use a scale from 0 to 10, where 0 means
“does not describe me at all" and a 10 means “describes me perfectly". Use the values in-between
to indicate where you fall on the scale.
Scale range 0-10: ______
98. DK
99. RF
V085_LOTTERY: LOTTERY VS SURE PAYMENT AMOUNT
IWER: Read slowly.
Please imagine that you have won a prize in a contest. Now you can choose between two different
payment methods, either a lottery or a sure payment. If you choose the lottery there is a 50 percent
chance that you would receive $1,000, and an equally high chance that you would receive nothing.
What is the smallest sure payment that would make you prefer the sure payment over playing the
lottery?
Amount $ ___________ ($0-$99997)
99998. DK
99999. RF
35
Online Appendix B. Generating Patience Scores and Internal Rates of Return Measures
from Our Survey Module
This document explains how we calculate Patience Scores and Internal Rates of Return (IRR) for
all respondents in our data, using responses to the HRS module described above.
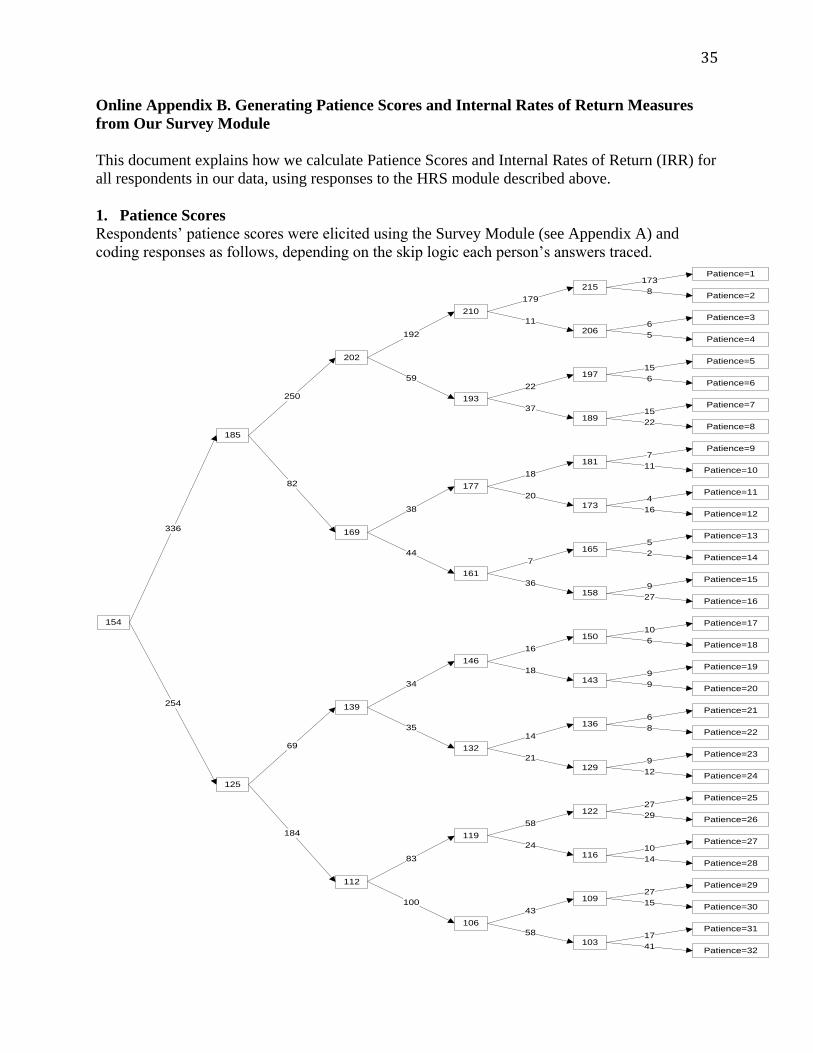
1. Patience Scores
Respondents’ patience scores were elicited using the Survey Module (see Appendix A) and
coding responses as follows, depending on the skip logic each person’s answers traced.
154
185
125
202
169
139
112
210
193
177
161
146
132
119
106
215
206
197
189
181
173
165
158
150
143
136
129
122
116
109
103
Patience=1
Patience=2
Patience=3
Patience=4
Patience=5
Patience=6
Patience=7
Patience=8
Patience=9
Patience=10
Patience=11
Patience=12
Patience=13
Patience=14
Patience=15
Patience=16
Patience=17
Patience=18
Patience=19
Patience=20
Patience=21
Patience=22
Patience=23
Patience=24
Patience=25
Patience=26
Patience=27
Patience=28
Patience=29
Patience=30
Patience=31
Patience=32
336
254
250
82
69
184
192
59
38
44
34
35
83
100
179
11
22
37
18
20
7
36
16
18
14
21
58
24
43
58
173
8
6
5
15
6
15
22
7
11
4
16
5
2
9
27
10
6
9
9
6
8
9
12
27
29
10
14
27
15
17
41

36
2. How We Computed the IRRs
The annual Internal Rate of Return (IRR) is the annual interest rate that makes it equally attractive
to receive $100 now, or a larger amount $X in 12 months. If the interest rate is compounded once
per year, the IRR satisfies this equation:
(1+IRR)*$100 = $X
We can solve for the IRR as:
IRR = ($X/$100) - 1
With compounding twice per year, the annual IRR satisfies:
(1+IRR/2)^2*$100 = $X
IRR =2*[ [($X/$100) ^(.5)]- 1 ]
With continuous compounding, the annual IRR satisfies:
(e^IRR)*$100 = $X
IRR = ln([($X/$100)

37
3. Inferring Respondents’ IRRs from Responses to Time Preference Questions:
A respondent’s choices in the time preference questions reveal something about the size of delayed
payment $Z, received in 12 months that would make him willing to give up $100 received now.
We cannot infer his exact $Z, but we infer lower and upper bounds for his true $Z. This in turn
allows us to infer bounds for an individual’s IRR, i.e., the annual interest rate that solves
(1+IRR)*$100 = $Z for that person. The patience score derived from the survey is given as follows:
For example, suppose someone has a patience score of 25. In this case we know:
$125 >= $Z >= $122. Thus, $Z is at least $122 and at most $125.
If we compounding occurred once per year, this means the person’s lower bound IRR is:
IRRlower = ($122/$100) – 1 = 0.22. And the upper bound IRR is: IRRupper = ($125/$100) – 1 =
0.25. We take the midpoint to be the respondent’s IRR: IRR = (.22 + .25)/2 = 0.235. In the case
of patience score of 1, we only have the lower bound, so we just use the lower bound.
Patience score Size of delayed payment
1 $Z >= $215
2 $215 >= $Z >= $210
3 $210 >= $Z >= $206
4 $206 >= $Z >= $202
5 $2062>= $Z >= $197
6 $197 >= $Z >= $193
7 $193 >= $Z >= $189
8 $189 >= $Z >= $185
9 $185 >= $Z >= $181
10 $181 >= $Z >= $177
11 $177 >= $Z >= $173
12 $173 >= $Z >= $169
13 $169 >= $Z >= $165
14 $165 >= $Z >= $161
15 $161 >= $Z >= $158
16 $158 >= $Z >= $154
17 $154 >= $Z >= $150
18 $150 >= $Z >= $146
19 $146 >= $Z >= $143
20 $143 >= $Z >= $139
21 $139 >= $Z >= $136
22 $136 >= $Z >= $132
23 $132 >= $Z >= $129
24 $129 >= $Z >= $125
25 $125 >= $Z >= $122
26 $122 >= $Z >= $119
27 $119 >= $Z >= $116
28 $116 >= $Z >= $112
29 $112 >= $Z >= $109
30 $109 >= $Z >= $106
31 $106 >= $Z >= $103
32 $103 >= $Z >= $0

38
The next table shows computed IRRs given three frequencies of compounding:
Summary of IRRs as a function of Patience Score and Frequency of Compounding
Patience
score
Annual
compounding
Semi-annual
compounding
Continuous
compounding
32 0.03 0.03 0.03
31 0.05 0.04 0.04
30 0.08 0.07 0.07
29 0.11 0.10 0.10
28 0.14 0.14 0.13
27 0.18 0.17 0.16
26 0.21 0.20 0.19
25 0.24 0.22 0.21
24 0.27 0.25 0.24
23 0.31 0.28 0.27
22 0.34 0.32 0.29
21 0.38 0.35 0.32
20 0.41 0.37 0.34
19 0.45 0.40 0.37
18 0.48 0.43 0.39
17 0.52 0.47 0.42
16 0.56 0.50 0.44
15 0.60 0.53 0.47
14 0.63 0.55 0.49
13 0.67 0.58 0.51
12 0.71 0.62 0.54
11 0.75 0.65 0.56
10 0.79 0.68 0.58
9 0.83 0.71 0.60
8 0.87 0.73 0.63
7 0.91 0.76 0.65
6 0.95 0.79 0.67
5 1.00 0.82 0.69
4 1.04 0.86 0.71
3 1.08 0.88 0.73
2 1.13 0.92 0.75
1 1.15 0.93 0.77