Embed Size (px)
Citation preview

Kenley and Armstead - Discounting Models For Long-Term Decision Making January 6, 2003
Discounting Models For Long-Term Decision Making
C. ROBERT KENLEY1 AND DONALD C. ARMSTEAD2
1Kenley Consulting, LLC, 165 S. 20TH Street, Richmond, IN 47374-5723*
Phone: (765) 939-8811 Fax: (765) 939-7422 Email: [email protected] Consulting, LLC, 165 S. 20TH Street, Richmond, IN 47374-5723
Phone: (765) 939-8811 Fax: (765) 939-7422 Email: [email protected]
January 6, 2003
The opinions and conclusions contained in this article are solely those of the authors.
* Author to whom all correspondence should be addressed

Kenley and Armstead - Discounting Models For Long-Term Decision Making January 6, 2003
Discounting Models for Long-Term Decision Making
C. ROBERT KENLEY1 AND DONALD C. ARMSTEAD2
1Kenley Consulting, LLC, 165 S. 20TH Street, Richmond, IN 47374-5723*
Phone: (765) 939-8811 Fax: (765) 939-7422 Email: [email protected] Consulting, LLC, 165 S. 20TH Street, Richmond, IN 47374-5723
Phone: (765) 939-8811 Fax: (765) 939-7422 Email: [email protected]
January 6, 2003
ABSTRACT
This paper investigates alternative approaches to constant rate discounting for
calculation of Net Present Value (NPV) in life cycle cost models that are used for
engineering trade studies. Alternative approaches are necessary to meet the challenge of
equitable intergenerational resource allocation for projects like radioactive waste disposal
that have a life cycle that impacts future generations well beyond the 30-year maximum
time horizon limit that results from using market-determined interest rates on bonds.
This paper reviews the literature on long-term discount models, provides a consistent
nomenclature for describing the models, summarizes the theoretical and empirical basis
for hyperbolic discounting models, evaluates the research results to date, and provides a
recommendation for applying hyperbolic discounting. It also identifies issues with the
current U.S. government policy on discounting and the future research necessary to
establish an improved foundation for discounting models for long-term projects.
KEYWORDS: life cycle costing, net present value, hyperbolic discounting, trade studies,
intergenerational equity
* Author to whom all correspondence should be addressed

Kenley and Armstead - Discounting Models For Long-Term Decision Making January 6, 2003
1
1. Introduction
Since publication of the seminal article on a generalized model of intertemporal choice that was
applicable to multiple time periods [Samuelson, 1937], it has become standard practice for
engineering trade studies to discount inflation-adjusted net cost-benefit time series using a
geometric discount function with a constant discount rate. Samuelson’s model has become a
standard practice in spite of disclaimers that provided in the original article. Samuelson [1937:
161] wrote, “any connection between utility as discussed here and any welfare concept is
disavowed”. He also stated “It is completely arbitrary to assume that the individual behaves so
as to maximize an integral of the form envisaged …” [Samuelson 1937: 159]. We will
investigate alternative approaches to Samuelson’s discount function for projects that last for very
long time periods that span multiple generations.
For U.S. federal projects, the practice of discounting is required as part of the implementation of
value engineering [United States Office of Management and Budget, 1993]. The constant-rate
geometric discount function is prescribed using a discount rate of 7% for “public investments
and regulatory programs that provide benefits and costs to the general public” [United States
Office of Management and Budget, 1993], and a rate of 3.9% for value engineering studies of
30-year internal government projects [United States Office of Management and Budget, 2002].
There are very long-term projects for which Samuelson’s widely accepted economic theory may
not be appropriate. For example, the life cycle cost profile of the U.S. Department of Energy
Civilian Radioactive Waste Management System extends 118 years, and there are large costs at
the conclusion of the program for Closure and Decommissioning as shown in Figure 1 [U.S.
Department of Energy, 2001). Using 3.9% constant rate discounting, an engineering alternative
to the baseline that combines reducing current cost by $1 million in 2002 and increasing the
closure cost by $46 million in 2102 is equivalent to the baseline using the accepted NPV method.
To graphically illustrate this, the life cycle costs shown in Figure 2 have been discounted using

Kenley and Armstead - Discounting Models For Long-Term Decision Making January 6, 2003
2
3.9% constant rate discounting. Note that beyond 2049, the effect of constant-rate discounting to
essentially make the costs beyond 2049 negligible in comparison to earlier costs.
Figure 1 Annual Total System Life Cycle Cost Profile
Figure 2 Constant Discounting at 3.9%
Hyperbolic discounting uses a hyperbolic function to reduce the discount factor for future costs
relative to the factor that results when using a constant discount rate. Using a proportional
version of hyperbolic discounting with an initial year 7.2% discount rate that decreases over
time, an alternative with $1 million in savings in 2002 and only $8 million in increased cost in
2102 is equivalent to the baseline. Figure 3 shows the life cycle costs using the 7.2%
proportional discounting. Note that all future costs have some significance, particularly the large
Closure and Decommissioning costs that begin in 2105. Proportional discounting provides a
balance between ignoring these very long-term costs, which occurs when constant discounting is
applied, and weighing future costs too much, which occurs when no discounting is applied. If
proportional discounting can be shown to be representative of social values in decision-making it
provides an alternative way of looking at the future.
Figure 3 Proportional Discounting at 7.2%
2. Review of Hyperbolic Discounting Literature
In this section, we summarize our research in the field of alternative discounting methods. The
authors lay the groundwork for the relatively new area of hyperbolic discounting. We begin with
definitions of discounting models to provide a common nomenclature that does not currently
exist for the discounting models that we reviewed. We also provide a citation hierarchy followed
by summaries of the individual research papers that indicate which researchers actually collected
empirical data, which used other researchers’ empirical data, and which provided theoretical
underpinnings. The empirical studies show that proportional discounting actually agrees with
public choice better than any other method, including the long-used constant discounting.

Kenley and Armstead - Discounting Models For Long-Term Decision Making January 6, 2003
3
Table I defines the discounting models discussed in this paper. For any discounting model the
discount factor at time t for interest rate i is given by
†
wt =1
(1+ i)a( t )
The function
†
a(t) is a time perception function that indicates how fast time is perceived to pass.
From Table I, the constant rate discounting model could also be described as linear time
perception discounting. Constant rate discounting is applied for scenarios where the total of the
costs and benefits for a discrete time period (e.g. a fiscal year) are discounted by a single
discount factor. Exponential discounting is the continuous time version of constant rate
discounting where a unique discount factor is applied to each individual cost or benefit the
instant it occurs. Note that it also has a linear time perception function in Table I, which is
related to the constant rate discounting time perception by the scale factor h / ln(1+i). Also, note
that relative discounting is hyperbolic discounting with the parameter g = 1; and proportional
discounting is hyperbolic with the parameter g = h.
Table I Discounting Models
A thorough literature review for potential methodologies was performed in the field of
management science and economics, and the key articles shown in Figure 4 are used in the
discussion below. The first line in each box is the principal author’s last name and the year of
publication of the reference. An arrow from that article to the citing reference indicates articles
that are cited by another article. If the article presents data and fits the data to the various models
in Table I, the second line in each box in Figure 4 shows the models that were fit in order of
goodness of fit from best to worst. For example, Cairns [2000] presents data and fits models for
proportional, hyperbolic, relative, and constant discounting. Proportional discounting had the
best fit to the data, and constant discounting had the worst fit to the data. The third line notes the
longest time horizon into the future for which data was collected. Note that in all cases where a

Kenley and Armstead - Discounting Models For Long-Term Decision Making January 6, 2003
4
proportional discounting model was fit, it had the best fit to the data. Also, in all cases where a
constant discounting model was fit, it had the worst fit to the data.
Figure 4 Hyperbolic Discounting References
Thaler [1981] was the first to examine preference reversals by using this much quoted, simple
example: one may prefer one apple today to two tomorrow but no one would prefer one apple in
a year to two apples in a year and a day. Constant discounting theory is based on the principal of
stationarity, which requires that if you prefer one apple today to two tomorrow, you must prefer
one apple in a year to two apples in a year and a day. It would seem prudent to allow for the
possibility that individual discount rates are not necessarily equal to the interest rate, and tend to
vary with the size and sign of the reward, and the length of the delay. He provides 36 median
data points derived from samples developed by surveying a general student body regarding
monetary choices over a 10-year time horizon.
Harvey [1986] noted that constant value discounting strikingly undervalues the future, especially
for decisions regarding natural resources and environmental quality with time horizons 100+
years in the future. He provides an axiomatic derivation of relative discounting, and contends
that the relative discounting model be applied to public policy rather than individual decision-
making. Relative discounting models change in preference due to length of delay of the reward
by assuming that time perception is relative to how far in the future the baseline comparison is
made. For example, if someone is indifferent between receiving one apple one day from today
and four apples two days from today, they are also indifferent between receiving one apple one
year from today and four apples two years from today. Under constant discounting, this person
would be indifferent between receiving one apple one year from today and four apples one year
and one day from today, whereas under relative discounting, four apples one year and one day
from today is clearly preferred to one apple one year from today. The functional form for
relative discounting falls within general hyperbolic discounting.

Kenley and Armstead - Discounting Models For Long-Term Decision Making January 6, 2003
5
Benzion, Rapoport, and Yagil [1989] show discount rates inferred from the riskless choices
support the previous findings reported by Thaler [1981]. The discount rates (i) decline as the
time necessary to wait increases, (ii) decrease as the size of cash flow increases and (iii) are
smaller for losses than for gains. The findings are based on responses of 204 students with
extensive knowledge of economics and finance regarding monetary choices over a 4-year time
horizon.
Cropper, Aydele, and Portney [1992] gathered data from questions on saving lives in delayed or
immediate situations. They provide 1859 data points from a survey of 3200 households
regarding life-saving delays over a 100-year time horizon. Problems arise because lives are
saved over time and programs save lives at different ages which changes number of life-years
saved. They find that the public agrees with the discounting of future lives saved.
Loewenstein and Prelec [1992] effectively summarize, in economic jargon and plain English, all
axioms and anomalies of the original constant discount model [Samuelson 1937] to date at
length. Principles such as stationarity (discounting is based on the difference in time between
two events as in Thaler’s example of the apples), the absolute magnitude effect (large sums
suffer less proportional discounting than do small ones), gain-loss asymmetry (losses are
discounted at a lower rate than gains), and the delay-speedup asymmetry (delay compensation
was two to four times greater than the amount willing to be sacrificed to speedup the reward) are
discussed. The latter were inconsistent with any normative theory to that time, particularly
constant discounting utility. They provide an axiomatic derivation of hyperbolic discounting that
provides a normative model with constant discounting as a special case. For the cases that are
anomalies under constant discounting, hyperbolic discounting provides a framework that
incorporates them as valid cases. The functional form for hyperbolic discounting also provides
for proportional and relative discounting as special cases.

Kenley and Armstead - Discounting Models For Long-Term Decision Making January 6, 2003
6
Shelley [1993] demonstrates the predictability of relative implied discount rates when a decision
maker’s reference point is manipulated. The results suggest that decision makers can adapt to an
outcome by imagining it, and when they adapt, they experience a reference point shift that will
determine how any change in the timing of that outcome will be interpreted. A subset of the
original 74 respondents from Benzion, Rapoport, and Yagil [1989] are analyzed in this paper.
Green, Fristoe, and Myerson [1994] provide an extensive discussion of preference reversal.
Preference depends on inter-reward delay and length of delay to the smaller amount. They use a
survey of 24 undergraduates regarding monetary choices over a 20-year time horizon.
Harvey [1994] discusses how constant discounting is unreasonable for intergenerational
decisions. He shows how many authors speak as though timing neutrality/non-discounting and
timing aversion/constant discounting are the only alternative models. Both represent extreme
types of timing preferences. He states that if the discount rate is positive, there is no reason why
it has to be constant. He introduces proportional discounting as an alternative to constant
discounting, which he had derived axiomatically and documented in a working paper. The
axiomatic derivation of proportional discounting appeared later in a refereed journal [Harvey,
1995].
Harvey [1995] proposes an alternative method called proportional discounting, and provides an
extensive discussion of terminology in the area of discounting. In contrast to his earlier work on
relative discounting, changes in preference due to length of delay in reward assumes that time
perception is relative to the amount that is being discounted. For example, if someone is
indifferent between receiving one apple today and four apples one day from today, they are also
indifferent between receiving one apple one year from today and four apples four years and one
day from today. Under constant discounting, this person would be indifferent between receiving
one apple one year from today and four apples one year and one day from today, whereas under
proportional discounting, four apples one year and one day from today is clearly preferred to one
Kenley and Armstead - Discounting Models For Long-Term Decision Making January 6, 2003
7
apple one year from today. The functional form for proportional discounting falls within general
hyperbolic discounting.
Albrecht and Weber [1995] provide a useful framework for comparing different discounting
models that is used to develop Table I above. They also state that hyperbolic models present a
better representation of societal choice because people value things more in the near future than
the far future. They use 5 mean discount rates from Benzion, Rapoport, and Yagil [1989] and
Shelley’s [1993] subset of Benzion, Rapoport, and Yagil [1989] to fit relative and constant
discount models.
Henderson and Bateman [1995] note that economists normally suggest that the suitable discount
rates for cost-benefit project appraisal can be derived from market interest rates. This rate differs
between individuals depending whether they are savers or borrowers, and is complex if they are
simultaneously both. Even after choosing one rate as the appropriate reference point, the
calculation of a single suitable (constant) discount rate for all projects is not uniquely possible.
They suggest that a hyperbolic discount rate can deal with the intergenerational dilemma and be
justifiable in so far as it represents the true social rate in some circumstances. They argue that
since we can’t possibly maintain economic growth at the rate of interest from capital markets, we
should be using a lower discount rate when we determine which projects to fund. They use 5
sample median discount rates from the Cropper, Aydele, and Portney [1992] data to fit a
proportional model.
Kirby and Marakovic [1995] provide results of two experiments that show the superiority of
proportional over exponential discounting. The proportional fit better for 170 out of 195 non-
linear regressions, real and hypothetical. The very high R-squared values for each suggest that
the exponential can account for most of the variance associated with human discounting (at least
for this very short time horizon of these experiments). They surveyed 22 college students for the
two experiments with 29-day time horizons, one using real rewards in a simulated auction and
the other using hypothetical monetary rewards. The real questions were asked such that each

Kenley and Armstead - Discounting Models For Long-Term Decision Making January 6, 2003
8
question should be examined as real and then one of their choices was selected randomly and
given to the participant. This removes error due to money already gained.
Myerson and Green [1995] state that hyperbolic models are preferable to exponential ones
because they allow preference reversals. They use a subset of 12 respondents from Green,
Fristoe, and Myerson [1994] with $1,000 and $10,000 rewards with 25-year time horizon to fit
proportional, hyperbolic, and exponential models.
Cairns and van der Pol [2000] refute the economic axiom of stationarity that states the preference
between two outcomes depends only on the absolute time difference between them, as in the case
of constant discounting. This article explains in detail why these other forms of discounting
(proportional, hyperbolic, and relative) are more suited to the wants of society. They use 922
data points from 473 respondents on tradeoffs framed in terms of general public welfare and in
terms of private and public financial measures over a 19-year time horizon.
Settle and Shogren [2001] present an overview that explains hyperbolic discounting very well in
layman’s terms, and also highlights main points of several other articles cited here. Constant
discounting will discount future benefits to zero whereas hyperbolic discounting will allow
future generations to be considered, even if they are in the far distant future. They select
Henderson and Bateman’s [1995] proportional model for their application to their environmental
project at Yellowstone Park, which has an unlimited time horizon. They conclude further
research applying hyperbolic discounting to specific projects is essential to gauge the importance
of hyperbolic discounting for project assessment.
Keller and Strazzera [2002] present a method for characterizing intertemporal preferences by
selecting the discounting model which best fits data on people’s preferences. They limit analysis
to exponential and relative discounting models using Thaler’s [1981] data. In contrast to Thaler,
they found that its predictive accuracy is good enough to warrant acceptance of the hypothesis
that the data are expressed by a unique discount rate, i.e. the relative discount rate h = 0.223.

Kenley and Armstead - Discounting Models For Long-Term Decision Making January 6, 2003
9
Most of authors reviewed come to the conclusion, through axiomatic derivation as well as
empirical studies, that the proportional style of hyperbolic discounting best represents societal
choice. This is because proportional discounting allows for preference reversals, that is, while
one apple today may be preferred to two tomorrow, two in a year and a day most likely is
preferred to one in a year. It also gives some value to future occurrences whereas constant
discounting values all costs beyond 30 years, no matter how great, to essentially zero.
3. A Recommended Discounting Model Consistent with OMB Guidance
The above research strongly suggests that for any project whose life cycle is well beyond the 30-
year maximum inherent in the nature of constant discounting, an alternative approach should be
considered when valuing future costs.
United States Office of Management and Budget Circular No. A-94 [1992] was developed to
promote efficient resource allocation by the federal government. It also provides a specific
guidance on the discount rates to be used in evaluating federal programs whose costs and
benefits are distributed over time. A real discount rate is one that has been adjusted to eliminate
the effect of inflation and should be used to discount constant-dollar or real benefits and costs.
This rate should be calculated by subtracting expected inflation from a nominal interest rate that
reflects the expected inflation should be used to discount nominal benefits and costs. Circular A-
94 [1992] states that constant-dollar benefit-cost analyses of internal government investments
should use the real Treasury borrowing rate on marketable securities of comparable maturity to
the period of analysis. Engineering trade studies for projects such as the Civilian Radioactive
Waste Management System where the alternatives all provide the same benefit to the public but
have different life cycle cost profiles fall under the category of internal government investments.
Appendix C of Circular A-94 [2002] provides the real Treasury borrowing rates to be used, and
states that projects of 30 years or more duration should report using a real discount rate of 3.9
percent.

Kenley and Armstead - Discounting Models For Long-Term Decision Making January 6, 2003
10
Table II depicts each major discounting method reviewed by listing discount factors versus time
for 3, 5, 7, 10, 30, and 100 years. In addition to the discount factor curves from the empirical
studies, we have also plotted the OMB-approved 3.9% real discount rate curve, and a
proportional discount curve with parameter g = 7.2%. The proportional discount model with
parameter g = 7.2% is recommended by the authors as a reasonable model consistent with OMB
guidance. The rationale for the recommendation is given below. The models in Table II are
listed in order of increasing ratio of the 3-year discount factor to the 100-year discount factor.
Models with parameters in the bottom half of the table essentially ignore costs and benefits at
year 100 relative to year 3.
Table II Discount Factors for Models Evaluated
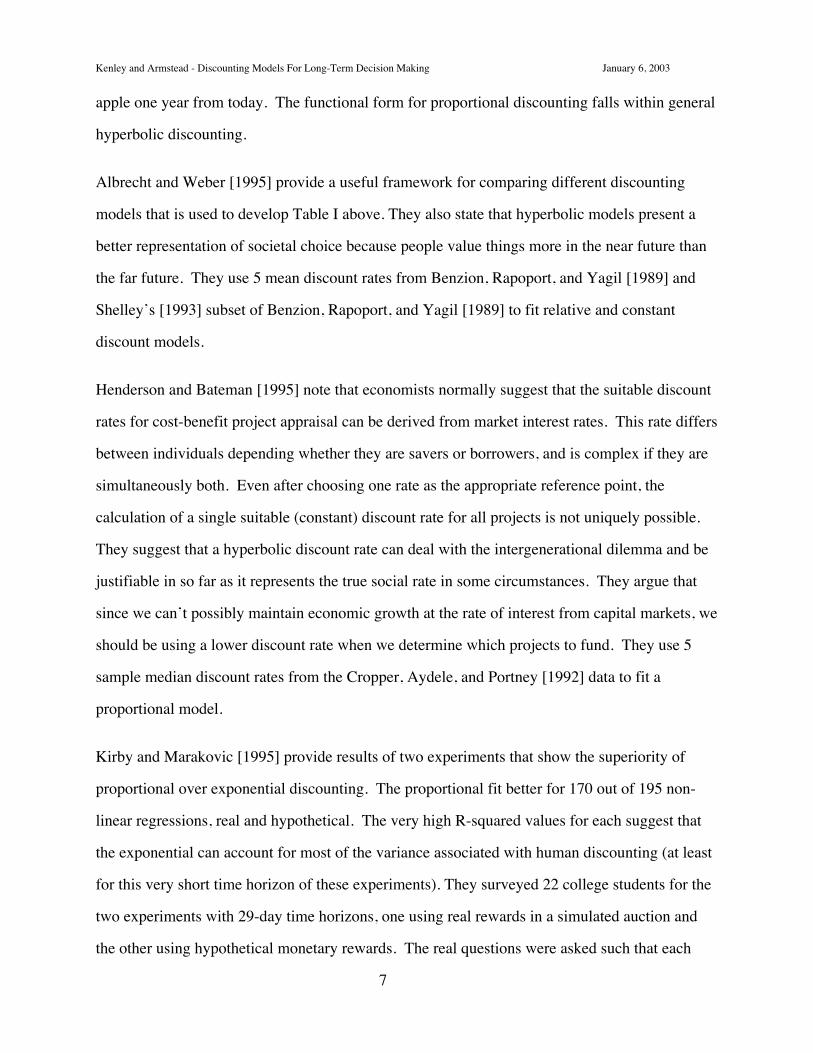
Table III shows the equivalent constant discount rate for the models calculated from discount
factors in Table II using the equation:
†
1W 1 t -1,
where W is the discount factor (as shown in Table II) and t is the time in years. This value is the
constant discount rate that would have to be applied to yield the same discount factor at time t as
the discount factor calculated from the alternative model. Table III is ordered from the smallest
to the largest value of the equivalent constant discount rate at year 3. It also shows the OMB-
approved real discount rates for projects with durations of 3, 5, 7, 10, and 30 years. Note that the
OMB rates actually increase over time, which is the opposite of hyperbolic discounting models.
Table III shows that equivalent annual discount rates are very high for most of the empirical
studies. This behavior reflects that the survey respondents’ choices exhibit consumer behavior in
that higher interest rates routinely are charged for credit cards and other short-term consumer
loans to meet high priority near-term needs.
Table III Equivalent Constant Discount Rates for Models Evaluated

Kenley and Armstead - Discounting Models For Long-Term Decision Making January 6, 2003
11
For government projects, consumer credit card rates certainly are not the appropriate choice;
therefore, the choice of the parameter for application of the discounting model must be selected
to yield reasonable interest rates consistent with the OMB-approved 3.9% constant discount rate.
Harvey’s [1995] relative and proportional models are single parameter models, and they have a
rationale for selecting them based on consideration of empirically measured attitudes toward
expenditures and rewards in far future years and how the impact of time delays is related to the
amounts being discounted. Since the proportional model consistently provides the better fit to
preferences in the empirical studies, it is the recommended alternative.
Harvey [1992] describes a method of selecting the parameter for proportional discounting that is
consistent with the OMB-approved discount rate.
With constant discounting and with proportional discounting, the timing weights are
determined by a single parameter. The parameters can be calculated from a single
quantity, such as the following:
1. an initial discount rate r from year 0 to year 1 (so that a1 = 1/(1+r)),
2. a temporal midvalue m that designates the year judged to be half as important as
year 0 (so that am = 1/2).
The initial discount rate r can be viewed as the measure of society’s short-term
intertemporal preferences, and the temporal midvalue m can be viewed as the measure of
society’s long-term intertemporal preferences. In a proportional-discounting model, the
annual discount rates will decrease from the initial discount rate r as t increases.
Harvey’s initial discount rate method extrapolates long-term preferences from short-term interest
rates. For a project like the Civilian Radioactive Waste Management System, the short-term
discount rate in the first year would extrapolated over 100 years, which leads to inaccuracies in
representing true long-term preferences. Instead of extrapolating from a short-tem rate in year

Kenley and Armstead - Discounting Models For Long-Term Decision Making January 6, 2003
12
1, we propose using the OMB-approved 30-year, long-term discount rate of 3.9% as the constant
interest rate at year 30 to establish the parameter for proportional discounting. The temporal
midvalue method also would reduce the length of time over which the interest rate is
extrapolated, but it requires extensive education and interviewing of decision makers to come a
consensus. OMB encourages parametric studies that evaluate tradeoffs as a function of the
discount rate in addition to evaluating tradeoffs using the 3.9% baseline rate. Similarly, it would
be expected that the parameter for proportional discounting would be varied to investigate the
sensitivity of tradeoffs to it.
To find the value of g for proportional discounting using the OMB-approved 30-year rate of
3.9%, we apply the formulas in Table I for constant rate and proportional discounting.
†
wt =1 1+ gt( ) =1 1+ i( )t for t = 30 and i = 0.039 fi
1 1+ 30g( ) =1 1+ 0.039( )30fi
1+ 30g = 1+ 0.039( )30fi
g =1+ 0.039( )30
-130
= 0.072 fi
wt =1 1+ 0.072 t( )
4. Consumer Loan Interest Rates and Proportional Discounting
The extraordinarily high equivalent constant discount rates for year 3 in Table III are descriptive
of what might be called passionate consumer behavior. Frederick, Loewenstein, and
O’Donoghue [2002] review how multiple consumer behaviors have been successfully modeled
with hyperbolic discounting including intergenerational altruism, procrastination, and addictive
behaviors. While we do not promote the idea that public projects should reflect the magnitude of
interest rates of passionate consumer behavior, it is very desirable that the declining discount
rates over time be used for long-term decisions.
Table IV compares the OMB-approved nominal discount rates (the OMB real rates shown in the
last row of Table III with inflation added), consumer nominal interest rates reported by the U.S.

Kenley and Armstead - Discounting Models For Long-Term Decision Making January 6, 2003
13
Federal Reserve at that time, and the discount rates from the recommended proportional model
with inflation added. The 1/12-year (one-month) consumer rate was the prevailing credit card
interest rate; the 2-, 4, and 5-year rates were new car loan rates; and the 15- and 30-year rates
were mortgage rates.
The OMB rates increase as the term increases. This is because the OMB rates are based on
investor rates from the bond market where a liquidity premium must be offered to commit an
investor’s resources for a longer period of time. The rationale for choosing investor rates is that
“in general, public investments and regulations displace both private investment and
consumption” [OMB, 1992].
The consumer rates decline as the term of the loan increases, and rise slightly for mortgages,
which represent a slight shift from consumer to investor behavior for home mortgages. The
proportional discount rate tracks the decline in consumer market rates, but does not produce the
high consumer rates in the near term.
When one considers long-term projects for which hyperbolic discounting is proposed such as the
Civilian Radioactive Waste Management System, national defense projects, and environmental
conservation, they should be viewed as a form of consumption where the government is acting as
the proxy consumer for the general public rather than viewing them as a case of the government
acting as an investor seeking high returns with maximum liquidity.
Looking at Table IV, it appears serendipitous that matching the 30-year discount for proportional
discounting to the 30-year OMB discount rate yielded a reasonable match of the proportional
discounting model to consumer preferences as represented by consumer interest rates. In fact, it
may be the case that the 30-year bond rate is driven by the supply and demand for home
mortgage financing. If this is true, the 3-year rates may be the keystone that links the “supply-
side’, investment-driven OMB guidance and the “demand-side”, consumption-driven public
preferences that follow hyperbolic discounting.

Kenley and Armstead - Discounting Models For Long-Term Decision Making January 6, 2003
14
5. Conclusion
Hyperbolic discounting models provide an excellent alternative to constant discount rate NPV.
They provide a better representation of public preference as shown by empirical evidence
collected by many noted authors. Not only was proportional discounting the best fit in nearly
every study conducted, is a single parameter model that should be just as simple to implement as
the OMB-approved constant discounting.
The OMB guidance appears to favor an investor’s perspective over a consumer’s perspective,
which leads to prescribing an increase in the discount rate as the length of a project under
evaluation increases. This may actually run counter to the purpose of some projects where the
government is acting a proxy consumer for the general public. To date, no one has offered up a
market mechanism to produce an acceptable parameter value for use in hyperbolic discounting
for those cases when the government is the proxy consumer. We propose that the 30-year
mortgage market may be the best input to determine the appropriate parameter for hyperbolic
discounting, and we believe that further investigation is necessary of this and other market-based
approaches to provide government decision makers with a methodology for establishing a more
rational long-term discounting policy.
6. References
Martin Albrecht and Martin Weber, Hyperbolic Discounting Models In Prescriptive Theory Of
Intertemporal Choice, Zeitschrift fur Wirtschafts- und Sozialwissenschaften, 1995, Vol. 115,
pp. 535 - 568.
U. Benzion, A. Rapoport, and J. Yagil, Discount rates inferred from decisions: An experimental
study, Management Science, Vol. 35, 1999, pp. 270-284.
John Cairns and Marjon van der Pol, Valuing future private and social benefits: The discounted
utility model versus hyperbolic discounting models, Journal of Economic Psychology, Vol.
21, 2000, pp 191 – 205.

Kenley and Armstead - Discounting Models For Long-Term Decision Making January 6, 2003
15
Maureen Cropper, Sema Aydede and Paul Portney, Rates of Time Preference for Saving Lives,
American Economic Review Papers and Proceedings, Vol. 82, No. 2, 1992, pp. 469 - 472.
Maureen L. Cropper, Sema K. Aydede and Paul R. Portney, Preferences for Life Saving
Programs: How the Public Discounts Time and Age, Journal of Risk and Uncertainty, Vol. 8,
1994, pp. 243-265.
Shane Frederick, George Loewenstein, and Ted O’Donoghue, Time Discounting and Time
Preference: A Critical Review, Journal of Economic Literature, Vol. 40, No. 2, June 2002,
pp. 351-401.
L. Green, N. Fristoe, and J. Myerson, Temporal discounting and preference reversals in choice
between delayed outcomes, Psychonomic Bulletin and Review, Vol.1, 1994, pp 383 - 389.
Charles M. Harvey, Value Functions for Infinite-Period Planning, Management Science, Vol. 32,
No. 9, September 1986, pp. 1123 – 1139.
Charles M. Harvey, A Slow Discounting Model for Energy Conservation, Interfaces, Vol. 22,
No. 6, November - December 1992, pp. 47 – 60.
Charles M . Harvey, The reasonableness of non-constant discounting, Journal of Public
Economics, Vol. 53, 1994, pp. 31 - 51.
Charles Harvey, Proportional Discounting of Future Cost and Benefits, Mathematics of
Operations Research, Vol. 20, No. 2, May 1995, pp. 381 - 399.
Norman Henderson and Ian Bateman, Empirical and Public Choice Evidence for Hyperbolic
Social Discount Rates and the Implications for Intergenerational Discounting, Environmental
and Resource Economics, Vol. 5,1995, pp 413 - 423.
L. Robin Keller and Elisabetta Strazzera, Examining Predictive Accuracy Among Discounting
Models, The Journal of Risk and Uncertainty, Vol. 24, No. 2, 2002, pp 143 – 160.

Kenley and Armstead - Discounting Models For Long-Term Decision Making January 6, 2003
16
K.N. Kirby and N.N. Marakovic, Modelling myopic decisions: Evidence for hyperbolic delay
discounting within subjects and amounts. Organizational Behavior and Human Decision
Processes, 64, 1995, pp 22-30.
George Loewenstein and Drazen Prelec, Anomalies in Intertemporal Choice: Evidence and an
Interpretation, Quarterly Journal of Economics, Vol. 107, No. 2, May 1992, pp 573 – 597.
J. Myerson and L. Green, Discounting of delayed rewards: Models of individual choice. Journal
of the Experimental Analysis of Behavior, 1995, 64, pp. 263-276.
Paul Samuelson, A Note on the Measurement of Utility, Review of Economic Studies, Vol. 4,
1937, pp 151-61.
Chad Settle and Jason F. Shogren, Applying Hyperbolic Discounting to a Native-Exotic Species
Conflict, First Draft, Department of Economics, University of Tulsa, Tulsa, OK 74104-3189
and Department of Economics and Finance, University of Wyoming, Laramie, WY 82071-
3985, 23 April 2001.
M. K. Shelley, Outcome signs, question frames and discount rates. Management Science, 1993,
39, pp. 806-815.
R. Thaler, Some empirical evidence on dynamic consistency. Economics Letters, 1981, Vol 8, pp
201-207.
U.S. Department of Energy, Office of Civilian Radioactive Waste Management, Analysis of the
Total System Life Cycle Cost of the Civilian Radioactive Waste Management Program,
DOE/RW-0533, May 2001
United States Office of Management and Budget, Guidelines and Discount Rates for Benefit-
Cost Analysis of Federal Programs, Circular No. A-94 Revised, (Transmittal Memo No. 64),
29 October 1992

Kenley and Armstead - Discounting Models For Long-Term Decision Making January 6, 2003
17
United States Office of Management and Budget, Value Engineering, Circular No. A-131, 21
May 1993
United States Office of Management and Budget, Discount Rates For Cost-Effectiveness, Lease
Purchase, And Related Analyses, Circular No. A-94 Appendix C Revised, February 2002

Kenley and Armstead - Discounting Models For Long-Term Decision Making January 6, 2003
18
Table I. Discounting Models
DiscountingModel Name
Time PerceptionFunction a(t)
Discount Factorwt at Time t
Constant Rate t
†
1 1+ i( )t
Exponential
†
hln(1+ i)
t
†
1 eht
Hyperbolic
†
hg
log1+ i(1+ gt)
†
1 1+ gt( )h
g
Relative
†
h log1+ i(1+ t)
†
1 1+ t( )h
Proportional
†
log1+ i(1+ gt)
†
1 1+ gt( )

Kenley and Armstead - Discounting Models For Long-Term Decision Making January 6, 2003
19
Parameters Discount Factor at Year tReference DiscountingModel g h i
Discount FactorEquation 3 5 7 10 30 100 Ratio
Kirby [1995] Proportional 0.028 - - 1 / (1 + 0.028*t) 0.923 0.877 0.836 0.781 0.543 0.263 2.1Cairns [2000] Relative - 0.351 - 1 / (1 + t) 0.351 0.615 0.533 0.482 0.431 0.300 0.198 3.1Cairns [2000] Relative - 0.365 - 1 / (1 + t) 0.365 0.603 0.520 0.468 0.417 0.286 0.186 3.2Keller [2002] Constant - - 0.014 1 / 1.014t 0.959 0.933 0.907 0.870 0.659 0.249 3.5Keller [2002] Relative - 0.223 - 1 / (1 + t) 0.223 0.724 0.659 0.616 0.572 0.449 0.341 3.9Recommended Proportional 0.072 - - 1 / (1 + 0.072*t) 0.822 0.735 0.665 0.581 0.317 0.122 6.7Kirby [1995] Exponential - 0.021 - 1 / e0.021t 0.939 0.900 0.863 0.811 0.533 0.122 7.7Cropper [1994] Relative - 0.7965 - 1 / (1 + t) 0.7965 0.331 0.240 0.191 0.148 0.065 0.037 9.0Henderson[1995]
Proportional 0.210 - - 1 / (1 + 0.21*t) 0.613 0.488 0.405 0.323 0.137 0.045 13.6
Cairns [2000] Hyperbolic 0.316 0.344 - 1/(1+0.316*t)1.09 0.484 0.356 0.281 0.212 0.077 0.023 21.0Cairns [2000] Proportional 0.615 - - 1 / (1 + 0.615*t) 0.351 0.245 0.189 0.140 0.051 0.016 22.0Cairns [2000] Proportional 0.606 - - 1 / (1 + 0.606*t) 0.355 0.248 0.191 0.142 0.052 0.016 22.2Cairns [2000] Hyperbolic 0.255 0.309 - 1/(1+0.255*t)1.21 0.502 0.369 0.289 0.215 0.073 0.019 26.4OMB [2002] 30-yr Constant - - 0.039 1 / 1.039t 0.892 0.826 0.765 0.682 0.317 0.022 40.5Cairns [2000] Constant - - 0.203 1 / 1.203t 0.574 0.397 0.274 0.158 0.004 0.000 574.4Cairns [2000] Constant - - 0.192 1 / 1.192t 0.590 0.416 0.292 0.173 0.005 0.000 590.4
Table II Discount Factors for Models Evaluated
Kenley and Armstead - Discounting Models For Long-Term Decision Making January 6, 2003
20
Parameters Equivalent Constant Discount Rate at Year tReference DiscountingModel g h i 3 5 7 10 30 100
Keller [2002] Constant - - 0.014 0.014 0.014 0.014 0.014 0.014 0.014Kirby [1995] Exponential - 0.021 - 0.021 0.021 0.021 0.021 0.021 0.021Kirby [1995] Proportional 0.028 - - 0.027 0.027 0.026 0.025 0.021 0.013OMB [2002] 30-yr Constant - - 0.039 0.039 0.039 0.039 0.039 0.039 0.039Recommended Proportional 0.072 - - 0.067 0.063 0.060 0.056 0.039 0.021Keller [2002] Relative - 0.223 - 0.114 0.087 0.072 0.057 0.027 0.011Cairns [2000] Relative - 0.351 - 0.176 0.134 0.110 0.088 0.041 0.016Henderson [1995] Proportional 0.210 - - 0.177 0.154 0.138 0.120 0.069 0.031Cairns [2000] Relative - 0.365 - 0.184 0.140 0.115 0.091 0.043 0.017Cairns [2000] Constant - - 0.192 0.192 0.192 0.192 0.192 0.192 0.192Cairns [2000] Constant - - 0.203 0.203 0.203 0.203 0.203 0.203 0.203Cairns [2000] Hyperbolic 0.255 0.309 - 0.258 0.220 0.194 0.166 0.091 0.041Cairns [2000] Hyperbolic 0.316 0.344 - 0.274 0.229 0.199 0.168 0.089 0.039Cairns [2000] Proportional 0.606 - - 0.412 0.321 0.267 0.216 0.103 0.042Cairns [2000] Proportional 0.615 - - 0.417 0.324 0.269 0.217 0.104 0.042Cropper [1994] Relative - 0.7965 - 0.445 0.330 0.267 0.210 0.095 0.037OMB [2002] OMB-Approved Constant Discount Rates 0.021 0.028 0.030 0.031 0.039
Table III Equivalent Constant Discount Rates for Models Evaluated

Kenley and Armstead - Discounting Models For Long-Term Decision Making January 6, 2003
21
Term (yr)OMB NominalDiscount Rates
(Feb 2002)
ConsumerNominal InterestRates (Feb 2002)
ProportionalDiscount Rate
(Inflation Added)1/12 - 0.130 0.094
2 - 0.117 0.0903 0.041 - 0.0874 - 0.075 0.0855 0.045 0.061 0.0837 0.048 - 0.08010 0.051 - 0.07615 - 0.064 0.07530 0.058 0.069 0.058
Table IV Comparison of OMB Discount Rates to Consumer Interest Rates

Kenley and Armstead - Discounting Models For Long-Term Decision Making January 6, 2003
22
List of Figures
Figure 1 Annual Total System Life Cycle Cost Profile
Figure 2 Constant Discounting at 3.9%
Figure 3 Proportional Discounting at 7.2%
Figure 4 Hyperbolic Discounting References

Kenley and Armstead - Discounting Models For Long-Term Decision Making January 6, 2003
23
BIOGRAPHIES
C. Robert Kenley holds a Ph.D. and M.S. in Engineering-Economic Systems from Stanford, a
M.S. in Statistics from Purdue, and a S.B. in Management from MIT. He has 20 years
experience in aerospace and nuclear systems engineering. His current mission is to provide
clients with insight and understanding of systems problems as an independent consultant. He is
the chair of the INCOSE Ways and Means Committee. He is a published author of several
papers and journal articles in the fields of systems engineering, decision analysis, Bayesian
probability networks, and applied meteorology.
Donald C. Armstead is an undergraduate student at Ball State University in Muncie, Indiana. He
is majoring in mathematics with minors in physics and computer science. He is attending the
university on the Presidential Scholarship, and wishes to pursue a doctorate in pure mathematics
after graduating. He desires to work in the field of space aviation afterwards. He is a member of
the Ball State Ultimate Frisbee Team.
.

Figure 1 Annual Total System Life Cycle Cost Profile
0
200
400
600
800
1000
1200
1400
1600
18001983
1987
1991
1995
1999
2003
2007
2011
2015
2019
2023
2027
2031
2035
2039
2043
2047
2051
2055
2059
2063
2067
2071
2075
2079
2083
2087
2091
2095
2099
2103
2107
2111
2115
2119
Year
Millio
ns
of
Do
llars
Future CostsHistorical Costs - 1983 - 2000 (YOE$s)

Figure 2 Constant Discounting at 3.9%
0
200
400
600
800
1000
1200
1400
1600
18001983
1987
1991
1995
1999
2003
2007
2011
2015
2019
2023
2027
2031
2035
2039
2043
2047
2051
2055
2059
2063
2067
2071
2075
2079
2083
2087
2091
2095
2099
2103
2107
2111
2115
2119
Year
Millio
ns
of
Do
llars
Future CostsHistorical Costs - 1983 - 2000 (YOE$s)

Figure 3 Proportional Discounting at 7.2%
0
200
400
600
800
1000
1200
1400
1600
1800
1983
1988
1993
1998
2003
2008
2013
2018
2023
2028
2033
2038
2043
2048
2053
2058
2063
2068
2073
2078
2083
2088
2093
2098
2103
2108
2113
2118
Year
Millio
ns
of
Do
llars
Future CostsHistorical Costs - 1983 - 2000 (YOE$s)

Keller 2002Relative,Constant100 years
Cairns 2000Proportional, Hyperbolic, Relative, Constant19 Year Horizon
Settle 2001Proportional100 Years
Myerson 1995Proportional,Exponential25 Years
Henderson 1995Proportional 100 years
Albrecht 1995Relative,Constant 4 years
Green 1994 Cropper 1994Relative 100 Years
Cropper 1992Loewenstein 1992
Shelley 1993
Benzion 1989Constant4 Years
Harvey 1986
Thaler 1981
Kirby 1995Proportional, Exponential29 days
Samuelson 1937Figure 4 Hyperbolic Discounting References


![Armstead Brown Diaries_1941 - Supreme Court · Web view[ARMSTEAD BROWN DIARIES. 1941.] [Inside cover:] Armstead Brown [Title page:] Diary for 1941. Wednesday, January 1, 1941. Clear](https://img.pdfslide.us/doc/110x75/60456e538b686e15b1646a88/armstead-brown-diaries1941-supreme-court-web-view-armstead-brown-diaries-1941.jpg)