Embed Size (px)
Citation preview
Timber Supply Analysis for Powell River Community Forest
POWELL RIVER COMMUNITY FOREST
TIMBER SUPPLY ANALYSIS
IN SUPPORT OF MANAGEMENT PLAN
Prepared for: Attention: Chris Laing
Powell River Community Forest
Prepared by:
Engineering and Resource Group Ltd.
579 Lawrence Avenue Kelowna, BC, V1Y 6L8
October 2015

Timber Supply Analysis for Powell River Community Forest
2 | P a g e
October 2015 Attention: Chris Laing Powell River Community Forest Ltd. 4760 Joyce Ave. Powell River BC, V8A 3B6
Subject: Timber Supply Analysis for Powell River Community Forest Ltd. Please find enclosed the timber supply analysis report in support of Powell River Community Forest 2015 timber supply review (TSR). Please do not hesitate to call with any questions. Yours Truly, Kelly Sherman, RPF Resource Analyst
Ecora Resource Group Ltd. 579 Lawrence Avenue Kelowna, BC, V1Y 6L8 Ph: 250.469.9757 Cell: 250.718.9532

Timber Supply Analysis for Powell River Community Forest
EXECUTIVE SUMMARY The Powell River Community Forest (PRCF) is undertaking a timber supply analysis to support their management plan in accordance with section 6 of the Community Forest Agreement. The community forest (CF) holder is required to propose an annual allowable cut (AAC) for the CF using a timber supply analysis that considers existing inventories, silviculture practices, current management, forest health and non-timber resources. Ecora Resource Group Ltd. (Ecora) has been contracted to carry out the timber supply analysis. This analysis considers the most recent timber supply review (TSR) assumptions in the Sunshine Coast Timber Supply Area (TSA) (MFLNRO, 2011), with updates to include CF- specific information or assumptions. The analysis procedure involves the following steps:
1. Collate all the necessary data layers required for the analysis; 2. Run an initial netdown to determine the timber harvestable land base (THLB),
and review with the PRCF to include localized knowledge; 3. Assemble analysis unit groupings and growth and yield information; 4. Create an analysis database that incorporates all necessary netdown, inventory
and resource information; 5. Create FPS-Atlas analysis files; 6. Run some base analysis scenarios to select an appropriate harvest level; 7. Run a series of sensitivity analyses; and 8. Provide an analysis report and pseudo information package documenting the
analysis assumptions and results. This determines the productive forest, which is the area included in the analysis, and the THLB, which is the area considered for harvest. Under these assumptions, the THLB is calculated at 5,579 ha and can sustain a harvest level of 44,500 m3/year as shown in Figure 1.
Figure 1: Harvest Level and Timber Availability
0
50,000
100,000
150,000
200,000
250,000
300,000
Stan
din
g V
olu
me
(m
3)
Basecase Harvest Level Growing Stock

Timber Supply Analysis for Powell River Community Forest
4 | P a g e
TABLE OF CONTENTS
1 Introduction ................................................................................................................. 7
2 General Description of the CF..................................................................................... 8
3 Landbase Description ................................................................................................. 9
3.1 Netdown ............................................................................................................ 9 3.2 Forest Characteristics ..................................................................................... 11
3.2.1 Biogeoclimatic Zone ................................................................................. 11 3.2.2 Leading Species ...................................................................................... 12 3.2.3 Site Index ................................................................................................. 12 3.2.4 Age Distribution ........................................................................................ 13
3.3 Resource Management Zones ........................................................................ 13
4 Timber Supply Analysis ............................................................................................ 14
4.1 Basecase Timber Supply ................................................................................ 14 4.2 Sensitivity Analyses ........................................................................................ 17
4.2.1 Reduced Natural Volume ......................................................................... 17 4.2.2 Recreational Tails .................................................................................... 18 4.2.3 Increased Minimum Harvest Age ............................................................. 18 4.2.4 No Genetic Gains ..................................................................................... 19 4.2.5 OGMA Alternative .................................................................................... 20 4.2.6 Managed Productivity ............................................................................... 20 4.2.7 ECA by Sub-basin .................................................................................... 20 4.2.8 Combined Sensitivity ................................................................................ 21
5 References ............................................................................................................... 22
6 Appendix A: Data Sources and Netdown .................................................................. 23
6.1 Data Sources .................................................................................................. 23 6.2 Logging History ............................................................................................... 23 6.3 Netdown Item Descriptions ............................................................................. 24
6.3.1 Gross Area ............................................................................................... 24 6.3.2 Non-Productive, Non-Forest, Non-Commercial Cover .............................. 24 6.3.3 Non-Crown ............................................................................................... 24 6.3.4 Roads, Trails, Landings............................................................................ 25 6.3.5 Low Growing Potential and Problem Forest Types ................................... 25 6.3.6 Cultural Heritage ...................................................................................... 25 6.3.7 Experimental and Permanent Sample Plots ............................................. 25 6.3.8 Unstable Terrain ...................................................................................... 26 6.3.9 Recreation Reserves and Sites ................................................................ 26 6.3.10 Wildlife Habitat Areas ............................................................................... 26 6.3.11 Old Growth Management Areas ............................................................... 26 6.3.12 Environmentally Sensitive Areas .............................................................. 26 6.3.13 Riparian Reserve Zones........................................................................... 26 6.3.14 Inoperable ................................................................................................ 27 6.3.15 Wildlife Tree Patches ............................................................................... 27
7 Appendix B: Growth and Yield .................................................................................. 28

Timber Supply Analysis for Powell River Community Forest
5 | P a g e
7.1 Analysis Unit Aggregation ............................................................................... 28 7.2 Yields .............................................................................................................. 28 7.3 Utilization Level ............................................................................................... 29 7.4 Non-Recoverable Losses ................................................................................ 29 7.5 Minimum Harvest Age ..................................................................................... 30 7.6 Forest Estate Model ........................................................................................ 30
7.6.1 Planning Horizon ...................................................................................... 30 7.6.2 Harvest Systems ...................................................................................... 30 7.6.3 Harvest Priority ........................................................................................ 30
7.7 Disturbing the Non-THLB ................................................................................ 31
8 Appendix C: Resource Management Zones.............................................................. 32
8.1 Community Watersheds .................................................................................. 32 8.2 Equivalent Clearcut Area ................................................................................. 32 8.3 Integrated Resource Management .................................................................. 33 8.4 Landscape Level Biodiversity .......................................................................... 33 8.5 Visually Sensitive Areas .................................................................................. 37
Timber Supply Analysis for Powell River Community Forest
6 | P a g e
TABLE OF FIGURES Figure 2.1: Location of the CF ...................................................................................... 8 Figure 3.1: Netdown Classification ............................................................................. 10 Figure 3.2: Land Base Classification Summary .......................................................... 11 Figure 3.3: BGC Summary ......................................................................................... 11 Figure 3.4: Leading Species Summary ...................................................................... 12 Figure 3.5: Site Index Summary ................................................................................. 12 Figure 3.6: Age Distribution Summary ........................................................................ 13 Figure 4.1: Basecase Harvest Level........................................................................... 14 Figure 4.2: Growing Stock .......................................................................................... 15 Figure 4.3: Average Harvest Area .............................................................................. 15 Figure 4.4: Average Harvest Volume per Hectare ...................................................... 16 Figure 4.5: Average Harvest Age ............................................................................... 16 Figure 4.6: Natural to Managed Transition ................................................................. 17 Figure 4.7: Reduced Natural Volume Impact on Timber Supply ................................. 18 Figure 4.8: Minimum Harvest Age Sensitivity Impact on Timber Supply ..................... 19 Figure 4.9: No Genetic Gains Sensitivity Impact on Timber Supply ............................ 19 Figure 4.10: Managed Productivity Sensitivity Impact on Timber Supply .................. 20 Figure 4.11: ECA by Sub-basin Impact on Timber Supply ........................................ 21 Figure 4.12: Combined Sensitivity Impact on Timber Supply .................................... 21 Figure 8.1: Community Watersheds within the PRCF ................................................ 34 Figure 8.2: Sub-basins within the PRCF .................................................................... 35 Figure 8.3: Seral Zones within the PRCF ................................................................... 36 Figure 8.4: Visually Sensitive Areas within the PRCF ................................................ 38
TABLE OF TABLES Table 3.1: Netdown Classification ............................................................................... 9 Table 3.2: Resource Management Zones Area Summary ......................................... 13 Table 4.1: List of Sensitivity Analyses ....................................................................... 17 Table 6.1: Data Sources ........................................................................................... 23 Table 6.2: Non-Crown Ownership Descriptions......................................................... 24 Table 6.3: Problem Forest Type Criteria ................................................................... 25 Table 7.1: AU Definition ............................................................................................ 28 Table 7.2: Managed Stand Input Assumptions .......................................................... 29 Table 7.3: NRL Estimate ........................................................................................... 29 Table 7.4: Minimum Harvest Age by Analysis Unit .................................................... 30 Table 7.5: Non-THLB Annual Disturbance ................................................................ 31 Table 7.6: Retention Requirements for the Non-THLB .............................................. 31 Table 8.1: ECA Application ....................................................................................... 32 Table 8.2: Old Growth Retention Targets .................................................................. 33 Table 8.3: Maximum Allowable Disturbance % by VQO ............................................ 37

Timber Supply Analysis for Powell River Community Forest
7 | P a g e
1 INTRODUCTION
The Powell River Community Forest (PRCF) is undertaking a timber supply analysis to support their management plan in accordance with section 6 of the Community Forest Agreement. The community forest (CF) holder is required to propose an annual allowable cut (AAC) for the CF using a timber supply analysis that considers existing inventories, silviculture practices, current management, forest health and non-timber resources. Ecora Resource Group Ltd. (Ecora) has been contracted to carry out the timber supply analysis. This analysis considers the most recent timber supply review (TSR) assumptions in the Sunshine Coast Timber Supply Area (TSA) (MFLNRO, 2011), with updates to include CF- specific information or assumptions. The analysis procedure involves:
1. Confirming the CF boundary; 2. Collate all the necessary data layers required for the analysis; 3. Run an initial netdown to determine the timber harvestable land base (THLB) and
review with the PRCF to include localized knowledge; 4. Assemble PRCF-specific analysis unit groupings and growth and yield
information; 5. Create an analysis database that incorporates all necessary netdown, inventory
and resource information; 6. Create FPS-Atlas analysis files; 7. Run some base analysis scenarios to select an appropriate harvest level; 8. Run a series of sensitivity analyses; and 9. Provide an analysis report and pseudo information package documenting the
analysis assumptions and results. This report presents the results of this analysis in a format similar to that of a TSR and has an abbreviated information package as an appendix.

Timber Supply Analysis for Powell River Community Forest
8 | P a g e
2 GENERAL DESCRIPTION OF THE CF
The PRCF (K3G) lies in close vicinity to the community of Powell River within the Sunshine Coast TSA as shown in Figure 2.1. The CF is northeast of the community and bound by Duck Lake Protected Area and Haslam Lake.
Figure 2.1: Location of the CF
Timber Supply Analysis for Powell River Community Forest
9 | P a g e
3 LANDBASE DESCRIPTION
3.1 Netdown
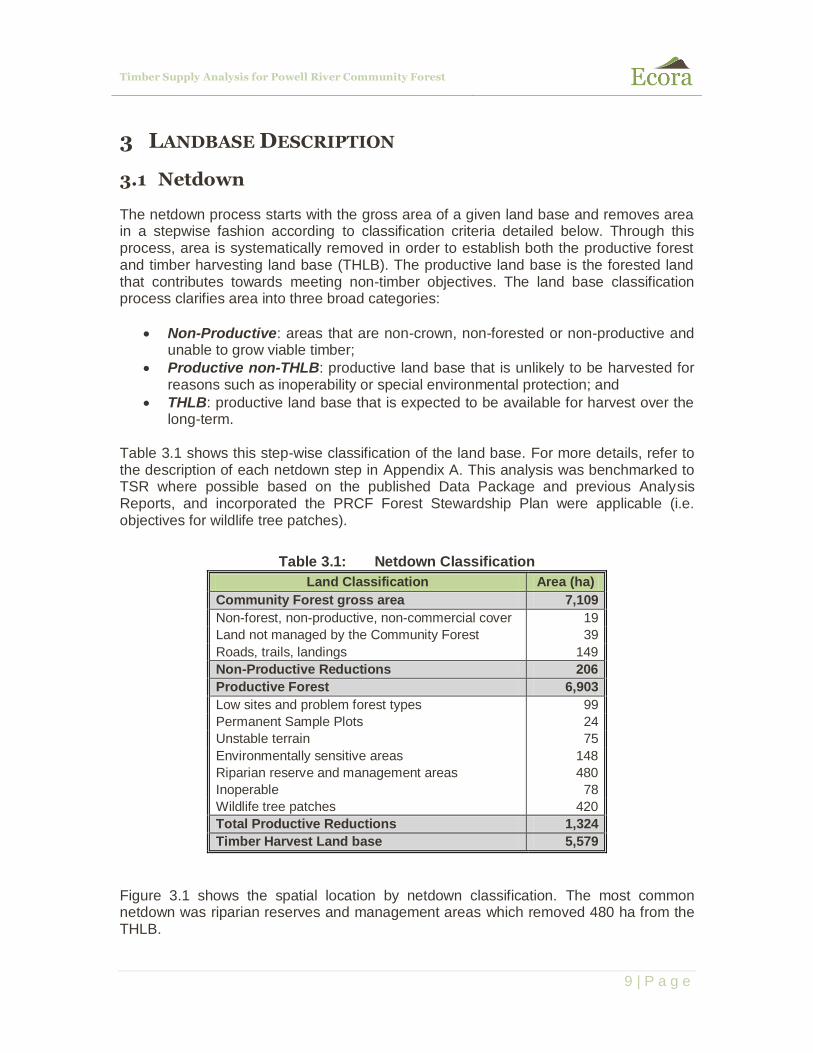
The netdown process starts with the gross area of a given land base and removes area in a stepwise fashion according to classification criteria detailed below. Through this process, area is systematically removed in order to establish both the productive forest and timber harvesting land base (THLB). The productive land base is the forested land that contributes towards meeting non-timber objectives. The land base classification process clarifies area into three broad categories:
Non-Productive: areas that are non-crown, non-forested or non-productive and unable to grow viable timber;
Productive non-THLB: productive land base that is unlikely to be harvested for reasons such as inoperability or special environmental protection; and
THLB: productive land base that is expected to be available for harvest over the long-term.
Table 3.1 shows this step-wise classification of the land base. For more details, refer to the description of each netdown step in Appendix A. This analysis was benchmarked to TSR where possible based on the published Data Package and previous Analysis Reports, and incorporated the PRCF Forest Stewardship Plan were applicable (i.e. objectives for wildlife tree patches).
Table 3.1: Netdown Classification
Land Classification Area (ha)
Community Forest gross area 7,109
Non-forest, non-productive, non-commercial cover 19
Land not managed by the Community Forest 39
Roads, trails, landings 149
Non-Productive Reductions 206
Productive Forest 6,903
Low sites and problem forest types 99
Permanent Sample Plots 24
Unstable terrain 75
Environmentally sensitive areas 148
Riparian reserve and management areas 480
Inoperable 78
Wildlife tree patches 420
Total Productive Reductions 1,324
Timber Harvest Land base 5,579
Figure 3.1 shows the spatial location by netdown classification. The most common netdown was riparian reserves and management areas which removed 480 ha from the THLB.

Timber Supply Analysis for Powell River Community Forest
10 | P a g e
Figure 3.1: Netdown Classification
Figure 3.2 shows a graphical representation of the total area by THLB, non-THLB and non-productive. The THLB of 5,579 ha occupies 78% of the land base.

Timber Supply Analysis for Powell River Community Forest
11 | P a g e
Figure 3.2: Land Base Classification Summary
3.2 Forest Characteristics
This section summarizes important forest characteristics on the CF. The following characteristics are summarized:
Biogeoclimatic zone (BGC);
Leading species;
Site index; and
Age distribution.
3.2.1 Biogeoclimatic Zone
Figure 3.3 shows the THLB and non-THLB productive area in each BGC zone in the CF. The most common BGC zone with 65% of the THLB is CWHdm.
Figure 3.3: BGC Summary
78%
19%
3%
THLB Productive non-THLB Non-productive
-
500
1,000
1,500
2,000
2,500
3,000
3,500
4,000
CWHxm1 CWHvm2 MHmm1 CWHdm
Are
a (h
a)
BEC Zone
THLB non-THLB

Timber Supply Analysis for Powell River Community Forest
12 | P a g e
3.2.2 Leading Species
Figure 3.4 shows the area by leading species in the CF. The THLB is approximately 46% Douglas-fir leading and 30% hemlock leading.
Figure 3.4: Leading Species Summary
3.2.3 Site Index
Figure 3.5 shows the area by site index class (inventory site index rounded to the nearest 3 m) in the CF. The area-weighted average inventory site index is approximately 29.2 m.
Figure 3.5: Site Index Summary
-
500
1,000
1,500
2,000
2,500
3,000
Are
a (h
a)
Leading Species
THLB non-THLB
-
200
400
600
800
1,000
1,200
6 9 12 15 18 21 24 27 30 33 36 39 42 45 51
Are
a (h
a)
Inventory Site Index
THLB non-THLB
Timber Supply Analysis for Powell River Community Forest
13 | P a g e
3.2.4 Age Distribution
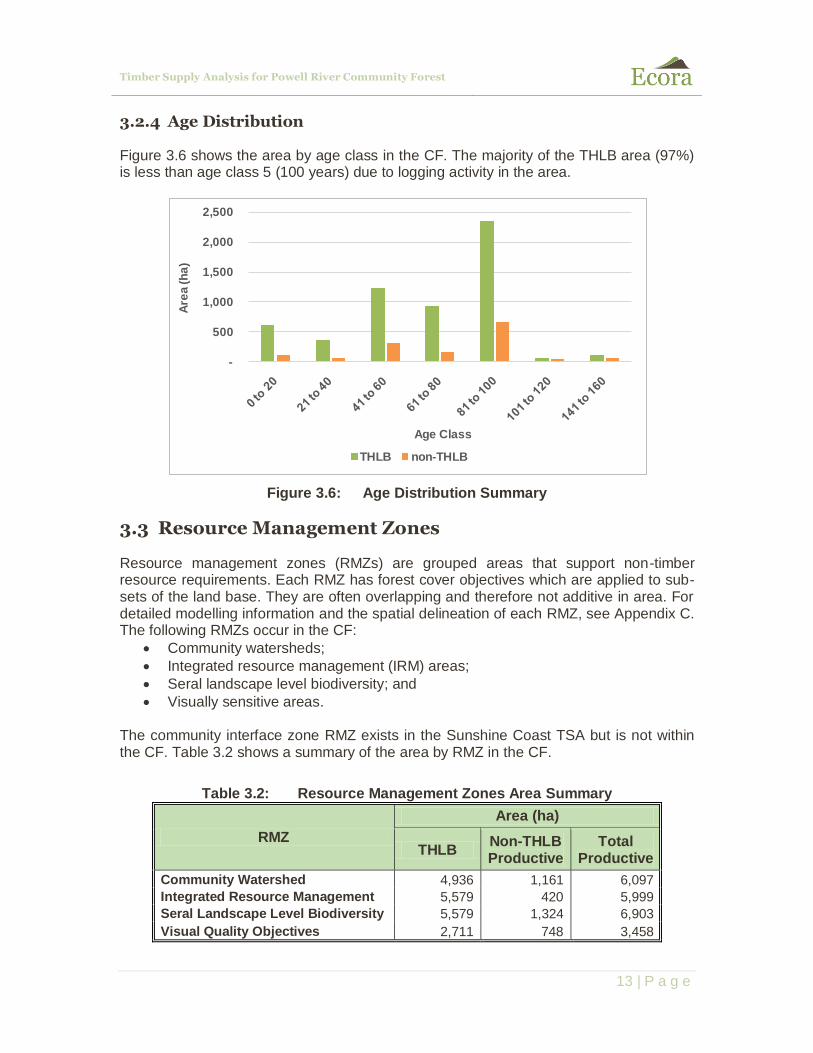
Figure 3.6 shows the area by age class in the CF. The majority of the THLB area (97%) is less than age class 5 (100 years) due to logging activity in the area.
Figure 3.6: Age Distribution Summary
3.3 Resource Management Zones
Resource management zones (RMZs) are grouped areas that support non-timber resource requirements. Each RMZ has forest cover objectives which are applied to sub-sets of the land base. They are often overlapping and therefore not additive in area. For detailed modelling information and the spatial delineation of each RMZ, see Appendix C. The following RMZs occur in the CF:
Community watersheds;
Integrated resource management (IRM) areas;
Seral landscape level biodiversity; and
Visually sensitive areas. The community interface zone RMZ exists in the Sunshine Coast TSA but is not within the CF. Table 3.2 shows a summary of the area by RMZ in the CF.
Table 3.2: Resource Management Zones Area Summary
RMZ
Area (ha)
THLB Non-THLB Productive
Total Productive
Community Watershed 4,936 1,161 6,097
Integrated Resource Management 5,579 420 5,999
Seral Landscape Level Biodiversity 5,579 1,324 6,903
Visual Quality Objectives 2,711 748 3,458
-
500
1,000
1,500
2,000
2,500
Are
a (h
a)
Age Class
THLB non-THLB
Timber Supply Analysis for Powell River Community Forest
14 | P a g e
4 TIMBER SUPPLY ANALYSIS
4.1 Basecase Timber Supply
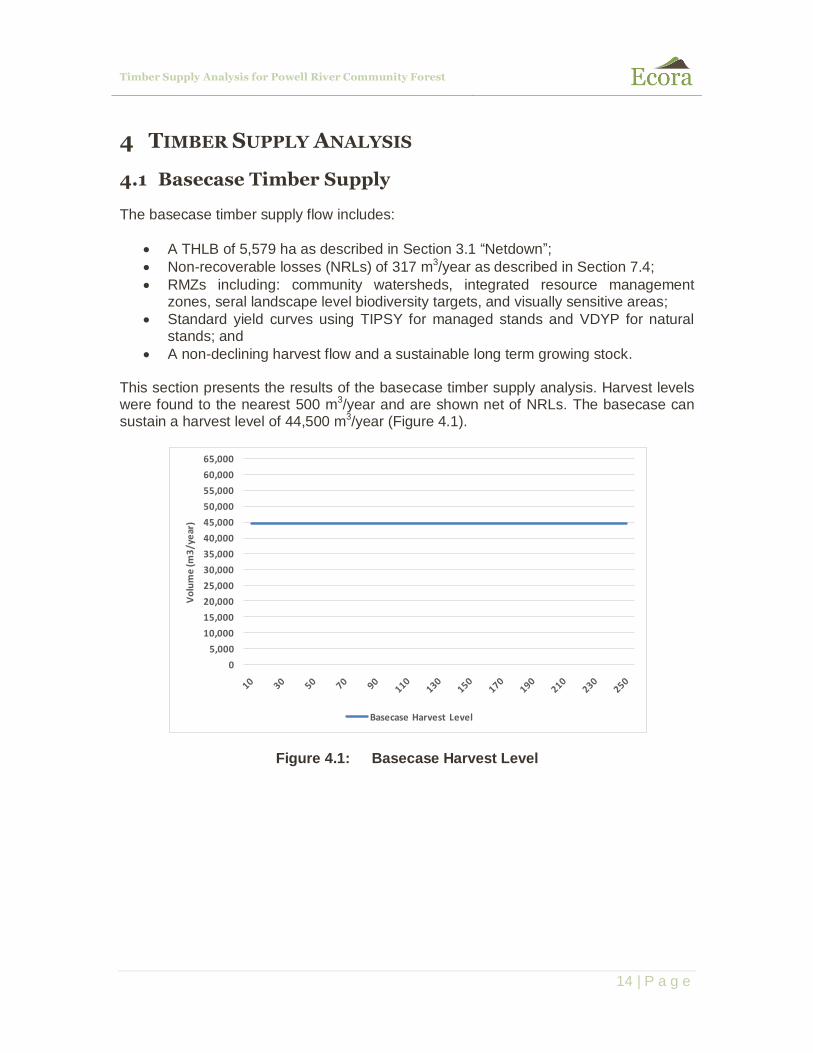
The basecase timber supply flow includes:
A THLB of 5,579 ha as described in Section 3.1 “Netdown”;
Non-recoverable losses (NRLs) of 317 m3/year as described in Section 7.4;
RMZs including: community watersheds, integrated resource management zones, seral landscape level biodiversity targets, and visually sensitive areas;
Standard yield curves using TIPSY for managed stands and VDYP for natural stands; and
A non-declining harvest flow and a sustainable long term growing stock. This section presents the results of the basecase timber supply analysis. Harvest levels were found to the nearest 500 m3/year and are shown net of NRLs. The basecase can sustain a harvest level of 44,500 m3/year (Figure 4.1).
Figure 4.1: Basecase Harvest Level
0
5,000
10,000
15,000
20,000
25,000
30,000
35,000
40,000
45,000
50,000
55,000
60,000
65,000
Vo
lum
e (m
3/y
ear
)
Basecase Harvest Level
Timber Supply Analysis for Powell River Community Forest
15 | P a g e
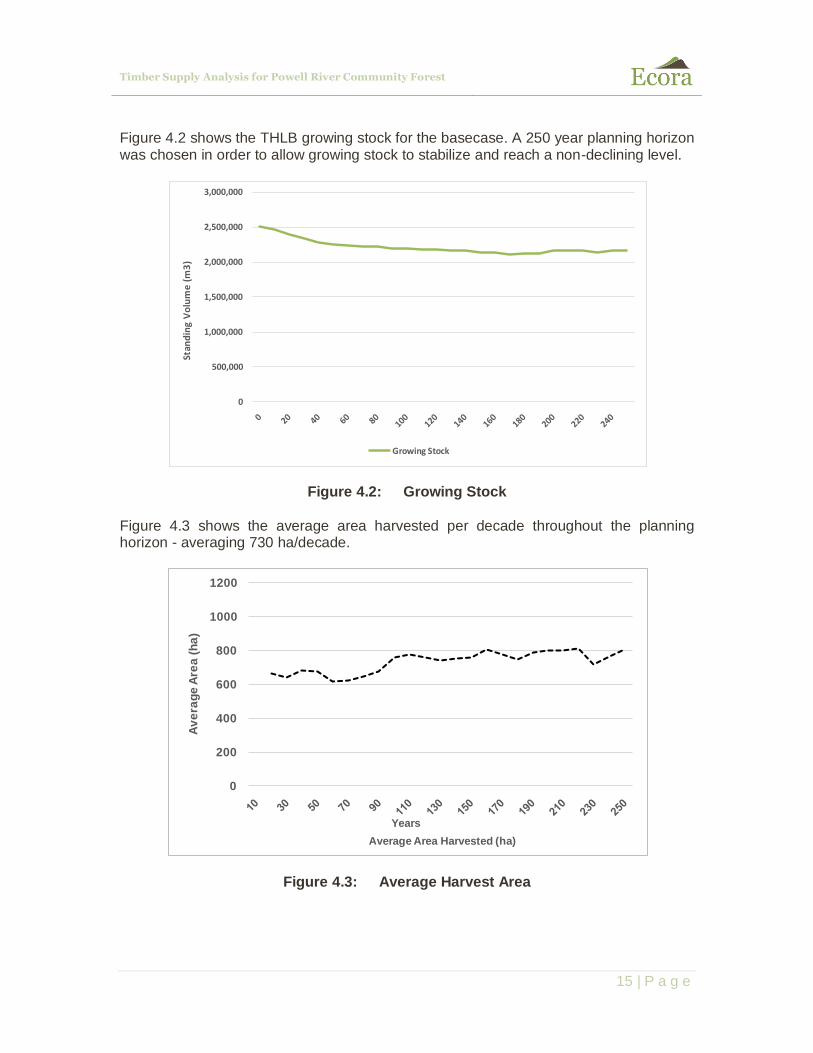
Figure 4.2 shows the THLB growing stock for the basecase. A 250 year planning horizon was chosen in order to allow growing stock to stabilize and reach a non-declining level.
Figure 4.2: Growing Stock
Figure 4.3 shows the average area harvested per decade throughout the planning horizon - averaging 730 ha/decade.
Figure 4.3: Average Harvest Area
0
500,000
1,000,000
1,500,000
2,000,000
2,500,000
3,000,000St
and
ing
Vo
lum
e (
m3
)
Growing Stock
0
200
400
600
800
1000
1200
Av
era
ge
Are
a (
ha
)
Years
Average Area Harvested (ha)
Timber Supply Analysis for Powell River Community Forest
16 | P a g e
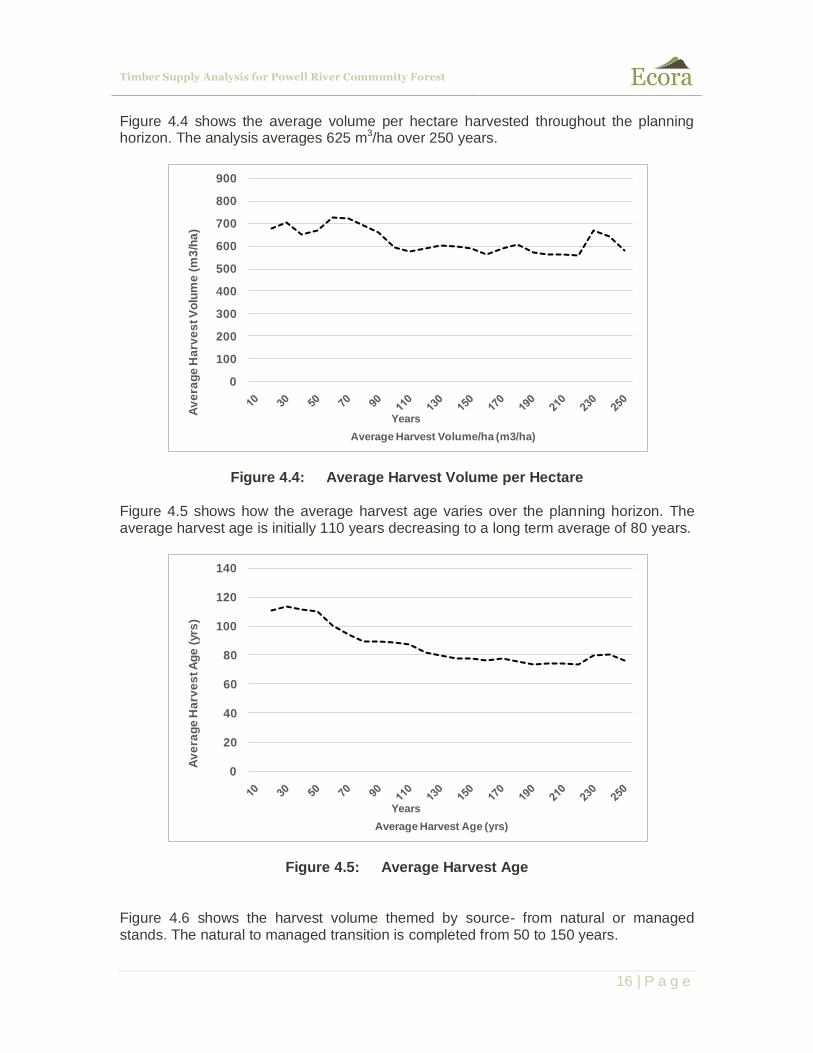
Figure 4.4 shows the average volume per hectare harvested throughout the planning horizon. The analysis averages 625 m3/ha over 250 years.
Figure 4.4: Average Harvest Volume per Hectare Figure 4.5 shows how the average harvest age varies over the planning horizon. The average harvest age is initially 110 years decreasing to a long term average of 80 years.
Figure 4.5: Average Harvest Age Figure 4.6 shows the harvest volume themed by source- from natural or managed stands. The natural to managed transition is completed from 50 to 150 years.
0
100
200
300
400
500
600
700
800
900
Av
era
ge
Ha
rve
st V
olu
me
(m
3/h
a)
Years
Average Harvest Volume/ha (m3/ha)
0
20
40
60
80
100
120
140
Av
era
ge
Ha
rve
st A
ge
(yrs
)
Years
Average Harvest Age (yrs)
Timber Supply Analysis for Powell River Community Forest
17 | P a g e
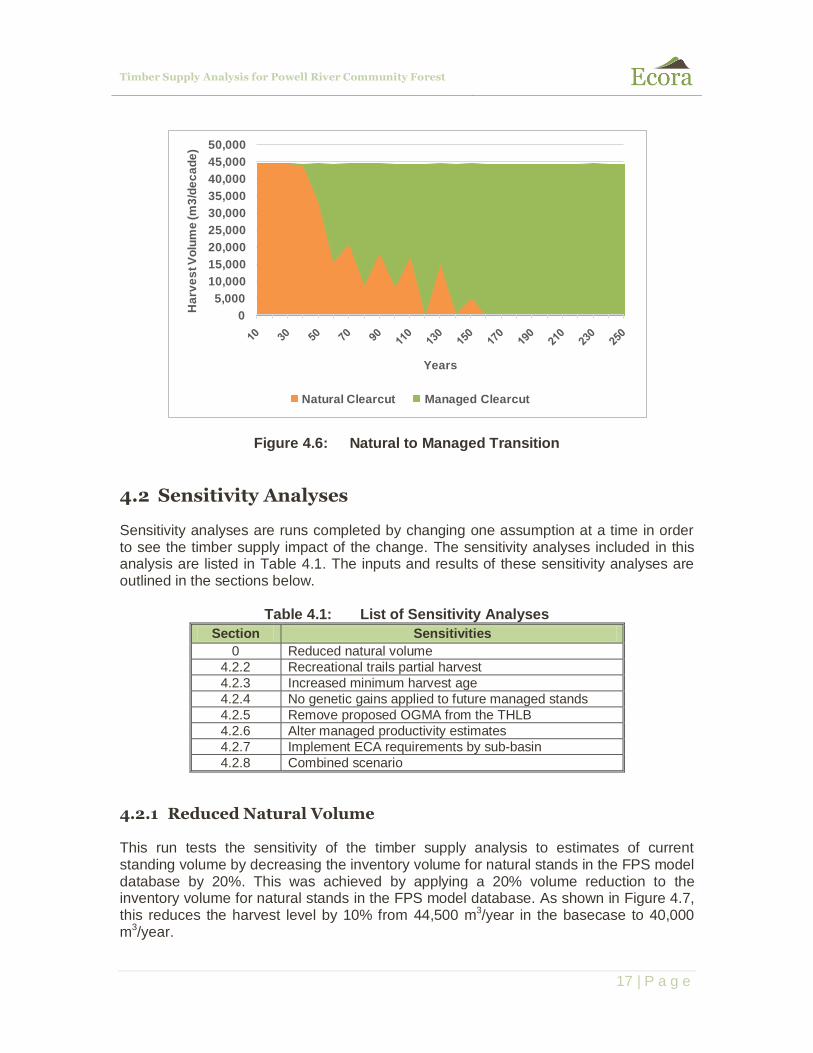
Figure 4.6: Natural to Managed Transition
4.2 Sensitivity Analyses
Sensitivity analyses are runs completed by changing one assumption at a time in order to see the timber supply impact of the change. The sensitivity analyses included in this analysis are listed in Table 4.1. The inputs and results of these sensitivity analyses are outlined in the sections below.
Table 4.1: List of Sensitivity Analyses
Section Sensitivities
0 Reduced natural volume
4.2.2 Recreational trails partial harvest
4.2.3 Increased minimum harvest age
4.2.4 No genetic gains applied to future managed stands
4.2.5 Remove proposed OGMA from the THLB
4.2.6 Alter managed productivity estimates
4.2.7 Implement ECA requirements by sub-basin
4.2.8 Combined scenario
4.2.1 Reduced Natural Volume
This run tests the sensitivity of the timber supply analysis to estimates of current standing volume by decreasing the inventory volume for natural stands in the FPS model database by 20%. This was achieved by applying a 20% volume reduction to the inventory volume for natural stands in the FPS model database. As shown in Figure 4.7, this reduces the harvest level by 10% from 44,500 m3/year in the basecase to 40,000 m3/year.
0
5,000
10,000
15,000
20,000
25,000
30,000
35,000
40,000
45,000
50,000
Ha
rve
st V
olu
me
(m
3/d
ec
ad
e)
Years
Natural Clearcut Managed Clearcut
Timber Supply Analysis for Powell River Community Forest
18 | P a g e
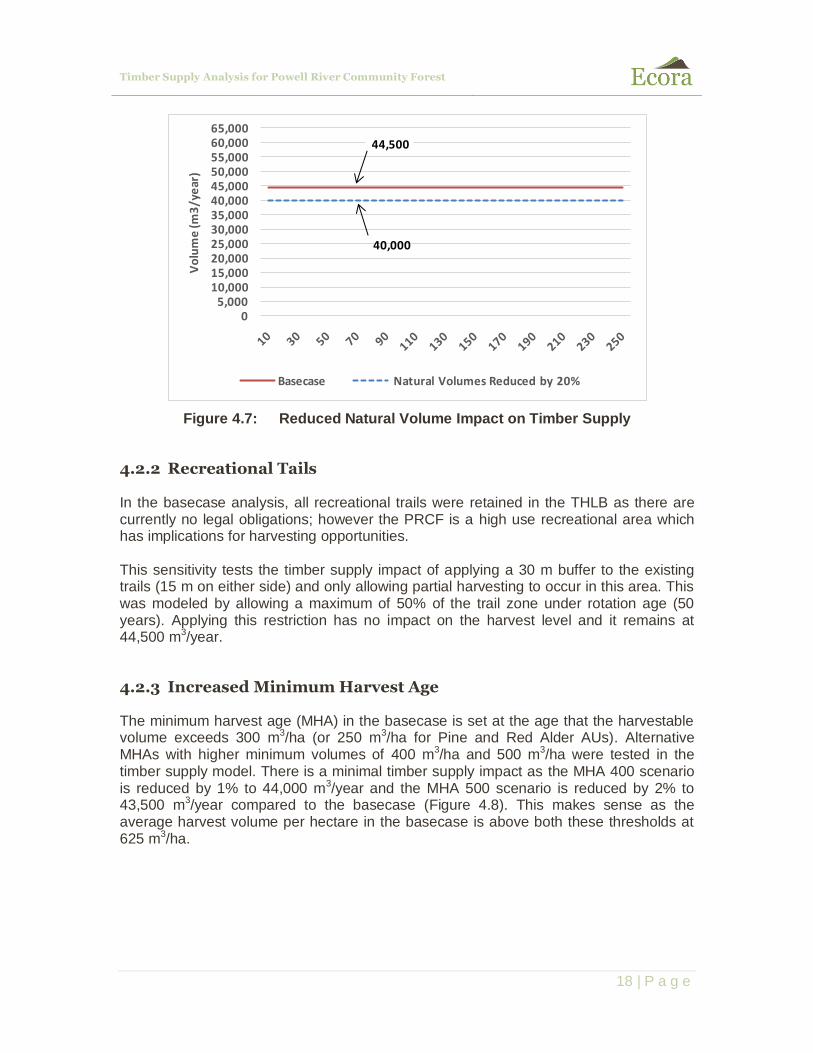
Figure 4.7: Reduced Natural Volume Impact on Timber Supply
4.2.2 Recreational Tails
In the basecase analysis, all recreational trails were retained in the THLB as there are currently no legal obligations; however the PRCF is a high use recreational area which has implications for harvesting opportunities. This sensitivity tests the timber supply impact of applying a 30 m buffer to the existing trails (15 m on either side) and only allowing partial harvesting to occur in this area. This was modeled by allowing a maximum of 50% of the trail zone under rotation age (50 years). Applying this restriction has no impact on the harvest level and it remains at 44,500 m3/year.
4.2.3 Increased Minimum Harvest Age
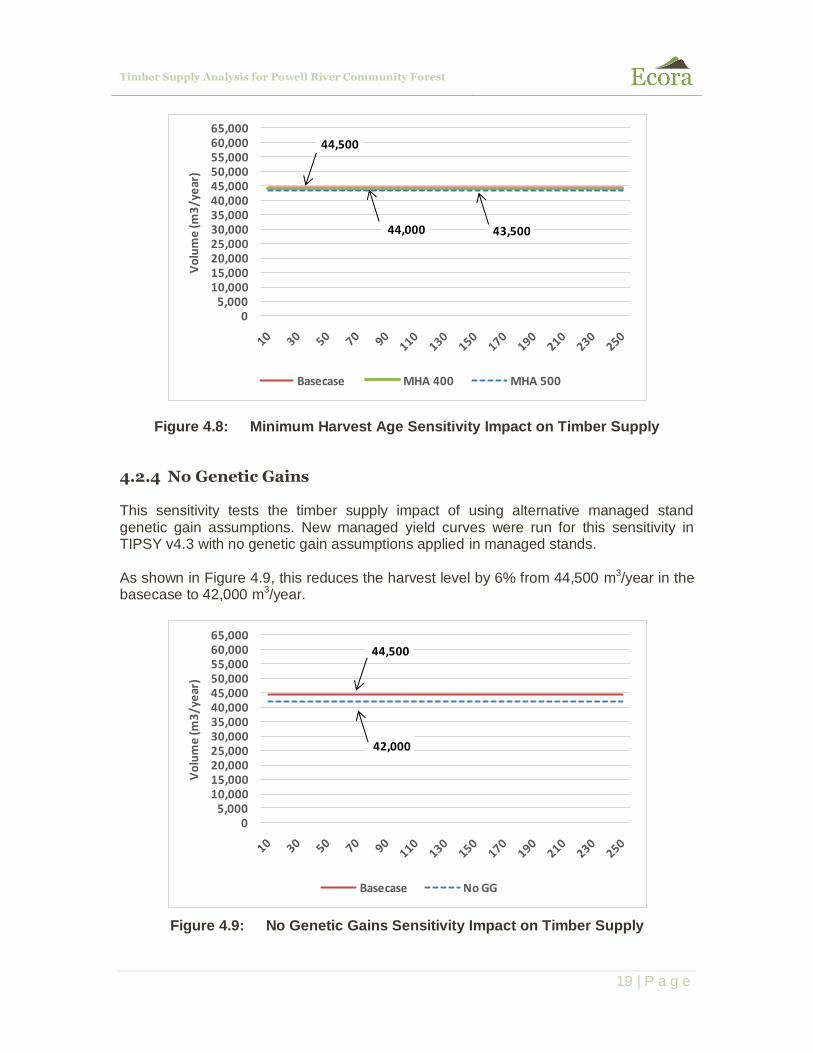
The minimum harvest age (MHA) in the basecase is set at the age that the harvestable volume exceeds 300 m3/ha (or 250 m3/ha for Pine and Red Alder AUs). Alternative MHAs with higher minimum volumes of 400 m3/ha and 500 m3/ha were tested in the timber supply model. There is a minimal timber supply impact as the MHA 400 scenario is reduced by 1% to 44,000 m3/year and the MHA 500 scenario is reduced by 2% to 43,500 m3/year compared to the basecase (Figure 4.8). This makes sense as the average harvest volume per hectare in the basecase is above both these thresholds at 625 m3/ha.
44,500
40,000
05,000
10,00015,00020,00025,00030,00035,00040,00045,00050,00055,00060,00065,000
Vo
lum
e (m
3/y
ear
)
Basecase Natural Volumes Reduced by 20%
Timber Supply Analysis for Powell River Community Forest
19 | P a g e
Figure 4.8: Minimum Harvest Age Sensitivity Impact on Timber Supply
4.2.4 No Genetic Gains
This sensitivity tests the timber supply impact of using alternative managed stand genetic gain assumptions. New managed yield curves were run for this sensitivity in TIPSY v4.3 with no genetic gain assumptions applied in managed stands. As shown in Figure 4.9, this reduces the harvest level by 6% from 44,500 m3/year in the basecase to 42,000 m3/year.
Figure 4.9: No Genetic Gains Sensitivity Impact on Timber Supply
44,500
44,000 43,500
05,000
10,00015,00020,00025,00030,00035,00040,00045,00050,00055,00060,00065,000
Vo
lum
e (m
3/y
ear
)
Basecase MHA 400 MHA 500
44,500
42,000
05,000
10,00015,00020,00025,00030,00035,00040,00045,00050,00055,00060,00065,000
Vo
lum
e (m
3/y
ear
)
Basecase No GG

Timber Supply Analysis for Powell River Community Forest
20 | P a g e
4.2.5 OGMA Alternative
This sensitivity tests the timber supply impact of removing 204 ha of proposed OGMA areas from the THLB. These OGMA removals are assumed to fulfill the old growth retention requirements and therefore the modeled aspatial seral requirements are removed in this sensitivity. There is no harvest level change in this scenario as the basecase harvest level can support the removal of additional OGMA areas.
4.2.6 Managed Productivity
This sensitivity tests the timber supply area of altering managed stand productivity estimates. New managed stand yield curves were run in TIPSY with site index estimates +/- 2 meters those in the basecase. Increasing the managed SI by 2m increases the harvest level by 8% from the basecase to 48,000 m3/year. Decreasing the managed SI by 2m decreases the harvest level by 8% from the basecase to 41,000 m3/year (Figure 4.10).
Figure 4.10: Managed Productivity Sensitivity Impact on Timber Supply
4.2.7 ECA by Sub-basin
This sensitivity tests the timber supply area of applying a maximum Equivalent Clearcut Area (ECA) requirement of 30% to each sub-basin in the CF as described in section 8.2. Once applied these additional requirements decrease the harvest level to 44,000 m3/year from the basecase harvest level of 44,500 m3/year (Figure 4.11).
44,500
41,000
48,000
05,000
10,00015,00020,00025,00030,00035,00040,00045,00050,00055,00060,00065,000
Vo
lum
e (m
3/y
ear
)
Basecase Minus 2m SI Plus 2m SI

Timber Supply Analysis for Powell River Community Forest
21 | P a g e
Figure 4.11: ECA by Sub-basin Impact on Timber Supply
4.2.8 Combined Sensitivity
This sensitivity tests the timber supply impact of a combination of factors:
Natural stand volume reduced by 10%;
Managed site index reduced by 2m; and
Partial harvesting in recreation trail buffers as in section 4.2.2; As shown in Figure 4.12, the combination of these changes results in an 11% decrease from the basecase harvest level of 44,500 m3/year to 39,500 m3/year.
Figure 4.12: Combined Sensitivity Impact on Timber Supply
44,500
44,000
05,000
10,00015,00020,00025,00030,00035,00040,00045,00050,00055,00060,00065,000
Vo
lum
e (m
3/y
ear
)
Basecase ECA
44,500
39,500
05,000
10,00015,00020,00025,00030,00035,00040,00045,00050,00055,00060,00065,000
Vo
lum
e (m
3/y
ear
)
Basecase Combined Scenario
Timber Supply Analysis for Powell River Community Forest
22 | P a g e
5 REFERENCES
MOF. 1995. Biodiversity Guidebook. Forest Practices Code of British Columbia Act. Strategic Planning Regulations Operational Planning Regulation. http://www.for.gov.bc.ca/tasb/legsregs/fpc/fpcguide/biodiv/biotoc.htm MOF. 1998. Factoring Visual Resources into Timber Supply Analyses. March 17, 1998. 12 pp. MOF. 2001. Watershed assessment procedure guidebook. 2nd ed., Version 2.1. Forest Practices Code of British Columbia Guidebook. http://www.for.gov.bc.ca/tasb/legsregs/fpc/fpcguide/iwap/iwap-toc.htm MFLNRO. 2011. Sunshine Coast Timber Supply Area Timber Supply Review Data Package. Updated April 2011. 48pp. Powell River Community Forests Ltd. 2008. Powell River Community Forest Ltd. Forest Stewardship Plan for Community Forest License K3G. Approved December 19, 2008. 27pp.
Timber Supply Analysis for Powell River Community Forest
23 | P a g e
6 APPENDIX A: DATA SOURCES AND NETDOWN
6.1 Data Sources
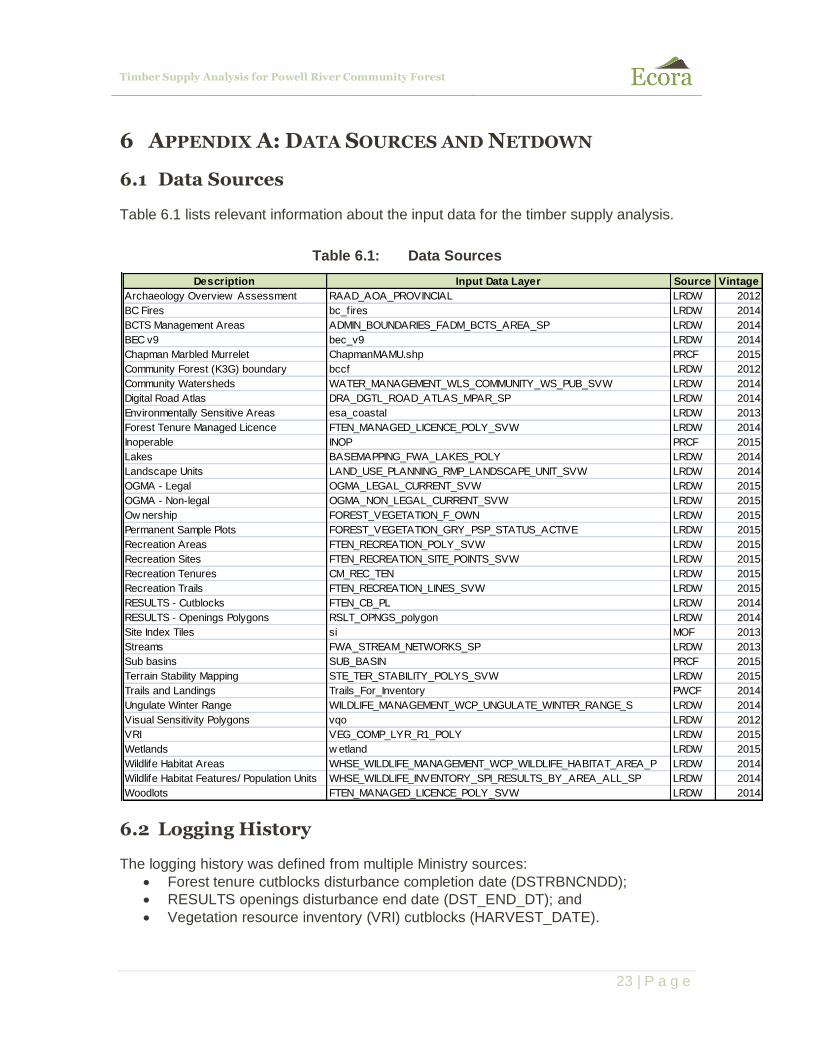
Table 6.1 lists relevant information about the input data for the timber supply analysis.
Table 6.1: Data Sources
6.2 Logging History
The logging history was defined from multiple Ministry sources:
Forest tenure cutblocks disturbance completion date (DSTRBNCNDD);
RESULTS openings disturbance end date (DST_END_DT); and
Vegetation resource inventory (VRI) cutblocks (HARVEST_DATE).
Description Input Data Layer Source Vintage
Archaeology Overview Assessment RAAD_AOA_PROVINCIAL LRDW 2012
BC Fires bc_fires LRDW 2014
BCTS Management Areas ADMIN_BOUNDARIES_FADM_BCTS_AREA_SP LRDW 2014
BEC v9 bec_v9 LRDW 2014
Chapman Marbled Murrelet ChapmanMAMU.shp PRCF 2015
Community Forest (K3G) boundary bccf LRDW 2012
Community Watersheds WATER_MANAGEMENT_WLS_COMMUNITY_WS_PUB_SVW LRDW 2014
Digital Road Atlas DRA_DGTL_ROAD_ATLAS_MPAR_SP LRDW 2014
Environmentally Sensitive Areas esa_coastal LRDW 2013
Forest Tenure Managed Licence FTEN_MANAGED_LICENCE_POLY_SVW LRDW 2014
Inoperable INOP PRCF 2015
Lakes BASEMAPPING_FWA_LAKES_POLY LRDW 2014
Landscape Units LAND_USE_PLANNING_RMP_LANDSCAPE_UNIT_SVW LRDW 2014
OGMA - Legal OGMA_LEGAL_CURRENT_SVW LRDW 2015
OGMA - Non-legal OGMA_NON_LEGAL_CURRENT_SVW LRDW 2015
Ow nership FOREST_VEGETATION_F_OWN LRDW 2015
Permanent Sample Plots FOREST_VEGETATION_GRY_PSP_STATUS_ACTIVE LRDW 2015
Recreation Areas FTEN_RECREATION_POLY_SVW LRDW 2015
Recreation Sites FTEN_RECREATION_SITE_POINTS_SVW LRDW 2015
Recreation Tenures CM_REC_TEN LRDW 2015
Recreation Trails FTEN_RECREATION_LINES_SVW LRDW 2015
RESULTS - Cutblocks FTEN_CB_PL LRDW 2014
RESULTS - Openings Polygons RSLT_OPNGS_polygon LRDW 2014
Site Index Tiles si MOF 2013
Streams FWA_STREAM_NETWORKS_SP LRDW 2013
Sub basins SUB_BASIN PRCF 2015
Terrain Stability Mapping STE_TER_STABILITY_POLYS_SVW LRDW 2015
Trails and Landings Trails_For_Inventory PWCF 2014
Ungulate Winter Range WILDLIFE_MANAGEMENT_WCP_UNGULATE_WINTER_RANGE_S LRDW 2014
Visual Sensitivity Polygons vqo LRDW 2012
VRI VEG_COMP_LYR_R1_POLY LRDW 2015
Wetlands w etland LRDW 2015
Wildlife Habitat Areas WHSE_WILDLIFE_MANAGEMENT_WCP_WILDLIFE_HABITAT_AREA_P LRDW 2014
Wildlife Habitat Features/ Population Units WHSE_WILDLIFE_INVENTORY_SPI_RESULTS_BY_AREA_ALL_SP LRDW 2014
Woodlots FTEN_MANAGED_LICENCE_POLY_SVW LRDW 2014
Timber Supply Analysis for Powell River Community Forest
24 | P a g e
Any stand with a harvest history after 1900 was considered previously harvested. This logging history was also applied as an age update to the inventory in the analysis database if stand age >= 40 years old and the disturbance was recent (since the year 2000).
6.3 Netdown Item Descriptions
6.3.1 Gross Area
The PRCF boundary was identified using a provided community forest boundary layer. This area was confirmed with the Ministry community forest boundary layer (BCCF).
6.3.2 Non-Productive, Non-Forest, Non-Commercial Cover
Non-forest classification reduces the land base by areas that are non-treed such as rock, alpine and water. Non-productive areas reduces the land base by areas that are vegetated but will not sustain trees. These areas were identified using the following criteria from the VRI where there was no logging history:
Non-productive descriptor code (NON_PRODUCTIVE_DESCRIPTOR_CD) not blank; or
BCLCS 1 is non-vegetated („N‟); or
BCLCS 1 is vegetated („V‟) and BCLCS 2 is non-treed („N‟).
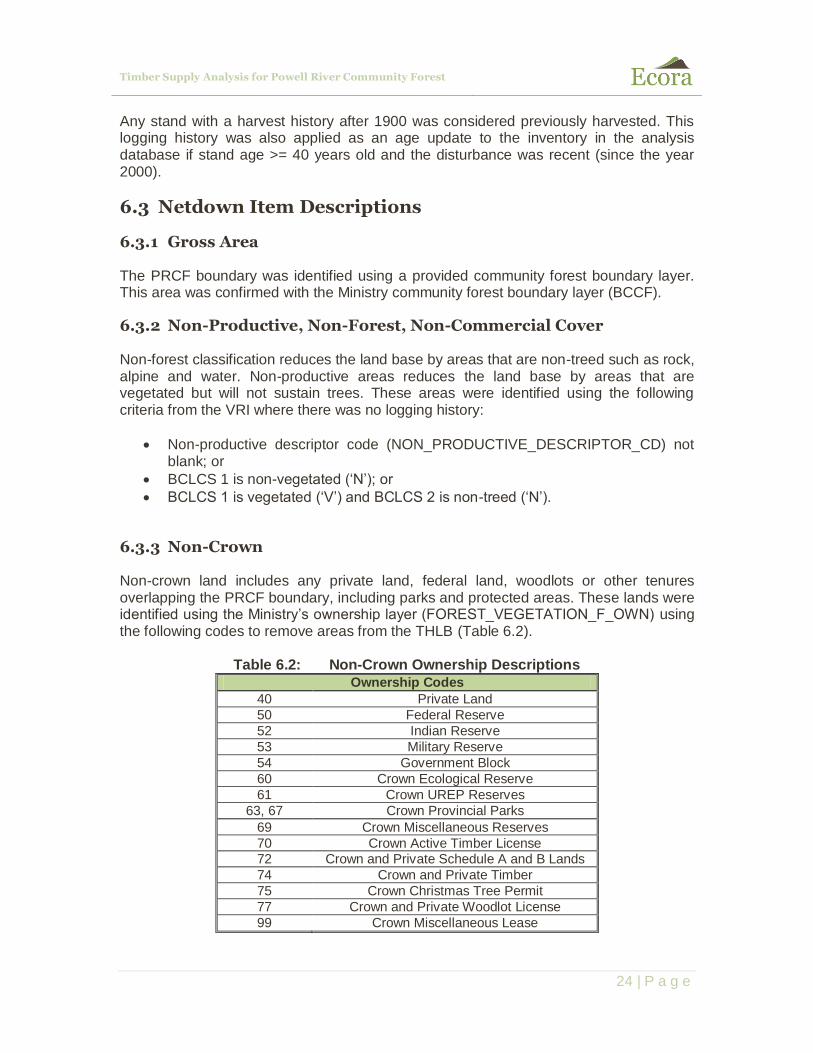
6.3.3 Non-Crown
Non-crown land includes any private land, federal land, woodlots or other tenures overlapping the PRCF boundary, including parks and protected areas. These lands were identified using the Ministry‟s ownership layer (FOREST_VEGETATION_F_OWN) using the following codes to remove areas from the THLB (Table 6.2).
Table 6.2: Non-Crown Ownership Descriptions
Ownership Codes
40 Private Land
50 Federal Reserve
52 Indian Reserve
53 Military Reserve
54 Government Block
60 Crown Ecological Reserve
61 Crown UREP Reserves
63, 67 Crown Provincial Parks
69 Crown Miscellaneous Reserves
70 Crown Active Timber License 72 Crown and Private Schedule A and B Lands
74 Crown and Private Timber
75 Crown Christmas Tree Permit
77 Crown and Private Woodlot License
99 Crown Miscellaneous Lease
Timber Supply Analysis for Powell River Community Forest
25 | P a g e
6.3.4 Roads, Trails, Landings
Existing roads are identified from the Ministry‟s digital road atlas (DRA) database (DRA_DIGITAL_ROAD_ATLAS_LINE_SP). These lines were buffered by 12 m total (6 m on each side) and removed from the THLB.
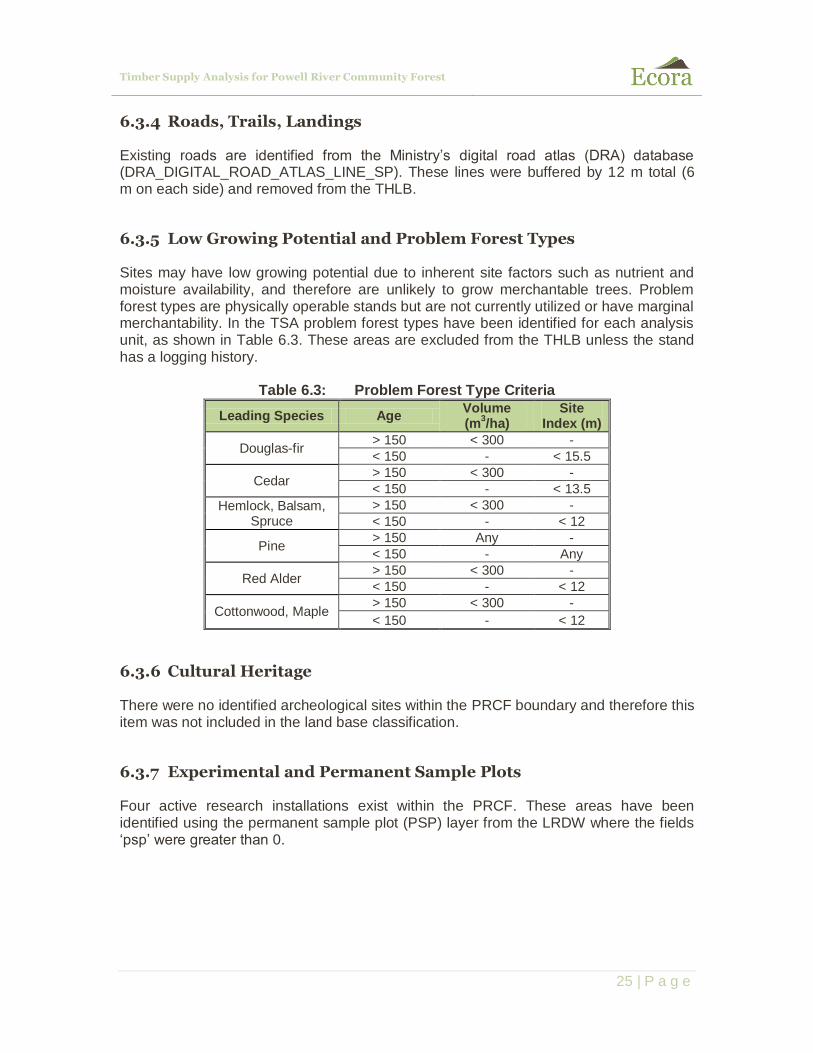
6.3.5 Low Growing Potential and Problem Forest Types
Sites may have low growing potential due to inherent site factors such as nutrient and moisture availability, and therefore are unlikely to grow merchantable trees. Problem forest types are physically operable stands but are not currently utilized or have marginal merchantability. In the TSA problem forest types have been identified for each analysis unit, as shown in Table 6.3. These areas are excluded from the THLB unless the stand has a logging history.
Table 6.3: Problem Forest Type Criteria
Leading Species Age Volume (m
3/ha)
Site Index (m)
Douglas-fir > 150 < 300 -
< 150 - < 15.5
Cedar > 150 < 300 -
< 150 - < 13.5
Hemlock, Balsam, Spruce
> 150 < 300 -
< 150 - < 12
Pine > 150 Any -
< 150 - Any
Red Alder > 150 < 300 -
< 150 - < 12
Cottonwood, Maple > 150 < 300 -
< 150 - < 12
6.3.6 Cultural Heritage
There were no identified archeological sites within the PRCF boundary and therefore this item was not included in the land base classification.
6.3.7 Experimental and Permanent Sample Plots
Four active research installations exist within the PRCF. These areas have been identified using the permanent sample plot (PSP) layer from the LRDW where the fields „psp‟ were greater than 0.
Timber Supply Analysis for Powell River Community Forest
26 | P a g e
6.3.8 Unstable Terrain
Terrain stability mapping provided by PRCF was used in the TSA to identify areas with unstable terrain. Areas with unstable terrain were identified using the code field where class equaled „V‟-H‟ and „V-H+‟.
6.3.9 Recreation Reserves and Sites
There are no identified recreation tenures within the PRCF that have established Government Action Regulation (GAR) orders. There are many recreational trails within
the community forest, however no legal objectives have been established for harvesting in these areas. Recreational trails were identified using the Ministry‟s forest tenure recreation linear layer (FTEN_RECREATION_LINES_SVW) using “forest_file_id”. These areas were retained in the THLB but identified for potential removal as a sensitivity analysis.
6.3.10 Wildlife Habitat Areas
Wildlife habitat areas (WHA) were identified using the Ministry of Environment‟s (MOE) approved WHA layer (WCP_WILDLIFE_HABITAT_AREA_POLY). No approved WHAs were located within the PRCF boundary.
6.3.11 Old Growth Management Areas
Permanent OGMAs were identified from the Ministry‟s legal OGMA layer (OGMA_LEG_CURRENT_SVW) and the non-legal OGMA layer (OGMA_NON_LEGAL_CURRENT_SVW). There are currently no legal OGMAs established within the PRCF boundary and therefore no additional area was removed during this stage.
6.3.12 Environmentally Sensitive Areas
Environmentally sensitive areas (ESA) are areas that are susceptible to disturbance. ESA mapping was available for the CF, however the classifications are dated. Where newer information was not available, areas with an ESA value (ESA not equal to blank) were completely removed from the THLB.
6.3.13 Riparian Reserve Zones
Detailed riparian inventories were not available for the TSA. The TSR analysis proceeded without a spatial layer and removed 3% from the productive forest as stream riparian reserves. Where lakes and wetlands had defined feature classes (i.e. „L1‟, „W1‟), buffers were applied according to the Riparian Management Guidebook.
Timber Supply Analysis for Powell River Community Forest
27 | P a g e
In this analysis, all riparian features were identified spatially using the Ministry‟s streams, lakes and wetlands layers (FWA_STREAMS_NETWORKS_SP, FWA_LAKES_POLY, FWA_WETLANDS_POLY), which was buffered by 70 m for streams (35 m on each side) and by 20 m around lakes and wetlands. This was to account for riparian reserve zones and riparian management zones for all riparian features. These areas were completely removed from the THLB.
6.3.14 Inoperable
Inoperable areas include steep slopes, broken topography, difficult road access, soil instability, high elevation, timber quality, and a combination of these. These areas were identified using an operability inventory that was provided by the PRCF.
6.3.15 Wildlife Tree Patches
Wildlife tree patches (WTP) are modelled by reducing the land base available for harvesting to account for trees that must be left standing in these areas. Requirements for WTP can be previously achieved through the establishment of riparian areas, OGMAs, and other reductions to the productive forest. Where Landscape Unit Plans exist, WTP reductions have been specified by BEC zone. For all other areas the Forest Range and Practices Act specifies a default of 7% reduction to the THLB. In the PRCF, no Landscape Unit Plans exist for the Haslam landscape unit, however objectives have been established in the Powell River Community Forest Ltd. Forest Stewardship Plan which require a minimum of 7% WTP retention. .
Timber Supply Analysis for Powell River Community Forest
28 | P a g e
7 APPENDIX B: GROWTH AND YIELD
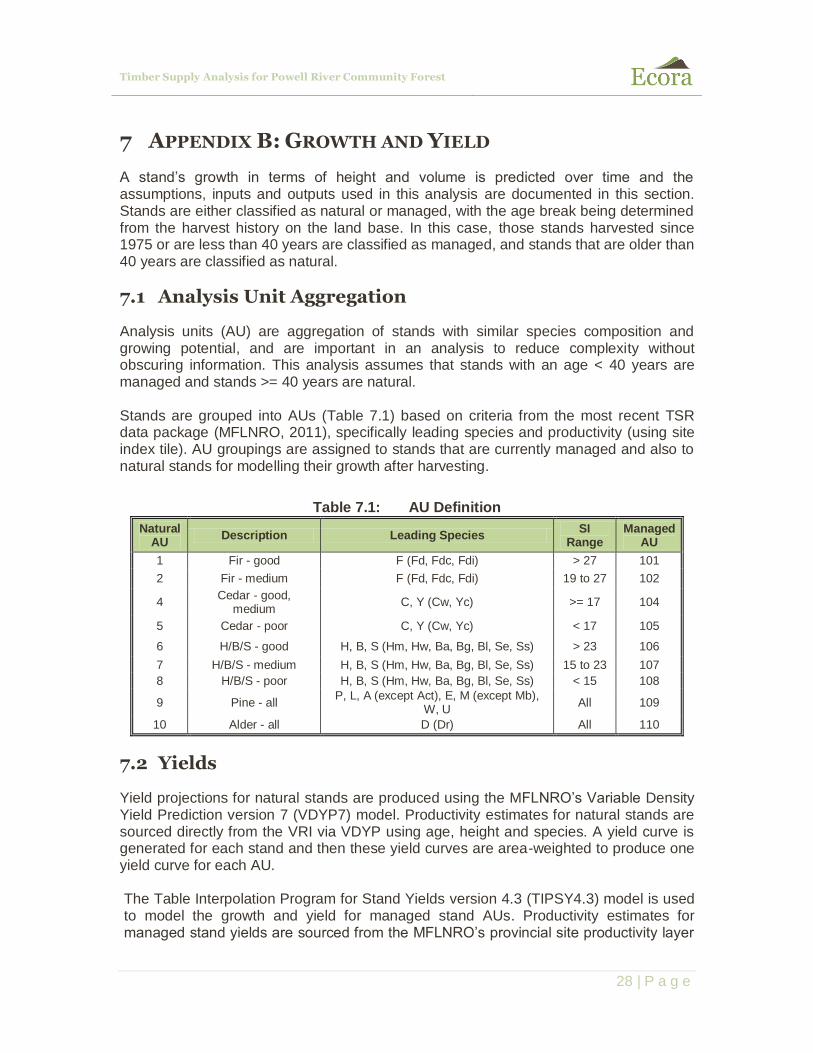
A stand‟s growth in terms of height and volume is predicted over time and the assumptions, inputs and outputs used in this analysis are documented in this section. Stands are either classified as natural or managed, with the age break being determined from the harvest history on the land base. In this case, those stands harvested since 1975 or are less than 40 years are classified as managed, and stands that are older than 40 years are classified as natural.
7.1 Analysis Unit Aggregation
Analysis units (AU) are aggregation of stands with similar species composition and growing potential, and are important in an analysis to reduce complexity without obscuring information. This analysis assumes that stands with an age < 40 years are managed and stands >= 40 years are natural. Stands are grouped into AUs (Table 7.1) based on criteria from the most recent TSR data package (MFLNRO, 2011), specifically leading species and productivity (using site index tile). AU groupings are assigned to stands that are currently managed and also to natural stands for modelling their growth after harvesting.
Table 7.1: AU Definition
Natural AU
Description Leading Species SI
Range Managed
AU
1 Fir - good F (Fd, Fdc, Fdi) > 27 101
2 Fir - medium F (Fd, Fdc, Fdi) 19 to 27 102
4 Cedar - good,
medium C, Y (Cw, Yc) >= 17 104
5 Cedar - poor C, Y (Cw, Yc) < 17 105
6 H/B/S - good H, B, S (Hm, Hw, Ba, Bg, Bl, Se, Ss) > 23 106
7 H/B/S - medium H, B, S (Hm, Hw, Ba, Bg, Bl, Se, Ss) 15 to 23 107
8 H/B/S - poor H, B, S (Hm, Hw, Ba, Bg, Bl, Se, Ss) < 15 108
9 Pine - all P, L, A (except Act), E, M (except Mb),
W, U All 109
10 Alder - all D (Dr) All 110
7.2 Yields
Yield projections for natural stands are produced using the MFLNRO‟s Variable Density Yield Prediction version 7 (VDYP7) model. Productivity estimates for natural stands are sourced directly from the VRI via VDYP using age, height and species. A yield curve is generated for each stand and then these yield curves are area-weighted to produce one yield curve for each AU. The Table Interpolation Program for Stand Yields version 4.3 (TIPSY4.3) model is used to model the growth and yield for managed stand AUs. Productivity estimates for managed stand yields are sourced from the MFLNRO‟s provincial site productivity layer

Timber Supply Analysis for Powell River Community Forest
29 | P a g e
version 2. For more information on this layer, see the MFLNRO website at: http://www.for.gov.bc.ca/hts/siteprod/provlayer.html.
Management practices such as species and planting densities are assigned using a combination of past practice and a review of current practice. Genetic gains through tree improvement are implemented in the TSA with Class A seeds used for cedar and Douglas-fir stands. Table 7.2 shows the managed stand assumptions by AU.
Table 7.2: Managed Stand Input Assumptions
AU Description SI Sp1 Sp1% Sp1 GG
Sp2 Sp2% Sp2 GG
Sp3 Sp3% Sp3 GG
Planted/ Natural
Prop Density Regen Delay
OAF1 OAF2
101 Fir - good 34.2 Fd 90 14.0 Cw 10 13.0
P 100 1,200 1.5 15 12*
102 Fir - medium 25.6 Fd 80 14.0 Cw 20 13.0
P 100 1,200 1.5 15 12*
104 Cedar - good,
medium 26.8 Cw 60 13.0 Fd 40 14.0
P 100 1,200 1.5 15 5
105 Cedar - poor 13.5 Fd 50 14.0 Cw 50 13.0
P 60 1,200 1.5 15 5
106 H/B/S - good 28.2 Ba 50 1.0 Yc 50
P 50 1,200 1.5 15 5
107 H/B/S - medium 20.3 Ba 50 1.0 Yc 50
P 50 1,200 1.5 15 5
108 H/B/S - poor 12.0 Ba 50 1.0 Yc 50
P 50 1,200 1.5 15 5
109 Pine - all 19.6 Pl 100
N 100 1,200 1.5 15 5
110 Alder - all 23.4 Dr 90
Fd 5 14.0 Cw 5 13.0 P 100 1,600 1.5 15 5
*OAF2 contains allowance for losses due to laminated root rot
7.3 Utilization Level
Utilization levels define the minimum diameter at breast height (DBH) for a stand to be selected for harvesting. In TSR, utilization levels are based on leading species:
All coniferous species: minimum DBH (cm) of 12.5; and
All deciduous species: minimum DBH (cm) of 17.5.
7.4 Non-Recoverable Losses
The calculation of NRLs used the TSR TSA-level estimates and pro-rated them for land base area. The PRCF has a THLB of 5,579 ha which is approximately 3% of the TSA THLB. Calculations to find the NRL estimate of 317 m3/year are shown below in Table 7.3.
Table 7.3: NRL Estimate
Land Base THLB Area
% of TSA
m3/year
Wind Fire
Forest Health Mammal/ Abiotic Damage
Other Abiotic Damage
Total Beetles
Sawfly, Looper
Balsam Wooly
Adelgid
Sunshine Coast TSA 222,894 100% 6,900 500 250 1,000 200 300 3,500 12,650
Powell River CF 5,579 3% 173 13 6 25 5 8 88 317
Timber Supply Analysis for Powell River Community Forest
30 | P a g e
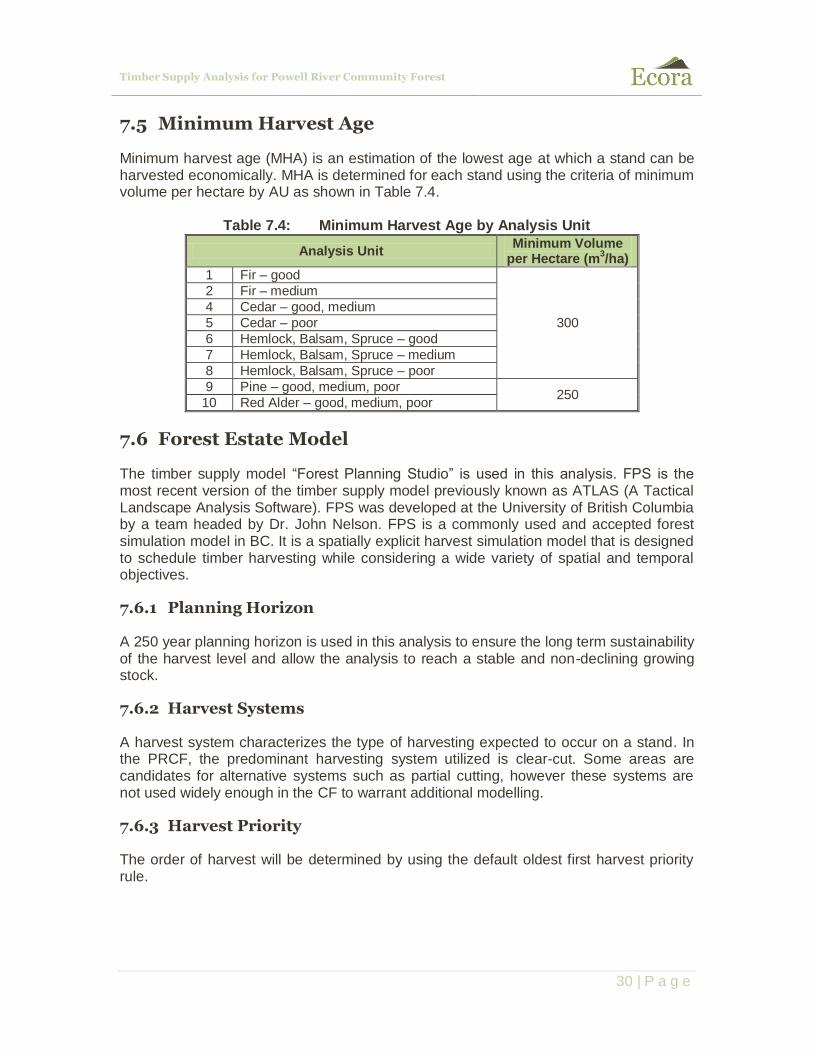
7.5 Minimum Harvest Age
Minimum harvest age (MHA) is an estimation of the lowest age at which a stand can be harvested economically. MHA is determined for each stand using the criteria of minimum volume per hectare by AU as shown in Table 7.4.
Table 7.4: Minimum Harvest Age by Analysis Unit
Analysis Unit Minimum Volume
per Hectare (m3/ha)
1 Fir – good
300
2 Fir – medium
4 Cedar – good, medium
5 Cedar – poor
6 Hemlock, Balsam, Spruce – good
7 Hemlock, Balsam, Spruce – medium
8 Hemlock, Balsam, Spruce – poor
9 Pine – good, medium, poor 250
10 Red Alder – good, medium, poor
7.6 Forest Estate Model
The timber supply model “Forest Planning Studio” is used in this analysis. FPS is the most recent version of the timber supply model previously known as ATLAS (A Tactical Landscape Analysis Software). FPS was developed at the University of British Columbia by a team headed by Dr. John Nelson. FPS is a commonly used and accepted forest simulation model in BC. It is a spatially explicit harvest simulation model that is designed to schedule timber harvesting while considering a wide variety of spatial and temporal objectives.
7.6.1 Planning Horizon
A 250 year planning horizon is used in this analysis to ensure the long term sustainability of the harvest level and allow the analysis to reach a stable and non-declining growing stock.
7.6.2 Harvest Systems
A harvest system characterizes the type of harvesting expected to occur on a stand. In the PRCF, the predominant harvesting system utilized is clear-cut. Some areas are candidates for alternative systems such as partial cutting, however these systems are not used widely enough in the CF to warrant additional modelling.
7.6.3 Harvest Priority
The order of harvest will be determined by using the default oldest first harvest priority rule.
Timber Supply Analysis for Powell River Community Forest
31 | P a g e
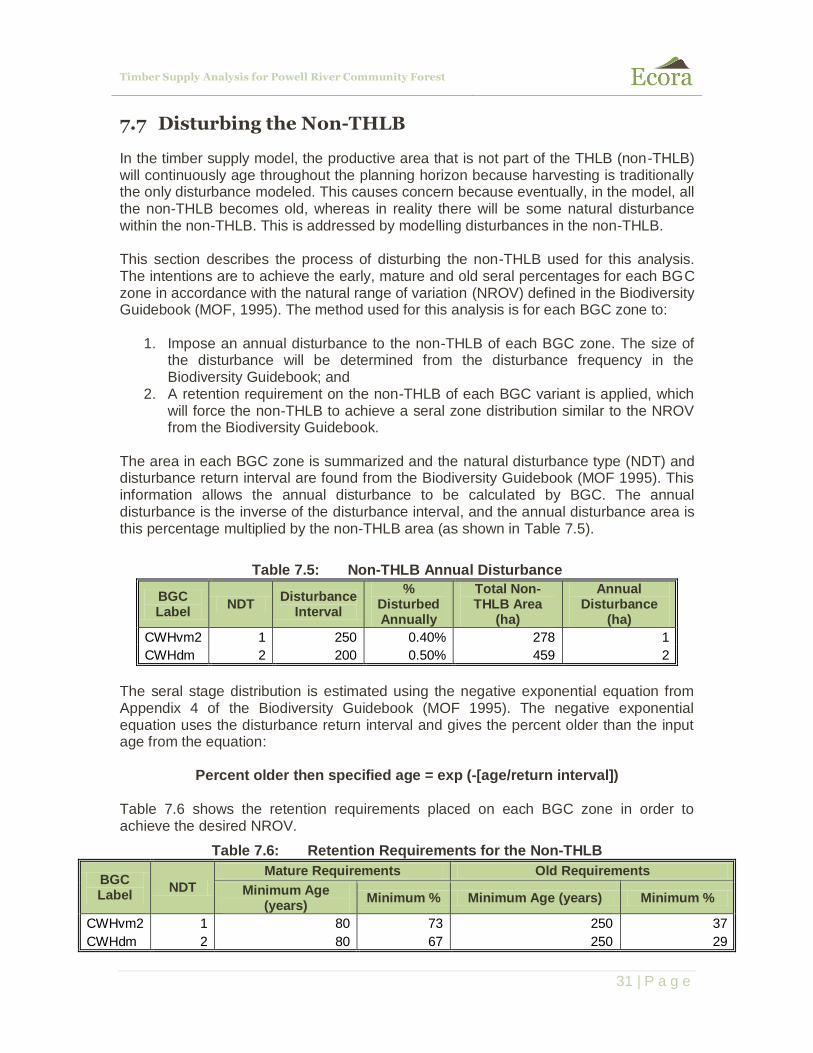
7.7 Disturbing the Non-THLB
In the timber supply model, the productive area that is not part of the THLB (non-THLB) will continuously age throughout the planning horizon because harvesting is traditionally the only disturbance modeled. This causes concern because eventually, in the model, all the non-THLB becomes old, whereas in reality there will be some natural disturbance within the non-THLB. This is addressed by modelling disturbances in the non-THLB. This section describes the process of disturbing the non-THLB used for this analysis. The intentions are to achieve the early, mature and old seral percentages for each BGC zone in accordance with the natural range of variation (NROV) defined in the Biodiversity Guidebook (MOF, 1995). The method used for this analysis is for each BGC zone to:
1. Impose an annual disturbance to the non-THLB of each BGC zone. The size of the disturbance will be determined from the disturbance frequency in the Biodiversity Guidebook; and
2. A retention requirement on the non-THLB of each BGC variant is applied, which will force the non-THLB to achieve a seral zone distribution similar to the NROV from the Biodiversity Guidebook.
The area in each BGC zone is summarized and the natural disturbance type (NDT) and disturbance return interval are found from the Biodiversity Guidebook (MOF 1995). This information allows the annual disturbance to be calculated by BGC. The annual disturbance is the inverse of the disturbance interval, and the annual disturbance area is this percentage multiplied by the non-THLB area (as shown in Table 7.5).
Table 7.5: Non-THLB Annual Disturbance
BGC Label
NDT Disturbance
Interval
% Disturbed Annually
Total Non-THLB Area
(ha)
Annual Disturbance
(ha)
CWHvm2 1 250 0.40% 278 1
CWHdm 2 200 0.50% 459 2
The seral stage distribution is estimated using the negative exponential equation from Appendix 4 of the Biodiversity Guidebook (MOF 1995). The negative exponential equation uses the disturbance return interval and gives the percent older than the input age from the equation:
Percent older then specified age = exp (-[age/return interval]) Table 7.6 shows the retention requirements placed on each BGC zone in order to achieve the desired NROV.
Table 7.6: Retention Requirements for the Non-THLB
BGC Label
NDT
Mature Requirements Old Requirements
Minimum Age (years)
Minimum % Minimum Age (years) Minimum %
CWHvm2 1 80 73 250 37
CWHdm 2 80 67 250 29
Timber Supply Analysis for Powell River Community Forest
32 | P a g e
8 APPENDIX C: RESOURCE MANAGEMENT ZONES
Direction on resource management zones (RMZ) comes from a variety of sources including:
The 2008 Powell River Community Forest Stewardship Plan (FSP);
The Ministry of Forest and Range‟s 1998 Procedures for Factoring Visual Resources into Timber Supply Analyses; and
Under the Forest and Range Practices Act (FRPA), objectives that are grand-parented from the Forest Practices Code – such as community watershed objectives.
The sources of information and modelling assumptions for each RMZ are documented in the sections below.
8.1 Community Watersheds
There is one community watershed within the PRCF boundary: Haslam/ Lang Community Watershed. Forest cover constraints are modelled based on recommendations in the Community Watershed Guidebook where no more than 25.2%
of an area can be less than 6.6 m in height. Figure 8.1 shows the spatial delineation of the Haslam/ Lang Community Watershed within the CF.
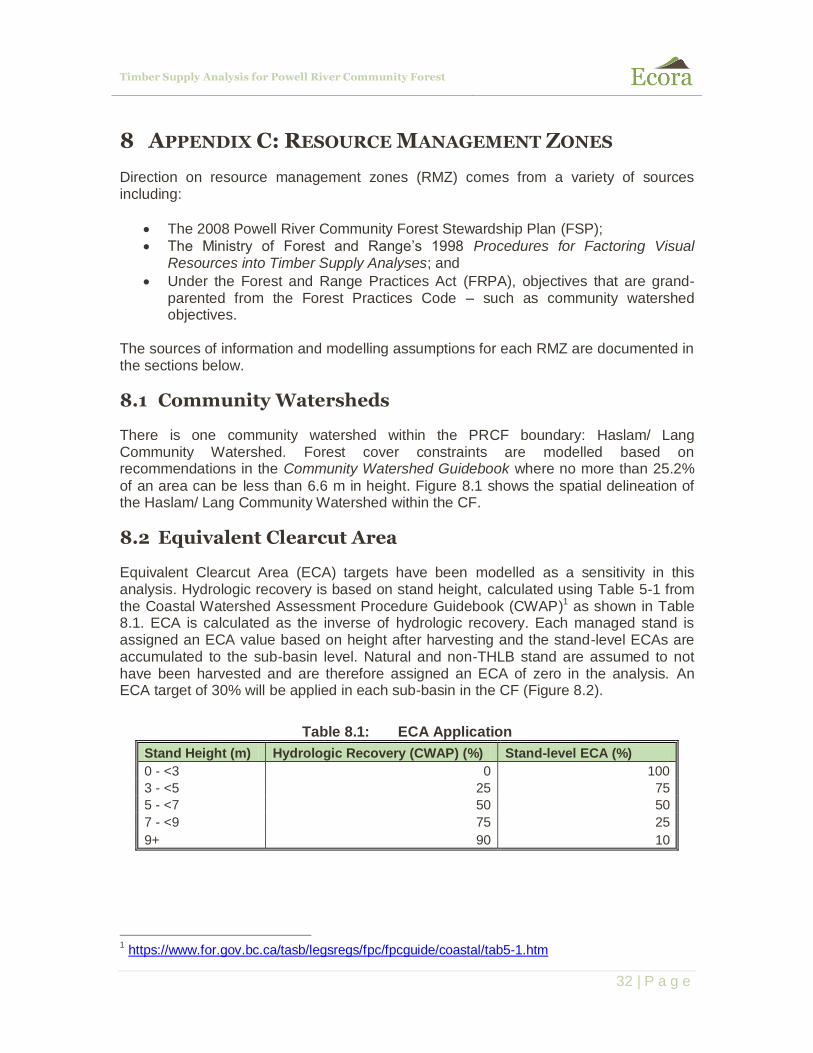
8.2 Equivalent Clearcut Area
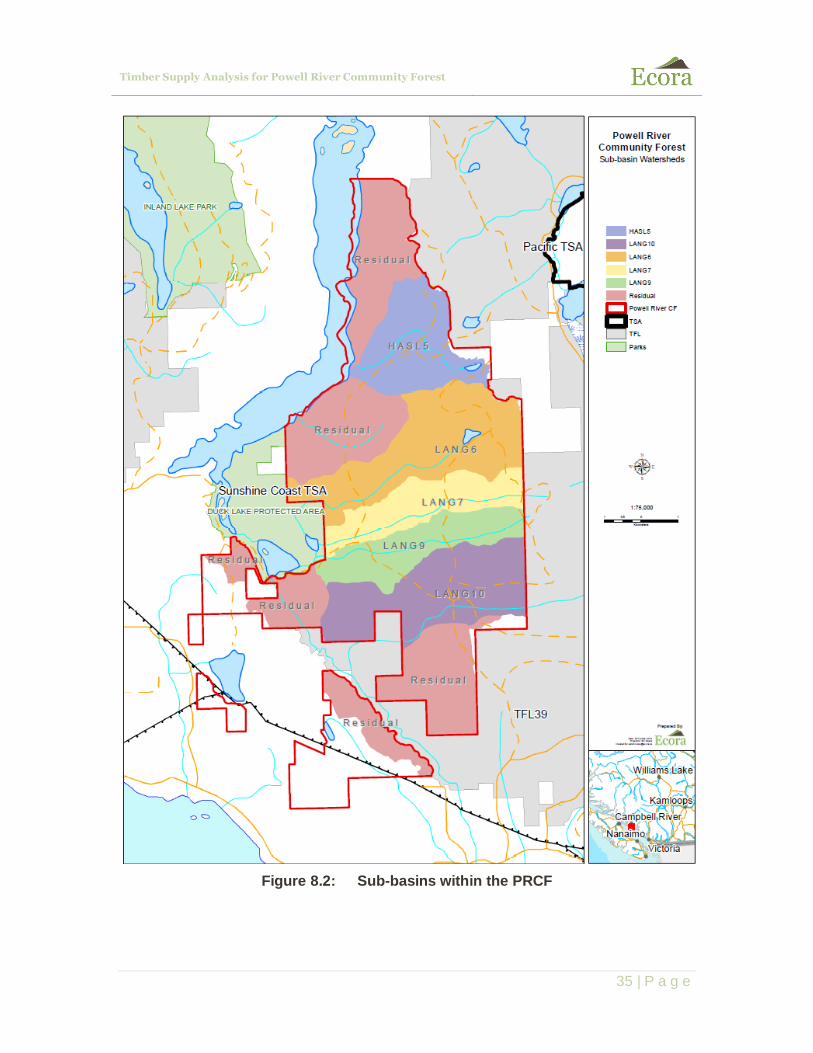
Equivalent Clearcut Area (ECA) targets have been modelled as a sensitivity in this analysis. Hydrologic recovery is based on stand height, calculated using Table 5-1 from the Coastal Watershed Assessment Procedure Guidebook (CWAP)1 as shown in Table 8.1. ECA is calculated as the inverse of hydrologic recovery. Each managed stand is assigned an ECA value based on height after harvesting and the stand-level ECAs are accumulated to the sub-basin level. Natural and non-THLB stand are assumed to not have been harvested and are therefore assigned an ECA of zero in the analysis. An ECA target of 30% will be applied in each sub-basin in the CF (Figure 8.2).
Table 8.1: ECA Application
Stand Height (m) Hydrologic Recovery (CWAP) (%) Stand-level ECA (%)
0 - <3 0 100
3 - <5 25 75
5 - <7 50 50
7 - <9 75 25
9+ 90 10
1 https://www.for.gov.bc.ca/tasb/legsregs/fpc/fpcguide/coastal/tab5-1.htm
Timber Supply Analysis for Powell River Community Forest
33 | P a g e
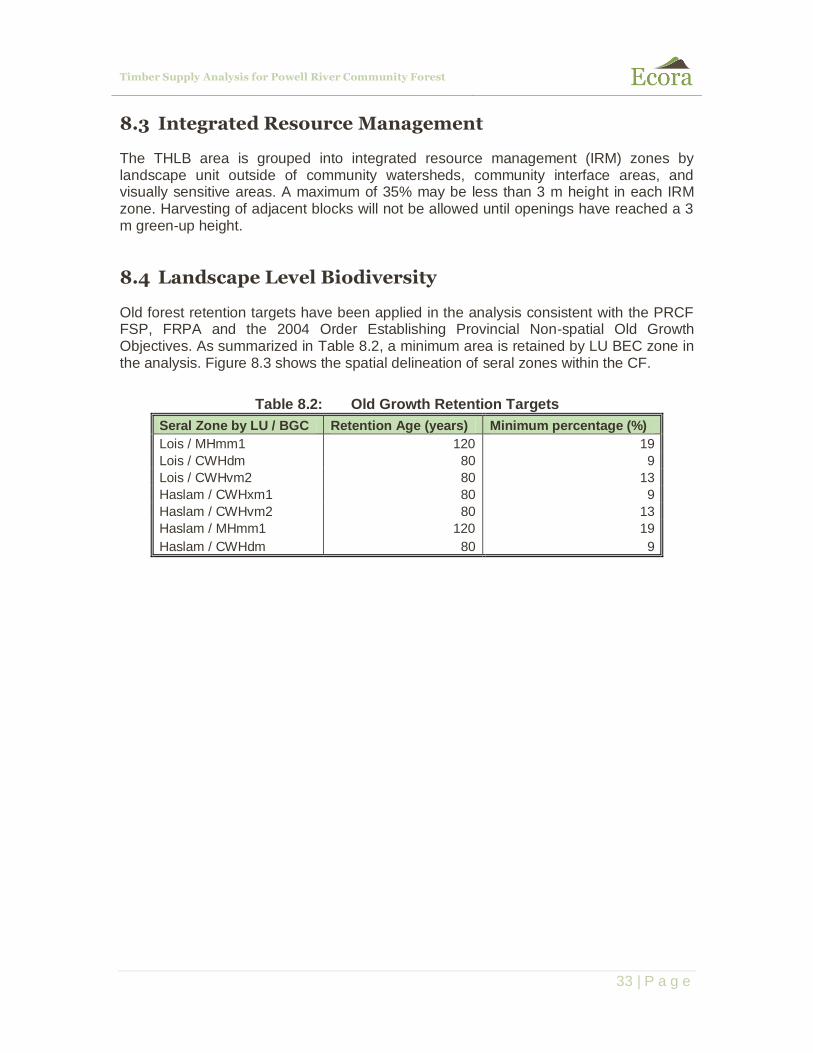
8.3 Integrated Resource Management
The THLB area is grouped into integrated resource management (IRM) zones by landscape unit outside of community watersheds, community interface areas, and visually sensitive areas. A maximum of 35% may be less than 3 m height in each IRM zone. Harvesting of adjacent blocks will not be allowed until openings have reached a 3 m green-up height.
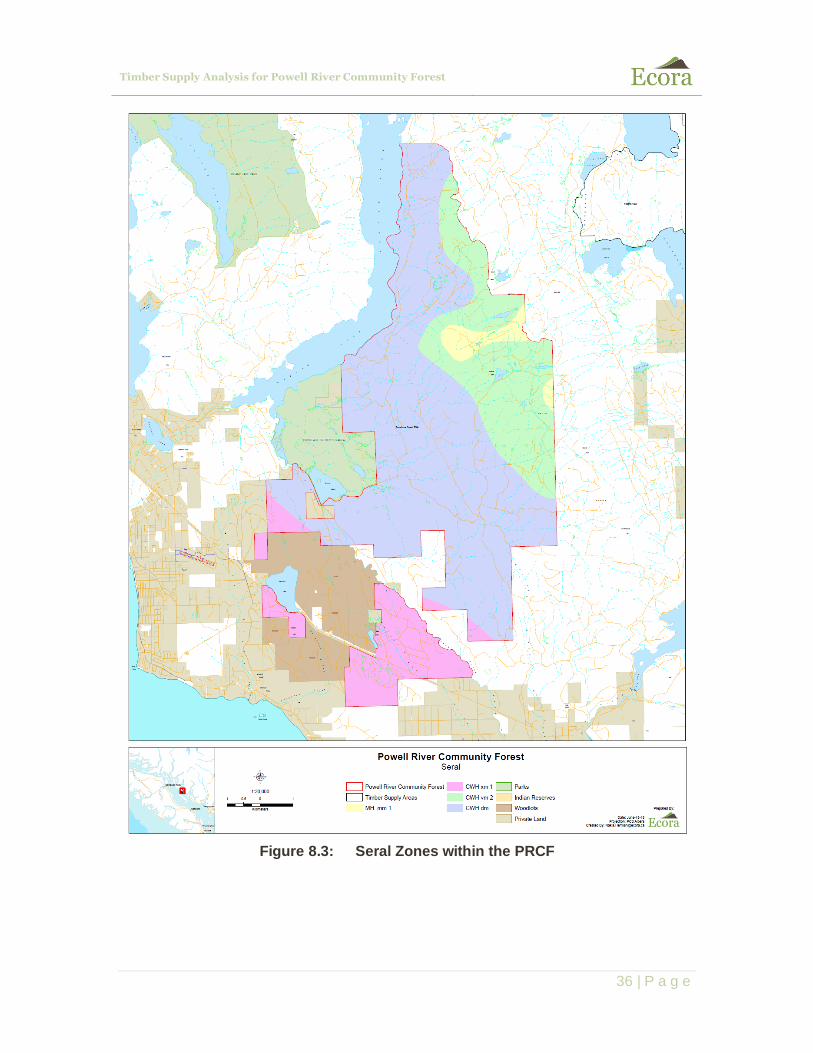
8.4 Landscape Level Biodiversity
Old forest retention targets have been applied in the analysis consistent with the PRCF FSP, FRPA and the 2004 Order Establishing Provincial Non-spatial Old Growth Objectives. As summarized in Table 8.2, a minimum area is retained by LU BEC zone in the analysis. Figure 8.3 shows the spatial delineation of seral zones within the CF.
Table 8.2: Old Growth Retention Targets
Seral Zone by LU / BGC Retention Age (years) Minimum percentage (%)
Lois / MHmm1 120 19
Lois / CWHdm 80 9
Lois / CWHvm2 80 13
Haslam / CWHxm1 80 9
Haslam / CWHvm2 80 13
Haslam / MHmm1 120 19
Haslam / CWHdm 80 9

Timber Supply Analysis for Powell River Community Forest
34 | P a g e
Figure 8.1: Community Watersheds within the PRCF
Timber Supply Analysis for Powell River Community Forest
35 | P a g e
Figure 8.2: Sub-basins within the PRCF
Timber Supply Analysis for Powell River Community Forest
36 | P a g e
Figure 8.3: Seral Zones within the PRCF

Timber Supply Analysis for Powell River Community Forest
37 | P a g e
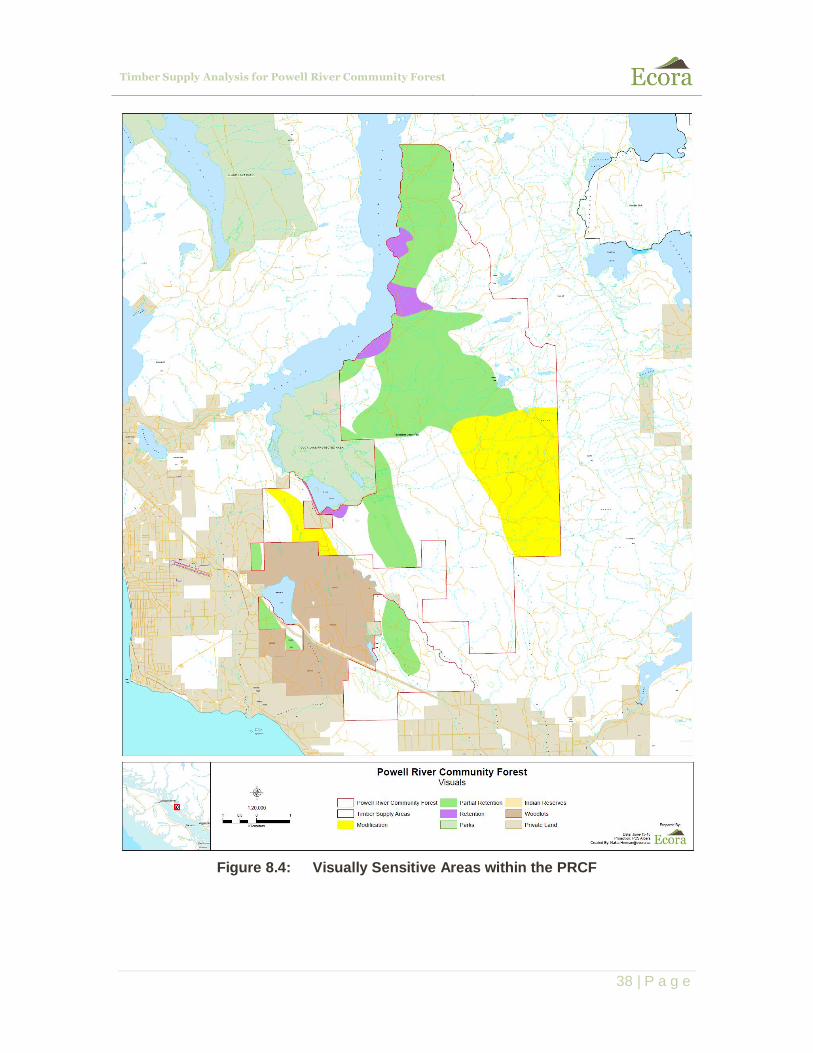
8.5 Visually Sensitive Areas
The visual landscape inventory (VLI) delineates areas of visual sensitivity near communities or adjacent to travel corridors. Restrictions on the acceptable limits of visual change are applied by visual polygon and modelled by a combination of visual quality objective (VQO) and visual absorption capability (VAC). VQOs include retention, partial retention, and modification, and VACs include low, medium, and high. Visual resource management will be modelled according to the Procedures for Factoring Visual Resources into Timber Supply Analyses (MOFR 1998). The VAC % denudation
range was used to apply the maximum disturbance requirement in the timber supply analysis based on the upper % denudation. Visual requirements are consistent with the established VQO and applied by visual polygon by the maximum percent denudation for a medium VAC, as shown inTable 8.3.
Table 8.3: Maximum Allowable Disturbance % by VQO
Visual Quality Objective
Maximum Allowable Disturbance % Green-up
Height Applicable
Area VAC Low
VAC Medium
VAC High
Preservation (P) 1 3.5 m Crown forested land base for each
visual unit
Retention (R) 3 3.5 m
Partial Retention (PR) 15 10 6 3.5 m
Modification (M) 20 3.5 m
Visual polygons were sourced from the current visual landscape inventory (VLI) mapping available on the MFLNRO website (www.for.gov.bc.ca/hfp/values/visual/VLI/index.htm). Visual requirements are applied by visual polygon. Figure 8.4 shows the spatial delineation of the VQOs within the CF.
Timber Supply Analysis for Powell River Community Forest
38 | P a g e
Figure 8.4: Visually Sensitive Areas within the PRCF