Embed Size (px)
Citation preview

Consumption Based Property Tax Distribution
October 31, 2009
British Columbia Municipal Sustainability
Model
Sustainability Strategy
Consumption of Service
Cost of Service Delivery
Consumption Based Property Tax Distribution
City of Powell River
P R E P A R E D F O R C A T A L Y S T P A P E R C O R P O R A T I O N
Authors
Rob Fitzgerald [email protected]
(604) 351-3860
Norm Stickelmann [email protected]
(604) 477-0415
© Copyright 2008-2009, All Rights Reserved


2008 Municipal Sustainability Report City of Powell River
FITZGERALD, STICKELMANN
i | P a g e
TABLE OF CONTENTS Acknowledgements .................................................................................................................. vi
1 Executive Summary .......................................................................................................... 1
1.1 Objectives and Scope .................................................................................................. 1
1.2 Overview of City Budget ............................................................................................ 2
1.2.1 Residential / Non-Residential Consumption Pattern Results .......................... 3
1.3 Details of Consumption Analysis by Class ................................................................ 6
2 Municipal Sustainability Model ........................................................................................ 7
2.1 Introduction ................................................................................................................ 7
2.2 Principles and Philosophy .......................................................................................... 9
2.3 Municipal Finance Responsibilities ..........................................................................10
2.3.1 Federal Funding ....................................................................................................10
2.4 Provincial Funding ....................................................................................................11
2.4.1 Municipal Funding ................................................................................................11
2.4.2 Sustainability ........................................................................................................12
2.4.3 The Municipal Sustainability Model ....................................................................13
2.4.4 City of Powell River Sustainability Strategy ........................................................14
2.5 Consumption of Services ...........................................................................................25
2.5.1 Consumption of Service Methodology ...................................................................25
2.5.2 Consumption Based Tax Distribution Policy Calculation ....................................27
2.5.3 Adjusted Marginal Corporate Tax Rate ................................................................28
2.5.4 Other Benefits and Costs ......................................................................................30
2.5.5 Consumption of Service Analysis ..........................................................................31
2.5.6 Cost of Service Delivery Analysis .........................................................................37
2.6 Property Classes ........................................................................................................40
2.6.1 Residential .............................................................................................................40
2.6.2 Non-Residential .....................................................................................................42
3 Methodology .....................................................................................................................43

2008 Municipal Sustainability Report City of Powell River
FITZGERALD, STICKELMANN
ii | P a g e
3.1 Five (5) Administrative Performance Measures (5 APMs) .......................................43
3.1.1 General Government .............................................................................................43
3.1.2 Security ..................................................................................................................43
3.1.3 Engineering ...........................................................................................................43
3.1.4 Planning and Development ...................................................................................43
3.1.5 Parks, Recreation and Culture .............................................................................44
4 2008 Budget Analysis By APM ........................................................................................45
4.1 General Government APM ........................................................................................45
4.1.1 Taxation .................................................................................................................45
4.1.2 Grants ....................................................................................................................49
4.1.3 Capital & Carry Forwards ....................................................................................49
4.1.4 Mayor and Council ................................................................................................63
4.1.5 Accounting .............................................................................................................64
4.1.6 Buildings and Grounds Maintenance ...................................................................66
4.1.7 Financial Management .........................................................................................67
4.1.8 Debt and Fiscal Services .......................................................................................68
4.1.9 Human Resources ..................................................................................................69
4.1.10 Interest and Penalties ...........................................................................................70
4.1.11 Powell River District Library ................................................................................70
4.1.12 Management Information Services .......................................................................71
4.1.13 Land Leases / Building Rentals ............................................................................72
4.1.14 Other General Government ..................................................................................72
4.1.15 Stores & Timekeeper .............................................................................................73
4.1.16 Tax Information Requests .....................................................................................73
4.2 Security APM ............................................................................................................74
4.2.1 Police (RCMP)........................................................................................................74
4.2.2 Fire ........................................................................................................................74
4.2.3 Revenues ................................................................................................................76
4.2.4 Animal Control ......................................................................................................77
4.2.5 Dog Licence Fees ...................................................................................................77

2008 Municipal Sustainability Report City of Powell River
FITZGERALD, STICKELMANN
iii | P a g e
4.2.6 Bylaw Enforcement ...............................................................................................78
4.3 Planning and Development APM ..............................................................................80
4.3.1 Administration ......................................................................................................80
4.3.2 Development Services ...........................................................................................80
4.3.3 Economic Development .........................................................................................83
4.3.4 Harbours ................................................................................................................84
4.4 Engineering APM ......................................................................................................88
4.4.1 Administration ......................................................................................................88
4.4.2 Airport ...................................................................................................................89
4.4.3 Building Permits ...................................................................................................92
4.4.4 Community Works Reserves .................................................................................93
4.4.5 Reserves .................................................................................................................93
4.4.6 Roads .....................................................................................................................93
4.4.7 Sanitation and Waste Collection ...........................................................................94
4.4.8 Sidewalks, Curbs and Footbridge .........................................................................96
4.4.9 Signs & Traffic Lights ...........................................................................................97
4.4.10 Storm Sewer ..........................................................................................................97
4.4.11 Street Lights ..........................................................................................................98
4.4.12 Tools & Equipment ................................................................................................98
4.4.13 Transit ...................................................................................................................99
4.4.14 Vandalism ............................................................................................................ 101
4.5 Parks, Recreation and Culture APM ...................................................................... 102
4.5.1 Museum ............................................................................................................... 102
4.5.2 Parks .................................................................................................................... 103
4.5.3 Other Parks Expenditures .................................................................................. 104
4.5.4 Powell River Recreation Complex ....................................................................... 105
4.5.5 Pool & Fitness ..................................................................................................... 108
4.5.6 Recreation Programs ........................................................................................... 110
4.5.7 Snack Bars ........................................................................................................... 110
4.5.8 Willingdon Beach Campground .......................................................................... 111

2008 Municipal Sustainability Report City of Powell River
FITZGERALD, STICKELMANN
iv | P a g e
5 Activity Drivers .............................................................................................................. 114
5.1 Consultant's Developed Drivers .............................................................................. 115
5.1.1 Distribution of Time Driver ................................................................................ 115
5.1.2 Jobs Driver .......................................................................................................... 118
5.1.3 Commuting Flow Driver ..................................................................................... 120
5.1.4 Commuting Distance Driver ............................................................................... 122
5.1.5 Commuting by Road Type Driver ....................................................................... 123
5.1.6 Human Resources Driver .................................................................................... 124
5.1.7 Protective Services Driver ................................................................................... 125
5.1.8 Road Use Driver .................................................................................................. 126
5.2 City Data Drivers .................................................................................................... 131
5.2.1 Building Inspection ............................................................................................. 131
5.2.2 Building Permits ................................................................................................. 132
5.2.3 Number of Employees ......................................................................................... 133
5.2.4 Road Network Description .................................................................................. 134
5.2.5 Transit ................................................................................................................. 135
5.3 Provincial Data Drivers .......................................................................................... 136
5.3.1 Assessment Occurrences ..................................................................................... 136
5.3.2 Total Assessment Values (2008) ......................................................................... 137
5.3.3 Assessment Land Values (2008) ......................................................................... 138
5.3.4 Assessment Improvement Values (2008) ............................................................ 139
5.3.5 Taxes Paid (2008) ................................................................................................ 140
5.3.6 Taxes Paid (2007) ................................................................................................ 141
5.3.7 Taxes Paid (2001 to 2008) ................................................................................... 142
5.4 Statistics Canada .................................................................................................... 143
5.4.1 Commuting Flows ............................................................................................... 143
5.4.2 Commuting Distance ........................................................................................... 143
5.4.3 Industry ............................................................................................................... 145
5.4.4 Labour Force Activity .......................................................................................... 147
5.4.5 Modes of Transportation ..................................................................................... 148

2008 Municipal Sustainability Report City of Powell River
FITZGERALD, STICKELMANN
v | P a g e
5.4.6 Occupation Statistics ........................................................................................... 149
5.4.7 Place of Work ....................................................................................................... 151
5.4.8 Population Statistics ........................................................................................... 153
6 Definitions ...................................................................................................................... 154
6.1 Activity Driver ......................................................................................................... 154
6.2 Administrative Performance Measure .................................................................... 154
6.3 Allocation Types ...................................................................................................... 155
6.3.1 Type 1: Direct ..................................................................................................... 155
6.3.2 Type 2: Departmental Indirect .......................................................................... 155
6.3.3 Type 3: Municipal Indirect ................................................................................. 155
6.4 Budget Categories ................................................................................................... 156
6.4.1 Category 1: Revenues ......................................................................................... 156
6.4.2 Category 2: Expenditures ................................................................................... 156
6.4.3 Category 3: Grants ............................................................................................. 156
6.4.4 Category 4: Transfers to and from Reserves...................................................... 156
6.4.5 Category 5: Excluded from consumption calculation ........................................ 157
6.4.6 Drivers ................................................................................................................. 157
6.4.7 Indirect Drivers ................................................................................................... 157
6.4.8 Property Class ..................................................................................................... 158
7 Table of Figures .............................................................................................................. 159
8 Table of Tables ............................................................................................................... 160
9 Bibliography ................................................................................................................... 164
10 Appendices ...................................................................................................................... 165

2008 Municipal Sustainability Report City of Powell River
FITZGERALD, STICKELMANN
vi | P a g e
ACKNOWLEDGEMENTS
The Authors’ would like to acknowledge the assistance of the Chief Administrative Officer, Mr. Stan Westby and his staff, for data, reports and maps essential to the compilation of the British Columbia Municipal Sustainability Model for the City of Powell River.

2008 Municipal Sustainability Report City of Powell River
FITZGERALD, STICKELMANN
1 | P a g e
1 EXECUTIVE SUMMARY
1.1 OBJECTIVES AND SCOPE
The purpose of the study was to develop an empirically‐based Municipal Sustainability Model for Powell River that would define and determine the following:
1. Sustainability Strategy and Performance Measures;
2. Consumption of Service Patterns;
3. Cost of Service Delivery Analysis; and
4. A Consumption Based Tax Distribution Policy.
The overall objective of the Municipal Sustainability Model concept is to identify and maintain the optimal balance between the net amount of services consumed by each class of property and the property tax paid by that class, even as the structure and economic characteristics of the City evolve over time. The Report calculates the price of availability and likely need for services by each class of property — rather than actual consumption or use by an individual property owner/occupier. The model has been developed over the past few years, and when applied to the City, allows determination of the empirically‐based relationship between the City's current Sustainability Strategy, its Consumption of Service Patterns and its Costs of Service Delivery — from which a Sustainable Consumption Based Tax Distribution allocation was derived1. This report applies principles established in the British Columbia Municipal Sustainability Model Framework2
This assignment was commissioned by Catalyst Paper Corporation and written by Rob Fitzgerald and Norm Stickelmann. The report allows for the comparison of property taxes paid by the different classes of property in the City of Powell River, relative to their consumption of tax‐supported services, using actual 2008 data provided by the City of Powell River. Other sources of information include Statistics Canada, BC Assessment and the Province of British Columbia.
authored by Rob Fitzgerald, Norm Stickelmann, Bob Laurie and Paul Sullivan, developed over time for the Vancouver Board of Trade, Local Government, Budget and Finance Committee.
All analyses and conclusions are those of the authors.
1No legislative changes are required to implement. 2 See Appendices.

2008 Municipal Sustainability Report City of Powell River
FITZGERALD, STICKELMANN
2 | P a g e
1.2 OVERVIEW OF CITY BUDGET
The Municipal Sustainability Model evaluates the City Budget in relation to the Consumption of Service Patterns attributable to the primary beneficiary or consumer of City services. Note that the main determinant of an activity is the extent to which that activity results in either a personal or economic benefit.
Consumption of Service patterns can be understood by viewing the various operations of a Municipality from three distinct perspectives:
1. Total City Expenditures.
2. Equivalent Consumption:
a. Total City Expenditures;
b. LESS Federal/Provincial Grants (other than grants-in-lieu of property tax);
c. LESS Transfers from Reserves;
d. Adjustments for the Marginal Tax Rate.
3. Net Consumption.

2008 Municipal Sustainability Report City of Powell River
FITZGERALD, STICKELMANN
3 | P a g e
1.2.1 RESIDENTIAL / NON-RESIDENTIAL CONSUMPTION PATTERN RESULTS
This Budget Analysis relies on information provided by the City of Powell River, set out in their 2008 to 2012 Financial Plan reported to the Province, which indicated a Total Property Tax Levy of $13,318,849 was required to balance the budget. Based on data provided by the City, the budget contained a variance of $62,195 when compared with the 2008 to 2012 Financial Plan. In addition, a further difference of $7,170 was also encountered — between the electronic data provided by the City and the Provincial Statistical tables set out below, which show Total Municipal Taxes as $13,249,484, highlighted in yellow in the Table 1 below. The total dollar variance amounts to approximately 0.5% — not considered material to the conclusions of this report. All subsequent calculations are based on the electronic data provided by the City excluding the variance of $62,195 ($13,249,284 + 7,170 = $13,256,654).
TABLE 1: PROVINCIAL STATISTICS 3
(SCH707)
TABLE 2: REVENUES BY CLASS PER POWELL RIVER BUDGET DATA
3 See http://www.cd.gov.bc.ca/lgd/infra/stratistics_index.htm. File: sch707_2008.xls
Municipality Type RD#
July 1, 2008 BC STATS Population Estimates (Dec. 2008 Release) Property Class
Authenticated Roll General
Taxable Values
Municipal Purposes Tax Rates
Tax Class
Multiples
Total Municipal Variable
Rate Taxes
Flat Taxes,Split Rate Taxes,
Ports Property Taxes and Tax
Sharing
Total Municipal
Taxes% Total Taxes
% Total Assessm
ent
Municipal Taxes
Per Capita
Pow ell River D POW 14,035 Residential 1,299,940,500 3.15683 1.00 4,103,691 2,373,500 6,477,191 49 85 462Pow ell River D POW Utilities 991,100 39.99992 12.67 39,644 39,644 0 0 0Pow ell River D POW Unmanaged Forest 0 0.00000 0.00 0 0 0 0 0Pow ell River D POW Major Industry 113,185,000 40.90086 12.96 4,629,364 4,629,364 35 7 0Pow ell River D POW Light Industry 4,581,000 10.76030 3.41 49,293 49,293 0 0 0Pow ell River D POW Business 112,341,550 17.96356 5.69 2,018,054 2,018,054 15 7 0Pow ell River D POW Managed Forest 37,900 28.28786 8.96 1,072 1,072 0 0 0Pow ell River D POW Recreation 2,059,500 15.36670 4.87 31,648 31,648 0 0 0Pow ell River D POW Farm 286,529 11.23268 3.56 3,218 3,218 0 0 0Powell River D POW Totals 1,533,423,079 0.00000 0.00 10,875,984 2,373,500 13,249,484 100 100 944
Account Consultant Cost Category2008 Original
Budget
% of Total Property
TaxesProperty Tax - Residential (Note 1) Property Taxes Collected (6,373,885) 47.9%Property Tax - Utilities (Note 2) Property Taxes Collected (39,643) 0.3%Property Tax - Managed Forest Land Property Taxes Collected (1,072) 0.0%Property Tax - Major Industry Property Taxes Collected (4,629,363) 34.8%Property Tax - Light Industry Property Taxes Collected (49,293) 0.4%Property Tax - Business/Other Property Taxes Collected (2,190,728) 16.4%Property Tax - Recreation/Non-Profit Property Taxes Collected (31,647) 0.2%Property Tax - Farm Property Taxes Collected (3,218) 0.0%
(13,318,849)
Notes1. Includes Flat Tax2. Excludes 1% of Revenues Paid under S353 of the Local Government Act in-lieu of General Municipal Taxes

2008 Municipal Sustainability Report City of Powell River
FITZGERALD, STICKELMANN
4 | P a g e
On a Gross Expenditure level, total Residential properties consumed 57.5%4, and total Non–Residential properties consumed 42.5%5 of TOTAL
City services. After deducting grants and reserve revenues, not directly related to consumption, Residential properties accounted for 62.2% of services consumed, and Non–Residential properties accounted for 37.8%. Once direct revenues paid to the City as fees-for--service are accounted for, and the marginal tax rate adjustment is applied, a total 63.945% of the property tax levy is attributed to Residential and 36.052% to Non–Residential.
4 See Residential, Total Municipal Expenditures in Table 3. 5 See Non-Residential, Total Municipal Expenditures in Table 2.
Total ResTotal Non
ResTotal Municipal Expenditures 57.483% 42.517%Adjust for: Grants / Reserves 39.972% 60.028%Consumption after Grants & 62.225% 37.775%Marginal Tax Rate Adjustment -9.106% 15.000%Consumptions After Marginal Tax
56.558% 43.442%
Less: Revenues 46.423% 53.577%Net Consumption with the Class 63.948% 36.052%
36.052%49.150% 50.850%
* Note: Calculated based on % of Total Levy reported in 2008 Provincial Statistics (sch707_2008.xls)
2008 Actual $ of Property Tax Levy Paid *
TABLE 3: SUMMARY OF CONSUMPTION (%)

2008 Municipal Sustainability Report City of Powell River
FITZGERALD, STICKELMANN
5 | P a g e
The 2008 Marginal Tax Rate Adjustment in the Table 3 (Page 4) refers to the percentage adjustment of Consumption after Grants & Reserves. This demonstrates that to achieve equivalency in tax payments, an adjustment of 15% (30% ÷ 2) is required6
after Grants & Reserves have been deducted.
TABLE 4: SUMMARY OF RESIDENTIAL 7
/ NON-RESIDENTIAL CONSUMPTION ($)
6 Consumption After Marginal Tax Rate Adjustment (33.639%) is calculated by multiplying the Consumption after Grants and Reserves (29.251%) by the percentage calculated as the Marginal Tax Rate Adjustment (based on a Marginal Tax Rate of 30%, an adjustment of 1.15 is required), for a total of 33.639%. For further information on the Marginal Tax Rate Adjustment, see section 2.5.3 – Adjusted Marginal Corporate Tax Rate for illustration of calculation. 7 Variance of $6 due to rounding in allocations in not considered Material ($13,256,654 - $13,256,648)
Total ResTotal Non
ResTotal Tax
LevyTotal Municipal Expenditures 16,743,727$ 12,384,539$ 29,128,266$ Adjust for: Grants / Reserves (2,481,201) (3,726,091) (6,207,292) Consumption after Grants & Reserves 14,262,526$ 8,658,448$ 22,920,974$ Marginal Tax Rate Adjustment (1,298,767) 1,298,767 - Consumptions After Marginal Tax Rate Adjustment
12,963,759$ 9,957,215$ 22,920,974$
Less: Revenues (4,486,461) (5,177,865) (9,664,326) Net Consumption with the Class 8,477,298$ 4,779,350$ 13,256,648$
6,512,057$ 6,737,427$ 13,249,484$
* Note: Calculated based on % of Total Levy reported in 2008 Provincial Statistics (sch707_2008.xls)
2008 Actual $ of Property Tax Levy Paid *

2008 Municipal Sustainability Report City of Powell River
FITZGERALD, STICKELMANN
6 | P a g e
1.3 DETAILS OF CONSUMPTION ANALYSIS BY CLASS
Property tax is the revenue source used to balance the Municipal Budget. Determining a sustainable, fair and equitable tax distribution is a challenging exercise, particularly in the absence of any empirically -based methodology. Under the current property tax system in British Columbia today, there is no known or universally accepted protocol in place that relates the cost of availability and likely need of services to those who pay for them through property tax.
The following table summarizes the Net Consumption Patterns for each Property Class defined in the Assessment Act.
TABLE 5: CONSUMPTION PATTERNS BY CLASS (%) 8
TABLE 6: CONSUMPTION PATTERNS BY CLASS 9 ($) 10
8 Percentages are based on 2008 Provincial Statistics.
9 A variance of $7,170 exists between the data provided by the City and Provincial Statistics due to differences in calculation methodologies used by the City and the Province. The Taxes Paid Calculation translates the Provincial percentages using the City's Budget. Percentages in Provincial Statistics exclude the Residential Flat Tax. Actual $ of Property Tax Levy Paid and Percentages include the Residential Flat Tax. 10 Allocation process results in an additional $6 rounding difference, which is not considered material. Utilities show a credit as the budget already includes receipt of 1% of Revenues (Section 353 of the Local Government Act) that are paid in–lieu of General Municipal property tax.
1 (Res)3 Supp
Hsg 8 (Rec NP) 9 (Farm) Total Res 2 (Util) 4 (Maj Ind) 5 (Lgt Ind)6 (Bus
Oth)7 (Mng
For)Total Non
ResTotal Municipal Expenditures 57.042% 0.000% 0.356% 0.084% 57.483% 0.096% 6.550% 1.450% 33.471% 0.950% 42.517%Adjust for: Grants / Reserves 39.890% 0.000% 0.064% 0.019% 39.972% 0.022% 8.899% 2.005% 47.709% 1.393% 60.028%Consumption after Grants & 61.687% 0.000% 0.436% 0.102% 62.225% 0.117% 5.914% 1.299% 29.615% 0.830% 37.775%Marginal Tax Rate Adjustment 0.000% 0.000% 0.000% 0.000% -9.106% 0.000% 0.000% 0.000% 0.000% 0.000% 15.000%Consumptions After Marginal Tax
56.070% 0.000% 0.396% 0.093% 56.558% 0.134% 6.801% 1.494% 34.058% 0.954% 43.442%
Less: Revenues 46.091% 0.000% 0.277% 0.055% 46.423% 4.585% 8.207% 1.660% 38.140% 0.986% 53.577%Net Consumption with the Class 63.345% 0.000% 0.483% 0.120% 63.948% -3.110% 5.777% 1.374% 31.080% 0.931% 36.052%
36.052%48.886% 0.000% 0.239% 0.024% 49.150% 0.299% 34.940% 0.372% 15.231% 0.008% 50.850%
* Note: Calculated based on % of Total Levy reported in 2008 Provincial Statistics (sch707_2008.xls)
2008 Actual $ of Property Tax Levy Paid *
1 (Res) 3 Supp Hsg 8 (Rec NP) 9 (Farm) Total Res 2 (Util) 4 (Maj Ind) 5 (Lgt Ind) 6 (Bus Oth) 7 (Mng For)Total Non
ResTotal Tax
LevyTotal Municipal Expenditures 16,615,367$ - 103,823$ 24,531$ 16,743,727$ 28,107$ 1,907,946$ 422,314$ 9,749,563$ 276,609$ 12,384,539$ 29,128,266$ Adjust for: Grants / Reserves (2,476,062) - (3,955) (1,186) (2,481,201) (1,349) (552,370) (124,480) (2,961,423) (86,469) (3,726,091) (6,207,292) Consumption after Grants & 14,139,305$ - 99,868$ 23,345$ 14,262,526$ 26,758$ 1,355,576$ 297,834$ 6,788,140$ 190,140$ 8,658,448$ 22,920,974$ Marginal Tax Rate Adjustment (1,287,547) - (9,094) (2,126) (1,298,767) 4,014 203,336 44,675 1,018,221 28,521 1,298,767 - Consumptions After Marginal Tax
12,851,758$ - 90,774$ 21,219$ 12,963,759$ 30,772$ 1,558,912$ 342,509$ 7,806,361$ 218,661$ 9,957,215$ 22,920,974$
Less: Revenues (4,454,415) - (26,769) (5,277) (4,486,461) (443,065) (793,131) (160,426) (3,685,974) (95,267) (5,177,865) (9,664,326) Net Consumption with the Class 8,397,343$ - 64,005$ 15,942$ 8,477,298$ (412,293)$ 765,781$ 182,083$ 4,120,387$ 123,394$ 4,779,350$ 13,256,648$
6,477,191 - 31,648 3,218 6,512,057$ 39,644$ 4,629,364$ 49,293$ 2,018,054$ 1,072$ 6,737,427$ 13,249,484$ * Note: Calculated based on % of Total Levy reported in 2008 Provincial Statistics (sch707_2008.xls)
2008 Actual $ of Property Tax Levy Paid *

2008 Municipal Sustainability Report City of Powell River
FITZGERALD, STICKELMANN
7 | P a g e
2 MUNICIPAL SUSTAINABILITY MODEL
2.1 INTRODUCTION
Property tax has long been a major and often controversial source of revenue for local governments. For just about as long, debate has continued over its strengths and weaknesses. Regardless of where one stands on the issue, it is clear that the roles and responsibilities of Municipalities are changing. With continual increases in property taxes — resulting from population growth and economic activity — development of a related tax distribution policy that is rational, fair and transparent, is even more critical.
Property Assessment values in and of themselves create no revenues for the City. Assessment values merely determine how property taxes will be distributed within and between each class11
of property. This issue underlies the importance of accurate assessment values as a partial solution to the equitable distribution of property tax. Other factors that determine the degree of tax burden placed on a particular taxpayer or class, is the size of the budget and the property tax distribution policies and practices of the City. These last two items are fully in control of Council. Property assessment increases or decreases by
themselves are not the determinant of property tax equity, except to the extent that a property might vary positively or negatively from the average value, year over year.
11 See Property Types for a description of current property classes.
Budget
Tax Distribution
Policy
Property Assessments
FIGURE 1: PROPERTY TAX RELATIONSHIP
Budget
Tax Distribution
Policy
Property Assessments
FIGURE 2: PROPERTY TAX RELATIONSHIP

2008 Municipal Sustainability Report City of Powell River
FITZGERALD, STICKELMANN
8 | P a g e
While we believe this model can be applied to most property tax systems, it has been designed to operate and be implemented under the existing legislative framework in British Columbia.
The Canada West Foundation in their position paper, “Problematic Property Tax: Why the Property Tax Fails to Measure Up and What to Do About It” (Vander Ploeg, November 2008), states, “The property tax is the only substantial tax available for local governments in Canada, and critics of the tax are right when they claim it alone is insufficient to meet the needs of today’s large modern cities. Defenders of the tax are wrong in asserting that property tax is the only way — or even the best way — to fund all our varied civic endeavours.”
Unlike taxes such as income tax and commodity12
To achieve municipal sustainability, the payment of property taxes must relate to consumption related to the availability and likely need of services by property class (“CbC”), rather than political perception budget allocation by class (“PbC”), thus ensuring that the users of finite City services are aware of their costs, and ultimately promotes responsible use of these services.
taxes, which are heavily reliant on the state of the economy, property taxes provide a stable revenue source for the City. When the economy is in an up‐cycle, access to income taxes and commodity taxes are certainly an appealing source of potential revenues for local governments — as a way to supplement existing municipal funding. However, with every up‐cycle there is a down‐cycle. If down‐cycles are not predicted accurately, pressure on property taxes would become even greater, as property tax is the revenue source that “balances the budget”. Any additional pressure on property taxation places and even greater burden on taxpayers, given that it is not related to income earned. The Authors do not suggest that access to other revenue streams would not be beneficial in financing municipalities; however, care must be exercised in fully understanding the risks from and exposure to, local and global market changes, which would affect predictability and certainty for all.
12 Includes taxes such as sales taxes, fuel taxes, or any other tax based on some form of consumption or activity.

2008 Municipal Sustainability Report City of Powell River
FITZGERALD, STICKELMANN
9 | P a g e
2.2 PRINCIPLES AND PHILOSOPHY
The Municipal Sustainability Model is part of a larger sustainability approach, which involves not only municipalities or other local government institutions, but also includes the Provincial and Federal Governments. With the growing trend in urbanization13
“Sustainability is the result of the act of balancing the three essential elements of social, economic and environment in the best interests of the constituents, but not at the expense of future generations
, the need for a principled and analytical approach to achieving long‐term sustainability in the provision of services — fundamental to the social, economic and environmental well‐being of communities — has become more critical.
14
This model is designed to be applied within the existing British Columbia Legislative framework and above all, recognizes that regardless of how many levels of government there are, there is only one taxpayer to fund the cost of services. Ultimately, the Municipal Sustainability Model is designed to bring greater stability and accountability, as well as transparency to taxpayers in the provision of services that critically affect their daily lives.
".
13 2006 Provincial Statistics show over 87% of the total population of British Columbia live within an Organized Area/Municipality. 14 The Municipal Sustainability Model Rob Fitzgerald, Norm Stickelmann, Bob Laurie and Paul Sullivan, dated April 4, 2008 and Amended as of April 10, 2009.
FIGURE 3: MUNICIPAL FUNDING FRAMEWORK
Federal Contribution
Provincial Contribution
Municipal Contribution
1. Operational Funding2. Infrastructure Funding3. Capital Funding
AC
CO
UN
TA
BIL
ITY
FU
ND
ING
AC
CO
UN
TA
BIL
ITY F
UN
DIN
GTax
Pay
er
Municipal Budget1. Sustainability Strategy2. Consumption of Service 3. Cost of Service Delivery4. Consumption Based Property Tax Distribution Policy
1. Infrastructure Grants2. Capital Grants
1. Infrastructure Grants2. Capital Grants 3. General Grants4. Revitalization Grants5. Transitional Grants
Municipal Sustainability Model

2008 Municipal Sustainability Report City of Powell River
FITZGERALD, STICKELMANN
10 | P a g e
2.3 MUNICIPAL FINANCE RESPONSIBILITIES
There are three major contributors inherent in the Municipal Sustainability Model. These include the Federal Government, the Provincial Government and the Municipal Government. Ultimately, this model recognizes that although there are three different spheres of government, there is only “one taxpayer” — the basis of all revenue sources. The funding formulas in this model do not presume or promote a “one‐way‐street” for revenues from Senior levels of government — without the essential attendant accountability. Our Municipal Sustainability Model is intended to provide transparency and accountability — so that Senior levels of government can have confidence in their municipal funding programs.
FIGURE 4: MUNICIPAL FINANCE RESPONSIBILITIES
2.3.1 FEDERAL FUNDING
The Federal contribution recognizes the importance of municipalities to the national health and wealth of the nation. The role we see for the Federal Government — in providing infrastructure and capital funding for projects that are of “National Significance” — is supporting overall inter‐connectivity and coordination of economic activity.
Federal
Provincial
Municipal
•Infrastructure Funding•Capital Funding
•General Funding•Infrastructure Funding•Capital Funding•Revitalization Funding•Transitional Funding
•General Funding•Operational Funding•Infrastructure Funding•Capital Funding

2008 Municipal Sustainability Report City of Powell River
FITZGERALD, STICKELMANN
11 | P a g e
2.4 PROVINCIAL FUNDING
The Provincial contribution recognizes the importance of municipalities to the overall health and wealth of the province. The role we see for the Provincial Government is more locally oriented and provides support in the following suggested areas, among others:
• General municipal funding that provides a link to the state of the economy. As with any funding from taxes that may fluctuate greatly over short periods of time, it cannot be viewed as fixed funding. Nor should it strive to fund for extreme highs and lows in the economy, but must be balanced so that municipalities of all sizes and economic scale can share in the overall benefits — as the economy of the Province grows.
• Infrastructure funding that ensures provincial inter‐connectivity, and avoids unnecessary duplication of services at all three levels of Government.
• Capital Funding that includes projects, which have a broader range of benefit, not only to the local community but also to the various regions.
• Revitalization Funding for the renewal and regeneration of economic activity within a community.
• Transitional Funding for the short‐term bridging of communities, when sudden economic circumstances beyond their control results in significant hardship.
2.4.1 MUNICIPAL FUNDING
The Municipal Contribution is related primarily to the funding of the ongoing operation of a Municipality. This includes infrastructure and capital funding of primary benefit to the Local Government’s constituents and socio-economic base. In general, Municipal revenue sources comprise of fees for service15
Property tax supported services are defined as those budgetary expenditures not supported either directly by the taxpayer through direct fees for service; other municipal revenues sources; and/or transfers from senior levels of government. As mentioned earlier, property tax is the revenue source that “balances” the municipal budget.
, investment income, parcel taxes and property taxes, among others.
15 Includes: water, sewer, transit, business licences, permit fees, building inspections.

2008 Municipal Sustainability Report City of Powell River
FITZGERALD, STICKELMANN
12 | P a g e
2.4.2 SUSTAINABILITY
Municipal Sustainability is the primary focus of this study and falls within the existing legislative authority of the local government in the provision of general municipal services.
Municipal sustainability centers around service delivery systems, organizational practices, as well as a culture dedicated to the long-term prosperity and health of the community. Achieving sustainability relies on an overall and well-defined strategy aimed at specific targets and performance goals that assess the effectiveness of various programs and provide full accountability to its constituents. One of the key elements of sustainability is the application of “Tax Topography Analysis16”; at its most basic level, it is a “before and after” comprehensive economic analysis of any proposed project17
16 See Tax Topography, Appendix A, The Municipal Sustainability Model, Rob Fitzgerald, Norm Stickelmann, Bob Laurie, and Paul Sullivan, dated April 2008 and updated February 26, 2009.
. It takes into account not only all the initial
capital costs typically accounted for through DCC's (Development Cost Charges), CAC's (Community Amenity Charges) and the like, but also includes the ongoing annual fluctuations in operating revenues and expenses. In addition, “tax topography” further highlights changes to existing consumption patterns and the impacts of a project on the municipal property tax burden of local government. Tax Topography Analysis is NOT intended to constrain or reduce Council decision‐making to simply economic factors; it is intended to ensure that all social, environmental and economic information is made available and therefore considered, prior to decision making. This practice ultimately results in a more informed and sustainable council decision.
17 Examples: a new residential development, a new commercial development, or a new community facility.
Planning
COUNCIL
Tax Topography
Consumption Analysis
Property Tax Distribution
Policy
FIGURE 5: THE ROLE OF PLANNING

2008 Municipal Sustainability Report City of Powell River
FITZGERALD, STICKELMANN
13 | P a g e
2.4.3 THE MUNICIPAL SUSTAINABILITY MODEL
As mentioned earlier The Municipal Sustainability Model is comprised of Four (4) major components shown graphically below:
1. Sustainability Vision/Strategy and corresponding Performance Measures;
2. Consumption of Service Analysis;
3. Cost of Service Delivery Analysis; and
4. Consumption based Tax Distribution Policy.
Sustainability VisionStrategy & Performance Measures
Consumption of ServiceBusiness Classes Adjusted for
“MARGINAL INCOME TAX RATE”
Cost of Service DeliveryFive (5) APMs
Administrative Performance Measures
Consumption Based Tax Distribution Policy
By Assessed Value Within Each Class
MUNICIPALBUDGET
FIGURE 6: MUNICIPAL SUSTAINABILITY MODEL

2008 Municipal Sustainability Report City of Powell River
FITZGERALD, STICKELMANN
14 | P a g e
2.4.4 CITY OF POWELL RIVER SUSTAINABILITY STRATEGY
Based on information obtained from the City's Website, the following extracts reflect the status of Powell River’s Sustainability initiatives:
• When creating a Charter, plans should be long term, at least 50 to 100 years hence, as what we do today may have very little impact tomorrow, but a vast impact in years to come.
• A system of evaluation needs to be set up so that every two years or so a review of progress relating to the Sustainability Charter initiatives can be undertaken. Such a progress review provides feedback to the community, businesses and government on the value of the initiatives that have been taken with the intent of sustainability. Financial savings, reduced air pollution, reduced use of fossil fuels, increased production of local food, and increased health of families adds up to a very positive move in the right direction.
• It seems that from here, we need to assess where we are at right now.
• There then needs to be a resolution made by the City, Regional District, and Tla’Amin adopting the focus on sustainability.
There are some recommendations that have been made to be included in any final version of a Sustainability Charter and the background material it involves. They are:
• To be locally self-sufficient. • Provide education to allow local economic benefit from value added products using
local raw materials. • Increase local food production. • Use environmentally and economically sound materials and technology when
creating residential, commercial and municipal developments. • Use tax breaks and subsidies to encourage sustainable practices and investments. • Enact a Precautionary Principle. • Have a region-wide ban on the use of cosmetic herbicides. • Create and maintain a network of alternative transportation pathways, using the
“Greenways Project” as a starting point. • Map sensitive ecosystems. • Only trees under a certain age can be harvested. • Adopt a zero-waste policy. • Back-call glass and plastic.

2008 Municipal Sustainability Report City of Powell River
FITZGERALD, STICKELMANN
15 | P a g e
• The City to allow mixed-use zoning, affordable housing initiatives, and the use of alternative energy sources within the municipal boundary.
• Enhance community spirit and a sense of belonging. • Work together to benefit the whole. • Inclusivity of our multicultural heritage. • Set examples of changes in perception towards sustainability, staring with local
government. • Emphasize and support our art, music and all creative expressions of culture. • Help those who need help. • Social sustainability is related to how we make choices that affect other humans. • Ensure basic conditions exist for human life to flourish.
ECONOMIC SUSTAINABILITY
The Economic sub-group report the following in their minutes of late May 2008: “Because we are isolated, in the future we will in all likelihood have to take care of most of our needs using local skills and resources. And we will need to provide new forms of employment as the world economy changes. So, when we think about developing our economy, we need to think about doing more with less and about doing everything we can locally.” From the minutes, ideas relating to economic self-sufficiency are:
• Modify the expectation that the economy will continue to grow in terms of profitability.
• Increase local food production dramatically. • Work toward construction of low-cost green housing and other buildings. • Develop self-reliance. • Use less, make less. • Develop jobs and businesses that will meet local needs with less impact on our
environment and our resources. • Reduce imports to Powell River. • Increase local trade and reliance on local products. • Increase production for export. • Find value-added products that we could make and export using local resources and
local skill sets. • Export nothing raw. • Work on ways to get back our resources from private hands or Crown control. • Emphasize prevention and wellness in health care. • Place the common good as the priority.
Also, in the late May 2008 minutes, the Economic sub-group came up with ideas on how to accomplish these ideas, regardless of current legislation:

2008 Municipal Sustainability Report City of Powell River
FITZGERALD, STICKELMANN
16 | P a g e
• Organizing neighbourhood units. • Developing a local currency. • Establishing retraining centres and facilities. • Retaining and developing “homesteading” skills. • Developing and training for new forms of employment with less impact on our
environment and our resources, and more contribution of products and services for local needs.
• Building and exporting prefabricated low-cost green houses. • Promoting all forms of agriculture and aquaculture, and home gardens. • Growing all possible useful crops, including hemp, nuts, fruit suitable for wine-
making, shellfish and kelp. • Using tax breaks and subsidies to encourage sustainable practices and investments. • Building and exporting sailing ships for passengers and cargo. • Changing building codes to permit and encourage green practices. • Training people to take on health care responsibilities to lessen burden on doctors
and other skilled professionals. • Changing zoning to mixed uses. • Learning from pre-contact practices of the Tla’Amin Nation.
The public at the January 19th meeting had roughly the same ideas as those brought to light in the Economic sub-group and youth forum. The words may be different but the intent is generally the same. Ideas that are common to other lists are highlighted.
• Value added, local industry, food growth, community forest, entrepreneurship, skilled workforce, opportunities for youth employment.
• Fund and develop the Arts. Establish a centre for the arts. Develop the cultural economy e.g. Equestrian Centre, Japanese Garden.
• Marketing plan through the Arts Council needed. • Link with First Nations ideas and experience. • Governments should budget for arts, perhaps a tax system (a line item). • Access funding from non-governmental organizations, including private sector. • Examine the culture of greed. • Balance environmental and economic needs. • Set goals and targets that are measurable for business, individual, government,
organizations. • Lobby needed to change provincial legislation, to represent our economic interests • Community owned insurance corporation/cooperative. Local input/control –
community as shareholders. • More public disclosure on the actions of the economic development committee. • Conflict between green energy and tourism development.

2008 Municipal Sustainability Report City of Powell River
FITZGERALD, STICKELMANN
17 | P a g e
• Community input on forestry/fisheries issues and initiatives. Fisheries can be environmentally friendly and sustainable.
• Barter system, self sufficiency, keep skilled workers here, connect hi tech industry to university. Move from ‘free’ market to ‘social’ market. Return profits to community.
• Tax incentives for small industry and hi tech industry. • Infrastructure i.e. high speed internet, develop the economy of the net. • Shop locally. • Draw on people with disabilities to work in local economy. • Sustainable agriculture, organic agriculture, botanic gardens, landscape design,
address meat production, need for local food. Support from City for local farming. Need abattoir. Preserve ALR. Exploit blackberries (antioxidants). Rules and regulations for large agriculture not needed for small local industry.
• Sustainable tourism, eco tourism, agri tourism. e.g. wilderness trails (SD47 – OMB squad), worldwide marketing. ATV trail rides – economic opportunity. Don’t be too reliant on tourism.
• Develop Malaspina as an economic driver – future “college” town. • Business accountability for sustainability. • City supports business sustainability. Is tax burden on small business too heavy? • Incentives for multi use of resources. • Pay as you go – don’t leave debt. Develop scenarios in case the mill closes or fossil
fuels get too expensive. • Incorporate family values into economic development. • Waterfront development, develop port. • Develop Cranberry area, farmers market, encourage local business. • Small business is key, small individually owned shops. • Export – seed production, bees and honey, value added wood products, seafood, and
clean biomass as fertilizer. Lessen raw log exports. Develop value added projects. • Value the entire forest not just the trees, sustainable integrated forest practice, Eco
system based forestry. Community forests. • Zoning – use land for best use, create inventory of lands. Develop policy for land use
planning and regulations. • Green industry. Green housing development/expertise is substantial. Green building
code. Focus on alternative energy, lead the province. • Let Powell River shrink to be sustainable. • Change from being a resource based economy. • What are our resources? Take advantage of existing assets. Identify new industry for
our area that differentiates Powell River from other communities. • Powell River has tremendous diversity of clean ecosystems, including green energy. • Attract investment in new environmental technologies, pilot environmental projects. • Access local, provincial and federal funding to seed innovation, research and
entrepreneurship in the area. Link universities, schools.

2008 Municipal Sustainability Report City of Powell River
FITZGERALD, STICKELMANN
18 | P a g e
• Create a vibrant economy that excites and attracts skilled workers and immigrants. • Small energy projects rather than BIG projects. • Generate and keep wealth in the region. • Economic opportunities as retirement destination. Utilize the full potential of
retirees, working together with youth. • Don’t encourage more retail, especially ‘big box’. Develop bylaws to limit ‘big box’
and fast food. • Work together rather than grinding axes. • Develop ‘good’ jobs – 40 hours per week; pension.
ENVIRONMENTAL SUSTAINABILITY
When the Youth Forum took place in late April, Ryan Barfoot compiled the following notes on the ideas the youth came up with regarding Environmental Sustainability. Students were asked to examine various slides that showed how the earth has transitioned from a state of balance with human resource use to a state of overshoot and crash where resource consumption was outstripping production. Student recommendations on how the environment could be protected and restored included:
• Improved reforestation practices. • Infrastructure for recycling. • Sustainable forestry. • Blanket computer policies – auto shut-offs. • Composting – education and programs at community level. • Environmental education at a young age. • Transport alternatives in our community, province and country. • Extend bus schedule while making services more widespread to include north and
south of town. • Improve transport options to regional district. • Lower the cost of bus travel. • Treat grey water. • Promote carpooling. • Create bike lanes along major roads similar to those found in Gibson and Roberts
Creek. • Lobby federal government for more funding for sustainable projects. • Promote local food consumption. • Local gardens at schools in Powell River. • Sell local food at Schools – or promote it at schools. • Ban plastic bags in Powell River. • Mandatory recycling for all local businesses. • Increase the density of Powell River – all developments should fill in unused areas. • Promote digging up lawns for local vegetation and gardens.

2008 Municipal Sustainability Report City of Powell River
FITZGERALD, STICKELMANN
19 | P a g e
• Address recycling needs for north and south of town residents. • Limit pollution levels. • Promote alternative energy consumption – model this at the municipal level. • Plant more trees in urban areas. • Create car-free zones in town. • Limit city lights in parts of town past 2 am. • Fundraise for renewable energy projects. • Retro-fit old buildings. • Mandate that public buildings should be sustainable. • At the January 19th forum, the public had the following suggestions relating to
Environmental Sustainability. Those ideas discussed by the Environment sub-group and the youth forum have been highlighted.
Sustainability Charter Base Document, Powell River 16:
• Invest in farming. • Regional food supply – increase resilience, lessen dependence. • Eat locally and naturally Re-localization of food. • Powell River has the lead: 50 mile diet, GMO free zone, honey bee quarantine. • There is demand for local produce, food production is an under developed industry. • Low transportation requirements, high employment benefits. • Supports health, education and community spirit. • Sustainability – if organic. • The artisanal model. • Agri tourism. • Retain farm lands as green space, consider that farmlands in other regions are in
short supply. • Collect seaweed for gardens, municipal composting. • Don’t over fish – let herring stocks replenish, salmon, enhance creeks with roe for
increased fish stock. • Protect Eagle River watershed. • GMO Free zone. • Full LRMP process. • Bio diversity mapping. • Create reserves, corridors, recreation and traditional use areas, green belts to
protect urban area Eco based management. • Inventory of toxicity. • Open public process, involve key governing bodies. • Resources are needed to support sustainable environment.

2008 Municipal Sustainability Report City of Powell River
FITZGERALD, STICKELMANN
20 | P a g e
• Energy policy needed, use sustainable energy sources. National Research Council should set standards for all things that use energy, self sufficiency goal – energy independence. Tax incentives for insulating homes.
• Biodiversity as a goal to ensure widest range of options for the future. • Establish a coordinator to act as a resource person for incentives and resources
related to sustainability, and to educate people on alternative choices. • Establish a car pool registry, a designated hitch hiker system. • Learn from others, e.g. Sweden, earthcat.org. • Build local consensus and a vision for 200 years from now – vision statement. • Define the sustainability challenges we face clearly (environmental review), and
communicate them. Who should be involved? Suggestion: Mike Wong, Ministry of Environment. Should be community driven, inclusive. Private land ownership may be a barrier to extended land use.
• There is a sense of urgency about needing to get on with this process. • We need a more pedestrian/bicycle friendly choice of routes, and sidewalks. • Monitor business/development Land fill, sewage, water issues – not all the water in
our area is drinkable, need buffers around the water shed with room for people and water.
• Protect our views. • Adopt smart growth policy. • Stick to the OCP, Municipal plan for land use.

2008 Municipal Sustainability Report City of Powell River
FITZGERALD, STICKELMANN
21 | P a g e
Sustainability Charter Base Document, Powell River 17:
• Set zero waste targets, no plastic or paper bags – bring your own. Provide recyclable batteries.
• local glass recycling for use, make composting mandatory, make recycling more accessible.
• Zero pollution paper industry. Effluent from mill brought to surface rather than to ocean floor.
• Georgia Strait – everyone in the basin is affected by water issues. • Water should remain in public ownership. • The value of our natural capital – how do we measure that, e.g. the air, water and
standing trees. • No tree cutting bylaw in City, no pesticides, use natural grasses, reduce lawn
mowing, soil removal bylaws. • Assure affordability in the future. • Provide tax incentives for environmentally appropriate transportation choices. • A proposal outlining goals for sustainable development and open government has
been developed, presenting key ideas of the emerging global movement towards local economy, sustainable living, and sensible responses to global warming, peak oil, and the corporatization of the public sphere.
• At the very least, clean drinking water, clean air and food on our tables are essential to the health of our community.
SOCIAL AND CULTURAL SUSTAINABILITY
CULTURAL SUSTAINABLITY
At the January 19th forum, the public came up with the following:
• For the charter it is important to define culture, to understand it so that we can know how to sustain it. Federal Definition includes the arts, heritage and culture. Other examples include language.
• Sustain a diversity of culture as there are so many cultures, it has a spiritual value, not just an economic investment.
• For Canadians we have defined ourselves as a compassionate peace loving society but cultural definition as a pluralistic society is difficult.
• Volunteerism is a very rich culture in Powell River; our isolation is to our advantage in this.
• Looking for cross cultural pollination. • One of the unique things about Powell River is the tolerance and compassion that
exists for example PRACL. • We welcome the international community.

2008 Municipal Sustainability Report City of Powell River
FITZGERALD, STICKELMANN
22 | P a g e
• Access for people with disabilities is a cultural strength. • Powell River has a very rich community in terms of arts and culture, much of which
is under developed presently. • Academy of music has had key impact locally and internationally, Kathaumixw. • Music is very important to our community. • Artists are very strong here, writing, poetry, theatre, as well. • People want an inclusive arts centre, that includes a gallery, arts and crafts,
language. • First Nations culture to be included in an arts centre. • People want a library included in an Arts Centre. • Build beauty into buildings. • Encourage First Nations people to develop their arts and culture. • Festivals; music, literary, crafts. • Creativity that allows people to express themselves. • More exploration of sustainability issues related to sports is needed. • Powell River is very receptive to sports and opens their homes to sporting events. • People want more interconnectedness in the community, with green space that
promotes health, accessible transportation network. • Interconnected transportation to access in town events. • Create spaces for outdoor activities such as parks, connected through trails that
bring people together. Physically construct a sense of community, intentionally. • The town site is a valuable historical area and it needs to retain its original footprint • Powell River is diverse, with 20 different cultures in the community, but we don’t
celebrate that. • Keep the natural environment beautiful and healthy. • Community design: wheel chair access, land use, increase bicycles, walking, fresh
water. Redesign neighborhoods and community for inclusiveness, alternate transport.
• Quality of life, address poverty, affordability, and self reliance, be proactive as a community, invest more in leisure, eat local food. Help those who need help, support success.
• First nations traditions – celebrate and integrate. • Examples and information from other communities on cultural sustainability exist • Celebrate our isolation – the positives it brings. • There are two perceptions; one of long term residents, one of new residents. Need to
overcome “isolation” attitude. • Powell River is a community where the unemployment is as close to zero as possible
due to an economy that is vibrant and growing with innovation. An economy that revolves around the most valuable natural resource in this community, its people.
• Powell River should be a place where the natural environment is healthy and accessible, where culture (the arts), the sciences, high technology and resource

2008 Municipal Sustainability Report City of Powell River
FITZGERALD, STICKELMANN
23 | P a g e
extraction (fishing, forestry, mining) flourish and support a social structure that is respectful, fair, compassionate and inclusive.
SOCIAL SUSTAINABILITY
At the January 19th forum the public came up with the following ideas:
• Social activities, youth centre, safe places for kids, protect kids and make a safe community.
• Youth are concerned about unrestricted development; ongoing consultation with youth is needed.
• Ask youth for what they want for the future of Powell River, their vision, the infrastructure that supports youth.
• More support for education in youth – financial support , more accessibility. • More family time. • Promote arts and culture in schools. • Retain young people and target youth for local opportunities. • Identify and target youth at risk and target programs to support youth. • Volunteerism is a rich opportunity in Powell River. • Look at other communities for solutions/ ideas. • We are a culture of collaboration, compassionate and connected. • People want a rural culture, a rural setting. • Need further meetings like this forum on sustainability. • Participation of kids in community events is limited. • Public transportation, activity nodes, housing clusters, larger city hall, bicycling,
public squares, pedestrian only days. • Street communities, neighborhoods are important. Develop the downtown area. • Listening, communicating, better dissemination of information. • Street parties, festivals. • Bridge generation gaps. • Support aging population. • Attract health care practitioners. • CAT scan. • Address drug issues. • Community health forum and education series. • Value added, local industry, food growth, community forest, entrepreneurship,
skilled workforce, opportunities for youth employment. • Human capital, keep university here, ESL, trades training, First Nations Speakers
to schools. • Local education to support ecological and economic development. • Events to educate and engage people about reducing consumption of fossil fuels.

2008 Municipal Sustainability Report City of Powell River
FITZGERALD, STICKELMANN
24 | P a g e
• Post secondary – sustainable agriculture, international education, research, trades. Start apprenticeship in Grade 11 rather than Grade 12.
• Educate and encourage newcomers – stewardship. • Local education to support ecological and economic development. • Student assessment of eco footprint. • Environmental studies. • Research & Education Committee (REC), which will oversee the creation of plans for
sustainable development; and the Political Action Committee (PAC), which will research the political opportunities and the electoral process, in an effort to find or support candidates for political office who will work with the community to develop and implement our sustainable development plans.
• Examine existing and proposed Brooks/Malaspina initiatives. • Safe affordable and accessible. • Use local natural materials for housing. • Coop and condo housing needed. • Carbon friendly building suppliers. • Infilling for urban development should be considered before new subdivisions are
made. • Update older buildings.

2008 Municipal Sustainability Report City of Powell River
FITZGERALD, STICKELMANN
25 | P a g e
2.5 CONSUMPTION OF SERVICES
2.5.1 CONSUMPTION OF SERVICE METHODOLOGY
The allocation of Consumption is a three-step process. Initially all budget items are categorized into one of the following Administrative Performance Measures (APMs):
• General Government; • Security; • Planning & Development; • Engineering; and • Parks, Recreation and Culture.
Secondly, revenues and expenditures are ascribed an INTER–Class Allocation i.e., between Residential and Non-Residential. All revenues and expenditures are individually evaluated and assigned, based on a driver(s) best suited to the individual line item. The following INTER--Class Categories are discussed below:
1. Residential: Includes Class 01―Residential, Class 03―Support Housing, Class 08―Recreation/Non-Profit, and Class 09―Farm.
2. Non‐Residential: Includes Class 02―Utilities, Class 04―Major Industry, Class 05―Light Industry, Class 06―Business/Other, and Class 07―Managed Forest Land.
Residential activities are those, which for personal consumption or benefit are related to personal accommodation, recreational, social or cultural activities. In general, these can also be viewed as quality of life issues and are not expected to generate economic activity18
Non–Residential activities are those, which directly establish, promote or enhance economic activity within the City e.g. those activities in Powell River related to tourism.
.
18 Example: a park in a neighbourhood that has no commercial properties within a reasonable distance.

2008 Municipal Sustainability Report City of Powell River
FITZGERALD, STICKELMANN
26 | P a g e
While some revenues and expenditures are clearly Residential or Non-Residential, the majority have a component of both and lie somewhere on the continuum shown below.
The third step is referred to as the INTRA-Class Allocation, which assigns costs and revenues to the individual classes within each INTER-Class Allocation.
At the present time there is no measure used either by the Provincial or Local Governments to assess the proportional changes in the relationship of property tax rates, to the changes in overall assessments and taxes paid by each class of property. Tax Rate ratios measure the relationship of tax rates compared to the Residential rate, but do not take into account ongoing changes in the relationship between the total assessed values and the total taxes paid by each particular Class. The Levy‐Assessment Quotient developed by the authors, and shown in the charts later on in this report, measures the deviation in the tax rates caused by proportional changes in the relationship between assessed values and the comparative local government taxes paid by each class of property. This analysis becomes a more revealing factor over time as the Levy Assessment Quotient Graph visually demonstrates the changes or "shifts" in the relationship, which would not otherwise be obvious from a survey of administrative tools available today.
Further, Professor Kesselman (Kesselman, 2008) opines, “BC’s provision of discretion over the relative tax rates was intended to allow municipalities to make a closer match between the costs of providing services to, and the taxes paid by each class of property, but the system has evolved in the opposite direction”. He also recognizes that determining consumption “requires complex and often arbitrary estimates to allocate the services to the various property classes”. The authors suggest that the development of a robust consumption methodology can be refined over time. Even in its basic form, consumption analysis is less arbitrary than the current “politically” and "perception" based tax distribution model (“PbC”). Residential and Non–Residential property taxes payable under a Consumption Based Tax Distribution Policy (“CbC”) are made comparable or equitable by further adjusting the Non–Residential result by the combined Federal and Provincial marginal tax rate, to account for the deductibility of property taxes on the business’s income tax return. This effectively ensures that both the Residential and Non–Residential sectors pay property taxes on the same relative after–tax basis.
FIGURE 7: CONSUMPTION CONTINUUM
Used or held solely for personal, recreational,
social or cultural activities. No expectation to
generate economic activity
Used or held solely for the purpose of establishing, promoting or enhancing
economic activity

2008 Municipal Sustainability Report City of Powell River
FITZGERALD, STICKELMANN
27 | P a g e
A key component inherent in the Municipal Sustainability Model is the Consumption of Services Analysis. Consumption patterns define which segments of the municipality’s constituents are utilizing City services. The focus here is on the property owner as the primary consumer of City services, rather than evaluation of the final beneficiary e.g. tenants and licencees. Therefore, all services are treated as if they are consumed by existing City property owners. While it is understood that non–residents19
2.5.2 CONSUMPTION BASED TAX DISTRIBUTION POLICY CALCULATION
and non--
property owners consume some City services, there is no known and practical methodology to directly allocate property taxes (based on assessed values) to non-residents or non-property owners. Such an analysis is beyond the scope of this undertaking.
Determination of the final Consumption Based Tax Distribution allocation requires two adjustments to the resultant consumption outcomes for each class of property. These adjustments ensure that property taxes are paid on an “equitable as well as an equivalent income tax basis”, e.g. businesses can subtract property tax as a business expense when filing their income tax return, whereas a resident cannot — hence an adjustment is required. These adjustments are not intended to represent “arbitrary” social payments, which would be inconsistent with the principles inherent in the Municipal Sustainability Model. In the application of the Municipal Sustainability Model all consumption costs associated with each class of property are assigned to that class in the first stage of the consumption analysis.
Once the actual class consumption base amount has been calculated, the first adjustment is the subtraction of Federal and Provincial Grants, (excluding payments in‐lieu of property taxes and reserve revenues). This deduction from each of the property classes’ consumption amount is based on a summation of the individual grants and reserve allocations determined through the application of various budget drivers. Unconditional grants are allocated based on the final overall consumption pattern. Grants or other monies from the Provincial and Federal Government are already paid from tax‐supported dollars; therefore, no further tax adjustments are required for the grants. The result is the Net Value of Consumption per class "before" the adjustment for the Marginal Tax Rate for business — the second and final adjustment.
It bears repeating that the function of the Marginal Tax Rate adjustment in this model is not an arbitrary redistribution for “social funding” or other such allowance. Rather, as mentioned earlier, it recognizes that Non‐Residential properties pay property taxes “before” calculating income taxes, while Residential properties pay property taxes “after” paying income tax.
19 Individuals or businesses that do not own or occupy space within the studied municipality.

2008 Municipal Sustainability Report City of Powell River
FITZGERALD, STICKELMANN
28 | P a g e
The aforementioned calculations and adjustments simply ensure that all property classes pay an equivalent amount in property taxes for the value of the services consumed.
2.5.3 ADJUSTED MARGINAL CORPORATE TAX RATE
The Marginal Tax Rate for 200820 is determined from the total income tax rate for General Active Business. This is a combination of the Federal Tax Rate (19.5%) and Provincial Tax Rate (11.5%21), for a total of 30%. This total reflects the tax rate paid on the last dollar of income earned. As with all other components of the Municipal Sustainability Model, property tax allocation to classes is based on the resultant net consumption value for
each class. As stated earlier, the intent of the Marginal Tax Rate Adjustment is to recognize that Non–Residential properties can “deduct" property taxes from income when calculating their income taxes. The objective is to ensure that all properties pay for services in equal
terms.
20 From http://www.kpmg.ca/en/services/tax/taxrates.html. 21 British Columbia Income Tax Rate decreased from 12% to 11% on July 1, 2008. Average 11.5% used.
•Consumption of Services (Expenditures Only)(From Line-By-Line Budget Analysis)
-•Provincial / Federal Grants / Transfers from Reserves(Excludes Grants-in-Lieu of Taxes)
=•Net Consumption Before Adjustment for Marginal Tax Rate
+/-•Marginal Corporate Tax Rate Adjustment
(Deductibility of Property Tax by Non-Residential Properties)
= •Net Consumption
FIGURE 8: CALCULATION OF NET CONSUMPTION

2008 Municipal Sustainability Report City of Powell River
FITZGERALD, STICKELMANN
29 | P a g e
2.5.3.1 ILLUSTRATION OF MARGINAL TAX RATE APPLICATION
As the illustration shows, to achieve fairness and equity in distribution of property taxes, 50% of the total marginal tax rate must be transferred from Non–Residential properties to Residential properties, thereby assuring all properties pay for services in
equivalent monetary terms. (See Adjoining Table 7 – Scenario 3).
Assumptions:Tax Bill Paid by Residential 1,000$ Tax Bill Paid by Non-Residential 1,000$ Marginal Tax Rate 30%
Unadjusted Marginal Tax Rate
Scenario 1 (Actual Taxes Paid - No Adjustment for Marginal Tax Rate) Residential
Non-Residential
Property Tax Paid to Municipality 1,000$ 1,000$ Deductibility from Income Tax - (300) Marginal Tax Rate Adjustment - - Effective Property Taxes Paid 1,000$ 700$
Subsidy Marginal Tax Rate
Scenario 2 (Actual Taxes Paid - Full Marginal Tax Rate Transferred) Residential
Non-Residential
Property Tax Paid to Municipality 1,000$ 1,000$ Deductibility from Income Tax - (300) Marginal Tax Rate Adjustment (300) 300 Effective Property Taxes Paid 700$ 1,000$
Equalized Marginal Tax Rate
Scenario 3 (Actual Taxes Paid - 50% of Marginal Tax Rate Transferred) Residential
Non-Residential
Property Tax Paid to Municipality 1,000$ 1,000$ Deductibility from Income Tax - (300) Marginal Tax Rate Adjustment (150) 150 Effective Property Taxes Paid 850$ 850$
$-
$200
$400
$600
$800
$1,000
$1,200
Scenario 1 Scenario 2 Scenario 3
Residential
Non-Residential
TABLE 7: MARGINAL TAX RATE EXAMPLE
FIGURE 9: MARGINAL TAX RATE GRAPH

2008 Municipal Sustainability Report City of Powell River
FITZGERALD, STICKELMANN
30 | P a g e
2.5.4 OTHER BENEFITS AND COSTS
External benefits and costs are often seen as a barrier to the application of a consumption‐based economic model. A question commonly asked is “How can one fairly allocate these costs if they can’t be directly quantified?” The authors suggest that from
this line of reasoning one might ask, “Why measure anything if you can’t measure everything”, which would be absurd. To quote Emeritus Professor Bish (Bish, September, 2004) “Allocating costs among property classes is a natural evolution of the transition of the property tax to a benefits‐received tax in relation to different classes of property as well as to geographically‐defined groups. British Columbia’s variable tax rate system allows such a trend.” Bish also
suggests that, “The closer the match between costs of providing services and taxes paid (through user charges where feasible, or for relatively small, geographically‐defined user groups), the more likely location and investment decisions will be efficient and therefore contribute to increasing productivity in the economy.”
2.5.4.1 EXTERNAL BENEFITS
External benefits are those, which accrue to the City but are directly related to expenditures made by those external to the City. An example of this is the indirect benefit, which accrues to the local jurisdiction and tourism industry, from a local port or airport.
FIGURE 10: ILLUSTRATION OF NET CONSUMPTION CALCULATION
Consumption of Services
(Expenditures Only)
(From Line-by-LineBudget Analysis)
Provincial / Federal Grants / Transfers
from Reserves
(Exclude Grants-In-Lieu of Taxes)
LESS
EQUALS
Net Consumption Before Adjustment
for Marginal Tax Rate
SUBTRACT / ADD
Marginal Corporate Tax Rate Adjustment
(To Account for Deductibility of Property Tax by Non-Residential Properties)
EQUALS
Net Consumption
Determines Tax Levy

2008 Municipal Sustainability Report City of Powell River
FITZGERALD, STICKELMANN
31 | P a g e
2.5.4.2 EXTERNAL COSTS
External Costs are the result of the cross charging (or lack thereof) of activities and services provided by local governments to non‐residents. City constituents pay both directly through user fees and indirectly through property taxation. Nevertheless, when members from another external property tax jurisdiction consume these benefits and services, the external member does not contribute by way of a property tax payment. This is often referred to as the “free rider” issue, which to the best of the author’s knowledge has not been formally studied in British Columbia.
2.5.5 CONSUMPTION OF SERVICE ANALYSIS
Consumption of Service Analysis is a tool designed as an empirical technique for an appropriate apportionment of property taxes between the legislated classes of properties. To the best of the Author’s knowledge, existing distribution policies are based mainly on historical practices and have not necessarily kept pace with a rapidly changing world. In essence, Consumption of Service Analysis is a detailed examination of the budget aimed at (a) determining how much each property class consumes of City Services, and (b) how much is contributed through various other fees, charges and taxes. Net Consumption determines the apportionment between the classes. As mentioned earlier, this Report calculates the price of availability and likely need for services by each class of property, rather than actual consumption or use by an individual property owner/occupier.

2008 Municipal Sustainability Report City of Powell River
FITZGERALD, STICKELMANN
32 | P a g e
2.5.5.1 NET CONSUMPTION OF SERVICE RESULTS — CITY OF POWELL RIVER
The Net Consumption of Service22
The following is a summary of the detailed budget analysis for the City of Powell River:
result is the key baseline conclusion in determining fair and equitable tax distribution. At Net Consumption of Services, all properties are paying fully for the services consumed in adjusted after–tax income. At this stage, each class is paying only for the services consumed — without any subsidization to or from any other class.
TABLE 8: CONSUMPTION ALLOCATION (%)
TABLE 9: CONSUMPTION ALLOCATION 23 ($) 24
22 See Consumption Based Tax Distribution Policy Calculation.
23 A variance of $7,170 exists between the data provided by the City and Provincial Statistics due to differences in calculation methodologies used by the City and the Province. The Taxes Paid Calculation translates the Provincial percentages using the City's Budget. Actual Property Tax Levy Paid includes the Residential Flat Tax, and percentages include the Residential Flat Tax. Percentages in Provincial Statistics exclude the Residential Flat Tax. 24 Allocation process results in an additional $6 rounding difference, which is not considered material. Utilities show a credit as the budget already includes receipt of 1% of Revenues (Section 353 of the Local Government Act) that are paid in–lieu of General Municipal property tax.
1 (Res)3 Supp
Hsg 8 (Rec NP) 9 (Farm) Total Res 2 (Util) 4 (Maj Ind) 5 (Lgt Ind)6 (Bus
Oth)7 (Mng
For)Total Non
ResTotal Municipal Expenditures 57.042% 0.000% 0.356% 0.084% 57.483% 0.096% 6.550% 1.450% 33.471% 0.950% 42.517%Adjust for: Grants / Reserves 39.890% 0.000% 0.064% 0.019% 39.972% 0.022% 8.899% 2.005% 47.709% 1.393% 60.028%Consumption after Grants & 61.687% 0.000% 0.436% 0.102% 62.225% 0.117% 5.914% 1.299% 29.615% 0.830% 37.775%Marginal Tax Rate Adjustment 0.000% 0.000% 0.000% 0.000% -9.106% 0.000% 0.000% 0.000% 0.000% 0.000% 15.000%Consumptions After Marginal Tax
56.070% 0.000% 0.396% 0.093% 56.558% 0.134% 6.801% 1.494% 34.058% 0.954% 43.442%
Less: Revenues 46.091% 0.000% 0.277% 0.055% 46.423% 4.585% 8.207% 1.660% 38.140% 0.986% 53.577%Net Consumption with the Class 63.345% 0.000% 0.483% 0.120% 63.948% -3.110% 5.777% 1.374% 31.080% 0.931% 36.052%
36.052%2008 Actual $ of Property Tax Levy
48.886% 0.000% 0.239% 0.024% 49.150% 0.299% 34.940% 0.372% 15.231% 0.008% 50.850%
* Note: Calculated based on % of Total Levy reported in 2008 Provincial Statistics (sch707_2008.xls)
1 (Res) 3 Supp Hsg 8 (Rec NP) 9 (Farm) Total Res 2 (Util) 4 (Maj Ind) 5 (Lgt Ind) 6 (Bus Oth) 7 (Mng For)Total Non
ResTotal Municipal Expenditures 16,615,365$ - 103,823$ 24,531$ 16,743,727$ 28,107$ 1,907,946$ 422,314$ 9,749,562$ 276,609$ 12,384,539$ Adjust for: Grants / Reserves (2,476,061) - (3,955) (1,186) (2,481,201) (1,349) (552,370) (124,480) (2,961,422) (86,469) (3,726,091) Consumption after Grants & 14,139,304$ - 99,868$ 23,345$ 14,262,526$ 26,758$ 1,355,576$ 297,834$ 6,788,140$ 190,140$ 8,658,448$ Marginal Tax Rate Adjustment (1,287,546) - (9,094) (2,126) (1,298,767) 4,014 203,336 44,675 1,018,221 28,521 1,298,767 Consumptions After Marginal Tax
12,851,758$ - 90,774$ 21,219$ 12,963,759$ 30,772$ 1,558,912$ 342,509$ 7,806,361$ 218,661$ 9,957,215$
Less: Revenues (4,454,415) - (26,769) (5,277) (4,486,461) (443,065) (793,131) (160,426) (3,685,974) (95,267) (5,177,865) Net Consumption with the Class 8,397,343$ - 64,005$ 15,942$ 8,477,298$ (412,293)$ 765,781$ 182,083$ 4,120,387$ 123,394$ 4,779,350$
2008 Actual $ of Property Tax Levy
6,477,191 - 31,648 3,218 6,512,057$ 39,644$ 4,629,364$ 49,293$ 2,018,054$ 1,072$ 6,737,427$ * Note: Calculated based on % of Total Levy reported in 2008 Provincial Statistics (sch707_2008.xls)

2008 Municipal Sustainability Report City of Powell River
FITZGERALD, STICKELMANN
33 | P a g e
On a Gross Expenditure level, Residential properties consumed 57.5% and Non-Residential properties consumed 42.5% of Total Municipal Expenditures. After deducting for revenue sources not directly related to consumption, Residential properties accounted for 62.2% and Non-Residential properties accounted for 37.8% of consumption after Grants and Reserves. Adjusting for the current Marginal Tax Rate25
The table below demonstrates which category
and then applying revenues paid directly to the City as fees-for-service, 63.9 % f the total consumption–based property tax levy is attributed to Residential, and 36.1% of the total consumption–based property tax levy is related to Non-Residential.
26
of property is consuming City services, and the extent to which each category pays for their consumption. It bears repeating that property tax is the revenue source used to balance the Municipal Budget. Determining a sustainable, fair and equitable tax distribution is a challenging prospect, particularly in the absence of a universally acceptable, transparent and systematic methodology. Under the current property tax system there is no method of relating the cost of providing services to those classes who pay for them through property tax.
FIGURE 11: ACTUAL TAX DISTRIBUTION COMPARED TO CONSUMPTION BASED TAX DISTRIBUTION
25 See 2.5.3.1 Illustration of Marginal Tax Rate Application (Net 15% to each Residential and Non-Residential). 26 Residential or Non-Residential
2008 Actual Tax Levy Paid, 49.150%
2008 Actual Tax Levy Paid, 50.850%
2008 Net Consumption, 63.948%
2008 Net Consumption, 36.052%
0.000% 10.000% 20.000% 30.000% 40.000% 50.000% 60.000% 70.000%
Residential
Non-Residential
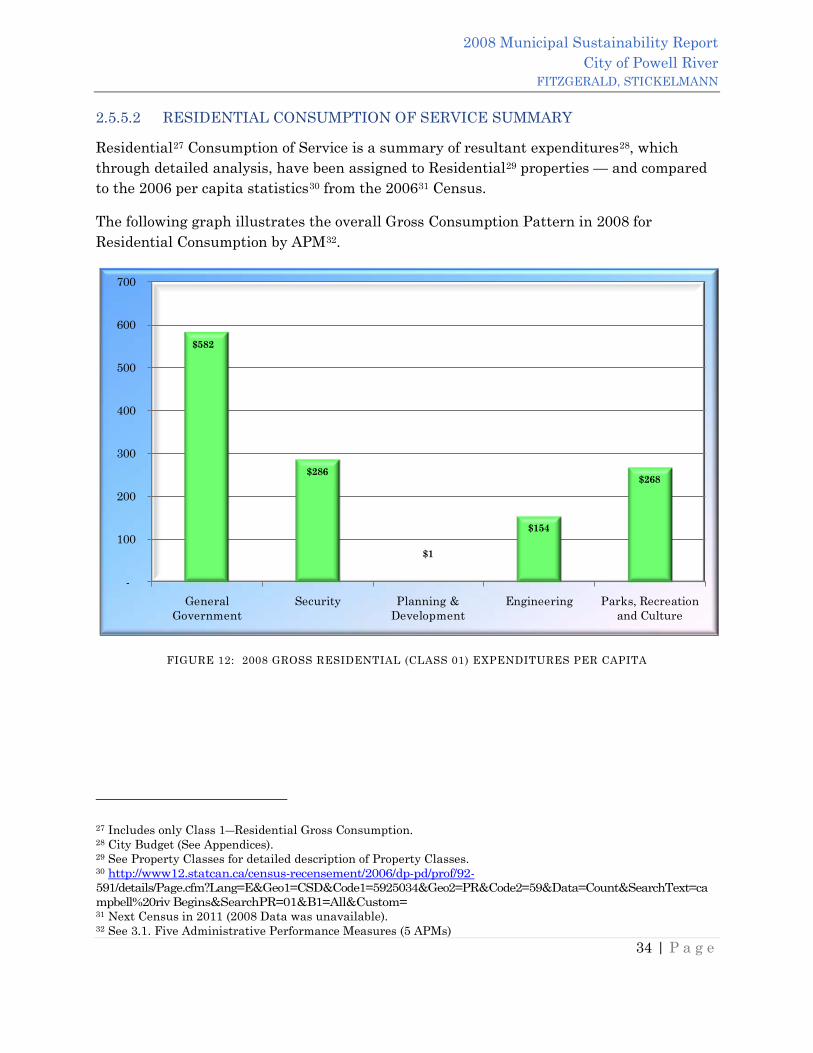
2008 Municipal Sustainability Report City of Powell River
FITZGERALD, STICKELMANN
34 | P a g e
2.5.5.2 RESIDENTIAL CONSUMPTION OF SERVICE SUMMARY
Residential27 Consumption of Service is a summary of resultant expenditures28, which through detailed analysis, have been assigned to Residential29 properties — and compared to the 2006 per capita statistics30 from the 200631
The following graph illustrates the overall Gross Consumption Pattern in 2008 for Residential Consumption by APM
Census.
32
.
FIGURE 12: 2008 GROSS RESIDENTIAL (CLASS 01) EXPENDITURES PER CAPITA
27 Includes only Class 1―Residential Gross Consumption. 28 City Budget (See Appendices). 29 See Property Classes for detailed description of Property Classes. 30 http://www12.statcan.ca/census-recensement/2006/dp-pd/prof/92-591/details/Page.cfm?Lang=E&Geo1=CSD&Code1=5925034&Geo2=PR&Code2=59&Data=Count&SearchText=campbell%20riv Begins&SearchPR=01&B1=All&Custom= 31 Next Census in 2011 (2008 Data was unavailable). 32 See 3.1. Five Administrative Performance Measures (5 APMs)
$582
$286
$1
$154
$268
General Government
Security Planning & Development
Engineering Parks, Recreation and Culture
-
100
200
300
400
500
600
700

2008 Municipal Sustainability Report City of Powell River
FITZGERALD, STICKELMANN
35 | P a g e
2.5.5.3 GROSS NON-RESIDENTIAL CONSUMPTION OF SERVICE SUMMARY
Non‐Residential Consumption of Service is a summary of the resultant expenditures33, which through detailed analysis — have been assigned to Non‐Residential34 properties — and are then compared to the number of jobs. Total jobs are estimated by subtracting jobs associated with Residential Properties (e.g. Public Sector35
The following graph illustrates the Gross Consumption of Services in 2008 for Non–Residential Consumption by APM
employees and Residential Care Facility jobs).
36
.
FIGURE 13: 2008 GROSS NON-RESIDENTIAL EXPENDITURES PER PRIVATE–SECTOR JOB
33 2008 City Budget (See Appendices). 34 See Property Classes for detailed description of Property Classes. 35 Includes local, municipal and regional public administration, aboriginal public administration, education service and hospital jobs. (Data obtained from Statistics Canada Total - Occupation - National Occupational Classification for Statistics 2006 – Powell River). 36 See 3.1. Five Administrative Performance Measures (5 APMs)
$1,442
$132$204
$257
$101
General Government
Security Planning & Development
Engineering Parks, Recreation and Culture
-
200
400
600
800
1,000
1,200
1,400
1,600

2008 Municipal Sustainability Report City of Powell River
FITZGERALD, STICKELMANN
36 | P a g e
2.5.5.4 LEVY–ASSESSMENT–QUOTIENT (LAQ)
To determine the extent to which tax shifting has taken place the authors have developed the “Levy–Assessment–Quotient (LAQ)”. The Levy-Assessment-Quotient is an expression of the relationship between the property assessment and local government taxes paid by each class of property. Effectively, it is a ratio, which shows the percentage of the levy paid by each class, for every one percent of value in the assessment base. The analysis of this factor over time defines the changes or shifts in the percentage relationship and is called the “Levy–Assessment–Quotient Shift (LAQS)”. It is the author’s belief that the Levy–Assessment–Quotient is a superior tool in the measurement of changes in tax rates — relative to the current practice of comparing tax rates as a ratio to the residential rate, which is always held at one (1).
FIGURE 14: CITY OF POWELL RIVER LAQ GRAPH
26.58%
9.35%
62.25%
38.80%
0.43 0.38 0.45 0.49 0.51 0.54 0.56 0.57 0.56
2.34
4.95
4.02
3.41 3.54 3.61 3.72
4.12 4.15
-
1.00
2.00
3.00
4.00
5.00
6.00
0%
10%
20%
30%
40%
50%
60%
70%
80%
90%
100%
1991 1996 2001 2002 2003 2004 2005 2006 2007
Perc
enta
ge
District of Powell RiverLevy-Assessment-Quotient-Shift: Class 1 vs Class 4
% of Assessment (Class 1) % of Levy (Class 1) % of Assessment (Class 4) % of Levy (Class 4)Levy-Assessment Quotient (Class 1) Levy-Assessment Quotient (Class 4)

2008 Municipal Sustainability Report City of Powell River
FITZGERALD, STICKELMANN
37 | P a g e
2.5.6 COST OF SERVICE DELIVERY ANALYSIS
Cost of Service Delivery is a secondary analysis, (not used for property tax distribution calculations) — but as a measure of the effectiveness and efficiency in the delivery of services — by and for the City's Council, Administration and Taxpayers.
There are several statistics that are now available, which can be used to broadly evaluate and compare the efficiency and effectiveness of the Administration in delivering services and implementing its sustainability strategies.
Cost of Service Delivery Analysis provides a limited tool for comparing the overall administrative performance of Local Government based on population and jobs (see DISTRIBUTION OF TIME driver or JOBS37
). Variations are possible by stratifying data e.g. all residents over the age of 15. This data is currently available from Provincial Statistics. Its value becomes more evident when compared to other years of municipal administration.
37 Calculated by subtracting FTEs (See 4.1.7. FULL-TIME EQUIVALENT DRIVER) from Estimated Workforce (See Appendix 7.7. DISTRIBUTION OF TIME (Detailed Calculation).

2008 Municipal Sustainability Report City of Powell River
FITZGERALD, STICKELMANN
38 | P a g e
2.5.6.1 GROSS COST OF SERVICE DELIVERY
Gross Expenditures define the actual consumption of services provided by the City. The graph summarizes the Cost of Service Delivery as a whole and is designed to assist with not only general year–over–year comparisons within the Municipality, but also as a general indicator of efficiencies compared to other Municipalities. Residential properties are measured on a per capita basis and Non–Residential properties are compared using Jobs. Determining the efficiency of service delivery is critical to the long–term sustainability of the City. This analysis provides Local Governments with a comparative tool to measure the performance and efficiency of programs and services offered — particularly if consumption targets are established within an overall sustainability strategy. It also creates a high degree of accountability to Taxpayers and other senior levels of government.
$93 $207
$1,227
$2,744$345
$771
$269
$602
$313
$699
Cost per Res Resident Cost per Job$-
$1,000
$2,000
$3,000
$4,000
$5,000
$6,000
Planning & Development General Government Security
Engineering Parks, Recreation and Culture
FIGURE 15: GROSS COST OF SERVICE DELIVERY

2008 Municipal Sustainability Report City of Powell River
FITZGERALD, STICKELMANN
39 | P a g e
GROSS COST OF SERVICE DELIVERY (PER CAPITA AND PER JOB)
The following chart is a comparison of Gross Expenditures compared to both population and the number of jobs excluding City Full-Time Employees. Total jobs are estimated by subtracting jobs not associated with the Non-Residential Property Classes (e.g. Public Sector38
employees and Residential Care Facility jobs).
FIGURE 16: 2008 GROSS COST OF SERVICE DELIVERY (PER CAPITA AND PER JOB)
38 Includes local, municipal and regional public administration, aboriginal public administration, education service and hospital jobs. (Data obtained from Statistics Canada Total - Occupation - National Occupational Classification for Statistics 2006 – Powell River.
$2,744
$771 $207
$602
$699
$1,227
$345
$93 $269
$313
General Government
Security Planning & Development
Engineering Parks, Recreation and Culture
-
500
1,000
1,500
2,000
2,500
3,000
Cost per Job Cost per Res Resident

2008 Municipal Sustainability Report City of Powell River
FITZGERALD, STICKELMANN
40 | P a g e
2.6 PROPERTY CLASSES
Property Classes are defined under the Assessment Act and form the basis for allocation of property taxes determined by “use” of the property.
2.6.1 RESIDENTIAL
Residential properties consist of the following property classes (generally of a non-commercial nature) as defined in the Assessment Act39
2.6.1.1 CLASS 01―RESIDENTIAL
. A brief description is provided below:
Includes land or improvements, or both, used for residential purposes, including single–family residences, duplexes, multi–family residences, apartments, condominiums, manufactured homes, nursing homes, rest homes, summer and seasonal dwellings, bunkhouses, cookhouses and ancillary improvements compatible with and used in conjunction with any of the above. Also included is certain strata–accommodation property not otherwise excluded from Class 01―Residential.
2.6.1.2 CLASS 03―SUPPORTIVE HOUSING
Includes only the eligible supportive housing property specifically designated in Schedule B of the Regulation. This is a new class introduced in 2008 and data is not yet available for INTRA–Class allocations in this report. There are no Class 03―Supportive Housing properties currently in the City of Powell River.
2.6.1.3 CLASS 08―RECREATIONAL PROPERTY / NON–PROFIT ORGANIZATION
Includes ONLY land, but not improvements on that land, used solely as an outdoor recreational facility for the activities or uses such as golf, skiing, tennis, ball games of any kind, lawn bowling, public swimming pool, motor car racing, trap shooting, archery, ice skating, waterslides, museums, amusement parks, horse racing, rifle shooting, pistol shooting, horseback riding, roller skating, marinas, parks and gardens open to the public, hang gliding, bicycling or camping. Also included are land and improvements used or set aside for use as a place of public worship or as a meeting hall for a non–profit fraternal organization.
Although some of these properties may have a Non–Residential use, not all of the allowable uses would meet this definition. In general, the number and value of these properties is nominal — when compared to the total assessment value in the municipality. In
39 B.C. Reg. 4499/2003, s.1, Part 1 ― Prescribed Classes of Property.

2008 Municipal Sustainability Report City of Powell River
FITZGERALD, STICKELMANN
41 | P a g e
addition, the uses that may be viewed as Non–Residential generally relate to recreational activities.
2.6.1.4 CLASS 09―FARM
Farm Class includes ONLY land classified as farmland, used to produce agricultural products. As with Class 08―Recreational / Non–Profit, the total of farm class value is nominal when compared to the total assessment value in the municipality.

2008 Municipal Sustainability Report City of Powell River
FITZGERALD, STICKELMANN
42 | P a g e
2.6.2 NON-RESIDENTIAL
Non‐Residential properties consist of the following property classes — generally of a commercial nature as defined in the Assessment Act40
2.6.2.1 CLASS 02―UTILITIES
. A brief description is provided below:
Includes land or improvements, or both, used or held ancillary to the business of transportation by railway; transportation, transmission or distribution by pipeline; telecommunications; generation, transmission or distribution of electricity; or receiving, transmission and distribution of closed circuit television e.g. BC Hydro, Terasen Gas, CP Rail, CN Rail, Shaw Cable, Telus, Bell.
2.6.2.2 CLASS 04―MAJOR INDUSTRY
Includes land used in conjunction with the operation of industrial improvements such as lumber mills, pulp mills, heavy manufacturing, mining, smelting, shipbuilding, and loading terminals e.g. Catalyst Paper Corporation.
2.6.2.3 CLASS 05―LIGHT INDUSTRY
Includes land used for the purpose of extracting, processing, manufacturing or transporting of products, or for the storage of products ancillary to or in conjunction with the extracting, processing, manufacturing or transporting of products.
2.6.2.4 CLASS 06―BUSINESS AND OTHER
Includes everything not included in another class. Examples include offices, retail, hotels and motels, and certain warehousing.
2.6.2.5 CLASS 07―MANAGED FOREST
Includes ONLY land that meets the definition of managed forest land.
40 B.C. Reg. 4499/2003, s.1, Part 1 ― Prescribed Classes of Property.

2008 Municipal Sustainability Report City of Powell River
FITZGERALD, STICKELMANN
43 | P a g e
3 METHODOLOGY
This study focuses ONLY on municipal service delivery expenditures supported by general property taxation revenues. The scope of this study is limited to General Operating Budget and excludes capital and other non‐operating items.
3.1 FIVE (5) ADMINISTRATIVE PERFORMANCE MEASURES (5 APMS)
Municipal expenditures are broken down into five (5) general categories. These represent the major areas of responsibility common to all municipalities. The categories are:
• General Government; • Security; • Planning and Development; • Engineering; • Parks, Recreation and Culture.
3.1.1 GENERAL GOVERNMENT
The General Government APM consists of the executive and general administrative functions exercised for the City as a whole, and does not generally correlate with any specific activity.
3.1.2 SECURITY
The Security APM consists of those activities related to the protection of life and property i.e. 911, Police, Fire, Search and Rescue.
3.1.3 ENGINEERING
The Engineering APM includes those activities related to the operation of various community facilities and infrastructure such as water, sewer, storm–water and roads.
3.1.4 PLANNING AND DEVELOPMENT
The Planning and Economic Development APM refers to those activities that ensure sustainable development and promotes the economic well being of the community.

2008 Municipal Sustainability Report City of Powell River
FITZGERALD, STICKELMANN
44 | P a g e
3.1.5 PARKS, RECREATION AND CULTURE
The Parks, Recreation and Culture APM relates to activities and facilities that enhance the lifestyle and health of the community. This measure generally includes items such as parks, sports and recreational programs, and support for the Arts.

2008 Municipal Sustainability Report City of Powell River
FITZGERALD, STICKELMANN
45 | P a g e
4 2008 BUDGET ANALYSIS BY APM
4.1 GENERAL GOVERNMENT APM
General government APM consists of the executive and general administrative functions exercised for the benefit of the City as a whole. In addition, revenues and expenditures do not generally relate to any specific activity, but benefit the City overall. General government expenditures and revenues are based on the allocation of total direct revenues and expenditures for the City that relate to General Government.
4.1.1 TAXATION
4.1.1.1 PROPERTY TAXES COLLECTED
Property or "General Purpose - Tax"41
accounts, are classified under General Government and excluded from consumption analysis. The final distribution of this revenue in the British Columbia Municipal Sustainability Model is allocated and determined by the result of the Consumption of Service Analysis, adjusted for the “Marginal Tax Rate for Business.” In the City of Powell River taxes collected for each class are segregated into separate Accounts. The Property Taxes to be levied in the 2008 budget for rate setting purposes were as follows:
TABLE 10: 2008 PROPERTY TAX LEVY
PPortion of Budget to be collected from Property Taxes as provided by the City.
Account Consultant Cost Category2008 Original
Budget
% of Total Property
TaxesProperty Tax - Residential (Note 1) Property Taxes Collected (6,373,885) 47.9%Property Tax - Utilities (Note 2) Property Taxes Collected (39,643) 0.3%Property Tax - Managed Forest Land Property Taxes Collected (1,072) 0.0%Property Tax - Major Industry Property Taxes Collected (4,629,363) 34.8%Property Tax - Light Industry Property Taxes Collected (49,293) 0.4%Property Tax - Business/Other Property Taxes Collected (2,190,728) 16.4%Property Tax - Recreation/Non-Profit Property Taxes Collected (31,647) 0.2%Property Tax - Farm Property Taxes Collected (3,218) 0.0%
(13,318,849)
Notes1. Includes Flat Tax2. Excludes 1% of Revenues Paid under S353 of the Local Government Act in-lieu of General Municipal Taxes

2008 Municipal Sustainability Report City of Powell River
FITZGERALD, STICKELMANN
46 | P a g e
4.1.1.2 UTILITY TAXES (1% OF REVENUES)
Utility Tax is a tax paid by Utility Companies on certain improvements used solely for local benefit. This is paid "in–lieu" of General Municipal property taxes under Section 353 of the Local Government Act— that would otherwise have been paid. As these amounts are calculated separately from the property tax levy — and this tax reduces the amount that would otherwise be required to be collected through the property tax levy — it is therefore allocated entirely to Class 02―Utilities.
TABLE 11: UTILITY (1%)
Account Consultant Cost Category2008 Original
Budget% of Total
Property TaxesB.C. Hydro Utility Taxes - 1% (326,817) 75.5%Telus Utility Taxes - 1% (35,759) 8.3%Centra Gas Utility Taxes - 1% (45,541) 10.5%Shaw Cable Utility Taxes - 1% (25,000) 5.8%
(433,117)

2008 Municipal Sustainability Report City of Powell River
FITZGERALD, STICKELMANN
47 | P a g e
4.1.1.3 COLLECTED FOR OTHER AGENCIES
The City collects taxes on behalf of other Governments and Agencies such as BC Assessment Authority, Powell River Hospital District, the Municipal Finance Authority, Schools and the Powell River Regional District.
Generally these taxes are collected on behalf of the above Government Taxation Authorities and are simply a flow-through. Ideally the inflows and outflows of these taxation items would be based on actual cash flow and consumption patterns for each Authority — by separate analysis; however, this is beyond the scope of this study.
For this analysis revenues and expenditures collected on behalf of other agencies have been excluded.
TABLE 12: COLLECTIONS FOR OTHER GOVERNMENTS
4.1.1.4 FEDERAL GRANTS-IN-LIEU
Federal Government Municipal Grants are monies received from the Federal Government in–lieu of taxes for Federal Government Properties which would otherwise be exempt. Properties include those used by Canada Post and Public Works Canada. These generally relate to office space and other facilities that would normally pay taxes as Class 06―Business and Other and have similar consumption characteristics.
INTER and INTRA-Class allocation is made 100% to Class 6 ―Business and Other.
Account Consultant Cost Category2008
BudgetMunicipal Finance Auth. Collection for Other Government 420 B.C. Assessment Collection for Other Government 159,000 P.R. Regional District Collection for Other Government 430,000 P.R. Reg'l Hospital District Collection for Other Government 1,120,000 Prov of BC School Taxes Collection for Other Government 5,695,000 Municipal Finance Authority Collection for Other Government (420) P.R. Regional District Collection for Other Government (430,000) P.R. Regional Hospital Dist. Collection for Other Government (1,120,000) BC Assessment Collection for Other Government (159,000) Prov. Of BC School Taxes Collection for Other Government (5,695,000)
Net Impact on Municipal Budget -

2008 Municipal Sustainability Report City of Powell River
FITZGERALD, STICKELMANN
48 | P a g e
4.1.1.5 PROVINCIAL GRANTS-IN-LIEU
Provincial Government Grants-In–Lieu of Tax generally relates property taxes otherwise payable on properties owned by the Provincial Government, which is exempt from property taxation.
4.1.1.5.1 BC BUILDING CORPORATION
BC Buildings Corporation provides accommodation and real estate services for the British Columbia Government and public sector. Generally, space relates to offices that would normally be classified as Class 6―Business and Other, and have a commensurate consumption pattern.
INTER and INTRA-Class allocation is made 100% to Class 6 ―Business and Other.
4.1.1.5.2 BC HYDRO
BC Hydro Grants-in-Lieu relates to taxes paid on BC Hydro owned property that would normally be classified as Class 6―Business and Other and have a commensurate consumption pattern.
INTER and INTRA-Class allocation is made 100% to Class 6 ―Business and Other.
4.1.1.5.3 PROVINCIAL RENTAL HOUSING
The Provincial Rental Housing Corporation (PRHC) is BC Housing’s land holding company. PRHC buys, holds and disposes of provincially owned social housing properties, and leases residential properties to non-profit societies and co-ops. Properties owned by PRHC would normally be classified as Class 1―Residential and have commensurate consumption patterns.
INTER and INTRA-Class allocation is made 100% to Class 1 ―Residential.

2008 Municipal Sustainability Report City of Powell River
FITZGERALD, STICKELMANN
49 | P a g e
4.1.2 GRANTS
4.1.2.1 SMALL COMMUNITY GRANTS
The Small Community Protection Grant is an unconditional grant based on a specific Provincial Government Formula. Unconditional Grants are transfers from the Provincial Government (or Provincial Agencies) where the municipality has full discretion on the use of funds. Grants are treated as a general reduction in the property tax levy and allocated based on DIRECT CATEGORY 1 AND CATEGORY 2 GENERAL EXPENDITURES.
TABLE 13: DIRECT CATEGORY 1 AND 2 GENERAL EXPENDITURES
4.1.3 CAPITAL & CARRY FORWARDS
This item relates to current year and re-budgeted projects carried forward from the prior year. In many cases information was not available to the authors; however, ideal allocation of these items would be based on the consumption characteristics of each individual item.
Information relating to Capital and Carry Forwards was taken from the February 27, 2008, Committee of the Whole Budget Meeting (File 540-30-05) to determine appropriate allocation of these items.
See Appendix 10.4 for allocation of Capital & Carry Forwards.
4.1.3.1 GENERAL OPERATING FUND CAPITAL & PROJECTS
4.1.3.1.1 GENERAL GOVERNMENT
4.1.3.1.1.1 AIR CONDITIONER FINANCE OFFICE
INTER-Class allocation is based on OCCURENCES; INTRA-Class allocation is based on OCCURENCES for Residential and JOBS for Non-Residential.
4.1.3.1.1.2 CENTRAL FILING
INTER-Class allocation is based on OCCURENCES; INTRA-Class allocation is based on OCCURENCES for Residential and JOBS for Non-Residential.
1 (Res)3 Supp
Hsg 8 (Rec NP) 9 (Farm) Total Res 2 (Util) 4 (Maj Ind) 5 (Lgt Ind)6 (Bus
Oth)7 (Mng
For)Total Non
ResTotal Type 1 98.971% 0.000% 0.830% 0.199% 75.780% 0.607% 16.253% 3.124% 78.046% 1.970% 24.220%Total Type 2 99.713% 0.000% 0.244% 0.043% 58.523% 0.112% 5.325% 2.061% 92.213% 0.289% 41.477%
99.092% 0.000% 0.734% 0.174% 72.309% 0.458% 12.960% 2.803% 82.315% 1.464% 27.691%Total Category 1 and 2 Expenditures

2008 Municipal Sustainability Report City of Powell River
FITZGERALD, STICKELMANN
50 | P a g e
4.1.3.1.1.3 CITY HALL EXTERIOR WALL
INTER-Class allocation is based on OCCURENCES; INTRA-Class allocation is based on OCCURENCES for Residential and JOBS for Non-Residential.
4.1.3.1.1.4 CONSULTANT BUSINESS PLAN
INTER-Class allocation is based on OCCURENCES; INTRA-Class allocation is based on OCCURENCES for Residential and JOBS for Non-Residential.
4.1.3.1.1.5 LIBRARY
Library projects include library door replacement, Handicap Access and Library Lighting / Wiring Upgrade.
INTER and INTRA-Class allocation is made using DIRECT LIBRARY EXPENDITURES.
TABLE 14: DIRECT LIBRARY
4.1.3.1.1.6 OFFICE FURNITURE
INTER-Class allocation is based on the HUMAN RESOURCES driver as a proxy for office requirements in support of the administration. INTRA-Class Allocation is made using DIRECT CATEGORY 1 AND CATEGORY 2 GENERAL EXPENDITURES.
TABLE 15: DIRECT CATEGORY 1 AND 2 GENERAL EXPENDITURES
Direct Costs 1 (Res) 3 Supp Hsg 8 (Rec NP) 9 (Farm) Total Res 2 (Util) 4 (Maj Ind) 5 (Lgt Ind) 6 (Bus Oth) 7 (Mng For) Res
Revenues 100.0000% 0.0000% 0.0000% 0.0000% 100.0000% 0.0000% 0.0000% 0.0000% 0.0000% 0.0000% 0.0000%Expenses 100.0000% 0.0000% 0.0000% 0.0000% 95.0000% 0.0000% 8.5110% 6.8770% 84.6120% 0.0000% 5.0000%
Net 100.0000% 0.0000% 0.0000% 0.0000% 94.4400% 0.0000% 8.5110% 6.8770% 84.6120% 0.0000% 5.5600%
Consumption Allocation (%)
1 (Res)3 Supp
Hsg 8 (Rec NP) 9 (Farm) Total Res 2 (Util) 4 (Maj Ind) 5 (Lgt Ind)6 (Bus
Oth)7 (Mng
For)Total Non
ResTotal Type 1 98.971% 0.000% 0.830% 0.199% 75.780% 0.607% 16.253% 3.124% 78.046% 1.970% 24.220%Total Type 2 99.713% 0.000% 0.244% 0.043% 58.523% 0.112% 5.325% 2.061% 92.213% 0.289% 41.477%
99.092% 0.000% 0.734% 0.174% 72.309% 0.458% 12.960% 2.803% 82.315% 1.464% 27.691%Total Category 1 and 2 Expenditures

2008 Municipal Sustainability Report City of Powell River
FITZGERALD, STICKELMANN
51 | P a g e
4.1.3.1.1.7 RELOCATION EXPENSES
INTER-Class allocation is based on the HUMAN RESOURCES driver as a proxy for office requirements in support of the administration. INTRA-Class Allocation is made using DIRECT CATEGORY 1 AND CATEGORY 2 GENERAL EXPENDITURES.
TABLE 16: DIRECT CATEGORY 1 AND 2 GENERAL EXPENDITURES
4.1.3.1.1.8 REPLACE EXISTING FIXTURES WITH AUTOMATIC
Individual replacement fixtures were identified. INTER and INTRA-Class Allocation is made using DIRECT CATEGORY 1 AND CATEGORY 2 GENERAL EXPENDITURES.
TABLE 17: DIRECT CATEGORY 1 AND 2 GENERAL EXPENDITURES
4.1.3.1.1.9 SEAWALL FISHERIES HABITAT COMPENSATION
INTER-Class allocation is based on OCCURENCES; INTRA-Class allocation is based on OCCURENCES for Residential and JOBS for Non-Residential.
1 (Res)3 Supp
Hsg 8 (Rec NP) 9 (Farm) Total Res 2 (Util) 4 (Maj Ind) 5 (Lgt Ind)6 (Bus
Oth)7 (Mng
For)Total Non
ResTotal Type 1 98.971% 0.000% 0.830% 0.199% 75.780% 0.607% 16.253% 3.124% 78.046% 1.970% 24.220%Total Type 2 99.713% 0.000% 0.244% 0.043% 58.523% 0.112% 5.325% 2.061% 92.213% 0.289% 41.477%
99.092% 0.000% 0.734% 0.174% 72.309% 0.458% 12.960% 2.803% 82.315% 1.464% 27.691%Total Category 1 and 2 Expenditures

2008 Municipal Sustainability Report City of Powell River
FITZGERALD, STICKELMANN
52 | P a g e
4.1.3.1.2 SECURITY
4.1.3.1.2.1 CRANBERRY TRAINING CENTRE BOILER FLUSHING
INTER and INTRA-Class allocation is based on DIRECT FIRE EXPENDITURES.
TABLE 18: DIRECT FIRE
4.1.3.1.2.2 EQUIPMENT FOR PEP PROGRAM
These expenditures relate to equipment required and used for Provincial Emergency Program.
INTER and INTRA-Class allocation is based on DIRECT SECURITY EXPENDITURES.
TABLE 19: DIRECT SECURITY
4.1.3.1.2.3 REPLACEMENT OF FLEET #2 - FIRE DEPARTMENT
Fire expenditures relate to the Replacement of Fleet #2. INTER and INTRA-Class allocation is based on DIRECT FIRE EXPENDITURES.
TABLE 20: DIRECT FIRE
1 (Res)3 Supp
Hsg 8 (Rec NP) 9 (Farm) Total Res 2 (Util) 4 (Maj Ind) 5 (Lgt Ind)6 (Bus
Oth)7 (Mng
For)Total Non
ResRevenues 0.0000% 0.0000% 0.0000% 0.0000% 0.0000% 0.0000% 0.0000% 0.0000% 0.0000% 0.0000% 0.0000%Expenses 98.4410% 0.0000% 1.2440% 0.3150% 82.4290% 0.6040% 17.8510% 3.9670% 74.6470% 2.9310% 17.5710%
Net 98.4410% 0.0000% 1.2440% 0.3150% 82.4290% 0.6040% 17.8510% 3.9670% 74.6470% 2.9310% 17.5710%
1 (Res)3 Supp
Hsg 8 (Rec NP) 9 (Farm) Total Res 2 (Util) 4 (Maj Ind) 5 (Lgt Ind)6 (Bus
Oth)7 (Mng
For)Total Non
ResRevenues 99.6800% 0.0000% 0.0000% 0.3200% 95.0000% 0.0000% 0.0000% 0.0000% 100.0000% 0.0000% 5.0000%Expenses 98.4420% 0.0000% 1.2430% 0.3150% 82.8930% 0.6880% 17.4700% 3.9690% 74.9960% 2.8770% 17.1070%
Net 98.4330% 0.0000% 1.2520% 0.3150% 82.8170% 0.6890% 17.5020% 3.9760% 74.9510% 2.8820% 17.1830%
1 (Res)3 Supp
Hsg 8 (Rec NP) 9 (Farm) Total Res 2 (Util) 4 (Maj Ind) 5 (Lgt Ind)6 (Bus
Oth)7 (Mng
For)Total Non
ResRevenues 0.0000% 0.0000% 0.0000% 0.0000% 0.0000% 0.0000% 0.0000% 0.0000% 0.0000% 0.0000% 0.0000%Expenses 98.4410% 0.0000% 1.2440% 0.3150% 82.4290% 0.6040% 17.8510% 3.9670% 74.6470% 2.9310% 17.5710%
Net 98.4410% 0.0000% 1.2440% 0.3150% 82.4290% 0.6040% 17.8510% 3.9670% 74.6470% 2.9310% 17.5710%

2008 Municipal Sustainability Report City of Powell River
FITZGERALD, STICKELMANN
53 | P a g e
4.1.3.1.2.4 RCMP
RCMP expenditures relate to new chairs for the RCMP office and new linoleum for the RCMP building.
INTER and INTRA-Class allocation is based on the DIRECT RCMP EXPENDITURES.
TABLE 21: DIRECT RCMP
1 (Res)3 Supp
Hsg 8 (Rec NP) 9 (Farm) Total Res 2 (Util) 4 (Maj Ind) 5 (Lgt Ind)6 (Bus
Oth)7 (Mng
For)Total Non
ResRevenues 0.0000% 0.0000% 0.0000% 0.0000% 0.0000% 0.0000% 0.0000% 0.0000% 0.0000% 0.0000% 0.0000%Expenses 98.4410% 0.0000% 1.2440% 0.3150% 82.4290% 0.6040% 17.8510% 3.9670% 74.6460% 2.9320% 17.5710%
Net 98.4410% 0.0000% 1.2440% 0.3150% 82.4290% 0.6040% 17.8510% 3.9670% 74.6460% 2.9320% 17.5710%

2008 Municipal Sustainability Report City of Powell River
FITZGERALD, STICKELMANN
54 | P a g e
4.1.3.1.3 PLANNING AND DEVELOPMENT
4.1.3.1.3.1 DCC IMPLEMENTATION
DCC's (Development Cost Charges) are an expense to Developers to offset the portion of costs related to the services that are incurred as a result of new development.
INTER and INTRA-Class allocation is made 100% to Class 6―Business and Other — as the class representing developers.
4.1.3.1.3.2 NORTH HARBOUR RECONFIGURATION
See North Boat Harbour. INTER and INTRA-Class allocation is made 100% to Class 1―Residential.
4.1.3.1.3.3 SOUTH HARBOUR DESIGN AND CONSTRUCTION
See South Boat Harbour (See 4.3.4.2).
4.1.3.1.3.4 OCP BYLAW
The OCP is a document that provides a longer term vision for the community.
INTER-Class allocation is based on OCCURENCES; INTRA-Class allocation is based on OCCURENCES for Residential and JOBS for Non-Residential.

2008 Municipal Sustainability Report City of Powell River
FITZGERALD, STICKELMANN
55 | P a g e
4.1.3.1.4 ENGINEERING
4.1.3.1.4.1 AIRPORT
Expenditures include Airport equipment, Airport sign & landscape improvements, enclosed Airport bag pickup area and terminal door access airside.
INTER and INTRA-Class allocation is made based on total DIRECT AIRPORT EXPENDITURES.
TABLE 22: DIRECT AIRPORT
4.1.3.1.4.2 EQUIPMENT RESERVES
This item relates to the replacement of various equipment, machinery and vehicles. INTER and INTRA-Class allocation is made based on total DIRECT ENGINEERING EXPENDITURES.
TABLE 23: EQUIPMENT RESERVES
TABLE 24: DIRECT ENGINEERING
1 (Res)
Hsg 8 (Rec NP) 9 (Farm) Total Res 2 (Util) 4 (Maj Ind) 5 (Lgt Ind) Oth)
For)
Res
Revenues 0.0000% 0.0000% 0.0000% 0.0000% 0.0000% 0.0000% 0.0000% 0.5210% 99.4790% 0.0000% 100.0000%Expenses 98.4420% 0.0000% 1.2440% 0.3140% 31.1030% 0.2740% 8.0570% 2.0760% 88.2690% 1.3240% 68.8970%
Net 98.4420% 0.0000% 1.2440% 0.3140% 43.3050% 0.4630% 13.6330% 3.1520% 80.5120% 2.2400% 56.6950%
Account Consultant Cost Category2008 Original
Budget1986 Hilti coring machine Equipment Reserve 7,000$ 1996 Freightliner c/w Hiab #726 (1992) Equipment Reserve 125,000 1997 Cat loader Equipment Reserve 165,000 1998 GMC PU Equipment Reserve 30,000 1999 1 ton dump Equipment Reserve 75,000 1999 Sonoma PU Equipment Reserve 25,000 Breaker / Jackhammer Equipment Reserve 3,000 Painter Sprayer Equipment Reserve 10,000 1995 GMC Step Van Replacement Tools & Equipment 23,205
463,205$
1 (Res)3 Supp
Hsg 8 (Rec NP) 9 (Farm) Total Res 2 (Util) 4 (Maj Ind) 5 (Lgt Ind)6 (Bus
Oth)7 (Mng
For)Total Non
ResRevenues 99.2340% 0.0000% 0.7600% 0.0060% 71.0550% 1.4460% 55.8110% 1.4250% 41.3090% 0.0090% 28.9450%Expenses 99.0420% 0.0000% 0.8380% 0.1200% 55.8200% 0.6440% 23.8390% 2.9900% 70.9690% 1.5580% 44.1800%
Net 98.4680% 0.0000% 1.0700% 0.4620% 34.0700% 0.1420% 3.7990% 3.9710% 89.5590% 2.5290% 65.9300%

2008 Municipal Sustainability Report City of Powell River
FITZGERALD, STICKELMANN
56 | P a g e
4.1.3.1.4.3 ROADS
INTER-Class allocation of Road projects is based on the ROAD USE Driver.
INTRA-Class allocation uses OCCURENCES for Residential and JOBS for Non-Residential.
4.1.3.1.4.4 SPECIAL PROJECTS
Specific projects were not identified, therefore INTER and INTRA-Class allocation is based on total DIRECT ENGINEERING EXPENDITURES.
TABLE 25: DIRECT ENGINEERING
4.1.3.1.4.5 SQUATTERS CREEK W&S (ENG. ONLY)
Research indicated this item relates to a provision for Squatter's Creek Erosion Control.
INTER-Class allocation uses 2008 IMPROVEMENT VALUES as a proxy for the benefits accruing to improvements placed on the property.
INTRA-Class allocation is based on OCCURRENCES, as benefits are assumed to accrue proportionally to all property owners.
4.1.3.1.4.6 TRANSIT SYSTEM CAPITAL IMPROVEMENTS
INTER and INTRA-Class allocation is made based on the TRANSIT USAGE driver. The funding source for this item is Grants.
4.1.3.1.4.7 WORK YARD TANK REMOVAL
INTER and INTRA-Class allocation is based on total DIRECT ENGINEERING EXPENDITURES.
TABLE 26: DIRECT ENGINEERING
1 (Res)3 Supp
Hsg 8 (Rec NP) 9 (Farm) Total Res 2 (Util) 4 (Maj Ind) 5 (Lgt Ind)6 (Bus
Oth)7 (Mng
For)Total Non
ResRevenues 99.2340% 0.0000% 0.7600% 0.0060% 71.0550% 1.4460% 55.8110% 1.4250% 41.3090% 0.0090% 28.9450%Expenses 99.0420% 0.0000% 0.8380% 0.1200% 55.8200% 0.6440% 23.8390% 2.9900% 70.9690% 1.5580% 44.1800%
Net 98.4680% 0.0000% 1.0700% 0.4620% 34.0700% 0.1420% 3.7990% 3.9710% 89.5590% 2.5290% 65.9300%

2008 Municipal Sustainability Report City of Powell River
FITZGERALD, STICKELMANN
57 | P a g e
4.1.3.1.5 PARKS & RECREATION
4.1.3.1.5.1 CAMPSITE ROADWAY REPAIRS
INTER and INTRA-Class allocation is based on DIRECT RECREATION COMPLEX EXPENDITURES. This item is a 2007 project carried over to 2008.
TABLE 27: DIRECT RECREATION COMPLEX
4.1.3.1.5.2 COMPLEX - CARPET FOR POPLAR & SPRUCE ROOMS
INTER and INTRA-Class allocation is based on DIRECT THEATRE & MEETING ROOM EXPENDITURES.
Funding for this item is from Building Maintenance Reserve.
TABLE 28: DIRECT THEATRE & MEETING ROOM
4.1.3.1.5.3 COMPLEX - POOL STAFF CHANGE ROOM FLOOR
INTER and INTRA-Class allocation is based on DIRECT POOL & FITNESS EXPENDITURES.
Funding for this item is from Building Maintenance Reserve.
TABLE 29: DIRECT POOL & FITNESS
1 (Res)3 Supp
Hsg 8 (Rec NP) 9 (Farm) Total Res 2 (Util) 4 (Maj Ind) 5 (Lgt Ind)6 (Bus
Oth)7 (Mng
For)Total Non
ResRevenues 99.780% 0.000% 0.176% 0.044% 91.129% 0.046% 1.364% 0.304% 98.063% 0.224% 8.871%
Expenditures 99.658% 0.000% 0.273% 0.069% 89.904% 0.062% 1.839% 0.409% 97.388% 0.302% 10.096%Net 99.585% 0.000% 0.331% 0.084% 89.199% 0.070% 2.063% 0.458% 97.070% 0.339% 10.801%
1 (Res)3 Supp
Hsg 8 (Rec NP) 9 (Farm) Total Res 2 (Util) 4 (Maj Ind) 5 (Lgt Ind)6 (Bus
Oth)7 (Mng
For)Total Non
ResRevenues 98.441% 0.000% 1.244% 0.315% 95.000% 0.603% 17.867% 3.980% 74.621% 2.929% 5.000%
Expenditures 98.441% 0.000% 1.244% 0.315% 95.000% 0.603% 17.849% 3.969% 74.646% 2.933% 5.000%Net 98.441% 0.000% 1.244% 0.315% 95.000% 0.603% 17.842% 3.964% 74.657% 2.934% 5.000%
1 (Res)3 Supp
Hsg 8 (Rec NP) 9 (Farm) Total Res 2 (Util) 4 (Maj Ind) 5 (Lgt Ind)6 (Bus
Oth)7 (Mng
For)Total Non
ResRevenues 100.000% 0.000% 0.000% 0.000% 100.000% 0.000% 0.000% 0.000% 0.000% 0.000% 0.000%
Expenditures 100.000% 0.000% 0.000% 0.000% 100.000% 0.000% 0.000% 0.000% 0.000% 0.000% 0.000%Net 100.000% 0.000% 0.000% 0.000% 100.000% 0.000% 0.000% 0.000% 0.000% 0.000% 0.000%

2008 Municipal Sustainability Report City of Powell River
FITZGERALD, STICKELMANN
58 | P a g e
4.1.3.1.5.4 COMPLEX ENERGY RETROFITS
Detailed information on Complex Energy Retrofits was not available but is assumed to relate to improving energy efficiency at the Complex.
Funding for this item is 100% from Grants.
INTER and INTRA-Class allocation is based on DIRECT RECREATION COMPLEX EXPENDITURES.
TABLE 30: DIRECT RECREATION COMPLEX
4.1.3.1.5.5 DEPOSIT ON MILLENNIUM PARK
This item relates to the City's intent to purchase approximately 34 hectares of land, commonly known as Millennium Park. Details relating to the planned use of Millennium Park were not available.
TABLE 31: DIRECT PARKS AND RECREATION
INTER and INTRA-Class allocation is based on total DIRECT PARKS & RECREATION EXPENDITURES.
4.1.3.1.5.6 DWIGHT HALL EXTERIOR PAINT
INTER and INTRA-Class allocation is based on total DIRECT DWIGHT HALL EXPENDITURES.
TABLE 32: DIRECT DWIGHT HALL
1 (Res)3 Supp
Hsg 8 (Rec NP) 9 (Farm) Total Res 2 (Util) 4 (Maj Ind) 5 (Lgt Ind)6 (Bus
Oth)7 (Mng
For)Total Non
ResRevenues 99.780% 0.000% 0.176% 0.044% 91.129% 0.046% 1.364% 0.304% 98.063% 0.224% 8.871%
Expenditures 99.658% 0.000% 0.273% 0.069% 89.904% 0.062% 1.839% 0.409% 97.388% 0.302% 10.096%Net 99.585% 0.000% 0.331% 0.084% 89.199% 0.070% 2.063% 0.458% 97.070% 0.339% 10.801%
1 (Res)3 Supp
Hsg 8 (Rec NP) 9 (Farm) Total Res 2 (Util) 4 (Maj Ind) 5 (Lgt Ind)6 (Bus
Oth)7 (Mng
For)Total Non
ResRevenues 99.780% 0.000% 0.176% 0.044% 91.129% 0.046% 1.364% 0.304% 98.062% 0.224% 8.871%
Expenditures 99.658% 0.000% 0.273% 0.069% 89.904% 0.062% 1.839% 0.409% 97.388% 0.302% 10.096%Net 99.585% 0.000% 0.331% 0.084% 89.199% 0.070% 2.063% 0.458% 97.070% 0.339% 10.801%
1 (Res)3 Supp
Hsg 8 (Rec NP) 9 (Farm) Total Res 2 (Util) 4 (Maj Ind) 5 (Lgt Ind)6 (Bus
Oth)7 (Mng
For)Total Non
ResRevenues 0.000% 0.000% 0.000% 0.000% 0.000% 0.000% 0.000% 0.000% 0.000% 0.000% 0.000%
Expenditures 98.441% 0.000% 1.244% 0.315% 95.000% 0.599% 17.860% 3.957% 74.642% 2.942% 5.000%Net 98.441% 0.000% 1.244% 0.315% 95.000% 0.599% 17.860% 3.957% 74.642% 2.942% 5.000%

2008 Municipal Sustainability Report City of Powell River
FITZGERALD, STICKELMANN
59 | P a g e
4.1.3.1.5.7 LOWER WASHROOM RENOVATION
This item relates to washrooms at the Willingdon Beach Campsite. Funding for this item is from the Willingdon Beach Campsite Reserve.
INTER and INTRA-Class allocation is based on total DIRECT WILLINGDON BEACH CAMPSITE EXPENDITURES.
TABLE 33: DIRECT WILLINGDON BEACH CAMPSITE
4.1.3.1.5.8 MUSEUM FURNACE
INTER and INTRA-Class allocation is made on DIRECT MUSEUM EXPENDITURES.
TABLE 34: DIRECT MUSEUM
4.1.3.1.5.9 PAINT WALLS IN TRAFFIC AREAS
While this item is not specifically described it has been assumed that this expenditure relates to the Complex.
INTER and INTRA-Class allocation is based on DIRECT RECREATION COMPLEX EXPENDITURES. This item is funded from the Building Maintenance Reserve.
TABLE 35: DIRECT RECREATION COMPLEX
1 (Res)3 Supp
Hsg 8 (Rec NP) 9 (Farm) Total Res 2 (Util) 4 (Maj Ind) 5 (Lgt Ind)6 (Bus
Oth)7 (Mng
For)Total Non
ResRevenues 0.000% 0.000% 0.000% 0.000% 0.000% 0.000% 0.000% 0.000% 100.000% 0.000% 100.000%
Expenditures 0.000% 0.000% 0.000% 0.000% 0.000% 0.000% 0.000% 0.000% 100.000% 0.000% 100.000%Net 0.000% 0.000% 0.000% 0.000% 0.000% 0.000% 0.000% 0.000% 100.000% 0.000% 100.000%
1 (Res)3 Supp
Hsg 8 (Rec NP) 9 (Farm) Total Res 2 (Util) 4 (Maj Ind) 5 (Lgt Ind)6 (Bus
Oth)7 (Mng
For)Total Non
ResRevenues 0.000% 0.000% 0.000% 0.000% 0.000% 0.000% 0.000% 0.000% 0.000% 0.000% 0.000%
Expenditures 100.000% 0.000% 0.000% 0.000% 50.000% 0.000% 0.000% 0.000% 100.000% 0.000% 50.000%Net 100.000% 0.000% 0.000% 0.000% 50.000% 0.000% 0.000% 0.000% 100.000% 0.000% 50.000%
1 (Res)3 Supp
Hsg 8 (Rec NP) 9 (Farm) Total Res 2 (Util) 4 (Maj Ind) 5 (Lgt Ind)6 (Bus
Oth)7 (Mng
For)Total Non
ResRevenues 99.780% 0.000% 0.176% 0.044% 91.129% 0.046% 1.364% 0.304% 98.063% 0.224% 8.871%
Expenditures 99.658% 0.000% 0.273% 0.069% 89.904% 0.062% 1.839% 0.409% 97.388% 0.302% 10.096%Net 99.585% 0.000% 0.331% 0.084% 89.199% 0.070% 2.063% 0.458% 97.070% 0.339% 10.801%

2008 Municipal Sustainability Report City of Powell River
FITZGERALD, STICKELMANN
60 | P a g e
4.1.3.1.5.10 PARKS DUGOUT AND SCORE SHACK
Parks Dugout and Scoreshack is located at Willingdon and Gouthro. INTER and INTRA-Class allocation is made 100% to Residential as these facilities relate to personal recreational activities. Funding is made from the Building Maintenance Reserve.
4.1.3.1.5.11 RECREATION STORAGE TANK
Information on the placement or purpose of the storage was not available. It is assumed this item relates to the Recreation Complex. INTER and INTRA-Class allocation is based on DIRECT RECREATION COMPLEX EXPENDITURES. The funding source for this item is Community Works Funds.
TABLE 36: DIRECT RECREATION COMPLEX
4.1.3.1.5.12 REPLACE SHOWER VALVES
This item involves the replacement of existing shower valves with automated valves, funded from the Community Works Reserve, and is assumed to relate to the Recreation Complex.
INTER and INTRA-Class allocation is based on DIRECT RECREATION COMPLEX EXPENDITURES.
TABLE 37: DIRECT RECREATION COMPLEX
1 (Res)3 Supp
Hsg 8 (Rec NP) 9 (Farm) Total Res 2 (Util) 4 (Maj Ind) 5 (Lgt Ind)6 (Bus
Oth)7 (Mng
For)Total Non
ResRevenues 99.780% 0.000% 0.176% 0.044% 91.129% 0.046% 1.364% 0.304% 98.063% 0.224% 8.871%
Expenditures 99.658% 0.000% 0.273% 0.069% 89.904% 0.062% 1.839% 0.409% 97.388% 0.302% 10.096%Net 99.585% 0.000% 0.331% 0.084% 89.199% 0.070% 2.063% 0.458% 97.070% 0.339% 10.801%

2008 Municipal Sustainability Report City of Powell River
FITZGERALD, STICKELMANN
61 | P a g e
4.1.3.1.5.13 SAFETY FENCE ALONG COMPLEX WALL
INTER and INTRA-Class allocation is based on DIRECT RECREATION COMPLEX EXPENDITURES. This item is a 2007 project carried over to 2008.
TABLE 38: DIRECT RECREATION COMPLEX
4.1.3.1.5.14 SPIRIT SQUARE HERITAGE PARK
Spirit Square Heritage Park is a revitalization program for the Wharf at Westview. Funding for Spirit Square Heritage Park is made 100% by Grant from the Provincial Government. Revitalization at Westview Wharf includes an open air market and gathering area.
INTER and INTRA-Class allocation is based on DIRECT HARBOUR EXPENDITURES.
TABLE 39: DIRECT HARBOUR
4.1.3.1.5.15 SANCTUARY HOUSE RENOVATIONS
Expenditures relate to the Wildlife Sanctuary at Mowat Bay Park.
INTER and INTRA-Class allocation is based on total DIRECT PARKS AND RECREATION EXPENDITURES.
TABLE 40: DIRECT PARKS AND RECREATION
1 (Res)3 Supp
Hsg 8 (Rec NP) 9 (Farm) Total Res 2 (Util) 4 (Maj Ind) 5 (Lgt Ind)6 (Bus
Oth)7 (Mng
For)Total Non
ResRevenues 99.780% 0.000% 0.176% 0.044% 91.129% 0.046% 1.364% 0.304% 98.063% 0.224% 8.871%
Expenditures 99.658% 0.000% 0.273% 0.069% 89.904% 0.062% 1.839% 0.409% 97.388% 0.302% 10.096%Net 99.585% 0.000% 0.331% 0.084% 89.199% 0.070% 2.063% 0.458% 97.070% 0.339% 10.801%
1 (Res)3 Supp
Hsg 8 (Rec NP) 9 (Farm) Total Res 2 (Util) 4 (Maj Ind) 5 (Lgt Ind)6 (Bus
Oth)7 (Mng
For)Total Non
ResRevenues 100.0000% 0.0000% 0.0000% 0.0000% 33.6040% 0.0000% 4.2040% 3.3960% 92.4000% 0.0000% 66.3960%Expenses 100.0000% 0.0000% 0.0000% 0.0000% 52.5060% 0.0000% 17.9590% 3.9910% 75.1010% 2.9490% 47.4940%
Net 100.0000% 0.0000% 0.0000% 0.0000% -3.8750% 0.0000% -8.2660% 2.8560% 108.0840% -2.6740% 103.8750%
1 (Res)3 Supp
Hsg 8 (Rec NP) 9 (Farm) Total Res 2 (Util) 4 (Maj Ind) 5 (Lgt Ind)6 (Bus
Oth)7 (Mng
For)Total Non
ResRevenues 99.8210% 0.0000% 0.1430% 0.0360% 79.0800% 0.0140% 0.4100% 0.0910% 99.4180% 0.0670% 20.9200%
Expenditures 99.7240% 0.0000% 0.2200% 0.0560% 85.2150% 0.0320% 0.9580% 0.2130% 98.6400% 0.1580% 14.7850%Net 99.6680% 0.0000% 0.2640% 0.0670% 89.1960% 0.0560% 1.6480% 0.3660% 97.6600% 0.2710% 10.8040%

2008 Municipal Sustainability Report City of Powell River
FITZGERALD, STICKELMANN
62 | P a g e
4.1.3.1.5.16 WILLINGDON BEACH RESERVE
INTER and INTRA-Class allocation is based on total DIRECT WILLINGDON BEACH CAMPSITE EXPENDITURES.
TABLE 41: DIRECT WILLINGDON BEACH CAMPSITE
1 (Res)3 Supp
Hsg 8 (Rec NP) 9 (Farm) Total Res 2 (Util) 4 (Maj Ind) 5 (Lgt Ind)6 (Bus
Oth)7 (Mng
For)Total Non
ResRevenues 0.000% 0.000% 0.000% 0.000% 0.000% 0.000% 0.000% 0.000% 100.000% 0.000% 100.000%
Expenditures 0.000% 0.000% 0.000% 0.000% 0.000% 0.000% 0.000% 0.000% 100.000% 0.000% 100.000%Net 0.000% 0.000% 0.000% 0.000% 0.000% 0.000% 0.000% 0.000% 100.000% 0.000% 100.000%

2008 Municipal Sustainability Report City of Powell River
FITZGERALD, STICKELMANN
63 | P a g e
4.1.4 MAYOR AND COUNCIL
The responsibility for local government (Powell River) is vested in the Mayor and six Councillors who collectively make up the City Council. The function of Council is to establish corporate policy and set direction for the community. This is achieved through the annual Strategic Plan, Financial Plan, Council Policies and Bylaws. Implementation of approved Council Policies is generally delegated to the Chief Administrative Officer, who is responsible for the actions of all staff. This item includes:
TABLE 42: BUDGETS FOR MAYOR AND COUNCIL
INTER and INTRA–Class allocation is based on DIRECT CATEGORY 1 AND CATEGORY 2 EXPENDITURES for the District as a proxy for time and resources expended.
TABLE 43: TOTAL DIRECT CATEGORY 1 AND 2 EXPENDITURES
4.1.4.1 ELECTIONS
This account relates to the cost of Municipal Elections.
Expenditures are allocated entirely to Class 1―Residential properties, as only residents are eligible to vote.
4.1.4.2 YOUTH IN GOVERNMENT
See Mayor and Council for allocation details.
Account Consultant Cost Category2008 Original
Budget
% of Total Property
TaxesMayor & Council - General Mayor & Council 114,932$ 38.5%Mayor S. Alsgard Mayor & Council 49,863 16.7%Councillor New Mayor & Council 16,278 5.5%Councillor T. Byng Mayor & Council 20,315 6.8%Councillor M. Leishman Mayor & Council 25,645 8.6%Councillor T. Rodonets Mayor & Council 22,645 7.6%Councillor R. Astrope Mayor & Council 18,815 6.3%Councillor S. Tremblay Mayor & Council 29,815 10.0%
298,307$
1 (Res)3 Supp
Hsg 8 (Rec NP) 9 (Farm) Total Res 2 (Util) 4 (Maj Ind) 5 (Lgt Ind)6 (Bus
Oth)7 (Mng
For)Total Non
ResTotal Type 1 98.971% 0.000% 0.830% 0.199% 75.780% 0.607% 16.253% 3.124% 78.046% 1.970% 24.220%Total Type 2 99.713% 0.000% 0.244% 0.043% 58.523% 0.112% 5.325% 2.061% 92.213% 0.289% 41.477%Total Category 1 and 2 Expenditures 99.092% 0.000% 0.734% 0.174% 72.309% 0.458% 12.960% 2.803% 82.315% 1.464% 27.691%

2008 Municipal Sustainability Report City of Powell River
FITZGERALD, STICKELMANN
64 | P a g e
4.1.4.3 GENERAL COUNCIL GRANTS
General Council Grants are intended to assist and encourage locally based non-profit groups and organizations who seek, through activities and events, to improve economic, cultural and civic well-being of the community. Ideally, allocation of grants would be based on long-term actual grant statistics — based on the purpose of the grant and the intended outcomes.
Based on the aims and objectives of these grants INTER-Class allocation is based on a CONSULTANT'S ESTIMATE, 50% to Residential and 50% to Non-Residential.
INTRA-Class allocation is based on OCCURENCES for Residential and JOBS for Non-Residential.
4.1.5 ACCOUNTING
Accounting services include functions such as payroll, accounts payable, taxation, utility billings, investments, debt management and accounts receivable. Accounting provides services to all City departments and benefits all residents and property owners equally.
INTER and INTRA-Class allocation is based on OCCURENCES for all property classes.
4.1.5.1 AUDIT
External Audit expresses an independent opinion on whether an entity’s financial statements are free of material misstatements.
INTER and INTRA-Class allocations are based on OCCURENCES as this service is deemed to benefit all properties equally.
4.1.5.2 BAD DEBT
Bad Debts relate to uncollectable funds. Ideally, Bad Debts would be allocated based on a detailed analysis of the Bad Debt Accounts. In the absence of a detailed analysis of the City's Bad Debt accounts INTER and INTRA-Class allocation is based on OCCURENCES.

2008 Municipal Sustainability Report City of Powell River
FITZGERALD, STICKELMANN
65 | P a g e
4.1.5.3 GENERAL OPERATING FUND CONTINGENCY
General Operating Fund Contingency42
is money set aside for unexpected expenditures. INTER-and INTRA-Class allocation is based on DIRECT CATEGORY 1 AND CATEGORY 2 GENERAL EXPENDITURES as a proxy for potential use of these funds.
TABLE 44: TOTAL DIRECT CATEGORY 1 AND 2 EXPENDITURES
42 It is assumed that this fund ($10,000) relates only to General Government contingencies.
1 (Res)3 Supp
Hsg 8 (Rec NP) 9 (Farm) Total Res 2 (Util) 4 (Maj Ind) 5 (Lgt Ind)6 (Bus
Oth)7 (Mng
For)Total Non
ResTotal Type 1 98.971% 0.000% 0.830% 0.199% 75.780% 0.607% 16.253% 3.124% 78.046% 1.970% 24.220%Total Type 2 99.713% 0.000% 0.244% 0.043% 58.523% 0.112% 5.325% 2.061% 92.213% 0.289% 41.477%Total Category 1 and 2 Expenditures 99.092% 0.000% 0.734% 0.174% 72.309% 0.458% 12.960% 2.803% 82.315% 1.464% 27.691%

2008 Municipal Sustainability Report City of Powell River
FITZGERALD, STICKELMANN
66 | P a g e
4.1.6 BUILDINGS AND GROUNDS MAINTENANCE
Building and Grounds maintenance includes various facilities around the City. Where identifiable with a specific Administrative Performance Measure, these facilities have been allocated based on the general use characteristics. Buildings and Grounds Maintenance is assigned to General Government and provides either general service to the City overall or was not identifiable43
by the authors to a specific activity or Administrative Performance Measure. In addition to specific grounds and building maintenance, administration costs —including wages and benefits, footwear, raingear and clothing, meetings, staff training development, telephone, computer administration, internal equipment, small tools, materials and supplies, office supplies and photocopying, and registrations — are also included in these accounts.
TABLE 45: BUILDING AND GROUNDS MAINTENANCE
As these types of facilities tend to provide general support for specific activities, INTER and INTRA-Class Allocation is based on DIRECT CATEGORY 1 AND CATEGORY 2 GENERAL EXPENDITURES, where the overall expenditure patterns of the City are used as a proxy for the support activities provided.
TABLE 46: TOTAL DIRECT CATEGORY 1 AND 2 EXPENDITURES
43 Information not available on the Website.
Account Consultant Cost Category2008 Original
BudgetBuilding Maintenance Reserve Fund Building & Grounds 97,130$ Administration Building & Grounds 185,656 Service Centre Building & Grounds 84,880 City Hall Building & Grounds 113,230 Park Avenue House Building & Grounds 5,816 Centennial Building Building & Grounds 7,719 Drake Street Building Building & Grounds 1,568 Former BarTech Property Building & Grounds 1,500
497,500$
1 (Res)3 Supp
Hsg 8 (Rec NP) 9 (Farm) Total Res 2 (Util) 4 (Maj Ind) 5 (Lgt Ind)6 (Bus
Oth)7 (Mng
For)Total Non
ResTotal Type 1 98.971% 0.000% 0.830% 0.199% 75.780% 0.607% 16.253% 3.124% 78.046% 1.970% 24.220%Total Type 2 99.713% 0.000% 0.244% 0.043% 58.523% 0.112% 5.325% 2.061% 92.213% 0.289% 41.477%Total Category 1 and 2 Expenditures 99.092% 0.000% 0.734% 0.174% 72.309% 0.458% 12.960% 2.803% 82.315% 1.464% 27.691%

2008 Municipal Sustainability Report City of Powell River
FITZGERALD, STICKELMANN
67 | P a g e
4.1.7 FINANCIAL MANAGEMENT
Financial Management includes Interest on Investments, Accounts Receivable Invoice Administration Fees, Sale of Assets, Collections and Billings and External Equipment.
Normally, INTER and INTRA-Class allocation would allocate these revenues based on an analysis of the specific account matching revenues to the contributors and purpose, for which the revenues are collected. For revenues such as Accounts Receivable Invoice Administration Fees, INTER and INTRA-Class allocation is based on a general reduction to all property taxes based on DIRECT CATEGORY 1 AND CATEGORY 2 GENERAL EXPENDITURES.
TABLE 47: TOTAL DIRECT CATEGORY 1 AND 2 EXPENDITURES
In the absence of specific details related to this group of accounts INTER and INTRA-Class allocation on other Financial Management accounts are treated as a general reduction to all property taxes based on OCCURENCES.
1 (Res)3 Supp
Hsg 8 (Rec NP) 9 (Farm) Total Res 2 (Util) 4 (Maj Ind) 5 (Lgt Ind)6 (Bus
Oth)7 (Mng
For)Total Non
ResTotal Type 1 98.971% 0.000% 0.830% 0.199% 75.780% 0.607% 16.253% 3.124% 78.046% 1.970% 24.220%Total Type 2 99.713% 0.000% 0.244% 0.043% 58.523% 0.112% 5.325% 2.061% 92.213% 0.289% 41.477%Total Category 1 and 2 Expenditures 99.092% 0.000% 0.734% 0.174% 72.309% 0.458% 12.960% 2.803% 82.315% 1.464% 27.691%

2008 Municipal Sustainability Report City of Powell River
FITZGERALD, STICKELMANN
68 | P a g e
4.1.8 DEBT AND FISCAL SERVICES
Debt and Fiscal Services relate to interest and principal payments for items such as MFA Capital Leases, Bank Charges and Interest and Tax Prepayment Plan Interest. Where possible, interest payments would normally be allocated based on the use characteristics of the items or services acquired with the debt funding.
TABLE 48: DEBT / FISCAL SERVICES
In the absence of specific information Debt Charges are allocated INTER and INTRA-Class based on DIRECT CATEGORY 1 AND CATEGORY 2 GENERAL EXPENDITURES.
TABLE 49: TOTAL DIRECT CATEGORY 1 AND 2 EXPENDITURES
Account Consultant Cost Category2008 Original
BudgetMFA-Capital leasesPrincipal Debt / Fiscal Services 61,032$ MFA-Capital Leases Interest Debt / Fiscal Services 27,662 Bank Charges & Interest Debt / Fiscal Services 12,000 Tax Prepayment Plan Interest Debt / Fiscal Services 17,000
117,694$
1 (Res)3 Supp
Hsg 8 (Rec NP) 9 (Farm) Total Res 2 (Util) 4 (Maj Ind) 5 (Lgt Ind)6 (Bus
Oth)7 (Mng
For)Total Non
ResTotal Type 1 98.971% 0.000% 0.830% 0.199% 75.780% 0.607% 16.253% 3.124% 78.046% 1.970% 24.220%Total Type 2 99.713% 0.000% 0.244% 0.043% 58.523% 0.112% 5.325% 2.061% 92.213% 0.289% 41.477%Total Category 1 and 2 Expenditures 99.092% 0.000% 0.734% 0.174% 72.309% 0.458% 12.960% 2.803% 82.315% 1.464% 27.691%

2008 Municipal Sustainability Report City of Powell River
FITZGERALD, STICKELMANN
69 | P a g e
4.1.9 HUMAN RESOURCES
Human Resources provide support in the areas of salary, benefit and pension administration; training, health and safety; performance management; collective agreement administration; recruitment and selection. This item includes Human Resources and the Employee/Family Assistance Program.
INTER–Class allocation uses the HUMAN RESOURCES driver; INTRA–Class allocation is based on OCCURENCES for Residential and JOBS for Non–Residential, as all properties benefit proportionally from these services.
TABLE 50: HUMAN RESOURCES
General Government Security
Planning & Development Engineering
Parks, Recreation &
Culture
1 2 3 4 5
Allocation based on FTEs by APMTotal Assigned FTE's 29.5 20.0 5.0 47.0 47.5 149.00
% of Total Employees 19.8% 13.4% 3.4% 31.5% 31.9%
Human Resource Costs (Allocated to APM based on % of Total Employees) 71,649$ 48,576$ 12,144$ 114,153$ 115,367$ 361,888$
Total Expenditures by APMResidential (Category 1) 1,735,913$ 3,704,426$ 3,680$ 1,099,817$ 2,606,991$ 9,150,827$
Residential (Category 2) - - 13,208 902,216 863,513$ 1,778,937
Total Residential 1,735,913 3,704,426 16,888 2,002,033 3,470,504 10,929,764
Non-Residential (Category 1) 162,970 764,506 672,114 870,461 454,562 2,924,613
Non-Residential (Category 2) - - 512,182 619,348 130,124 1,261,654
Total Non-Residential 162,970 764,506 1,184,296 1,489,809 584,686 4,186,267
Total Expenditures 1,898,883$ 4,468,932$ 1,201,184$ 3,491,842$ 4,055,190$ 15,116,031$
% of Total ExpendituresResidential 91.418% 82.893% 1.406% 57.335% 85.582% 72.306%
Non-Residential 8.582% 17.107% 98.594% 42.665% 14.418% 27.694%
Human Resource AllocationResidential 65,500$ 40,266$ 171$ 65,450$ 98,733$ 261,667$
Non-Residential 6,149 8,310 11,973 48,703 16,634 100,221
Total 71,649$ 48,576$ 12,144$ 114,153$ 115,367$ 361,888$
Total Employees

2008 Municipal Sustainability Report City of Powell River
FITZGERALD, STICKELMANN
70 | P a g e
4.1.10 INTEREST AND PENALTIES
Interest Revenues include the accounts: Penalty on Current, Interest on Arrears, and Interest on Delinquent. As interest and penalties result from failure to pay taxes and charges on time — ideally an INTEREST AND PENALTIES driver would be based on the sources of these penalties — so as to ensure that the classes triggering the interest payments do not benefit from the payment of penalties.
Detailed information was not available to develop an INTEREST AND PENALTIES driver, therefore allocation is based on OCCURRENCES.
4.1.11 POWELL RIVER DISTRICT LIBRARY
The Powell River District Library Association was formed in 1973 by the amalgamation of the Westview, Powell River, Cranberry, and Wildwood Public Library Associations. Service has since expanded to include an affiliated branch on nearby Texada Island. In 2001, 12,483 residents of Powell River and the surrounding district were registered borrowers. In 2004 the library became a municipal library and changed its name to the Powell River Public Library.
4.1.11.1 LIBRARY/MUSEUM SERVICES
The Library/Museum Services are listed in the 2008 / 2009 Budget documents provided by the City under Land Leases / Building Rentals. It is assumed by the authors that this item relates to fees and charges collected by the Library and Museum for services provided, rather than as a transfer of funds back to the City for Land and Building rental, as the budget item would suggest.
It is further assumed that fees paid to the library come entirely from Residential users, hence INTER and INTRA-Class allocation is made 100% to Class 1―Residential.

2008 Municipal Sustainability Report City of Powell River
FITZGERALD, STICKELMANN
71 | P a g e
4.1.11.2 LIBRARY GRANT
The Library Grant is the amount requisitioned and approved by Council for operation of the Library. Library expenditures are incurred primarily by residents but include a small business component.
Normally, drivers that measure the activity of the Library services performed over a period of time for Residential and Non-Residential groups would be used as the most appropriate drivers—but this information was not available.
INTER-CLASS allocation has been made by CONSULTANT’S ESTIMATE, 95% to Residential and 5% to Non-Residential.
INTRA-Class allocations is based on OCCURENCES for Residential and JOBS for Non-Residential, excluding Class 2–Utilities, Class 7–Managed Forest, Recreation / Non-Profit and Class 9–Farm.
4.1.11.3 WESTVIEW LIBRARY MAINTENANCE
Westview Library maintenance relates to janitorial services, structure and grounds maintenance, waste disposal and pickup as well as alarm monitoring.
The Library Grant is the amount requisitioned and approved by Council for operation of the Library.
For allocation details see Library Grant.
4.1.12 MANAGEMENT INFORMATION SERVICES
Information Services is responsible for the electronic assets of the City including the network infrastructure, servers, workstations, laptops, GIS and other business systems.
Information on usage of electronic assets e.g. number of computers by department, network usage by department, number of authorized users by department were not available to allow for a specific driver to be built. In the absence of the aforementioned statistics INTER-Class allocation uses the HUMAN RESOURCES driver, as most, if not all employees have computers and access to information systems.
INTRA-Class allocation is based on OCCURENCES for Residential and JOBS for Non–Residential, as all properties benefit proportionally from these services.

2008 Municipal Sustainability Report City of Powell River
FITZGERALD, STICKELMANN
72 | P a g e
4.1.13 LAND LEASES / BUILDING RENTALS
This item relates to revenues and expenditures from the leasing of City Land and Buildings.
TABLE 51: BUILDING RENTALS AND LAND LEASES
INTER and INTRA-Class allocation is based on OCCURENCES to distribute the revenues proportionately to each property.
4.1.14 OTHER GENERAL GOVERNMENT
4.1.14.1 DAMAGE CLAIMS
Damage claims are a general expense to the City to cover expenditures related to damage caused to private property by the City.
INTER and INTRA-Class allocation is based on 2008 IMPROVEMENT VALUES as a proxy for benefits received from the protection of property values.
4.1.14.2 LEGAL FEES
Normally allocation would be based on a detailed analysis of long-term activity, however in the absence of this information INTER and INTRA-Class allocation is based on OCCURENCES, as all properties are equally likely to benefit from internal legal services.
Account Consultant Cost Category2008 Original
BudgetBuilding Rentals Land Leases / Building Rentals 55,000$ Land Leased Land Leases / Building Rentals ( 6,500)
48,500$

2008 Municipal Sustainability Report City of Powell River
FITZGERALD, STICKELMANN
73 | P a g e
4.1.15 STORES & TIMEKEEPER
Detailed information on the specific functions of the Stores & Timekeeper function was not available to the authors. The authors have assumed the primary function is inventory planning, purchasing and stores. The department works closely with all other City departments and building tenants; it manages all major contracting competitions to supply goods and services to the City.
INTER-and INTRA-Class allocation is based on DIRECT CATEGORY 1 AND CATEGORY 2 GENERAL EXPENDITURES for the District, and is used as a proxy for overall activity related to this function.
TABLE 52: TOTAL DIRECT CATEGORY 1 AND 2 EXPENDITURES
4.1.16 TAX INFORMATION REQUESTS
Tax Information Requests relate to provision of tax information for real estate transactions. Tax Info Search Fees are generally paid by the purchaser or mortgagor. The benefits obtained for the purchaser is that he/she will not be charged with unpaid taxes; and for the mortgage holder at the time of the mortgage that the property is not subject to tax sale.
Allocation of revenues would ideally be based on the number of actual transactions categorized by class. In the absence of specific information, revenue is allocated INTER and INTRA-Class based on OCCURRENCES, as a representation of the proportion of the number and type of transactions that are likely to occur. Class 2–Utilities, Class 4–Major Industry and Class 7–Managed Forest have been excluded, as these properties are unlikely to contribute to the revenue source.
1 (Res)3 Supp
Hsg 8 (Rec NP) 9 (Farm) Total Res 2 (Util) 4 (Maj Ind) 5 (Lgt Ind)6 (Bus
Oth)7 (Mng
For)Total Non
ResTotal Type 1 98.971% 0.000% 0.830% 0.199% 75.780% 0.607% 16.253% 3.124% 78.046% 1.970% 24.220%Total Type 2 99.713% 0.000% 0.244% 0.043% 58.523% 0.112% 5.325% 2.061% 92.213% 0.289% 41.477%Total Category 1 and 2 Expenditures 99.092% 0.000% 0.734% 0.174% 72.309% 0.458% 12.960% 2.803% 82.315% 1.464% 27.691%

2008 Municipal Sustainability Report City of Powell River
FITZGERALD, STICKELMANN
74 | P a g e
4.2 SECURITY APM
The Security APM relates to services that protect both life and property. Services include:
1. Police (RCMP),
2. Fire,
3. Emergency Programs, and
4. Animal Control.
4.2.1 POLICE (RCMP)
Police Services for the City of Powell River and surrounding area are provided under contract by the Royal Canadian Mounted Police (RCMP). The detachment offices are located at 7070 Barnet Street. RCMP members are supported by four full-time, two part-time relief municipal employees, in addition to some part-time guards.
Statistics on RCMP activities were not available for inclusion in this report. While the latter information is useful as a general indicator of actual incident activity, the information is not pertinent to the allocation of costs based on consumption, as it fails to recognize the price of general availability and likely need over time for Police Services.
INTER-Class allocation uses the Protective Services driver. INTRA-Class allocation is ascribed 100% to Residential properties based on OCCURENCES and Non-Residential properties based on JOBS.
4.2.2 FIRE
The Powell River Fire Department provides fire suppression, fire prevention and fire inspection services to The City Of Powell River. The Department is also equipped to respond to and deal with hazardous materials incidents inside City limits. The Department's fully Equipped Rescue / Haz-Mat vehicle allows the Fire Department to perform rescue and extrication duties inside the City, and also in the Regional District.
The Fire Department under the Director of Fire and Emergency Services is made up of two divisions, and four Companies. At the time of this report Division 1 had 11 full-time personnel, and 17 Auxiliary Fire Fighters and Division 2 had nine full-time Personnel, ten Auxiliary Fire Fighters and eight in training.
As with Police Services — while incident information is useful as a general indicator of actual activity — the information is not pertinent to the allocation of costs based on

2008 Municipal Sustainability Report City of Powell River
FITZGERALD, STICKELMANN
75 | P a g e
consumption, as it fails to recognize the price of general availability and likely need over time for Police Services.
The following is a summary of 2007 Incidents:
TABLE 53: 2007 FIRE RESCUE STATISTICS
TABLE 54: 2007 INCIDENTS
INTER-Class allocation uses the PROTECTIVE SERVICES driver. INTRA-Class allocation is ascribed 100% to Residential properties based on OCCURRENCES, and Non-Residential properties based on JOBS.
2007 2006 2005 2004Incidents 767 777 781 709 Fire Fighters F/T 15.5 15.5 15.5 15.5 Fire Fighters Auxiliary 36 42 45 48 Fire Hydrants 657 642 642 641 Operational Expendtires 1,751 1,798 1,639 1,664
Incidents 2007% of
TotalAlarm Activation 60 7.8%Boat / Ship / Aircraft 1 0.1%Bush / Grass / Beach 15 2.0%Chimeny Fire 8 1.0%Electrical Wires Down 6 0.8%First Responder Calls 409 53.3%Fuel Spill 12 1.6%Garbage Fire 6 0.8%Hazardous Material 13 1.7%Investigation 51 6.6%Burning / Smoke 41 5.3%Mill Fire 5 0.7%Motor Vehicle Accidents 39 5.1%Motor Vehicle Fire 7 0.9%Natural Gas / Propane 8 1.0%Public Assistance / Complaints 50 6.5%Rescue 7 0.9%Structure Fire 29 3.8%Total Incidents 767

2008 Municipal Sustainability Report City of Powell River
FITZGERALD, STICKELMANN
76 | P a g e
4.2.3 REVENUES
Generally revenues related to Security are distributed based on overall DIRECT SECURTY EXPENDITURES, unless it is clearly derived from a specific source that can be attributed to a specific property class or classes.
TABLE 55: DIRECT SECURITY
1 (Res)3 Supp
Hsg 8 (Rec NP) 9 (Farm) Total Res 2 (Util) 4 (Maj Ind) 5 (Lgt Ind)6 (Bus
Oth)7 (Mng
For)Total Non
ResRevenues 99.6800% 0.0000% 0.0000% 0.3200% 95.0000% 0.0000% 0.0000% 0.0000% 100.0000% 0.0000% 5.0000%Expenses 98.4420% 0.0000% 1.2430% 0.3150% 82.8930% 0.6880% 17.4700% 3.9690% 74.9960% 2.8770% 17.1070%
Net 98.4330% 0.0000% 1.2520% 0.3150% 82.8170% 0.6890% 17.5020% 3.9760% 74.9510% 2.8820% 17.1830%

2008 Municipal Sustainability Report City of Powell River
FITZGERALD, STICKELMANN
77 | P a g e
4.2.4 ANIMAL CONTROL
Animal Control relates to expenditures incurred for regulation, management and enforcement of City Bylaw 1979, 203 — a Bylaw to Regulate the keeping of dogs and other animals in the City.
INTER–Class allocation is made by a CONSULTANT'S ESTIMATE on the premise that this relates primarily to Residential / Farm activity at 95% — with 5% allocated to Non-Residential.
INTRA–Class allocation is based on OCCURENCES for Residential Properties (Excluding Class 08―Recreational / Non–Profit). Non–Residential allocation is also based on OCCURENCES for Class 06―Business and Other. A more precise allocation would result from a class analysis of actual pound services provided over time.
4.2.5 DOG LICENCE FEES
Dog Licence Fees are charged under the Animal Control and Pound Bylaw. Fees are required to be paid for all dogs over the age of six months, and any cat over the age of six months that is not spayed or neutered.
Revenues are allocated in the same way as Animal Control.

2008 Municipal Sustainability Report City of Powell River
FITZGERALD, STICKELMANN
78 | P a g e
4.2.6 BYLAW ENFORCEMENT
Bylaw Enforcement routinely responds to animal, noise, and unsightly premises complaints. Bylaw enforcement is ideally sought through voluntary compliance. Officers enforce parking regulations daily and enforcement of other bylaws is driven by complaints. Bylaw Enforcement is performed by one full-time staff member and two part-time staff members who provide enforcement services seven days per week.
The following is a summary of 2008 service activities:
TABLE 56: 2008 SUMMARY OF BYLAW INCIDCENTS
The following is a summary of 2008 incidents:
TABLE 57: 2008 SERVICE ACTIVITY DETAIL
As with Police and Fire Services — while specific information on bylaw incidents are useful as a general indicator of activity — the information is not pertinent to the allocation of costs
Bylaw 2008 % ofTotal
Animal 138 46.0%Noise 14 4.7%Other 17 5.7%Property 56 18.7%Rubbish 10 3.3%Traffic 50 16.7%Waterworks 3 1.0%Zoning 12 4.0%Total 300 100.0%
Incidents 2007% of
TotalDeemed Dangerous Dog 6 2.0%Dog Barking 24 8.0%Dog on Loose 59 19.7%Keeping of Animals in Contravention of Zoning 2 0.7%Other 30 10.0%Poop & Scoop Complaint 6 2.0%Suspected Dangerous Dog 11 3.7%Other 3 1.0%Prohibited Noise 11 3.7%Other 17 5.7%Hedge 4 1.3%Other 17 5.7%Overgrown 15 5.0%Unsightly Premises 20 6.7%Illegal Dumping / Littering 10 3.3%Abandoned 4 1.3%Encroachment/Hedge, Trees, Etc. 1 0.3%Illegal Parking 38 12.7%Other 7 2.3%Illegal Watering 1 0.3%Other 2 0.7%Illegal Use 3 1.0%Other 9 3.0%
0.0%Total Incidents 300

2008 Municipal Sustainability Report City of Powell River
FITZGERALD, STICKELMANN
79 | P a g e
based on consumption, as it fails to recognize the price of general availability as well as this activities impact on property values.
INTER and INTRA-Class allocation is based on OCCURENCES as all properties benefit or potentially benefit equally from Bylaw Enforcement activities.
4.2.6.1 BYLAW ENFORCEMENT REVENUES
Bylaw Enforcement revenues relate to Parking Permits, Traffic Fines, and Ticket Dispensers. Detailed information on the nature of these revenues was not available; therefore they have been treated as a general reduction in Bylaw Enforcement and Control expenditures.
INTER and INTRA-Class allocation is based on total DIRECT BYLAW ENFORCEMENT EXPENDITURES.
TABLE 58: DIRECT BYLAW ENFORCEMENT
1 (Res)3 Supp
Hsg 8 (Rec NP) 9 (Farm) Total Res 2 (Util) 4 (Maj Ind) 5 (Lgt Ind)6 (Bus
Oth)7 (Mng
For)Total Non
ResRevenues 0.0000% 0.0000% 0.0000% 0.0000% 0.0000% 0.0000% 0.0000% 0.0000% 0.0000% 0.0000% 0.0000%Expenses 98.4410% 0.0000% 1.2440% 0.3150% 92.1100% 4.4990% 0.4110% 4.0880% 90.5910% 0.4110% 7.8900%
Net 98.4410% 0.0000% 1.2440% 0.3150% 92.1100% 4.4990% 0.4110% 4.0880% 90.5910% 0.4110% 7.8900%

2008 Municipal Sustainability Report City of Powell River
FITZGERALD, STICKELMANN
80 | P a g e
4.3 PLANNING AND DEVELOPMENT APM
The Planning Office is responsible for the review and processing of development applications, including Official Community Plan and Zoning Bylaw amendments, Development Permits, Development Variance Permits and Subdivisions. Planning is also responsible for the City's long range planning such as the Official Community Plan.
4.3.1 ADMINISTRATION
Administration relates to general overhead specific to Planning & Development, but not to any specific Residential or Non-Residential activity; included under Administration is Planning Administration.
INTER and INTRA-Class allocation of revenues and expenditures is based on total DIRECT PLANNING EXPENDITURES.
TABLE 59: DIRECT PLANNING EXPENDITURES
4.3.2 DEVELOPMENT SERVICES
4.3.2.1 BOARD OF VARIANCE
Board of Variance revenues relate to applications for such things as side yard setback variances, frontage variances, an exemption for bylaw requirements, etc. Information was not available for a breakdown of this item, hence this item is allocated INTER-Class by CONSULTANT'S ESTIMATE — 50% to Residential and 50% to Non-Residential.
INTRA-Class allocation is based on OCCURRENCES. Ideally, this item would be allocated based on actual statistics over time.
1 (Res)3 Supp
Hsg 8 (Rec NP) 9 (Farm) Total Res 2 (Util) 4 (Maj Ind) 5 (Lgt Ind)6 (Bus
Oth)7 (Mng
For)Total Non
ResRevenues 99.1360% 0.0000% 0.6890% 0.1750% 35.0150% 0.1230% 4.3840% 3.5700% 91.8090% 0.1140% 64.9850%Expenses 100.0000% 0.0000% 0.0000% 0.0000% 0.5450% 0.3010% 17.9050% 3.9790% 74.8740% 2.9410% 99.4550%
Net 99.1270% 0.0000% 0.6970% 0.1760% 104.1540% 8.6960% 653.7260% 23.2010% -721.4860% 135.8630% -4.1540%

2008 Municipal Sustainability Report City of Powell River
FITZGERALD, STICKELMANN
81 | P a g e
4.3.2.2 BUILDING PERMIT REVENUES
The Building Permit process is deemed a Non-Residential activity as it is seen as an integral component of the construction activity in the City. While some activity may relate to do-it-yourself construction, this activity still generates business activity in the home-improvement retail industry.
INTER-Class allocation is made 100% to Non-Residential.
INTRA-Class allocation would normally use the BUILDING PERMIT or BUILDING INSPECTION driver for allocation purposes; however insufficient detail was available to fully develop this driver. In the absence of more detailed information, INTRA-Class allocation is based on OCCURRENCES — excluding44
4.3.2.3 BUSINESS LICENCE REVENUES
Class 2―Utility and Class 7―Managed Forest — as a proxy for relative construction activity by class.
Business licences are required by all businesses unless exempted by a Provincial or Federal Statute or Regulation.
INTER–Class allocation of business licences was charged entirely to Non-Residential properties, with INTRA-Class allocation, based on OCCURRENCES to Class 4―Major Industry, Class 5―Light Industry and Class 6―Business and Other. A more accurate allocation would result from an analysis of actual business licences; however, this information was not available at the time of this study.
44 2―Utility is excluded as utility infrastructure construction is not subject to the Building Permit and Inspections. Class 7―Managed Forest includes only land and therefore would not require Building Permit or Inspection services.

2008 Municipal Sustainability Report City of Powell River
FITZGERALD, STICKELMANN
82 | P a g e
4.3.2.4 COMMERCIAL VEHICLE LICENCE REVENUES
Commercial Licence Fees are charged on all commercial vehicles defined and licensed under the Commercial Transport Act, as well as any vehicles used for the collection or delivery of goods, wares, merchandise, or other commodities used, in the ordinary course of a business undertaking.
INTER–Class allocation of business licences were charged entirely to Non-Residential properties.
INTRA-Class allocation was based on JOBS — as a proxy for likely vehicle requirements, in the absence of individual Commercial Licence fee information. A more accurate allocation would result from an analysis of actual commercial licences; however, this information was not available at the time of this study.
4.3.2.5 DEVELOPMENT SERVICES EXPENDITURES
Development Service includes salaries, wages and benefits, footwear, clothing and raingear, staff training and development, planning special projects, telephone expenses, advertising and promotion, memberships, subscriptions, computer administration, internal equipment, land surveys and appraisals.
INTER and INTRA-Class allocation is based on total DEVELOPMENT SERVICE REVENUES as a proxy for actual activities. Details related to expenditures for the individual Development Service expenditures, was not available from the financial information provided.
TABLE 60: DIRECT DEVELOPMENT SERVICES
4.3.2.6 PLAN SIGNING FEES
See Building Permits for allocation details.
4.3.2.7 OCP/ZONING BYLAW AMENDMENT REVENUES
See Building Permits for allocation details.
4.3.2.8 OTHER PERMIT REVENUES (E.G. DEMOLITION, SIGNAGE)
See Building Permits for allocation details.
1 (Res)3 Supp
Hsg 8 (Rec NP) 9 (Farm) Total Res 2 (Util) 4 (Maj Ind) 5 (Lgt Ind)6 (Bus
Oth)7 (Mng
For)Total Non
ResRevenues 99.7580% 0.0000% 0.1940% 0.0480% 2.5140% 0.0180% 3.7840% 3.6750% 92.5210% 0.0020% 97.4860%Expenses 0.0000% 0.0000% 0.0000% 0.0000% 0.0000% 0.0000% 0.0000% 0.0000% 0.0000% 0.0000% 0.0000%
Net 99.7580% 0.0000% 0.1940% 0.0480% 2.5140% 0.0180% 3.7840% 3.6750% 92.5210% 0.0020% 97.4860%

2008 Municipal Sustainability Report City of Powell River
FITZGERALD, STICKELMANN
83 | P a g e
4.3.2.9 PLUMBING PERMIT REVENUES
See Building Permits for allocation details.
4.3.2.10 SUBDIVISION FEES
See Building Permits for allocation details.
4.3.2.11 PLANNING SERVICE REVENUES
INTER and INTRA-Class allocation of planning Services revenues is based on DIRECT PLANNING REVENUES.
TABLE 61: DIRECT PLANNING
4.3.3 ECONOMIC DEVELOPMENT
4.3.3.1 ADMINISTRATION
Administration includes expenditures related to Powell River Regional Economic Development and the Visitors Bureau.
INTER-Class allocation is based on a CONSULTANT'S ESTIMATE, 100% to Non-Residential.
INTRA-Class allocation is based on JOBS.
1 (Res)3 Supp
Hsg 8 (Rec NP) 9 (Farm) Total Res 2 (Util) 4 (Maj Ind) 5 (Lgt Ind)6 (Bus
Oth)7 (Mng
For)Total Non
ResRevenues 99.1360% 0.0000% 0.6890% 0.1750% 35.0150% 0.1230% 4.3840% 3.5700% 91.8090% 0.1140% 64.9850%Expenses 100.0000% 0.0000% 0.0000% 0.0000% 0.5450% 0.3010% 17.9050% 3.9790% 74.8740% 2.9410% 99.4550%
Net 99.1270% 0.0000% 0.6970% 0.1760% 104.1540% 8.6960% 653.7260% 23.2010% -721.4860% 135.8630% -4.1540%

2008 Municipal Sustainability Report City of Powell River
FITZGERALD, STICKELMANN
84 | P a g e
4.3.4 HARBOURS
The Westview Harbour consists of a north pleasure craft harbour and a south commercial fishing and transient craft harbour. The City operates and maintains both harbours with a staff of one full-time wharfinger, three part-time summer assistants, and the Transportation Manager. Federal Small Craft Harbours owns the south harbour and undertakes most major works. The City collects moorage fees, which typically offset and approximate City expenditures. In 2005, the City was in the process of securing the Provincial head lease for the north harbour, which operates on a moorage contract basis.
In spring of 2005, there were 303 craft in the North Harbour with another 84 on the waiting list. There is an active North Harbour Boat Owners’ Association.
4.3.4.1 NORTH BOAT HARBOUR
The North Harbour is a pleasure craft harbour and all revenues and expenditures are allocated both INTER and INTRA-Class to Class 1―Residential.

2008 Municipal Sustainability Report City of Powell River
FITZGERALD, STICKELMANN
85 | P a g e
4.3.4.2 SOUTH BOAT HARBOUR
The South Boat Harbour houses the Commercial Fishing Fleet and is used by transient recreational boaters. This harbour is viewed as a Non-Residential activity and would normally be allocated as such.
Federal Small Craft Harbours own the south harbour and are responsible for most expenditures. The City collects moorage fees that typically offset City expenditures.
In the event a short fall should occur, this would be deemed a Non-Residential expense; allocation INTER and INTRA-Class is based on JOBS (Excluding Class 2―Utilities).
TABLE 62: JOBS EXCLUDING CLASS 2―UTILITIES
In the event of a surplus, revenues are treated as a supplement to the overall Planning & Development budget, and are allocated entirely based on DIRECT PLANNING EXPENDITURES.
TABLE 63: DIRECT PLANNING
4.3.4.3 WHARFINGER REVENUES
The Wharfinger's Office obtains revenues from Berthage and Wharfage fees.
INTER-Class allocation is based on a CONSULTANT'S ESTIMATE 100% to Non-Residential; INTRA-Class allocation is based on JOBS (Excluding Class 2―Utilities).
2008Jobs % of Total
Utilities - 0.000%Major Industry 1,035 17.959%Light Industry 230 3.991%Business / Other 4,328 75.100%Managed Forest 170 2.950%Total Non-Residential Properties 5,763 100.000%
Non-Residential Properties
1 (Res)3 Supp
Hsg 8 (Rec NP) 9 (Farm) Total Res 2 (Util) 4 (Maj Ind) 5 (Lgt Ind)6 (Bus
Oth)7 (Mng
For)Total Non
ResRevenues 99.1360% 0.0000% 0.6890% 0.1750% 35.0150% 0.1230% 4.3840% 3.5700% 91.8090% 0.1140% 64.9850%Expenses 100.0000% 0.0000% 0.0000% 0.0000% 0.5450% 0.3010% 17.9050% 3.9790% 74.8740% 2.9410% 99.4550%
Net 99.1270% 0.0000% 0.6970% 0.1760% 104.1540% 8.6960% 653.7260% 23.2010% -721.4860% 135.8630% -4.1540%

2008 Municipal Sustainability Report City of Powell River
FITZGERALD, STICKELMANN
86 | P a g e
4.3.4.4 BARGE FACILITIES / TANKER WHARF
4.3.4.4.1 BARGE FACILITIES/ TANKER WHARF REVENUES
Revenues from the Barge Facilities / Tanker Wharf, come from three sources: Building and Land Leases, Revenues from Contract, and Wharfage. This facility is owned by Federal Small Craft Harbours, which undertakes most major work. Therefore, revenues in excess of any City Expenditures are treated as an overall reduction in the property tax levy.
INTER-Class allocation is based on a CONSULTANT'S ESTIMATE 100% to Non-Residential; INTRA-Class allocation is based on JOBS (Excluding Class 2―Utilities).
4.3.4.4.2 BARGE AND TANKER EXPENDITURES
This item includes expenditures related to salaries and wages, utilities, internal and external building maintenance, equipment the operations lease and the waterlot lease. As well as funds set aside for future expenditures — and is treated as a Non-Residential item.
INTER-Class allocation is based on a CONSULTANT'S ESTIMATE 100% to Non-Residential. INTRA-Class allocation is bases on OCCURRENCES to correspond with the allocation of associated revenues.
4.3.4.5 WHARFINGERS OFFICE
4.3.4.5.1 NORTH HARBOUR
See North Boat Harbour.
4.3.4.5.2 SOUTH HARBOUR
See South Boat Harbour.

2008 Municipal Sustainability Report City of Powell River
FITZGERALD, STICKELMANN
87 | P a g e
4.3.4.6 POWELL RIVER COMMUNITY FOREST
Powell River Community Forest Ltd. was established in 2006 — set up by the sole shareholder, the City of Powell River. Profits are returned to the community for investment.
The Powell River Community Forest licence issued in August 2006 covers approximately 7,100 hectares of forest area. A sustainable allowable annual cut has been calculated at 25,000 cubic meters per year. The company is responsible (only) for planning development and reforestation activities, and pays stumpage and various taxes as other forest companies do.
INTER and INTRA-Class allocation is based on OCCURRENCES so as to benefit all properties equally.

2008 Municipal Sustainability Report City of Powell River
FITZGERALD, STICKELMANN
88 | P a g e
4.4 ENGINEERING APM
The Engineering Department exists to provide a healthy, safe and high quality of life to the citizens by ensuring safe and adequate Water Supply, Streets, Buildings, Wastewater Collection/Treatment, and Solid Waste Collection. Services provided by the Engineering Department relate to Municipal Infrastructure and Development in the City.
• Streets Maintenance and Upgrading — including snow and ice removal, street sweeping, sidewalk maintenance, street lighting, traffic control signals, signage and road reconstruction.
• Water System Operation — including provision of water supply and distribution and water quality monitoring.
• Sewage and Drainage System Operation — including provision of sanitary and storm sewer collection and treatment systems.
• Garbage Collection — including pick up of residential and commercial solid waste. • Cemetery Operations and Administration. • Building Inspection Service.
4.4.1 ADMINISTRATION
Administration relates to general overhead specific to Engineering, but not to any explicit Residential or Non-Residential activity. Included under Administration are Engineering Services Administration and Public Works Administration. Also included under Administration is a minor revenue source, the 4% Engineering Administration Fee.
INTER and INTRA-Class allocation of revenues and expenditures is based on total DIRECT ENGINEERING EXPENDITURES. Preferably, revenues would be allocated based on contribution levels; however, in the absence of specific contribution details, revenues are treated as a general reduction in overall costs and allocated back, based on DIRECT ENGINEERING EXPENDITURES.
TABLE 64: DIRECT ENGINEERING
1 (Res)3 Supp
Hsg 8 (Rec NP) 9 (Farm) Total Res 2 (Util) 4 (Maj Ind) 5 (Lgt Ind)6 (Bus
Oth)7 (Mng
For)Total Non
ResRevenues 99.2340% 0.0000% 0.7600% 0.0060% 71.0550% 1.4460% 55.8110% 1.4250% 41.3090% 0.0090% 28.9450%Expenses 99.0420% 0.0000% 0.8380% 0.1200% 55.8200% 0.6440% 23.8390% 2.9900% 70.9690% 1.5580% 44.1800%
Net 98.4680% 0.0000% 1.0700% 0.4620% 34.0700% 0.1420% 3.7990% 3.9710% 89.5590% 2.5290% 65.9300%

2008 Municipal Sustainability Report City of Powell River
FITZGERALD, STICKELMANN
89 | P a g e
4.4.2 AIRPORT
The Powell River City Airport (YPW) is owned and operated by the City. The Airport includes 80 ha of related lands and infrastructure and is fully certified as a Transport Canada facility. The facility was deeded to the City by the Federal Government in the 1950s with various conditions.
Infrastructure includes paved 1190m by 46m runway (09-27), two paved taxiways, a 3500 m2 paved apron, a 237 m2 terminal, and a storage building of 55m2.
The airport manager and maintenance staff allocate a portion of their time to the airport; however, there is no assigned full-time staff. A specialized contractor undertakes specific regulatory functions such as runway inspection.
Public carriers pay a set fee based upon passenger counts and private users pay a runway departure fee. There is an airport reserve account for surplus revenues.
Federal funding is available and has been used for safety upgrades, runway lighting, etc. With the transfer of the airport, a significant extent of adjoining land was deeded to the City — albeit restricted to airport related uses. Most of these lands, some fully serviced, have remained vacant. Pacific Coastal Airlines provide regular scheduled flights daily, direct from the South Terminal of the Vancouver International Airport. Air travel to or from Vancouver International Airport takes approximately 25 minutes. Flights also arrive from the Comox and Campbell River airports.
The airport also accommodates the Westview Flying Club, an aircraft maintenance business, a car rental business, a weather station operated by NavCanada, a Ministry of Forestry fire base, and helicopter operations. For Powell River, the proximity of the Comox Valley Airport (YQQ) provides expanded accessibility to direct flights to major Canadian cities and new markets for tourism, trade and industry. YQQ is also the only Island airport capable of handling fully-laden large jet aircraft.
4.4.2.1 AIRPORT REVENUES
4.4.2.1.1 BUILDING AND LAND LEASES
Building and Land Leases relate to charges for the use of City owned property at the Powell River Airport. These revenues are not related to the consumption of City services, but for the use of City owned property. These revenues are first treated as an offset to airport building costs45
45 Same as any Landlord / Tenant relationship
with any surplus treated as a return on equity to the city — and would be

2008 Municipal Sustainability Report City of Powell River
FITZGERALD, STICKELMANN
90 | P a g e
distributed INTER and INTRA-Class, as a reduction to overall taxes for each class, based on DIRECT CATEGORY 1 AND CATEGORY 2 GENERAL EXPENDITURES .
TABLE 65: TOTAL DIRECT CATEGORY 1 AND 2 EXPENDITURES
In the event of a shortfall, allocation would be based on the assessment classification characteristics of the tenants / occupiers. Without specific detail on the classification of these properties, INTER-Class allocation is made 100% to Non-Residential. INTRA-Class allocation is based on IMPROVEMENT VALUES for Class 5―Light Industry and Class 6―Business and Other, as the most likely classifications for these buildings — and an indicator of maintenance required.
In 2008, revenues were insufficient to cover all Airport building maintenance and costs, resulting in an overall shortfall that is allocated to Class 5―Light Industry and Class 6―Business and Other.
4.4.2.1.2 PASSENGER DEPARTURE FEES
Passenger Departure Fees are charged to both private users and public carriers. Public Carriers pay a set fee based on passenger count while private users pay based on departures. Departure fees are used to offset Airport operating costs. Normally revenues are allocated based on the characteristics of those paying directly for the services. However, in this case, public carriers would simply act as an agent for the City, and pass these costs on to the users of the airlines. These would be allocated most appropriately based on the purpose of the passenger trips; however, this level of detail is not currently available.
TABLE 66: DIRECT AIRPORT
INTER and INTRA-Class allocation is based on DIRECT AIRPORT EXPENDITURES.
1 (Res)3 Supp
Hsg 8 (Rec NP) 9 (Farm) Total Res 2 (Util) 4 (Maj Ind) 5 (Lgt Ind)6 (Bus
Oth)7 (Mng
For)Total Non
ResTotal Type 1 98.971% 0.000% 0.830% 0.199% 75.780% 0.607% 16.253% 3.124% 78.046% 1.970% 24.220%Total Type 2 99.713% 0.000% 0.244% 0.043% 58.523% 0.112% 5.325% 2.061% 92.213% 0.289% 41.477%Total Category 1 and 2 Expenditures 99.092% 0.000% 0.734% 0.174% 72.309% 0.458% 12.960% 2.803% 82.315% 1.464% 27.691%
1 (Res)
Hsg 8 (Rec NP) 9 (Farm) Total Res 2 (Util) 4 (Maj Ind) 5 (Lgt Ind) Oth)
For)
Res
Revenues 0.0000% 0.0000% 0.0000% 0.0000% 0.0000% 0.0000% 0.0000% 0.5210% 99.4790% 0.0000% 100.0000%Expenses 98.4420% 0.0000% 1.2440% 0.3140% 31.1030% 0.2740% 8.0570% 2.0760% 88.2690% 1.3240% 68.8970%
Net 98.4420% 0.0000% 1.2440% 0.3140% 43.3050% 0.4630% 13.6330% 3.1520% 80.5120% 2.2400% 56.6950%

2008 Municipal Sustainability Report City of Powell River
FITZGERALD, STICKELMANN
91 | P a g e
4.4.2.1.3 AIRCRAFT PARKING FEES
Aircraft parking Fees are treated as a general revenue source and are allocated INTER and INTRA-Class using DIRECT AIRPORT EXPENDITURES.
TABLE 67: DIRECT AIRPORT
4.4.2.1.4 FUEL DISPENSING FEES
Fuel Dispensing Fees are treated as a general revenue source and are allocated INTER and INTRA-Class using DIRECT AIRPORT EXPENDITURES.
TABLE 68: DIRECT AIRPORT
4.4.2.2 AIRPORT EXPENDITURES
4.4.2.2.1 AIRPORT TERMINAL BUILDING
Expenditures at the Airport Terminal Building relate to internal equipment as well as building structural maintenance. Ideally, the most appropriate allocation of this expenditure would relate to the purpose of the passenger trips; however, as stated under Passenger Departure Fees this information is not currently available.
INTER-Class allocation is based on a CONSULTANT'S ESTIMATE, 50% Residential and 50% Non-Residential, assuming roughly equal usage for personal and business purposes.
INTRA-Class allocation is based on OCCURRENCES for Residential, and JOBS for Non-Residential.
4.4.2.2.2 AIRPORT ACCESSORY BUILDINGS
See Airport Terminal Building for allocation details.
4.4.2.2.3 AIRPORT GROUNDS AND MAINTENCE
See Airport Terminal Building for allocation details.
1 (Res)
Hsg 8 (Rec NP) 9 (Farm) Total Res 2 (Util) 4 (Maj Ind) 5 (Lgt Ind) Oth)
For)
Res
Revenues 0.0000% 0.0000% 0.0000% 0.0000% 0.0000% 0.0000% 0.0000% 0.5210% 99.4790% 0.0000% 100.0000%Expenses 98.4420% 0.0000% 1.2440% 0.3140% 31.1030% 0.2740% 8.0570% 2.0760% 88.2690% 1.3240% 68.8970%
Net 98.4420% 0.0000% 1.2440% 0.3140% 43.3050% 0.4630% 13.6330% 3.1520% 80.5120% 2.2400% 56.6950%

2008 Municipal Sustainability Report City of Powell River
FITZGERALD, STICKELMANN
92 | P a g e
4.4.3 BUILDING PERMITS
Information on Building Inspections was not available; however, statistics on building permits are maintained by the City. The BUILDING INSPECTIONS driver uses Building Permits46
INTER and INTRA-Class allocation is based on the table set out below. Permits are typically paid by contractors, architects and the like; however, the authors have allocated a small portion to Residential so as to reflect the do-it-yourself (DIY) builder.
as a proxy for Building Inspections.
In the absence of a detailed breakdown of Building Permits by Payee, INTER-Class allocation is based on a CONSULTANT'S ESTIMATE of 5% Residential, while Non-Residential is allocated 95%.
INTRA-Class allocation is made 100% to Class 1―Residential and Class 6―Business and Other, for Non-Residential.
TABLE 69: BUILDING PERMIT STATISTICS ($)
TABLE 70: BUILDING PERMIT STATISTICS (%)
46 Value of Construction by Type and Year (1992 to 2007) including number of permits provided by the City of Powell River in file Building Stats from 1992 to date.xls.
Commercial / Industrial
PermitsConstruction
ValueAverage
Permit Value
Residential / Mobile Home
PermitsConstruction
ValueAverage
Permit Value2008 23 6,393,500 277,978 131 11,390,091 86,947 2007 34 4,998,646 147,019 130 9,274,249 71,340 2006 27 8,740,360 323,717 162 91,129 563 2005 34 17,608,534 517,898 151 8,693,807 57,575
Total 118 37,741,040 319,839 574 29,449,276 51,305 Average 30 9,435,260 144 7,362,319
Commercial / Industrial
Construction Value
Residential / Mobile Home
Construction Value
2008 15% 36% 85% 64%2007 21% 35% 79% 65%2006 14% 99% 86% 1%2005 18% 67% 82% 33%
Total 17% 56% 83% 44%Average 17% 56% 83% 44%

2008 Municipal Sustainability Report City of Powell River
FITZGERALD, STICKELMANN
93 | P a g e
4.4.4 COMMUNITY WORKS RESERVES
Community Works Reserves are amounts set aside from the current budget to meet future needs and obligations related to Community Works.
Allocation of Reserve funds is discussed in Part 6 - Definitions, under Cost Categories.
INTER and INTRA-Class allocation is based on 2008 TAXES PAID.
4.4.5 RESERVES
In 2008, reserves were used for the following items: 1) Equipment, 2) Building Maintenance, 3) Community Works and the Hwy 101 Re-Alignment.
See Budget Categories for a description of the allocation methodology.
For transfers greater than or equal to $100,000, INTER and INTRA-Class allocation is based on 2001-2008 TAXES PAID. For transfers less than $100,000, INTER and INTRA-Class allocation is based on 2008 TAXES PAID.
4.4.6 ROADS
Roads account relates to the maintenance and upkeep of arterials, connectors and local roads. ROAD USE is the result of personal, personal/ business, and business activities within the municipality; all are allocated on an INTER-Class basis using the ROAD USE driver.
TABLE 71: ROAD USE DRIVER
INTRA-Class allocations are based on OCCURRENCES within the Residential property classes —as roads are deemed to benefit all properties proportionally — and JOBS for Non-Residential properties, as a proxy for activity on municipal roads.
Residential (Personal)
Use Km
Non-Residential
Use Km Total Km
Residential Use 21,059,760 18,849,760 39,909,520 Transit 75,642 69,750 145,392 Trucks 5,986,428 5,986,428
Total Km 21,135,402 24,905,939 46,041,341
Road Usage Driver 45.9% 54.1%

2008 Municipal Sustainability Report City of Powell River
FITZGERALD, STICKELMANN
94 | P a g e
4.4.7 SANITATION AND WASTE COLLECTION
4.4.7.1 SOLID WASTE DISPOSAL
The Regional District administers garbage or solid waste disposal, thus there is a limited City role in the collection within its boundaries. The City sells garbage tags for curbside pickup and then pays the Region by the ton. Two City staff and two small industrial trucks operate pick-up on a weekly rotating schedule that shifts with statutory holidays. The annual residential garbage collection levy covers the operating costs and the system operates on a break-even basis.
Commercial, industrial, and all non-residential solid waste is handled by a private collection system.
4.4.7.2 SOLID WASTE REDUCTION & RECYCLING
In order to reduce demands on the Cache Creek landfill, or any other future landfill the City strongly encourages recycling. The tag bag system for solid waste pickup indirectly supports recycling. The City currently operates bi-weekly curbside pickup for the “Blue Box” program with operator and equipment costs covered via a special tax levy. To promote a workable system, items are required to be clean, sorted and bagged. To this end, there is ongoing public information and education for best practices of recycling preparation. Recycling is subsidized with the Regional District contracting this service through a competitive bidding process. The main recycling depot is currently along Highway 101, approximately one kilometre south of the City.
4.4.7.3 CONTAMINATED SITES
The Contaminated Site Program was created to provide a legally defined, uniform process to screen, record, and administer the remediation of contaminated lands in BC. The legislative changes of 2005 increased the liability protection for local governments in administering the program, and in the case of unintentionally acquiring contaminated lands (typically via tax default). The City cooperates with the Ministry of Environment in the Contaminated Sites program as regulated by the Environmental Management Act.

2008 Municipal Sustainability Report City of Powell River
FITZGERALD, STICKELMANN
95 | P a g e
4.4.7.4 ADMINISTRATION
Administration is an indirect cost related to garbage collection services.
INTER and INTRA-Class allocation is based on DIRECT SANITATION & WASTE EXPENDITURES.
TABLE 72: DIRECT SANITATION & WASTE
4.4.7.5 RESIDENTIAL SERVICE
Residential garbage service includes revenues from Residential Garbage Rates and Garbage bag tags. Expenditures include Residential Garbage Pickup and Recycling.
INTER-Class allocation is made 100% to Residential. INTRA-Class allocation is based on OCCURRENCES for Class 1―Residential and Class 8―Recreation/Non-Profit.
4.4.7.6 COMMERCIAL SERVICE
Commercial garbage service includes revenues from Commercial Garbage Rates. Expenditures include Commercial Garbage Collection. From the OCP, Bylaw 2080, 2005 Commercial, Industrial, and Non-Residential solid waste is handled by a private collection system. The authors presume that since 2005 the City have moved into the Commercial Collection function.
INTER-Class allocation is made 100% to Non-Residential. INTRA-Class allocation is based on JOBS for Class 5―Light Industry and Class 6―Business and Other.
1 (Res)3 Supp
Hsg 8 (Rec NP) 9 (Farm) Total Res 2 (Util) 4 (Maj Ind) 5 (Lgt Ind)6 (Bus
Oth)7 (Mng
For)Total Non
ResRevenues 98.7520% 0.0000% 1.2480% 0.0000% 91.5710% 0.0000% 0.0000% 7.5160% 92.4840% 0.0000% 8.4290%Expenses 98.7520% 0.0000% 1.2480% 0.0000% 84.9500% 0.0000% 0.0000% 7.5140% 92.4860% 0.0000% 15.0500%
Net 98.7520% 0.0000% 1.2480% 0.0000% 104.3560% 0.0000% 0.0000% 7.5050% 92.4950% 0.0000% -4.3560%

2008 Municipal Sustainability Report City of Powell River
FITZGERALD, STICKELMANN
96 | P a g e
4.4.7.7 GARBAGE BINS
Allocation of Garbage Bins would normally be based on long-term actual activity. Information on this item was not available; however, revenues and expenditures are minor and this item is self-funding.
INTER and INTRA-Class allocation is based in DIRECT SANITATION & WASTE EXPENDITURES.
TABLE 73: SANITATION & WASTE DIRECT
4.4.8 SIDEWALKS, CURBS AND FOOTBRIDGE
This account includes salaries, contracts, equipment and material costs to maintain City Sidewalks, Curbs and Footbridges. Normally, allocation of this item would be based on statistics related to the actual costs over the long-term of the property class benefitting from this activity.
Detailed information on Sidewalks, Curbs and Footbridge were not available for review at the time of this report. INTER-Class allocation is made by CONSULTANT'S ESTIMATE, 95% to Non-Residential with the notion that the majority of these activities would be undertaken in areas of higher traffic. These are most likely to be in commercial areas.
INTRA-Class allocation is based on OCCURRENCES for Class 1―Residential and JOBS for Non-Residential Class 5―Light Industry and Class 6―Business and Other.
1 (Res)3 Supp
Hsg 8 (Rec NP) 9 (Farm) Total Res 2 (Util) 4 (Maj Ind) 5 (Lgt Ind)6 (Bus
Oth)7 (Mng
For)Total Non
ResRevenues 98.7520% 0.0000% 1.2480% 0.0000% 91.5710% 0.0000% 0.0000% 7.5160% 92.4840% 0.0000% 8.4290%Expenses 98.7520% 0.0000% 1.2480% 0.0000% 84.9500% 0.0000% 0.0000% 7.5140% 92.4860% 0.0000% 15.0500%
Net 98.7520% 0.0000% 1.2480% 0.0000% 104.3560% 0.0000% 0.0000% 7.5050% 92.4950% 0.0000% -4.3560%

2008 Municipal Sustainability Report City of Powell River
FITZGERALD, STICKELMANN
97 | P a g e
4.4.9 SIGNS & TRAFFIC LIGHTS
Signs and Traffic lights relate to maintenance activities aimed at efficient and safe traffic operations and Hydro.
TABLE 74: ROAD USE DRIVER
INTER -Class allocation is based on the ROAD USE driver.
INTRA-Class allocation uses OCCURENCES for Residential and JOBS for Non-Residential, as all properties benefit proportionally.
4.4.10 STORM SEWER
The Storm Sewer system is designed to collect and convey storm runoff from the City, and aid in flood prevention. Storm Sewer includes the following accounts: Storm Sewer Connections and Storm Sewer Maintenance.
Ideally, INTER and INTRA-Class allocation of Storm Sewer Revenues would be based on long-term actual statistics related to the collection of these fees. In the absence of this detail, INTER and INTRA-Class allocation of Storm Sewer Revenues uses a CONSULTANT'S ESTIMATE 100% to Class 6―Business and Other. The assumption is made that Storm Sewer Connections are primarily driven by the conversion of vacant land into an improved property; as vacant land is treated as Class 6―Business and Other for its development potential and therefore paid for by developers in conversion.
INTER and INTRA-Class allocation of Storm Sewer expenditures uses 2008 IMPROVEMENT VALUES as a proxy for the benefits received by improvements.
Residential (Personal)
Use Km
Non-Residential
Use Km Total Km
Residential Use 21,059,760 18,849,760 39,909,520 Transit 75,642 69,750 145,392 Trucks 5,986,428 5,986,428
Total Km 21,135,402 24,905,939 46,041,341
Road Usage Driver 45.9% 54.1%

2008 Municipal Sustainability Report City of Powell River
FITZGERALD, STICKELMANN
98 | P a g e
4.4.11 STREET LIGHTS
Street Lights provide general safety through adequate lighting in all public and semi-public areas.
Street Lights are assumed to benefit properties proportionally, therefore INTER and INTRA-Class allocations are based on OCCURRENCES, excluding: Class 8―Recreational and Non-Profit, 9―Farm, 2―Utilities and 7― Managed Forest, as these properties do not directly benefit from this item.
4.4.12 TOOLS & EQUIPMENT
Tools and Equipment is a reserve fund for the replacement of equipment and tools.
INTER and INTRA-Class allocation of Transfers to Reserve Fund is determined DIRECT ENGINEERING EXPENDITURES.
TABLE 75: DIRECT ENGINEERING
1 (Res)3 Supp
Hsg 8 (Rec NP) 9 (Farm) Total Res 2 (Util) 4 (Maj Ind) 5 (Lgt Ind)6 (Bus
Oth)7 (Mng
For)Total Non
ResRevenues 99.2340% 0.0000% 0.7600% 0.0060% 71.0550% 1.4460% 55.8110% 1.4250% 41.3090% 0.0090% 28.9450%Expenses 99.0420% 0.0000% 0.8380% 0.1200% 55.8200% 0.6440% 23.8390% 2.9900% 70.9690% 1.5580% 44.1800%
Net 98.4680% 0.0000% 1.0700% 0.4620% 34.0700% 0.1420% 3.7990% 3.9710% 89.5590% 2.5290% 65.9300%

2008 Municipal Sustainability Report City of Powell River
FITZGERALD, STICKELMANN
99 | P a g e
4.4.13 TRANSIT
Community transit service is operated by the City in partnership with the Regional District (for rural para-transit only) and BC Transit. Transit is comprised of three services:
conventional fixed routes; fully accessible rural transit; and door-to-door “handyDART” for those with disabilities.
The system in 2004 was operated by four full-time drivers and a contingent of part-time and supplemental relief staff. In addition, the manager and mechanics allocated a portion of their time to transit operations.
Routes and scheduling are modified in response to community needs, land use, development, and public input. In 2004, there was no service on Sundays and Statutory Holidays. The system currently serves some public school students and there has been discussion with the School Board for future coordination of the buses with school hours.
In 2008, Transit provided ridership to 201,110 passengers, on 10,036 Revenue hours of service. This equates to 20 passengers per revenue hour.
TABLE 76: TRANSIT RIDERSHIP
Year PassengersChange in
Passengers% Annual
Change2008 201,110 40,799 25.4%2007 160,311 6,714 4.4%2006 153,597 17,146 12.6%2005 136,451 5,879 4.5%2004 130,572
FIGURE 17: TRANSIT ROUTES

2008 Municipal Sustainability Report City of Powell River
FITZGERALD, STICKELMANN
100 | P a g e
4.4.13.1 MUNICIPAL TRANSIT REVENUES
Transit Revenues are paid by Residents for use of the Transit system. Transit Revenues include Bus Fares, Bus Tickets, Bus Passes and Other Transit Fees, and are paid by Residents as a "User Fee" for Transit services consumed.
INTER-Class allocation is made entirely to Residential; INTRA-Class is made entirely to Class 01―Residential.
4.4.13.2 TRANSFERS FROM BC TRANSIT
In addition to the revenues mentioned above, the City receives funds from BC Transit to assist with funding of the Transit system within the City.
The Regulations of the BC Transit Act set out the formula for sharing costs of transit between BC Transit and its Municipal transit partners. BC Transit's share of transit system funding is provided by the Provincial Government. BC Transit funds 46.69% of conventional transit systems and 66.69% of custom/para-transit systems. A system that is a combination of custom and conventional service will have a cost sharing percentage that reflects the level of each type of service.
These revenues are treated as a Grant for the calculation of consumption.
INTER and INTRA-Class allocation is based on DIRECT TRANSIT EXPENDITURES so as to provide equitable distribution of these expenditures.
TABLE 77: DIRECT TRANSIT
1 (Res)3 Supp
Hsg 8 (Rec NP) 9 (Farm) Total Res 2 (Util) 4 (Maj Ind) 5 (Lgt Ind)6 (Bus
Oth)7 (Mng
For)Total Non
ResRevenues 100.0000% 0.0000% 0.0000% 0.0000% 100.0000% 0.0000% 0.0000% 0.0000% 0.0000% 0.0000% 0.0000%Expenses 100.0000% 0.0000% 0.0000% 0.0000% 61.5140% 0.0000% 0.0000% 0.0000% 100.0000% 0.0000% 38.4860%
Net 100.0000% 0.0000% 0.0000% 0.0000% -51.8050% 0.0000% 0.0000% 0.0000% 100.0000% 0.0000% 151.8050%

2008 Municipal Sustainability Report City of Powell River
FITZGERALD, STICKELMANN
101 | P a g e
4.4.13.3 TRANSIT EXPENDITURES
As stated earlier, Transit Expenditures relate to the City of Powell River's share for the Conventional Transit System.
INTER-Class allocation is based on TRANSIT USE and INTRA-Class allocation for Residential is made 100% to Class 01―Residential; Non-Residential is made entirely to Class 06―Business and Other, based on the properties served by Transit.
4.4.14 VANDALISM
The Vandalism account relates to expenditures to repair City property damaged by vandals. INTER-Class allocation is made equally between Residential and Non-Residential. INTRA-Class allocation is based on 2008 IMPROVEMENT VALUES as repairs of vandalized property are seen to maintain the quality and standard of improvements within the City.

2008 Municipal Sustainability Report City of Powell River
FITZGERALD, STICKELMANN
102 | P a g e
4.5 PARKS, RECREATION AND CULTURE APM
The Mission47
Goals include:
of the Powell River Parks, Recreation & Culture Department is to enhance the quality of life for all citizens through: the facilitation of recreation services; providing and maintaining parks and green space; supporting arts and culture in a positive, healthy and equitable manner.
• Providing leisure services to further growth and development of the community. The Parks, Recreation and Culture department should positively connect local residents to the community by fostering a sense of:
• Community Identity – feeling part of the community Community Spirit & Pride – feeling good about being part of the community Community Culture – unique and distinguishing community characteristics or attributes
• Provide leisure services to further growth and development of the individual. Leisure services contribute to the emotional, intellectual, physical and social development and growth of residents.
4.5.1 MUSEUM
The museum preserves the cultural history of Powell River and provides economic stimulus to the local community through tourism.
Revenues for the Museum are combined with Library revenues and normally these would be segregated to permit a more accurate allocation. These revenues have been allocated 100% to Residential; however, this does not recognize the economic component of the Museum.
INTER-Class allocation is based on a CONSULTANT'S ESTIMATE, 50% to Residential for cultural preservation and 50% to Non-Residential to reflect the tourism aspect of the Museum.
INTRA-Class allocation is based on OCCURENCES for Residential and JOBS for Non-Residential.
47 http://www.powellriver.ca/siteengine/activepage.asp?PageID=28 (Extracted 2009-05-23)

2008 Municipal Sustainability Report City of Powell River
FITZGERALD, STICKELMANN
103 | P a g e
4.5.2 PARKS
4.5.2.1 ADMINISTRATION
Administration is an expenditure for the overall management and maintenance activities of parks. This includes expenditures for Salaries and Wages, training, utilities, computer administration, building and street maintenance, gardening supplies, planning and design, street trees, trail and seawalks, and waste disposal.
Normally, administration costs would be allocated INTER and INTRA-Class based on the total direct expenditures of specific parks. It appears that most of the parks are maintained under a single budget item, therefore this expenditure has been allocated INTER and INTRA-Class, based on overall DIRECT PARKS, RECREATION AND CULTURE EXPENDITURES.
TABLE 78: DIRECT PARKS, RECREATION AND CULTURE
1 (Res)3 Supp
Hsg 8 (Rec NP) 9 (Farm) Total Res 2 (Util) 4 (Maj Ind) 5 (Lgt Ind)6 (Bus
Oth)7 (Mng
For)Total Non
ResRevenues 99.8210% 0.0000% 0.1430% 0.0360% 79.0800% 0.0140% 0.4100% 0.0910% 99.4180% 0.0670% 20.9200%
Expenditures 99.7240% 0.0000% 0.2200% 0.0560% 85.2150% 0.0320% 0.9580% 0.2130% 98.6390% 0.1580% 14.7850%Net 99.6680% 0.0000% 0.2650% 0.0670% 89.1960% 0.0560% 1.6480% 0.3660% 97.6590% 0.2710% 10.8040%

2008 Municipal Sustainability Report City of Powell River
FITZGERALD, STICKELMANN
104 | P a g e
4.5.3 OTHER PARKS EXPENDITURES
Other Parks include Sunset Park Washrooms / Electrical Shed, Mowat Bay Washrooms, DA Evans Washroom & Scoreshack, Larry Guthro Park, Westview Playground and Lindsay Park Washrooms.
TABLE 79: OTHER PARKS
Information relevant to consumption analysis on these facilities was limited or did not exist on the City's website. It is likely these facilities, based on the expenditure levels, are related to Class 1―Residential. In the absence of specific City detail, allocation of the above Parks is based on overall DIRECT PARKS, RECREATION AND CULTURE EXPENDITURES (See Administration).
TABLE 80: DIRECT PARKS, RECREATION AND CULTURE
4.5.3.1 FIELD USER FEES AND RESERVES
Field User fees relate to revenues received for the use of City Sports fields. These fees are all placed in a reserve fund for field maintenance.
As fees and usage appear to relate to personal and recreational consumption, INTER and INTRA-Class allocation is 100% to Class 1. As this appears to be a self funding item, there is no impact on property tax distribution.
Account Consultant Cost Category2008 Original
BudgetSunset Park Washrooms / Electrical Shed Parks ( 510)$ Mowat Bay Washrooms Parks ( 500) DA Evans Washroom & Scoreshack Parks ( 200) Larry Gouthro Park Parks ( 200) Westview Playground Parks ( 1,600) Lindsay Park Washrooms Parks ( 200)
( 3,210)$
1 (Res)3 Supp
Hsg 8 (Rec NP) 9 (Farm) Total Res 2 (Util) 4 (Maj Ind) 5 (Lgt Ind)6 (Bus
Oth)7 (Mng
For)Total Non
ResRevenues 99.8210% 0.0000% 0.1430% 0.0360% 79.0800% 0.0140% 0.4100% 0.0910% 99.4180% 0.0670% 20.9200%
Expenditures 99.7240% 0.0000% 0.2200% 0.0560% 85.2150% 0.0320% 0.9580% 0.2130% 98.6390% 0.1580% 14.7850%Net 99.6680% 0.0000% 0.2650% 0.0670% 89.1960% 0.0560% 1.6480% 0.3660% 97.6590% 0.2710% 10.8040%

2008 Municipal Sustainability Report City of Powell River
FITZGERALD, STICKELMANN
105 | P a g e
4.5.4 POWELL RIVER RECREATION COMPLEX
The Powell River Recreation Complex is a centralized recreation facility with two ice arenas, a swimming pool, children’s pool, hot tub, sauna, exercise/weight room, a 725 seat auditorium and eight multi-purpose rooms of varying sizes. Also included at this site is Dwight Hall; a multi-purpose heritage building with mature gardens, kitchen, stage, several smaller multi-purpose rooms and a Grand Hall.
4.5.4.1 ARENA
The Arena is part of the Powell River Recreation located at 5001 Joyce Avenue. The arena has:
• 200' x 85' ice surface • seating for 1,312 including 6 for wheelchairs, • 594 theatre-style seats, • Infrared overhead radiant heating, • 3 Concessions, • Access to 10 dressing rooms, • a Press box/sound room, and • a Heated Skating lounge & skate shop.
The arena is home to the Powell River Kings Hockey Club Society and the Powell River Regals Hockey Club. The Powell River Kings play in the BC Junior Hockey league from August until April, with playoffs potentially expanding into May or June for an 8 to 10 month season. For purposes of consumption analysis, the Kings are treated as Non-Residential.
4.5.4.1.1 REVENUES
4.5.4.1.1.1 ADMISSIONS
Admissions relate to fees for use of the arena. Allocation would preferably come from a detailed analysis of Admission revenue sources. It is assumed that 25% of Arena Admission revenues relate to the Powell River Kings.
In the absence of this detail, INTER-Class allocation was based on a Class 1―Residential 75% and Non-Residential 25%. INTRA-Class allocation for Residential is 100% to Class 1―Residential and for Non-Residential, 100% to Class 6―Business and Other.

2008 Municipal Sustainability Report City of Powell River
FITZGERALD, STICKELMANN
106 | P a g e
4.5.4.1.1.2 ARENA PROGRAMS
Arena Programs are those incidentals to the Arena and separate from other Recreation Programs. These programs are seen to be oriented to personal / recreational users who pay required fees.
INTER and INTRA-Class allocation is made 100% to Class 1―Residential.
4.5.4.1.1.3 BOARD ADVERTISING
Provides opportunities for business to advertise through varying mediums e.g. rink board signs, penalty box signs, in-rink logos, wall signs. This revenue source is paid by businesses, who receive an economic benefit for this fee. As business advertising is a voluntary program and business expects to receive economic benefits to offset this cost, this item is allocated INTER and INTRA-Class 100% to Class 1―Residential.
4.5.4.1.1.4 FACILITY RENTALS
Facility Rentals relate to fees for the use of the arena and rink facility. Users of the facility include the local Minor Hockey Association, Figure Skating Club, and the Powell River Kings BCJHL franchise. A detailed summary of actual users of the facility (based on revenues received or facility time used), would ideally produce the most accurate allocation of this revenue source — which was not available. INTER-Class allocation is based on CONSULTANT'S ESTIMATE 75% to Residential and 25% to Non-Residential; INTRA-Class allocation is made 100% to Class 1―Residential and for Non-Residential, 100% to Class 6―Business and Other.
4.5.4.1.1.5 PASS SALES
This item is self-explanatory and uses the same allocation methodology as Admissions.
4.5.4.1.1.6 SKATE SHOP
The Skate shop revenues are received from skate rentals and sharpening services for users of the facility. These programs are seen to be oriented to personal / recreational users who pay required fees.
INTER and INTRA-Class allocation is made 100% to Class 1―Residential.

2008 Municipal Sustainability Report City of Powell River
FITZGERALD, STICKELMANN
107 | P a g e
4.5.4.1.2 EXPENSES
4.5.4.1.2.1 ARENA EXPENSES
Arena Expenses relate to the general operation and maintenance of the Arena and Rink facilities. A use analysis over the long-term would provide the best indicator of the type of user. Arena Expenses include wages and salaries, contract instructors, training, development, utilities, internal and external structural costs, equipment repair, janitorial services and the like. With only a few immaterial exceptions, expense items are not attributable to any specific activity; hence INTER-Class allocation is made 75% to Residential and 25% to Non-Residential. INTRA-Class allocation is made 100% to Class 1―Residential and for Non-Residential, 100% to Class 6―Business and Other.
4.5.4.1.3 MFA - RINK/ARENA DEBT
Rink/Arena Debt includes both principal and interest and relates to Municipal Finance Authority Borrowing related to this specific facility.
INTER and INTRA-Class allocation is based on DIRECT ARENA EXPENDITURES as these are deemed to be a fair representation of the use of the facility.
TABLE 81: DIRECT ARENA
4.5.4.1.3.1 SKATE SHOP
The Skate shop expenditures relate to ongoing costs to maintain skate rentals and sharpening services for users of the facility. These programs are seen to be oriented to personal / recreational users who pay required fees.
INTER and INTRA-Class allocation is made 100% to Class 1―Residential.
4.5.4.2 CULTURE
This item relates to the unique and distinguishing characteristics or attributes48
INTER and INTRA-Class allocation is made 100% to Residential.
of the City.
48 From City of Powell River, Parks, Recreation and Culture web page.
1 (Res)3 Supp
Hsg 8 (Rec NP) 9 (Farm) Total Res 2 (Util) 4 (Maj Ind) 5 (Lgt Ind)6 (Bus
Oth)7 (Mng
For)Total Non
ResRevenues 100.000% 0.000% 0.000% 0.000% 75.942% 0.000% 0.000% 0.000% 100.000% 0.000% 24.058%
Expenditures 100.000% 0.000% 0.000% 0.000% 75.000% 0.000% 0.000% 0.000% 100.000% 0.000% 25.000%Net 100.000% 0.000% 0.000% 0.000% 74.507% 0.000% 0.000% 0.000% 100.000% 0.000% 25.493%

2008 Municipal Sustainability Report City of Powell River
FITZGERALD, STICKELMANN
108 | P a g e
4.5.4.3 OUTDOOR SWIMMING POOL
Information on the outdoor swimming pool confirms it is or was used for personal recreational activities.
INTER and INTRA-Class allocation is made 100% to Class 1―Residential.
4.5.5 POOL & FITNESS
The Aquatic Centre contains:
• a 25 meter pool with a slide, cargo net, Tarzan swing rope, and bleachers that seat up to 300 people;
• a leisure pool49
• sun tanning studio with 2 private tanning booths;
with a large stair for easy access, a geyser, tot slide and raindrop pool;
• free form swirl pool with seating capacity of 35; • sauna • fitness studio with Olympic free weights, cardio equipment, bodyguard stepper,
concept II rower, dumbbells up to 75 lbs, three upper body stations50
4.5.5.1 REVENUE
, and various other fitness equipment.
Pool Revenues are derived primarily from admissions and pass sales (72.8%), with the remainder coming from such things as aerobics, admissions, facility rentals, locker rentals, the pro-shop, school rentals, suntan booth and swim lessons. These revenues are paid by residential users for personal benefit and enjoyment, therefore, INTER and INTRA-Class allocation is made 100% to Class 1―Residential.
4.5.5.2 EXPENDITURES
The Aquatic Centre generally provides facilities and activities that cater to personal and recreational users, hence, these expenditures have been allocated INTER and INTRA-Class 100% to Class 1―Residential.
49 18" to 3 feet deep. 50 Wheelchair accessible.

2008 Municipal Sustainability Report City of Powell River
FITZGERALD, STICKELMANN
109 | P a g e
4.5.5.3 THEATRE & MEETING ROOMS
Theatre and Meeting rooms are located at the Powell River Recreation Complex including Dwight Hall.
The Theatre is designed as a combination of facilities with portable acoustical walls separating areas such as the Theatre, as well as small and large banquet rooms. The Theatre offers seating for 723 with 8 wheelchair spaces, compact seating of 273, a full performing stage complete with orchestra pit, computerized lighting system, sound system, dressing and rehearsal rooms.
Meeting rooms includes:
• Arbutus Room: 80' x 40' with a seating capacity of 250. • Cedar Room: 40' x 40' with a seating capacity of 120. • Combination of Arbutus and Cedar Room: 120' x 40' with a seating capacity of 370. • Prep Kitchen 20' x 20' equipped with 2 electric stoves, 2 ovens, a large commercial
refrigerator, warming table coffee urns and a dishwasher. • Elm Room: 20' x 40' with a seating capacity of 50. • Poplar Room: 20' x 32' with a seating capacity of 50. • Spruce Room: 22' x 12' with a seating capacity of 50. • Maple Room: 16' x 22' with a seating capacity of 25. • Rehearsal Room: 20' x 40' with a seating capacity of 50.
From information available in the Leisure Guide Winter ∕ Spring 2009, it appears the intended users of these facilities are primarily local groups — for general public activities.
The best allocation indicator would be based on actual use data — not available for this study. In the absence of the latter, INTER-Class allocation is made by CONSULTANT’S ESTIMATE, 95% to Residential — as the primary user of these facilities — and 5% to Non-Residential as incidental users.
INTRA-Class allocation is based on OCCURENCES for Residential, and JOBS for Non-Residential.
4.5.5.4 POWELL LAKE
Powell Lake facilities are located in Waterfront Commercial zoning and offer a variety of commercially based recreational activities e.g. floating cabins.
INTER and INTRA-Class allocation is made 100% to Class 6―Business and Other.

2008 Municipal Sustainability Report City of Powell River
FITZGERALD, STICKELMANN
110 | P a g e
4.5.6 RECREATION PROGRAMS
Recreation Programs are Community recreation programs offered through Parks, Recreation and Culture. Current programs are defined in the Leisure Guide Winter ∕ Spring 2009 and are related to personal and family recreational activities. Continuing Studies, which relate to the development of business skills are offered and funded through Vancouver Island University.
INTER and INTRA-Class allocation is made 100% to Class 1―Residential.
4.5.7 SNACK BARS
4.5.7.1.1 REVENUES
Revenues come from three identified51
4.5.7.1.2 EXPENDITURES
locations as well as Vending - Contract Commissions. Revenues from snack bars come from personal consumption hence these are allocated both INTER and INTRA-Class 100% to Class 1―Residential.
Allocation of Snack Bars would normally be based on the use and operating characteristics of the facility or activities that make use of the snack bars. Detailed information on the use and operation of the facilities and activities was not available from the accounts provided; however, snack bars appear to be most related to the arena, rink and the theatre.
INTER and INTRA-Class allocation is based on the total DIRECT RECREATION COMPLEX expenditures related to these facilities.
TABLE 82: DIRECT RECREATION COMPLEX
51 Sales #1, Sales - Reception F&B, and Sales #2 (From City General Operation Fund information provided by the City.
1 (Res)3 Supp
Hsg 8 (Rec NP) 9 (Farm) Total Res 2 (Util) 4 (Maj Ind) 5 (Lgt Ind)6 (Bus
Oth)7 (Mng
For)Total Non
ResRevenues 99.780% 0.000% 0.176% 0.044% 91.129% 0.046% 1.364% 0.304% 98.062% 0.224% 8.871%
Expenditures 99.658% 0.000% 0.273% 0.069% 89.904% 0.062% 1.839% 0.409% 97.388% 0.302% 10.096%Net 99.585% 0.000% 0.331% 0.084% 89.199% 0.070% 2.063% 0.458% 97.070% 0.339% 10.801%

2008 Municipal Sustainability Report City of Powell River
FITZGERALD, STICKELMANN
111 | P a g e
4.5.7.2 TOWNSITE TENNIS COURT - CLUBHOUSE.
This site contains 4 tennis courts, public washrooms, lawn bowling green adjacent to the tennis courts, and a clubhouse.
INTER and INTRA-Class allocation is made 100% to Residential as this is used for personal recreational activity and there is no evidence of fees or charges.
4.5.7.3 TIMBERLANE PARK BUILDINGS
Timberlane Park contains a soccer pitch and practice area, a baseball pitch, a concession stand, washrooms and change rooms, auto sprinklers and a resident caretaker. This park relates to community sport activities.
INTER and INTRA-Class allocation is made 100% to Class 1―Residential.
4.5.8 WILLINGDON BEACH CAMPGROUND
Willingdon Beach Campground is a municipally owned Campsite located at 4845 Marine Ave and is adjacent to the Willingdon Beach Park and Playground. The campsite offers full and partial hook-ups, swimming, grassy tent areas, a fishing pier, free showers and access to Willingdon Beach Park. The Campsite is close to sani-station, 5 minutes from the Vancouver Island Ferry Terminal, a 10 minute walk to the Recreation Complex and is next
to downtown shops and restaurants.
The municipality designates a caretaker under its bylaws and is responsible for setting rates.

2008 Municipal Sustainability Report City of Powell River
FITZGERALD, STICKELMANN
112 | P a g e
4.5.8.1.1 WILLINGDON BEACH CAMPSITE GENERAL REVENUES
Willingdon Beach Campsite General Revenues includes all fees and charges to campsite users. Revenues are categorized as administration charges, showers, campsite fees, firewood sales, ice sales, sundries, cable TV and picnic area rentals.
INTER-Class allocation is based on a CONSULTANT'S ESTIMATE, 100% to Non-Residential. INTRA-Class allocation is made 100% to Class 6―Business and Other as Tourism activities are a Non-Residential activity. See Willingdon Beach – Transfers to Internal Funds for allocation of surplus funds.
4.5.8.1.2 WILLINGDON BEACH CAMPSITE GENERAL EXPENSE
Willingdon Beach Campsite General Expenses include direct wages and benefits of City Staff 52
INTER-Class allocation is based on a CONSULTANT'S ESTIMATE 100% to Non-Residential. INTRA-Class allocation is made 100% to Class 6―Business and Other, as the class
, caretaker fees, cabin expenses, utilities, advertising, and other administration expenditures. Included in this item are expenditures related to internal equipment.
53
4.5.8.1.3 WILLINGDON BEACH - TRANSFER TO INTERNAL FUNDS
that receives the benefit of additional tourism business.
This account transfers some of the surplus from the operation of the Willingdon Campsite to reserve funds.
Surpluses from Willingdon Beach operations are deemed to be a reduction in overall taxes paid by all tax payers. INTER and INTRA-Class allocation is viewed as a reduction in taxpayer support required for parks and recreation activity.
52 Includes Management and Janitorial. 53 Restaurants, shops and grocery stores, as well as gas stations.

2008 Municipal Sustainability Report City of Powell River
FITZGERALD, STICKELMANN
113 | P a g e
4.5.8.1.4 WILLINGDON BEACH CONCESSION
This concession is assumed to be part of the Willingdon Park and Playground, and is separate from the Willingdon Beach Campsite. The Concession is leased to an operator, and expenditures relate to interior and exterior building maintenance, internal equipment, materials and supplies.
INTER-Class allocation is made by CONSULTANT'S ESTIMATE, 95% to Residential and 5% to Non-Residential — as these facilities exist primarily for the use by local residents, with some nominal use by neighbouring campsite guests.
INTRA-Class allocation for Residential is made 100% to Class 1―Residential; Non-Residential is 100% to Class 6―Business and Other.
4.5.8.1.5 WILLINGDON BEACH CAMPSITE RESERVES
Willingdon Beach Reserves are funds set aside for future expenditures on the Willingdon Beach Campsite. Transfers to Reserve funds would normally be made based on the expected expenditure patterns. Transfers from Reserves would be based on the average of all contributions by class. In 2008, a transfer was made from Reserves.
Detailed information relating to the Willingdon Reserve Fund balance, at a class level, was not available at the time of this study, therefore total DIRECT WILLINGDON BEACH CAMPSITE EXPENDITURES were used as a proxy to determine this allocation.
4.5.8.1.6 WILLINGDON BEACH WASHROOMS
These washrooms are assumed to be part of the Willingdon Park and Playground and are separate from the Willingdon Beach Campsite.
INTER-Class allocation is made by CONSULTANT'S ESTIMATE, 95% to Residential and 5% to Non-Residential — as these facilities exist primarily for use by local residents, with some nominal use by neighbouring campsite guests.
INTRA-Class allocation for Residential is made 100% to Class 1―Residential; Non-Residential is allocated 100% to Class 6―Business and Other.

2008 Municipal Sustainability Report City of Powell River
FITZGERALD, STICKELMANN
114 | P a g e
5 ACTIVITY DRIVERS
Activity drivers54
The results from this report rely on thousands of varying apportionments, ratios, estimates and assumptions from a variety of analyses, statistics and data. As a result, a large variation in a single assumption, will have only limited impact on the final overall outcome or conclusion of this study.
provide different measures of an activity that either generate revenues or cause expenses to be incurred. For some budget items, a single budget driver may be sufficient, but more frequently budget revenues and expenditures have more than one driver attached. Wherever possible budget drivers are based on empirical information, but in some cases they must be based on common sense and logic. A driver is assigned separately to gross revenues and expenses, rather than net revenues and expenses — to avoid distortion where distribution patterns vary between revenues and expenses.
This report identifies the drivers that are normally available to municipalities — although our conclusions are by no means intended to represent an exhaustive list. It is fully expected that as consumption analyses become more commonplace, many new drivers will be created, added and improved upon.
Consumption is determined by applying budget drivers using two distinct procedures. The first is an INTER‐Class Allocation so as to determine the overall split between Residential and Non‐Residential properties (see Property Types for detailed information). The second part is an INTRA–Class Allocation, distributing the revenue or expenditure to the individual property classes within the two INTER‐Class pools.
The budget drivers relied upon in this report are discussed in the following sections and will be referenced in the individual analyses. Drivers are listed in alphabetical order, rather than in any order of importance or application.
This Municipal Sustainability Report is based on the City's Organizational Chart55
as at 2008, to which the 2008 budget relates.
54 See Definitions. 55 See City Data.

2008 Municipal Sustainability Report City of Powell River
FITZGERALD, STICKELMANN
115 | P a g e
5.1 CONSULTANT'S DEVELOPED DRIVERS
5.1.1 DISTRIBUTION OF TIME DRIVER
Distribution of Time56
Resident’s time is considered business oriented when travelling to or from work, or on personal business. Personal business includes, but is not limited to, shopping, medical/dental appointments and entertainment such as movies, restaurants or other activities considered to generate economic activity. Time spent on personal business is estimated at 15% of time spent at work for employed individuals. A CONSULTANT’S ESTIMATE for personal business was used for persons under 15, unemployed persons, persons not in the Labour Force and persons 75 years and older.
for example is used to allocate Police, Fire and Rescue expenditures considered to be for the protection of life. Labour data was obtained from the 2006 Census, particularly statistics on the Labour Force by Place of Work. In addition, the statistics reviewed in the development of the DISTRIBUTION OF TIME driver includes Labour Force by Industry and Labour Force by Occupation — for estimation of working days available. To account for persons living in the City of Powell River — and those who work in another census subdivision, plus those living in another census subdivision —adjustments were made to the work force statistics. Overall, the results led to only minor adjustments.
TABLE 83: DISTRIBUTION OF TIME - SUMMARY
56 See Appendix 8.7 ― Distribution of Time details for additional information on calculation.
Total Employed Work Force
Total Unemployed Work Force
Total Available Work Force
Not in Labour Force
Total Population for Business Time Calculation 2,065 5,741 415 6,156 5,056 1,405 14,683 Total Time Available (Hours per Year) 8,760 8,760 8,760 8,760 8,760 8,760 8,760 Total Person Hours Available Per Year 18,089,400 50,293,350 3,635,400 53,928,750 44,292,750 12,307,800 128,618,700 % of Total Time Available 14.1% 39.1% 2.8% 41.9% 34.4% 9.6% 100.0%
Total Assumed Working Hours - 8.00 2.80 - - - Assumed Travel/Commute (Time Note 1) - 0.20 0.15 - - - Assumed Personal Business 1.00 1.20 2.00 - 4.00 3.00 Business Hours per Day 1.00 9.40 4.95 9.07 4.00 3.00 Business Days per Year 250.00 235.20 250.00 236.53 250.00 250.00
Total Business Hours per Year 516,250 12,688,588 513,310 13,201,898 5,056,250 1,053,750 19,828,148 % of Total Hours 2.854% 25.229% 14.120% 24.480% 11.416% 8.562% 15.416%
Average Commute TimeTotal Time spent commuting 1,130 61 1,191 Average Commute Time 0.19 or 11.6 Minutes
Total Person Working Days 1,350,315.28 103,750.00 1,454,065 Average working days per year 236.19 Days per year
Notes
For unemployeed, commuting time seeking employment within the City, a factor of 75% has been applied based on a Consultant's Estimate.1. Assumed Commuting time based on Estimated Commuting Distance 14.2 km travelling at an average speed of 50 kph.
Less than 15 Years of Age
Greater than 15 Years of Age and Less than 75 Years of Age
Greater than 75 Years of Age
Total Population

2008 Municipal Sustainability Report City of Powell River
FITZGERALD, STICKELMANN
116 | P a g e
Census data lags this study; hence the authors believe that while absolute numbers may alter over time, the relative percentages will remain stable. Census data considered for this driver include:
a. Labour Force Activity refers to either employed, or unemployed persons during the week (Sunday to Saturday) prior to the Census Day (May 16, 2006).
b. Employed persons refer to persons 15 years and over, excluding institutional residents, who during the week (Sunday to Saturday) prior to Census Day (May 16, 2006):
i. did any work at all for pay or in self‐employment or without pay in a family farm business or professional practice;
ii. were absent from their job or business, with or without pay, for the entire week because of vacation, an illness, a labour dispute at their place of work, or any other reason.
Unemployed refers to persons 15 years and over, excluding institutional residents, who, during the week (Sunday to Saturday) prior to Census Day (May 16, 2006), were without paid work or with self‐employment work and were available for work either:
1. had actively looked for paid work in the past four weeks; 2. were on temporary lay-off and expected to return to their job; 3. were on temporary lay-off and expected to return to their job; 4. had definite arrangements to start a new job in four weeks or
less.
c. Not in the labour force refers to persons 1 year and over, excluding institutional residents, who, in the week (Sunday to Saturday) prior to Census Day (May 16, 2006), were neither employed nor unemployed. It includes students, homemakers, retired workers in an “off” season who were not looking for work, and persons who could not work because of a long‐term illness or disability.
d. Occupations refer to the kind of work persons were doing during the reference week, as determined by their kind of work and the description of the main activities in their job. If the person did not have a job during the week (Sunday to Saturday) prior to enumeration (May 16, 2006), the data relate to the job of longest duration since January 1, 2005. Persons with two (2) or more jobs were to report the information for the job at which they worked the most hours. Occupations are based on the National Occupational Classification for Statistics 2006 using 20% sample data.
e. Industry refers to the general nature of the business carried out in the establishment where the person worked. If the person did not have a job during

2008 Municipal Sustainability Report City of Powell River
FITZGERALD, STICKELMANN
117 | P a g e
the week (Sunday to Saturday) prior to enumeration (May 16, 2006), the data relate to the job of longest duration since January 1, 2005. Persons with two or more jobs were to report the information for the job at which they worked the most hours.
i. Experienced labour force refers to persons 15 years and over, excluding institutional residents who, during the week (Sunday to Saturday) prior to Census Day (May 16, 2006), were employed and the unemployed who had last worked for pay or in self‐employment in either 2005 or 2006.

2008 Municipal Sustainability Report City of Powell River
FITZGERALD, STICKELMANN
118 | P a g e
5.1.2 JOBS DRIVER
The JOBS driver is used for INTRA-Class allocation of revenues and expenditures amongst Non-Residential properties. Non-Residential properties tend to be less homogeneous in nature than Residential properties and their consumption of City Services is more accurately reflected by the jobs related to each property class. National Occupational Classification Statistics are not available for Powell River; however, information is available for the Powell River Agglomeration.
The JOBS driver is used for estimating the proportion of jobs related to each class of property as defined in the Assessment Act. Data for the JOBS DRIVER is based on Statistics Canada analysis57 of Occupations by Industry58
Based on analysis of the data, the following is a summary of the allocation of jobs to all property classes. Certain Jobs have been excluded from the allocation as they relate to properties that would not pay property taxes, e.g. municipal properties, hospitals, schools. In addition, certain jobs have been assigned to "Residential" based on the occupation definitions.
TABLE 84: TOTAL JOBS BY PROPERTY CLASSIFICATION
57 Occupation - National Occupational Classification for Statistics 2006 (720C), Sex (3) and Selected Demographic, Cultural, Labour Force, Educational and Income Characteristics (273) for the Population 15 Years and Over of Canada, Provinces, Territories, Census Metropolitan Areas and Census Agglomerations, 2006 Census - 20% Sample Data. 58 Based on North American Industry Classification System 2002.
Classification (Note 1)
2008Jobs % of Total
Residential Residential 300 4.047%Utilities Non-Residential 35 0.472%Supportive Housing Residential - 0.000%Major Industry Non-Residential 1,035 13.964%Light Industry Non-Residential 230 3.103%Business / Other Non-Residential 4,328 58.392%Managed Forest Non-Residential 170 2.294%Recreation / NonProfit Residential 120 1.619%Farm Residential 122 1.646%Unallocated Public Sector 1,072 14.463%Total Jobs Driver 7,412 100.000%
Property Class

2008 Municipal Sustainability Report City of Powell River
FITZGERALD, STICKELMANN
119 | P a g e
As mentioned earlier, the JOBS DRIVER is used for INTRA-Class allocation of revenues and expenditures amongst Non-Residential properties. By including only jobs, defined as "Non-Residential", the following allocations may be used:
TABLE 85: ALL NON-RESIDENTIAL JOBS
TABLE 86: NON-RESIDENTIAL JOBS (EXCLUDING UTILITIES AND MANAGED FOREST)
TABLE 87: NON-RESIDENTIAL JOBS (EXC. CLASS 2, 4 AND 7)
2008Jobs % of Total
Utilities 35 0.604%Major Industry 1,035 17.851%Light Industry 230 3.967%Business / Other 4,328 74.646%Managed Forest 170 2.932%Total Non-Residential Properties 5,798 100.000%
Non-Residential Properties
2008Jobs % of Total
Major Industry 1,035 18.505%Light Industry 230 4.112%Business / Other 4,328 77.383%Total Non-Residential Properties 5,593 100.000%
Non-Residential Properties
2008Jobs % of Total
Light Industry 230 5.046%Business / Other 4,328 94.954%Total Non-Residential Properties 4,558 100.000%
Non-Residential Properties

2008 Municipal Sustainability Report City of Powell River
FITZGERALD, STICKELMANN
120 | P a g e
5.1.3 COMMUTING FLOW DRIVER
COMMUTING FLOW DRIVER is used as a check on the reasonableness of the DISTRBUTION OF TIME estimate — for the net difference between those who live in the City and work in another Census Subdivision, and those who live in a different Census Subdivision and work in the City. Based on commuting flows, the City of Powell River has an indicated 7,385 jobs in total within the City boundary, based on "a usual place of work". Overall, the City of Powell River has a higher proportion of workers with a "usual place of work" inside the City — than those who commute to the City from outside its boundaries.
TABLE 88: POWELL RIVER COMMUTING FLOWS
Data in the above table shows:
• commuting flows between census subdivisions for employed persons having a usual place of work;
• the geography dimension; • identifies place of residence, followed by place of work; and • identifies place of work, followed by place of residence.
Summary of Commuting Flows
Total Estimated Jobs in Powell River 4,080
Place of Residence and Place of Work in Powell River 3,725 91.3%
Place of Residence in another Municipality 355 8.7%
Place of Work in another Municipality 1,055
Net Commuters Into District (700)

2008 Municipal Sustainability Report City of Powell River
FITZGERALD, STICKELMANN
121 | P a g e
5.1.3.1 COMMUTING FLOW DETAILS
The following tables are derived from data obtained from Statistics Canada using Commuting Flow Census Subdivisions: Sex (3) for the Employed Labour Force 15 Years and Over Having a Usual Place of Work of Census Subdivisions, Flows Greater than or Equal to 20, 2006 Census - 20% Sample Data.
TABLE 89: PLACE OF RESIDENCE WITHIN POWELL RIVER
TABLE 90: PLACE OF WORK WITHIN POWELL RIVER
Place of Residence Place of Work Total% of
TotalPowell River (CY) Powell River (CY) 3,725 91.3%
Powell River (CY) Powell River C (RDA) 120 2.9%
Powell River (CY) Powell River B (RDA) 100 2.5%
Powell River (CY) Powell River A (RDA) 45 1.1%
Powell River (CY) Powell River D (RDA) 30 0.7%
Powell River (CY) Toronto (C) 20 0.5%
Powell River (CY) Victoria (CY) 20 0.5%
Powell River (CY) North Vancouver (DM) 20 0.5%
Total 4,080 100.0%
Place of Residence Place of Work Total% of
TotalPowell River (CY) Powell River (CY) 3,725 77.9%
Powell River C (RDA) Powell River (CY) 470 9.8%
Powell River B (RDA) Powell River (CY) 405 8.5%
Powell River A (RDA) Powell River (CY) 140 2.9%
Powell River D (RDA) Powell River (CY) 40 0.8%
4,780 100.0%

2008 Municipal Sustainability Report City of Powell River
FITZGERALD, STICKELMANN
122 | P a g e
5.1.4 COMMUTING DISTANCE DRIVER
COMMUTING DISTANCE59
5.1.4.1 POWELL RIVER CENSUS AGGLOMERATION COMMUTING DISTANCES
is estimated so as to determine the reasonableness of the proportion of commuting distance to and from work. In determining consumption, travel time to and from work is treated as Non-Residential time. The table below is a summary of data provided by Statistics Canada on commuting distances. COMMUTING DISTANCE is also used in the determination of the DISTRIBUTION OF TIME driver. COMMUTING DISTANCE is also used in the calculation of ROAD USE.
TABLE 91: WEIGHTED AVERAGE STRAIGHT-LINE COMMUTING DISTANCE
Data in the above table assumes:
1. Distance is defined as a "straight-line", measured in kilometres, between the Census respondent's residence and his or her usual place of work.
2. Data is not available for the City of Powell River.
59 Source: http://www12.statcan.ca/english/census06/data/topics/RetrieveProductTable.cfm?ALEVEL=3&APATH=3&CATNO=&DETAIL=0&DIM=&DS=99&FL=0&FREE=0&GAL=0&GC=99&GID=838074&GK=NA&GRP=1&IPS=&METH=0&ORDER=1&PID=90655&PTYPE=88971&RL=0&S=1&SUB=0&ShowAll=No&StartRow=1&Temporal=2006&Theme=76&VID=0&VNAMEE=&VNAMEF=
A B C D (B x C)
Census Groupings
Assumed Commuting
DistanceTotal - Age
groups
Total - Age groups X Assumed
Commuting Distance
Less than 5 km 2.5 3,500 8,750
5 to 9.9 km 7.5 905 6,788
10 to 14.9 km 12.5 465 5,813
15 to 19.9 km 17.5 140 2,450
20 to 24.9 km 22.5 40 900
25 to 29.9 km 27.5 20 550
30 km or more 40.0 325 13,000
Total Kilometres 5,395 38,250
Total Commuters 5,400
Weighted Average Kilometers 7.08

2008 Municipal Sustainability Report City of Powell River
FITZGERALD, STICKELMANN
123 | P a g e
5.1.5 COMMUTING BY ROAD TYPE DRIVER
COMMUTING BY ROAD TYPE is a Consultant's Estimate of the use of road by type, based on commuting distances — assuming roads are travelled in proportion to their overall lengths. This driver is not used directly in any allocations, but is used in calculating the ROADS USE driver.
TABLE 92: COMMUTING BY ROAD TYPE
Length of Roads (kms) (Note 1) 13 - 11 95 - 119 % of Total Roads 10.5% 0.0% 9.5% 80.0% 0.0% 89.5%
Assumed Commuting kms per Road Type 889,612 - 800,651 6,743,257 - 8,433,520 Average Daily Km per Commuter 0.6 - 0.6 4.6 - 5.8
Assumed Vehicles (Note 2)% of Total Workforce Excluded Trips Vehicles
Car, Truck, Van as Driver 79.3% 4,882 Car, Truck, Van as Passenger 8.3% 511 Transit (Estimate of 17 Passengers per Bus)(Note 4) 1.5% 92 Walked or Cycled 9.4% 579 Other Modes of Transportation 1.5% 92 Total Vehicles Assumed 100.0% 1,182 4,974
Total Employed Workforce (See Distribution of Time Driver) 6,156
Estimated Average Total Daily Commuting Distance (Note 3) 11.6 Estimated One-Way Trip 5.8
Average Working Days per Year (See Distribution of Time-Summary) 236.2
Total Workforce Daily Kilometers 35,706 Total Annual Workforce Kilometers 8,433,520
Notes
1. See Workforce Commuting Driver. Highways are assumed to be maintained by the Provincial Government.2. Based on District Modes of Transportation Driver.3. Communting distance based on average speed of 50 km per Hour at the average Commute Time of 11.6 minutes. (See Distribution of Time Driver).4. See Modes of Transportation Driver.4. Assumed by Consultants based on limited routes and availability of transit options.
Municipal Roads
Highway Arterial Collector Local Roads
Total Transportation
NetworkProvincial Highways

2008 Municipal Sustainability Report City of Powell River
FITZGERALD, STICKELMANN
124 | P a g e
5.1.6 HUMAN RESOURCES DRIVER
The HUMAN RESOURCES driver is used to allocate expenses of the Human Resources Department based on the number of employees by APM.
TABLE 93: HUMAN RESOURCES
General Government Security
Planning & Development Engineering
Parks, Recreation &
Culture
1 2 3 4 5
Allocation based on FTEs by APMTotal Assigned FTE's 29.5 20.0 5.0 47.0 47.5 149.00
% of Total Employees 19.8% 13.4% 3.4% 31.5% 31.9%
Human Resource Costs (Allocated to APM based on % of Total Employees) 71,649$ 48,576$ 12,144$ 114,153$ 115,367$ 361,888$
Total Expenditures by APMResidential (Category 1) -$ 3,404,016$ -$ 1,099,817$ 2,525,396$ 7,029,229$
Residential (Category 2) - - 2,002 902,216 129,990$ 1,034,208
Total Residential - 3,404,016 2,002 2,002,033 2,655,386 8,063,437
Non-Residential (Category 1) - 725,617 335,427 870,461 388,106 2,319,611
Non-Residential (Category 2) - - 523,388 619,348 6,847 1,149,583
Total Non-Residential - 725,617 858,815 1,489,809 394,953 3,469,194
Total Expenditures -$ 4,129,633$ 860,817$ 3,491,842$ 3,050,339$ 11,532,631$
% of Total ExpendituresResidential 0.000% 82.429% 0.233% 57.335% 87.052% 69.918%
Non-Residential 0.000% 17.571% 99.767% 42.665% 12.948% 30.082%
Human Resource AllocationResidential -$ 40,041$ 28$ 65,450$ 100,429$ 253,025$
Non-Residential - 8,535 12,116 48,703 14,938 108,863
Total -$ 48,576$ 12,144$ 114,153$ 115,367$ 361,888$
Total Employees

2008 Municipal Sustainability Report City of Powell River
FITZGERALD, STICKELMANN
125 | P a g e
5.1.7 PROTECTIVE SERVICES DRIVER
The PROTECTIVE SERVICES driver is used to allocate Police and Fire services. Detailed information on the nature of various protective services was not available to the authors at the time of compilation of this report. An estimate of 70% for protection of life and 30% for the protection of property was taken from other similar reports (KPMG, March 17, 1995) and (MMK Consulting, January 2007). The DISTRIBUTION OF TIME driver is used to allocate expenditures related to the protection of life. The value of ASSESSMENT IMPROVEMENTS is used in the allocation of the protection of property.
TABLE 94: PROTECTIVE SERVICES
Protective Service Revenues Expenses NetFire (11,201) 1,914,397 1,903,196 Police (298,500) 2,170,314 1,871,814 Total (309,701) 4,084,711 3,775,010
Allocation of Expenses (Note 1)Protection of Life 70%Protection of Property 30%
ExpensesProtection of
LifeProtection of
Property NetFire 1,340,078 574,319 1,914,397 Police 1,519,220 651,094 2,170,314 Total 2,859,298 1,225,413 4,084,711
Protective Services Driver Residential Non-Residential TotalProtection of Life Distribution of Time ($) 2,418,502 440,796 2,859,298
% of Total 84.584% 15.416%Protection of Property Value of Improvements ($) 948,470 276,943 1,225,413
% of Total 77.400% 22.600%Total Value of Allocated Services 3,366,972 717,739 4,084,711
% of Total 82.429% 17.571%
Notes1. City of Vancouver, Study of Consumption of Tax Supported City Services, Volume 2 -- Appendices, Appendix K - Fire -- Fund 60 Agency 23, Page K2 & K3, KPMG.

2008 Municipal Sustainability Report City of Powell River
FITZGERALD, STICKELMANN
126 | P a g e
5.1.8 ROAD USE DRIVER
ROAD USE is an activity driver used for the measurement and allocation of City streets. This driver would typically take into account the greater extent of wear and tear for higher usage as well as the impacts of both smaller and larger vehicles. Data was not available from City records to allow development of a driver based on wear and tear. The ROAD USE driver was developed by the authors to measure the extent of use of City Streets.
Information on actual vehicle mileage was not available for Powell River. INTER-Class allocation of the ROAD USE driver takes into account personal vehicle mileage (cars and trucks), transit mileage and truck mileage (commercial vehicles).
TABLE 95: ROAD USE
INTRA-Class allocations are based on OCCURRENCES within the Residential property classes —as roads are deemed to benefit all properties, equally—and JOBS for Non-Residential properties as an indicator of activity on municipal roads.
Residential (Personal)
Use Km
Non-Residential
Use Km Total Km
Residential Use 21,059,760 18,849,760 39,909,520 Transit 75,642 69,750 145,392 Trucks 5,986,428 5,986,428
Total Km 21,135,402 24,905,939 46,041,341
Road Usage Driver 45.9% 54.1%

2008 Municipal Sustainability Report City of Powell River
FITZGERALD, STICKELMANN
127 | P a g e
5.1.8.1 ESTIMATED NUMBER OF PERSONAL VEHICLES
To determine the ROAD USE driver, an estimate of the number of vehicles in the municipality was required. An actual vehicle count was not available, therefore an estimate was developed based on 2006 Census data. Information on vehicle ownership statistics were not available, hence the authors have used60
92% of households owning at least 1 vehicle, and 60% having two or more vehicles.
TABLE 96: ESTIMATE OF VEHICLES
60 The author's have assumed ownership characteristics to be similar to that found in Campbell River (See Campbell River Transit Service Strategy, P. 24)
Estimate of Vehicles
Number ofVehicles
5,680
92% 5,226 60% 3,408
8,634
1.5
Notes:
2. Data not available for Powell River. Assumed same percentages as Draft Campbell River Transit Service Strategy (June 2002) (P.24).
Households with at least 1 Vehicle (Note 2)Households with 2 or more Vehicles (Note 2)
Estimated number of Vehicles
Total Private Dwellings (2006 Census), Occupied Private Dwelling Characteristics, Occupied by usual residents (Note 1)(Assumed to be equal to number of Households)
Estimated Vehicles per Household
1. Occupied Private Dwellings refers to private dwellings in which a person or group of persons are permanently residing (Including residents who are temporarily absent on Census Day).

2008 Municipal Sustainability Report City of Powell River
FITZGERALD, STICKELMANN
128 | P a g e
5.1.8.2 ESTIMATED PERSONAL VEHICLE MILEAGE
Determination of personal vehicle mileage within the City is based on the total number of vehicles estimated in 5.1.8.1, plus Modes of Transportation61
used to commute to and from work — assuming an average of 5,300 annual kilometres are driven within the City.
TABLE 97: ESTIMATED VEHICLE COMMUTING MILEAGE
TABLE 98: ESTIMATED OTHER BUSINESS TRIPS
61 Statistics Canada - http://www12.statcan.ca.
Vehicle Mileage (Within City Boundaries)Estimated
Annual Km
Estimated Km for
Business Travel
Estimated Personal
Kms Estimated Total Number of Vehicles 8,634
4,882 6,100 3,400 2,700
Average Daily 11.6
Percentage of Total 55.7%
Vehicles used for Commuting 4,882 6,100 56.5%
2,800
600
3,752
Other Business Trips (See Below)
Estimated Number of Vehicles NOT used for Commuting to/from Work
Estimated Number of Vehicles used for Commuting to/from Work
Travel to/from work (6,156 Km per day X 236.2 Working Days / Year)
Other Business Trips Medical Dental Shopping /
Other Total
5,680 5,680 590,720 602,080
454 454 47,258 48,166
25% 25% 25%
803 803 83,508 85,114
Number of Other Business Trips 4,423 4,423 459,955 468,800
Estimated Km per Trip 10 10 10 44,226 44,226 4,599,545 4,687,998
600
Estimated Total Km Traveled Per Year
Average Per Vehicle per Year
Number of Other Business Vehicle Round Trips / Year (Note 1)
Less:
Trips Assumed by Transit (Note 2)
Percentage of Commuter Trips Combined with Other Business (Consultant Estimate)
Estimated Vehicle Trips Combined with Commute) (Note 3)

2008 Municipal Sustainability Report City of Powell River
FITZGERALD, STICKELMANN
129 | P a g e
5.1.8.3 ESTIMATED TRANSIT MILEAGE
Using Bus Schedule Information62 found on the Powell River Transit website, total transit mileage was estimated for the City of Powell River. Transit trips were estimated for the three routes63 that service the City (Excluding Rural Routes) and we have used 30% of weekday use as relating to personal use. Mileage for Residential use is estimated to be 52.0% and Non-Residential64
Transit has not been adjusted for any wear factors. Although the authors recognize that transit vehicles have a greater impact on road surfaces than personal vehicles, it is not expected to change the overall allocation significantly.
mileage is estimated to be 48.0%.
Handy-Dart services were not factored into the Transit calculation, as insufficient data was available and wear factors are expected to be similar to personal vehicles.
TABLE 99: TRANSIT USE
62 http://www.busonline.ca/regions/pta/ 63 Includes Townsite / Wildwood (Estimated Round Trip 20 km), Grief Point (Estimated Round Trip (11 km) and Upper Westview (Estimated Round Trip 9 km). 64 e.g. including personal business such as shopping, dining out, medical/dental appointments
Transit Week Days Evenings Saturday Sunday & Holidays Total % of Total
1,398 580 427 391 2,796
1,398 580 427 391 2,796 52 52 52 52 72,696 30,160 22,204 20,332 145,392
- - - - 72,696 30,160 22,204 20,332 145,392
Personal Use 30% 85% 40% 95% 21,809 25,636 8,882 19,315 75,642 52.0% 50,887 4,524 13,322 1,017 69,750 48.0%
Assumptions
Estimated kms per week
1. Total Transit Loops based on 20 km for Wildwood, 11 km for Grief Point and 9 km for Upper Westview.
Estimated kms per week
Estimated Non-Residential Use
Number of Weeks per Year
Less: HolidaysTotal Potential Estimated Transit km
Total Estimated Transit km
Estimated Residential Use

2008 Municipal Sustainability Report City of Powell River
FITZGERALD, STICKELMANN
130 | P a g e
5.1.8.4 TRUCK MILEAGE
Information related specifically to truck traffic was not available and estimates are used. Truck trips are estimated as a percentage of personal trips based on an average trip length of 5.6 kilometres. Truck mileage has been estimated at 15% to account for additional wear caused by trucks.
TABLE 100: TRUCK MILEAGE
Truck / Commercial Traffic
39,909,520
15% Est
5,986,428
Total Arterial Routes (in kms)
11.3 km
532,127
5.6
1,064,254
2,916
Estimated Total Truck km
Total Personal Vehicle (kms)
Total Km's Driven by Trucks as a % of Personal Vehicles (Estimate)
Road Truck kms per Arterial km
Average Truck Trip (Assumed 50% of Total Arterial Routes)
Total Estimated Truck Trips per Year
Estimated number of Truck Trips per Day (365 Days per Year)

2008 Municipal Sustainability Report City of Powell River
FITZGERALD, STICKELMANN
131 | P a g e
5.2 CITY DATA DRIVERS
5.2.1 BUILDING INSPECTION
Information on Building Inspections was limited to the number of inspections by year. Data was insufficient to develop the BUILDING INSPECTION driver.
TABLE 101: BUILDING INSPECTIONS
The Building Inspection process is deemed a Non-Residential activity as it is seen as an integral component of the construction activity in the City. While some activity may relate to do–it–yourself construction, this activity still generates business activity in the home–improvement retail industry.
Inspections2008 1,343 2007 1,270 2006 1,713 2005 1,428
Total 5,754 Average 1,439

2008 Municipal Sustainability Report City of Powell River
FITZGERALD, STICKELMANN
132 | P a g e
5.2.2 BUILDING PERMITS
Information on Building Permits and Inspections is maintained by the City; however, information was not sufficiently detailed to develop an accurate driver.
From the information available on Building Permit statistics, 15% of the total Building Permits issued in 2008 related to Commercial / Industrial properties, while 85% related to Residential properties. When looking at construction value in 2008, Commercial / Industrial accounted for 36% of the construction value while residential accounted for 64%. However, when looking at a longer trend, using the 4 year average from 2005 to 2008, Commercial / Industrial Permits made up 17% of total Building permits issued and 56% of the total construction value, while Residential made up 83% of the total permits issued but only accounted for 44% of the Construction value.
TABLE 102: PERMITS ISSUED
TABLE 103: PERMITS AS A PERCENTAGE OF TOTALS
As with Building Inspections, Building Permits are deemed to be a Non-Residential activity for consumption analysis purposes as they are seen as an integral component of the construction activity in the City. While some activity may relate to do–it–yourself construction, this activity still generates business activity in the home–improvement retail industry.
Commercial / Industrial
PermitsConstruction
ValueAverage
Permit Value
Residential / Mobile Home
PermitsConstruction
ValueAverage
Permit Value2008 23 6,393,500 277,978 131 11,390,091 86,947 2007 34 4,998,646 147,019 130 9,274,249 71,340 2006 27 8,740,360 323,717 162 91,129 563 2005 34 17,608,534 517,898 151 8,693,807 57,575
Total 118 37,741,040 319,839 574 29,449,276 51,305 Average 30 9,435,260 144 7,362,319
Commercial / Industrial
Construction Value
Residential / Mobile Home
Construction Value
2008 15% 36% 85% 64%2007 21% 35% 79% 65%2006 14% 99% 86% 1%2005 18% 67% 82% 33%
Total 17% 56% 83% 44%Average 17% 56% 83% 44%

2008 Municipal Sustainability Report City of Powell River
FITZGERALD, STICKELMANN
133 | P a g e
5.2.3 NUMBER OF EMPLOYEES
Based on the most recent Organizational Chart provided by the City, the following is a summary of employees categorized by each Administrative Performance Measure. To determine the number of Full-Time Equivalent Employees, the following multipliers were used by the authors:
TABLE 104: FULL TIME EQUIVALENT EMPLOYEES BY APM
APM Employees % of Total
General Government 28 18.7%Security 37.5 25.1%Planning & Development 4 2.7%Engineering 45 30.1%Parks, Recreation & Culture 35 23.4%
149.5

2008 Municipal Sustainability Report City of Powell River
FITZGERALD, STICKELMANN
134 | P a g e
5.2.4 ROAD NETWORK DESCRIPTION
The OCP establishes a road network plan based on arterial, collector, and local or limited local roads, each with specific functional criteria, as designated on Map 4: Transportation Plan attached to the OCP document. These designations correspond with the engineering design specifications in City subdivision and development servicing bylaw(s). There is also an Advanced Street Plan that is not adopted as part of this OCP but is consulted in the course of subdivision and development application review.
Provincial Highway 101 traverses Powell River for a distance of 13.5 km, maintained by the Ministry of Transportation (MOT). Highway 101 consists of Thunder Bay Road, Marine Avenue, Arbutus Avenue and Lund Street within the City, and serves as a key link between Wildwood, the Townsite, and Westview. Regionally, it connects the ferry terminal at Saltery Bay to the unincorporated community of Lund for a total distance of 55 km. It is classified as a “controlled access highway” in the Regional District and is in the process of being similarly designated within the City, anticipated to be complete by 2006.
The City presently maintains approximately 106 km of paved roads, seven km of unpaved roads and lanes. Joyce Avenue is the main north-south municipal arterial in Westview. It is often the preferred route for City truck traffic due to the proximity of the commercial and light industrial centre.
The hierarchy of streets as shown on Map 4 is based on the following:
Arterial Roads/Highway 101 are major roads designed to accommodate inter-regional traffic as well as major intercommunity travel. Arterial roads should be planned for an ultimate potential of four traffic lanes. Access to abutting residential properties shall be discouraged and limited. Where major residential subdivisions abut arterial roads, lanes and reverse frontages or other means, shall be provided for lot access. Minimum right-of-way width shall be 25 meters.
Collector Roads are designed as secondary inter-community routes, to collect and carry local traffic to the arterial road system, to distribute traffic to local roads and to provide access to abutting properties. Minimum right-of-way width shall be 20 metres.
Local and Limited Roads include all other City roads designed to discourage major thru-traffic and provide access to fronting properties. Minimum right-of-way width shall be 20 metres for local and 17 metres for limited local roads such as cul-de-sacs.

2008 Municipal Sustainability Report City of Powell River
FITZGERALD, STICKELMANN
135 | P a g e
Trails, Greenways and Bike Paths are shown on OCP Map 3: Trails and Bike Paths65
5.2.5 TRANSIT
; importantly, most of these are upon and across private land, primarily owned by Catalyst Paper and Island Timberlands.
To determine the number of kilometres driven by Transit buses, the following analysis is used:
TABLE 105: ESTIMATE OF TRANSIT KILOMETRES
65 Referenced but not included in this report.
1,398 580 427 391 2,796
Holidays - - - - - -
1,398 580 427 391 2,796 52 52 52 52 72,696 30,160 22,204 20,332 145,392
- - - - 72,696 30,160 22,204 20,332 145,392
Personal Use 30% 85% 40% 95% 21,809 25,636 8,882 19,315 75,642 52.0% 50,887 4,524 13,322 1,017 69,750 48.0%
Assumptions
Estimated kms per week
1. Total Transit Loops based on 20 km for Wildwood, 11 km for Grief Point and 9 km for Upper Westview.
Daily km Forgone
Estimated kms per week
Estimated Non-Residential Use
Number of Weeks per Year
Less: HolidaysTotal Potential Estimated Transit km
Total Estimated Transit km
Estimated Residential Use

2008 Municipal Sustainability Report City of Powell River
FITZGERALD, STICKELMANN
136 | P a g e
5.3 PROVINCIAL DATA DRIVERS
Assessment data provides several statistics useful in the INTRA–Class allocation of revenues and expenditures to the nine individual classes of property defined in the Assessment Act.
5.3.1 ASSESSMENT OCCURRENCES
Assessment Occurrences are statistics produced by BC Assessment and provide information on the number of times a property class occurs on the assessment roll. OCCURENCES are used as a proxy for the number of tax accounts, even though each property assessment may contain more than one property class.
TABLE 106: ASSESSMENT OCCURRENCES
Classification(Note 1/Note 2)
2008Occurences
(Note 3) % of TotalResidential (Class 01) 5,620 90.675%
Vacant Non-Residential 349 6.210%
Single Family Residential 4,831 85.961%
ALR Residential 7 0.125%
Farm Residential 8 0.142%
Other Residential 131 2.331%
Strata Residential 294 5.231%Utilities (Class 02) Non-Residential 22 0.355%
Supportive Housing (Class 03) Residential - 0.000%
Major Industry (Class 04) Non-Residential 2 0.032%
Light Industry (Class 05) Non-Residential 20 0.323%
Business / Other (Class 06) Non-Residential 443 7.147%
Managed Forest (Class 07) Non-Residential 2 0.032%
Recreation / NonProfit (Class 08) Residential 71 1.146%
Farm (Class 09) Residential 18 0.290%
Total Occurences Driver ` 6,198 100.000%
Total Occurences % of Total
Residential (Note 1) 5,709 92.110%
Non-Residential (Note 2) 489 7.890%
Total Property Classifications 6,198 100.000%
Notes
2. Non-Residential Occurences include Utilities, Major Industry, Light Industry, Business / Other, Managed Forest and Vacant Residential Land (See Note 1).
1. Residential Occurences include Single Family, ALR, Farm, Other and Strata as classified by BC Assessment. Residential Vacant is included as Non-Residential Property to reflect its development potential as yet unrealized.
3. Data provided by BC Assessment. Vacant Land treated as Class 06―Business and Other.
Property Class
Property Classifications

2008 Municipal Sustainability Report City of Powell River
FITZGERALD, STICKELMANN
137 | P a g e
5.3.2 TOTAL ASSESSMENT VALUES (2008)
TOTAL ASSESSMENT VALUES are produced by BC Assessment and are a compilation of Land and Improvements. TOTAL ASSESSMENT VALUES are used primarily for INTRA–Class Allocations within the property group66
TABLE 107: TOTAL ASSESSMENT VALUES
66 Residential or Non-Residential
Classification (Note 1)
Total Assessment
Values % of Total
Residential 1,299,921,100 83.976%Vacant Non-Residential 42,141,000 2.722%Single Family Residential 1,165,384,200 75.285%ALR Residential 1,401,500 0.091%Farm Residential 47,500 0.003%Other Residential 42,228,000 2.728%Strata Residential 48,718,900 3.147%
Utilities Non-Residential 991,100 0.064%S.353 LGA Non-Residential 9,745,000 0.630%
Supportive Housing Residential - 0.000%Major Industry Non-Residential 113,185,000 7.312%Light Industry Non-Residential 4,581,000 0.296%Business / Other Non-Residential 117,153,550 7.568%Managed Forest Non-Residential 37,900 0.002%Recreation / NonProfit Residential 2,059,500 0.133%Farm Residential 286,529 0.019%
Total Total Assessment Values 1,547,960,679 100.000%
Total Assessment
Values % of TotalResidential 1,260,126,129 81.406%Non-Residential 287,834,550 18.594%Total Summary of Property Classifications 1,547,960,679 100.000%
Total Assessment
Values % of TotalResidential (Excluding Vacant Land) 1,257,780,100 99.814%Supportive Housing - 0.000%Recreation / NonProfit 2,059,500 0.163%Farm 286,529 0.023%Total Residential Properties 1,260,126,129 100.000%
Total Assessment
Values % of TotalUtilities 10,736,100 3.730%Major Industry 113,185,000 39.323%Light Industry 4,581,000 1.592%Business / Other (Including Vacant Land) 159,294,550 55.342%Managed Forest 37,900 0.013%Total Non-Residential Properties 287,834,550 100.000%
Total 1,547,960,679
Notes
by BC Assessment. Residential Vacant is included as Non-Residential Property to reflect its development potential as yet unrealized and included and included in Class 06―Business and Other).2. Data provided by BC Assessment (July 2008). Data may be different than Provincial Statistics.
municipality on specified specified improvements (other than buildings)3. Utility Improvements exempt under s.353 of the Local Government Act. (1% of Gross Revenues earnd wi
1. Residential Occurences include Single Family, ALR, Farm, Other and Strata as classified
Property Class
Summary of Property Classifications
Residential Properties
Non-Residential Properties

2008 Municipal Sustainability Report City of Powell River
FITZGERALD, STICKELMANN
138 | P a g e
5.3.3 ASSESSMENT LAND VALUES (2008)
ASSESSMENT LAND VALUES are produced by BC Assessment and provide information on the market value of Land, distinct from the value of Improvements. Land Values are used as a proxy for area of land.
TABLE 108: ASSESSMENT LAND VALUES
Classification(Note 1)
2008 Gross Land Value % of Total
Residential 603,386,500 93.307%Vacant Non-Residential 42,141,000 6.517%Single Family Residential 520,300,500 80.458%ALR Residential 1,401,500 0.217%Farm Residential - 0.000%Other Residential 13,822,900 2.138%Strata Residential 25,720,600 3.977%
Utilities Non-Residential 368,000 0.057%S.353 LGA Non-Residential - 0.000%
Supportive Housing Residential - 0.000%Major Industry Non-Residential 4,570,000 0.707%Light Industry Non-Residential 4,137,600 0.640%Business / Other Non-Residential 32,882,791 5.085%Managed Forest Non-Residential 37,900 0.006%Recreation / NonProfit Residential 994,500 0.154%Farm Residential 286,529 0.044%
Total Gross Land Assessment Values 646,663,820 100.000%
2008 Gross Land Value % of Total
Residential 562,526,529 86.989%Non-Residential 84,137,291 13.011%Total Summary of Property Classifications 646,663,820 100.000%
2008 Gross Land Value % of Total
Residential (Excluding Vacant Land) 561,245,500 99.772%Supportive Housing - 0.000%Recreation / NonProfit 994,500 0.177%Farm 286,529 0.051%Total Residential Properties 562,526,529 100.000%
2008 Gross Land Value % of Total
Utilities 368,000 0.437%Major Industry 4,570,000 5.432%Light Industry 4,137,600 4.918%Business / Other (Including Vacant Land) 75,023,791 89.168%Managed Forest 37,900 0.045%Total Non-Residential Properties 84,137,291 100.000%
Notes
Assessment. Residential Vacant is included as Non-Residential Property to reflect its development potential as yet unrealized and included in Class 6 (Business / Other).2. Data provided by BC Assessment (July 2008). Values may differ from Provincial Statistics.
1. Residential Occurences include Single Family, ALR, Farm, Other and Strata as classified by BC
Property Class
Summary of Property Classifications
Residential Properties
Non-Residential Properties

2008 Municipal Sustainability Report City of Powell River
FITZGERALD, STICKELMANN
139 | P a g e
5.3.4 ASSESSMENT IMPROVEMENT VALUES (2008)
ASSESSMENT IMPROVEMENT VALUES are produced by BC Assessment and provide information on the value of Improvements only, as distinct from Land Values. This driver is used for the allocation of costs and revenues relative to the protection of property.
TABLE 109: ASSESSMENT IMPROVEMENT VALUES
Classification (Note 1)
2008 Gross Improvement
Value % of TotalResidential 696,534,600 77.282%
Vacant Non-Residential - 0.000%Single Family Residential 645,083,700 71.573%ALR Residential - 0.000%Farm Residential 47,500 0.005%Other Residential 28,405,100 3.152%Strata Residential 22,998,300 2.552%
Utilities Non-Residential 623,100 0.069%S.353 LGA (Note 2) Non-Residential 9,745,000 1.081%
Supportive Housing Residential - 0.000%Major Industry Non-Residential 108,615,000 12.051%Light Industry Non-Residential 443,400 0.049%Business / Other Non-Residential 84,270,759 9.350%Managed Forest Non-Residential - 0.000%Recreation / NonProfit Residential 1,065,000 0.118%Farm Residential - 0.000%
Total Gross Improvement Values 901,296,859 100.000%
2008 Gross Improvement
Value % of TotalResidential 697,599,600 77.400%Non-Residential 203,697,259 22.600%Total City Employees 901,296,859 100.000%
2008 Gross Improvement
Value % of TotalResidential 696,534,600 99.847%Supportive Housing - 0.000%Recreation / NonProfit 1,065,000 0.153%Farm - 0.000%Total Residential Properties 697,599,600 100.000%
2008 Gross Improvement
Value % of TotalUtilities (Including Exempt Under LGA s.353) 10,368,100 5.090%Major Industry 108,615,000 53.321%Light Industry 443,400 0.218%Business / Other 84,270,759 41.371%Managed Forest - 0.000%Total Non-Residential Properties 203,697,259 100.000%
Notes
classified by BC Assessment.2. Data provided by BC Assessment (July 2008). Data may be different than Provincial Statistics.
earnd within the municipality on specified specified improvements (other than buildings)
1. Residential Occurences include Single Family, ALR, Farm, Other and Strata as
3. Utility Improvements exempt under s.353 of the Local Government Act. (1% of Gross Revenues
Property Class
Summary of Property Classifications
Residential Properties
Non-Residential Properties

2008 Municipal Sustainability Report City of Powell River
FITZGERALD, STICKELMANN
140 | P a g e
5.3.5 TAXES PAID (2008)
TAXES PAID (2008)67
reflect actual contributions made by each Property Class for the current (2008) tax year. TAXES PAID (2008) are generally used to allocate transfers to Reserves for the current year based on the current year collection pattern.
TABLE 110: TAXES PAID (2008)
67 From Provincial Statistics Table sch_707_2008.xls.
Taxes Paid(2008) % of Total
Residential 6,512,057 49.150%Non-Residential 6,737,427 50.850%Total Property Classifications 13,249,484 100.000%
Taxes Paid(2008) % of Total
Residential 6,477,191 99.465%Supportive Housing - 0.000%Recreation / NonProfit 31,648 0.486%Farm 3,218 0.049%Total Residential Properties 6,512,057 100.000%
Taxes Paid(2008) % of Total
Utilities 39,644 0.588%Major Industry 4,629,364 68.711%Light Industry 49,293 0.732%Business / Other 2,018,054 29.953%Managed Forest 1,072 0.016%Total Non-Residential Properties 6,737,427 100.000%
Notes1. Residential Occurences include Single Family, ALR, Farm, Other and Strata as classified by BC Assessment. Residential Vacant is included as Non-Residential Property to reflect its development potential as yet unrealized and included in Class 06―Business and Other.
Property Classifications
Residential Properties
Non-Residential Properties

2008 Municipal Sustainability Report City of Powell River
FITZGERALD, STICKELMANN
141 | P a g e
5.3.6 TAXES PAID (2007)
TAXES PAID (2007)68
reflect actual contributions made by each Property Class for the prior (2007) tax year. TAXES PAID (2007) is generally used to allocate prior years' surpluses based on the original revenue collection pattern.
TABLE 111: TAXES PAID (2007)
68 From Provincial Statistics Table sch_707_2007.xls.
Taxes Paid(2007) % of Total
Residential 5,911,543 46.400%Non-Residential 6,828,929 53.600%Total Taxes Paid 12,740,472 100.000%
Taxes Paid(2007) % of Total
Residential 5,882,943 99.516%Supportive Housing - 0.000%Recreation / NonProfit 26,132 0.442%Farm 2,468 0.042%Total Taxes Paid by Residential Properties 5,911,543 100.000%
Taxes Paid(2007) % of Total
Utilities 37,587 0.550%Major Industry 4,943,393 72.390%Light Industry 42,296 0.619%Business / Other 1,804,689 26.427%Managed Forest 964 0.014%Total Taxes Paid by Non-Residential Properties 6,828,929 100.000%
Notes1. Residential Occurences include Single Family, ALR, Farm, Other and Strata as classified by BC Assessment. Residential Vacant is included as Non-Residential Property to reflect its development potential as yet unrealized and included in Class 06―Business and Other.
Property Classifications
Residential Properties
Non-Residential Properties

2008 Municipal Sustainability Report City of Powell River
FITZGERALD, STICKELMANN
142 | P a g e
5.3.7 TAXES PAID (2001 TO 2008)
TAXES PAID (2001 to 2008)69
reflect the actual contributions made by each Property Class for the current (2008) tax year. TAXES PAID (2001 to 2008) are used to allocate transfers to Reserves for prior years, for transfers from reserves greater than $100,000, on the assumption that these funds were contributed over time.
TABLE 112: TOTAL TAXES PAID (2001 TO 2008)
69 From Provincial Statistics Tables sch_707_2001.xls, sch_707_2002.xls, sch_707_2003.xls, sch_707_2004.xls, sch_707_2005.xls, sch_707_2006.xls, sch_707_2007.xls and sch_707_2008.xls.
Taxes Paid(2001 to 2008) % of Total
Residential (Note 1) 38,813,247 42.317%Non-Residential 52,906,536 57.683%Total Taxes Paid 91,719,784 100.000%
Taxes Paid(2001 to 2008) % of Total
Residential 38,644,176 99.565%Supportive Housing - 0.000%Recreation / NonProfit 159,232 0.410%Farm 9,839 0.025%Total Residential Taxes Paid 38,813,247 100.000%
Taxes Paid(2001 to 2008) % of Total
Utilities 1,011,065 1.911%Major Industry 39,019,339 73.751%Light Industry 330,729 0.625%Business / Other 12,539,200 23.701%Managed Forest 6,204 0.012%Total Non-Residential Taxes Paid 52,906,536 100.000%
Notes
2. Class 3 Previously Unmanaged Forest. No Taxes Assessed from 2001 to 2008.
1. Residential Occurences include Single Family, ALR, Farm, Other and Strata as classified by BC Assessment. Residential Vacant is included as Non-Residential Property to reflect its development potential as yet unrealized and included in Class 6 (Business / Other).
Property Classifications
Residential Properties ONLY
Non-Residential Properties ONLY

2008 Municipal Sustainability Report City of Powell River
FITZGERALD, STICKELMANN
143 | P a g e
5.4 STATISTICS CANADA
5.4.1 COMMUTING FLOWS
Commuting Flows by Census Subdivision show the number of commuters indicating (a) location of their residence and (b) their regular place of work, and (c) as well as those whose residence is in Powell River, along with their regular place of work. Commuting Flow data is used as a "test of reasonability" for the DISTRIBTUTION OF TIME driver. Results will not be the same — as the DISTRIBTUTION OF TIME driver is a more comprehensive calculation.
TABLE 113: COMMUTING FLOWS
5.4.2 COMMUTING DISTANCE
Summary of Commuting Flows
Total Estimated Jobs in Powell River 4,080
Place of Residence and Place of Work in Powell River 3,725 91.3%
Place of Residence in another Municipality 355 8.7%
Place of Work in another Municipality 1,055
Net Commuters Into District (700)
Place of Residence Place of Work Total% of
TotalPowell River (CY) Powell River (CY) 3,725 91.3%
Powell River (CY) Powell River C (RDA) 120 2.9%
Powell River (CY) Powell River B (RDA) 100 2.5%
Powell River (CY) Powell River A (RDA) 45 1.1%
Powell River (CY) Powell River D (RDA) 30 0.7%
Powell River (CY) Toronto (C) 20 0.5%
Powell River (CY) Victoria (CY) 20 0.5%
Powell River (CY) North Vancouver (DM) 20 0.5%
Total 4,080 100.0%
Place of Residence Place of Work Total% of
TotalPowell River (CY) Powell River (CY) 3,725 77.9%
Powell River C (RDA) Powell River (CY) 470 9.8%
Powell River B (RDA) Powell River (CY) 405 8.5%
Powell River A (RDA) Powell River (CY) 140 2.9%
Powell River D (RDA) Powell River (CY) 40 0.8%
4,780 100.0%
Notes
Commuting Flow Census Subdivisions: Sex (3) for the Employed Labour Force 15 Years and Over Having a Usual Place of Work of Census Subdivisions, Flows Greater than or Equal to 20, 2006 Census - 20% Sample Data

2008 Municipal Sustainability Report City of Powell River
FITZGERALD, STICKELMANN
144 | P a g e
Commuting Distance is an estimate of commuting distances based on Census Data. Census Data only provides median70
commuting distances particularly when taking into account the commuter flow in and out of the City. Our calculation estimates a weighted average commute using the middle value of each Census Grouping as the average Commuting Distance. Commuting Distance is used to determine the reasonableness of the WORKFORCE COMMUTING driver.
TABLE 114: COMMUTING DISTANCE
70 Based on Census Canada the median value for all age groups between 15 and up was 6 kilometres.
Census Groupings
Assumed Commuting
DistanceTotal - Age
groups
Total - Age groups X Assumed
Commuting Distance
15 to 24 years
25 to 54 years
25 to 34 years
35 to 44 years
45 to 54 years
55 to 64 years
65 to 74 years
75 years and over
Less than 5 km 2.5 3,500 8,750 1,100 6,275 1,188 2,288 2,813 1,250 113 -
5 to 9.9 km 7.5 905 6,788 863 4,350 750 1,575 2,025 1,275 188 75
10 to 14.9 km 12.5 465 5,813 500 4,500 625 1,188 2,625 563 313 -
15 to 19.9 km 17.5 140 2,450 613 1,313 350 350 438 613 - 175
20 to 24.9 km 22.5 40 900 - 675 - 225 563 225 - -
25 to 29.9 km 27.5 20 550 - 688 - 275 413 - - -
30 km or more 40.0 325 13,000 3,800 6,400 1,000 2,800 2,400 2,400 800 -
Total Kilometres 5,395 38,250 6,875 24,200 3,913 8,700 11,275 6,325 1,413 250
Total Commuters 5,400 730 3,725 670 1,325 1,730 815 110 20
Weighted Average Kilometers 7.08 9.42 6.50 5.84 6.57 6.52 7.76 12.84 12.50
Census Data Note(s)
Source: Statistics Canada - 2006 Census. Catalogue Number 97-561-XCB2006010.
[1] Data quality index showing, for the short census questionnaire (100% data), a global non response rate higher than or equal to 5% but lower than 10%.
[1] Data quality index showing, for the long census questionnaire (20% sample data), a global non response rate higher than or equal to 5% but lower than 10%.
[2] Commuting distance Part A - Plain language definition Straight-line distance between a respondent's home and place of work. Part B - Detailed definition Refers to the distance, in kilometres, between the respondent's residence and his or her usual workplace location. The variable relates to non-institutional residents 15 years of age and over who worked at some time since January 1, 2005. The variable usually relates to the individual's job held in the week prior to enumeration. However, if the person did not work during that week but had worked at some time since January 1, 2005, the information relates to the job held longest during that period.
[3] The median distance of a specified group of distance units is that distance which divides their distribution into two halves, i.e. the distances of the first half are below the median, while those of the second half are above the median. The distance is calculated as the straight-line distance between the residential block representative point and the workplace location representative point. For persons who work outside the areas covered by census metropolitan areas or census agglomerations, the workplace location is usually coded to a single representative point for the census subdivision of work. This can affect the calculated commuting distance, particularly when the census subdivision of work has a large area. This is most apparent for members of the labour force who live in smaller, resource-based urban areas and work outside the census metropolitan area or census agglomeration.
Commuting Distance (km) (9), Age Groups (9) and Sex (3) for the Employed Labour Force 15 Years and Over Having a Usual Place of Work of Canada, Provinces, Territories, Census Metropolitan Areas and Census Agglomerations, 2006 Census - 20% Sample Data

2008 Municipal Sustainability Report City of Powell River
FITZGERALD, STICKELMANN
145 | P a g e
5.4.3 INDUSTRY
Industry Statistics are prepared by Statistics Canada based on census data. The data provide employment information by industry type for the labour force over 15.
5.4.3.1 CITY OF POWELL RIVER
TABLE 115: INDUSTRY - CITY OF POWELL RIVER
Description Total
Agriculture & Resource
Based Industries Construction Manufacturing
Wholesale Trade Retail Trade
Finance & Real Estate
Health Care and Social
ServicesEducational
ServicesBusiness Services
Other Services
Experienced Labour Force 15 Years and Over 5,785 425 430 685 60 835 255 740 375 865 1,115 Percentage of Total Labour Force 7.3% 7.4% 11.8% 1.0% 14.4% 4.4% 12.8% 6.5% 15.0% 19.3%
Male Labour Force 2,950 345 395 600 35 320 70 145 95 530 415 Percentage of Total Male Labour Force 11.7% 13.4% 20.3% 1.2% 10.8% 2.4% 4.9% 3.2% 18.0% 14.1%Male Percentage of Industry 81.2% 91.9% 87.6% 58.3% 38.3% 27.5% 19.6% 25.3% 61.3% 37.2%
Female Labour Force 2,825 80 35 85 20 515 180 595 280 335 700 Percentage of Total Female Labour Force 2.8% 1.2% 3.0% 0.7% 18.2% 6.4% 21.1% 9.9% 11.9% 24.8%Female Percentage of industry 18.8% 8.1% 12.4% 33.3% 61.7% 70.6% 80.4% 74.7% 38.7% 62.8%
Data entered as presented by Statistics Canada (Rounding differences may exist)
Employment Statistics
Total Hours per Year 8,760 8,760 8,760 8,760 8,760 8,760 8,760 8,760 8,760 8,760
Working Hours per day 8.0 8.0 8.0 8.0 8.0 8.0 8.0 8.0 8.0 8.0
Travel Time to Work 0.5 1.0 0.5 0.5 0.5 0.5 0.5 0.5 0.5 0.5 Personal Business (Note 1) 15% 1.3 1.4 1.3 1.3 1.3 1.3 1.3 1.3 1.3 1.3 Total Available Working Hours per year 9.8 10.4 9.8 9.8 9.8 9.8 9.8 9.8 9.8 9.8
Number of Working Days per Week 5.0 5.0 5.0 5.0 5.0 5.0 5.0 5.0 5.0 5.0
Total Working Days available per Year 260 260 260 260 260 260 260 260 260 260 Less: Assumed Holiday Available during year (Note 2) 25 20 25 25 20 20 35 35 25 20 Total Working Days available per Year 235 240 235 235 240 240 225 225 235 240
Total Working/Business Hours (26.5%) 13,404,620 978,775 1,073,280 1,577,555 138,180 1,963,920 599,760 1,631,700 826,875 1,992,095 2,622,480 Total Personal Hours (73.5%) 37,271,980 2,744,225 2,693,520 4,423,045 387,420 5,350,680 1,634,040 4,850,700 2,458,125 5,585,305 7,144,920
Percentage of Activity as Work/Business 26.5% 26.3% 28.5% 26.3% 26.3% 26.8% 26.8% 25.2% 25.2% 26.3% 26.8%
Notes
1. Includes shopping, medical, entertainment, dining, etc (Based on Percentage of Total Working Hours per Day plus Travel Time to Work).
2. Includes 10 days for statuatory holidays.
3. Source: http://www12.statcan.ca/census-recensement/2006/dp-pd/prof/92-591/index.cfm?Lang=E

2008 Municipal Sustainability Report City of Powell River
FITZGERALD, STICKELMANN
146 | P a g e
5.4.3.2 POWELL RIVER CENSUS AGGLOMERATION
TABLE 116: INDUSTRY - POWELL RIVER CENSUS AGGLOMERATION
Description Total
Agriculture & Resource
Based Industries Construction Manufacturing
Wholesale Trade Retail Trade
Finance & Real Estate
Health Care and Social
ServicesEducational
ServicesBusiness Services
Other Services
Experienced Labour Force 15 Years and Over 7,485 630 605 865 65 1,010 280 900 540 1,170 1,420 Percentage of Total Labour Force 8.4% 8.1% 11.6% 0.9% 13.5% 3.7% 12.0% 7.2% 15.6% 19.0%
Male Labour Force 3,955 520 545 760 45 395 75 175 180 685 575 Percentage of Total Male Labour Force 13.1% 13.8% 19.2% 1.1% 10.0% 1.9% 4.4% 4.6% 17.3% 14.5%Male Percentage of Industry 82.5% 90.1% 87.9% 69.2% 39.1% 26.8% 19.4% 33.3% 58.5% 40.5%
Female Labour Force 3,540 110 60 105 25 620 205 720 360 490 845 Percentage of Total Female Labour Force 3.1% 1.7% 3.0% 0.7% 17.5% 5.8% 20.3% 10.2% 13.8% 23.9%Female Percentage of industry 17.5% 9.9% 12.1% 38.5% 61.4% 73.2% 80.0% 66.7% 41.9% 59.5%
Data entered as presented by Statistics Canada (Rounding differences may exist)
Employment Statistics
Total Hours per Year 8,760 8,760 8,760 8,760 8,760 8,760 8,760 8,760 8,760 8,760
Working Hours per day 8.0 8.0 8.0 8.0 8.0 8.0 8.0 8.0 8.0 8.0
Travel Time to Work 0.5 1.0 0.5 0.5 0.5 0.5 0.5 0.5 0.5 0.5
Personal Business (Note 1) 15% 1.3 1.4 1.3 1.3 1.3 1.3 1.3 1.3 1.3 1.3
Total Available Working Hours per year 9.8 10.4 9.8 9.8 9.8 9.8 9.8 9.8 9.8 9.8
Number of Working Days per Week 5 5 5 5 5 5 5 5 5 5
Total Working Days available per Year 260 260 260 260 260 260 260 260 260 260
Less: Assumed Holiday Available during year (Note 2) 25 20 25 25 20 20 35 35 25 20
Total Working Days available per Year 235 240 235 235 240 240 225 225 235 240
Total Working/Business Hours (26.5%) 17,346,390 1,450,890 1,510,080 1,992,095 149,695 2,375,520 658,560 1,984,500 1,190,700 2,694,510 3,339,840 Total Personal Hours (73.5%) 48,222,210 4,067,910 3,789,720 5,585,305 419,705 6,472,080 1,794,240 5,899,500 3,539,700 7,554,690 9,099,360
Percentage of Activity as Work/Business 26.5% 26.3% 28.5% 26.3% 26.3% 26.8% 26.8% 25.2% 25.2% 26.3% 26.8%
Notes
1. Includes shopping, medical, entertainment, dining, etc (Based on Percentage of Total Working Hours per Day plus Travel Time to Work).
2. Includes 10 days for statuatory holidays.
3. Source: http://www12.statcan.ca/census-recensement/2006/dp-pd/prof/92-591/index.cfm?Lang=E

2008 Municipal Sustainability Report City of Powell River
FITZGERALD, STICKELMANN
147 | P a g e
5.4.4 LABOUR FORCE ACTIVITY
Labour Force Activity71
is prepared by Statistics Canada and refers to the labour market activity of the population 15 years and over in the week (Sunday to Saturday) prior to Census Day (May 16, 2006).
TABLE 117: LABOUR FORCE ACTIVITY
71 Source Data: http://www12.statcan.ca/census-recensement/2006/dp-pd/prof/92-591/index.cfm?Lang=E
City of Powell River Powell River AgglomerationDescription Total Male Female Description Total Male FemaleTotal Population 10,625 5,085 5,540 Total Population 13,700 6,690 7,010
In Labour Force 5,895 3,020 2,875 In Labour Force 7,625 4,015 3,610 Employeed 5,480 2,840 2,640 Employeed 7,155 3,815 3,340 Unemployed 415 180 235 Unemployed 470 200 270
Not in the Labour Force 4,730 2,065 2,665 Not in the Labour Force 6,075 2,675 3,400 Participation Rate 55.5% 59.4% 51.9% Participation Rate 55.7% 60.0% 51.5%Employment Rate 51.6% 55.9% 47.7% Employment Rate 52.2% 57.0% 47.6%Unemployment Rate 7.0% 6.0% 8.2% Unemployment Rate 6.2% 5.0% 7.5%
Per Statistics Canada Total Population 12,957 Per Statistics Canada Total Population 25,297 Variance due to rounding in table Variance due to rounding in table
Total Population over 15 and over
4,732 2,066 2,666 Total Population over 15 and over
6,077 2,676 3,401
Description Total Male FemaleTotal Population 77.6% 76.0% 79.0%
In Labour Force 77.3% 75.2% 79.6%Employeed 76.6% 74.4% 79.0%Unemployed 88.3% 90.0% 87.0%
Not in the Labour Force 77.9% 77.2% 78.4%
Per Statistics Canada Total Population 51.2%Variance due to rounding in table
Total Population over 15 and over 77.9% 77.2% 78.4%
Powell River as a % of Total Powell River Agglomeration

2008 Municipal Sustainability Report City of Powell River
FITZGERALD, STICKELMANN
148 | P a g e
5.4.5 MODES OF TRANSPORTATION
Modes of Transportation Statistics are prepared by Statistics Canada based on Census Data. They provide employment information by industry type, for the labour force over 15 years of age.
TABLE 118: MODES OF TRANSPORTATION
Census Agglomeration Total
Car, Truck, Van as Driver
Car, Truck, Van as
PassengerPublic
TransitWalked or
BicycledAll other
Modes
Total employed labour force 15 years and over with a usual place of work or no fixed workplace address 6,495 5,220 505 95 535 140
Percentage of total labour force 80.3% 7.8% 1.5% 8.2% 2.2%
Male Labour Force 3,545 2,825 325 60 230 105
Percentage of total male labour force 79.6% 9.2% 1.7% 6.5% 3.0%
Male Percentage of industry 54.1% 64.4% 63.2% 43.0% 75.0%
Female Labour Force 2,960 2,395 180 40 310 35
Percentage of total female labour force 80.8% 6.1% 1.4% 10.5% 1.2%
Female Percentage of industry 45.9% 35.6% 42.1% 57.9% 25.0%
Data entered as presented by Statistics Canada (Rounding differences may exist)
Powell River Total
Car, Truck, Van as Driver
Car, Truck, Van as
PassengerPublic
TransitWalked or
BicycledAll other
Modes
Total employed labour force 15 years and over with a usual place of work or no fixed workplace address 5,030 3,990 415 75 475 75
Percentage of total labour force 79.3% 8.3% 1.5% 9.4% 1.5%
Male Labour Force 2,650 2,095 260 30 210 55
Percentage of total male labour force 79.1% 9.8% 1.1% 7.9% 2.1%
Male Percentage of industry 40.1% 51.5% 31.6% 39.3% 39.3%
Female Labour Force 2,370 1,895 155 35 265 20
Percentage of total female labour force 80.0% 6.5% 1.5% 11.2% 0.8%
Female Percentage of industry 36.3% 30.7% 36.8% 49.5% 14.3%
Data entered as presented by Statistics Canada (Rounding differences may exist)
Outside City of Powell River Total
Car, Truck, Van as Driver
Car, Truck, Van as
PassengerPublic
TransitWalked or
BicycledAll other
Modes
Total employed labour force 15 years and over with a usual place of work or no fixed workplace address 1,485 1,230 90 35 65 65
Percentage of total labour force 82.7% 6.1% 2.4% 4.4% 4.4%
Male Labour Force 895 730 65 30 20 50
Percentage of total male labour force 81.5% 7.3% 3.4% 2.2% 5.6%
Male Percentage of industry 14.0% 12.9% 31.6% 3.7% 35.7%
Female Labour Force 590 500 25 5 45 15
Percentage of total female labour force 84.9% 4.2% 0.8% 7.6% 2.5%
Female Percentage of industry 9.6% 5.0% 5.3% 8.4% 10.7%

2008 Municipal Sustainability Report City of Powell River
FITZGERALD, STICKELMANN
149 | P a g e
5.4.6 OCCUPATION STATISTICS
5.4.6.1 CITY OF POWELL RIVER
Occupation Statistics are prepared by Statistics Canada based on census data. This table summarizes employment data within the City of Powell River by occupation for the labour force over 15 years of age.
TABLE 119: OCCUPATION STATISTICS - CITY OF POWELL RIVER
Description Total Management
Business, Finance, and
Administration
Natural & Applied
Sciences and Relate Health
Social Science,
Education, Government Service and
Religion
Art, Culture, Recreation and Sport
Sales and Service
Trades, Transport, Equipment Operators,
and Related
Unique to Primary Industry
Unique to Processing,
Manufacturing, and Utilities
Experienced Labour Force 15 Years and Over 5,780 515 715 285 435 460 105 1,575 1,035 375 280 Percentage of Total Labour Force 8.9% 12.4% 4.9% 7.5% 8.0% 1.8% 27.2% 17.9% 6.5% 4.8%
Male Labour Force 2,970 305 105 255 85 125 45 515 985 300 250 Percentage of Total Male Labour Force 10.3% 3.5% 8.6% 2.9% 4.2% 1.5% 17.3% 33.2% 10.1% 8.4%Male Percentage of Industry 59.2% 14.7% 89.5% 19.5% 27.2% 42.9% 32.7% 95.2% 80.0% 89.3%
Female Labour Force 2,820 220 610 30 355 335 55 1,065 50 70 30 Percentage of Total Female Labour Force 7.8% 21.6% 1.1% 12.6% 11.9% 2.0% 37.8% 1.8% 2.5% 1.1%Female Percentage of Industry 42.7% 85.3% 10.5% 81.6% 72.8% 52.4% 67.6% 4.8% 18.7% 10.7%
Data entered as presented by Statistics Canada (Rounding differences may exist)
Employment Statistics
Total Hours per Year 8,760 8,760 8,760 8,760 8,760 8,760 8,760 8,760 8,760 8,760
Working Hours per day 8.0 8.0 8.0 8.0 8.0 8.0 8.0 8.0 8.0 8.0
Travel Time to Work 0.5 0.5 0.5 0.5 0.5 0.5 0.5 1.0 0.5 0.5 Personal Business (Note 1) 15% 1.3 1.3 1.3 1.3 1.3 1.3 1.3 1.4 1.3 1.3 Total Assumed Working Hours per Day 9.8 9.8 9.8 9.8 9.8 9.8 9.8 10.4 9.8 9.8
Number of Working Days per Week 5.0 5.0 5.0 5.0 5.0 5.0 5.0 5.0 5.0 5.0
Total Working Days available per Year 260.0 260.0 260.0 260.0 260.0 260.0 260.0 260.0 260.0 260.0 Less: Assumed Holiday Available during year (Note 2) 25.0 30.0 25.0 35.0 35.0 20.0 20.0 20.0 35.0 35.0 Plus: Business Time on Holidays 1.0 1.0 1.0 1.0 1.0 1.0 1.0 1.0 1.0 1.0 Total Working Days available per Year 236.0 231.0 236.0 226.0 226.0 241.0 241.0 241.0 226.0 226.0
Total Working/Business Hours 13,463,745 1,191,092 1,618,617 659,148 963,438 1,018,808 247,989 3,719,835 2,594,124 830,550 620,144 Total Personal Hours 37,169,055 3,320,308 4,644,783 1,837,452 2,847,162 3,010,792 671,811 10,077,165 6,472,476 2,454,450 1,832,656
Percentage of Activity as Work/Business 26.6% 26.4% 25.8% 26.4% 25.3% 25.3% 27.0% 27.0% 28.6% 25.3% 25.3%
Average Working Days Available 237.7 (13,463,745 / 5,780 ) / 9.8)
Notes
1. Includes shopping, medical, entertainment, dining, etc (Based on Percentage of Total Working Hours per Day plus Travel Time to Work).
2. Includes 10 days for statuatory holidays.
3. Source: http://www12.statcan.ca/census-recensement/2006/dp-pd/prof/92-591/index.cfm?Lang=E

2008 Municipal Sustainability Report City of Powell River
FITZGERALD, STICKELMANN
150 | P a g e
5.4.6.2 POWELL RIVER CENSUS AGGLOMERATION
Occupation Statistics are prepared by Statistics Canada based on census data. This table summarizes employment data — within both the City of Powell River and the surrounding area— by occupation, for the labour force over 15 years of age.
TABLE 120: OCCUPATION STATISTICS - POWELL RIVER CENSUS AGGLOMERATION
Total Management
Business, Finance, and
Administration
Natural & Applied
Sciences and Relate Health
Social Science,
Education, Government Service and
Religion
Art, Culture, Recreation and Sport
Sales and Service
Trades, Transport, Equipment Operators,
and Related
Unique to Primary Industry
Unique to Processing,
Manufacturing, and Utilities
Experienced Labour Force 15 Years and Over 7,490 680 910 360 525 600 130 1,955 1,365 545 425 Percentage of Total Labour Force 9.1% 12.1% 4.8% 7.0% 8.0% 1.7% 26.1% 18.2% 7.3% 5.7%
Male Labour Force 3,945 425 120 305 105 155 75 630 1,310 435 385 Percentage of Total Male Labour Force 10.8% 3.0% 7.7% 2.7% 3.9% 1.9% 16.0% 33.2% 11.0% 9.8%Male Percentage of Industry 5.7% 1.6% 4.1% 1.4% 2.1% 1.0% 8.4% 17.5% 5.8% 5.1%
Female Labour Force 3,545 250 790 55 425 445 55 1,320 60 105 40 Percentage of Total Female Labour Force 7.1% 22.3% 1.6% 12.0% 12.6% 1.6% 37.2% 1.7% 3.0% 1.1%Female Percentage of Industry 3.3% 10.5% 0.7% 5.7% 5.9% 0.7% 17.6% 0.8% 1.4% 0.5%
Data entered as presented by Statistics Canada (Rounding differences may exist)
Employment Statistics
Total Hours per Year 8,760 8,760 8,760 8,760 8,760 8,760 8,760 8,760 8,760 8,760
Working Hours per day 8.0 8.0 8.0 8.0 8.0 8.0 8.0 8.0 8.0 8.0
Travel Time to Work 0.5 0.5 0.5 0.5 0.5 0.5 0.5 1.0 0.5 0.5
Personal Business (Note 1) 15% 1.3 1.3 1.3 1.3 1.3 1.3 1.3 1.4 1.3 1.3
Total Assumed Working Hours per Day 9.8 9.8 9.8 9.8 9.8 9.8 9.8 10.4 9.8 9.8
Number of Working Days per Week 5.0 5.0 5.0 5.0 5.0 5.0 5.0 5.0 5.0 5.0
Total Working Days available per Year 260.0 260.0 260.0 260.0 260.0 260.0 260.0 260.0 260.0 260.0
Less: Assumed Holiday Available during year (Note 2) 25.0 30.0 25.0 35.0 35.0 20.0 20.0 20.0 35.0 35.0
Total Working Days available per Year 235.0 230.0 235.0 225.0 225.0 240.0 240.0 240.0 225.0 225.0
Total Working/Business Hours 17,376,695 1,566,040 2,051,140 829,080 1,157,625 1,323,000 305,760 4,598,160 3,407,040 1,201,725 937,125 Total Personal Hours 48,279,505 4,390,760 5,920,460 2,324,520 3,441,375 3,933,000 833,040 12,527,640 8,550,360 3,572,475 2,785,875
Percentage of Activity as Work/Business 26.5% 26.3% 25.7% 26.3% 25.2% 25.2% 26.8% 26.8% 28.5% 25.2% 25.2%
Notes
1. Includes shopping, medical, entertainment, dining, etc (Based on Percentage of Total Working Hours per Day plus Travel Time to Work).2. Includes 10 days for statuatory holidays.3. Source: http://www12.statcan.ca/census-recensement/2006/dp-pd/prof/92-591/index.cfm?Lang=E

2008 Municipal Sustainability Report City of Powell River
FITZGERALD, STICKELMANN
151 | P a g e
5.4.7 PLACE OF WORK
Place of Work Statistics are prepared by Statistics Canada based on census data. They provide employment information by industry type, for the labour force over 15 years of age.
5.4.7.1 CITY OF POWELL RIVER
TABLE 121: PLACE OF WORK - CITY OF POWELL RIVER
Description TotalWorked at
homeWorked outside
Canada
No fixed workplace
addressWorked at
usual place
Worked in census
subdivision (municipality)
of residence
Worked in different
census subdivision
(municipality) of residence
Worked in different
census division (country) of
residence
Worked in different Province
Total Population (15 Years and Over) 10,900 Unemployeed 415 Not in Labour Force 4,730
Total Employeed labour force 15 years and over 5,480 425 20 810 4,225 3,725 315 130 55 Percentage of total labour force 7.8% 0.4% 14.8% 77.1% 68.0% 5.7% 2.4% 1.0%
Total Place of Work within Municipality 4,150 425 3,725 3,725 Percentage with Total Place of Work Within Municpalilty 10.2% 89.8% 89.8%Percentage of total employeed labour force 15 years and over 75.7%
Total Place of Work outside Municipality 520 20 500 315 130 55 Percentage with total place of workoutside Municipality 3.8% 96.2% 60.6% 25.0% 10.6%Percentage of total employeed labour force 15 years and over 9.5%
Total No Fixed Workplace Address 810 810 - Percentage with no fixed workplace address 100.0%Percentage of total employeed labour force 15 years and over 14.8%
Male Labour Force 2,840 175 10 645 2,010 1,685 210 80 35 Percentage of total male labour force 6.2% 0.4% 22.7% 70.8% 59.3% 7.4% 2.8% 1.2%Male Percentage of industry 41.2% 50.0% 79.6% 47.6% 45.2% 66.7% 61.5% 63.6%
Female Labour Force 2,630 245 15 160 2,210 2,040 105 45 25 Percentage of total female labour force 9.3% 0.6% 6.1% 84.0% 77.6% 4.0% 1.7% 1.0%Female Percentage of industry 57.6% 75.0% 19.8% 52.3% 54.8% 33.3% 34.6% 45.5%
Employment Statistics
Total Hours per Year 8,760 8,760 8,760 8,760 8,760 8,760 8,760 8,760
Working Hours per day 8 0 8 8 8 8 8 8
Travel Time to Work 0 0 1 0.5 0.5 1 0 0Personal Business (Note 1) 1.2 0 1.4 1.3 1.3 1.4 1.2 1.2Total Available Working Hours per year 9.2 0 10.4 9.8 9.8 10.4 9.2 9.2
Weighted Average Travel Time 0 0 810 2112.5 1862.5 315 0 0.93
Number of Working Days per Week 5 5 5 5 5 5 5 5
Total Working Days available per Year 260 260 260 260 260 260 260 260Less: Assumed Holiday Available during year (Note 2) 25 30 25 35 35 20 20 20Total Working Days available per Year 235 230 235 225 225 240 240 240
Total Working/Business Hours (25.4%) 12,214,615 918,850 - 1,979,640 9,316,125 8,213,625 786,240 287,040 121,440 Total Personal Hours (74.6%) 35,790,185 2,804,150 175,200 5,115,960 27,694,875 24,417,375 1,973,160 851,760 360,360
Percentage of Activity as Work/Business 25.4% 24.7% 0.0% 27.9% 25.2% 25.2% 28.5% 25.2% 25.2%
Notes
1. Includes shopping, medical, entertainment, dining, etc (Based on Percentage of Total Working Hours per Day plus Travel Time to Work).2. Includes 10 days for statuatory holidays.3. Source: http://www12.statcan.ca/census-recensement/2006/dp-pd/prof/92-591/index.cfm?Lang=E

2008 Municipal Sustainability Report City of Powell River
FITZGERALD, STICKELMANN
152 | P a g e
5.4.7.2 POWELL RIVER CENSUS AGGLOMERATION
TABLE 122: PLACE OF WORK - POWELL RIVER CENSUS AGGLOMERATION
Description TotalWorked at
homeWorked outside
Canada
No fixed workplace
addressWorked at
usual place
Worked in census
subdivision (municipality)
of residence
Worked in different
census subdivision
(municipality) of residence
Worked in different
census division (country) of
residence
Worked in different Province
Total Population (15 Years and Over) 10,900 Unemployeed 620 Not in Labour Force 6,300
Total Employeed labour force 15 years and over 5,480 425 20 810 4,225 3,725 315 130 55 Percentage of total labour force 7.8% 0.4% 14.8% 77.1% 68.0% 5.7% 2.4% 1.0%
Total Place of Work within Municipality 4,150 425 3,725 3,725 Percentage with Total Place of Work Within Municpalilty 10.2% 89.8% 89.8%Percentage of total employeed labour force 15 years and over 75.7%
Total Place of Work outside Municipality 520 20 500 315 130 55 Percentage with total place of workoutside Municipality 3.8% 96.2% 60.6% 25.0% 10.6%Percentage of total employeed labour force 15 years and over 9.5%
Total No Fixed Workplace Address 810 810 - Percentage with no fixed workplace address 100.0%Percentage of total employeed labour force 15 years and over 14.8%
Male Labour Force 2,840 175 10 645 2,010 1,685 210 80 35 Percentage of total male labour force 6.2% 0.4% 22.7% 70.8% 59.3% 7.4% 2.8% 1.2%Male Percentage of industry 41.2% 50.0% 79.6% 47.6% 45.2% 66.7% 61.5% 63.6%
Female Labour Force 2,630 245 15 160 2,210 2,040 105 45 25 Percentage of total female labour force 9.3% 0.6% 6.1% 84.0% 77.6% 4.0% 1.7% 1.0%Female Percentage of industry 57.6% 75.0% 19.8% 52.3% 54.8% 33.3% 34.6% 45.5%
Employment Statistics
Total Hours per Year 8,760 8,760 8,760 8,760 8,760 8,760 8,760 8,760
Working Hours per day 8 0 8 8 8 8 8 8
Travel Time to Work 0 0 1 0.5 0.5 1 0 0Personal Business (Note 1) 1.2 0 1.4 1.3 1.3 1.4 1.2 1.2Total Available Working Hours per year 9.2 0 10.4 9.8 9.8 10.4 9.2 9.2
Weighted Average Travel Time 0 0 810 2112.5 1862.5 315 0 0.93
Number of Working Days per Week 5 5 5 5 5 5 5 5
Total Working Days available per Year 260 260 260 260 260 260 260 260Less: Assumed Holiday Available during year (Note 2) 25 30 25 35 35 20 20 20Total Working Days available per Year 235 230 235 225 225 240 240 240
Total Working/Business Hours (25.4%) 12,214,615 918,850 - 1,979,640 9,316,125 8,213,625 786,240 287,040 121,440 Total Personal Hours (74.6%) 35,790,185 2,804,150 175,200 5,115,960 27,694,875 24,417,375 1,973,160 851,760 360,360
Percentage of Activity as Work/Business 25.4% 24.7% 0.0% 27.9% 25.2% 25.2% 28.5% 25.2% 25.2%
Notes
1. Includes shopping, medical, entertainment, dining, etc (Based on Percentage of Total Working Hours per Day plus Travel Time to Work).2. Includes 10 days for statuatory holidays.3. Source: http://www12.statcan.ca/census-recensement/2006/dp-pd/prof/92-591/index.cfm?Lang=E

2008 Municipal Sustainability Report City of Powell River
FITZGERALD, STICKELMANN
153 | P a g e
5.4.8 POPULATION STATISTICS
Population statistics are prepared by Statistics Canada.
City of Powell River Census Agglomeration
Description Total Male Female Description Total Male FemaleTotal Population 12,965 6,270 6,695 Total Population 16,540 8,130 8,410
0 to 4 years 550 260 290 0 to 4 years 670 320 350 5 to 9 years 675 360 315 5 to 9 years 815 430 385 10 to 14 years 840 455 385 10 to 14 years 1,075 585 490 15 to 19 years 870 460 410 15 to 19 years 1,125 610 515 20 to 24 years 480 240 240 20 to 24 years 620 310 310 25 to 29 years 390 190 200 25 to 29 years 500 240 260 30 to 34 years 550 250 300 30 to 34 years 695 325 370 35 to 39 years 740 365 375 35 to 39 years 910 445 465 40 to 44 years 1,000 455 545 40 to 44 years 1,270 575 695 45 to 49 years 1,090 535 555 45 to 49 years 1,420 695 725 50 to 54 years 1,110 540 570 50 to 54 years 1,510 750 760 55 to 59 years 1,025 515 510 55 to 59 years 1,400 725 675 60 to 64 years 880 435 445 60 to 64 years 1,180 585 595 65 to 69 years 705 350 355 65 to 69 years 945 490 455 70 to 74 years 655 315 340 70 to 74 years 790 385 405 75 to 79 years 585 265 320 75 to 79 years 690 325 365 80 to 84 years 445 160 285 80 to 84 years 515 200 315 85 years and over 375 120 255 85 years and over 410 135 275
Total Population (2006 Community Profiles) 12,957 Total Population (2006 Community Profiles) 25,297 Variance due to rounding in table Variance due to rounding in table`Total Population over 15 and over
10,900 5,195 5,705 Total Population over 15 and over
13,980 6,795 7,185
Outside the City of Powell River
Description Total Male FemaleTotal Population 3,575 1,860 1,715
0 to 4 years 120 60 60 5 to 9 years 140 70 70 10 to 14 years 235 130 105 15 to 19 years 255 150 105 20 to 24 years 140 70 70 25 to 29 years 110 50 60 30 to 34 years 145 75 70 35 to 39 years 170 80 90 40 to 44 years 270 120 150 45 to 49 years 330 160 170 50 to 54 years 400 210 190 55 to 59 years 375 210 165 60 to 64 years 300 150 150 65 to 69 years 240 140 100 70 to 74 years 135 70 65 75 to 79 years 105 60 45 80 to 84 years 70 40 30 85 years and over 35 15 20
Total Population (2006 Community Profiles) 12,340 Variance due to rounding in table
Total Population over 15 and over
3,080 1,600 1,480
TABLE 123: POPULATION STATISTICS

2008 Municipal Sustainability Report City of Powell River
FITZGERALD, STICKELMANN
154 | P a g e
6 DEFINITIONS
6.1 ACTIVITY DRIVER
An Activity Driver is the element used to quantify and allocate revenues and expenditures. Activity Drivers relate to the structural causes of activities performed. They measure the use and consumption of discrete activities, so as to establish a relative percentage value for those activities. Drivers may be used together or separately.
Activities are generally defined as:
Primary: These are directly related to an activity (Category 1).
Secondary: These are indirectly related the activity (Category 2, 3, 4, and 5).
Generally, there are three types of activity drivers:
1. Volume: This cost driver uses units of work to measure an activity. The allocation of volume related to an activity increases as more units of work are processed. (Category 1).
2. Time: This cost driver uses units of time taken or spent on an activity. The allocation of an activity increases as the time required for the activity increases, and visa‐a‐versa. (Category 1).
3. Estimates: Estimates are used to allocate activities that cannot be related directly or attributed to a specific source. Estimates may be defined by either a Consultant's or Management Estimate and represent a reasoned or logical approach.
6.2 ADMINISTRATIVE PERFORMANCE MEASURE
An Administrative Performance Measure is a metric, which allows for systematic comparison of the efficiency and effectiveness related to the delivery of individual municipal services.

2008 Municipal Sustainability Report City of Powell River
FITZGERALD, STICKELMANN
155 | P a g e
6.3 ALLOCATION TYPES
6.3.1 TYPE 1: DIRECT
Direct revenues and expenditures are driven by the specific activities of the department and provide measurable benefits of people and/or property. Specific departmental revenues and expenditures are assigned to each property class based on empirical data, and/or logic.
6.3.2 TYPE 2: DEPARTMENTAL INDIRECT
Departmental Indirect revenues and expenditures are driven by services that directly support Category 1 activities for a specific service or within a single APM category e.g. Parks and Recreation Director, Fire Chief, Planning Director.
These support services are generally allocated based on the average of all direct expenditures72
6.3.3 TYPE 3: MUNICIPAL INDIRECT
related to the activity, unless an empirical driver is available.
Municipal Indirect revenues and expenditures are general administrative expenditures that do not relate to a specific department or activity. These expenditures relate to overall general administration and management of the municipality e.g. Mayor and Council, Human Resource, Information Technology.
Allocation of these administrative costs may use empirical drivers e.g. number of full-time employees or the average of all direct Type 1 and 2 expenditures.
72 Direct Expenditures are generally used as a measurement of time and resources when an empirical driver is not available. This is based on the concept of "value for money" and that greater administrative time and resources will be devoted to those activities that generate the greatest level of expenditures to the City.

2008 Municipal Sustainability Report City of Powell River
FITZGERALD, STICKELMANN
156 | P a g e
6.4 BUDGET CATEGORIES
6.4.1 CATEGORY 1: REVENUES
Revenues relate to all direct or indirect funds received from the provision or sale of municipal services.
6.4.2 CATEGORY 2: EXPENDITURES
Expenditures relate to all direct and indirect costs related to the provision or sale of municipal services.
6.4.3 CATEGORY 3: GRANTS
Grants are funds received from Senior levels of Government and may be classified as either conditional or unconditional.
Grants are paid from tax revenues received by Senior levels of Government and are allocated as a general reduction in the overall cost of operating the municipality and as such, are treated as a net reduction to all property classes based on overall consumption patterns when not attributable to a specific service. When attributable to a specific service, grants are allocated based on the consumption pattern for that service.
6.4.4 CATEGORY 4: TRANSFERS TO AND FROM RESERVES.
Reserves are funds similar to savings accounts used to purchase new or replacement assets at some future date or to meet anticipated future liabilities. Transfers to/from Reserves are allocated based on taxes paid. This report uses two different allocations:
1) Transfers to reserves are based on either the current or projected consumption pattern of the intended use of the reserves.
2) Transfers from reserves are based on the average contribution pattern to the reserve fund.
3) Interest earned on reserve funds are credited based on the average contribution pattern within each fund.

2008 Municipal Sustainability Report City of Powell River
FITZGERALD, STICKELMANN
157 | P a g e
6.4.5 CATEGORY 5: EXCLUDED FROM CONSUMPTION CALCULATION
This budget category is used to remove certain budget line items from Consumption Analysis. This generally relates to two types of revenues and expenditures that may be included in the City's Financial Statements. Some examples are listed below:
6.4.5.1 TAXES COLLECTED FOR OTHER GOVERNMENTS
Property taxes are levied by various Government Agencies e.g. BC Assessment, Regional Districts, Regional Hospitals, the Municipal Finance Authority, Translink (Transit), and the Provincial Government (School Taxes). These authorities all provide services to the municipality, but are not under the direct control or responsibility of the Municipal Government. The Municipality simply acts as the collector of the property taxes on behalf of these other Authorities.
6.4.5.2 REVENUES FROM PROPERTY TAXES
Revenues required from property taxes are the subject of the Consumption Analysis.
6.4.5.3 DISTRIBUTION OF TIME DRIVER
The Distribution of Time Driver is used to allocate services that can reasonably be defined, based on time spent on work/business related activities versus personal/recreational activities. An example would be a portion of Police / Fire revenues and expenditures.
Time spent travelling to and from work is an estimated average value using 2006 Census Employment Data (place of work, labour force activity, occupations, industry). In addition, time is defined as personal “business” — to cover activities such as medical, shopping, entertainment and dining activities.
6.4.6 DRIVERS
Drivers are activities that cause expenditures or revenues to be incurred.
6.4.7 INDIRECT DRIVERS
Indirect Drivers are activities that support the provision of services, but may not be specifically identifiable to that activity.

2008 Municipal Sustainability Report City of Powell River
FITZGERALD, STICKELMANN
158 | P a g e
6.4.8 PROPERTY CLASS
Property Class refers to the types and uses of property as defined in the Assessment Act. Abbreviations commonly used in this report include:
Class 01―Residential = Res
Class 02―Utilities = Util
Class 03―Supportive Housing = Supp Hse
Class 04―Major Industry = Maj Ind
Class 05―Light Industry = Lgt Ind
Class 06―Business / Other = Bus
Class 07―Managed Forest = Man For
Class 08―Recreational / Non-Profit = Red / NP
Class 09―Farm = Farm
Classes are also defined as aggregate groups of Residential and Non-Residential.

2008 Municipal Sustainability Report City of Powell River
FITZGERALD, STICKELMANN
159 | P a g e
7 TABLE OF FIGURES
Figure 1: Property Tax Relationship ..................................................................................... 7Figure 2: Municipal Funding Framework ............................................................................ 9Figure 3: Municipal Finance Responsibilities .....................................................................10Figure 4: The Role of Planning .............................................................................................12Figure 5: Municipal Sustainability Model ...........................................................................13Figure 6: Consumption Continuum .....................................................................................26Figure 7: Calculation of Net Consumption ..........................................................................28Figure 8: Marginal Tax Rate Graph ....................................................................................29Figure 9: Illustration of Net Consumption Calculation .......................................................30Figure 10: Actual Tax Distribution compared to Consumption Based Tax Distribution .....33Figure 11: 2008 Gross Residential (Class 01) Expenditures per Capita ...............................34Figure 12: 2008 Gross Non-Residential Expenditures per Private–Sector Job ....................35Figure 13: City of Powell River LAQ Graph ..........................................................................36Figure 14: Gross Cost of Service Delivery ..............................................................................38Figure 15: 2008 Gross Cost of Service Delivery (Per Capita and Per Job) ...........................39Figure 16: Transit Routes ......................................................................................................99

2008 Municipal Sustainability Report City of Powell River
FITZGERALD, STICKELMANN
160 | P a g e
8 TABLE OF TABLES
Table 1: Provincial Statistics (Sch707) .............................................................................. 3Table 2: Revenues by Class per Powell River Budget Data ............................................... 3Table 3: Summary of Total Residential / Non-Residential Consumption (%) .................... 4Table 4: Summary of Residential ........................................................................................ 5Table 5: Consumption Patterns by Class (%) ...................................................................... 6Table 6: Consumption Patterns by Class ($) ....................................................................... 6Table 7: Marginal Tax Rate Example ................................................................................29Table 8: Consumption Allocation (%) .................................................................................32Table 9: Consumption Allocation ($) ..................................................................................32Table 10: 2008 Property Tax Levy .......................................................................................45Table 11: Utility (1%) ...........................................................................................................46Table 12: Collections for Other Governments ......................................................................47Table 13: Direct Category 1 and 2 General Expenditures ...................................................49Table 14: Direct Library .......................................................................................................50Table 15: Direct Category 1 and 2 General Expenditures ...................................................50Table 16: Direct Category 1 and 2 General Expenditures ...................................................51Table 17: Direct Category 1 and 2 General Expenditures ...................................................51Table 18: Direct Fire .............................................................................................................52Table 19: Direct Security ......................................................................................................52Table 20: Direct Fire .............................................................................................................52Table 21: Direct RCMP .........................................................................................................53Table 22: Direct Airport .......................................................................................................55Table 23: Equipment Reserves .............................................................................................55Table 24: Direct Engineering ...............................................................................................55Table 25: Direct Engineering ...............................................................................................56Table 26: Direct Engineering ...............................................................................................56Table 27: Direct Recreation Complex ...................................................................................57Table 28: Direct Theatre & Meeting Room ..........................................................................57Table 29: Direct Pool & Fitness ............................................................................................57Table 30: Direct Recreation Complex ...................................................................................58Table 31: Direct Parks and REcreation ...............................................................................58Table 32: Direct Dwight Hall ...............................................................................................58Table 33: Direct Willingdon Beach Campsite ......................................................................59Table 34: Direct Museum .....................................................................................................59Table 35: Direct Recreation Complex ...................................................................................59Table 36: Direct Recreation Complex ...................................................................................60Table 37: Direct Recreation Complex ...................................................................................60Table 38: Direct Recreation Complex ...................................................................................61

2008 Municipal Sustainability Report City of Powell River
FITZGERALD, STICKELMANN
161 | P a g e
Table 39: Direct Harbour .....................................................................................................61Table 40: Direct Parks and Recreation ................................................................................61Table 41: Direct Willingdon Beach Campsite ......................................................................62Table 42: Budgets for Mayor and Council ............................................................................63Table 43: Total Direct Category 1 and 2 Expenditures .......................................................63Table 44: Total Direct Category 1 and 2 Expenditures .......................................................65Table 45: Building and Grounds Maintenance ....................................................................66Table 46: Total Direct Category 1 and 2 Expenditures .......................................................66Table 47: Total Direct Category 1 and 2 Expenditures .......................................................67Table 48: Debt / Fiscal Services ...........................................................................................68Table 49: Total Direct Category 1 and 2 Expenditures .......................................................68Table 50: Human Resources .................................................................................................69Table 51: Total Direct Category 1 and 2 Expenditures .......................................................73Table 52: 2007 Fire Rescue Statistics ..................................................................................75Table 53: 2007 Incidents ......................................................................................................75Table 54: Direct Security ......................................................................................................76Table 55: 2008 Summary of Bylaw Incidcents .....................................................................78Table 56: 2008 Service Activity Detail .................................................................................78Table 57: Direct Bylaw Enforcement ...................................................................................79Table 58: Direct planning expenditures ...............................................................................80Table 59: Direct Development Services ...............................................................................82Table 60: Direct Planning .....................................................................................................83Table 61: Jobs Excluding Class 2―Utilities .........................................................................85Table 62: Direct Planning .....................................................................................................85Table 63: Direct Engineering ...............................................................................................88Table 64: Total Direct Category 1 and 2 Expenditures .......................................................90Table 65: Direct Airport .......................................................................................................90Table 66: Direct Airport .......................................................................................................91Table 67: Direct Airport .......................................................................................................91Table 68: Building Permit Statistics ($) ..............................................................................92Table 69: Building Permit Statistics (%) ..............................................................................92Table 70: Road Use Driver ...................................................................................................93Table 71: Direct Sanitation & Waste ...................................................................................95Table 72: Sanitation & Waste Direct ...................................................................................96Table 73: Road Use Driver ...................................................................................................97Table 74: Direct Engineering ...............................................................................................98Table 75: Transit Ridership .................................................................................................99Table 76: Direct Transit ..................................................................................................... 100Table 77: Direct Parks, Recreation and Culture ................................................................ 103Table 78: Other Parks ........................................................................................................ 104Table 79: Direct Parks, Recreation and Culture ................................................................ 104

2008 Municipal Sustainability Report City of Powell River
FITZGERALD, STICKELMANN
162 | P a g e
Table 80: Direct Arena ....................................................................................................... 107Table 81: Direct Recreation Complex ................................................................................. 110Table 82: Distribution of Time - Summary ........................................................................ 115Table 83: Total Jobs by Property Classification ................................................................ 118Table 84: All Non-Residential Jobs .................................................................................... 119Table 85: Non-Residential Jobs (Excluding Utilities and Managed Forest) .................... 119Table 86: Non-Residential Jobs (Exc. Class 2, 4 and 7) ..................................................... 119Table 87: Powell River Commuting Flows ......................................................................... 120Table 88: Place of Residence Within Powell River ............................................................ 121Table 89: Place of Work Within Powell River .................................................................... 121Table 90: Weighted Average Straight-Line Commuting Distance .................................... 122Table 91: Commuting by Road Type .................................................................................. 123Table 92: Human Resources ............................................................................................... 124Table 93: Protective Services ............................................................................................. 125Table 94: Road Use ............................................................................................................. 126Table 95: Estimate of Vehicles ........................................................................................... 127Table 96: Estimated Vehicle Commuting Mileage ............................................................ 128Table 97: Estimated Other Business Trips ........................................................................ 128Table 98: Transit Use ......................................................................................................... 129Table 99: Truck Mileage ..................................................................................................... 130Table 100: Building Inspections ........................................................................................... 131Table 101: Permits Issued .................................................................................................... 132Table 102: Permits as a Percentage of Totals ...................................................................... 132Table 103: Full Time Equivalent Employees by APM ......................................................... 133Table 104: Estimate of Transit Kilometres .......................................................................... 135Table 105: Assessment Occurrences .................................................................................... 136Table 106: Total Assessment Values .................................................................................... 137Table 107: Assessment Land Values .................................................................................... 138Table 108: Assessment Improvement Values ...................................................................... 139Table 109: Taxes Paid (2008) ............................................................................................... 140Table 110: Taxes Paid (2007) ............................................................................................... 141Table 111: Total Taxes Paid (2001 to 2008) ......................................................................... 142Table 112: Commuting Flows ............................................................................................... 143Table 113: Commuting Distance .......................................................................................... 144Table 114: Industry - City of Powell River ........................................................................... 145Table 115: Industry - Powell River Census Agglomeration ................................................. 146Table 116: Labour Force Activity ......................................................................................... 147Table 117: Modes of Transportation .................................................................................... 148Table 118: Occupation Statistics - City of Powell River ...................................................... 149Table 119: Occupation Statistics - Powell River Census Agglomeration ............................ 150Table 120: Place of Work - City of Powell River .................................................................. 151

2008 Municipal Sustainability Report City of Powell River
FITZGERALD, STICKELMANN
163 | P a g e
Table 121: Place of Work - Powell River Census Agglomeration ........................................ 152Table 122: Population Statistics .......................................................................................... 153

2008 Municipal Sustainability Report City of Powell River
FITZGERALD, STICKELMANN
164 | P a g e
9 BIBLIOGRAPHY
Bish, R. L. (September, 2004 ). Property Taxes on Business and Industrial Property in British Columbia. Fraser Institute. Vancouver, British Columbia: Fraser Institute.
MMK Consulting, (January 5, 2007). Consumption of Tax Supported Municipal Services. Vancouver, British Columbia.
Kesselman, D. J. (2008). A Framework to Guide the Allocation of Municipal Property Taxes: Equity, Efficiency, and Economic Development. Vancouver.
KPMG. (March 17, 1995). Study of Consumption of Tax Supported City Services - Volume II - Appendices. Vancouver, British Columbia: City of Vancouver.
Vander Ploeg, C. G. (November 2008). Problematic Property Tax: Why the Property Tax Fails to Measure Up and What to Do About It. Canada West Foundation. Calgary, Alberta: Canada West Foundation.

2008 Municipal Sustainability Report City of Powell River
FITZGERALD, STICKELMANN
165 | P a g e
10 APPENDICES
10.1. Municipal Sustainability Model Framework
10.2. Consumption–based Percentage Allocations.
10.3. Consumption–based Dollar Allocations
10.4. Capital and Carry Forward Percentage Allocations
10.5 Capital and Carry Forward Dollar Allocations
10.6. Phase 1 – Volume III Powell River Statistics (Partially Updated for 2008)
10.7. Distribution of Time (Detail Calculation)