Embed Size (px)
Citation preview
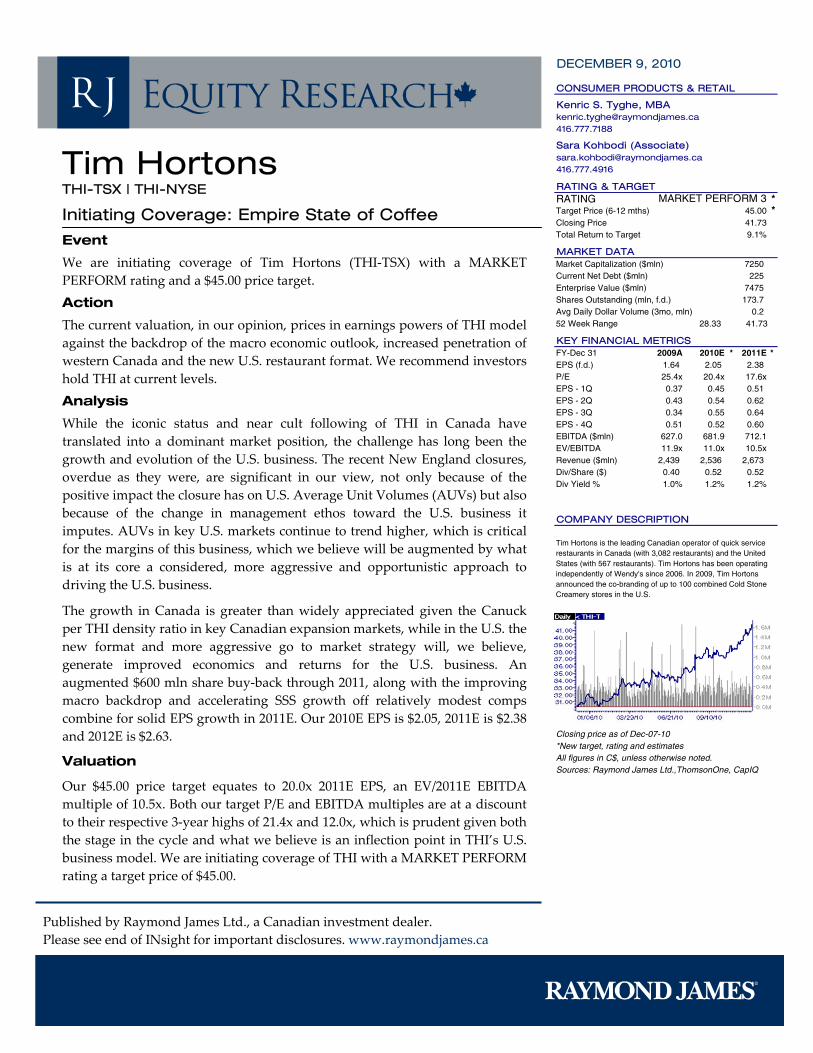
Published by Raymond James Ltd., a Canadian investment dealer. Please see end of INsight for important disclosures. www.raymondjames.ca
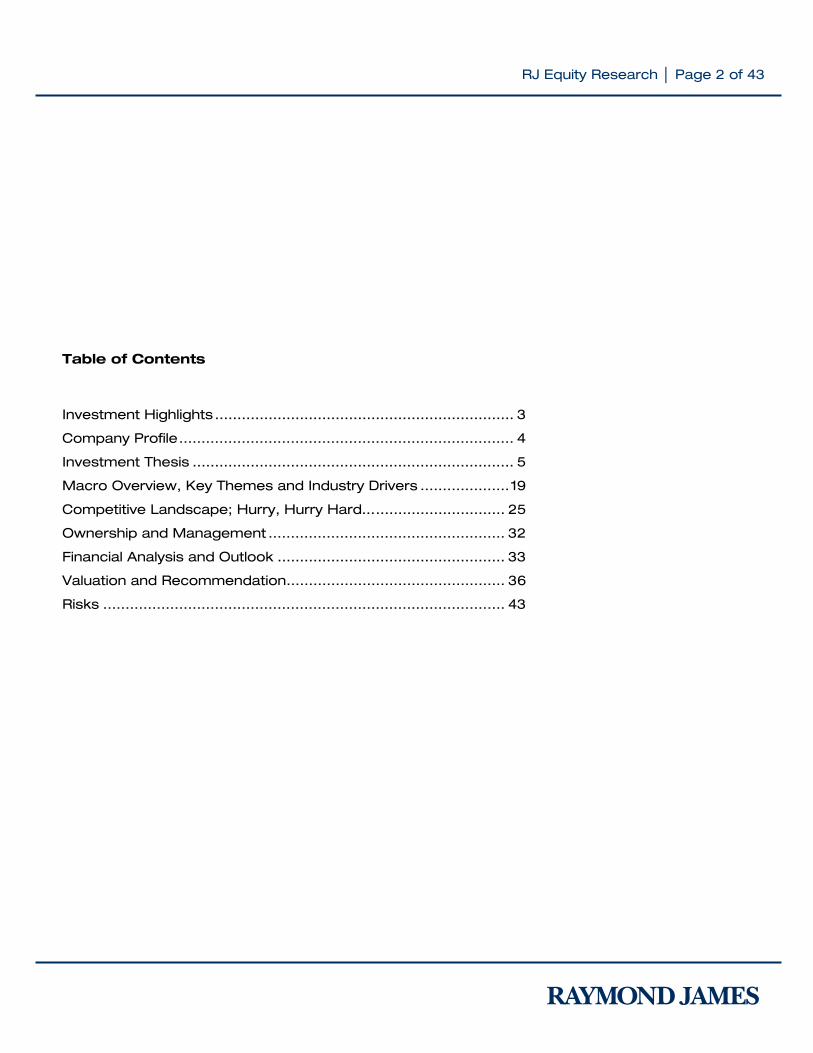
DECEMBER 9, 2010
Tim Hortons THI-TSX | THI-NYSE
Initiating Coverage: Empire State of Coffee
Event
We are initiating coverage of Tim Hortons (THI‐TSX) with a MARKET PERFORM rating and a $45.00 price target. Action
The current valuation, in our opinion, prices in earnings powers of THI model against the backdrop of the macro economic outlook, increased penetration of western Canada and the new U.S. restaurant format. We recommend investors hold THI at current levels. Analysis
While the iconic status and near cult following of THI in Canada have translated into a dominant market position, the challenge has long been the growth and evolution of the U.S. business. The recent New England closures, overdue as they were, are significant in our view, not only because of the positive impact the closure has on U.S. Average Unit Volumes (AUVs) but also because of the change in management ethos toward the U.S. business it imputes. AUVs in key U.S. markets continue to trend higher, which is critical for the margins of this business, which we believe will be augmented by what is at its core a considered, more aggressive and opportunistic approach to driving the U.S. business.
The growth in Canada is greater than widely appreciated given the Canuck per THI density ratio in key Canadian expansion markets, while in the U.S. the new format and more aggressive go to market strategy will, we believe, generate improved economics and returns for the U.S. business. An augmented $600 mln share buy‐back through 2011, along with the improving macro backdrop and accelerating SSS growth off relatively modest comps combine for solid EPS growth in 2011E. Our 2010E EPS is $2.05, 2011E is $2.38 and 2012E is $2.63.
Valuation
Our $45.00 price target equates to 20.0x 2011E EPS, an EV/2011E EBITDA multiple of 10.5x. Both our target P/E and EBITDA multiples are at a discount to their respective 3‐year highs of 21.4x and 12.0x, which is prudent given both the stage in the cycle and what we believe is an inflection point in THI’s U.S. business model. We are initiating coverage of THI with a MARKET PERFORM rating a target price of $45.00.
CONSUMER PRODUCTS & RETAIL
Kenric S. Tyghe, [email protected]
Sara Kohbodi (Associate)[email protected]
RATING & TARGETRATING *Target Price (6-12 mths) *Closing PriceTotal Return to Target 9.1%
MARKET DATAMarket Capitalization ($mln) 7250Current Net Debt ($mln) 225Enterprise Value ($mln) 7475Shares Outstanding (mln, f.d.) 173.7Avg Daily Dollar Volume (3mo, mln) 0.252 Week Range 28.33
KEY FINANCIAL METRICSFY-Dec 31 2009A 2010E * 2011E *EPS (f.d.) 1.64 2.05 2.38 P/E 25.4x 20.4x 17.6xEPS - 1Q 0.37 0.45 0.51 EPS - 2Q 0.43 0.54 0.62 EPS - 3Q 0.34 0.55 0.64 EPS - 4Q 0.51 0.52 0.60 EBITDA ($mln) 627.0 681.9 712.1EV/EBITDA 11.9x 11.0x 10.5xRevenue ($mln) 2,439 2,536 2,673 Div/Share ($) 0.40 0.52 0.52 Div Yield % 1.0% 1.2% 1.2%
COMPANY DESCRIPTION
Closing price as of Dec-07-10*New target, rating and estimatesAll figures in C$, unless otherwise noted.Sources: Raymond James Ltd.,ThomsonOne, CapIQ
MARKET PERFORM 3
Tim Hortons is the leading Canadian operator of quick service restaurants in Canada (with 3,082 restaurants) and the United States (with 567 restaurants). Tim Hortons has been operating independently of Wendy's since 2006. In 2009, Tim Hortons announced the co-branding of up to 100 combined Cold Stone Creamery stores in the U.S.
45.0041.73
Publishing will insert chart here
41.73
RJ Equity Research │ Page 2 of 43
Table of Contents
Investment Highlights ................................................................... 3 Company Profile........................................................................... 4 Investment Thesis ........................................................................ 5 Macro Overview, Key Themes and Industry Drivers .................... 19 Competitive Landscape; Hurry, Hurry Hard…............................. 25 Ownership and Management ..................................................... 32 Financial Analysis and Outlook ................................................... 33 Valuation and Recommendation................................................. 36 Risks .......................................................................................... 43
RJ Equity Research │ Page 3 of 43
Investment Highlights
Empire State of Mind in New York, New York
The positive evolution of a more aggressive approach by THI to U.S. growth markets is most evident in New York City (NYC) where an opportunistic play complimented the new strategy of layered openings, by seeding the brand and acting bigger than they are through guerrilla and blitz marketing to quickly build brand awareness. This is in stark contrast to THI’s previous strategy which was that of a build it and they will come approach in growth markets, which from 2007 to 2009 had increasingly translated into non‐standard units build with inherently less favourable economics (volumes are significantly lower and THI does not generally own the real estate).
New England Closures to Positively Impact U.S. Economics
The closure of 36 restaurants from the flawed 2004 Bess Eaton acquisition in New England (34 in the Providence and Hartford markets, and 2 in the Portland market) in addition to the closure of 18 non‐standard restaurants (kiosks) is a modest incremental positive. The positives are, we believe, the increased funds for (guerrilla) marketing of the higher AUV restaurants, generating further brand and market awareness. The negatives are the additional question marks the closures likely raise for some investors on the viability of THI’s U.S. expansion strategy outside of its core markets.
Back to (Baking) Basics; It’s a Bake Shop not a Doughnut Joint
A key element of the THI’s refined U.S. strategy is the redefinition of the brand as a café and bake shop, through an extensive reimaging of the stores and significant innovation and additions to the product offering. The new Tim Hortons’ Café and Bake Shop is worlds away from both the prototypical Canadian THI look and feel that we all know, and that of its key U.S. competitors, which we believe is a good thing in an otherwise crowded and relatively undifferentiated market.
Pass Through Commodity Pricing is not Pass Off Commodity Pricing
In terms of the commodity outlook, both coffee and wheat futures impute that further price increases will be necessary to maintain unit economics. We forecast that THI’s 6–12 month forward hedging program will partially mitigate the negative impact of the cost increase flow‐through on franchisee economics. However, while $30 mln in proceeds from the sale of THI’s interest in Maidstone Bakeries will ostensibly be used to recognize franchisees’ investment in, commitment to, and role as strategic customers of the bakery, it is likely, in our opinion, that it also has the benefit of helping restaurant owners mitigate higher commodity prices.
RJ Equity Research │ Page 4 of 43
Company Profile
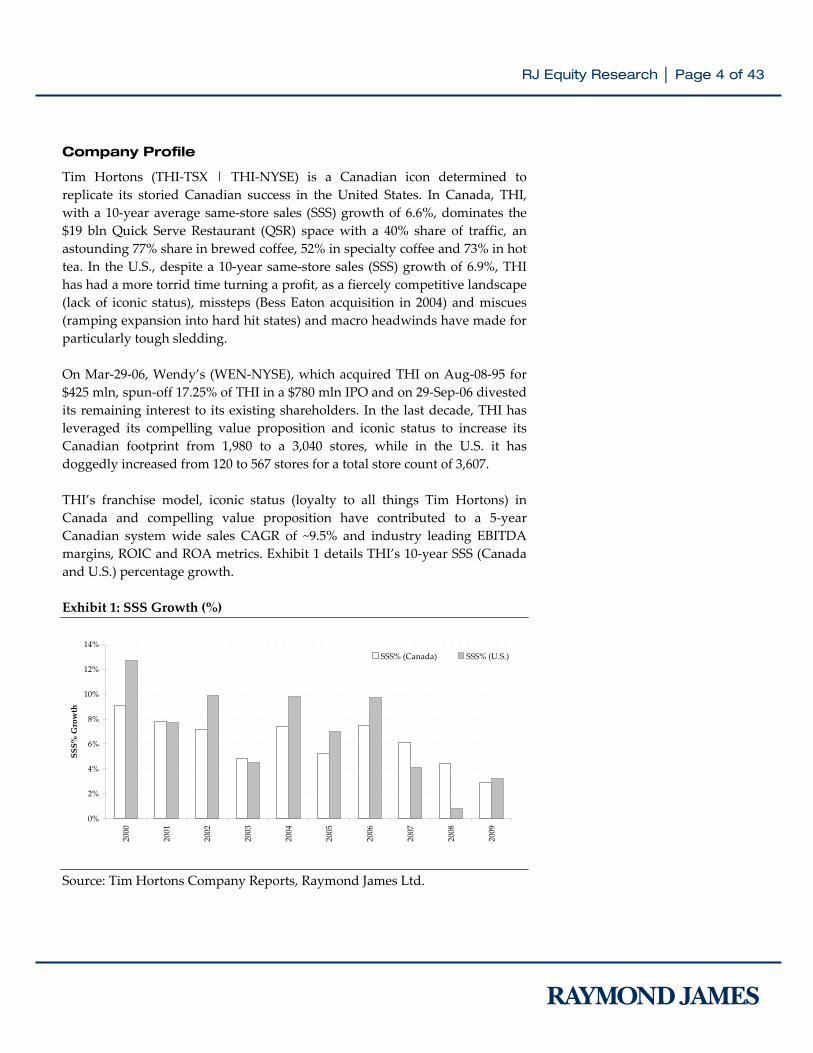
Tim Hortons (THI‐TSX | THI‐NYSE) is a Canadian icon determined to replicate its storied Canadian success in the United States. In Canada, THI, with a 10‐year average same‐store sales (SSS) growth of 6.6%, dominates the $19 bln Quick Serve Restaurant (QSR) space with a 40% share of traffic, an astounding 77% share in brewed coffee, 52% in specialty coffee and 73% in hot tea. In the U.S., despite a 10‐year same‐store sales (SSS) growth of 6.9%, THI has had a more torrid time turning a profit, as a fiercely competitive landscape (lack of iconic status), missteps (Bess Eaton acquisition in 2004) and miscues (ramping expansion into hard hit states) and macro headwinds have made for particularly tough sledding. On Mar‐29‐06, Wendy’s (WEN‐NYSE), which acquired THI on Aug‐08‐95 for $425 mln, spun‐off 17.25% of THI in a $780 mln IPO and on 29‐Sep‐06 divested its remaining interest to its existing shareholders. In the last decade, THI has leveraged its compelling value proposition and iconic status to increase its Canadian footprint from 1,980 to a 3,040 stores, while in the U.S. it has doggedly increased from 120 to 567 stores for a total store count of 3,607. THI’s franchise model, iconic status (loyalty to all things Tim Hortons) in Canada and compelling value proposition have contributed to a 5‐year Canadian system wide sales CAGR of ~9.5% and industry leading EBITDA margins, ROIC and ROA metrics. Exhibit 1 details THI’s 10‐year SSS (Canada and U.S.) percentage growth. Exhibit 1: SSS Growth (%) Source: Tim Hortons Company Reports, Raymond James Ltd.
0%
2%
4%
6%
8%
10%
12%
14%
2000
2001
2002
2003
2004
2005
2006
2007
2008
2009
SSS% Growth
SSS% (Canada) SSS% (U.S.)
RJ Equity Research │ Page 5 of 43
Investment Thesis
Franchise System and Economics; Core Strength
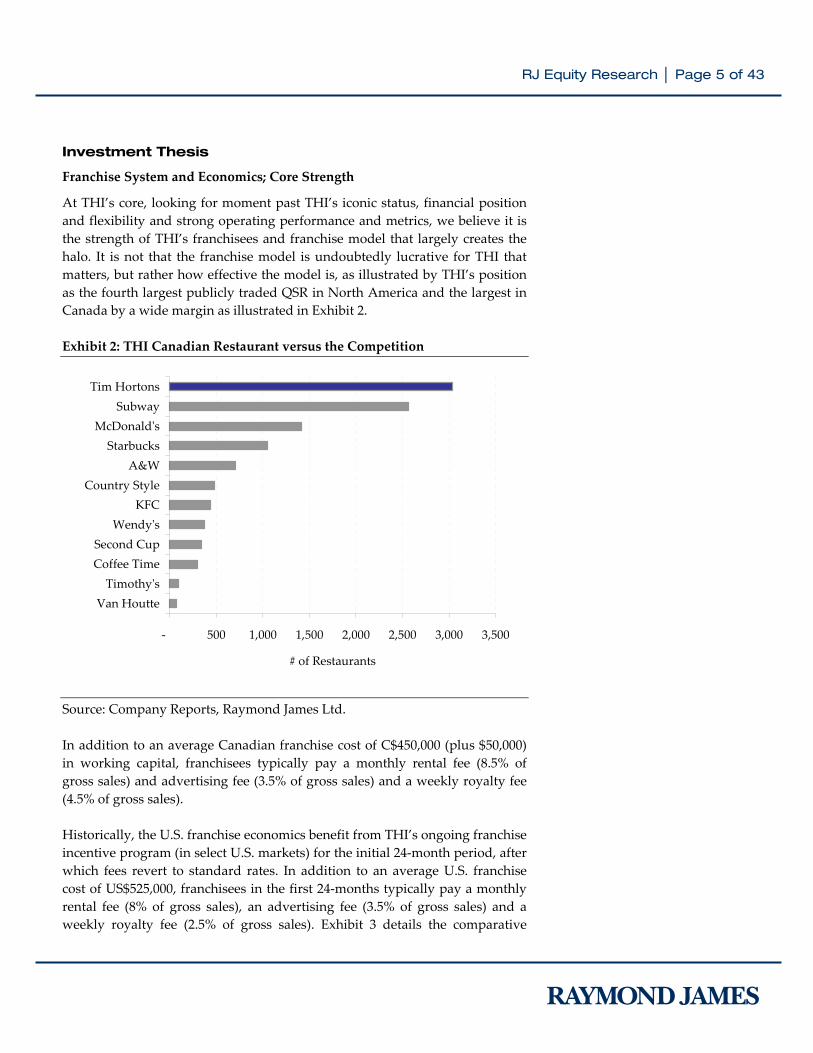
At THI’s core, looking for moment past THI’s iconic status, financial position and flexibility and strong operating performance and metrics, we believe it is the strength of THI’s franchisees and franchise model that largely creates the halo. It is not that the franchise model is undoubtedly lucrative for THI that matters, but rather how effective the model is, as illustrated by THI’s position as the fourth largest publicly traded QSR in North America and the largest in Canada by a wide margin as illustrated in Exhibit 2. Exhibit 2: THI Canadian Restaurant versus the Competition Source: Company Reports, Raymond James Ltd. In addition to an average Canadian franchise cost of C$450,000 (plus $50,000) in working capital, franchisees typically pay a monthly rental fee (8.5% of gross sales) and advertising fee (3.5% of gross sales) and a weekly royalty fee (4.5% of gross sales). Historically, the U.S. franchise economics benefit from THI’s ongoing franchise incentive program (in select U.S. markets) for the initial 24‐month period, after which fees revert to standard rates. In addition to an average U.S. franchise cost of US$525,000, franchisees in the first 24‐months typically pay a monthly rental fee (8% of gross sales), an advertising fee (3.5% of gross sales) and a weekly royalty fee (2.5% of gross sales). Exhibit 3 details the comparative
‐ 500 1,000 1,500 2,000 2,500 3,000 3,500
Van HoutteTimothyʹs
Coffee TimeSecond Cup
WendyʹsKFC
Country StyleA&W
StarbucksMcDonaldʹs
SubwayTim Hortons
# of Restaurants
RJ Equity Research │ Page 6 of 43
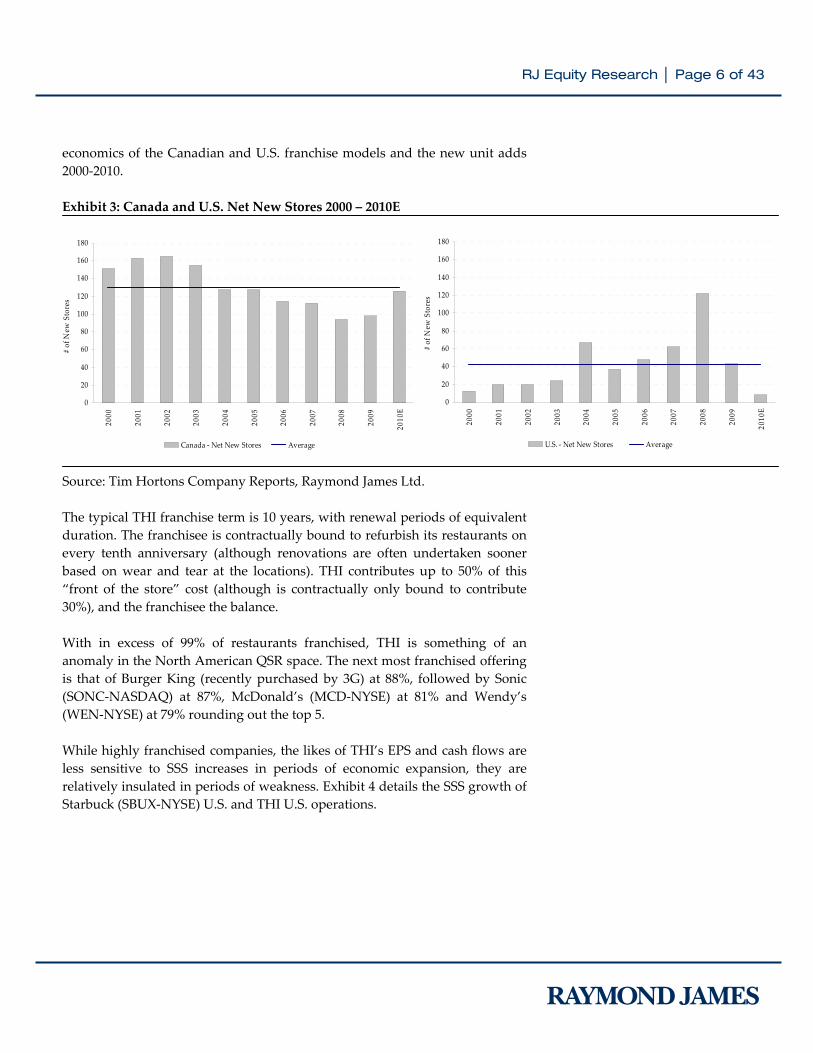
economics of the Canadian and U.S. franchise models and the new unit adds 2000‐2010. Exhibit 3: Canada and U.S. Net New Stores 2000 – 2010E Source: Tim Hortons Company Reports, Raymond James Ltd. The typical THI franchise term is 10 years, with renewal periods of equivalent duration. The franchisee is contractually bound to refurbish its restaurants on every tenth anniversary (although renovations are often undertaken sooner based on wear and tear at the locations). THI contributes up to 50% of this “front of the store” cost (although is contractually only bound to contribute 30%), and the franchisee the balance. With in excess of 99% of restaurants franchised, THI is something of an anomaly in the North American QSR space. The next most franchised offering is that of Burger King (recently purchased by 3G) at 88%, followed by Sonic (SONC‐NASDAQ) at 87%, McDonald’s (MCD‐NYSE) at 81% and Wendy’s (WEN‐NYSE) at 79% rounding out the top 5. While highly franchised companies, the likes of THI’s EPS and cash flows are less sensitive to SSS increases in periods of economic expansion, they are relatively insulated in periods of weakness. Exhibit 4 details the SSS growth of Starbuck (SBUX‐NYSE) U.S. and THI U.S. operations.
0
20
40
60
80
100
120
140
160
180
2000
2001
2002
2003
2004
2005
2006
2007
2008
2009
2010
E
Canada ‐ Net New Stores Average
0
20
40
60
80
100
120
140
160
180
2000
2001
2002
2003
2004
2005
2006
2007
2008
2009
2010
E
U.S. ‐ Net New Stores Average
# of N
ew Stores
# of N
ew Stores
RJ Equity Research │ Page 7 of 43
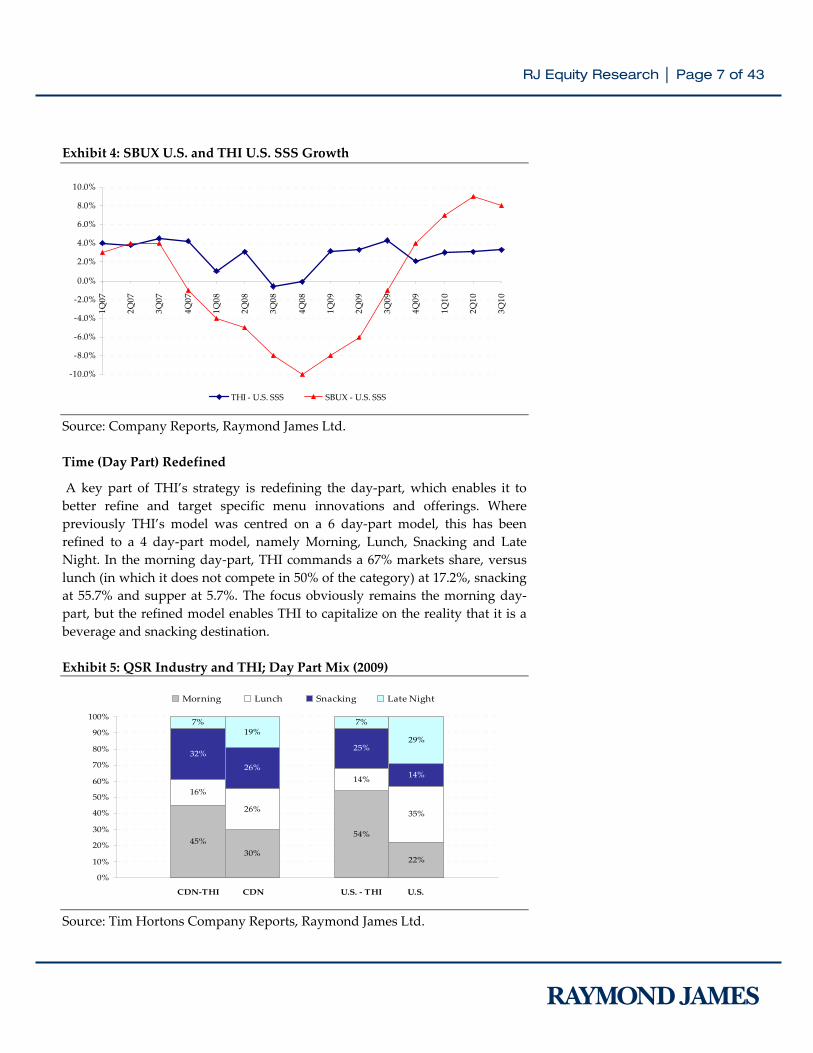
Exhibit 4: SBUX U.S. and THI U.S. SSS Growth Source: Company Reports, Raymond James Ltd. Time (Day Part) Redefined
A key part of THI’s strategy is redefining the day‐part, which enables it to better refine and target specific menu innovations and offerings. Where previously THI’s model was centred on a 6 day‐part model, this has been refined to a 4 day‐part model, namely Morning, Lunch, Snacking and Late Night. In the morning day‐part, THI commands a 67% markets share, versus lunch (in which it does not compete in 50% of the category) at 17.2%, snacking at 55.7% and supper at 5.7%. The focus obviously remains the morning day‐part, but the refined model enables THI to capitalize on the reality that it is a beverage and snacking destination. Exhibit 5: QSR Industry and THI; Day Part Mix (2009) Source: Tim Hortons Company Reports, Raymond James Ltd.
‐10.0%
‐8.0%
‐6.0%
‐4.0%
‐2.0%
0.0%
2.0%
4.0%
6.0%
8.0%
10.0%
1Q07
2Q07
3Q07
4Q07
1Q08
2Q08
3Q08
4Q08
1Q09
2Q09
3Q09
4Q09
1Q10
2Q10
3Q10
THI ‐ U.S. SSS SBUX ‐ U.S. SSS
45%30%
54%
22%
16%
26%
14%
35%
32%
26%
25%
14%
7%19%
7%
29%
0%
10%
20%
30%
40%
50%
60%
70%
80%
90%
100%
CDN‐THI CDN U.S. ‐ THI U.S.
Morning Lunch Snacking Late Night
RJ Equity Research │ Page 8 of 43
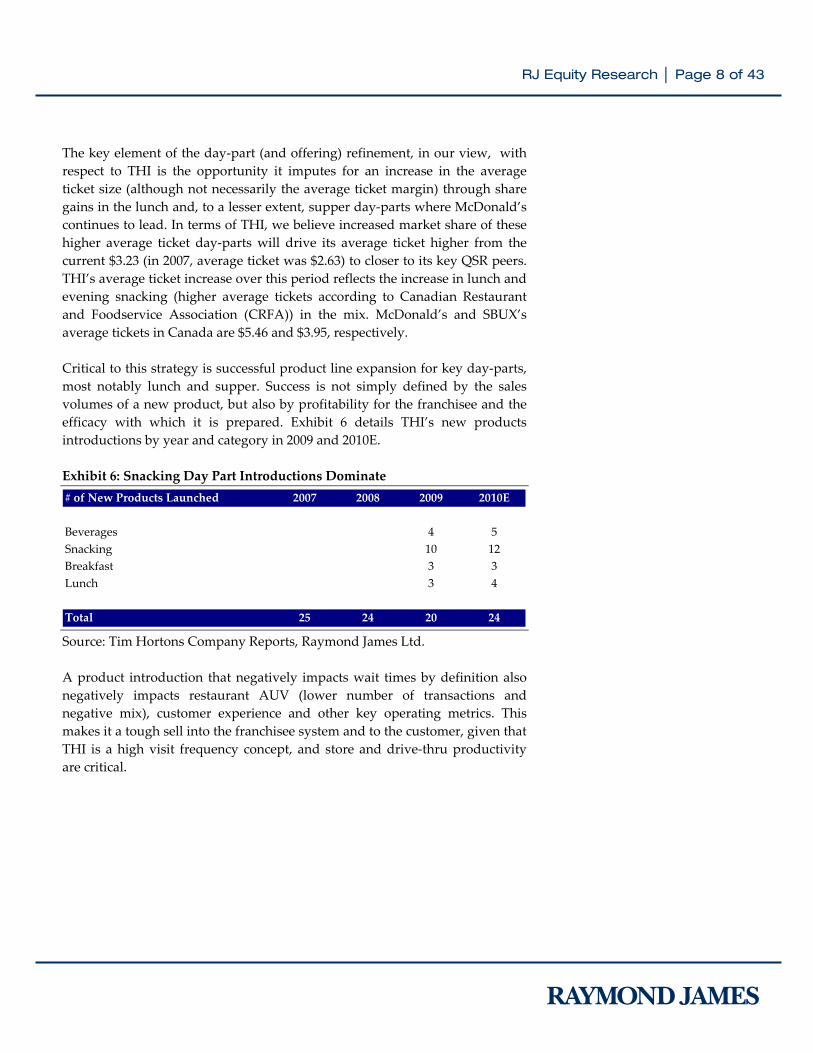
The key element of the day‐part (and offering) refinement, in our view, with respect to THI is the opportunity it imputes for an increase in the average ticket size (although not necessarily the average ticket margin) through share gains in the lunch and, to a lesser extent, supper day‐parts where McDonald’s continues to lead. In terms of THI, we believe increased market share of these higher average ticket day‐parts will drive its average ticket higher from the current $3.23 (in 2007, average ticket was $2.63) to closer to its key QSR peers. THI’s average ticket increase over this period reflects the increase in lunch and evening snacking (higher average tickets according to Canadian Restaurant and Foodservice Association (CRFA)) in the mix. McDonald’s and SBUX’s average tickets in Canada are $5.46 and $3.95, respectively. Critical to this strategy is successful product line expansion for key day‐parts, most notably lunch and supper. Success is not simply defined by the sales volumes of a new product, but also by profitability for the franchisee and the efficacy with which it is prepared. Exhibit 6 details THI’s new products introductions by year and category in 2009 and 2010E. Exhibit 6: Snacking Day Part Introductions Dominate Source: Tim Hortons Company Reports, Raymond James Ltd. A product introduction that negatively impacts wait times by definition also negatively impacts restaurant AUV (lower number of transactions and negative mix), customer experience and other key operating metrics. This makes it a tough sell into the franchisee system and to the customer, given that THI is a high visit frequency concept, and store and drive‐thru productivity are critical.
# of New Products Launched 2007 2008 2009 2010E
Beverages 4 5Snacking 10 12Breakfast 3 3Lunch 3 4
Total 25 24 20 24
RJ Equity Research │ Page 9 of 43
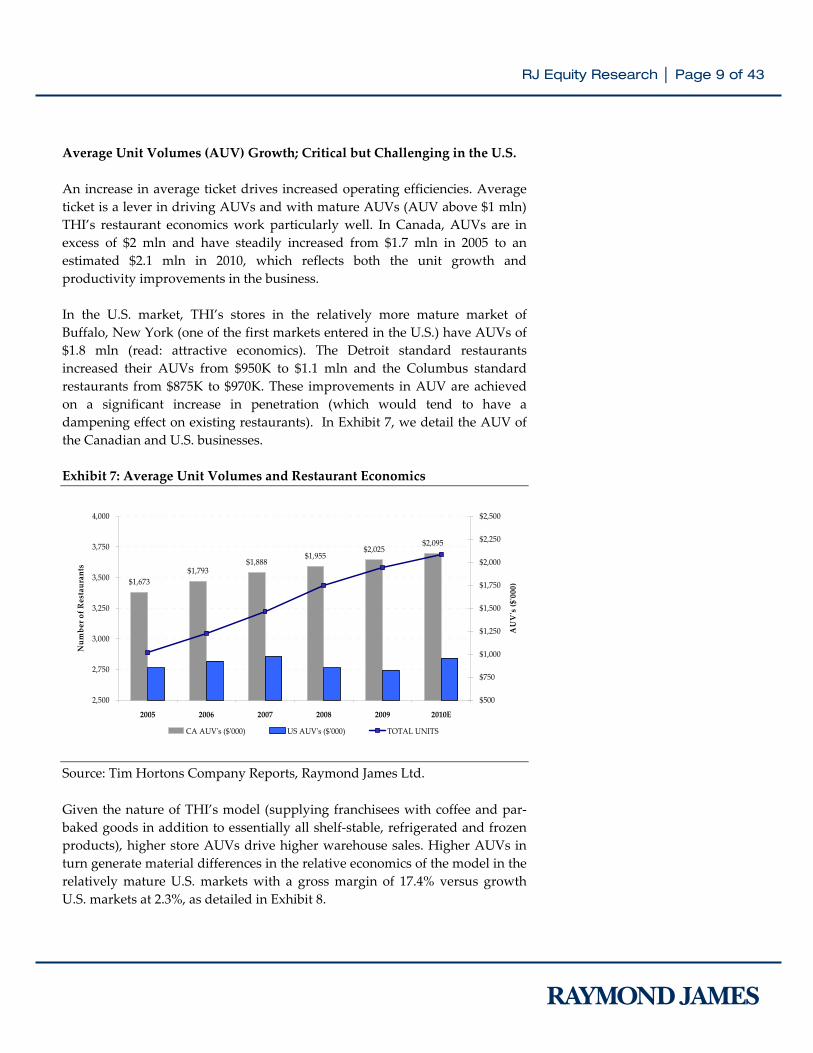
Average Unit Volumes (AUV) Growth; Critical but Challenging in the U.S. An increase in average ticket drives increased operating efficiencies. Average ticket is a lever in driving AUVs and with mature AUVs (AUV above $1 mln) THI’s restaurant economics work particularly well. In Canada, AUVs are in excess of $2 mln and have steadily increased from $1.7 mln in 2005 to an estimated $2.1 mln in 2010, which reflects both the unit growth and productivity improvements in the business. In the U.S. market, THI’s stores in the relatively more mature market of Buffalo, New York (one of the first markets entered in the U.S.) have AUVs of $1.8 mln (read: attractive economics). The Detroit standard restaurants increased their AUVs from $950K to $1.1 mln and the Columbus standard restaurants from $875K to $970K. These improvements in AUV are achieved on a significant increase in penetration (which would tend to have a dampening effect on existing restaurants). In Exhibit 7, we detail the AUV of the Canadian and U.S. businesses. Exhibit 7: Average Unit Volumes and Restaurant Economics Source: Tim Hortons Company Reports, Raymond James Ltd. Given the nature of THI’s model (supplying franchisees with coffee and par‐baked goods in addition to essentially all shelf‐stable, refrigerated and frozen products), higher store AUVs drive higher warehouse sales. Higher AUVs in turn generate material differences in the relative economics of the model in the relatively mature U.S. markets with a gross margin of 17.4% versus growth U.S. markets at 2.3%, as detailed in Exhibit 8.
$1,673$1,793
$1,888$1,955
$2,025$2,095
2,500
2,750
3,000
3,250
3,500
3,750
4,000
2005 2006 2007 2008 2009 2010E
Num
ber of Restaurants
$500
$750
$1,000
$1,250
$1,500
$1,750
$2,000
$2,250
$2,500AUVʹs ($ʹ000)
CA AUVʹs ($ʹ000) US AUVʹs ($ʹ000) TOTAL UNITS
RJ Equity Research │ Page 10 of 43
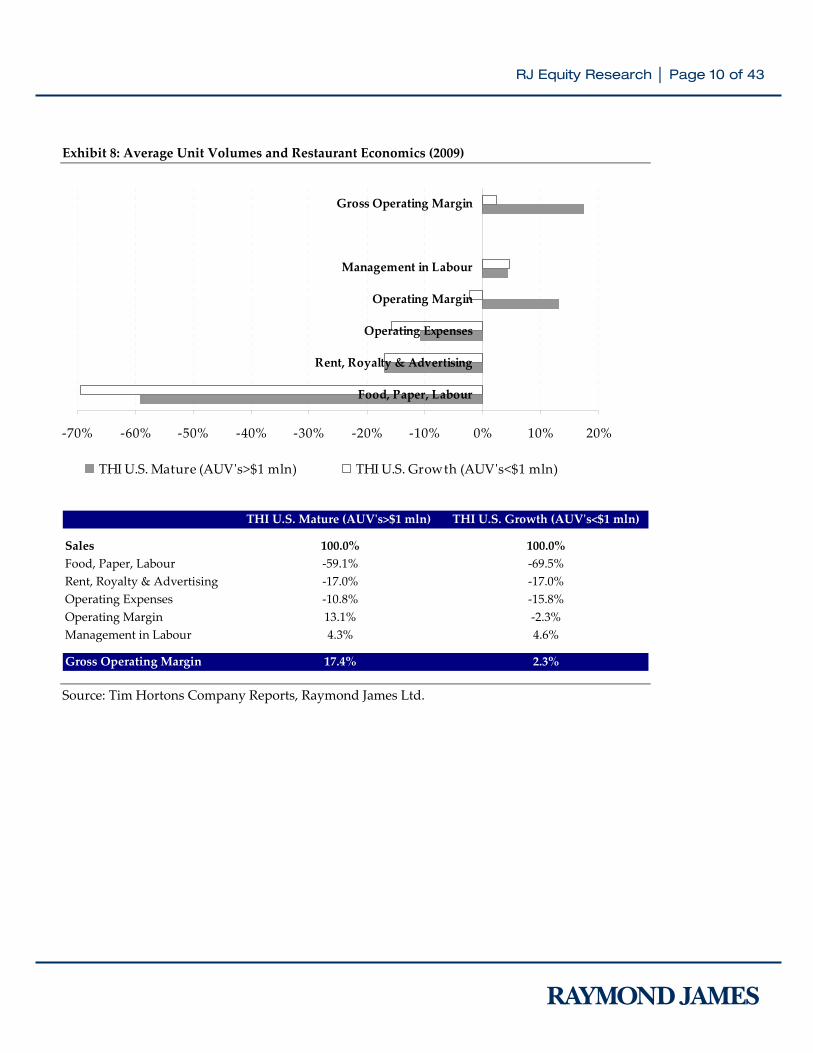
Exhibit 8: Average Unit Volumes and Restaurant Economics (2009) Source: Tim Hortons Company Reports, Raymond James Ltd.
‐70% ‐60% ‐50% ‐40% ‐30% ‐20% ‐10% 0% 10% 20%
Food, Paper, Labour
Rent, Royalty & Advertising
Operating Expenses
Operating Margin
Management in Labour
Gross Operating Margin
THI U.S. Mature (AUVʹs>$1 mln) THI U.S. Growth (AUVʹs<$1 mln)
THI U.S. Mature (AUVʹs>$1 mln) THI U.S. Growth (AUVʹs<$1 mln)
Sales 100.0% 100.0%Food, Paper, Labour ‐59.1% ‐69.5%Rent, Royalty & Advertising ‐17.0% ‐17.0%Operating Expenses ‐10.8% ‐15.8%Operating Margin 13.1% ‐2.3%Management in Labour 4.3% 4.6%
Gross Operating Margin 17.4% 2.3%
RJ Equity Research │ Page 11 of 43
The announcement, concurrent with the 3Q10 results release on Nov‐11‐10, of the closure of 36 restaurants from the flawed 2004 Bess Eaton acquisition in New England (34 in the Providence and Hartford markets, and 2 in the Portland market) in addition to the closure of 18 non‐standard restaurants (kiosks) is a modest incremental positive. The closed restaurants had cost THI $4.4 mln after tax year‐to‐date, compressing U.S. performance metrics and U.S. SSS growth performance by an estimated 50 bps to 3.3%. While the losses of the closed restaurants impute AUVs significantly below the U.S. average, the closure (while strategically significant) of 36 restaurants on a base of 621 (567 post closing) we believe will not move the needle on U.S. AUVs, the increase of which remains critical to THI improving the economics and returns of the U.S. footprint. The strategic significance and merit of the closures, however, should not be underestimated. The positives are, we believe, the increased funds for marketing (guerrilla) of the higher AUV restaurants, generating further brand and market awareness. The negatives are the additional question marks the closures likely raise for some investors on the viability of THI’s U.S. expansion strategy outside of its core markets, at a time when THI is embarking on an ambitious repositioning of its offering in the U.S. THI expects to incur costs associated with the closures of $50.9 mln of which a $20.9 mln asset impairment charge was taken in 3Q10, with an additional largely cash charge of some $30 mln related to the lease termination and other location closing costs to be taken in a reduction of revenues in 4Q10E. Go West Tim(my), Go West? With a plan to open approximately 1,000 more stores (of which some 600 are targeted to be added through 2013) in Canada from 2011 forward (largely concentrated in Quebec and the West), THI is targeting a coast‐to‐coast Tim’s‐per‐Canuck ratio of 1:8,200 (which aligns with the current density in Ontario). In the U.S. where THI had 567 stores as of November 2010), they plan to build an additional 300 stores through 2013. The unit expansion targets in Canada appear aggressive at first blush, given that although SSS growth has a 10‐year CAGR of 6.6%, it is on a downward trend, from 9% in 2000 to 3% (with essentially no pricing lift) in 2009. What is missed at first blush is that the store density of THI in key markets in Canada denotes significant further opportunity (even in major urban areas).
RJ Equity Research │ Page 12 of 43
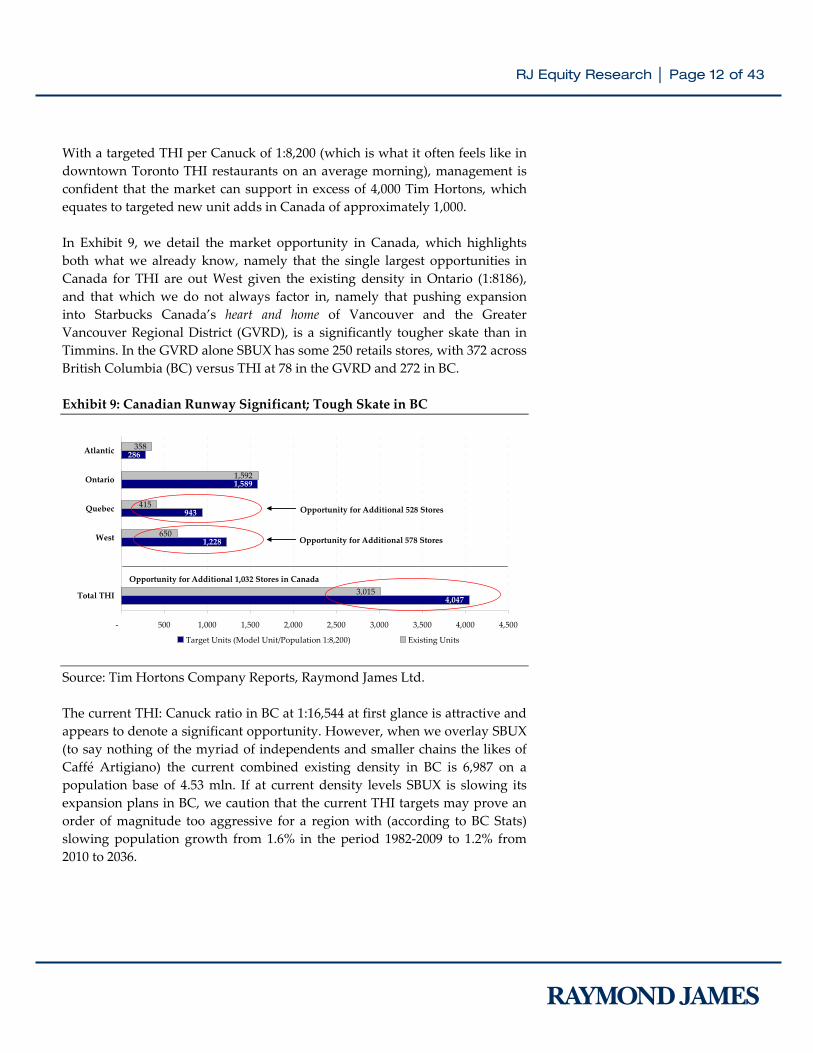
With a targeted THI per Canuck of 1:8,200 (which is what it often feels like in downtown Toronto THI restaurants on an average morning), management is confident that the market can support in excess of 4,000 Tim Hortons, which equates to targeted new unit adds in Canada of approximately 1,000. In Exhibit 9, we detail the market opportunity in Canada, which highlights both what we already know, namely that the single largest opportunities in Canada for THI are out West given the existing density in Ontario (1:8186), and that which we do not always factor in, namely that pushing expansion into Starbucks Canada’s heart and home of Vancouver and the Greater Vancouver Regional District (GVRD), is a significantly tougher skate than in Timmins. In the GVRD alone SBUX has some 250 retails stores, with 372 across British Columbia (BC) versus THI at 78 in the GVRD and 272 in BC. Exhibit 9: Canadian Runway Significant; Tough Skate in BC Source: Tim Hortons Company Reports, Raymond James Ltd. The current THI: Canuck ratio in BC at 1:16,544 at first glance is attractive and appears to denote a significant opportunity. However, when we overlay SBUX (to say nothing of the myriad of independents and smaller chains the likes of Caffé Artigiano) the current combined existing density in BC is 6,987 on a population base of 4.53 mln. If at current density levels SBUX is slowing its expansion plans in BC, we caution that the current THI targets may prove an order of magnitude too aggressive for a region with (according to BC Stats) slowing population growth from 1.6% in the period 1982‐2009 to 1.2% from 2010 to 2036.
4,047
1,228
943
1,589
286
3,015
650
415
1,592
358
‐ 500 1,000 1,500 2,000 2,500 3,000 3,500 4,000 4,500
Total THI
West
Quebec
Ontario
Atlantic
Target Units (Model Unit/Population 1:8,200) Existing Units
Opportunity for Additional 578 Stores
Opportunity for Additional 528 Stores
Opportunity for Additional 1,032 Stores in Canada
RJ Equity Research │ Page 13 of 43
Bake‐off in Buffalo and Beyond In the States, it is battling entrenched, all‐American brands that have many more locations per capita there than they do in Canada, including McDonald’s, 7‐Eleven, Starbucks and, most notably, the 6,400‐strong Dunkin’ Donuts chain. The U.S. expansion from 2007 through 2009 and early 2010 augmented by opportunistic non‐standard units deals with the likes of Tops to build out the brand despite the inherently less favourable economics (volumes are significantly lower and THI does not generally own the real estate) of these units. Headlining the bias in this period toward non‐standard unit build was the October 2008 announcement of a joint venture with U.S. supermarket group, Tops Markets LLC (Tops) which was acquired from Ahold (AH‐ENXTAM) by Morgan Stanley Private Equity for $310 mln in December 2007. THI’s agreement with Tops saw the deployment of 82 THI locations into Tops stores across Western New York, Rochester, Central New York and North‐western Pennsylvania. Of the 82 locations, 62 were self‐serve kiosks (a number of these have since morphed into full‐service restaurants). As such, the expansion was footprint light as the non‐standard new unit adds do not generate anything approaching the AUVs of full service THI restaurants. The THI deal with former Ahold subsidiary Tops is interesting in that it mirrors a deal concluded between Starbucks (SBUX‐NYSE) and Ahold in 2006, when Ahold’s U.S. subsidiary, Stop & Shop and its Giant food affiliate, signed a contract with Starbucks, placing the coffee shop chainʹs licensed stores inside certain supermarkets. The majority of Stop & Shop stores had since 2002 featured Dunkin’ Donuts outlets inside the store. In August 2009, Stop & Shop announced closures and re‐brandings of 43 (26 Stop and Shop and 17 Giant Foods) of the licensed Starbucks kiosks opened in 2006. After the 2009 closures 56 kiosks remained, which were augmented by the addition of 5‐new stores in late 2009 for a current total of 61 kiosks. In stark contrast to its development approach through 2009, THI detailed a new U.S. go to market strategy in early 2010. The new strategy involves a rebranding and repositioning of THI in the U.S. as a Café and Bake Shop. The future openings of the concept restaurant would selectively look at the most important of the drivers in an iterative build, relative to the specific market opportunity. Exhibit 10 details the new THI U.S. store signage and logo.
RJ Equity Research │ Page 14 of 43
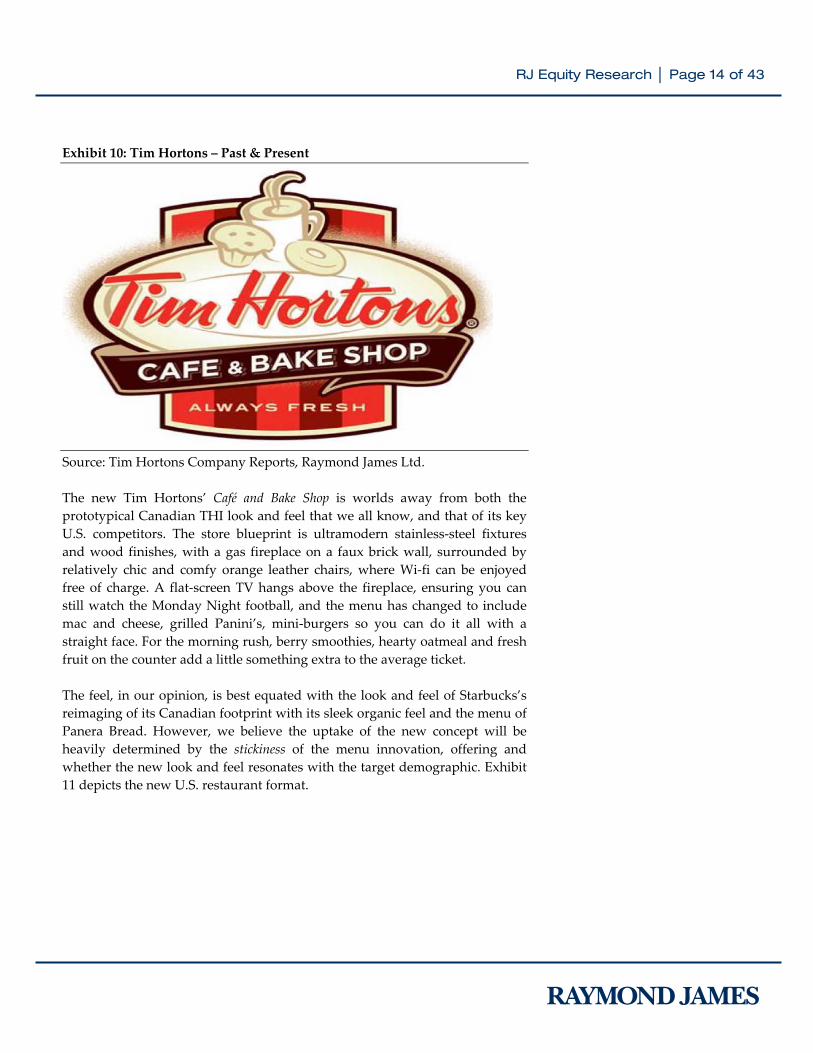
Exhibit 10: Tim Hortons – Past & Present Source: Tim Hortons Company Reports, Raymond James Ltd. The new Tim Hortons’ Café and Bake Shop is worlds away from both the prototypical Canadian THI look and feel that we all know, and that of its key U.S. competitors. The store blueprint is ultramodern stainless‐steel fixtures and wood finishes, with a gas fireplace on a faux brick wall, surrounded by relatively chic and comfy orange leather chairs, where Wi‐fi can be enjoyed free of charge. A flat‐screen TV hangs above the fireplace, ensuring you can still watch the Monday Night football, and the menu has changed to include mac and cheese, grilled Panini’s, mini‐burgers so you can do it all with a straight face. For the morning rush, berry smoothies, hearty oatmeal and fresh fruit on the counter add a little something extra to the average ticket. The feel, in our opinion, is best equated with the look and feel of Starbucks’s reimaging of its Canadian footprint with its sleek organic feel and the menu of Panera Bread. However, we believe the uptake of the new concept will be heavily determined by the stickiness of the menu innovation, offering and whether the new look and feel resonates with the target demographic. Exhibit 11 depicts the new U.S. restaurant format.
RJ Equity Research │ Page 15 of 43
Exhibit 11: THI New U.S. Restaurant Format Source: Tim Hortons Company Reports, Raymond James Ltd. What is apparent, and further highlighted by the New England closures, is that the old concept did not resonate (or at least not loudly enough) to drive the required AUVs and, to a lesser extent, that the brand (unlike the coffee) is more difficult to keep hot for an away game beyond Buffalo than THI believed. Against this backdrop, and the rollout of the new format, it is prescient to briefly recap the THI experience in the U.S. THI’s U.S. market experience since its opening foray in 1985 has at best been mixed. The AUVs and performance of markets close to home, the likes of Buffalo and Detroit, are solid. AUVs of Buffalo area restaurants on average exceed $1.8 mln (versus the U.S. average of roughly $1.0 mln). In highly competitive markets with limited brand recognition and insufficient scale to
RJ Equity Research │ Page 16 of 43
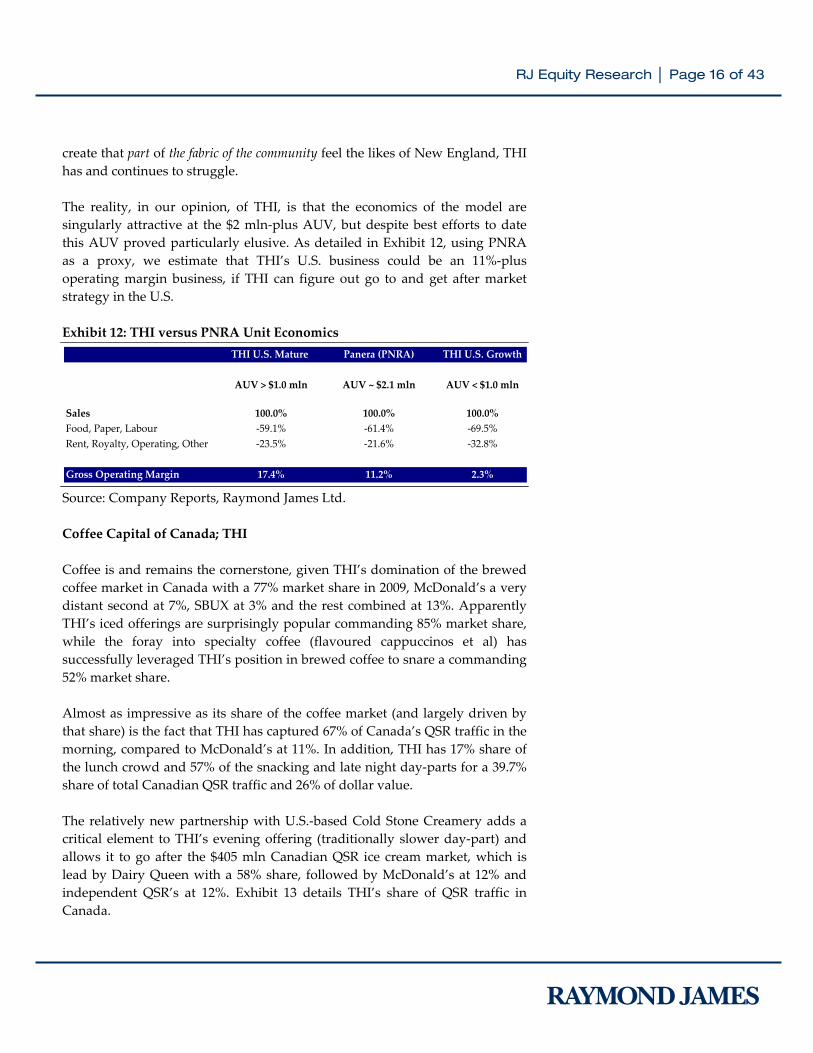
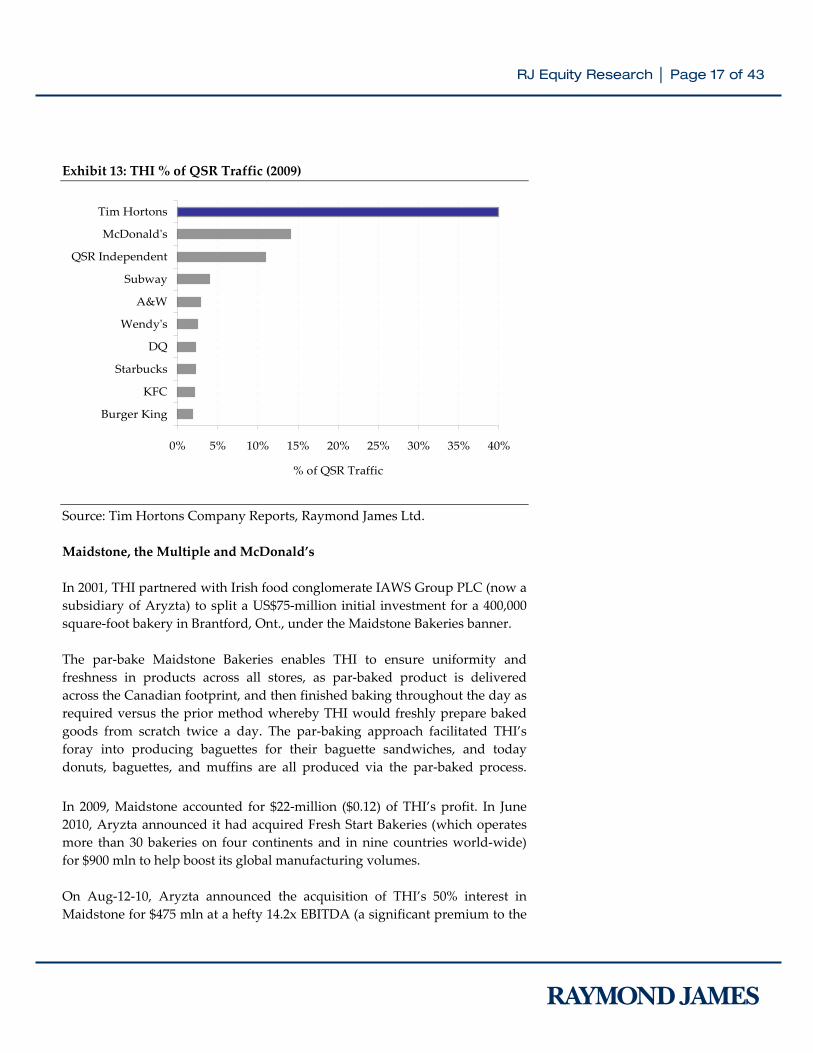
create that part of the fabric of the community feel the likes of New England, THI has and continues to struggle. The reality, in our opinion, of THI, is that the economics of the model are singularly attractive at the $2 mln‐plus AUV, but despite best efforts to date this AUV proved particularly elusive. As detailed in Exhibit 12, using PNRA as a proxy, we estimate that THI’s U.S. business could be an 11%‐plus operating margin business, if THI can figure out go to and get after market strategy in the U.S. Exhibit 12: THI versus PNRA Unit Economics Source: Company Reports, Raymond James Ltd. Coffee Capital of Canada; THI Coffee is and remains the cornerstone, given THI’s domination of the brewed coffee market in Canada with a 77% market share in 2009, McDonald’s a very distant second at 7%, SBUX at 3% and the rest combined at 13%. Apparently THI’s iced offerings are surprisingly popular commanding 85% market share, while the foray into specialty coffee (flavoured cappuccinos et al) has successfully leveraged THI’s position in brewed coffee to snare a commanding 52% market share. Almost as impressive as its share of the coffee market (and largely driven by that share) is the fact that THI has captured 67% of Canada’s QSR traffic in the morning, compared to McDonald’s at 11%. In addition, THI has 17% share of the lunch crowd and 57% of the snacking and late night day‐parts for a 39.7% share of total Canadian QSR traffic and 26% of dollar value. The relatively new partnership with U.S.‐based Cold Stone Creamery adds a critical element to THI’s evening offering (traditionally slower day‐part) and allows it to go after the $405 mln Canadian QSR ice cream market, which is lead by Dairy Queen with a 58% share, followed by McDonald’s at 12% and independent QSR’s at 12%. Exhibit 13 details THI’s share of QSR traffic in Canada.
THI U.S. Mature Panera (PNRA) THI U.S. Growth
AUV > $1.0 mln AUV ~ $2.1 mln AUV < $1.0 mln
Sales 100.0% 100.0% 100.0%Food, Paper, Labour ‐59.1% ‐61.4% ‐69.5%Rent, Royalty, Operating, Other ‐23.5% ‐21.6% ‐32.8%
Gross Operating Margin 17.4% 11.2% 2.3%
RJ Equity Research │ Page 17 of 43
Exhibit 13: THI % of QSR Traffic (2009) Source: Tim Hortons Company Reports, Raymond James Ltd. Maidstone, the Multiple and McDonald’s In 2001, THI partnered with Irish food conglomerate IAWS Group PLC (now a subsidiary of Aryzta) to split a US$75‐million initial investment for a 400,000 square‐foot bakery in Brantford, Ont., under the Maidstone Bakeries banner. The par‐bake Maidstone Bakeries enables THI to ensure uniformity and freshness in products across all stores, as par‐baked product is delivered across the Canadian footprint, and then finished baking throughout the day as required versus the prior method whereby THI would freshly prepare baked goods from scratch twice a day. The par‐baking approach facilitated THI’s foray into producing baguettes for their baguette sandwiches, and today donuts, baguettes, and muffins are all produced via the par‐baked process. In 2009, Maidstone accounted for $22‐million ($0.12) of THI’s profit. In June 2010, Aryzta announced it had acquired Fresh Start Bakeries (which operates more than 30 bakeries on four continents and in nine countries world‐wide) for $900 mln to help boost its global manufacturing volumes. On Aug‐12‐10, Aryzta announced the acquisition of THI’s 50% interest in Maidstone for $475 mln at a hefty 14.2x EBITDA (a significant premium to the
0% 5% 10% 15% 20% 25% 30% 35% 40%
Burger King
KFC
Starbucks
DQ
Wendyʹs
A&W
Subway
QSR Independent
McDonaldʹs
Tim Hortons
% of QSR Traffic
RJ Equity Research │ Page 18 of 43
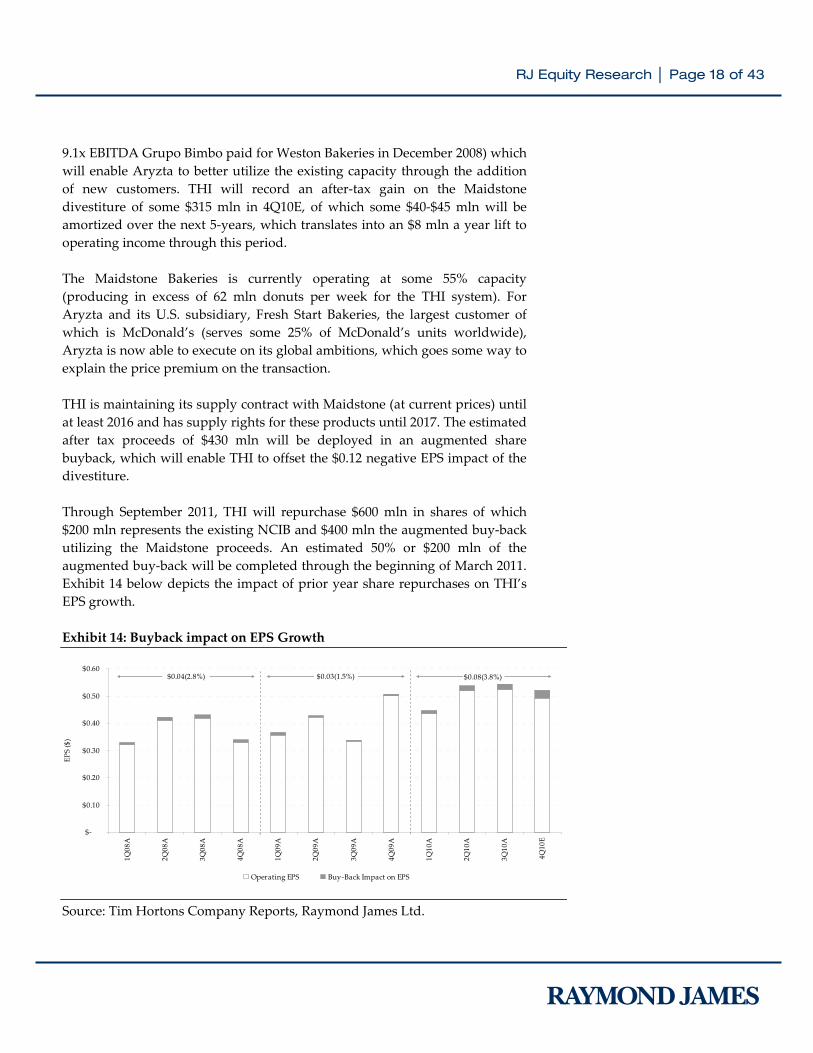
9.1x EBITDA Grupo Bimbo paid for Weston Bakeries in December 2008) which will enable Aryzta to better utilize the existing capacity through the addition of new customers. THI will record an after‐tax gain on the Maidstone divestiture of some $315 mln in 4Q10E, of which some $40‐$45 mln will be amortized over the next 5‐years, which translates into an $8 mln a year lift to operating income through this period. The Maidstone Bakeries is currently operating at some 55% capacity (producing in excess of 62 mln donuts per week for the THI system). For Aryzta and its U.S. subsidiary, Fresh Start Bakeries, the largest customer of which is McDonald’s (serves some 25% of McDonald’s units worldwide), Aryzta is now able to execute on its global ambitions, which goes some way to explain the price premium on the transaction. THI is maintaining its supply contract with Maidstone (at current prices) until at least 2016 and has supply rights for these products until 2017. The estimated after tax proceeds of $430 mln will be deployed in an augmented share buyback, which will enable THI to offset the $0.12 negative EPS impact of the divestiture. Through September 2011, THI will repurchase $600 mln in shares of which $200 mln represents the existing NCIB and $400 mln the augmented buy‐back utilizing the Maidstone proceeds. An estimated 50% or $200 mln of the augmented buy‐back will be completed through the beginning of March 2011. Exhibit 14 below depicts the impact of prior year share repurchases on THI’s EPS growth. Exhibit 14: Buyback impact on EPS Growth Source: Tim Hortons Company Reports, Raymond James Ltd.
$‐
$0.10
$0.20
$0.30
$0.40
$0.50
$0.60
1Q08
A
2Q08
A
3Q08
A
4Q08
A
1Q09
A
2Q09
A
3Q09
A
4Q09
A
1Q10
A
2Q10
A
3Q10
A
4Q10
E
Operating EPS Buy‐Back Impact on EPS
$0.04(2.8%) $0.03(1.5%) $0.08(3.8%)
EPS ($)
RJ Equity Research │ Page 19 of 43
Macro Overview, Key Themes and Industry Drivers
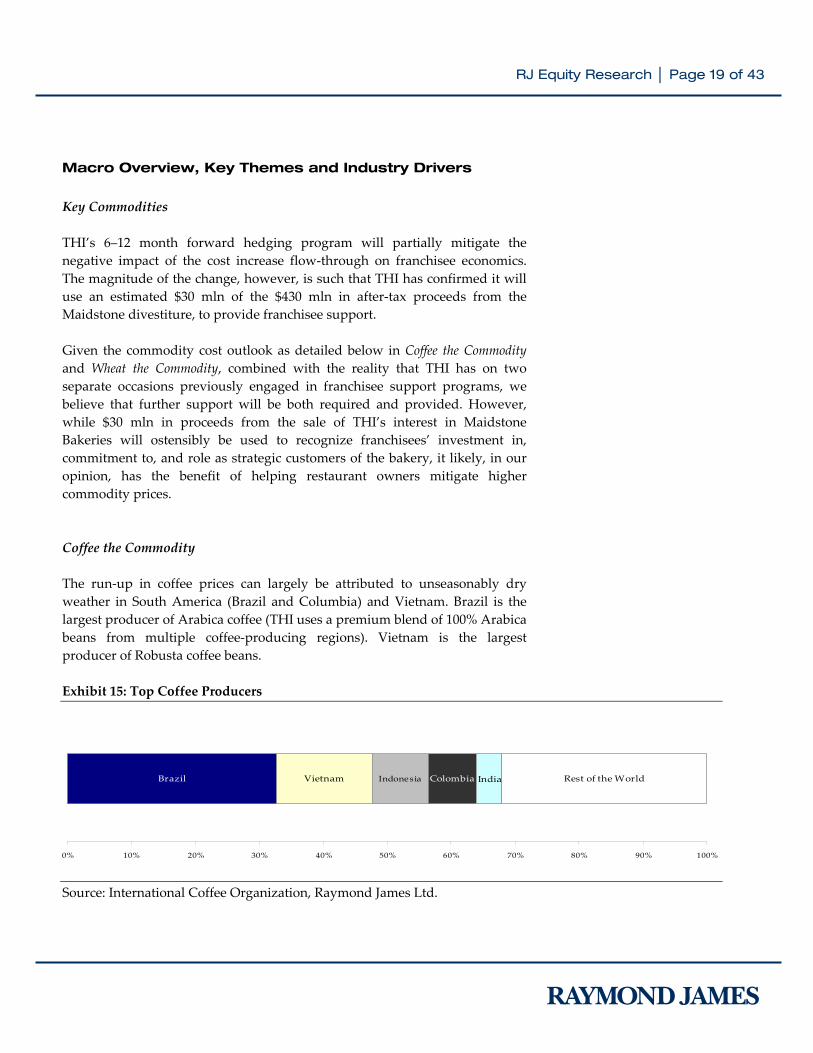
Key Commodities THI’s 6–12 month forward hedging program will partially mitigate the negative impact of the cost increase flow‐through on franchisee economics. The magnitude of the change, however, is such that THI has confirmed it will use an estimated $30 mln of the $430 mln in after‐tax proceeds from the Maidstone divestiture, to provide franchisee support. Given the commodity cost outlook as detailed below in Coffee the Commodity and Wheat the Commodity, combined with the reality that THI has on two separate occasions previously engaged in franchisee support programs, we believe that further support will be both required and provided. However, while $30 mln in proceeds from the sale of THI’s interest in Maidstone Bakeries will ostensibly be used to recognize franchisees’ investment in, commitment to, and role as strategic customers of the bakery, it likely, in our opinion, has the benefit of helping restaurant owners mitigate higher commodity prices. Coffee the Commodity The run‐up in coffee prices can largely be attributed to unseasonably dry weather in South America (Brazil and Columbia) and Vietnam. Brazil is the largest producer of Arabica coffee (THI uses a premium blend of 100% Arabica beans from multiple coffee‐producing regions). Vietnam is the largest producer of Robusta coffee beans. Exhibit 15: Top Coffee Producers Source: International Coffee Organization, Raymond James Ltd.
Brazil Vietnam Indonesia Colombia Rest of the World India
0% 10% 20% 30% 40% 50% 60% 70% 80% 90% 100%
1
RJ Equity Research │ Page 20 of 43
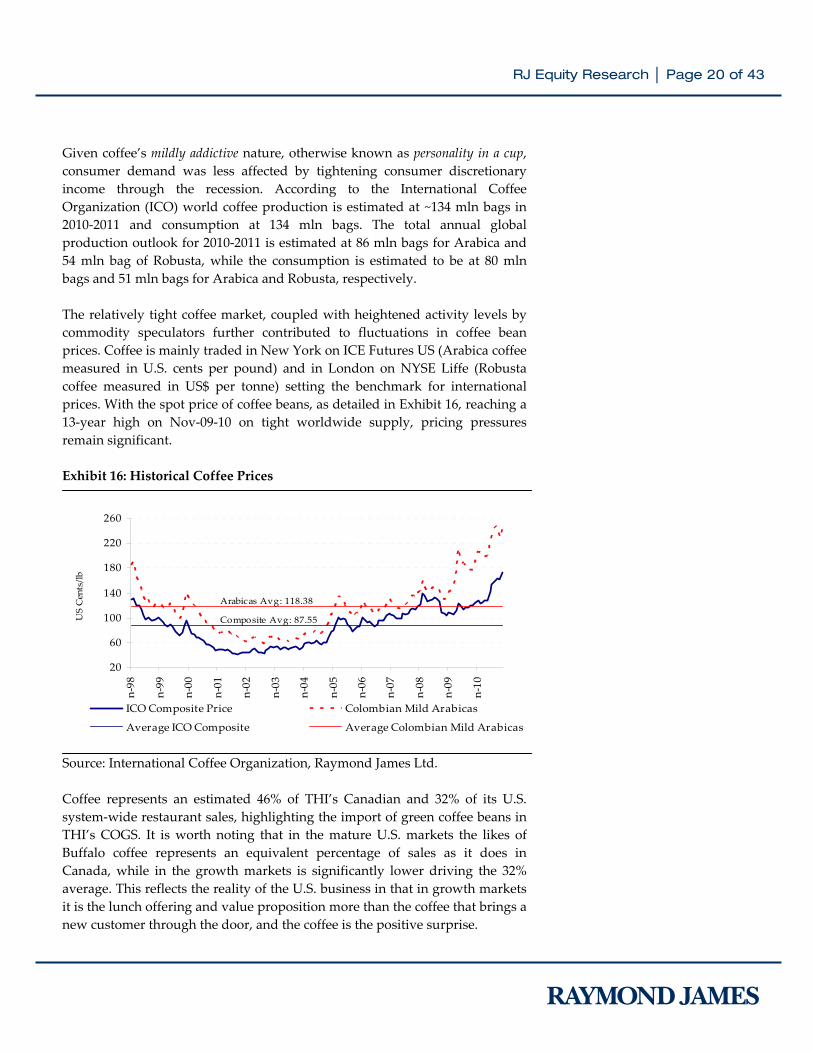
Given coffee’s mildly addictive nature, otherwise known as personality in a cup, consumer demand was less affected by tightening consumer discretionary income through the recession. According to the International Coffee Organization (ICO) world coffee production is estimated at ~134 mln bags in 2010‐2011 and consumption at 134 mln bags. The total annual global production outlook for 2010‐2011 is estimated at 86 mln bags for Arabica and 54 mln bag of Robusta, while the consumption is estimated to be at 80 mln bags and 51 mln bags for Arabica and Robusta, respectively. The relatively tight coffee market, coupled with heightened activity levels by commodity speculators further contributed to fluctuations in coffee bean prices. Coffee is mainly traded in New York on ICE Futures US (Arabica coffee measured in U.S. cents per pound) and in London on NYSE Liffe (Robusta coffee measured in US$ per tonne) setting the benchmark for international prices. With the spot price of coffee beans, as detailed in Exhibit 16, reaching a 13‐year high on Nov‐09‐10 on tight worldwide supply, pricing pressures remain significant. Exhibit 16: Historical Coffee Prices Source: International Coffee Organization, Raymond James Ltd. Coffee represents an estimated 46% of THI’s Canadian and 32% of its U.S. system‐wide restaurant sales, highlighting the import of green coffee beans in THI’s COGS. It is worth noting that in the mature U.S. markets the likes of Buffalo coffee represents an equivalent percentage of sales as it does in Canada, while in the growth markets is significantly lower driving the 32% average. This reflects the reality of the U.S. business in that in growth markets it is the lunch offering and value proposition more than the coffee that brings a new customer through the door, and the coffee is the positive surprise.
20
60
100
140
180
220
260
Jan‐98
Jan‐99
Jan‐00
Jan‐01
Jan‐02
Jan‐03
Jan‐04
Jan‐05
Jan‐06
Jan‐07
Jan‐08
Jan‐09
Jan‐10
ICO Composite Price Colombian Mild Arabicas
Average ICO Composite Average Colombian Mild Arabicas
Composite Avg: 87.55
Arabicas Avg: 118.38
US Cents/lb
RJ Equity Research │ Page 21 of 43
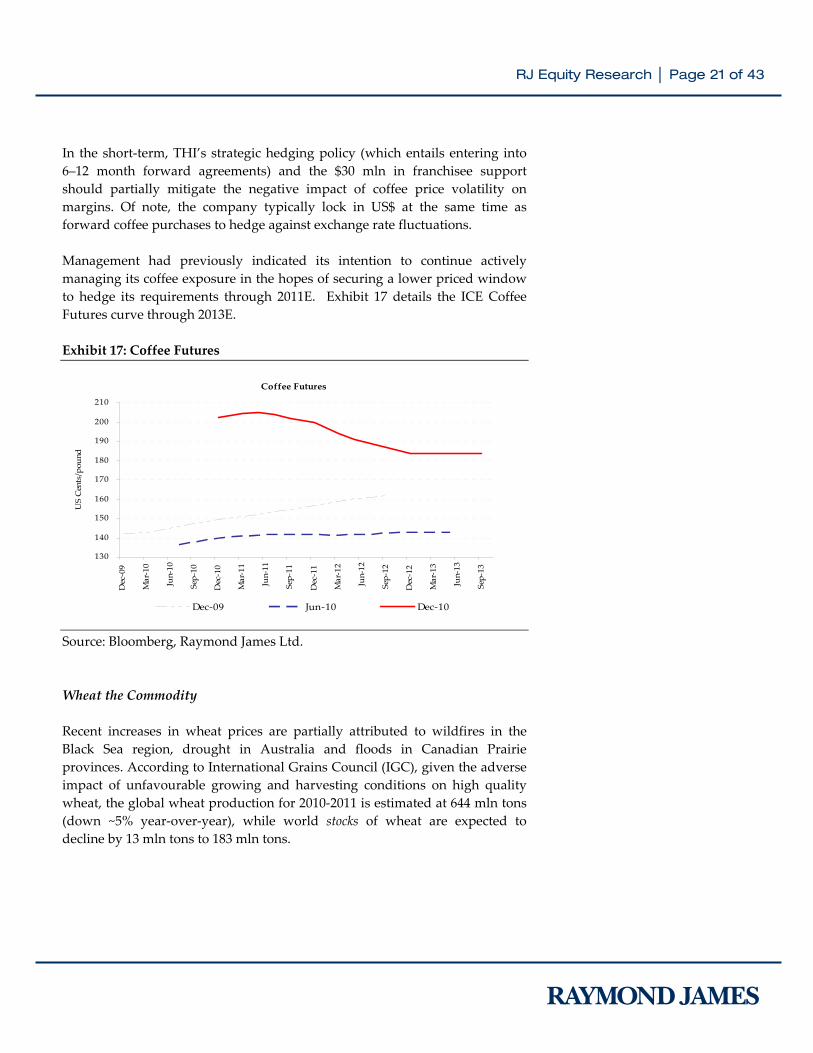
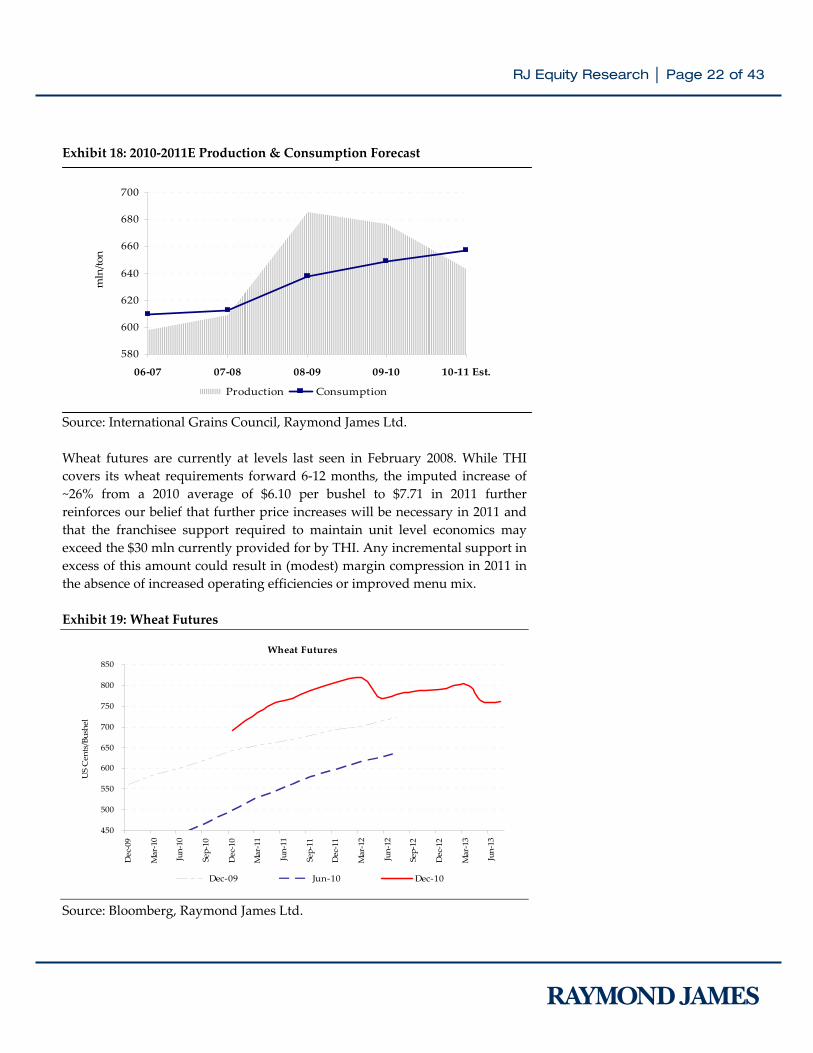
In the short‐term, THI’s strategic hedging policy (which entails entering into 6–12 month forward agreements) and the $30 mln in franchisee support should partially mitigate the negative impact of coffee price volatility on margins. Of note, the company typically lock in US$ at the same time as forward coffee purchases to hedge against exchange rate fluctuations. Management had previously indicated its intention to continue actively managing its coffee exposure in the hopes of securing a lower priced window to hedge its requirements through 2011E. Exhibit 17 details the ICE Coffee Futures curve through 2013E. Exhibit 17: Coffee Futures Source: Bloomberg, Raymond James Ltd. Wheat the Commodity Recent increases in wheat prices are partially attributed to wildfires in the Black Sea region, drought in Australia and floods in Canadian Prairie provinces. According to International Grains Council (IGC), given the adverse impact of unfavourable growing and harvesting conditions on high quality wheat, the global wheat production for 2010‐2011 is estimated at 644 mln tons (down ~5% year‐over‐year), while world stocks of wheat are expected to decline by 13 mln tons to 183 mln tons.
Coffee Futures
130
140
150
160
170
180
190
200
210
Dec‐09
Mar‐10
Jun‐10
Sep‐10
Dec‐10
Mar‐11
Jun‐11
Sep‐11
Dec‐11
Mar‐12
Jun‐12
Sep‐12
Dec‐12
Mar‐13
Jun‐13
Sep‐13
US Cents/pou
nd
Dec‐09 Jun‐10 Dec‐10
RJ Equity Research │ Page 22 of 43
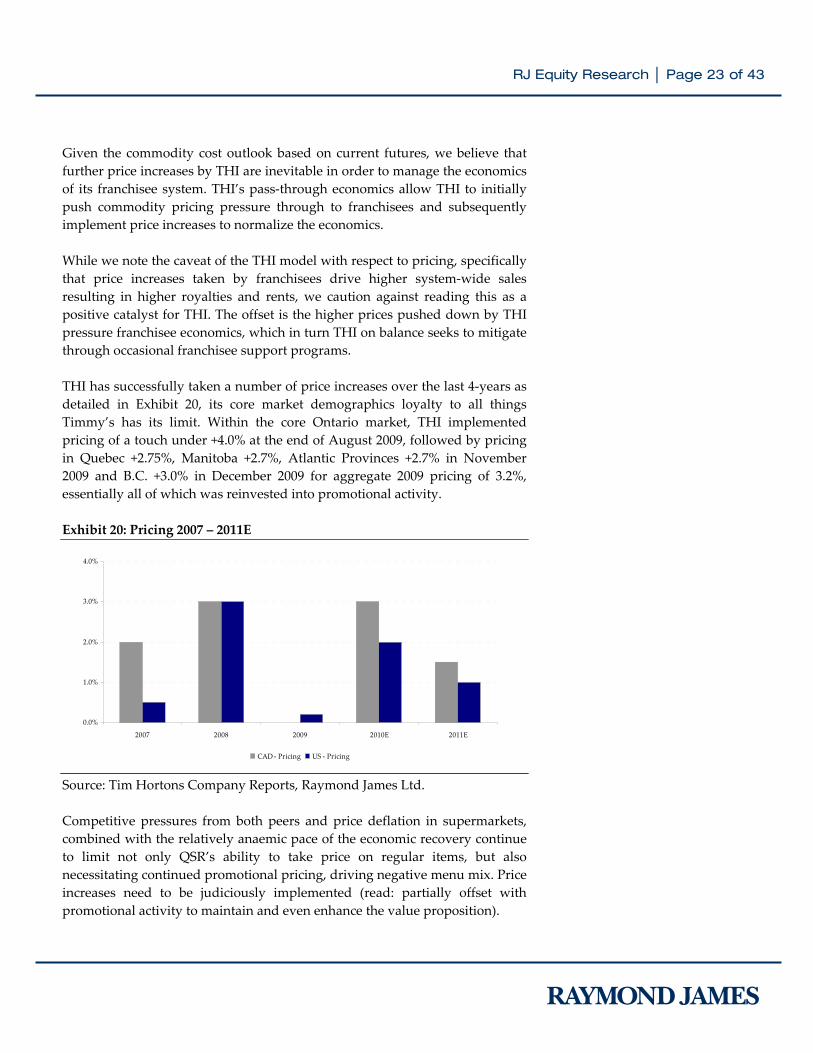
Exhibit 18: 2010‐2011E Production & Consumption Forecast Source: International Grains Council, Raymond James Ltd. Wheat futures are currently at levels last seen in February 2008. While THI covers its wheat requirements forward 6‐12 months, the imputed increase of ~26% from a 2010 average of $6.10 per bushel to $7.71 in 2011 further reinforces our belief that further price increases will be necessary in 2011 and that the franchisee support required to maintain unit level economics may exceed the $30 mln currently provided for by THI. Any incremental support in excess of this amount could result in (modest) margin compression in 2011 in the absence of increased operating efficiencies or improved menu mix. Exhibit 19: Wheat Futures Source: Bloomberg, Raymond James Ltd.
580
600
620
640
660
680
700
06‐07 07‐08 08‐09 09‐10 10‐11 Est.
Production Consumption
mln/ton
Wheat Futures
450
500
550
600
650
700
750
800
850
Dec‐09
Mar‐10
Jun‐10
Sep‐10
Dec‐10
Mar‐11
Jun‐11
Sep‐11
Dec‐11
Mar‐12
Jun‐12
Sep‐12
Dec‐12
Mar‐13
Jun‐13
US Cents/Bushel
Dec‐09 Jun‐10 Dec‐10
RJ Equity Research │ Page 23 of 43
Given the commodity cost outlook based on current futures, we believe that further price increases by THI are inevitable in order to manage the economics of its franchisee system. THI’s pass‐through economics allow THI to initially push commodity pricing pressure through to franchisees and subsequently implement price increases to normalize the economics. While we note the caveat of the THI model with respect to pricing, specifically that price increases taken by franchisees drive higher system‐wide sales resulting in higher royalties and rents, we caution against reading this as a positive catalyst for THI. The offset is the higher prices pushed down by THI pressure franchisee economics, which in turn THI on balance seeks to mitigate through occasional franchisee support programs. THI has successfully taken a number of price increases over the last 4‐years as detailed in Exhibit 20, its core market demographics loyalty to all things Timmy’s has its limit. Within the core Ontario market, THI implemented pricing of a touch under +4.0% at the end of August 2009, followed by pricing in Quebec +2.75%, Manitoba +2.7%, Atlantic Provinces +2.7% in November 2009 and B.C. +3.0% in December 2009 for aggregate 2009 pricing of 3.2%, essentially all of which was reinvested into promotional activity. Exhibit 20: Pricing 2007 – 2011E Source: Tim Hortons Company Reports, Raymond James Ltd. Competitive pressures from both peers and price deflation in supermarkets, combined with the relatively anaemic pace of the economic recovery continue to limit not only QSR’s ability to take price on regular items, but also necessitating continued promotional pricing, driving negative menu mix. Price increases need to be judiciously implemented (read: partially offset with promotional activity to maintain and even enhance the value proposition).
0.0%
1.0%
2.0%
3.0%
4.0%
2007 2008 2009 2010E 2011E
CAD ‐ Pricing US ‐ Pricing
RJ Equity Research │ Page 24 of 43
Coffee Consumption: Dynamics and Trends in Canada Coffee at Home is Growing; New Entrants are Aggressive. According to The Nielsen Company, at‐home coffee sales represent a $645 mln business growing at 6% in year‐to‐date in 2010 in Canada’s retail marketplace, building on the momentum of 7% growth in 2009. Roast and ground coffee lead the category, accounting for 75% of retail sales, supporting the thesis that when Canadians reach for their cuppa joe, they are more often reaching for a pot‐of‐joe. Sales of instant coffee also continue to perk, showing an increase of +5% over the past year. Canadian consumers are signalling that they want quality and convenience when it comes to their coffee fix. The Roast & Ground On‐Demand segment – single‐cup brew pods which allow consumers to bring the café experience into their own home – has become a hot coffee trend. This segment, while still minuscule within the context of the Canadian coffee market, has grown 81% to approximately $12.5 mln. In case we needed reminding, Nielson research reaffirms that “Canadians are serious about their coffee! Regardless of economic times, consumers have said they are not willing to change their java habit – indicating they are not likely to change brands, shop for deals, or pantry‐load this particular pleasure, no matter what”. Coffee Consumption: Dynamics and Trends in the U.S. In the U.S. instant coffee market, SBUX continues to see significant traction with its premium single serve VIA Ready Brew offering. A consumer penchant for convenient, single serve coffee options is further reinforced by the rapid proliferation of single serve coffee machines in the market, consumers trading up from 3‐serve to 12‐serve pack and SBUX noting that in F1Q10 VIA drove 2% of its average check increase. Coffee at Home is Growing; SBUX and SBC Lead as New Entrants Charge The distinctly premium segment focused, current SBUX offering in VIA and Seattle’s Best Coffee (SBC) brands have, however, struggled to maintain share in an increasingly competitive specialty coffee market. Dunkin’ Donuts has been particularly aggressive in this segment, rapidly expanding both distribution and advertising and building a market share that rivals SBUX. The brand recognition advantage in the U.S. market enjoyed by the likes of SBUX, SBC and Dunkin’ over THI has facilitated its competitors signing distribution agreements for their packaged coffee offering. SBC has recently concluded deals with Subway, Taco Bell, Burger King and AMC Movie
RJ Equity Research │ Page 25 of 43
Theatres, which will significantly boost distribution, and potentially stave off further market share gains in this segment by Dunkin’. THI simply does not have the brand recognition or footprint in the U.S. for a competitive offering is this key and growing segment of the market. The single largest U.S. instant coffee brand by market share remains Folgers.
Competitive Landscape; Hurry, Hurry Hard…
Tim Hortons’ presence in the U.S. market (with only 587 stores in 10 states) is modest in comparison to its U.S.‐based counterparts the likes of Panera Bread Co., Dunkin’ Donuts, Starbucks and McDonald’s. Where previously we would have focused on the Dunkin’ comparison, we believe the new U.S. strategy warrants an increased focus on Panera Bread Co.
Panera Bread Co. (PNRA‐NASDAQ)
America’s Healthiest Fast‐Casual Restaurant?
Formerly known as Au Bon Pain (founded in 1981), Panera Bread Co. as it has been known since 1988, operates and franchises retail bakery‐cafes in the U.S. In addition to operating its 605 company‐owned and 816 franchise‐operated bakery‐cafes under the Panera Bread, Saint Louis Bread, and Paradise Bakery & Cafe banners, the company (like THI) supplies dough items to company‐owned and franchise‐operated bakery‐cafes.
Panera’s bakery café supply chain includes 20 fresh dough facility (FDF), which manufactures and delivers (daily) fresh dough and soups to the company’s 1,380 units. Panera’s improvement of its vertically integrated supply chain management, through increasing purchasing power leverage and enhancing distribution efficiencies, resulted in higher operating margins of 11.2% in 2009. The margins achieved in 2009, are the targeted new normal floor going forward.
Despite Panera’s heavy concentration in the Eastern states (away from its initial core market of Midwest), there are only three markets in which Panera’s penetration levels exceed one unit per 100,000 population base. Consequently, despite its current size, we believe the company could benefit from further development within the metropolitan areas of the U.S. with >250,000 population base.
RJ Equity Research │ Page 26 of 43
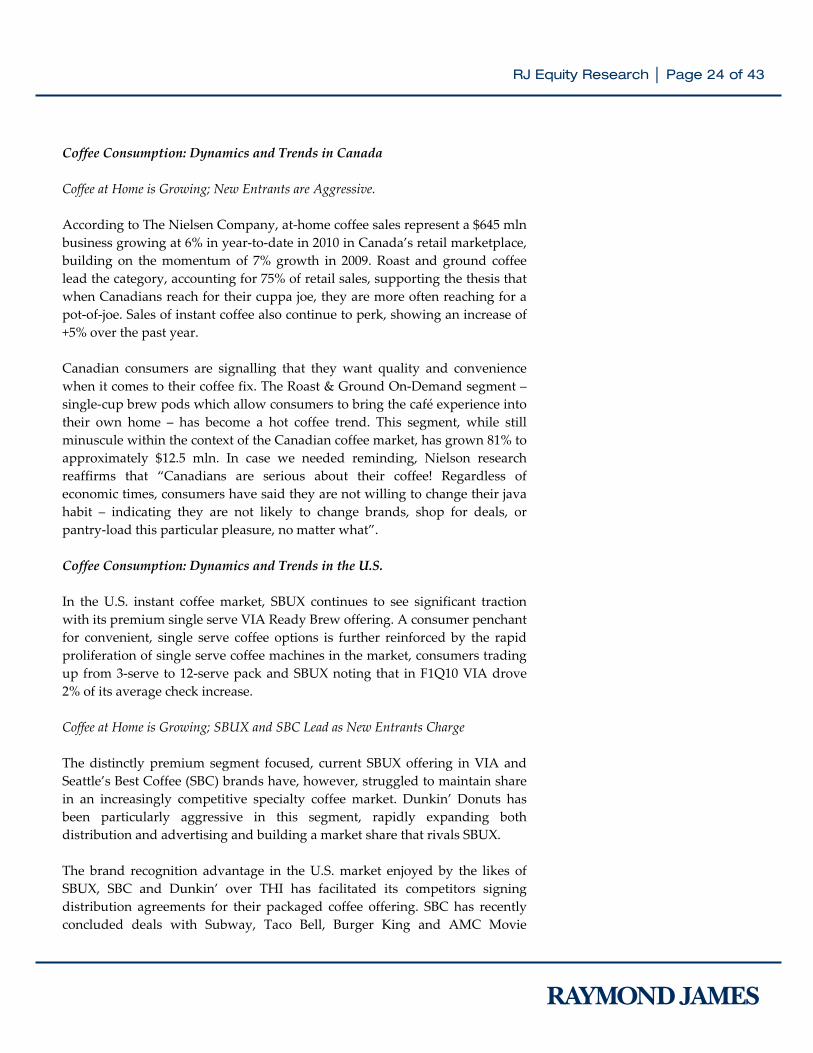
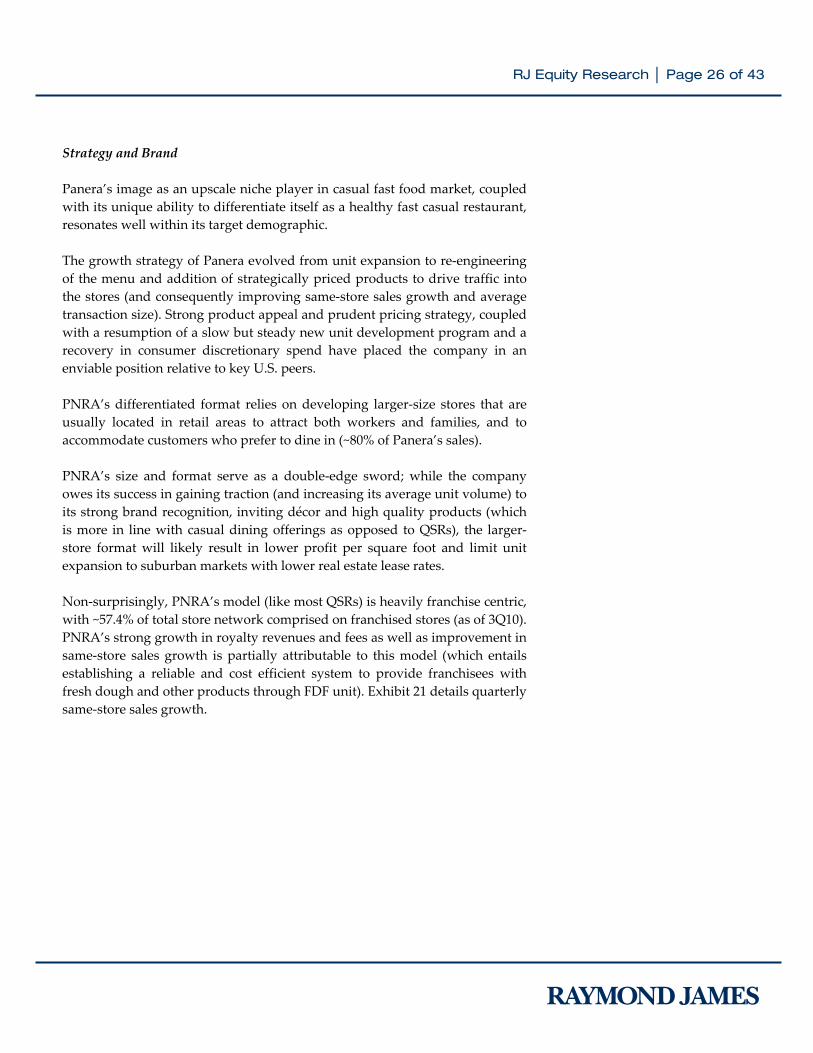
Strategy and Brand Panera’s image as an upscale niche player in casual fast food market, coupled with its unique ability to differentiate itself as a healthy fast casual restaurant, resonates well within its target demographic. The growth strategy of Panera evolved from unit expansion to re‐engineering of the menu and addition of strategically priced products to drive traffic into the stores (and consequently improving same‐store sales growth and average transaction size). Strong product appeal and prudent pricing strategy, coupled with a resumption of a slow but steady new unit development program and a recovery in consumer discretionary spend have placed the company in an enviable position relative to key U.S. peers. PNRA’s differentiated format relies on developing larger‐size stores that are usually located in retail areas to attract both workers and families, and to accommodate customers who prefer to dine in (~80% of Panera’s sales). PNRA’s size and format serve as a double‐edge sword; while the company owes its success in gaining traction (and increasing its average unit volume) to its strong brand recognition, inviting décor and high quality products (which is more in line with casual dining offerings as opposed to QSRs), the larger‐ store format will likely result in lower profit per square foot and limit unit expansion to suburban markets with lower real estate lease rates. Non‐surprisingly, PNRA’s model (like most QSRs) is heavily franchise centric, with ~57.4% of total store network comprised on franchised stores (as of 3Q10). PNRA’s strong growth in royalty revenues and fees as well as improvement in same‐store sales growth is partially attributable to this model (which entails establishing a reliable and cost efficient system to provide franchisees with fresh dough and other products through FDF unit). Exhibit 21 details quarterly same‐store sales growth.
RJ Equity Research │ Page 27 of 43
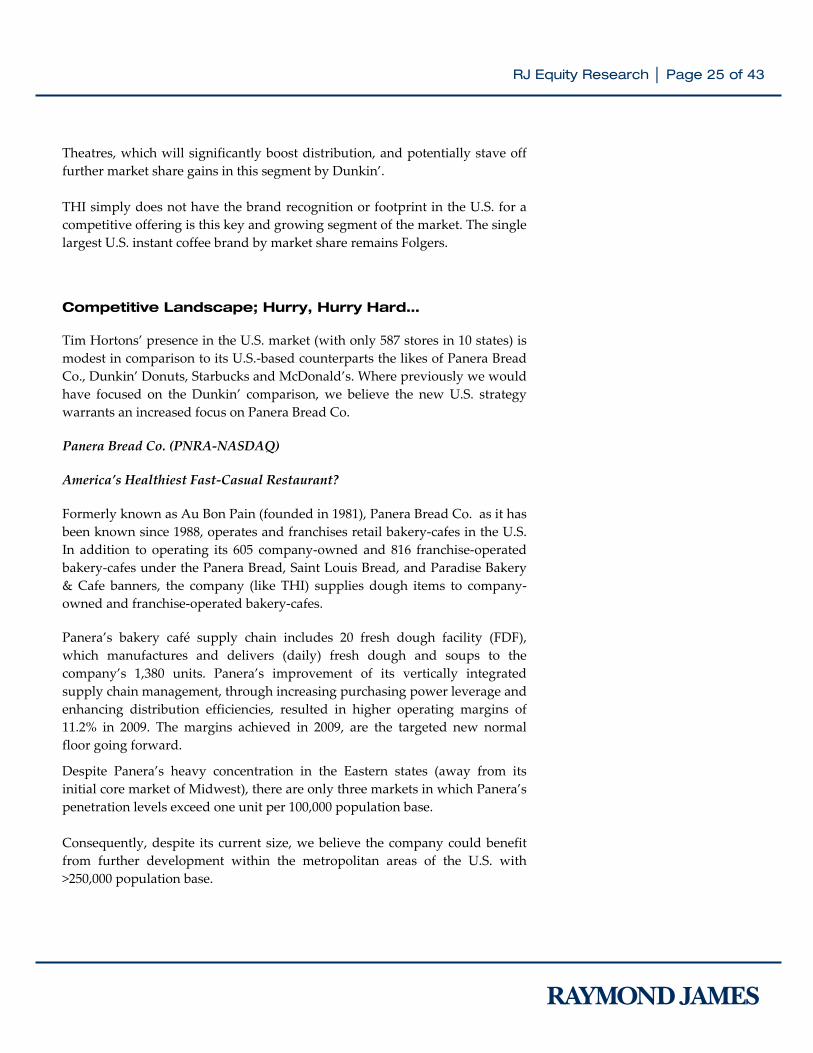
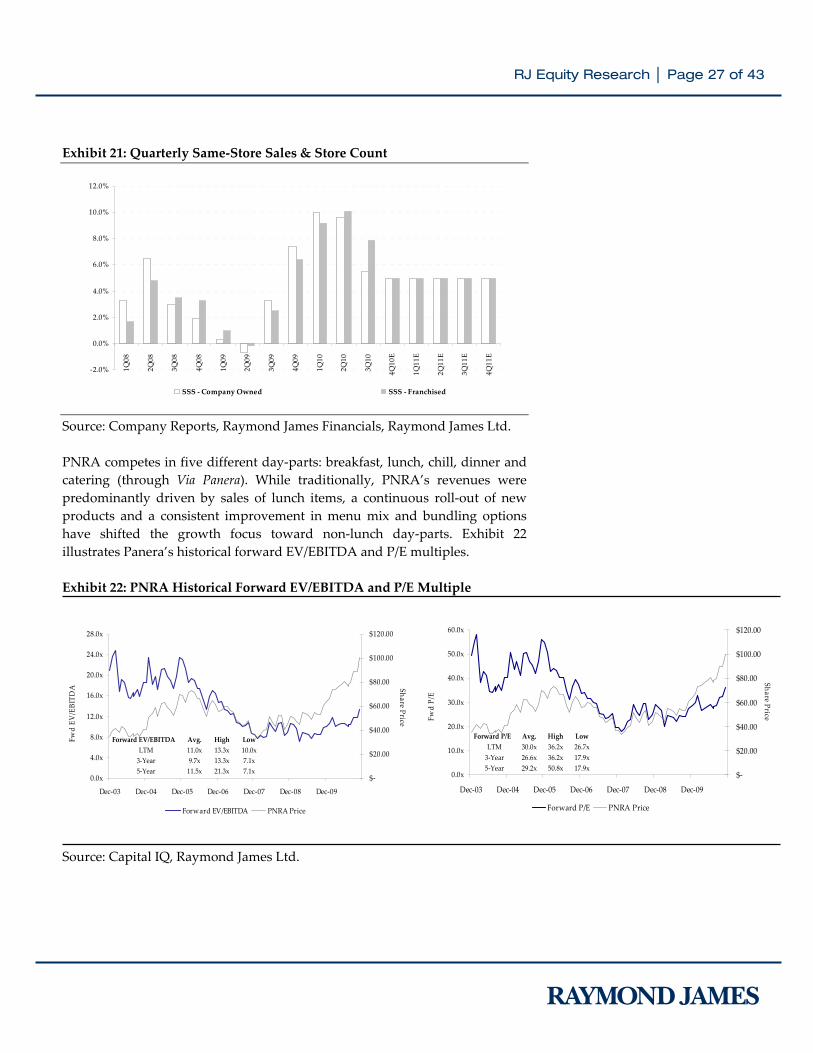
Exhibit 21: Quarterly Same‐Store Sales & Store Count Source: Company Reports, Raymond James Financials, Raymond James Ltd. PNRA competes in five different day‐parts: breakfast, lunch, chill, dinner and catering (through Via Panera). While traditionally, PNRA’s revenues were predominantly driven by sales of lunch items, a continuous roll‐out of new products and a consistent improvement in menu mix and bundling options have shifted the growth focus toward non‐lunch day‐parts. Exhibit 22 illustrates Panera’s historical forward EV/EBITDA and P/E multiples. Exhibit 22: PNRA Historical Forward EV/EBITDA and P/E Multiple Source: Capital IQ, Raymond James Ltd.
0.0x
4.0x
8.0x
12.0x
16.0x
20.0x
24.0x
28.0x
Dec‐03 Dec‐04 Dec‐05 Dec‐06 Dec‐07 Dec‐08 Dec‐09
$‐
$20.00
$40.00
$60.00
$80.00
$100.00
$120.00
Forward EV/EBITDA PNRA Price
0.0x
10.0x
20.0x
30.0x
40.0x
50.0x
60.0x
Dec‐03 Dec‐04 Dec‐05 Dec‐06 Dec‐07 Dec‐08 Dec‐09
$‐
$20.00
$40.00
$60.00
$80.00
$100.00
$120.00
Forward P/E PNRA Price
Forward P/E Avg. High LowLTM 30.0x 36.2x 26.7x3‐Year 26.6x 36.2x 17.9x5‐Year 29.2x 50.8x 17.9x
Forward EV/EBITDA Avg. High LowLTM 11.0x 13.3x 10.0x3‐Year 9.7x 13.3x 7.1x5‐Year 11.5x 21.3x 7.1x
Share Price
Share Price
Fwd EV
/EBITD
A
Fwd P/E
‐2.0%
0.0%
2.0%
4.0%
6.0%
8.0%
10.0%
12.0%
1Q08
2Q08
3Q08
4Q08
1Q09
2Q09
3Q09
4Q09
1Q10
2Q10
3Q10
4Q10
E
1Q11
E
2Q11
E
3Q11
E
4Q11
E
SSS ‐ Company Owned SSS ‐ Franchised
RJ Equity Research │ Page 28 of 43
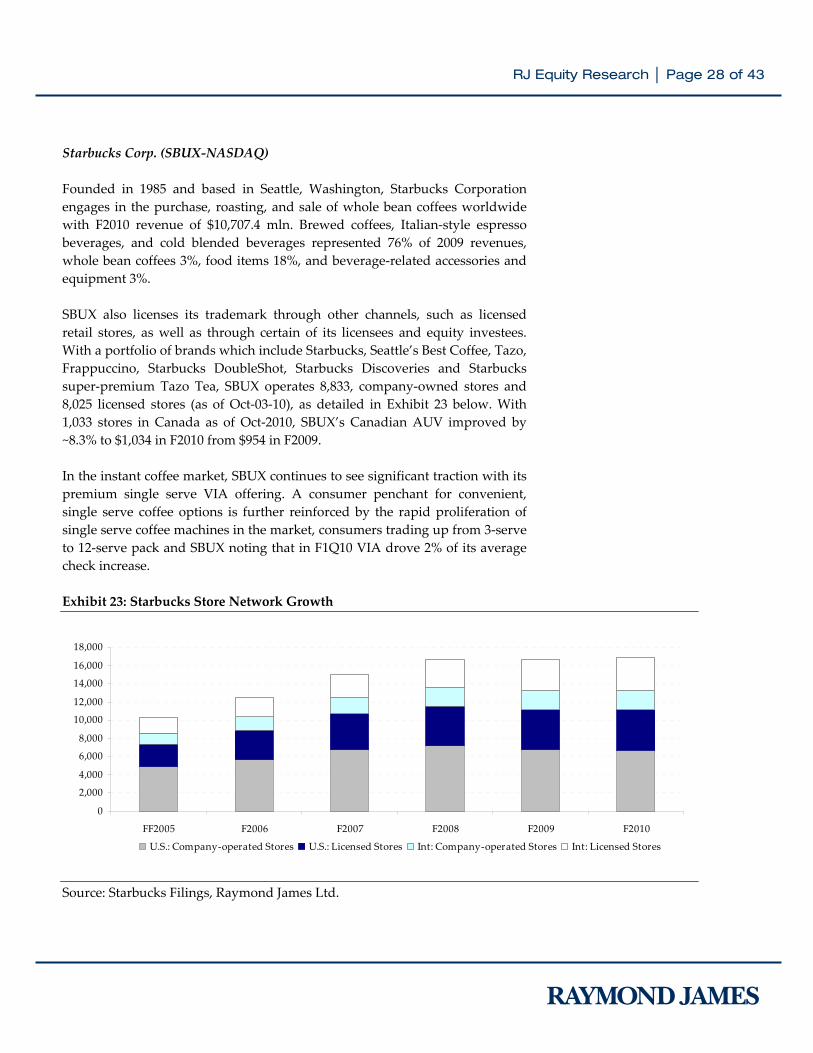
Starbucks Corp. (SBUX‐NASDAQ) Founded in 1985 and based in Seattle, Washington, Starbucks Corporation engages in the purchase, roasting, and sale of whole bean coffees worldwide with F2010 revenue of $10,707.4 mln. Brewed coffees, Italian‐style espresso beverages, and cold blended beverages represented 76% of 2009 revenues, whole bean coffees 3%, food items 18%, and beverage‐related accessories and equipment 3%. SBUX also licenses its trademark through other channels, such as licensed retail stores, as well as through certain of its licensees and equity investees. With a portfolio of brands which include Starbucks, Seattle’s Best Coffee, Tazo, Frappuccino, Starbucks DoubleShot, Starbucks Discoveries and Starbucks super‐premium Tazo Tea, SBUX operates 8,833, company‐owned stores and 8,025 licensed stores (as of Oct‐03‐10), as detailed in Exhibit 23 below. With 1,033 stores in Canada as of Oct‐2010, SBUX’s Canadian AUV improved by ~8.3% to $1,034 in F2010 from $954 in F2009. In the instant coffee market, SBUX continues to see significant traction with its premium single serve VIA offering. A consumer penchant for convenient, single serve coffee options is further reinforced by the rapid proliferation of single serve coffee machines in the market, consumers trading up from 3‐serve to 12‐serve pack and SBUX noting that in F1Q10 VIA drove 2% of its average check increase. Exhibit 23: Starbucks Store Network Growth Source: Starbucks Filings, Raymond James Ltd.
0
2,000
4,000
6,000
8,000
10,000
12,000
14,000
16,000
18,000
FF2005 F2006 F2007 F2008 F2009 F2010
U.S.: Company‐operated Stores U.S.: Licensed Stores Int: Company‐operated Stores Int: Licensed Stores
RJ Equity Research │ Page 29 of 43
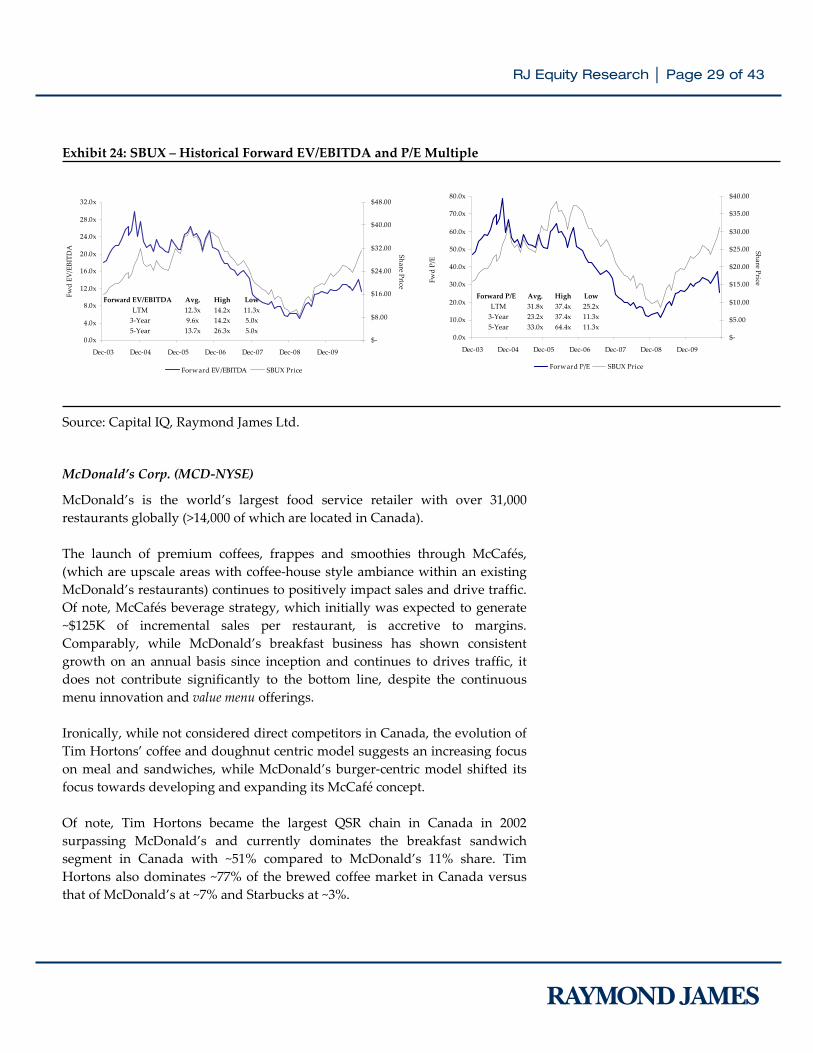
Exhibit 24: SBUX – Historical Forward EV/EBITDA and P/E Multiple Source: Capital IQ, Raymond James Ltd.
McDonald’s Corp. (MCD‐NYSE)
McDonald’s is the world’s largest food service retailer with over 31,000 restaurants globally (>14,000 of which are located in Canada). The launch of premium coffees, frappes and smoothies through McCafés, (which are upscale areas with coffee‐house style ambiance within an existing McDonald’s restaurants) continues to positively impact sales and drive traffic. Of note, McCafés beverage strategy, which initially was expected to generate ~$125K of incremental sales per restaurant, is accretive to margins. Comparably, while McDonald’s breakfast business has shown consistent growth on an annual basis since inception and continues to drives traffic, it does not contribute significantly to the bottom line, despite the continuous menu innovation and value menu offerings. Ironically, while not considered direct competitors in Canada, the evolution of Tim Hortons’ coffee and doughnut centric model suggests an increasing focus on meal and sandwiches, while McDonald’s burger‐centric model shifted its focus towards developing and expanding its McCafé concept. Of note, Tim Hortons became the largest QSR chain in Canada in 2002 surpassing McDonald’s and currently dominates the breakfast sandwich segment in Canada with ~51% compared to McDonald’s 11% share. Tim Hortons also dominates ~77% of the brewed coffee market in Canada versus that of McDonald’s at ~7% and Starbucks at ~3%.
0.0x
4.0x
8.0x
12.0x
16.0x
20.0x
24.0x
28.0x
32.0x
Dec‐03 Dec‐04 Dec‐05 Dec‐06 Dec‐07 Dec‐08 Dec‐09
$‐
$8.00
$16.00
$24.00
$32.00
$40.00
$48.00
Forward EV/EBITDA SBUX Price
0.0x
10.0x
20.0x
30.0x
40.0x
50.0x
60.0x
70.0x
80.0x
Dec‐03 Dec‐04 Dec‐05 Dec‐06 Dec‐07 Dec‐08 Dec‐09
$‐
$5.00
$10.00
$15.00
$20.00
$25.00
$30.00
$35.00
$40.00
Forward P/E SBUX Price
Forward P/E Avg. High LowLTM 31.8x 37.4x 25.2x3‐Year 23.2x 37.4x 11.3x5‐Year 33.0x 64.4x 11.3x
Forward EV/EBITDA Avg. High LowLTM 12.3x 14.2x 11.3x3‐Year 9.6x 14.2x 5.0x5‐Year 13.7x 26.3x 5.0x
Share Price
Share Price
Fwd EV
/EBITD
A
Fwd P/E
RJ Equity Research │ Page 30 of 43
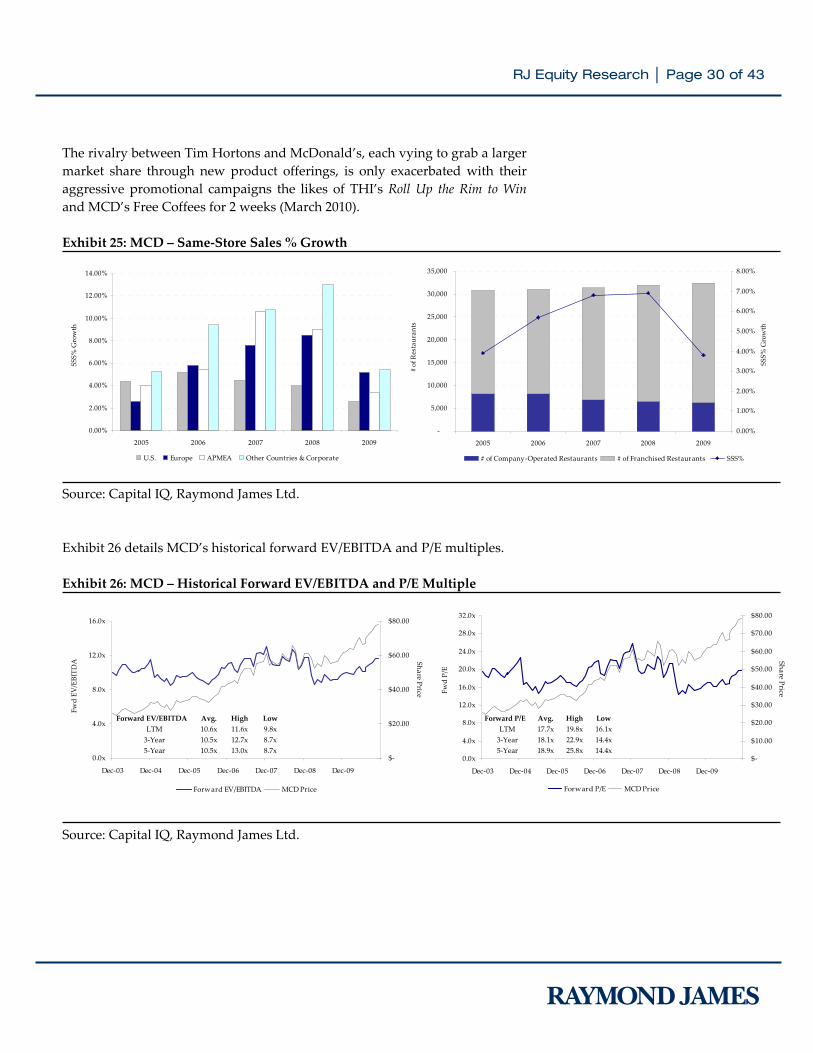
The rivalry between Tim Hortons and McDonald’s, each vying to grab a larger market share through new product offerings, is only exacerbated with their aggressive promotional campaigns the likes of THI’s Roll Up the Rim to Win and MCD’s Free Coffees for 2 weeks (March 2010). Exhibit 25: MCD – Same‐Store Sales % Growth Source: Capital IQ, Raymond James Ltd. Exhibit 26 details MCD’s historical forward EV/EBITDA and P/E multiples. Exhibit 26: MCD – Historical Forward EV/EBITDA and P/E Multiple Source: Capital IQ, Raymond James Ltd.
0.0x
4.0x
8.0x
12.0x
16.0x
Dec‐03 Dec‐04 Dec‐05 Dec‐06 Dec‐07 Dec‐08 Dec‐09
$‐
$20.00
$40.00
$60.00
$80.00
Forward EV/EBITDA MCD Price
0.0x
4.0x
8.0x
12.0x
16.0x
20.0x
24.0x
28.0x
32.0x
Dec‐03 Dec‐04 Dec‐05 Dec‐06 Dec‐07 Dec‐08 Dec‐09
$‐
$10.00
$20.00
$30.00
$40.00
$50.00
$60.00
$70.00
$80.00
Forward P/E MCD Price
Share Price
Share Price
Forward P/E Avg. High LowLTM 17.7x 19.8x 16.1x3‐Year 18.1x 22.9x 14.4x5‐Year 18.9x 25.8x 14.4x
Forward EV/EBITDA Avg. High LowLTM 10.6x 11.6x 9.8x3‐Year 10.5x 12.7x 8.7x5‐Year 10.5x 13.0x 8.7x
Fwd EV
/EBITD
A
Fwd P/E
0.00%
2.00%
4.00%
6.00%
8.00%
10.00%
12.00%
14.00%
2005 2006 2007 2008 2009
U.S. Europe APMEA Other Countries & Corporate
‐
5,000
10,000
15,000
20,000
25,000
30,000
35,000
2005 2006 2007 2008 2009
0.00%
1.00%
2.00%
3.00%
4.00%
5.00%
6.00%
7.00%
8.00%
# of Company‐Operated Restaurants # of Franchised Restaurants SSS%
SSS% Growth
SSS% Growth
# of Restauran
ts
RJ Equity Research │ Page 31 of 43
Dunkin’ Donuts Incorporated (Private Company) Founded in 1950 and headquartered in Canton, Massachusetts, Dunkinʹ Donuts Incorporated operates and franchises one of the largest coffee and baked goods chain of restaurants in the United States and globally. Along with another globally recognized brand (Baskin‐Robbins), Dunkin’ Donuts is a subsidiary of Dunkin Brands, Inc, owned by 3 private equity firms: Bain Capital, the Carlyle Group and Thomas H. Lee Partners. Dunkin Brands has approximately 9,000 Dunkin and 6,000 Baskin‐Robbins franchised locations in 44 countries (its key international markets include Asia‐Pacific and Latin America), with 2009 system‐wide sales of $6.9 bln. Dunkin Brands has approximately 6,400 Dunkin’ Donuts and 2,700 Baskin‐Robbins franchised restaurants in North America. In 2009, Dunkin’ Donuts (100% franchised) with system‐wide sales of $5.7 bln opened 171 net new restaurants in the U.S. (90% were outside its core New England market), for total net‐new worldwide openings of 351. Year‐to‐date, Dunkin’ Donuts has opened 75 net new restaurants in the U.S for total net‐new worldwide openings of 338.
RJ Equity Research │ Page 32 of 43
Ownership and Management
As of Dec‐03‐10, the directors and executive officers, as a group, directly or indirectly owned ~1.8 mln common shares, representing approximately 1% of shares outstanding, while institutions and hedge funds own approximately 78.4% of the shares outstanding. Exhibit 27: Senior Management Profiles Source: Tim Hortons Company Reports, Capital IQ, Raymond James Ltd.
Senior Management Position Description
Paul D. House Executive Chairman Mr. House has served as Executive Chairman of Tim Hortons Board of Director sinceMarch 2008. Since he joined the Company in 1985 as VP of Marketing, he has heldvarious senior executive positions such as Chief Operating Officer in 1993, Presidentand Chief Operating Officer in 1995, Chief Executive Officer in November 2005 andChairman of the Board in 2007. Prior to joining Tim Hortons, Mr. House heldvarious management positions with Dairy Queen Canada including VP of CanadianOperations. Educationally, he holds a Bachelor of Arts in Economics from McMasterUniversity.
Donald B. Schroeder Chief Executive Officer, President and Director
Mr. Schroeder has been the President and Chief Executive Officer of Tim Hortons Inc.since March 1, 2008. Prior to joining the company in 1991 as VP of Human Resourcesand International Development, he owned and operated 8 different Tim Hortonsrestaurants from 1978 to 1990. Upon Tim Hortonsʹ separation from Wendy’s, he alsoassumed the roles of General Counsel, Secretary, and Chief Compliance Officer. Mr.Schroeder graduated from the University of Western Ontario with a Bachelor of Lawsin 1969 and subsequently received his Master of Laws degree from the Osgoode HallLaw School in 1978.
Cynthia J. Devine Chief Financial Officer, Principal Accounting Officer and Executive Vice President of Finance
Prior to joining Tim Hortons in 2003 as Chief Financial Officer, Ms. Devine served asSVP, Finance of Maple Leaf Foods and from 1999 to 2001 she served as the ChiefFinancial Officer of Pepsi‐Cola® Canada. Ms. Devine holds an Honors BusinessAdministration degree from the University of Western Ontario and is a CharteredAccountant.
William A. Moir Chief Brand & Marketing Officer and President of Tim Horton Childrenʹs Foundation
Mr. Moir joined the company in 1990 as Vice President of Marketing and has servedas Chief Brand and Marketing Officer of Tim Hortons since May 2008. Prior tojoining Tim Hortons, he held key positions with K‐Tel, Shell Oil and LabattBreweries. Furthermore, Mr. Moir is a Director and past Chairman of the CoffeeAssociation of Canada. Educationally, he holds an Honors Business degree from theUniversity of Manitoba.
David F. Clanachan Chief Operations Officer of United States & International Operations
Mr. Clanachan has served as Chief Operations Officer, United States andInternational since March 2008, a role which entails overseeing the U.S. operations,restaurant development and the growth strategy. Prior to joining Tim Hortons in1992, he served as Director of Operations for an international food company. Mr.Clanachan holds a Bachelor of Commerce degree from the University of Windsor.
Roland M. Walton Chief Operations Officer of Canada
Mr. Walton has served as Chief Operations Officer, Canada since March 2008. Priorto joining Tim Hortons in 1997 as Executive VP of Operations, responsible foroperations in both Canada and the U.S., he served as Division VP for Pizza HutUSAʹs Central Division since 1995. Mr. Walton holds a Bachelor of Commerce degreefrom the University of Guelph.
RJ Equity Research │ Page 33 of 43
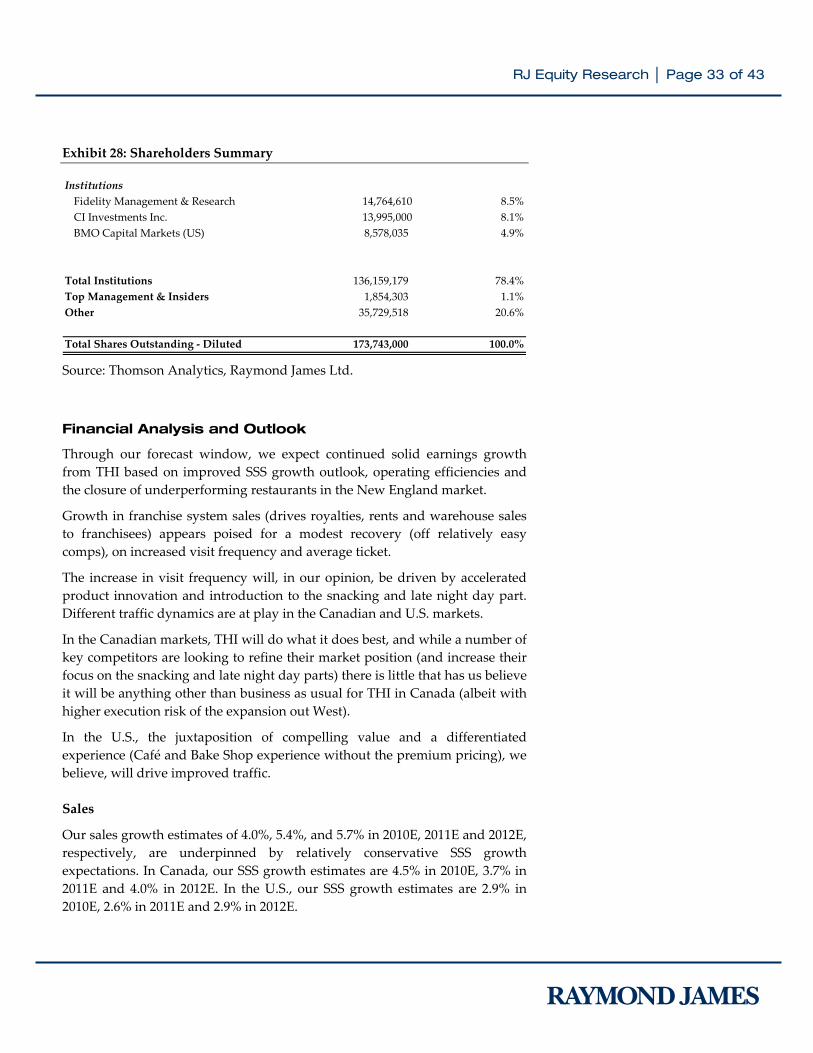
Exhibit 28: Shareholders Summary Source: Thomson Analytics, Raymond James Ltd.
Financial Analysis and Outlook
Through our forecast window, we expect continued solid earnings growth from THI based on improved SSS growth outlook, operating efficiencies and the closure of underperforming restaurants in the New England market.
Growth in franchise system sales (drives royalties, rents and warehouse sales to franchisees) appears poised for a modest recovery (off relatively easy comps), on increased visit frequency and average ticket.
The increase in visit frequency will, in our opinion, be driven by accelerated product innovation and introduction to the snacking and late night day part. Different traffic dynamics are at play in the Canadian and U.S. markets.
In the Canadian markets, THI will do what it does best, and while a number of key competitors are looking to refine their market position (and increase their focus on the snacking and late night day parts) there is little that has us believe it will be anything other than business as usual for THI in Canada (albeit with higher execution risk of the expansion out West).
In the U.S., the juxtaposition of compelling value and a differentiated experience (Café and Bake Shop experience without the premium pricing), we believe, will drive improved traffic. Sales
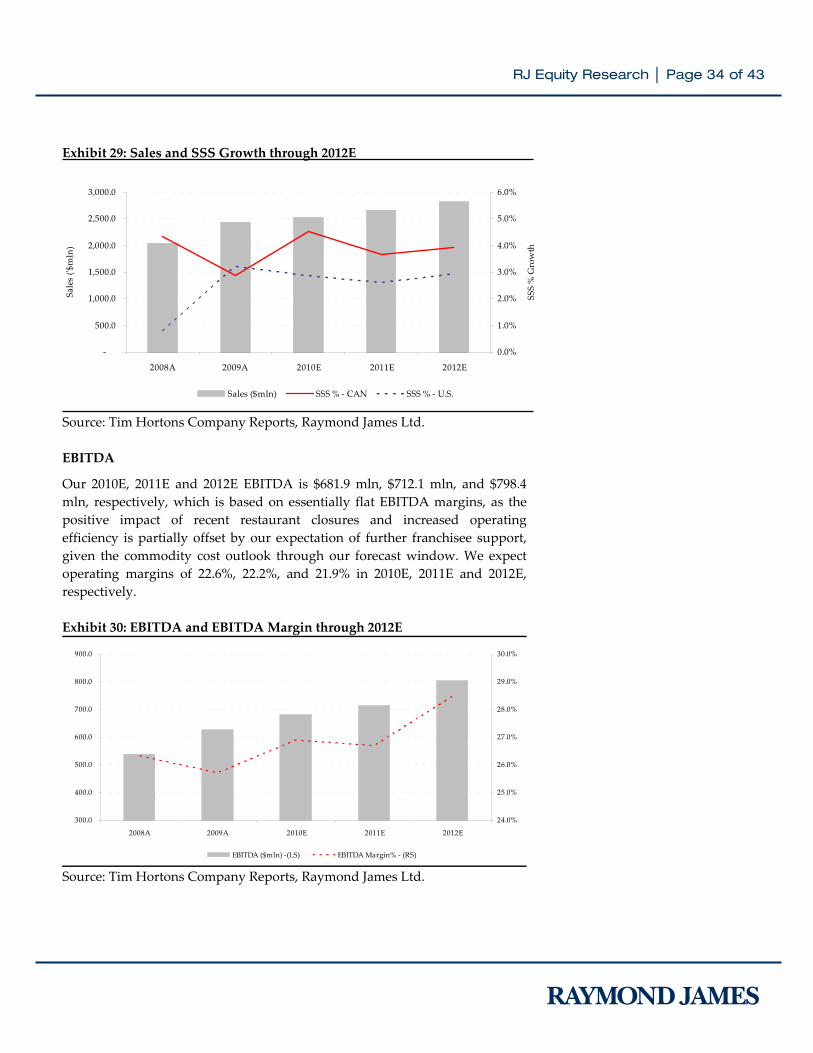
Our sales growth estimates of 4.0%, 5.4%, and 5.7% in 2010E, 2011E and 2012E, respectively, are underpinned by relatively conservative SSS growth expectations. In Canada, our SSS growth estimates are 4.5% in 2010E, 3.7% in 2011E and 4.0% in 2012E. In the U.S., our SSS growth estimates are 2.9% in 2010E, 2.6% in 2011E and 2.9% in 2012E.
Institutions Fidelity Management & Research 14,764,610 8.5%CI Investments Inc. 13,995,000 8.1%BMO Capital Markets (US) 8,578,035 4.9%
Total Institutions 136,159,179 78.4%Top Management & Insiders 1,854,303 1.1%Other 35,729,518 20.6%
Total Shares Outstanding ‐ Diluted 173,743,000 100.0%
RJ Equity Research │ Page 34 of 43
Exhibit 29: Sales and SSS Growth through 2012E Source: Tim Hortons Company Reports, Raymond James Ltd. EBITDA
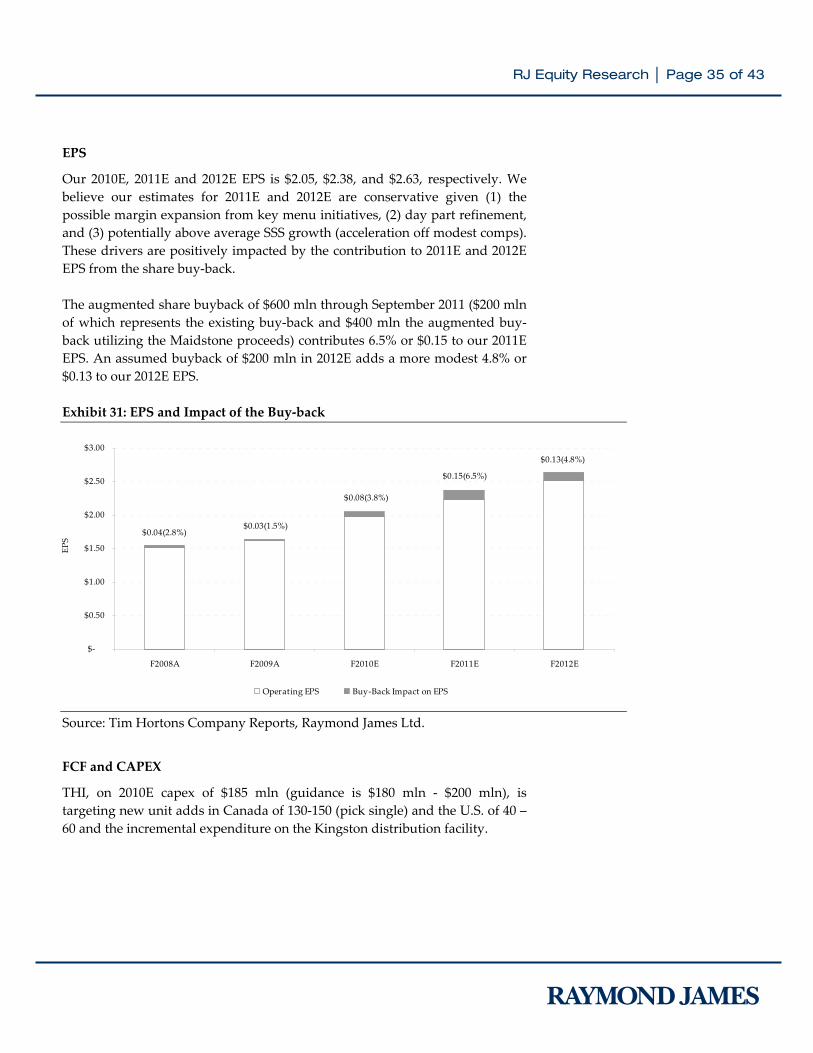
Our 2010E, 2011E and 2012E EBITDA is $681.9 mln, $712.1 mln, and $798.4 mln, respectively, which is based on essentially flat EBITDA margins, as the positive impact of recent restaurant closures and increased operating efficiency is partially offset by our expectation of further franchisee support, given the commodity cost outlook through our forecast window. We expect operating margins of 22.6%, 22.2%, and 21.9% in 2010E, 2011E and 2012E, respectively. Exhibit 30: EBITDA and EBITDA Margin through 2012E
300.0
400.0
500.0
600.0
700.0
800.0
900.0
2008A 2009A 2010E 2011E 2012E
24.0%
25.0%
26.0%
27.0%
28.0%
29.0%
30.0%
EBITDA ($mln) ‐(LS) EBITDA Margin% ‐ (RS)
Source: Tim Hortons Company Reports, Raymond James Ltd.
‐
500.0
1,000.0
1,500.0
2,000.0
2,500.0
3,000.0
2008A 2009A 2010E 2011E 2012E
0.0%
1.0%
2.0%
3.0%
4.0%
5.0%
6.0%
Sales ($mln) SSS % ‐ CAN SSS % ‐ U.S.
Sales (ʹ$
mln)
SSS % Growth
RJ Equity Research │ Page 35 of 43
EPS
Our 2010E, 2011E and 2012E EPS is $2.05, $2.38, and $2.63, respectively. We believe our estimates for 2011E and 2012E are conservative given (1) the possible margin expansion from key menu initiatives, (2) day part refinement, and (3) potentially above average SSS growth (acceleration off modest comps). These drivers are positively impacted by the contribution to 2011E and 2012E EPS from the share buy‐back. The augmented share buyback of $600 mln through September 2011 ($200 mln of which represents the existing buy‐back and $400 mln the augmented buy‐back utilizing the Maidstone proceeds) contributes 6.5% or $0.15 to our 2011E EPS. An assumed buyback of $200 mln in 2012E adds a more modest 4.8% or $0.13 to our 2012E EPS. Exhibit 31: EPS and Impact of the Buy‐back Source: Tim Hortons Company Reports, Raymond James Ltd.
FCF and CAPEX
THI, on 2010E capex of $185 mln (guidance is $180 mln ‐ $200 mln), is targeting new unit adds in Canada of 130‐150 (pick single) and the U.S. of 40 – 60 and the incremental expenditure on the Kingston distribution facility.
$‐
$0.50
$1.00
$1.50
$2.00
$2.50
$3.00
F2008A F2009A F2010E F2011E F2012E
Operating EPS Buy‐Back Impact on EPS
$0.04(2.8%)$0.03(1.5%)
$0.08(3.8%)
$0.15(6.5%)
$0.13(4.8%)
EPS
RJ Equity Research │ Page 36 of 43
Our expectations are for new unit adds in Canada of 144 and in the U.S. of 52. In 2011E our preliminary capex estimate is $175 mln. THI will increasingly focus capex allocation on renovation and re‐imaging of the U.S. store footprint as a ‘Café and Bake Shop’. FCF growth is strong, increasing 35.8% from $185.4 mln in 2009A to $251.8 mln in 2010E. THI’s balance sheet remains very healthy, in our opinion. On Nov‐25‐10, THI announced it would offer $100 million in a reopening of its 7‐year (due Jun‐01‐17) senior unsecured notes, and use the proceeds to refinance the remaining portion of its existing term debt set to mature in February 2011. The offering closed on Dec‐01‐10 and brings the total amount outstanding to $300 million. THI is also currently in the process of refinancing its bank revolver facility, maturing Feb‐28‐11. It expects to complete the new $250 mln revolver facility with a 4‐year term by the end of the year.
Valuation and Recommendation
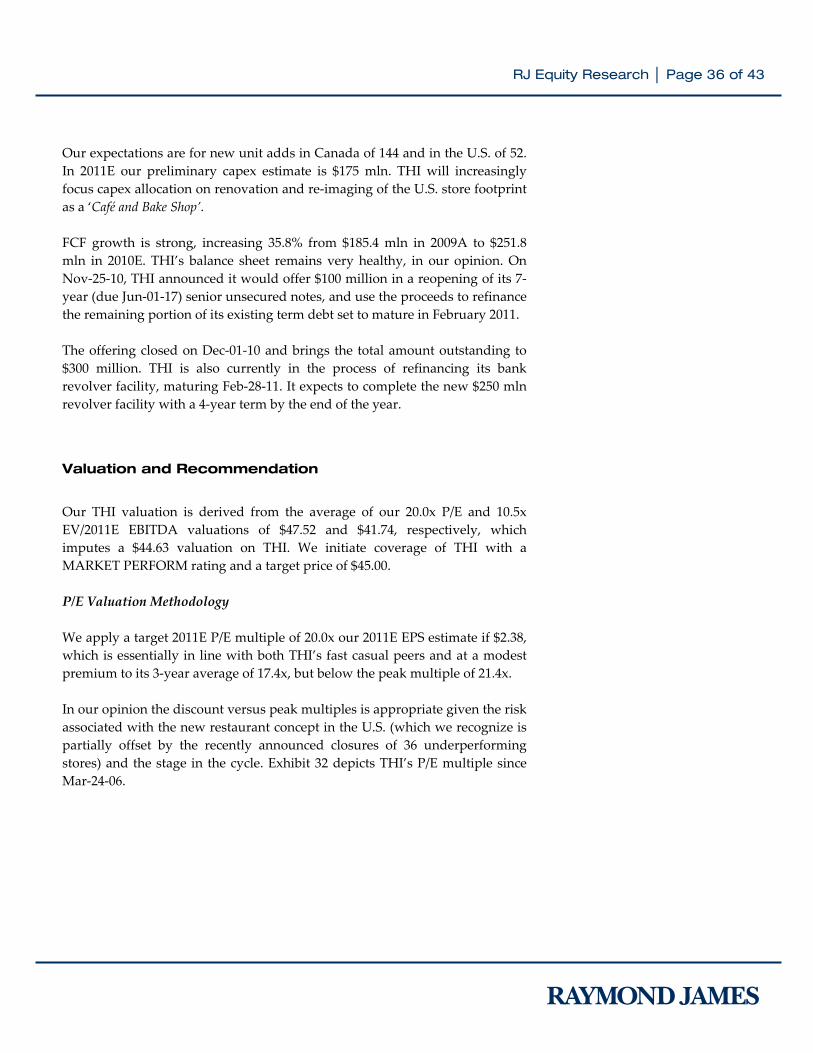
Our THI valuation is derived from the average of our 20.0x P/E and 10.5x EV/2011E EBITDA valuations of $47.52 and $41.74, respectively, which imputes a $44.63 valuation on THI. We initiate coverage of THI with a MARKET PERFORM rating and a target price of $45.00. P/E Valuation Methodology We apply a target 2011E P/E multiple of 20.0x our 2011E EPS estimate if $2.38, which is essentially in line with both THI’s fast casual peers and at a modest premium to its 3‐year average of 17.4x, but below the peak multiple of 21.4x. In our opinion the discount versus peak multiples is appropriate given the risk associated with the new restaurant concept in the U.S. (which we recognize is partially offset by the recently announced closures of 36 underperforming stores) and the stage in the cycle. Exhibit 32 depicts THI’s P/E multiple since Mar‐24‐06.
RJ Equity Research │ Page 37 of 43
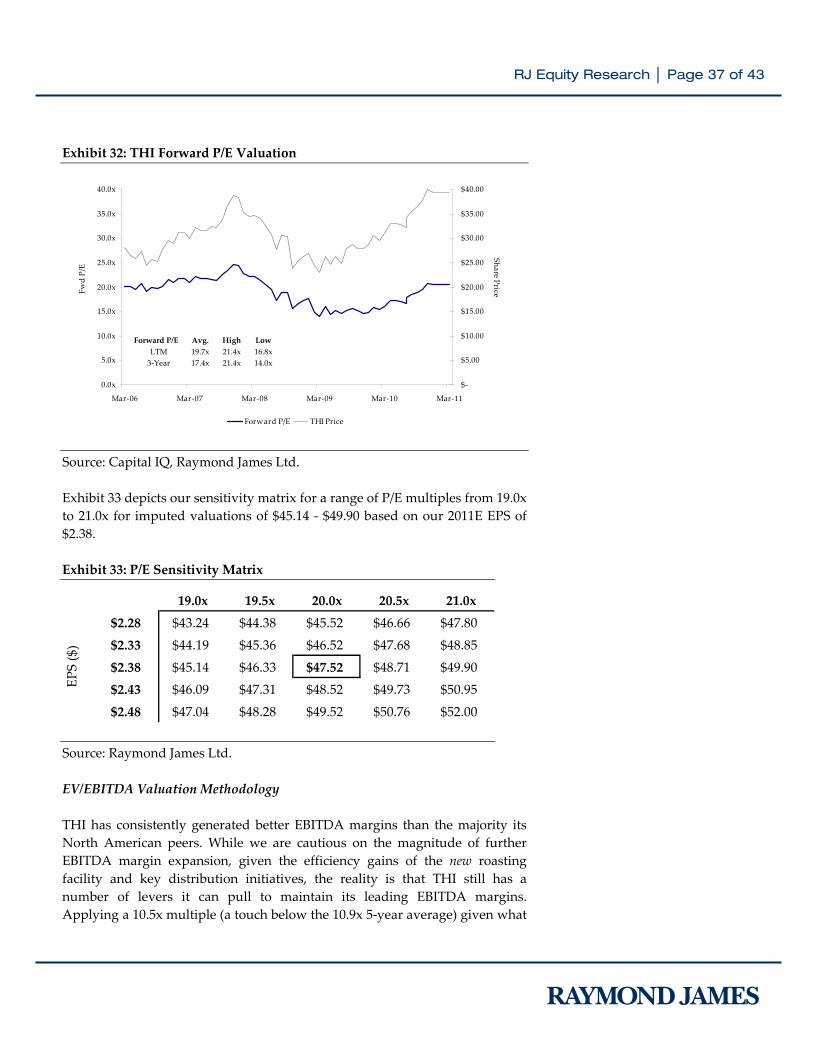
Exhibit 32: THI Forward P/E Valuation Source: Capital IQ, Raymond James Ltd. Exhibit 33 depicts our sensitivity matrix for a range of P/E multiples from 19.0x to 21.0x for imputed valuations of $45.14 ‐ $49.90 based on our 2011E EPS of $2.38. Exhibit 33: P/E Sensitivity Matrix Source: Raymond James Ltd. EV/EBITDA Valuation Methodology THI has consistently generated better EBITDA margins than the majority its North American peers. While we are cautious on the magnitude of further EBITDA margin expansion, given the efficiency gains of the new roasting facility and key distribution initiatives, the reality is that THI still has a number of levers it can pull to maintain its leading EBITDA margins. Applying a 10.5x multiple (a touch below the 10.9x 5‐year average) given what
0.0x
5.0x
10.0x
15.0x
20.0x
25.0x
30.0x
35.0x
40.0x
Mar‐06 Mar‐07 Mar‐08 Mar‐09 Mar‐10 Mar‐11
$‐
$5.00
$10.00
$15.00
$20.00
$25.00
$30.00
$35.00
$40.00
Forward P/E THI Price
Share PriceFwd P/E
Forward P/E Avg. High LowLTM 19.7x 21.4x 16.8x3‐Year 17.4x 21.4x 14.0x
47.52$ 19.0x 19.5x 20.0x 20.5x 21.0x$2.28 $43.24 $44.38 $45.52 $46.66 $47.80
$2.33 $44.19 $45.36 $46.52 $47.68 $48.85
$2.38 $45.14 $46.33 $47.52 $48.71 $49.90
$2.43 $46.09 $47.31 $48.52 $49.73 $50.95
$2.48 $47.04 $48.28 $49.52 $50.76 $52.00
EPS ($)
RJ Equity Research │ Page 38 of 43
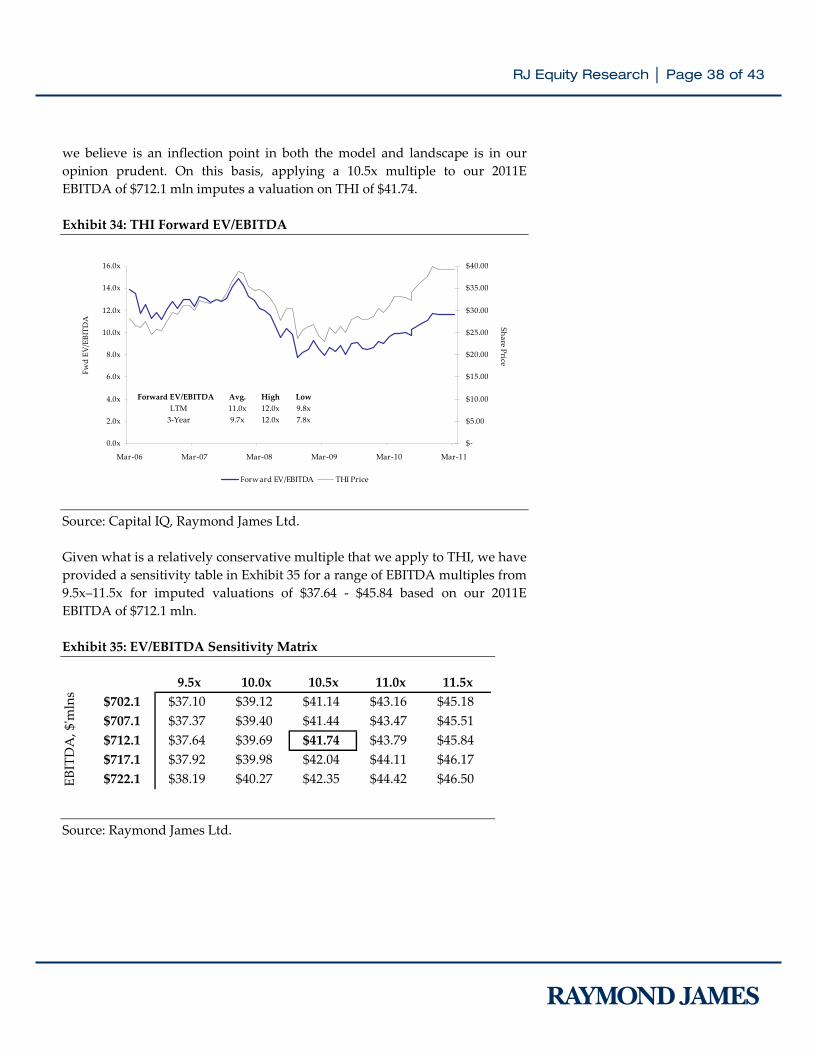
we believe is an inflection point in both the model and landscape is in our opinion prudent. On this basis, applying a 10.5x multiple to our 2011E EBITDA of $712.1 mln imputes a valuation on THI of $41.74. Exhibit 34: THI Forward EV/EBITDA Source: Capital IQ, Raymond James Ltd. Given what is a relatively conservative multiple that we apply to THI, we have provided a sensitivity table in Exhibit 35 for a range of EBITDA multiples from 9.5x–11.5x for imputed valuations of $37.64 ‐ $45.84 based on our 2011E EBITDA of $712.1 mln. Exhibit 35: EV/EBITDA Sensitivity Matrix Source: Raymond James Ltd.
0.0x
2.0x
4.0x
6.0x
8.0x
10.0x
12.0x
14.0x
16.0x
Mar‐06 Mar‐07 Mar‐08 Mar‐09 Mar‐10 Mar‐11
$‐
$5.00
$10.00
$15.00
$20.00
$25.00
$30.00
$35.00
$40.00
Forward EV/EBITDA THI Price
Forward EV/EBITDA Avg. High LowLTM 11.0x 12.0x 9.8x3‐Year 9.7x 12.0x 7.8x
Fwd EV
/EBITD
A
Share Price
41.74$ 9.5x 10.0x 10.5x 11.0x 11.5x$702.1 $37.10 $39.12 $41.14 $43.16 $45.18$707.1 $37.37 $39.40 $41.44 $43.47 $45.51$712.1 $37.64 $39.69 $41.74 $43.79 $45.84$717.1 $37.92 $39.98 $42.04 $44.11 $46.17$722.1 $38.19 $40.27 $42.35 $44.42 $46.50EB
ITDA, $ʹm
lns
RJ Equity Research │ Page 39 of 43
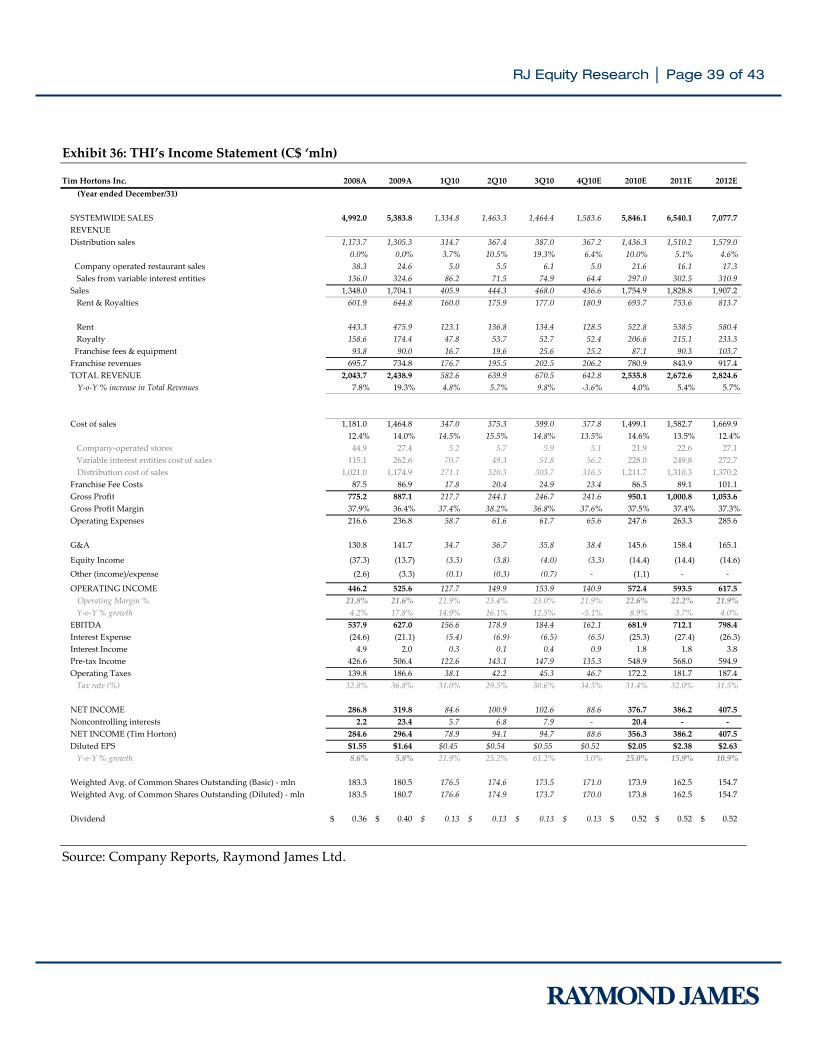
Exhibit 36: THI’s Income Statement (C$ ‘mln) Source: Company Reports, Raymond James Ltd.
Tim Hortons Inc. 2008A 2009A 1Q10 2Q10 3Q10 4Q10E 2010E 2011E 2012E(Year ended December/31)
SYSTEMWIDE SALES 4,992.0 5,383.8 1,334.8 1,463.3 1,464.4 1,583.6 5,846.1 6,540.1 7,077.7 REVENUEDistribution sales 1,173.7 1,305.3 314.7 367.4 387.0 367.2 1,436.3 1,510.2 1,579.0
0.0% 0.0% 3.7% 10.5% 19.3% 6.4% 10.0% 5.1% 4.6% Company operated restaurant sales 38.3 24.6 5.0 5.5 6.1 5.0 21.6 16.1 17.3 Sales from variable interest entities 136.0 324.6 86.2 71.5 74.9 64.4 297.0 302.5 310.9 Sales 1,348.0 1,704.1 405.9 444.3 468.0 436.6 1,754.9 1,828.8 1,907.2 Rent & Royalties 601.9 644.8 160.0 175.9 177.0 180.9 693.7 753.6 813.7
Rent 443.3 475.9 123.1 136.8 134.4 128.5 522.8 538.5 580.4 Royalty 158.6 174.4 47.8 53.7 52.7 52.4 206.6 215.1 233.3 Franchise fees & equipment 93.8 90.0 16.7 19.6 25.6 25.2 87.1 90.3 103.7 Franchise revenues 695.7 734.8 176.7 195.5 202.5 206.2 780.9 843.9 917.4 TOTAL REVENUE 2,043.7 2,438.9 582.6 639.9 670.5 642.8 2,535.8 2,672.6 2,824.6 Y‐o‐Y % increase in Total Revenues 7.8% 19.3% 4.8% 5.7% 9.8% ‐3.6% 4.0% 5.4% 5.7%
Cost of sales 1,181.0 1,464.8 347.0 375.3 399.0 377.8 1,499.1 1,582.7 1,669.9 12.4% 14.0% 14.5% 15.5% 14.8% 13.5% 14.6% 13.5% 12.4%
Company‐operated stores 44.9 27.4 5.2 5.7 5.9 5.1 21.9 22.6 27.1 Variable interest entities cost of sales 115.1 262.6 70.7 49.3 51.8 56.2 228.0 249.8 272.7 Distribution cost of sales 1,021.0 1,174.9 271.1 320.3 303.7 316.5 1,211.7 1,310.3 1,370.2
Franchise Fee Costs 87.5 86.9 17.8 20.4 24.9 23.4 86.5 89.1 101.1 Gross Profit 775.2 887.1 217.7 244.1 246.7 241.6 950.1 1,000.8 1,053.6 Gross Profit Margin 37.9% 36.4% 37.4% 38.2% 36.8% 37.6% 37.5% 37.4% 37.3%Operating Expenses 216.6 236.8 58.7 61.6 61.7 65.6 247.6 263.3 285.6
G&A 130.8 141.7 34.7 36.7 35.8 38.4 145.6 158.4 165.1
Equity Income (37.3) (13.7) (3.3) (3.8) (4.0) (3.3) (14.4) (14.4) (14.6) Other (income)/expense (2.6) (3.3) (0.1) (0.3) (0.7) ‐ (1.1) ‐ ‐
OPERATING INCOME 446.2 525.6 127.7 149.9 153.9 140.9 572.4 593.5 617.5 Operating Margin % 21.8% 21.6% 21.9% 23.4% 23.0% 21.9% 22.6% 22.2% 21.9%
Y‐o‐Y % growth 4.2% 17.8% 14.9% 16.1% 12.5% ‐5.1% 8.9% 3.7% 4.0%EBITDA 537.9 627.0 156.6 178.9 184.4 162.1 681.9 712.1 798.4 Interest Expense (24.6) (21.1) (5.4) (6.9) (6.5) (6.5) (25.3) (27.4) (26.3) Interest Income 4.9 2.0 0.3 0.1 0.4 0.9 1.8 1.8 3.8 Pre‐tax Income 426.6 506.4 122.6 143.1 147.9 135.3 548.9 568.0 594.9 Operating Taxes 139.8 186.6 38.1 42.2 45.3 46.7 172.2 181.7 187.4 Tax rate (%) 32.8% 36.8% 31.0% 29.5% 30.6% 34.5% 31.4% 32.0% 31.5%
NET INCOME 286.8 319.8 84.6 100.9 102.6 88.6 376.7 386.2 407.5 Noncontrolling interests 2.2 23.4 5.7 6.8 7.9 ‐ 20.4 ‐ ‐ NET INCOME (Tim Horton) 284.6 296.4 78.9 94.1 94.7 88.6 356.3 386.2 407.5 Diluted EPS $1.55 $1.64 $0.45 $0.54 $0.55 $0.52 $2.05 $2.38 $2.63 Y‐o‐Y % growth 8.6% 5.8% 21.9% 25.2% 61.2% 3.0% 25.0% 15.9% 10.9%
Weighted Avg. of Common Shares Outstanding (Basic) ‐ mln 183.3 180.5 176.5 174.6 173.5 171.0 173.9 162.5 154.7 Weighted Avg. of Common Shares Outstanding (Diluted) ‐ mln 183.5 180.7 176.6 174.9 173.7 170.0 173.8 162.5 154.7
Dividend 0.36$ 0.40$ 0.13$ 0.13$ 0.13$ 0.13$ 0.52$ 0.52$ 0.52$
RJ Equity Research │ Page 40 of 43
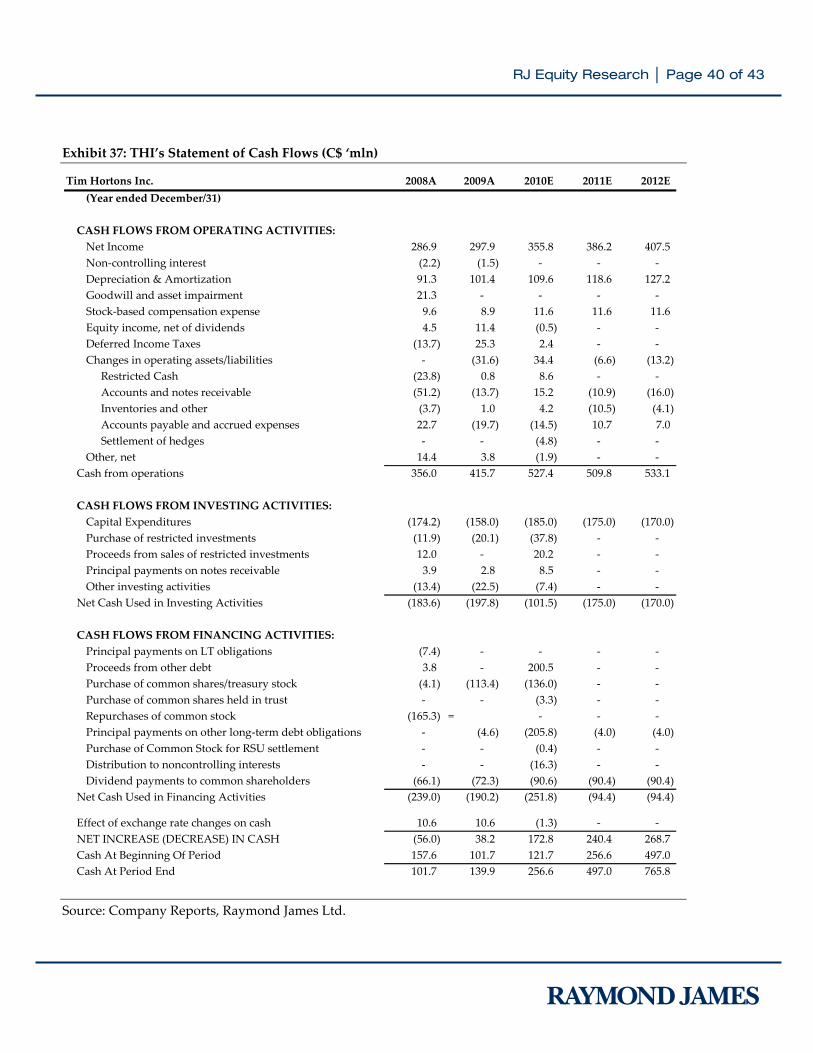
Exhibit 37: THI’s Statement of Cash Flows (C$ ‘mln) Source: Company Reports, Raymond James Ltd.
Tim Hortons Inc. 2008A 2009A 2010E 2011E 2012E(Year ended December/31)
CASH FLOWS FROM OPERATING ACTIVITIES:Net Income 286.9 297.9 355.8 386.2 407.5 Non‐controlling interest (2.2) (1.5) ‐ ‐ ‐ Depreciation & Amortization 91.3 101.4 109.6 118.6 127.2 Goodwill and asset impairment 21.3 ‐ ‐ ‐ ‐ Stock‐based compensation expense 9.6 8.9 11.6 11.6 11.6 Equity income, net of dividends 4.5 11.4 (0.5) ‐ ‐ Deferred Income Taxes (13.7) 25.3 2.4 ‐ ‐ Changes in operating assets/liabilities ‐ (31.6) 34.4 (6.6) (13.2) Restricted Cash (23.8) 0.8 8.6 ‐ ‐ Accounts and notes receivable (51.2) (13.7) 15.2 (10.9) (16.0) Inventories and other (3.7) 1.0 4.2 (10.5) (4.1) Accounts payable and accrued expenses 22.7 (19.7) (14.5) 10.7 7.0 Settlement of hedges ‐ ‐ (4.8) ‐ ‐
Other, net 14.4 3.8 (1.9) ‐ ‐ Cash from operations 356.0 415.7 527.4 509.8 533.1
CASH FLOWS FROM INVESTING ACTIVITIES:Capital Expenditures (174.2) (158.0) (185.0) (175.0) (170.0) Purchase of restricted investments (11.9) (20.1) (37.8) ‐ ‐ Proceeds from sales of restricted investments 12.0 ‐ 20.2 ‐ ‐ Principal payments on notes receivable 3.9 2.8 8.5 ‐ ‐ Other investing activities (13.4) (22.5) (7.4) ‐ ‐
Net Cash Used in Investing Activities (183.6) (197.8) (101.5) (175.0) (170.0)
CASH FLOWS FROM FINANCING ACTIVITIES:Principal payments on LT obligations (7.4) ‐ ‐ ‐ ‐ Proceeds from other debt 3.8 ‐ 200.5 ‐ ‐ Purchase of common shares/treasury stock (4.1) (113.4) (136.0) ‐ ‐ Purchase of common shares held in trust ‐ ‐ (3.3) ‐ ‐ Repurchases of common stock (165.3) = ‐ ‐ ‐ Principal payments on other long‐term debt obligations ‐ (4.6) (205.8) (4.0) (4.0) Purchase of Common Stock for RSU settlement ‐ ‐ (0.4) ‐ ‐ Distribution to noncontrolling interests ‐ ‐ (16.3) ‐ ‐ Dividend payments to common shareholders (66.1) (72.3) (90.6) (90.4) (90.4)
Net Cash Used in Financing Activities (239.0) (190.2) (251.8) (94.4) (94.4)
Effect of exchange rate changes on cash 10.6 10.6 (1.3) ‐ ‐ NET INCREASE (DECREASE) IN CASH (56.0) 38.2 172.8 240.4 268.7 Cash At Beginning Of Period 157.6 101.7 121.7 256.6 497.0 Cash At Period End 101.7 139.9 256.6 497.0 765.8
RJ Equity Research │ Page 41 of 43
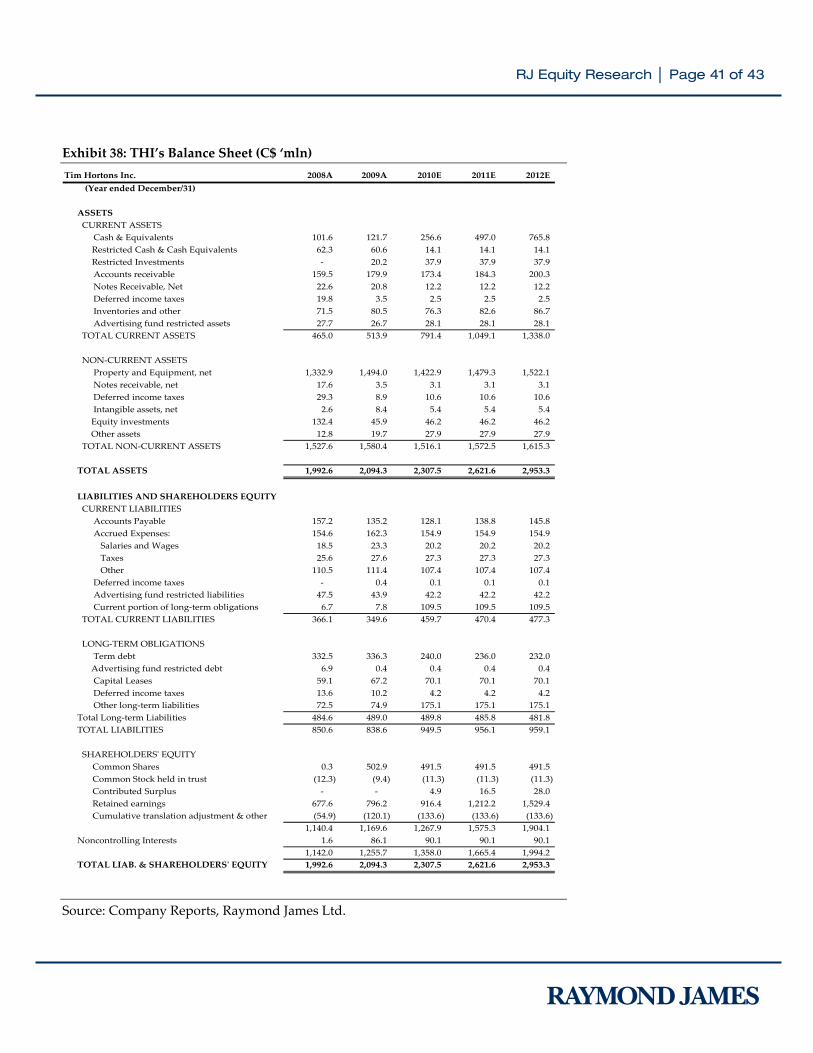
Exhibit 38: THI’s Balance Sheet (C$ ‘mln) Source: Company Reports, Raymond James Ltd.
Tim Hortons Inc. 2008A 2009A 2010E 2011E 2012E(Year ended December/31)
ASSETS CURRENT ASSETS Cash & Equivalents 101.6 121.7 256.6 497.0 765.8 Restricted Cash & Cash Equivalents 62.3 60.6 14.1 14.1 14.1 Restricted Investments ‐ 20.2 37.9 37.9 37.9
Accounts receivable 159.5 179.9 173.4 184.3 200.3 Notes Receivable, Net 22.6 20.8 12.2 12.2 12.2 Deferred income taxes 19.8 3.5 2.5 2.5 2.5 Inventories and other 71.5 80.5 76.3 82.6 86.7 Advertising fund restricted assets 27.7 26.7 28.1 28.1 28.1 TOTAL CURRENT ASSETS 465.0 513.9 791.4 1,049.1 1,338.0
NON‐CURRENT ASSETS Property and Equipment, net 1,332.9 1,494.0 1,422.9 1,479.3 1,522.1 Notes receivable, net 17.6 3.5 3.1 3.1 3.1 Deferred income taxes 29.3 8.9 10.6 10.6 10.6 Intangible assets, net 2.6 8.4 5.4 5.4 5.4 Equity investments 132.4 45.9 46.2 46.2 46.2 Other assets 12.8 19.7 27.9 27.9 27.9 TOTAL NON‐CURRENT ASSETS 1,527.6 1,580.4 1,516.1 1,572.5 1,615.3
TOTAL ASSETS 1,992.6 2,094.3 2,307.5 2,621.6 2,953.3
LIABILITIES AND SHAREHOLDERS EQUITY CURRENT LIABILITIES Accounts Payable 157.2 135.2 128.1 138.8 145.8 Accrued Expenses: 154.6 162.3 154.9 154.9 154.9 Salaries and Wages 18.5 23.3 20.2 20.2 20.2 Taxes 25.6 27.6 27.3 27.3 27.3 Other 110.5 111.4 107.4 107.4 107.4 Deferred income taxes ‐ 0.4 0.1 0.1 0.1 Advertising fund restricted liabilities 47.5 43.9 42.2 42.2 42.2 Current portion of long‐term obligations 6.7 7.8 109.5 109.5 109.5 TOTAL CURRENT LIABILITIES 366.1 349.6 459.7 470.4 477.3
LONG‐TERM OBLIGATIONS Term debt 332.5 336.3 240.0 236.0 232.0 Advertising fund restricted debt 6.9 0.4 0.4 0.4 0.4 Capital Leases 59.1 67.2 70.1 70.1 70.1 Deferred income taxes 13.6 10.2 4.2 4.2 4.2 Other long‐term liabilities 72.5 74.9 175.1 175.1 175.1 Total Long‐term Liabilities 484.6 489.0 489.8 485.8 481.8 TOTAL LIABILITIES 850.6 838.6 949.5 956.1 959.1
SHAREHOLDERSʹ EQUITYCommon Shares 0.3 502.9 491.5 491.5 491.5 Common Stock held in trust (12.3) (9.4) (11.3) (11.3) (11.3) Contributed Surplus ‐ ‐ 4.9 16.5 28.0 Retained earnings 677.6 796.2 916.4 1,212.2 1,529.4 Cumulative translation adjustment & other (54.9) (120.1) (133.6) (133.6) (133.6)
1,140.4 1,169.6 1,267.9 1,575.3 1,904.1 Noncontrolling Interests 1.6 86.1 90.1 90.1 90.1
1,142.0 1,255.7 1,358.0 1,665.4 1,994.2 TOTAL LIAB. & SHAREHOLDERSʹ EQUITY 1,992.6 2,094.3 2,307.5 2,621.6 2,953.3
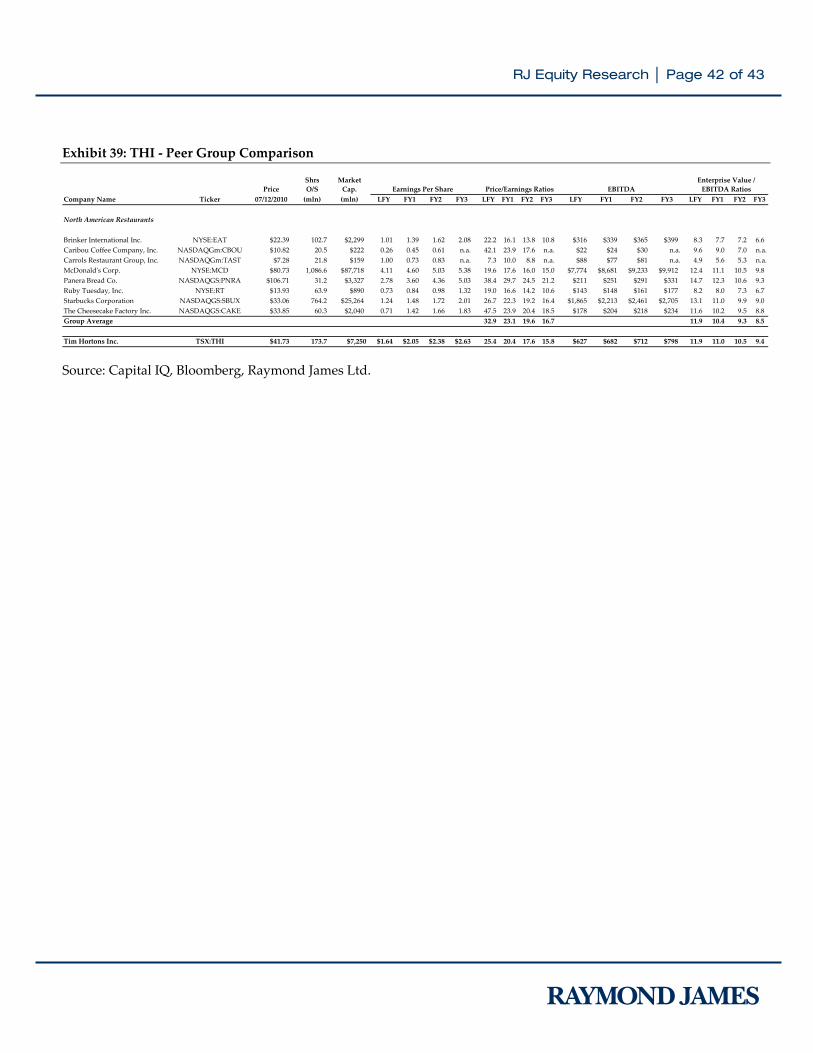
RJ Equity Research │ Page 42 of 43
Exhibit 39: THI ‐ Peer Group Comparison Source: Capital IQ, Bloomberg, Raymond James Ltd.
Shrs Market 1000 1001 1002 1003 Enterprise Value /Price O/S Cap. EBITDA Ratios
Company Name Ticker 07/12/2010 (mln) (mln) LFY FY1 FY2 FY3 LFY FY1 FY2 FY3 LFY FY1 FY2 FY3 LFY FY1 FY2 FY3
North American Restaurants LAST 1000 1001 1002 1003
Brinker International Inc. NYSE:EAT $22.39 102.7 $2,299 1.01 1.39 1.62 2.08 22.2 16.1 13.8 10.8 $316 $339 $365 $399 8.3 7.7 7.2 6.6Caribou Coffee Company, Inc. NASDAQGm:CBOU $10.82 20.5 $222 0.26 0.45 0.61 n.a. 42.1 23.9 17.6 n.a. $22 $24 $30 n.a. 9.6 9.0 7.0 n.a.Carrols Restaurant Group, Inc. NASDAQGm:TAST $7.28 21.8 $159 1.00 0.73 0.83 n.a. 7.3 10.0 8.8 n.a. $88 $77 $81 n.a. 4.9 5.6 5.3 n.a.McDonaldʹs Corp. NYSE:MCD $80.73 1,086.6 $87,718 4.11 4.60 5.03 5.38 19.6 17.6 16.0 15.0 $7,774 $8,681 $9,233 $9,912 12.4 11.1 10.5 9.8Panera Bread Co. NASDAQGS:PNRA $106.71 31.2 $3,327 2.78 3.60 4.36 5.03 38.4 29.7 24.5 21.2 $211 $251 $291 $331 14.7 12.3 10.6 9.3Ruby Tuesday, Inc. NYSE:RT $13.93 63.9 $890 0.73 0.84 0.98 1.32 19.0 16.6 14.2 10.6 $143 $148 $161 $177 8.2 8.0 7.3 6.7Starbucks Corporation NASDAQGS:SBUX $33.06 764.2 $25,264 1.24 1.48 1.72 2.01 26.7 22.3 19.2 16.4 $1,865 $2,213 $2,461 $2,705 13.1 11.0 9.9 9.0The Cheesecake Factory Inc. NASDAQGS:CAKE $33.85 60.3 $2,040 0.71 1.42 1.66 1.83 47.5 23.9 20.4 18.5 $178 $204 $218 $234 11.6 10.2 9.5 8.8Group Average 32.9 23.1 19.6 16.7 11.9 10.4 9.3 8.5
Tim Hortons Inc. TSX:THI $41.73 173.7 $7,250 $1.64 $2.05 $2.38 $2.63 25.4 20.4 17.6 15.8 $627 $682 $712 $798 11.9 11.0 10.5 9.4
Earnings Per Share Price/Earnings Ratios EBITDA
RJ Equity Research │ Page 43 of 43
Risks Some of the general and specific risk factors that pertain to the projected 6‐12 month stock price target for Tim Hortons included with our research are as follows: Inflation in Cost of Goods Sold
Coffee constitutes a significant percentage of Tim Hortons’ cost of goods sold. As a result, the company’s inability to mitigate the impact of potentially higher coffee beans and wheat costs through either their hedging strategy or price increases the company could adversely impact Tim Hortons’ margins and financial performance. Supply Chain Disruption
Disruptions or delays in inventory replenishment could adversely impact operation and earning. Factors resulting in disruption of supply chain include, but not limited to: shipping slowdown or disruption, extreme weather conditions and sudden hikes in raw material costs which could lead to their shortage. Competition and Growth Opportunities
Tim Hortons’ growth strategy is contingent upon its ability to increase the number of new restaurants and to expand its geographic footprint in the U.S, without cannibalizing the performance of the existing restaurants. Moreover, given the competitive nature of QSR industry, Tim Hortons’ market share and financial performance could be negatively impacted by its competitors’ new store openings and promotional activities. Foreign Exchange Fluctuation
Decrease in the value of the Canadian dollar compared to the U.S. dollar would proportionately increase the cost of coffee beans, which are traded in US dollar. Conversely, despite the company’s effort to shift the sourcing of certain products and supplies for U.S. franchises to the U.S., this segment of the business is negatively affected when Canadian dollar strengthens, as the U.S. franchises are required to purchase certain good from Canadian suppliers. Macro Economic Considerations
Unstable global economy, rising consumer debt levels and changes in consumer preferences and buying patterns, as well as changes in unemployment rate, labour costs, and fuel price may have negative impacts on Tim Hortons’ financial results.

Notes
................................................................................................................................
................................................................................................................................
................................................................................................................................
................................................................................................................................
................................................................................................................................
................................................................................................................................
................................................................................................................................
................................................................................................................................
................................................................................................................................
................................................................................................................................
................................................................................................................................
................................................................................................................................
................................................................................................................................
................................................................................................................................
................................................................................................................................
................................................................................................................................
................................................................................................................................
................................................................................................................................
................................................................................................................................
................................................................................................................................
................................................................................................................................
RJ Disclosures
Analyst Certification
The views expressed in this report (which include the actual rating assigned to the company as well as the analytical substance and tone of the report) accurately reflect the personal views of the analyst(s) covering the subject securities. No part of said personʹs compensation was, is, or will be directly or indirectly related to the specific recommendations or views contained in this research report.
Stock Ratings
STRONG BUY 1: the stock is expected to appreciate and produce a total return of at least 15% and outperform the S&P/TSX Composite Index over the next six months. OUTPERFORM 2: the stock is expected to appreciate and outperform the S&P/TSX Composite Index over the next twelve months. MARKET PERFORM 3: the stock is expected to perform generally in line with the S&P/TSX Composite Index over the next twelve months and is potentially a source of funds for more highly rated securities. UNDERPERFORM 4: the stock is expected to underperform the S&P/TSX Composite Index or its sector over the next six to twelve months and should be sold.
Distribution of Ratings
Out of 244 stocks in the Raymond James Ltd. (Canada) coverage universe, the ratings distribution is as follows: Strong Buy and Outperform (Buy, 67%); Market Perform (Hold, 30%); Underperform (Sell, 3%). Within those rating categories, the percentage of rated companies that currently are or have been investment‐banking clients of Raymond James Ltd. or its affiliates over the past 12 months is as follows: Strong Buy and Outperform (Buy, 47%); Market Perform (Hold, 38%); Underperform, (Sell, 17%). Note: Data updated monthly.
Risk Factors
Some of the general risk factors that pertain to the projected 6‐12 month stock price targets included with our research are as follows: i) changes in industry fundamentals with respect to customer demand or product/service pricing could adversely impact expected revenues and earnings, ii) issues relating to major competitors, customers, suppliers and new product expectations could change investor attitudes toward the sector or this stock, iii) unforeseen developments with respect to the management, financial condition or accounting policies or practices could alter the prospective valuation, or iv) external factors that affect global and/or regional economies, interest rates, exchange rates or major segments of the economy could alter investor confidence and investment prospects.
Analyst Compensation
Equity research analysts and associates at Raymond James Ltd. are compensated on a salary and bonus system. Several factors enter into the compensation determination for an analyst, including i) research quality and overall productivity, including success in rating stocks on an absolute basis and relative to the S&P/TSX Composite Index and/or a sector index, ii) recognition from institutional investors, iii) support effectiveness to the institutional and retail sales forces and traders, iv) commissions generated in stocks under coverage that are attributable to the analyst’s efforts, v) net revenues of the overall Equity Capital Markets Group, and vi) compensation levels for analysts at competing investment dealers.
Analyst Stock Holdings
Effective September 2002, Raymond James Ltd. equity research analysts and associates or members of their households are forbidden from investing in securities of companies covered by them. Analysts and associates are permitted to hold long positions in the securities of companies they cover which were in place prior to September 2002 but are only permitted to sell those positions five days after the rating has been lowered to Underperform.
RJ Disclosures
Review of Material Operations
The Analyst and/or Associate are required to conduct due diligence on, and where deemed appropriate visit, the material operations of a subject company before initiating research coverage. The scope of the review may vary depending on the complexity of the subject companyʹs business operations.
Raymond James Relationships
Raymond James Ltd. or its affiliates expects to receive or intends to seek compensation for investment banking services from all companies under research coverage within the next three months.
Raymond James Ltd. or its officers, employees or affiliates may execute transactions in securities mentioned in this report that may not be consistent with the report’s conclusions.
Additional information is available upon request. This document may not be reprinted without permission.
All Raymond James Ltd. research reports are distributed electronically and are available to clients at the same time via the firm’s website (http://www.raymondjames.ca). Immediately upon being posted to the firm’s website, the research reports are then distributed electronically to clients via email upon request and to clients with access to Bloomberg (home page: RJLC), First Call Research Direct and Reuters. Selected research reports are also printed and mailed at the same time to clients upon request. Requests for Raymond James Ltd. research may be made by contacting the Raymond James Product Group during market hours at (604) 659‐8000.
In the event that this is a compendium report (i.e., covers 6 or more subject companies), Raymond James Ltd. may choose to provide specific disclosures for the subject companies by reference. To access these disclosures, clients should refer to: http://www.raymondjames.ca (click on Equity Capital Markets / Equity Research / Research Disclosures) or call toll‐free at 1‐800‐667‐2899.
All expressions of opinion reflect the judgment of the Research Department of Raymond James Ltd. or its affiliates (RJL), at this date and are subject to change. Information has been obtained from sources considered reliable, but we do not guarantee that the foregoing report is accurate or complete. Other departments of RJL may have information which is not available to the Research Department about companies mentioned in this report. RJL may execute transactions in the securities mentioned in this report which may not be consistent with the report’s conclusions. RJL may perform investment banking or other services for, or solicit investment banking business from, any company mentioned in this report. This information is not an offer or solicitation for the sale or purchase of securities. Information in this report should not be construed as advice designed to meet the individual objectives of every investor. Consultation with your investment advisor is recommended. For institutional clients of the European Economic Area (EEA): This document (and any attachments or exhibits hereto) is intended only for EEA Institutional Clients or others to whom it may lawfully be submitted. RJL is a member of CIPF. ©2010 Raymond James Ltd.
Raymond James Ltd. is not a U.S. broker‐dealer and therefore is not governed by U.S. laws, rules or regulations applicable to U.S. broker‐dealers. Consequently, the persons responsible for the content of this publication are not licensed in the U.S. as research analysts in accordance with applicable rules promulgated by the U.S. Self Regulatory Organizations.
Any U.S. Institutional Investor wishing to effect trades in any security should contact Raymond James (USA) Ltd., a U.S. broker‐dealer affiliate of Raymond James Ltd.
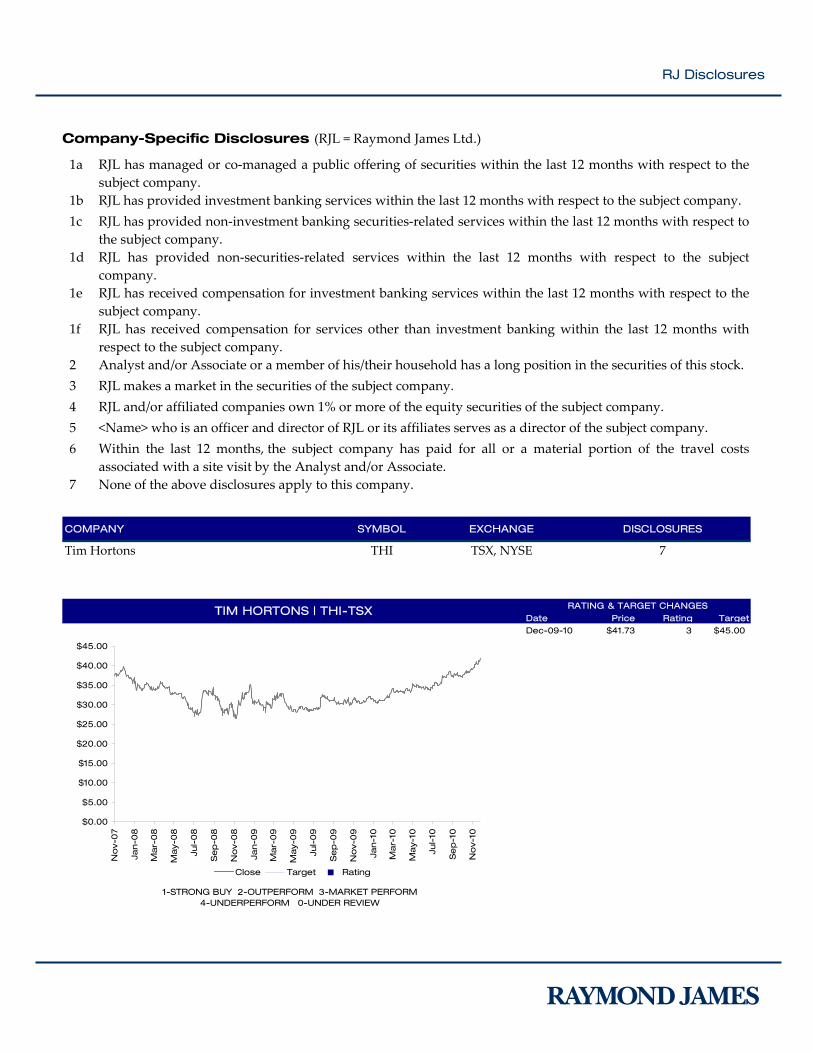
RJ Disclosures
Company-Specific Disclosures (RJL = Raymond James Ltd.)
1a RJL has managed or co‐managed a public offering of securities within the last 12 months with respect to the subject company.
1b RJL has provided investment banking services within the last 12 months with respect to the subject company. 1c RJL has provided non‐investment banking securities‐related services within the last 12 months with respect to
the subject company. 1d RJL has provided non‐securities‐related services within the last 12 months with respect to the subject
company. 1e RJL has received compensation for investment banking services within the last 12 months with respect to the
subject company. 1f RJL has received compensation for services other than investment banking within the last 12 months with
respect to the subject company. 2 Analyst and/or Associate or a member of his/their household has a long position in the securities of this stock. 3 RJL makes a market in the securities of the subject company. 4 RJL and/or affiliated companies own 1% or more of the equity securities of the subject company. 5 <Name> who is an officer and director of RJL or its affiliates serves as a director of the subject company. 6 Within the last 12 months, the subject company has paid for all or a material portion of the travel costs
associated with a site visit by the Analyst and/or Associate. 7 None of the above disclosures apply to this company.
COMPANY SYMBOL EXCHANGE DISCLOSURES
Tim Hortons THI TSX, NYSE 7
Date Price Rating TargetDec-09-10 $41.73 3 $45.00
TIM HORTONS | THI-TSX RATING & TARGET CHANGES
1-STRONG BUY 2-OUTPERFORM 3-MARKET PERFORM 4-UNDERPERFORM 0-UNDER REVIEW
$0.00
$5.00
$10.00
$15.00
$20.00
$25.00
$30.00
$35.00
$40.00
$45.00
No
v-0
7
Jan-0
8
Mar-
08
May-
08
Jul-
08
Sep
-08
No
v-0
8
Jan-0
9
Mar-
09
May-
09
Jul-
09
Sep
-09
No
v-0
9
Jan-1
0
Mar-
10
May-
10
Jul-
10
Se
p-1
0
No
v-10
Close Target Rating
R A Y M O N D J A M E S LT D . CA N A D I A N IN S T I T U T I O N A L E Q U I T Y T E A M W W W . R A Y M O N D J A M E S . C A
EQUITY RESEARCH HE A D O F EQ U I T Y RE S E A R C H
Daryl Swetlishoff, CFA 604.659.8246
C O N S U M E R P R O D U C T S & R E T A I L
CO N S U M E R PR O D U C T S & RE T A I L Kenric Tyghe, MBA 416.777.7188 Sara Kohbodi (Associate) 416.777.4916
E N E R G Y
OI L & GA S SE R V I C E S , HE A D O F EN E R G Y RE S E A R C H Andrew Bradford, CFA 403.509.0503 Nick Heffernan (Associate) 403.509.0511
I N T E R N A T I O N A L O I L & GA S Rafi Khouri, B.Sc, MBA 403.509.0560 Braden Purkis (Associate) 403.509.0534
O I L & GA S RO Y A L T Y TR U S T S / O I L & GA S PR O D U C E R S Kristopher Zack, CA, CFA 403.221.0414 Gordon Steppan (Associate) 403.221.0411
O I L SA N D S / O I L & GA S PR O D U C E R S Justin Bouchard, P.Eng, CFA 403.509.0523 Christopher Cox (Associate) 403.509.0562
O I L & GA S PR O D U C E R S Luc Mageau, CFA 403.509.0505
I N D U S T R I A L S P E C I A L S I T U A T I O N S
AE R O S P A C E & AV I A T I O N / IN D U S T R I A L PR O D U C T S & SE R V I C E S HE A D O F I N D U S T R I A L RE S E A R C H
Ben Cherniavsky 604.659.8244 Theoni Pilarinos, CFA (Associate) 604.659.8234 Greg Jackson (Associate) 604.659.8262
I N D U S T R I A L PR O D U C T S & SE R V I C E S Frederic Bastien, CFA 604.659.8232 Jamil Murji, CFA (Associate) 604.659.8261
I N D U S T R I A L PR O D U C T S & SE R V I C E S Steve Hansen, CMA, CFA 604.659.8208 Arash Yazdani, MBA (Associate) 604.659.8280
M I N I N G
BA S E ME T A L S & MI N E R A L S , HE A D O F MI N I N G RE S E A R C H Tom Meyer, P.Eng., CFA 416.777.4912 Adam Low, CFA 416.777.4943 Miroslav Vukomanovic (Associate) 416.777.7144
PR E C I O U S ME T A L S Brad Humphrey 416.777.4917 Gary Baschuk 416.777.7098 Afjal Mohammad (Associate) 416.777.7084
UR A N I U M / JU N I O R EX P L O R A T I O N Bart Jaworski, P.Geo. 604.659.8282 David Sadowski (Associate) 604.659.8255 Graham Morrison (Associate) 604.659.8238
P A P E R & F O R E S T P R O D U C T S
PA P E R & FO R E S T PR O D U C T S Daryl Swetlishoff, CFA 604.659.8246 David Quezada (Associate) 604.659.8257
R E A L E S T A T E
RE A L ES T A T E & REITS Mandy Samols, CA, CFA 416.777.7175 Tracy Reynolds (Associate) 416.777.7042
T E C H N O L O G Y
TE C H N O L O G Y, AL T E R N A T I V E EN E R G Y & CL E A N TE C H Steven Li, CFA 416.777.4918 Anthony Jin, MBA, P.Eng (Associate) 416.777.6414 Diane Yu (Associate) 416.777.7150
EQUITY RESEARCH PUBLISHING SE N I O R SU P E R V I S O R Y AN A L Y S T
Heather Herron 403.509.0509 AC T I N G HE A D O F PU B L I S H I N G
Cynthia Lui 604.659.8210 Kevin LaRose (Supervisory Analyst | Editor) 416.777.7172 Ashley Ramsay (Research Editor) 604.659.8226 Inder Gill (Research Editor) 604.659.8202 Deborah Cheetham (Publishing Assistant) 604.659.8200 Christine Marte (Research Publisher) 604.659.8200
INST ITUT IONAL EQUITY SALES HE A D O F SA L E S
Mike Westcott 416.777.4935 Michelle Baldry (Marketing Coordinator) 416.777.4951
T O R O N T O (CAN 1.888.601.6105 | USA 1.800.290.4847)
Laura Arrell (U.S. Equities) 416.777.4920 Sean Boyle 416.777.4927 Jeff Carruthers, CFA 416.777.4929 Jon De Vos (London) 0.207.426.5632 Richard Eakins 416.777.4926 Jonathan Greer 416.777.4930 Aman Jain 416.777.4949 Dave MacLennan 416.777.4934 Robert Mills 416.777.4945 Doug Owen 416.777.4925 Nicole Svec-Griffis, CFA (U.S. Equities) 416.777.4942 Lakshmi Thurai (London) 0.207.426.5626 Neil Weber 416.777.4931 Carmela Avella (Assistant) 416.777.4915 Ornella Burns (Assistant) 416.777.4928
V A N C O U V E R (1.800.667.2899)
Scot Atkinson, CFA 604.659.8225 Doug Bell 604.659.8220 Terri McEwan (Assistant) 604.659.8228
M O N T R E A L (514.350.4450 | 1.866.350.4455)
John Hart 514.350.4462 David Maislin, CFA 514.350.4460 Elliott Soifer 514.350.4472 Tanya Hatcher (Assistant) 514.350.4458
INST ITUT IONAL EQUITY TRADING CO-HE A D O F TR A D I N G
Bob McDonald, CFA 604.659.8222 Andrew Foote, CFA 416.777.4924
T O R O N T O (CANADA 1.888.601.6105 | USA 1.800.290.4847)
Pam Banks 416.777.4923 Anthony Cox 416.777.4922 Ross Davidson 416.777.4981 Oliver Herbst 416.777.4947 Andy Herrmann 416.777.4937 Rebecca Joseph 416.777.4938 Eric Munro, CFA 416.777.4983 James Shields 416.777.4941 Bob Standing 416.777.4921 Peter Mason (Assistant) 416.777.7195
V A N C O U V E R (1.800.667.2899)
Nav Cheema 604.659.8224 Fraser Jefferson 604.659.8218 Derek Oram 604.659.8223
M O N T R E A L (514.350.4450 | 1.866.350.4455)
Sebastien Benoit 514.350.4466 Joe Clement 514.350.4470
RETA IL RESEARCH & D ISTR IBUT ION Don Ogden, CFA 604.659.8227 Samantha Barrett, CFA 604.659.8235 Arno Richter (Associate) 604.659.8243 Lauren Corscadden (Assistant) 604.659.8233
INST ITUT IONAL EQUITY OFF ICES Calgary Suite 2500 707 8th Avenue SW Calgary, AB T2P 1H5 403.509.0500
Montreal Suite 1420 1002 Sherbrooke St W Montreal, PQ H3A 3L6 514.350.4450 Toll Free: 1.866.350.4455
Vancouver Suite 2200 925 West Georgia Street Vancouver, BC V6C 3L2 604.659.8200 Toll Free: 1.800.667.2899
Toronto Suite 5400, Scotia Plaza 40 King Street West Toronto, ON M5H 3Y2 416.777.4900 Toll Free Canada: 1.888.601.6105 Toll Free USA: 1.800.290.4847
International Headquarters The Raymond James Financial Center 880 Carillon Parkway St.Petersburg, FL USA 33716 727.567.1000