Embed Size (px)
Citation preview
Tilburg University
Essays on corporate takeovers
Vansteenkiste, Cara
Publication date:2018
Document VersionPublisher's PDF, also known as Version of record
Link to publication in Tilburg University Research Portal
Citation for published version (APA):Vansteenkiste, C. (2018). Essays on corporate takeovers. CentER, Center for Economic Research.
General rightsCopyright and moral rights for the publications made accessible in the public portal are retained by the authors and/or other copyright ownersand it is a condition of accessing publications that users recognise and abide by the legal requirements associated with these rights.
• Users may download and print one copy of any publication from the public portal for the purpose of private study or research. • You may not further distribute the material or use it for any profit-making activity or commercial gain • You may freely distribute the URL identifying the publication in the public portal
Take down policyIf you believe that this document breaches copyright please contact us providing details, and we will remove access to the work immediatelyand investigate your claim.
Download date: 11. Mar. 2022
ESSAYS ON CORPORATE TAKEOVERS
PROEFSCHRIFT
ter verkrijging van de graad van doctor aan Tilburg University op gezag van de
rector magnificus, prof. dr. E.H.L. Aarts, in het openbaar te verdedigen ten
overstaan van een door het college voor promoties aangewezen commissie in de
aula van de Universiteit op maandag 18 juni 2018 om 10.00 uur door
CARA VANSTEENKISTE
geboren op 21 november 1991 te Gent, België

PROMOTOR: Prof. dr. L.D.R. Renneboog
COPROMOTOR: Dr. A. Manconi
OVERIGE COMMISSIELEDEN: Prof. dr. O.G. Spalt
Prof. dr. J. Franks
Dr. F. Braggion
Dr. P.C. de Goeij
Dr. C.A.R. Schneider

1
Acknowledgements
In December of 2013 I never would have believed that, for the next five years, I would spend
my days in Tilburg. I was starting the last semester of my M.Sc. studies in Leuven and, being
indecisive as ever, I had applied to a broad set of Ph.D. programs all over Europe, none of
which involved going to the Netherlands. Until, some weeks later, I received a phone call
asking whether I would be interested in visiting Tilburg University. One return journey to
Tilburg later, I had made my decision: I would start the Research Master program and
hopefully become a Ph.D. candidate at the Tilburg Finance Department.
It was the start of an exciting, but also challenging couple of years in which I grew as
a researcher, but also as a person. This thesis is the product of those years, and I would not
have been able to complete it without the help of so many different people.
First and foremost, I would like to thank my supervisor Luc Renneboog, as without
him I would never have started in Tilburg, but I also would never have had the many amazing
opportunities this Ph.D. has given me. He has not only been a great mentor and supervisor
in terms of research, but also on a more personal level when things got a bit more stressful.
I am positive I could not have asked for a better supervisor who, besides juggling research
and a busy family life, was always there when he was needed. Second, I am very thankful to
my co-supervisor Alberto Manconi. Although we did not talk much, he was always available
when I asked him for feedback on my work.
I am grateful to the remaining members of my dissertation committee, Fabio
Braggion, Peter de Goeij, Oliver Spalt, Christoph Schneider, and Julian Franks. Their feedback
has been invaluable in the development of my thesis, and my papers would have looked quite
different without their comments. I would also like to thank Marco Da Rin for his enthusiasm
in setting up the reading group, as going through so many different papers has enabled me
to grow tremendously as a researcher. I would also like to thank Allen Ferrell for hosting me
at Harvard University in 2016, as this has given me the opportunity to not only discuss with
many researchers at Harvard, but also to present my work at MIT and Boston University. My
gratitude also goes to my co-authors on my papers, of course Luc Renneboog, but also Hao

2
Liang, Peter Szilagyi, and Isabel Feito-Ruiz for always providing useful insights on our joint
projects. I am especially grateful to Hao for his invaluable support and feedback during the
job market.
I could not have completed my Ph.D. without being able to share my joys and struggles
with my colleagues at the Finance Department. In particular, getting through the research
master would have been much more difficult without Gabor, Zhaneta, Emanuele, Haikun, and
Camille to share the ups and downs. I would also like to thank Maaike and Kristy for our
walks in the forest during the Ph.D. and for all our conversations about all aspects of life. In
addition, I would like to thank Loes, Helma, and Marie-Cécile for always being available to
chat and for their excellent administrative support.
Finally, I am forever grateful to my family and friends for their unconditional support
and encouragement. To my parents and grandparents, for always supporting my choices,
even when choosing Tilburg over Cambridge seemed like an odd thing to do, or when Tilburg
seemed like another world away. To my friends, for always being able to provide distraction
when necessary and for reminding me that there is life outside of research. And lastly, to Jarl,
for carrying the biggest burden of keeping me sane during this crazy process, for always
believing in me when things got though, and for always having my back.
Cara Vansteenkiste
Tilburg, April 2018
ESSAYS ON CORPORATE TAKEOVERS
3
Introduction
Mergers and acquisitions (M&As) have a significant impact on the firm’s operations and
activities and are among the most important events in a firm’s lifecycle. In the last 30 years,
the global market for M&As amounted to a volume of more than $20 trillion, with some
individual transaction values exceeding that of a small country’s GDP: the 2016 deal between
the German drug company Bayer and US-based Monsanto for example was valued at $66
billion, exceeding the 2015 GDP of Luxembourg ($57.8 billion). M&As enable firms to expand
into new markets, realize cost synergies, or benefit from cross-country differences in rules
and regulations. Despite these apparent benefits and the vast amounts of money and
resources spent on takeovers, hundreds of academic studies have shown that shareholders
earn zero or negative returns following a takeover announcement, with this effect being even
more pronounced when considering the firm’s operational performance.
This then begs the question: why do bidders persist in undertaking M&As while
decades of research have shown that the ex-ante probability of a successful and profitable
takeover is low? The complexity of the M&A process can pose challenges for even the most
skilled and experienced acquirers. Existing studies explain the returns around M&As by
taking a short-term view, or by concentrating on one or a few features of the firm, deal,
management, board, or country. This however only provides a limited perspective on the
complexity of the underlying process, given that short-run expectations regarding the deal’s
performance can deviate from long-run realizations. In the first chapter of this thesis, we
therefore compile the evidence on M&A success or failure and identify what variables
determine the success of a takeover in terms of long-run shareholder returns and firm
performance.
Our study of the literature identifies a number of transaction characteristics that
prove to be relatively consistent predictors of long-run performance. First, serial acquirers’
performance declines deal by deal as the firm increases its acquisitiveness, with CEO
overconfidence as the main driver of this underperformance. Second, performance- and
equity-based compensation contracts can deter managers from making value-destroying
INTRODUCTION
4
acquisitions through the negative effect on their own long-run wealth and by aligning
managers’ and shareholders’ interests. Third, board members with multiple directorships
are generally more reputable and have better monitoring and advisory skills, resulting in
more value-generating M&As and better long-run performance. Also female executives and
directors, and experienced target CEOs are associated with better deal performance. Fourth,
related or focused acquisitions outperform unrelated or diversifying acquisitions, as
acquirers in related deals are more likely to have the skills and resources required to
successfully integrate the target firm. Finally, an important source of synergies are cross-
country differences in corporate governance standards and investor protection, as M&As
enable firms to transfer governance standards across countries.
Given the importance of cross-country differences in rules and regulations as a source
of value creation in M&As, the second chapter of this thesis investigates how differences in
creditor protection affect bond performance around cross-border deal announcements. We
use a global sample of cross-border M&As by Eurobond-issuing firms to show that returns
to bidder bondholders are highly sensitive to the strength and enforcement of creditor
protection. The increase in global cooperation between jurisdictions in multinational
insolvencies enables creditors to engage in insolvency arbitrage and start insolvency
proceedings in the jurisdiction that suits their claims the most. Bondholders of bidding firms
therefore respond more positively to deals that expose their firm to a jurisdiction with
stronger creditor rights and more efficient claims enforcement through courts, as acquiring
a target in a more creditor-friendly country increases the threat and implications of starting
insolvency proceedings in the target’s country. We find that these positive spillover effects
are stronger for firms that are more likely to default, such as firms with higher asset risk,
longer maturity bonds, and a higher likelihood of financial distress. This paper has been
published in the Journal of International Business Studies (2017).
The third chapter investigates a second stakeholder group in a cross-border deal
setting, namely the firm’s employees. We use a global firm-level database on employee
policies to investigate how an acquirer’s investment in its employee relations affects the
value creation process in domestic and cross-border M&As. Given the importance of
employees for firms’ operations, it is crucial for firms to know how employee relations relate
to shareholders’ reactions when acquiring a domestic or a foreign target. We show that
ESSAYS ON CORPORATE TAKEOVERS
5
whereas an acquirer’s investment in employee relations is positively related to shareholder
value and firm performance when acquiring domestically, this effect is reversed when
acquiring a foreign target. These results are mainly driven by the provision of monetary
incentives such as a bonus plan or health insurance benefits, but the negative effect in cross-
border deals is reduced in deals where the acquirer has acquisition experience in the target’s
country, or where the social security laws in the target’s county are weaker. Overall, this
paper shows that providing employee welfare in the form of generous benefits is not
absolutely good or bad for value creation in M&As: a trade-off exists between value-
enhancing incentive effects and the labor-related frictions that arise in cross-border deals.
The fourth and final chapter investigates how acquiring a minority stake in a target
firm before committing to a majority stake affects the takeover process in terms of bid
premiums, shareholder returns, and post-deal performance. Based on a global sample of
M&A deals between 1990 and 2015, I find that two-stage acquisitions (which amounted to
almost 20% of the global public M&A volume) are less affected by information asymmetries
and that they mitigate pre-emptive overbidding by deterring rival firms from making
competing offers. I confirm these results for a US sample, using the increase in trade secret
protection across US states as an exogenous shock to target value uncertainty, and the
reduction in import tariffs across industries as a shock to potential bidder competition. In
addition, I find that two-stage deals are more likely to be completed, they are completed
faster, targets are less likely to be divested, and they perform better in the long run. Overall,
these results suggest that two-stage acquisitions can offer benefits to acquiring firms when
information asymmetries increase or when potential bidder competition is high.
CONTENTS
6
Contents Acknowledgements ........................................................................................................................ 1
Introduction ...................................................................................................................................... 3
Contents .............................................................................................................................................. 6
1. What Goes Wrong in M&As? .................................................................................................... 9
1. Introduction ......................................................................................................................................... 10
2. Measuring long-run performance ............................................................................................... 15
3. Long-run operating performance ................................................................................................ 20
4. Empirical findings on short- & long-run stock returns & operating performance .. 22
4.1 Short-run returns ...................................................................................................................... 22
4.2 Long-run returns ....................................................................................................................... 24
5. What leads to success or failure in M&As? .............................................................................. 26
5.1 Serial acquirers .......................................................................................................................... 27
5.2 CEO Incentives and Compensation ..................................................................................... 33
5.3 CEO and director connections and networks ................................................................. 36
5.4 Board characteristics ............................................................................................................... 38
5.5 Corporate culture ...................................................................................................................... 42
5.6 Ownership structure ................................................................................................................ 43
5.7 Cultural distance ........................................................................................................................ 48
5.8 Geographical distance .............................................................................................................. 52
5.9 Spillovers in corporate governance and investor protection ................................... 53
5.10 Industry and product market relatedness .................................................................... 55
5.11 Distressed target acquisitions ........................................................................................... 57
5.12 Post-merger restructuring and divestitures ................................................................ 59
5.13 Political economics ................................................................................................................. 61
5.14 Means of payment and sources of financing ................................................................ 63
5.15 Tobin’s Q, historical performance, and merger waves ............................................. 66
5.16 Other dimensions .................................................................................................................... 67
6. Suggestions for future research ................................................................................................... 73
7. Conclusion ........................................................................................................................................... 75
2. Creditor rights, claims enforcement, and bond performance in M&As................. 92
ESSAYS ON CORPORATE TAKEOVERS
7
1. Introduction ......................................................................................................................................... 93
2. Background and Hypotheses ........................................................................................................ 95
3. Sample Selection, Methodology, and Descriptive Statistics .............................................. 99
3.1 Sample Selection and Methodology .................................................................................... 99
3.2 Country-level Measures of Creditor Protection .......................................................... 102
3.3 Descriptive Statistics ............................................................................................................. 103
4. Empirical Results ............................................................................................................................ 104
4.1 Abnormal Bond Returns around M&A Announcements ......................................... 104
4.2 Creditor Protection Spillover Effects in Cross-Border M&As................................ 106
4.3 The Impact of Deal & Firm Characteristics on Abnormal Bidder Bond Returns107
4.4 Multivariate Analysis of Creditor Protection Spillovers.......................................... 110
4.5 Subsample Analysis ............................................................................................................... 113
4.6 Asset Risk, Bond Maturity, and Stock Market Reaction to Previous Deal ........ 115
4.7 Further Robustness Tests ................................................................................................... 116
5. Conclusion ......................................................................................................................................... 121
3. Cross-Border Acquisitions and Employee Relations ................................................ 130
1. Introduction ...................................................................................................................................... 131
2. Data and Method ............................................................................................................................. 136
2.1 Data .............................................................................................................................................. 136
2.2 Empirical Strategy .................................................................................................................. 138
3. Results ................................................................................................................................................. 140
3.1 Descriptive Statistics ............................................................................................................. 140
3.2 Employee Relations and Shareholder Returns in Domestic and Cross-Border
Takeovers ......................................................................................................................................... 144
3.3 Unbundling Employee Incentives .................................................................................... 147
3.4 Labor-Related Frictions in Cross-Border Deals: Channels ..................................... 151
3.5 Employee Relations and Post-Merger Performance ................................................. 155
3.6 The Role of Target Firm’s Employee Relations & Announcement Returns .... 156
4. Robustness and Alternative Explanations ............................................................................ 158
4.1 Placebo Test on Employee Relations and Propensity Score Matching .............. 158
4.2 Alternative Explanations ..................................................................................................... 161
4.3 Instrumental Variable Approach ...................................................................................... 163
CONTENTS
8
4.4 Other Robustness Tests ....................................................................................................... 164
5. Conclusions ....................................................................................................................................... 165
Appendix ................................................................................................................................................. 172
4. Two-Stage Acquisitions and Deal Premiums ............................................................... 183
1. Introduction ...................................................................................................................................... 184
2. Data, Sample Selection, and Identification ............................................................................ 191
2.1 Data Sources and Sample Selection ................................................................................. 191
2.2 Identification Strategy ................................................................................................................ 193
2.2.1 Treatment Effects Model .................................................................................................. 193
2.3 Descriptive Statistics ............................................................................................................. 199
3. Two-Stage Acquisitions and Bid Premiums ......................................................................... 202
3.1 Treatment Effects Model ..................................................................................................... 202
3.2 Exogenous Variation in Target Value Uncertainty and M&A Competition ...... 209
4. Selling vs Expanding a Minority Stake .................................................................................... 219
4.1 Investigating the Decision-Making Process when Expanding a Minority Stake220
4.2 At What Price Does a Minority Stake Acquirer Sell? ................................................. 224
5. Deal Completion, Long-Run Performance and Robustness Tests ................................ 226
5.1 Deal Completion and Long-Run Performance ............................................................. 226
5.2 Robustness Tests .................................................................................................................... 228
6. Conclusion ......................................................................................................................................... 233
Appendix ................................................................................................................................................. 238
ESSAYS ON CORPORATE TAKEOVERS
9
Chapter 1
What Goes Wrong in M&As?
with Luc Renneboog
Abstract – This paper provides an overview of the academic literature on the market for
corporate control, and focuses specifically on firms’ performance around and after a
takeover. Hundreds of academic studies have shown that bidding firms’ shareholders earn
returns close to zero or even negative returns after a takeover, and the lack of significant
positive returns becomes even more pronounced when considering the firm’s long-run
performance. Nevertheless, the aggregate M&A market amounts to several trillions USD on
an annual basis. In this light, we wonder about factors leading to M&A success or failure and
seek an answer to the question: What goes wrong in mergers and acquisitions? We also
provide an overview of the methods and techniques used to analyse post-takeover
performance, and identify that deal performance is affected by some key determinants such
as CEO overconfidence, CEO compensation contracts, board independence and busyness,
differences in governance standards, and target relatedness.
Keywords: Takeovers; Mergers and Acquisitions; Long-Run Performance; Corporate
Governance
JEL Classification: G34
CONTENTS
10
1. Introduction
Mergers and acquisitions (M&As) are among the most important events in a company’s
lifecycle and have a significant impact on the firm’s operations and activities. M&As enable
firms to grow faster than firms that rely on organic growth, penetrate new markets and
cross-sell into a new customer base, expand their scope by acquiring a set of complementary
products, buy a pipeline of R&D intensive products or patents, avoid upstream or
downstream market foreclosure by suppliers, reduce taxes by means of new subsidiaries
situated in tax-friendly countries, realize cost synergies by eliminating surplus facilities and
overheads, reduce competition, improve access to capital, etc.
Despite the vast amounts of money and resources spent on takeovers, hundreds of
academic studies have shown that the bidding firms’ shareholders either lose out at
takeovers or are expected to gain rather little on average. The abnormal returns at a takeover
announcement are approximately zero and many deals perform worse over the long run.
One reason for this anticipated poor bidder performance at announcement is the very high
premiums paid to target firms. These average 25 to 35% above the target’s pre-
announcement market value and are even much higher in case of bidder competition or
hostile takeovers (Betton, Eckbo, and Thorburn, 2008; Martynova and Renneboog, 2008a),
suggesting that the target firm is able to extract the marginal dollar related to the expected
synergies out of the pockets of the bidding firm.
When we study the share price evolution or operational performance of the merged
firm over a longer time window (two to three years subsequent to the transaction), we
equally find little evidence that bidders’ shareholders receive a return on takeover deals
(Andrade, Mitchell, and Stafford, 2001; Moeller, Schlingemann, and Stulz, 2004), as the
anticipated synergies at the announcement of the deal are frequently overestimated (Jensen
and Ruback, 1983; Agrawal, Jaffe, and Mandelker, 1992; Agrawal and Jaffe, 2000).
Considering the lack of value creation for the bidder, we wonder what goes wrong in
takeovers? Why do bidders persist in undertaking M&As while decades of research show
that the ex-ante probability of a successful and profitable takeover is low? The complexity of
the M&A process can pose challenges for even the most skilled and experienced acquirers. A
great number of studies have thus attempted to identify the variables that determine the
success of a takeover in terms of shareholder returns and firm performance. These studies
ESSAYS ON CORPORATE TAKEOVERS
11
usually explain the returns around M&As by concentrating on only one or a few features of
the firm, deal, management, board, or country. While this improves our understanding of
M&A performance, it only provides a limited perspective on the complexity of the underlying
process. In this paper, we compile the evidence on M&A success or failure.
As an illustration of how a firm’s characteristics and decision-making processes affect
its takeover policy, we turn to Royal Ahold, a Dutch classic showcase which got everything
wrong in terms of M&A strategy and internal and external governance. In the 1990s, Royal
Ahold was an (at first sight) very successful food retailing company with a worldwide
presence. Its downfall in 2003 and near bankruptcy serves as a caveat for the consequences
of an ill-considered policy of serial acquisitions. Royal Ahold, referred to as “Europe’s Enron”,
was led by narcissistic managers, had adopted questionable corporate governance
mechanisms, committed accounting fraud, and adopted a problematic acquisition strategy.
In 2003, Ahold’s CEO and CFO were forced to resign after media coverage of repeated
financial fraud consisting of the overstating of corporate profits by €1 billion, the signing of
side letters to takeover agreements and joint ventures which were kept secret (also to the
external auditors), and the inappropriate consolidation of joint ventures and partial
acquisitions in the financial statements. Ahold’s market value plunged to €3.3 billion, an
almost 90% decline from a €30 billion high in 2001. The firm had acquired over 70
companies in 28 countries in less than a decade. So, what had gone wrong with one of the
world’s biggest food retailers?
Ahold’s CEO, Cees van der Hoeven, can be considered as a textbook case of a CEO
“superstar” (Malmendier and Tate, 2009) affected by hubris, overconfidence, narcissism
(Aktas, de Bodt, Bollaert, and Roll, 2015), and prone to empire-building (Dixon, 2003): “He
became addicted to his reputation as an infallible corporate titan”.1 At best, he was described
as a strong and persuasive personality (Smit, 2004; De Jager, 1997), and the fact that he won
several awards as best CEO and manager of the year further convinced him of his unique
abilities (Aras and Crowther, 2010). In his first annual report, CEO Verhoeven
formulated a corporate policy which explicitly focused on maximizing the returns to
shareholders. This would be achieved through a growth strategy which consisted of a
1 The Economist, February 27th 2003, http://www.economist.com/node/1610552.
CONTENTS
12
doubling of profits every 5 years and a 15% annual growth in earnings per share, 5% of
which was to come from acquisitions and 10% from internal growth (de Jong et al., 2007).
This was a questionable strategy: accounting performance objectives such as growth in
earnings do not necessarily imply value creation, especially when growth is bought through
an aggressive acquisition strategy. Following the initially successful growth via acquisitions,
Ahold’s high equity value enabled it to acquire firms more easily by making all-equity offers.
This gave management more discretion to make acquisitions that valued growth over
shareholder value. The firm’s strategy gradually shifted and it increasingly focused on
acquisitions instead of internal growth to meet its growth targets.2 Ahold became a serial
acquirer: fueled by the overconfidence of its CEO, it acquired 106 firms from 1989 to 2003,
out of which 18 in the year 2000 alone (de Jong et al., 2007).
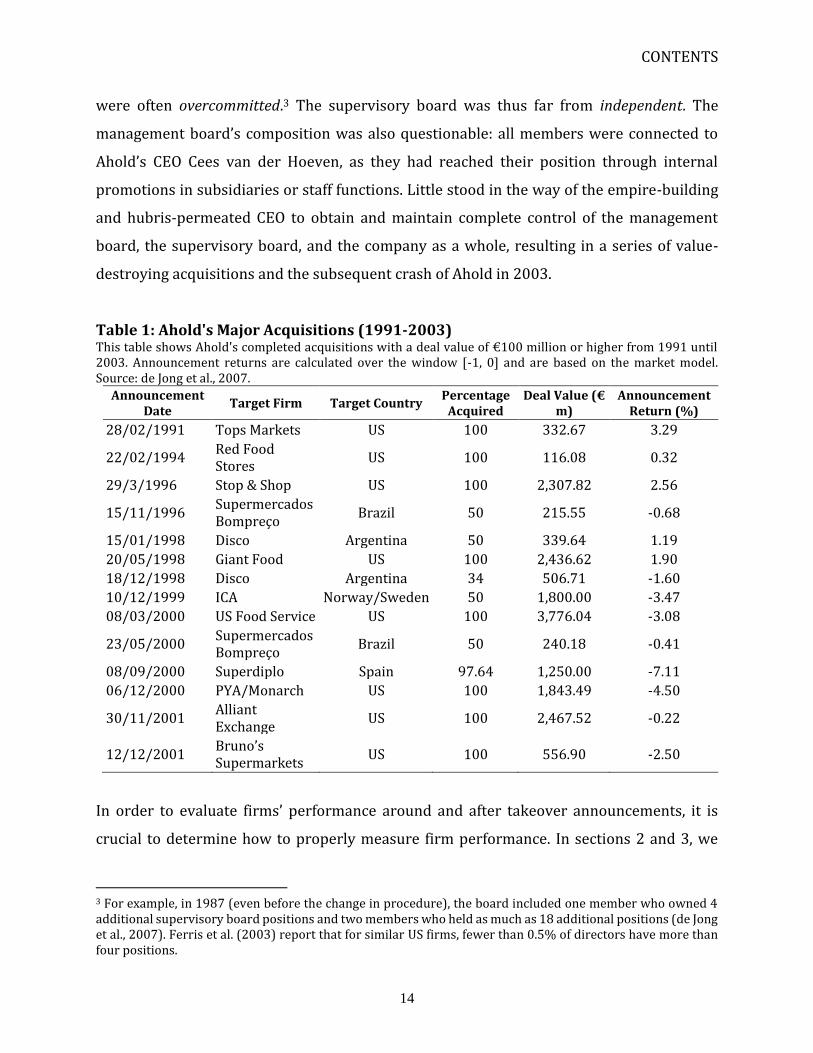
The market reactions to Ahold’s takeover announcements gradually declined the
more firms it acquired (Table 1). Although growth through acquisitions proved initially
successful with stock markets reacting positively to its takeovers, Ahold shifted its takeover
strategy towards sectors in which it had no experience and which had little relatedness to its
original activities in order to maintain its growth path. For example, its entry into the
American food production market through the takeover of US Foodservice was –
unsurprisingly - perceived negatively by shareholders, as the firm had no experience in this
sector and there was little overlap with its core activities.
A similar pattern appeared for the stock market reaction to the financing of the
takeovers, which mainly consisted of equity issues and convertible bond issues. Stock price
performance was an important reinforcing factor in Ahold’s acquisition pattern: the higher
the stock price, the smaller the seasoned equity issue for the equity offer to the target.
Ahold’s house bank, ABN Amro, played a significant role in maintaining high stock price
performance through its analyst recommendations. These analysts were more optimistic
than those of other banks and more frequently gave the advice to buy Ahold’s shares. In the
spirit of Jensen (2005), these high stock prices facilitated making the value-destroying
acquisitions that (incorrectly) appeared beneficial to firm growth. It is surprising that
2 Although the bonuses of the management team would be made dependent on the firm’s EPS to avoid shareholder-management conflicts, these incentive compensation plans soon lost their purposes as the executives quickly sold off their shares obtained in the stock option plans.
ESSAYS ON CORPORATE TAKEOVERS
13
analysts and investors were myopic to the consequences of Ahold’s policies, although an
explanation may be the overoptimism in the stock and M&A markets that grew substantially
over the 1990s until March 2000.
Ahold not only expanded across product markets, but also across geographical
markets. It was operating in 27 countries; it had operations not only in the Netherlands and
in the US, but also in Brazil, Thailand, Guatemala, China, Sweden, and Spain. Still, the
operating environment in Asia and Latin America differed substantially from Ahold’s initial
operations in the US and Europe, and attempts to resolve cross-country cultural differences
and integrate target firms were unsuccessful and even led to a withdrawal from countries
such as China and Singapore.
So, one wonders why none of the firm’s large shareholders or the board step in when
stock performance started deteriorating? Although Ahold was initially a family firm, the
ownership of the family gradually diluted in order to finance the group’s strong growth, such
that no major blockholder was left to monitor management’s decision making. After the
kidnapping and murder of one of the family members, the company’s control shifted from
the family to a professional management team. The management (and CEO Cees van der
Hoeven in particular) installed a battery of takeover defences in order to maintain its hold
on the firm (de Jong et al, 2007). By 2000, Ahold’s shares were held by dispersed
shareholders and a few institutional investors, who strongly advised the CEO to slow down
the acquisition rate as the firm had spent €19 billion on acquiring 74 companies in less than
10 years and, by now, its stock performance was quickly deteriorating. However, few
shareholders held voting rights such that management’s actions could not be constrained.
Management had put a large part of the voting shares in a trust which issued the non-voting
certificates that had been sold to ‘shareholders’, while the votes of the shares in the trust
were controlled by management.
At the general annual meeting of 2001, Ahold changed its supervisory board
nomination procedure: the supervisory board would make all nominations, and the voting
threshold needed to reject nominations was substantially increased (a 2/3 majority was
needed representing at least half of the voting rights). As a consequence, the supervisory
board largely consisted of former managers who were loyal to the management and who
CONTENTS
14
were often overcommitted.3 The supervisory board was thus far from independent. The
management board’s composition was also questionable: all members were connected to
Ahold’s CEO Cees van der Hoeven, as they had reached their position through internal
promotions in subsidiaries or staff functions. Little stood in the way of the empire-building
and hubris-permeated CEO to obtain and maintain complete control of the management
board, the supervisory board, and the company as a whole, resulting in a series of value-
destroying acquisitions and the subsequent crash of Ahold in 2003.
Table 1: Ahold's Major Acquisitions (1991-2003) This table shows Ahold's completed acquisitions with a deal value of €100 million or higher from 1991 until 2003. Announcement returns are calculated over the window [-1, 0] and are based on the market model. Source: de Jong et al., 2007.
Announcement Date
Target Firm Target Country Percentage
Acquired Deal Value (€
m) Announcement
Return (%)
28/02/1991 Tops Markets US 100 332.67 3.29
22/02/1994 Red Food Stores
US 100 116.08 0.32
29/3/1996 Stop & Shop US 100 2,307.82 2.56
15/11/1996 Supermercados Bompreço
Brazil 50 215.55 -0.68
15/01/1998 Disco Argentina 50 339.64 1.19
20/05/1998 Giant Food US 100 2,436.62 1.90
18/12/1998 Disco Argentina 34 506.71 -1.60
10/12/1999 ICA Norway/Sweden 50 1,800.00 -3.47
08/03/2000 US Food Service US 100 3,776.04 -3.08
23/05/2000 Supermercados Bompreço
Brazil 50 240.18 -0.41
08/09/2000 Superdiplo Spain 97.64 1,250.00 -7.11
06/12/2000 PYA/Monarch US 100 1,843.49 -4.50
30/11/2001 Alliant Exchange
US 100 2,467.52 -0.22
12/12/2001 Bruno’s Supermarkets
US 100 556.90 -2.50
In order to evaluate firms’ performance around and after takeover announcements, it is
crucial to determine how to properly measure firm performance. In sections 2 and 3, we
3 For example, in 1987 (even before the change in procedure), the board included one member who owned 4 additional supervisory board positions and two members who held as much as 18 additional positions (de Jong et al., 2007). Ferris et al. (2003) report that for similar US firms, fewer than 0.5% of directors have more than four positions.
ESSAYS ON CORPORATE TAKEOVERS
15
concentrate on methodologies and techniques used to calculate long-term share price
reactions and operating performance following M&A transactions. We then review the
literature on post-takeover performance in section 4, where the empirical evidence
generally shows negative stock returns and operating performance. Occasionally, we show
short-run announcement returns on the topics for which there is no or hardly any long-run
research. In section 5, we discuss what drives long-term success and failure of takeovers; we
concentrate on managerial quality (including the effect of hubris, overconfidence, and
narcissism of top management), social ties and networks of CEOs and their incentives and
compensation contracts, the structure of the (supervisory) board and the quality and
busyness of its non-executive members, external governance by major shareholders
(institutional investors, insiders, families, all of whom could have different investment
horizons), the characteristics of the transaction (means of payment, sources of financing),
historical financial performance of the parties involved (including targets’ financial distress),
product market relatedness, acquisitiveness of bidder and target (serial acquisitions and
learning), the geographical distance between bidder and target, differences in corporate
cultures, industry specificities, post-merger restructuring and divestitures, and country-
specific variables which matter in cross-border acquisitions (differences in quality of the
corporate governance regulation and rule of law, spillover effects in governance regulation,
differences in the degree of investor protection, country cultural distance, corporate political
orientation). As the M&A literature is vast, we predominantly confine ourselves to the
finance literature, with exception of some topics on corporate culture which has been a focal
area in the strategy literature. In section 6, we will identify the holes in the recent literature
and lay out some ideas for future research; section 7 concludes.
2. Measuring long-run performance
The market for corporate control changes the corporate landscape: 91.4% of all publicly
listed firms in the US engaged in at least one merger or acquisition in the 1990s and 2000s
(Netter, Stegemoller, and Wintoki, 2011). In spite of the vast number of studies on M&As in
the finance literature, the conclusions on takeover performance are often ambiguous. The
research focus is usually on the short-run shareholder wealth effects from the viewpoint of
CONTENTS
16
the target, bidder, or the combined firm, and less on the long-run as it is difficult to isolate
the lasting impact of a takeover on the combined firm. Furthermore, the perspective on
takeovers by a wide range of other stakeholders (often with diverging interests), such as
bondholders, employees, consumers, suppliers, and the society at large, is only rarely taken.
Most of the M&A research has concentrated on the takeover announcement effect by
using event studies that capture the anticipation of the takeovers’ success or failure or, in
other words, the discounted future cash flows generated by the takeover over and above a
market benchmark. The resulting cumulative abnormal stock returns (CARs) are the
deviations from the expected returns measured by basic asset pricing models such as the
CAPM or the Fama-French-Carhart four-factor model. Long-run performance measures the
ultimate success of a takeover as new information on the true synergy value and the
integration processes become gradually available such that the market can correct its
initially (possibly biased) short-term predicted returns. For instance, at the takeover
announcement, the market may not accurately anticipate the resistance of employees or
other stakeholders to the reorganization and integration process due to cultural differences
(Capron and Guillen, 2009).
Long-run effects can be measured in various ways, but they share the concern that it
is not straightforward to isolate the takeover effect from other effects influencing the firm
over the years following the transaction. Long-run studies focus either on the stock price
effects or on the changes in operating performance in the years following the deal. For the
former approach, two choices can significantly affect the magnitude, significance, and even
the sign of the estimated abnormal returns: first, as in short-run event studies, abnormal
returns are usually defined as the excess returns over some benchmark return and the choice
of the benchmark (e.g. the market model, the Fama-French Three/Five Factor model, or the
Fama-French-Carhart four factor model) can yield different results. Second, a decision has to
be made on the event-time techniques to calculate abnormal returns: CARs, buy-and-hold
abnormal returns (BHARs), calendar time abnormal returns (CTARs), or calendar time
portfolio regression returns (CTPRs). The expected benchmark returns in long-run event
studies strongly depend on the asset pricing model employed and, as argued in Fama (1970),
all tests of long-term abnormal performance are joint tests of market efficiency and a market
equilibrium model. As the length of the event window increases, the model choice for
ESSAYS ON CORPORATE TAKEOVERS
17
calculating expected returns becomes increasingly important. Long-term expected returns
systematically suffer from imprecision as they can only be roughly estimated. Small errors
in setting up a benchmark asset pricing model can result in large errors in the abnormal long-
run returns, and therefore can have important consequences for the significance and
magnitude of the results. For example, Andrade et al. (2001) argue that the expected returns
over a three-year window range between 30% and 65% depending on the chosen model,
such that it is difficult to know whether an abnormal return of 15% can be considered
statistically significant.
The majority of takeover studies rely on either time-series or cross-sectional models.
The former comprise e.g. the market model (MM), the capital asset pricing model (CAPM),
and the Fama-French three factor model (FF3), possibly augmented with a momentum
factor. While the parameters in these models are estimated out-of-sample and are usually
assumed to remain stable over time, it is questionable whether this assumption is reasonable
for event windows of up to three or even five years. Cross-sectional models, on the other
hand, rely on a benchmark portfolio or matching portfolio, generally matched on industry,
firm size, and market-to-book ratio. Although additional dimensions, such as the firm’s past
accounting performance, return volatility, stock illiquidity, or capital expenditure can be
included in the matching process, capturing all relevant cross-sectional variation is not
straightforward.
Once the expected returns are estimated, abnormal returns are calculated. As in
short-run event studies, a simple and popular approach for measuring long-run abnormal
returns following a takeover event is to calculate the CARs as the sum of the abnormal
returns over a long event window starting at, prior to, or after the event (see equation (1)
where N stands for the number of events, t1 and t2 are the respective start and end of the
event window, Rit is the return of firm i on date t, and ERit is the expected return resulting
from an asset pricing model). Despite its simplicity, using CARs in a long-run analysis has
encountered a lot of criticism.
(1) 𝐶𝐴𝑅𝑖 = ∑1
𝑁[ ∑ (𝑅𝑖𝑡 − 𝐸𝑅𝑖𝑡)]
𝑁
𝑖=1
𝑡2
𝑡=𝑡1
CONTENTS
18
An alternative popular method is that of the buy-and-hold abnormal returns (BHARs). It
differs from the CARs in that it aggregates the abnormal returns geometrically rather than
arithmetically over the event period, and it allows for compounding whereas the CARs do
not.
(2) 𝐵𝐻𝐴𝑅𝑖 = ∏ (1 + 𝑅𝑖𝑡)𝑡2𝑡=𝑡1 − ∏ (1 + 𝐸𝑅𝑖𝑡)𝑡2
𝑡=𝑡1
Both equations (1) and (2) suffer from methodological and statistical drawbacks in
that they are subject to the bad model problem (Fama, 1998) and assume independence of
individual firm abnormal returns. The first issue relates to the fact that all tests of long-term
abnormal performance are joint tests of market efficiency and the validity of the asset pricing
equilibrium model: even in non-event studies, α tends to be non-zero in a model of expected
returns. This implies that none of the expected returns models are able to capture all of the
systematic patterns in average returns, and this remains a largely unresolved problem in
asset pricing. Barber and Lyon (1997) make a case in favour of BHARs: whereas CARs result
in biased estimates of the actual investor returns, BHARs more accurately measure real
investors’ performance. When investing in assets, investors usually hold them for a specific
time period rather than focus on earning abnormal returns day by day. Still, a concern with
BHARs is that they can also be biased through the influence of new listings, rebalancing of
benchmark portfolios, or the skewness of long-run returns. Lyon, Barber, and Tsai (1999)
address this issue by introducing a bootstrapped skewness-adjusted t-statistic, building on
the methods used in, amongst others, Ikenberry et al. (1995). In contrast, Fama (1998)
favours the CARs over the BHARs because return compounding in BHARs brings about a
stronger skewness in the abnormal returns distribution, and because compounding of
returns results in standard errors that are amplified as the number of periods increases.
With BHARs, standard errors thus increase at a faster rate at longer time windows relative
to the average CAR standard error. Most of the early long-term event studies were almost
exclusively based on BHARs, and both Mitchell and Stafford (2000) and Dutta and Jog (2009)
conclude that no statistically significant returns are found once the biases in the BHAR
methodology are corrected for.
ESSAYS ON CORPORATE TAKEOVERS
19
What CARs and BHARs have in common is that they both use event time (number of
days relative to the event at t0). The second issue with these types of event studies concerns
the assumption that the test statistics assume independently distributed abnormal returns
across firms, whereas M&A events tend to be clustered through time and by industry and are
hence not random. Consequently, samples in event studies are unlikely to consist of
independent observations, leading to cross-correlation of abnormal returns and possibly
overstated test statistics (Kolari and Pynnönen, 2010). Alternatively, one can use calendar
time-based approaches such as calendar time abnormal returns (CTARs) or a calendar time
portfolio regression returns (CTPRs). CTARs are average abnormal returns calculated each
calendar month for all event firms over some expected return benchmark based on an asset
pricing model or a matching portfolio. Many studies prefer a portfolio approach, given the
issues with calculating expected returns based on asset pricing models (Fama’s (1998) bad
model problem). The portfolio variance accounts for the cross-sectional correlation of the
firm’s abnormal returns that occur in M&A studies and addresses the point that M&As are
not random events and cluster over time by industry, resulting in cross-correlated abnormal
returns and upwards biased test statistics. In the CTAR approach, the benchmark returns are
allowed to change over time, and monthly CTARs are sometimes standardized by estimates
of the portfolio’s standard deviation to control for heteroskedasticity induced by the
changing portfolio composition, and to add more weight to periods with more event activity.
The measure of abnormal performance is the time-series mean of the monthly CTARs.
(3) 𝐶𝑇𝐴𝑅𝑡 = 𝑅𝑝𝑡 − 𝐸(𝑅𝑝𝑡), where Rpt is the monthly return on event firm portfolio p
CTPR is based on the intercept from a time-series regression of a series of portfolio
returns on a benchmark set by an asset pricing model, where the portfolio firms have
participated in an M&A event in the past n periods and this is repeated each period. The
intercept from the regression measures the average monthly abnormal return on the event
firm portfolio. In its simplest form (the market model), the model looks like this:
CONTENTS
20
(4) 𝑅𝑝𝑡 − 𝑅𝑓𝑡 = 𝜶𝒑 + 𝛽𝑝(𝑅𝑚𝑡 − 𝑅𝑓𝑡) + 𝜀𝑝𝑡, where Rft is the riskfree rate at time t and αp
is the average monthly abnormal return on event firm portfolio p.
Fama (1998) argues that the monthly returns in the CTPR approach are less
susceptible to the bad model problem, and Mitchell and Stafford (2000) confirm that it is less
sensitive to misspecification than the CTAR calculation. However, the downside of CTPR is
that the number of firms in the portfolio may vary across time periods, and that when each
time period is weighted equally, abnormal returns are harder to identify because periods of
high and low activity could average out (Loughran and Ritter, 2000). Also, when one uses a
factor model to estimate the expected returns, CTPR assumes that the factor loadings are
constant over time, which is unlikely as the event portfolio composition changes every
month and takeover events tend to be clustered through time and by industry. As a result,
the return estimates of CTPR can still be biased.4 Betton, Eckbo, and Thorburn (2008)
compare the matched-firm CTAR technique to the CTPR approach in combination with a
factor model. They report that the matched-firm technique identifies matched firms that
have different factor loadings than the firms in the event sample and therefore also prefer
the CTPR factor model approach which avoids this problem altogether.5 A considerable
number of studies that take into account the issues above still report significantly negative
long-run abnormal returns.
3. Long-run operating performance
The anticipation of real economic gains cannot easily be distinguished from market
mispricing when only examining stock market prices over the short run (Healy, Palepu, and
Ruback, 1992). Accounting-based performance measures – such as ROA, cash flows, sales,
employee growth, or operating margins6 - can be a more direct metric of synergistic gains or
losses, and represent the value-added by the acquisition (Fu, Lin, and Officer, 2013).
4 Brav (2000) proposes an alternative Bayesian predictive methodology relaxing the assumption of independence. However, Mitchell and Stafford (2000) argue that this methodology does not completely solve the independence problem, and for this reason still favour the CTPR approach. 5 Studies using a more complex set of benchmarks represent ambiguous results (see e.g. Franks et al. (1991)). 6 Ravenscraft and Scherer (1987, 1989) use both earnings-based and cash flow-based measures of operating performance, and find that the difference in these measures accounts for the conflicting evidence that post-merger performance declines on the basis of earnings-based measures but increases for cash flow-based measures.
ESSAYS ON CORPORATE TAKEOVERS
21
However, as with long-term stock returns, concerns may arise regarding the statistical
properties and potential measurement errors in studies based on long-run post-takeover
operating performance. The use of accounting data to measure post-merger performance
suffers from inherent noisiness, as mergers often come with restatements, write-downs, or
special depreciation or amortization, making it more difficult to isolate the effect of a merger
event. Issues such as industry clustering of merger events or changes in accounting
standards over time can likewise considerably affect the results. If the merger is a response
to an industry shock, using the firm’s pre-merger performance as a benchmark will not be
sufficient. The pre-and post-merger performance will then need to be adjusted for industry
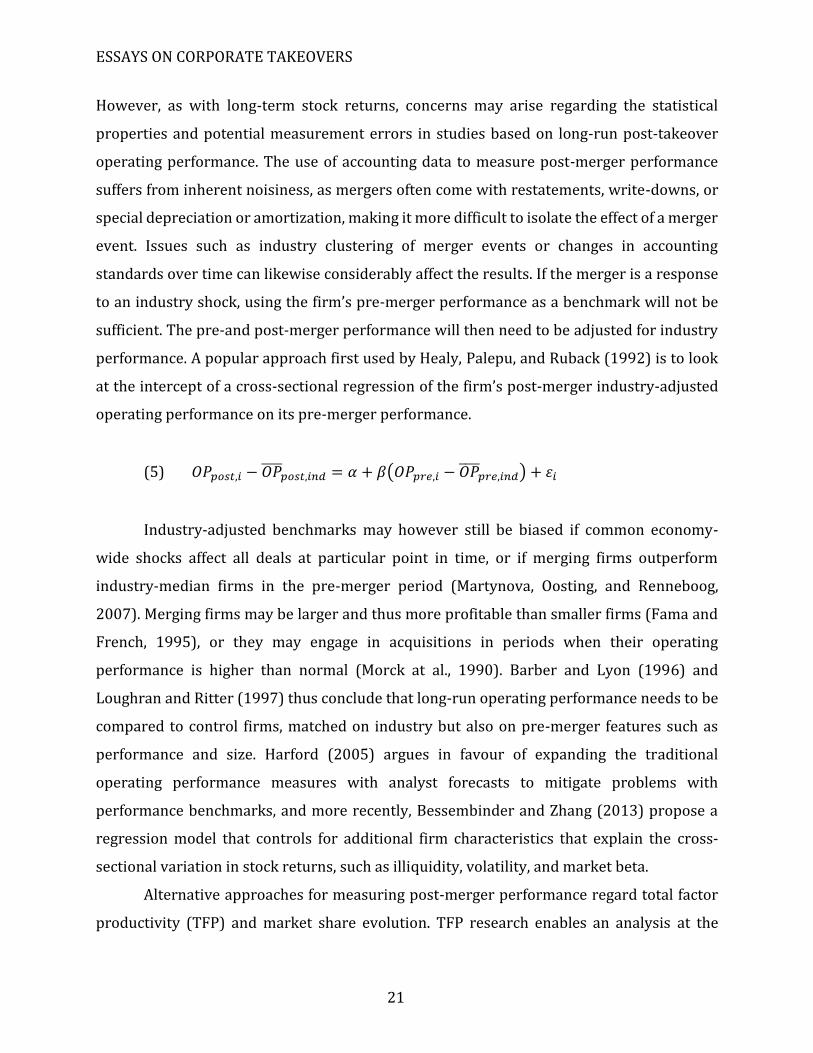
performance. A popular approach first used by Healy, Palepu, and Ruback (1992) is to look
at the intercept of a cross-sectional regression of the firm’s post-merger industry-adjusted
operating performance on its pre-merger performance.
(5) 𝑂𝑃𝑝𝑜𝑠𝑡,𝑖 − 𝑂𝑃̅̅ ̅̅𝑝𝑜𝑠𝑡,𝑖𝑛𝑑 = 𝛼 + 𝛽(𝑂𝑃𝑝𝑟𝑒,𝑖 − 𝑂𝑃̅̅ ̅̅
𝑝𝑟𝑒,𝑖𝑛𝑑) + 𝜀𝑖
Industry-adjusted benchmarks may however still be biased if common economy-
wide shocks affect all deals at particular point in time, or if merging firms outperform
industry-median firms in the pre-merger period (Martynova, Oosting, and Renneboog,
2007). Merging firms may be larger and thus more profitable than smaller firms (Fama and
French, 1995), or they may engage in acquisitions in periods when their operating
performance is higher than normal (Morck at al., 1990). Barber and Lyon (1996) and
Loughran and Ritter (1997) thus conclude that long-run operating performance needs to be
compared to control firms, matched on industry but also on pre-merger features such as
performance and size. Harford (2005) argues in favour of expanding the traditional
operating performance measures with analyst forecasts to mitigate problems with
performance benchmarks, and more recently, Bessembinder and Zhang (2013) propose a
regression model that controls for additional firm characteristics that explain the cross-
sectional variation in stock returns, such as illiquidity, volatility, and market beta.
Alternative approaches for measuring post-merger performance regard total factor
productivity (TFP) and market share evolution. TFP research enables an analysis at the
CONTENTS
22
plant-level (often by means of the Longitudinal Research Database at the US Bureau of the
Census). For example, McGuckin and Nguyen (1995) and Schoar (2000) discover that
acquired plants improve their productivity, whereas the acquirer’s existing plants suffer
from productivity decreases, resulting in a net change for the acquiring firm that is close to
zero. Ghosh (2004) examines market shares and unveils a large increase in the acquiring
firm’s market share three years after the acquisition, and a positive relation between market
share evolution and the firm’s long-run operating performance.
4. Empirical findings on short- and long-run stock returns and operating performance
4.1 Short-run returns
Short-run event studies have by far been the most popular approach to evaluate takeovers
since the 1970s (Martynova and Renneboog, 2008a). Out of the 98 studies in our overview
focusing on long-term performance, 86 also include an analysis of short-run wealth effects.
Takeovers on average are expected to create value as reflected in the weighted average of
the announcement returns of bidders and targets, but the bulk of the returns accrue to the
target shareholders who hold most of the bargaining power in the takeover negotiations.
Returns differ over time and across takeover waves: Eckbo (1983) and Eckbo and Langohr
(1989) report 6% two-day CARs for US targets in the 1960s and 1970s, Martynova and
Renneboog (2008a) report CARs that amount to at least 16% for the 1980s and 1990s, and
Netter, Stegemoller, and Wintoki (2011) report target CARs around 24% for the 2000s. The
announcement returns to the acquirer shareholders are either close to zero (some studies
report small statistically significant gains, others report small losses) or indistinguishable
from zero (Netter et al., 2011). Asquith (1983) and Eckbo (1983) report slightly positive
announcement CARs during the 1960s and 1970s, but Morck et al. (1990) and Chang (1998)
report slightly negative returns for the 1970s and 1980s. The combined (weighted) acquirer
and target returns are significantly positive, but they remain small: combined returns are
1.5% in the 1970s and 2.6% in the 1980s (Andrade et al., 2001), 1.06% in the 1990s (Betton
et al., 2008), and 1.69% in the 1990s and 2000s (Maksimovic, Phillips, and Prabhala, 2011).
These numbers reflect that the bidding firms generate lower CARs and are on average
considerably larger (by a factor of 4) than the target firms.
ESSAYS ON CORPORATE TAKEOVERS
23
The empirical literature has identified a number of takeover bid characteristics, such
as bid type, deal attitude, the target’s public status, bidder and target size, and means of
payment, that can partially explain return differences across M&A waves. Short-run returns
to bidders and targets are generally higher in tender offers relative to friendly merger
negotiations (Schwert, 1996; Franks and Harris, 1989; Loughran and Vijh, 1997; Bouwman,
Fuller, and Nain, 2009, Eckbo, 2009). A common explanation is that tender offers signal a
higher degree of confidence in the deal. As tender offers are often hostile in attitude (as the
bidding firm bypasses the board and directly addresses an offer to the target shareholders),
target returns in tender offers are generally much larger than those in friendly deals. This
difference is even more outspoken for hostile deals, in which the target board rejects the
offer, because the market expects that opposition to a bid will trigger upward bid price
revisions (see Servaes (1991) for the US; Franks and Mayer (1996) for the UK). Although
bidder returns are expected to reflect the opposite pattern (bidder shareholders may fear
overbidding in hostile transactions that hence drives the acquirer’s share price down) some
argue that bidder returns and combined returns should also be higher and positive in hostile
deals. This is because rational decision making by the bidder should imply that hostile offers
are used when favourable outcomes are more likely (relative to privately negotiating with
the target firm) (Schwert, 2000), but also because hostile bids could result in an upward
revision of the stand-alone value of the bidder (Bhagat, Dong, and Hirshleifer, 2005). All-cash
bids typically result in higher announcement returns for both the target and the acquirer
than all-equity bids (Loughran and Vijh, 1997; Bhagat et al., 2005; Savor and Lu, 2009). The
common argument here is that takeovers are to be financed with cash when the management
believes the acquiring firm’s stock is undervalued, and with stock in case of overvaluation.
As such, the market adjusts the bidder’s stock price based on the expected over- or under
valuation. However, market timing by managers cannot fully explain the use of stock, as stock
is used as frequent in the greatest value-reducing deals as in the most value-creating deals
(Netter et al., 2011). Netter et al. (2011) also show that the clustering of M&As in waves is
attenuated by the presence of smaller or privately held firms, which are generally excluded
from M&A samples due to data constraints. Samples that do include small deals and private
acquirers follow a smoother and less wavelike pattern than samples predominantly focused
on large and public firms. Moreover, the authors confirm earlier evidence on announcement
CONTENTS
24
return differences between deals involving public and private targets (e.g. Fuller et al., 2002,
Conn et al., 2005, Capron and Shen, 2007) by showing that although acquirer announcement
returns are typically negative in samples including large and public firms, they are
significantly positive when considering small and private deals. This is likely because the
cost of restructuring is much larger in publicly traded firms due to the size of the transaction,
organizational inertia, stakeholder entrenchment, or regulatory constraints. Similarly,
Schneider and Spalt (2017b) document that when considering public targets, low bidder
returns are associated with small bidders and large targets, whereas this pattern reverses
when considering privately held targets.
4.2 Long-run returns
When extending the time window to several years subsequent to the deal, the vast majority
of studies report significantly negative returns accruing to acquirer shareholders. For
surveys on the long-term post-acquisition performance literature, see Agrawal and Jaffe
(2000), Andrade et al. (2001), King et al. (2004), Martynova and Renneboog (2008a), Dutta
and Jog (2009), and Bessembinder and Zhang (2013). Agrawal and Jaffe (2000) conclude
that there is strong evidence of long-term underperformance following a takeover event, but
caution that the use of inadequate estimation techniques (up to the 1990s) make drawing
robust conclusions from these studies rather difficult. Andrade et al. (2001) report generally
negative abnormal returns, also to the combined firm, in the three to five year period
following the deal’s completion. King et al. (2004) find insignificant or negative long-run
acquirer market and accounting returns, with returns already declining from 22 days after
the deal’s announcement onwards. They thus conclude that, at the very least, M&As do not
increase the acquiring (or combined) firm’s performance. A number of transaction
characteristics seem to have some predictive power for long-run returns: the most
important ones of which are the means of payment, deal attitude, and the public status of the
target firm. While long-run studies concentrating on the deal’s attitude (friendly vs hostile)
yield mixed results (Franks et al., 1991; Cosh and Guest, 2001), the acquisition of publicly
listed target firms is associated with higher long-run bidder returns relative to the purchase
of privately owned target firms (Bradley and Sundaram, 2004; Croci, 2007). Cash-financed
ESSAYS ON CORPORATE TAKEOVERS
25
deals earn significantly higher returns than equity-financed ones (Mitchell and Stafford,
2000; Loughran and Vijh, 1997; Savor and Lu, 2009; Fu, Lin, and Officer, 2013). This finding
can be explained by signalling as equity-financing may signal the bidder’s overvaluation
(Myers and Majluf, 1984). However, Savor and Lu (2009) argue that bidders’ long-term
shareholders are still better off with a stock deal than they would have been without an M&A
deal taking place, suggesting that stock deals are not necessarily bad for shareholders.
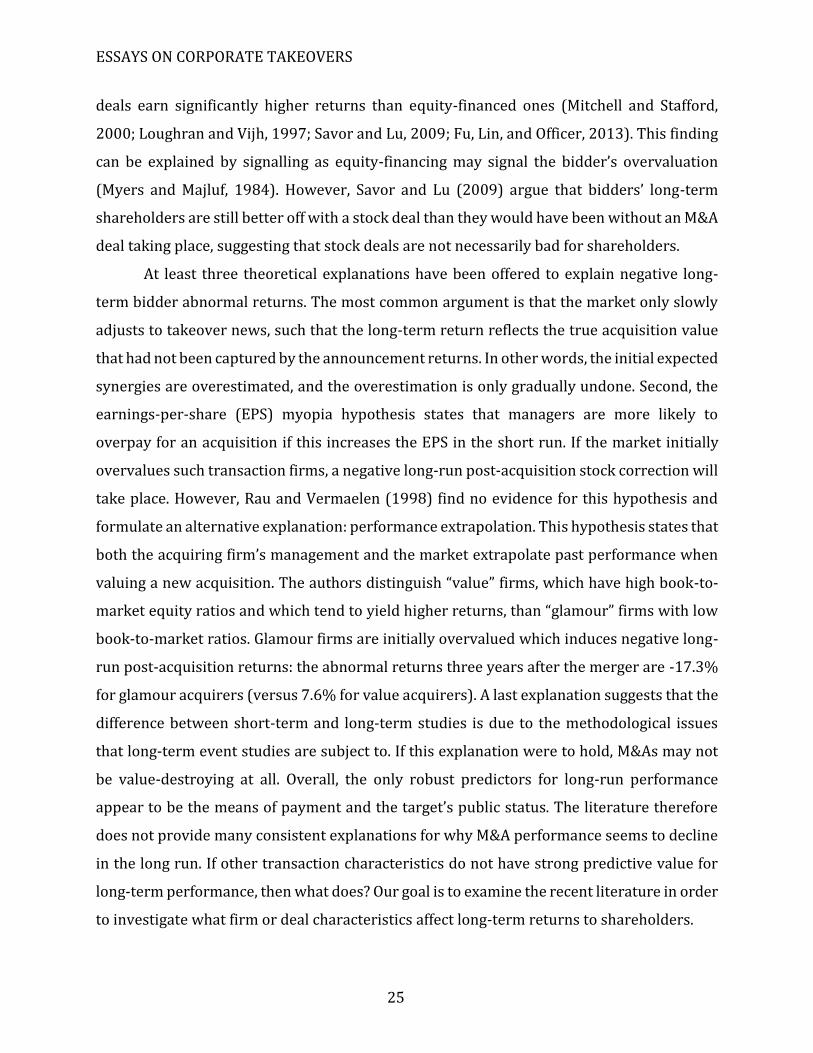
At least three theoretical explanations have been offered to explain negative long-
term bidder abnormal returns. The most common argument is that the market only slowly
adjusts to takeover news, such that the long-term return reflects the true acquisition value
that had not been captured by the announcement returns. In other words, the initial expected
synergies are overestimated, and the overestimation is only gradually undone. Second, the
earnings-per-share (EPS) myopia hypothesis states that managers are more likely to
overpay for an acquisition if this increases the EPS in the short run. If the market initially
overvalues such transaction firms, a negative long-run post-acquisition stock correction will
take place. However, Rau and Vermaelen (1998) find no evidence for this hypothesis and
formulate an alternative explanation: performance extrapolation. This hypothesis states that
both the acquiring firm’s management and the market extrapolate past performance when
valuing a new acquisition. The authors distinguish “value” firms, which have high book-to-
market equity ratios and which tend to yield higher returns, than “glamour” firms with low
book-to-market ratios. Glamour firms are initially overvalued which induces negative long-
run post-acquisition returns: the abnormal returns three years after the merger are -17.3%
for glamour acquirers (versus 7.6% for value acquirers). A last explanation suggests that the
difference between short-term and long-term studies is due to the methodological issues
that long-term event studies are subject to. If this explanation were to hold, M&As may not
be value-destroying at all. Overall, the only robust predictors for long-run performance
appear to be the means of payment and the target’s public status. The literature therefore
does not provide many consistent explanations for why M&A performance seems to decline
in the long run. If other transaction characteristics do not have strong predictive value for
long-term performance, then what does? Our goal is to examine the recent literature in order
to investigate what firm or deal characteristics affect long-term returns to shareholders.
CONTENTS
26
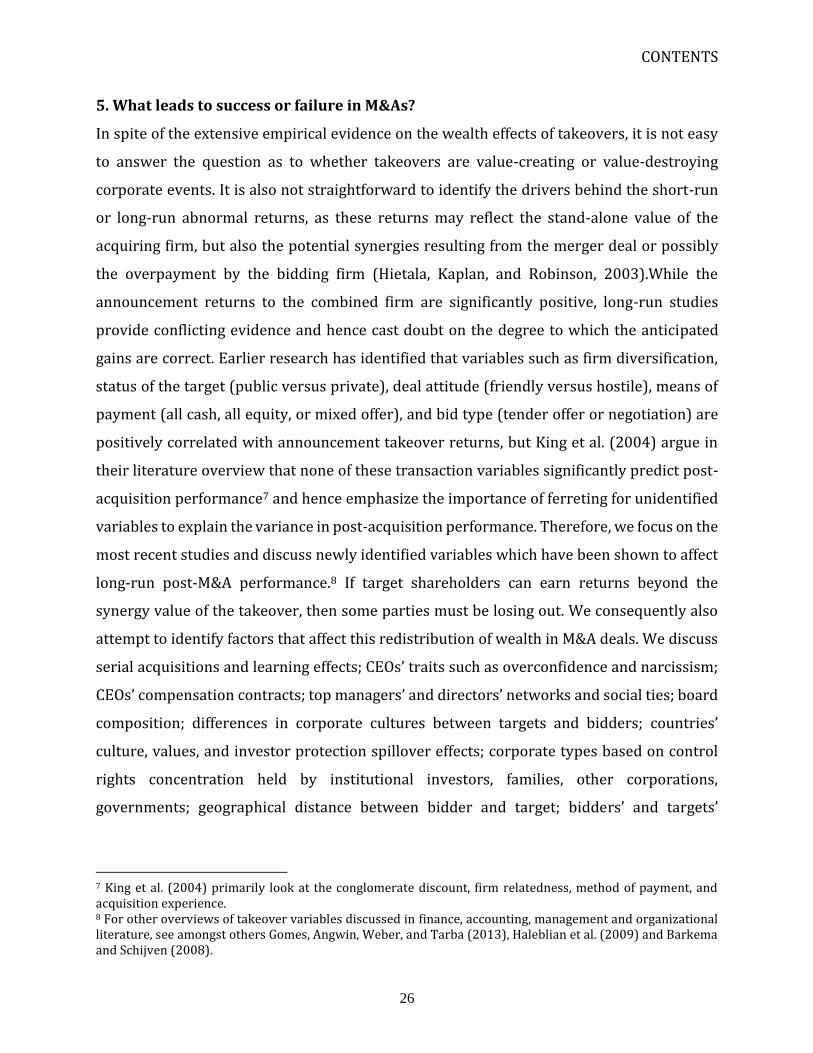
5. What leads to success or failure in M&As?
In spite of the extensive empirical evidence on the wealth effects of takeovers, it is not easy
to answer the question as to whether takeovers are value-creating or value-destroying
corporate events. It is also not straightforward to identify the drivers behind the short-run
or long-run abnormal returns, as these returns may reflect the stand-alone value of the
acquiring firm, but also the potential synergies resulting from the merger deal or possibly
the overpayment by the bidding firm (Hietala, Kaplan, and Robinson, 2003).While the
announcement returns to the combined firm are significantly positive, long-run studies
provide conflicting evidence and hence cast doubt on the degree to which the anticipated
gains are correct. Earlier research has identified that variables such as firm diversification,
status of the target (public versus private), deal attitude (friendly versus hostile), means of
payment (all cash, all equity, or mixed offer), and bid type (tender offer or negotiation) are
positively correlated with announcement takeover returns, but King et al. (2004) argue in
their literature overview that none of these transaction variables significantly predict post-
acquisition performance7 and hence emphasize the importance of ferreting for unidentified
variables to explain the variance in post-acquisition performance. Therefore, we focus on the
most recent studies and discuss newly identified variables which have been shown to affect
long-run post-M&A performance.8 If target shareholders can earn returns beyond the
synergy value of the takeover, then some parties must be losing out. We consequently also
attempt to identify factors that affect this redistribution of wealth in M&A deals. We discuss
serial acquisitions and learning effects; CEOs’ traits such as overconfidence and narcissism;
CEOs’ compensation contracts; top managers’ and directors’ networks and social ties; board
composition; differences in corporate cultures between targets and bidders; countries’
culture, values, and investor protection spillover effects; corporate types based on control
rights concentration held by institutional investors, families, other corporations,
governments; geographical distance between bidder and target; bidders’ and targets’
7 King et al. (2004) primarily look at the conglomerate discount, firm relatedness, method of payment, and acquisition experience. 8 For other overviews of takeover variables discussed in finance, accounting, management and organizational literature, see amongst others Gomes, Angwin, Weber, and Tarba (2013), Haleblian et al. (2009) and Barkema and Schijven (2008).
ESSAYS ON CORPORATE TAKEOVERS
27
industry- and product market-relatedness; political influence on acquisitions; sources of
financing; target acquisitiveness; and differences in CSR policies between bidder and target.
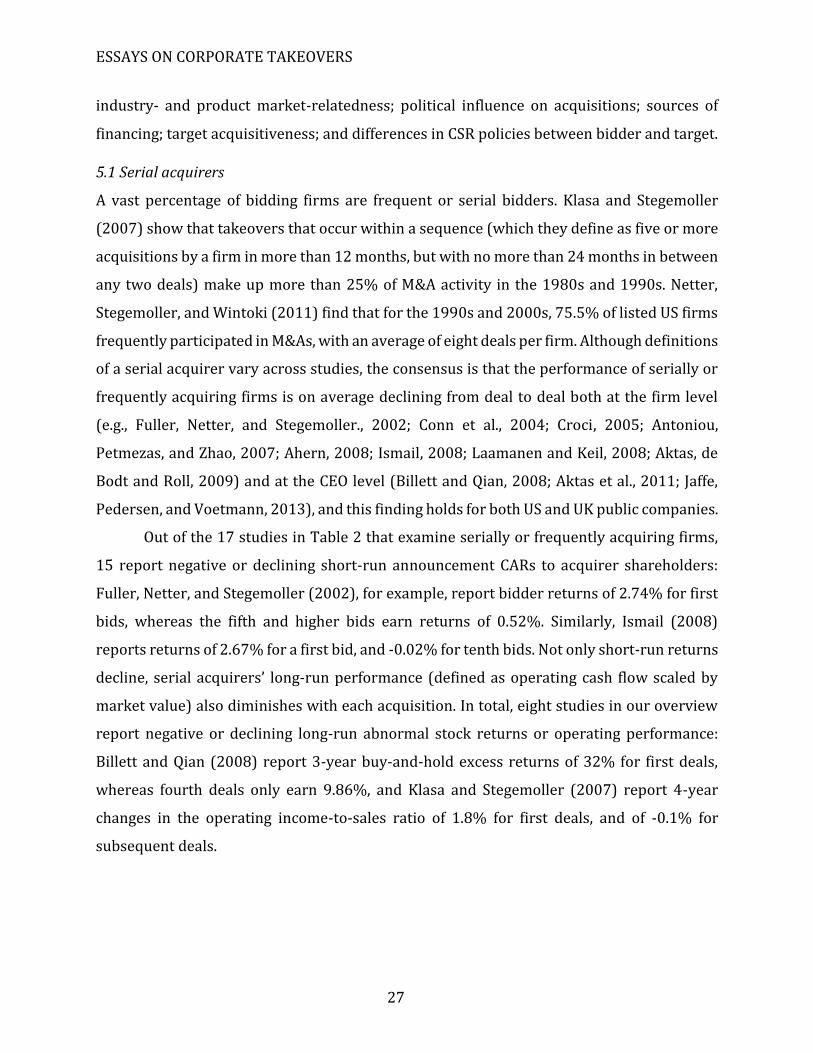
5.1 Serial acquirers
A vast percentage of bidding firms are frequent or serial bidders. Klasa and Stegemoller
(2007) show that takeovers that occur within a sequence (which they define as five or more
acquisitions by a firm in more than 12 months, but with no more than 24 months in between
any two deals) make up more than 25% of M&A activity in the 1980s and 1990s. Netter,
Stegemoller, and Wintoki (2011) find that for the 1990s and 2000s, 75.5% of listed US firms
frequently participated in M&As, with an average of eight deals per firm. Although definitions
of a serial acquirer vary across studies, the consensus is that the performance of serially or
frequently acquiring firms is on average declining from deal to deal both at the firm level
(e.g., Fuller, Netter, and Stegemoller., 2002; Conn et al., 2004; Croci, 2005; Antoniou,
Petmezas, and Zhao, 2007; Ahern, 2008; Ismail, 2008; Laamanen and Keil, 2008; Aktas, de
Bodt and Roll, 2009) and at the CEO level (Billett and Qian, 2008; Aktas et al., 2011; Jaffe,
Pedersen, and Voetmann, 2013), and this finding holds for both US and UK public companies.
Out of the 17 studies in Table 2 that examine serially or frequently acquiring firms,
15 report negative or declining short-run announcement CARs to acquirer shareholders:
Fuller, Netter, and Stegemoller (2002), for example, report bidder returns of 2.74% for first
bids, whereas the fifth and higher bids earn returns of 0.52%. Similarly, Ismail (2008)
reports returns of 2.67% for a first bid, and -0.02% for tenth bids. Not only short-run returns
decline, serial acquirers’ long-run performance (defined as operating cash flow scaled by
market value) also diminishes with each acquisition. In total, eight studies in our overview
report negative or declining long-run abnormal stock returns or operating performance:
Billett and Qian (2008) report 3-year buy-and-hold excess returns of 32% for first deals,
whereas fourth deals only earn 9.86%, and Klasa and Stegemoller (2007) report 4-year
changes in the operating income-to-sales ratio of 1.8% for first deals, and of -0.1% for
subsequent deals.
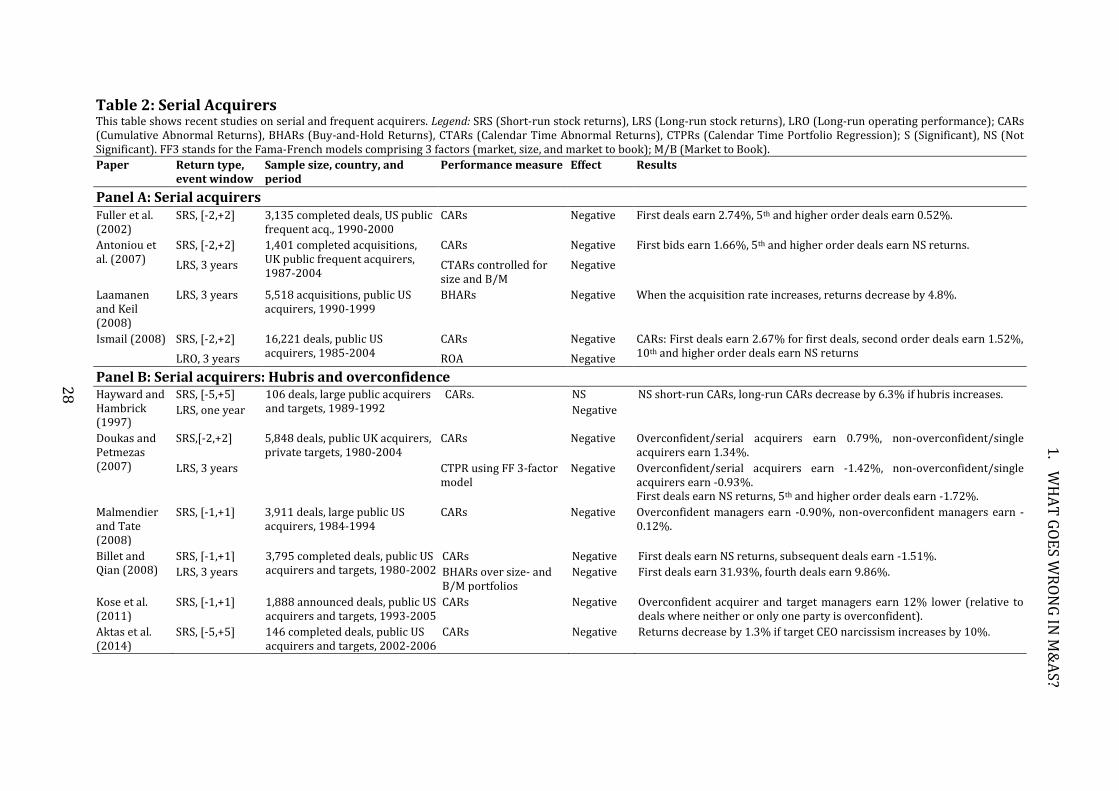
Table 2: Serial Acquirers This table shows recent studies on serial and frequent acquirers. Legend: SRS (Short-run stock returns), LRS (Long-run stock returns), LRO (Long-run operating performance); CARs (Cumulative Abnormal Returns), BHARs (Buy-and-Hold Returns), CTARs (Calendar Time Abnormal Returns), CTPRs (Calendar Time Portfolio Regression); S (Significant), NS (Not Significant). FF3 stands for the Fama-French models comprising 3 factors (market, size, and market to book); M/B (Market to Book). Paper Return type,
event window Sample size, country, and period
Performance measure Effect Results
Panel A: Serial acquirers Fuller et al. (2002)
SRS, [-2,+2] 3,135 completed deals, US public frequent acq., 1990-2000
CARs Negative First deals earn 2.74%, 5th and higher order deals earn 0.52%.
Antoniou et al. (2007)
SRS, [-2,+2] 1,401 completed acquisitions, UK public frequent acquirers, 1987-2004
CARs Negative First bids earn 1.66%, 5th and higher order deals earn NS returns.
LRS, 3 years CTARs controlled for size and B/M
Negative
Laamanen and Keil (2008)
LRS, 3 years 5,518 acquisitions, public US acquirers, 1990-1999
BHARs Negative When the acquisition rate increases, returns decrease by 4.8%.
Ismail (2008) SRS, [-2,+2] 16,221 deals, public US acquirers, 1985-2004
CARs Negative CARs: First deals earn 2.67% for first deals, second order deals earn 1.52%, 10th and higher order deals earn NS returns LRO, 3 years ROA Negative
Panel B: Serial acquirers: Hubris and overconfidence Hayward and Hambrick (1997)
SRS, [-5,+5] 106 deals, large public acquirers and targets, 1989-1992
CARs. NS NS short-run CARs, long-run CARs decrease by 6.3% if hubris increases.
LRS, one year Negative
Doukas and Petmezas (2007)
SRS,[-2,+2] 5,848 deals, public UK acquirers, private targets, 1980-2004
CARs Negative Overconfident/serial acquirers earn 0.79%, non-overconfident/single acquirers earn 1.34%.
LRS, 3 years CTPR using FF 3-factor model
Negative Overconfident/serial acquirers earn -1.42%, non-overconfident/single acquirers earn -0.93%. First deals earn NS returns, 5th and higher order deals earn -1.72%.
Malmendier and Tate (2008)
SRS, [-1,+1] 3,911 deals, large public US acquirers, 1984-1994
CARs Negative Overconfident managers earn -0.90%, non-overconfident managers earn -0.12%.
Billet and Qian (2008)
SRS, [-1,+1] 3,795 completed deals, public US acquirers and targets, 1980-2002
CARs Negative First deals earn NS returns, subsequent deals earn -1.51%.
LRS, 3 years BHARs over size- and B/M portfolios
Negative First deals earn 31.93%, fourth deals earn 9.86%.
Kose et al. (2011)
SRS, [-1,+1] 1,888 announced deals, public US acquirers and targets, 1993-2005
CARs Negative Overconfident acquirer and target managers earn 12% lower (relative to deals where neither or only one party is overconfident).
Aktas et al. (2014)
SRS, [-5,+5] 146 completed deals, public US acquirers and targets, 2002-2006
CARs Negative Returns decrease by 1.3% if target CEO narcissism increases by 10%.
28
1.
WH
AT
GO
ES W
RO
NG
IN M
&A
S?
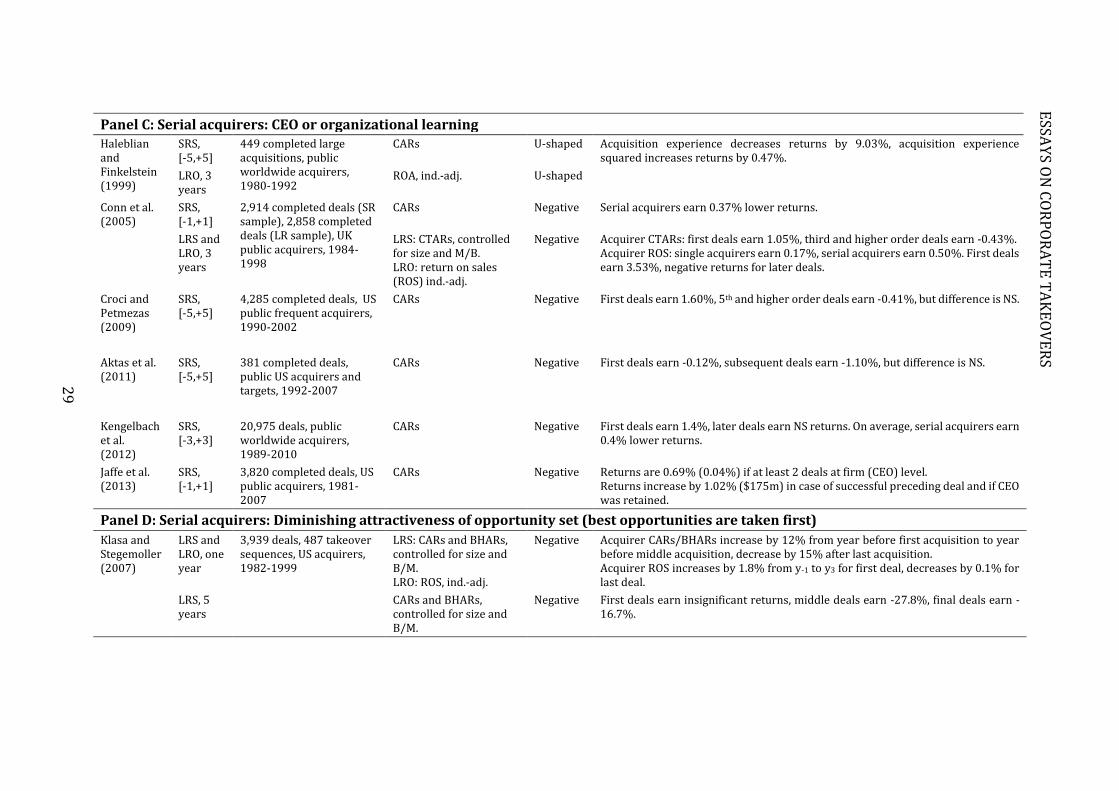
Panel C: Serial acquirers: CEO or organizational learning Haleblian and Finkelstein (1999)
SRS, [-5,+5]
449 completed large acquisitions, public worldwide acquirers, 1980-1992
CARs U-shaped Acquisition experience decreases returns by 9.03%, acquisition experience squared increases returns by 0.47%.
LRO, 3 years
ROA, ind.-adj. U-shaped
Conn et al. (2005)
SRS, [-1,+1]
2,914 completed deals (SR sample), 2,858 completed deals (LR sample), UK public acquirers, 1984-1998
CARs Negative Serial acquirers earn 0.37% lower returns.
LRS and LRO, 3 years
LRS: CTARs, controlled for size and M/B. LRO: return on sales (ROS) ind.-adj.
Negative Acquirer CTARs: first deals earn 1.05%, third and higher order deals earn -0.43%. Acquirer ROS: single acquirers earn 0.17%, serial acquirers earn 0.50%. First deals earn 3.53%, negative returns for later deals.
Croci and Petmezas (2009)
SRS, [-5,+5]
4,285 completed deals, US public frequent acquirers, 1990-2002
CARs Negative First deals earn 1.60%, 5th and higher order deals earn -0.41%, but difference is NS.
Aktas et al. (2011)
SRS, [-5,+5]
381 completed deals, public US acquirers and targets, 1992-2007
CARs Negative First deals earn -0.12%, subsequent deals earn -1.10%, but difference is NS.
Kengelbach et al. (2012)
SRS, [-3,+3]
20,975 deals, public worldwide acquirers, 1989-2010
CARs Negative First deals earn 1.4%, later deals earn NS returns. On average, serial acquirers earn 0.4% lower returns.
Jaffe et al. (2013)
SRS, [-1,+1]
3,820 completed deals, US public acquirers, 1981-2007
CARs Negative Returns are 0.69% (0.04%) if at least 2 deals at firm (CEO) level. Returns increase by 1.02% ($175m) in case of successful preceding deal and if CEO was retained.
Panel D: Serial acquirers: Diminishing attractiveness of opportunity set (best opportunities are taken first)
Klasa and Stegemoller (2007)
LRS and LRO, one year
3,939 deals, 487 takeover sequences, US acquirers, 1982-1999
LRS: CARs and BHARs, controlled for size and B/M. LRO: ROS, ind.-adj.
Negative Acquirer CARs/BHARs increase by 12% from year before first acquisition to year before middle acquisition, decrease by 15% after last acquisition. Acquirer ROS increases by 1.8% from y-1 to y3 for first deal, decreases by 0.1% for last deal.
LRS, 5 years
CARs and BHARs, controlled for size and B/M.
Negative First deals earn insignificant returns, middle deals earn -27.8%, final deals earn -16.7%.
29
ESSA
YS O
N C
OR
PO
RA
TE
TA
KE
OV
ER
S
1. WHAT GOES WRONG IN M&AS?
30
Overall, the evidence thus consistently shows that serial or frequent acquirers’ short- and
long-run stock and operating performance declines as the firm increases its
acquisitiveness. In the next sections, we will discuss the three main explanations
provided by the literature for the average underperformance of serial acquirers: CEO
overconfidence and narcissism, bidding persistence by CEOs, and the diminishing
attractiveness of the firm’s opportunity set.
5.1.1 Hubris, overconfidence, and narcissism
Doukas and Petmezas (2007) and Malmendier and Tate (2008) argue that CEOs who
engage in multiple acquisitions over a short time span could be regarded as overconfident.
Their overconfidence hypothesis builds on the hubris hypothesis by Roll (1986) and the
investment framework by Heaton (2002) and states that there is a misalignment in the
beliefs of the CEO and of the market about the firm value. Serially acquiring managers are
less likely to be efficient negotiators and may overestimate their ability to identify
profitable target firms and to create synergy gains. It should be noted that this argument
does not coincide with the agency costs or empire-building hypothesis developed by
Jensen and Meckling (1976) because, from a hubris perspective, CEOs believe they act in
the best interest of shareholders.9 Malmendier and Tate (2008) confirm that (serial)
acquisitions by overconfident CEOs – defined by the CEOs’ timing of exercising vested
stock options – do indeed generate lower announcement returns than deals by CEOs not
liable to overconfidence. In addition, they find that announcement returns around serial
acquisitions are also lower when the takeover announcement follows a confidence-
boosting event for the CEO (such as a ‘Manager of the Year’ award), which gives the CEO
a “superstar” status (Malmendier and Tate, 2009). Billet and Qian (2008) find evidence
consistent with a self-attribution bias in CEOs that leads to overconfidence. They examine
a sample of public US serial acquirers and find that the long-term buy-and-hold returns
(BHARs) decline from deal to deal. This is confirmed for a sample of UK public acquirers
by Doukas and Petmezas (2007) who demonstrate that higher order deals perform worse
over the long-run than first order deals, although they use the CTPR approach rather than
BHARs. Whereas the majority of the studies analysing CEO overconfidence in M&As only
9 Maksimovic et al. (2011) investigate the empire building hypothesis for serial acquirers, and predict that repeat acquirers are less likely to sell plants after acquisitions and show fewer improvements in performance. They find no evidence for these predictions and find instead that disposition of assets is in fact more likely than retention for repeated acquirers.
ESSAYS ON CORPORATE TAKEOVERS
31
investigate the effect of the acquirer CEO’s overconfidence, Kose, Liu, and Taffler (2011)
examine the relative overconfidence of the bidder and target CEOs. They find that if both
decision makers are prone to overconfidence, the acquirer announcement returns are
lower relative to deals where only one or neither party is identified as being
overconfident. A trait related to overconfidence is narcissism, capturing characteristics
such as egocentricity, the search of the spotlights, an overdeveloped sense of entitlement,
or even contempt towards others. Aktas et al. (2014) proxy narcissism by measuring the
use of the first person singular pronoun by the CEO relative to the use of first person
plural pronoun by the top management team of the firm in meetings with analysts.
Consistent with the research on overconfidence, they find that CEO narcissism is
negatively related to merger announcement returns, positively to deal completion
probability and negatively to the length of the takeover process.
5.1.2 CEO and organizational learning
In contrast to the studies in the previous subsection, Aktas, de Bodt, and Roll (2009) argue
that attributing declining returns in serial acquisitions to growing hubris or
overconfidence is hard to reconcile with the original hubris framework of Roll (1986).
Their theoretical analysis proposes an alternative hypothesis based on CEO learning. This
implies that acquirer CEOs improve their target selection and integration processing
abilities gradually, from deal to deal, which affects their bidding behavior during
subsequent takeover contests. In an empirical follow-up study, Aktas, de Bodt, and Roll
(2011) find considerable persistence in the level of bidding (persistently high or low
bids), and the market reactions to previous deals affect the persistence of the CEO’s
bidding behaviour: the better (worse) investors’ reactions to previous announcements,
the higher (lower) the bid premium of the subsequent deal. In other words, CEOs bid
more aggressively following positive announcement market reactions and overbid in
subsequent deals which decreases the announcement acquirer returns of later deals, but
they overbid less for subsequent deals if previous market reactions were negative.
Importantly, these predictions are in contrast with the general findings that
overconfident CEOs experience a decline in performance from deal to deal.
A number of studies point out that it is important to study serial acquisitions at
the CEO level rather than at the firm level, as a series of acquisitions by a specific firm is
often undertaken by different CEOs. In line with Aktas et al. (2011), Croci and Petmezas
1. WHAT GOES WRONG IN M&AS?
32
(2009) and Jaffe, Pedersen, and Voetmann (2013) document a positive persistence in
announcement bidder returns for acquisitions studied at the CEO level. Deals by CEOs
who were successful acquirers in the past trigger higher CARs than deals by CEOs with a
less successful acquisition history, which implies that some CEOs have superior
acquisition skills. Still, the authors fail to examine whether the documented short-term
acquisition performance by CEOs also extends to the long run.
Previous studies suggest that successful acquiring firms/CEOs may travel a
learning curve resulting in on average positive merger returns, whereas unsuccessful
firms/CEOs may lack the specific abilities needed to achieve organizational learning
gains. In contrast, Conn et al. (2005) do not document learning but argue that acquisition
returns are subject to regression to the mean: acquirers with unsuccessful first
acquisitions generate increasing short-run returns at subsequent acquisitions, whereas
successful first acquirers incur declining returns (that nevertheless still stay somewhat
higher than those of the unsuccessful first acquirers). Haleblian and Finkelstein (1999)
relate organizational acquisition experience to long-run ROA performance and report a
U-shaped relation between acquisition experience and performance. The best long-run
performers are the bidders without any acquisition experience who can thus not
(inappropriately) extrapolate their acquisition experience to subsequent deals, and the
bidders with plenty of experience who can appropriately discriminate between good and
bad targets. Acquirers with little experience however inappropriately generalize their
early acquisition experience, resulting in a decline in performance. In addition, they find
that experienced acquirers’ long-term performance further increases the more similar a
target is to prior targets. This conclusion is confirmed by Laamanen and Keil (2008) and
Kengelbach et al. (2012). The former paper documents that bidder stock returns are on
average negative in the long run, but the negative effects are alleviated the larger is the
acquirer’s experience, size, and scope of its acquisition program. The specialized-learning
hypothesis in the latter paper states that acquisition experience leads to superior
performance provided that the experience is applied to acquire similar target firms. The
overall declining performance of serial acquirers is then attributed to the increasingly
complex target integration processes and diversifying acquisitions.
ESSAYS ON CORPORATE TAKEOVERS
33
5.1.3 Diminishing attractiveness of opportunity set
Serial acquisitions may reduce the firm’s investment opportunity set, especially for
within-industry deals. Klasa and Stegemoller (2007) report that takeover sequences
begin after an expansion of the firm’s opportunity set and end when the opportunity set
closes off. They find that this gradual exhaustion of interesting takeover targets induces
lower long-run stock and operating performance: one-year bidder abnormal returns are
insignificant for the first acquisition and become significantly more negative with
subsequent acquisitions by the acquirer. The five-year post-acquisition returns confirm
this negative trend for later acquisitions. Moreover, the authors argue that these results
are unlikely to be explained by overconfident managers making bad acquisitions, as this
hypothesis is not related to the contraction in industry-level investment opportunities at
the end of a takeover sequence. Taken together, the firm’s growth opportunity set
gradually closes off as the best opportunities are taken first.
5.2 CEO Incentives and Compensation
Although narcissistic or overconfident CEOs may be incentivized to undertake M&As by
non-pecuniary awards in terms of prestige, reputation, and media attention, specific CEO
compensation contracts may also stimulate takeover activity (even if it is value-
destroying at the firm level). According to agency theory, management compensation
contracts should reduce managerial opportunism by aligning managements’ and
shareholders’ interests (Shleifer and Vishny, 1988). One way of achieving this is by
linking management compensation contracts to firm performance through equity-based
compensation. If equity-based compensation is high enough, this should deter managers
to make poor acquisitions through the negative effect on their long-run wealth. Datta,
Iskandar-Datta, and Raman (2001) find that a higher level of equity-based compensation
is associated with positive long-run returns and that long-run post-acquisition stock
return underperformance is primarily incurred by firms with low equity-based CEO
compensation that underperform matched control firms by 23%, as their executives are
less incentivised to increase firm value (Table 3).
Feito-Ruiz and Renneboog (2017) report that CEOs who receive high levels of
equity-based compensation pay lower premiums for target firms and undertake more
risky investments. The authors show that stock option-based compensation motivates
1. WHAT GOES WRONG IN M&AS?
34
managers to take on projects that maximize shareholders’ value (even in the absence of
active ownership), which is recognized by bidders’ shareholders who put a higher
expected value on deals by CEOs with this type of compensation contract. This suggests
that the shareholders have more faith in takeover decisions when the proceeds/losses
will also be shared with the top management (through their equity claims when the
options and restricted stock vest).10 Considering CEO traits (such as age, and tenure or
experience), firm attributes (such as size and financial performance), industry, country
(e.g. the degree of investor protection), and the year of pay, the authors estimate normal
or expected CEO pay from which they subtract actual pay to obtain ‘excess’ compensation.
They demonstrate that excess compensation negatively affects the acquirer’s stock
valuation at a takeover announcement. Excess CEO remuneration can blur fair
managerial corporate investment judgments and constitutes an agency problem.
In addition, providing performance-based compensation contracts may not be
sufficient to discourage managers from undertaking value-destroying takeovers if the
performance criteria leading to higher pay include a policy of firm growth through
acquisitions (Bebchuk and Grinstein, 2005). Harford and Li (2007) indeed provide
evidence that post-acquisition CEO wealth increases irrespective of whether the deal
created or destroyed firm value. They find that even if post-acquisition firm value
decreases, the resulting decreases in the CEO’s existing wealth portfolio are often offset
through new equity-based grants such as stocks or options, making the CEO’s
compensation indifferent to poor stock performance.
10 Pikulina and Renneboog (2015) confirm these findings but point out that the relation between equity-based compensation and expected performance is eroded for firms in which there are major corporate blockholders. This is consistent with a substitute effect between the monitoring role of concentrated ownership (held by corporations) and the self-regulatory role of equity-based compensation.
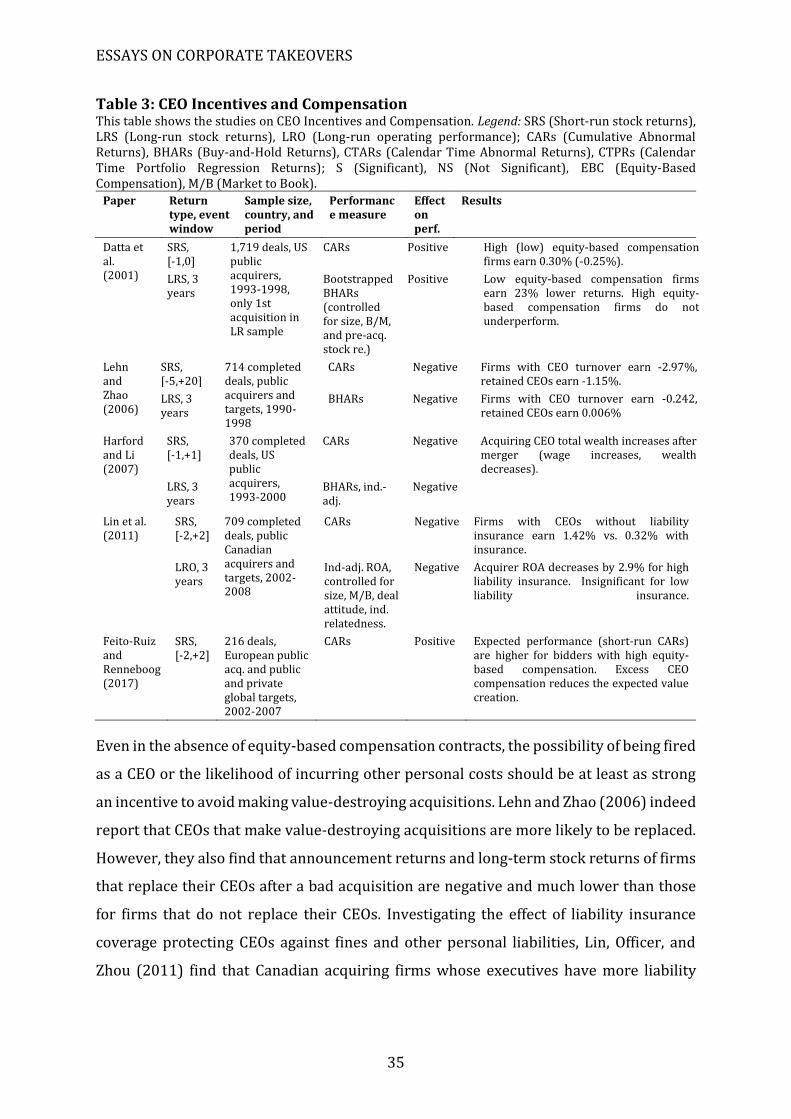
ESSAYS ON CORPORATE TAKEOVERS
35
Table 3: CEO Incentives and Compensation This table shows the studies on CEO Incentives and Compensation. Legend: SRS (Short-run stock returns), LRS (Long-run stock returns), LRO (Long-run operating performance); CARs (Cumulative Abnormal Returns), BHARs (Buy-and-Hold Returns), CTARs (Calendar Time Abnormal Returns), CTPRs (Calendar Time Portfolio Regression Returns); S (Significant), NS (Not Significant), EBC (Equity-Based Compensation), M/B (Market to Book).
Paper Return type, event window
Sample size, country, and period
Performance measure
Effect on perf.
Results
Datta et al. (2001)
SRS, [-1,0]
1,719 deals, US public acquirers, 1993-1998, only 1st acquisition in LR sample
CARs Positive High (low) equity-based compensation firms earn 0.30% (-0.25%).
LRS, 3 years
Bootstrapped BHARs (controlled for size, B/M, and pre-acq. stock re.)
Positive Low equity-based compensation firms earn 23% lower returns. High equity-based compensation firms do not underperform.
Lehn and Zhao (2006)
SRS, [-5,+20]
714 completed deals, public acquirers and targets, 1990-1998
CARs Negative Firms with CEO turnover earn -2.97%, retained CEOs earn -1.15%.
LRS, 3 years
BHARs Negative Firms with CEO turnover earn -0.242, retained CEOs earn 0.006%
Harford and Li (2007)
SRS, [-1,+1]
370 completed deals, US public acquirers, 1993-2000
CARs Negative Acquiring CEO total wealth increases after merger (wage increases, wealth decreases).
LRS, 3 years
BHARs, ind.-adj.
Negative
Lin et al. (2011)
SRS, [-2,+2]
709 completed deals, public Canadian acquirers and targets, 2002-2008
CARs Negative Firms with CEOs without liability insurance earn 1.42% vs. 0.32% with insurance.
LRO, 3 years
Ind-adj. ROA, controlled for size, M/B, deal attitude, ind. relatedness.
Negative Acquirer ROA decreases by 2.9% for high liability insurance. Insignificant for low liability insurance.
Feito-Ruiz and Renneboog (2017)
SRS, [-2,+2]
216 deals, European public acq. and public and private global targets, 2002-2007
CARs Positive Expected performance (short-run CARs) are higher for bidders with high equity-based compensation. Excess CEO compensation reduces the expected value creation.
Even in the absence of equity-based compensation contracts, the possibility of being fired
as a CEO or the likelihood of incurring other personal costs should be at least as strong
an incentive to avoid making value-destroying acquisitions. Lehn and Zhao (2006) indeed
report that CEOs that make value-destroying acquisitions are more likely to be replaced.
However, they also find that announcement returns and long-term stock returns of firms
that replace their CEOs after a bad acquisition are negative and much lower than those
for firms that do not replace their CEOs. Investigating the effect of liability insurance
coverage protecting CEOs against fines and other personal liabilities, Lin, Officer, and
Zhou (2011) find that Canadian acquiring firms whose executives have more liability
1. WHAT GOES WRONG IN M&AS?
36
insurance coverage have significantly worse post-takeover long-term ROA and asset
turnover performance.
5.3 CEO and director connections and networks
Social and professional connections of board members and executives can affect the
firm’s decision-making processes, including decisions on mergers and acquisitions. These
networks are established through professional activities, such as being on the same board
of directors, or social connections such as education (graduated from the same university
or college), common sports interests and club memberships.
The effect of well-connected directors/firms on M&A performance can be twofold:
on the one hand, professional and social networks enable connected CEOs and directors
to get easier and less costly access to information. This can improve their decision
making, enhance trust between the parties involved (Fracassi, 2009; Wu, 2011), and
facilitate the search for profitable targets (Renneboog and Zhao, 2014). Cai and Sevilir
(2012) do indeed find evidence for a sample of US deals that long-run ROA increases for
deals with a first-degree common director between target and acquirer (which is a direct
link) relative to second-degree connected deals (based on indirect connections) and non-
connected deals. For a sample of UK firms, Renneboog and Zhao (2014) find that deals
between connected firms are more likely to be completed, that the negotiations are
completed faster, and that these deals are more likely to be financed with equity, which
reflects the trust between the parties. However, they find no significant announcement
effect in the bidders’ share prices. Chikh and Filbien (2011) focus on CEO’s educational
ties and find that well-connected CEOs are more likely to complete a deal even in the wake
of negative market reactions, and that the merged firms achieve higher long-run stock
returns than firms that abandoned negotiations. While the majority of studies consider
only the effect of CEO and board connections on acquirer returns, Dhaliwal et al. (2014)
focus on connections through common auditors and discover that deals involving parties
with the same auditor transfer part of the negotiation power to the bidding firm, which
is reflected in the higher returns for acquirer shareholders and lower returns for target
shareholders.
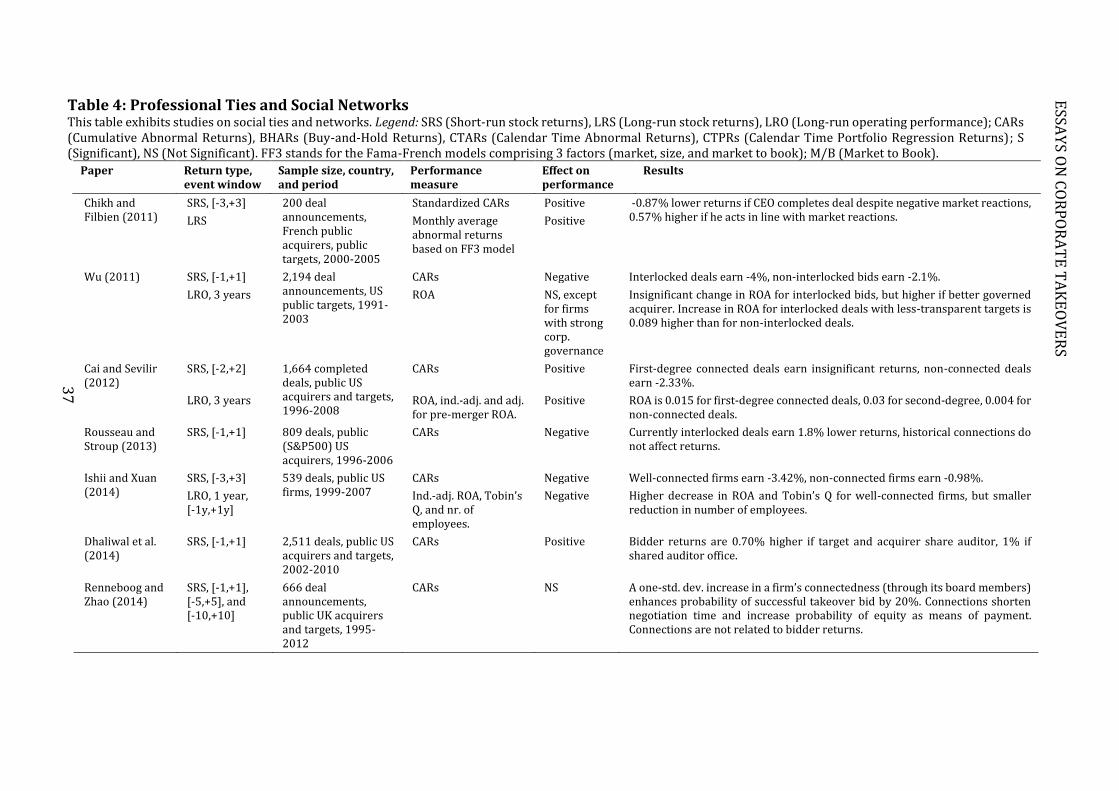
Table 4: Professional Ties and Social Networks This table exhibits studies on social ties and networks. Legend: SRS (Short-run stock returns), LRS (Long-run stock returns), LRO (Long-run operating performance); CARs (Cumulative Abnormal Returns), BHARs (Buy-and-Hold Returns), CTARs (Calendar Time Abnormal Returns), CTPRs (Calendar Time Portfolio Regression Returns); S (Significant), NS (Not Significant). FF3 stands for the Fama-French models comprising 3 factors (market, size, and market to book); M/B (Market to Book).
Paper Return type, event window
Sample size, country, and period
Performance measure
Effect on performance
Results
Chikh and Filbien (2011)
SRS, [-3,+3] 200 deal announcements, French public acquirers, public targets, 2000-2005
Standardized CARs Positive -0.87% lower returns if CEO completes deal despite negative market reactions, 0.57% higher if he acts in line with market reactions. LRS Monthly average
abnormal returns based on FF3 model
Positive
Wu (2011) SRS, [-1,+1] 2,194 deal announcements, US public targets, 1991-2003
CARs Negative Interlocked deals earn -4%, non-interlocked bids earn -2.1%.
LRO, 3 years ROA NS, except for firms with strong corp. governance
Insignificant change in ROA for interlocked bids, but higher if better governed acquirer. Increase in ROA for interlocked deals with less-transparent targets is 0.089 higher than for non-interlocked deals.
Cai and Sevilir (2012)
SRS, [-2,+2] 1,664 completed deals, public US acquirers and targets, 1996-2008
CARs Positive First-degree connected deals earn insignificant returns, non-connected deals earn -2.33%.
LRO, 3 years ROA, ind.-adj. and adj. for pre-merger ROA.
Positive ROA is 0.015 for first-degree connected deals, 0.03 for second-degree, 0.004 for non-connected deals.
Rousseau and Stroup (2013)
SRS, [-1,+1] 809 deals, public (S&P500) US acquirers, 1996-2006
CARs Negative Currently interlocked deals earn 1.8% lower returns, historical connections do not affect returns.
Ishii and Xuan (2014)
SRS, [-3,+3] 539 deals, public US firms, 1999-2007
CARs Negative Well-connected firms earn -3.42%, non-connected firms earn -0.98%.
LRO, 1 year, [-1y,+1y]
Ind.-adj. ROA, Tobin’s Q, and nr. of employees.
Negative Higher decrease in ROA and Tobin’s Q for well-connected firms, but smaller reduction in number of employees.
Dhaliwal et al. (2014)
SRS, [-1,+1] 2,511 deals, public US acquirers and targets, 2002-2010
CARs Positive Bidder returns are 0.70% higher if target and acquirer share auditor, 1% if shared auditor office.
Renneboog and Zhao (2014)
SRS, [-1,+1], [-5,+5], and [-10,+10]
666 deal announcements, public UK acquirers and targets, 1995-2012
CARs NS A one-std. dev. increase in a firm’s connectedness (through its board members) enhances probability of successful takeover bid by 20%. Connections shorten negotiation time and increase probability of equity as means of payment. Connections are not related to bidder returns.
37
ESSA
YS O
N C
OR
PO
RA
TE
TA
KE
OV
ER
S
1. WHAT GOES WRONG IN M&AS?
38
In contrast to the view that directors’ or firm connections have a positive impact on
takeover performance though an enhanced information-gathering potential, Renneboog
and Zhao (2014) argue that connections may also have a dark side in the sense that they
may only reflect past performance and do not necessarily have any bearing on future
corporate (takeover) performance. In that case, CEO or managerial connections may
reflect managerial power or even hubris which may insulate them from being fired when
the firm performs badly or when value-destroying acquisitions are made. Wu (2011) and
Rousseau and Stroup (2013) report negative announcement effects (but insignificant
long-run operating performance effects) in deals with interlocked board directors. Ishii
and Xuan (2014) investigate educational and professional ties between executives and
directors in acquiring and target firms, and find evidence supporting the inefficient
retention of the target’s management and board in well-connected firms. In addition, they
find that mergers of two strongly connected firms are associated with a decrease in the
post-acquisition ROA and that such transactions are more likely to be undone by means
of divestitures following disappointing performance. Overall, worldwide evidence on the
impact of professional connections and networks on takeover performance is mixed and
often statistically insignificant, which implies that detrimental and beneficial effects of
networks may offset one another. It thus remains an open question as to what conditions
determine which of the beneficial or detrimental effects dominate.
5.4 Board characteristics
5.4.1 Board busyness and multiple directorships
The previous section has pointed out that professional and social networks may have
negative effects on merger performance because firms may overly rely on their executive
and non-executive directors’ networks which they may see as a substitute for active
information collection and because networks may reflect managers’ past successes and
performance which may not be easily replicable and even increase these managers’
hubris (Renneboog and Zhao, 2011). Another drawback is that non-executive board
members who are connected through multiple directorships could be too busy to fulfil
their role of monitors and advisers effectively, while well-connected executive directors
may not spend sufficient time managing their own company. Brown and Maloney (1999)
do not agree as they find evidence that multiple directorships positively affect short-run
ESSAYS ON CORPORATE TAKEOVERS
39
announcement returns; they also identify a number of board (member) characteristics
that positively affect returns: firms perform better if they have smaller boards and if
board members hold more equity. Still, Ferris et al. (2003) do not find evidence that non-
executive and executive board members with multiple directorships shirk their
responsibilities by not serving on the various board committees, although they do not
directly relate this to M&A performance. In contrast, Ahn, Jiraporn, and Kim (2010)
document that the long-term operating performance of firms with directors holding
many outside board seats perform worse in the three years after deal completion. The
little evidence on board busyness in an M&A context indicates that firms with board
members holding multiple directorships encourages value-creating M&As and increase
firm value provided that the number of outside directorships remains limited.
5.4.2 Board composition
Other studies have identified additional board characteristics (other than busyness or
reputation) that may affect merger performance. Consistent with potential conflicts of
interest between shareholders and creditors, Hilscher and Sisli-Ciamarra (2013) find that
announcement returns and overall firm value around an acquisition are lower when a
creditor is represented on the board, but the authors fail to examine the long-run
performance effects. Huang and Kisgen (2013) examine the presence of female directors
on the acquirer’s corporate board. They use a difference-in-difference analysis to
investigate the effect of the executive directors’ gender on acquirer returns for a sample
of large publicly listed firms in which male executives were replaced by female ones. They
find that acquirer announcement returns are 2% higher for deals conducted by female
executives relative to the ones led by male executives. Although the effects on long-run
stock return and operating performance are insignificant, there is some evidence that
male executives are more likely to go for empire-building and suffer from overconfidence,
which results in more value-destroying acquisitions.11 Levi, Li, and Zhang (2014) confirm
this by showing that the presence of female directors on the acquirer’s corporate board
reduces the firm’s acquisitiveness as female directors are less likely to overestimate
merger gains. They find that independent female non-executive directors are associated
11 This is consistent with experimental evidence that women are more risk-averse than men (Croson and Gneezy, 2009). Overall however, CEOs are significantly more optimistic and risk-tolerant than non-CEOs (Graham, Harvey, and Puri, 2013).
1. WHAT GOES WRONG IN M&AS?
40
with offering lower bid premiums (and hence lower target returns), but this effect does
not hold for dependent (executive or family-related) female directors. It is important to
point out that the authors are not able to make any causal statements due to endogeneity
between appointing female directors and firm performance.
Whereas the majority of studies only study the impact of characteristics of the
acquirer’s CEO or board on the takeover process, a few turn to target executives.
Krishnan, Miller & Judge (1997) find that if the acquirer and target management teams
are complementary, post-acquisition long-term operating performance are significantly
higher. Moreover, they find that post-takeover performance deteriorates after the
departure of the target firm’s top management. If a target CEO is forced to depart or retire,
he undergoes private merger costs in the form of forgone benefits of staying employed.
Jenter and Lewellen (2015) argue that, if the CEO is close to retirement age, his private
merger costs may be much lower making him more willing to accept takeover offers that
might not be value-optimizing. However, they reveal that takeover premiums and target
and bidder short-run returns are not significantly affected by the target CEO being close
to retirement age. Field and Mkrtchyan (2017) report that not only directors’ past
acquisition experience affects short- and long-run deal performance, but also the quality
of directors’ prior acquisitions. The authors demonstrate that firms with higher levels of
positive board acquisition experience make better acquisition decisions and are better at
integration of the target firm. Overall, these studies indicate that the target CEOs’ and
acquirer board’s expertise and experience increases deal synergies and long-term
performance, and that female executives or board members are less likely overbid and
make value-destroying acquisitions. Having creditors serve on the board reduces returns
to shareholders however, as wealth may then be transferred from shareholders to
creditors.
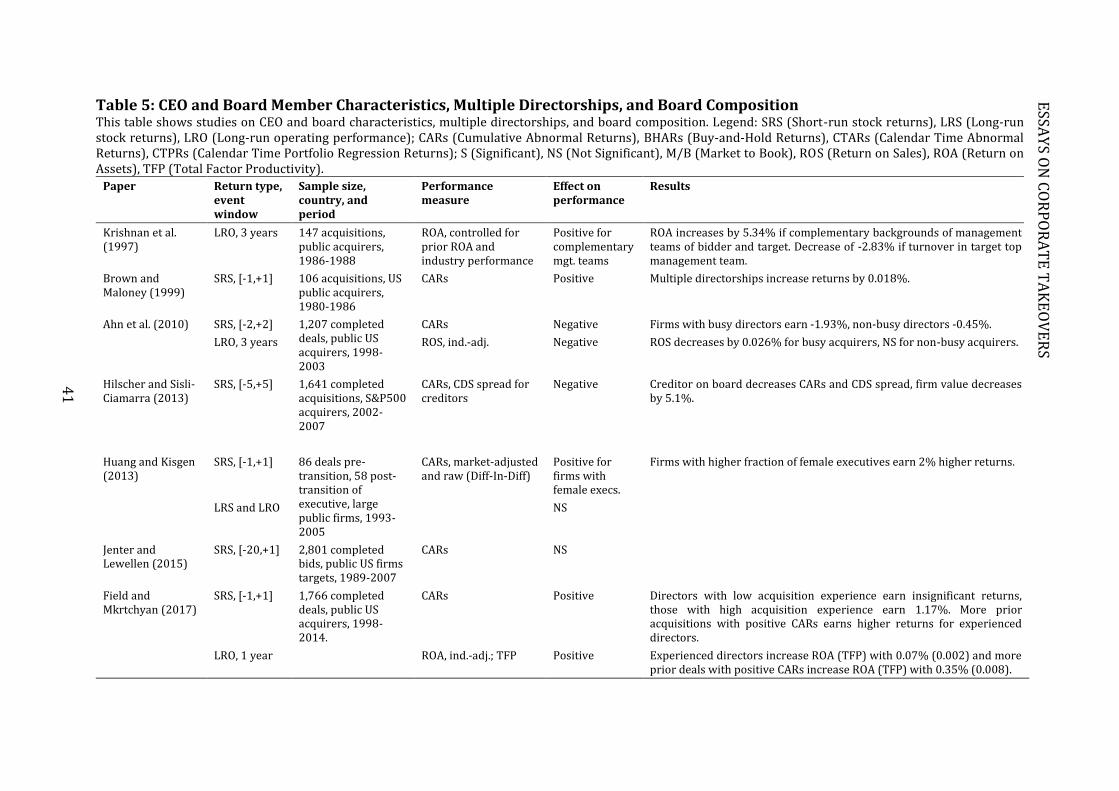
Table 5: CEO and Board Member Characteristics, Multiple Directorships, and Board Composition This table shows studies on CEO and board characteristics, multiple directorships, and board composition. Legend: SRS (Short-run stock returns), LRS (Long-run stock returns), LRO (Long-run operating performance); CARs (Cumulative Abnormal Returns), BHARs (Buy-and-Hold Returns), CTARs (Calendar Time Abnormal Returns), CTPRs (Calendar Time Portfolio Regression Returns); S (Significant), NS (Not Significant), M/B (Market to Book), ROS (Return on Sales), ROA (Return on Assets), TFP (Total Factor Productivity).
Paper Return type, event window
Sample size, country, and period
Performance measure
Effect on performance
Results
Krishnan et al. (1997)
LRO, 3 years 147 acquisitions, public acquirers, 1986-1988
ROA, controlled for prior ROA and industry performance
Positive for complementary mgt. teams
ROA increases by 5.34% if complementary backgrounds of management teams of bidder and target. Decrease of -2.83% if turnover in target top management team.
Brown and Maloney (1999)
SRS, [-1,+1] 106 acquisitions, US public acquirers, 1980-1986
CARs Positive Multiple directorships increase returns by 0.018%.
Ahn et al. (2010) SRS, [-2,+2] 1,207 completed deals, public US acquirers, 1998-2003
CARs Negative Firms with busy directors earn -1.93%, non-busy directors -0.45%.
LRO, 3 years ROS, ind.-adj. Negative ROS decreases by 0.026% for busy acquirers, NS for non-busy acquirers.
Hilscher and Sisli-Ciamarra (2013)
SRS, [-5,+5] 1,641 completed acquisitions, S&P500 acquirers, 2002-2007
CARs, CDS spread for creditors
Negative Creditor on board decreases CARs and CDS spread, firm value decreases by 5.1%.
Huang and Kisgen (2013)
SRS, [-1,+1] 86 deals pre-transition, 58 post-transition of executive, large public firms, 1993-2005
CARs, market-adjusted and raw (Diff-In-Diff)
Positive for firms with female execs.
Firms with higher fraction of female executives earn 2% higher returns.
LRS and LRO NS
Jenter and Lewellen (2015)
SRS, [-20,+1] 2,801 completed bids, public US firms targets, 1989-2007
CARs NS
Field and Mkrtchyan (2017)
SRS, [-1,+1] 1,766 completed deals, public US acquirers, 1998-2014.
CARs Positive Directors with low acquisition experience earn insignificant returns, those with high acquisition experience earn 1.17%. More prior acquisitions with positive CARs earns higher returns for experienced directors.
LRO, 1 year ROA, ind.-adj.; TFP Positive Experienced directors increase ROA (TFP) with 0.07% (0.002) and more prior deals with positive CARs increase ROA (TFP) with 0.35% (0.008).
41
ESSA
YS O
N C
OR
PO
RA
TE
TA
KE
OV
ER
S
1. WHAT GOES WRONG IN M&AS?
42
5.5 Corporate culture
When two firms merge and become one entity, corporate cultures and traditions may clash and
resistance by employees and other stakeholders may slow down the post-merger integration
process. Whereas the finance and economics literature on culture clashes in M&As is scarce, the
strategy and management literature frequently illustrates post-merger integration frictions
through theoretical integration models, measuring strategic similarity of merging firms, or the
analysis of human relations management.12 Target firm employees react negatively to merger
announcements if they are concerned about their job security, career prospects, and loss of
autonomy and organizational identity (Napier, 1989). This may then result in a reduction of
productivity and an increase in turnover and absenteeism.
The integration process is crucially affected by factors such as the compatibility of
administrative practices, management styles, organizational structures, and organizational
cultures, but also by the degree of post-merger consolidation and the extent to which
organizational integrity can be retained (Ollie, 1994). Although management can facilitate the
integration process in the combined firm through leadership, a new identity for the merged firm,
and common goals, the perception of cultural differences between the bidding and target firm
negatively affects the bidder’s announcement returns (Chatterjee, et al., 1992). In the context of
cross-border M&As, Datta and Puia (1995) report lower bidder returns the larger the cultural
distance between the target and acquirer. They argue that cultural differences result in
inadequate knowledge of the foreign market and overpayment by the bidder which reduces its
market value.13
Focusing on the importance of employment policies in the integration process, Liang,
Renneboog, and Vansteenkiste (2017) find that although generous employment policies increase
acquirer shareholder returns around domestic deals, uncertainty regarding the integration of
these policies in a foreign target firm reverses this effect in cross-border deals. This is driven by
the provision of monetary incentives such as bonus plans and health insurance benefits, but
acquisition experience in the target’s country, weak unions, and weak social security laws in the
target’s country can reduce the negative effect in cross-border deals.
12 See for example Buono, Bowditch, and Lewis (1985) for a bank merger case study, Weber, Shenkar, and Raveh (1996) for a discussion on the difference between national and corporate culture fit, Weber and Camerer (2003) for experimental evidence, Stahl and Voigt (2008) for an overview of the organizational literature, Weber and Fried (2011), Marks and Mirvis (2011), Shenkar (2012), Bauer and Matzler (2014). None of these papers directly assess short- or long-run returns, however. 13 In the finance literature, Fiordelisi and Ricci (2013) distinguish competition-, creation-, collaboration- and control-oriented cultures and relate these to CEO turnover and firm performance, but do not investigate the effect on takeover outcomes. The probability of a CEO change is positively influenced by competition- and creation-oriented cultures, but these types of cultures attenuate the relation firm performance-turnover.
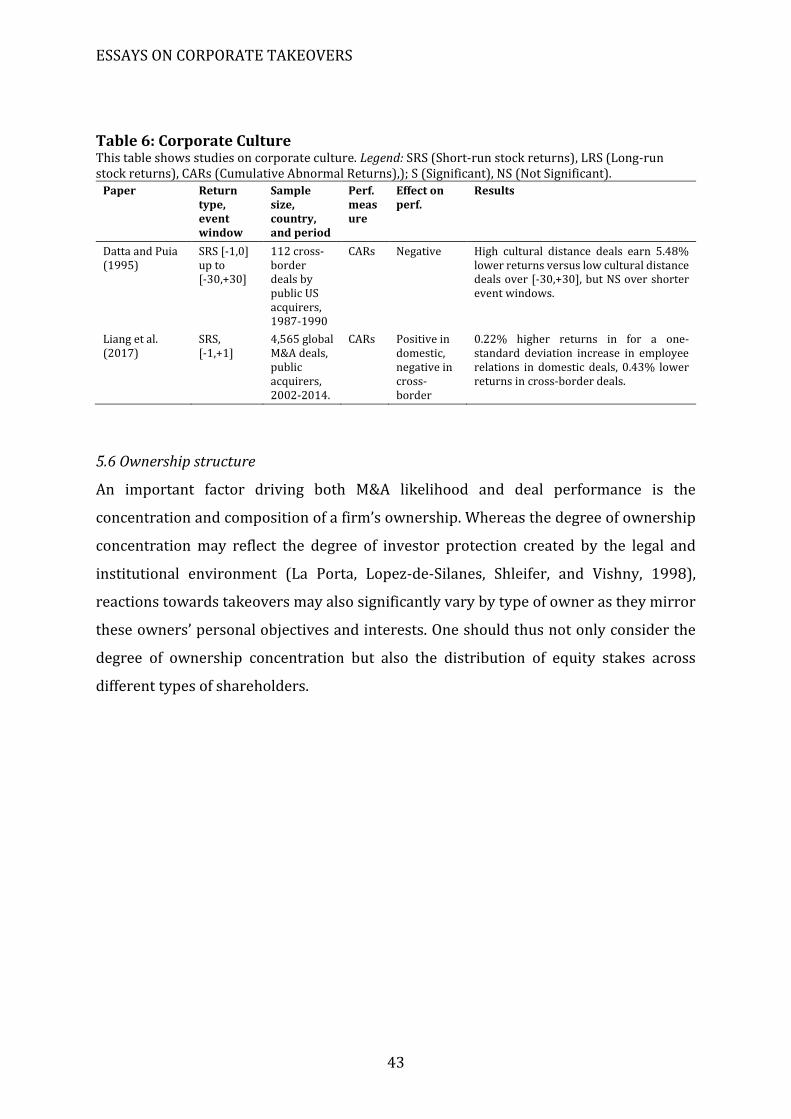
ESSAYS ON CORPORATE TAKEOVERS
43
Table 6: Corporate Culture This table shows studies on corporate culture. Legend: SRS (Short-run stock returns), LRS (Long-run stock returns), CARs (Cumulative Abnormal Returns),); S (Significant), NS (Not Significant).
Paper Return type, event window
Sample size, country, and period
Perf.measure
Effect on perf.
Results
Datta and Puia (1995)
SRS [-1,0] up to [-30,+30]
112 cross-border deals by public US acquirers, 1987-1990
CARs Negative High cultural distance deals earn 5.48% lower returns versus low cultural distance deals over [-30,+30], but NS over shorter event windows.
Liang et al. (2017)
SRS, [-1,+1]
4,565 global M&A deals, public acquirers, 2002-2014.
CARs Positive in domestic, negative in cross-border
0.22% higher returns in for a one-standard deviation increase in employee relations in domestic deals, 0.43% lower returns in cross-border deals.
5.6 Ownership structure
An important factor driving both M&A likelihood and deal performance is the
concentration and composition of a firm’s ownership. Whereas the degree of ownership
concentration may reflect the degree of investor protection created by the legal and
institutional environment (La Porta, Lopez-de-Silanes, Shleifer, and Vishny, 1998),
reactions towards takeovers may also significantly vary by type of owner as they mirror
these owners’ personal objectives and interests. One should thus not only consider the
degree of ownership concentration but also the distribution of equity stakes across
different types of shareholders.
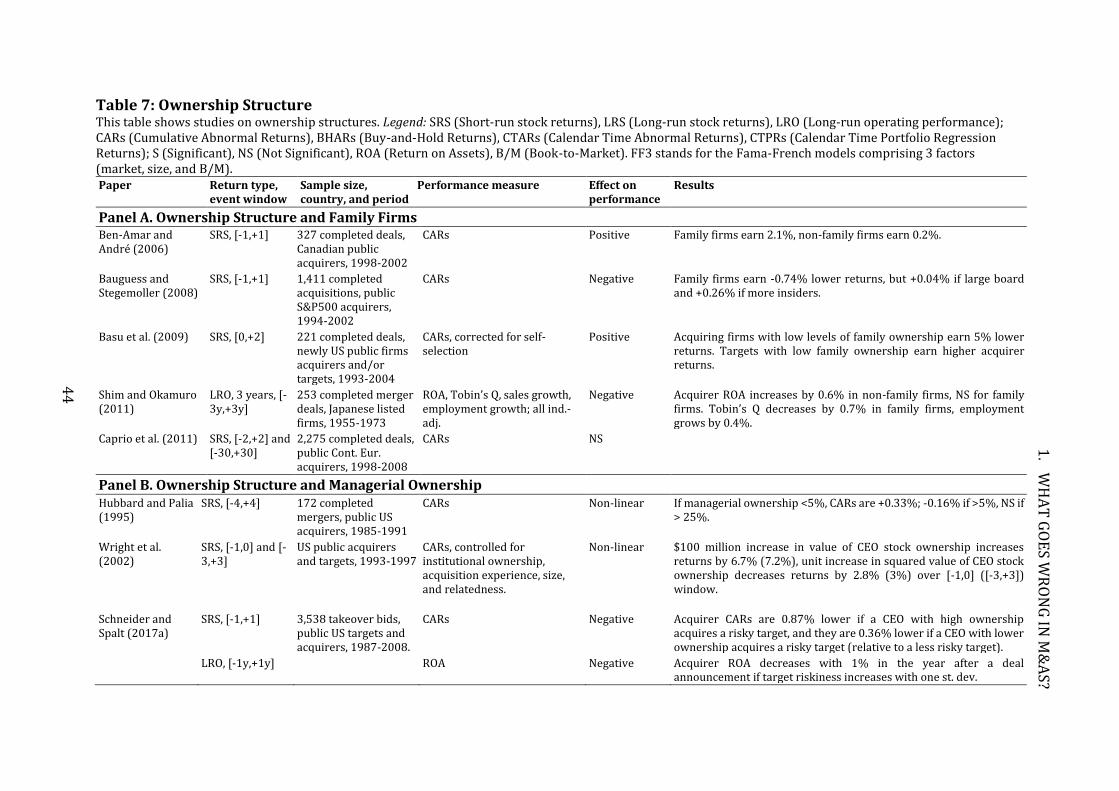
Table 7: Ownership Structure This table shows studies on ownership structures. Legend: SRS (Short-run stock returns), LRS (Long-run stock returns), LRO (Long-run operating performance); CARs (Cumulative Abnormal Returns), BHARs (Buy-and-Hold Returns), CTARs (Calendar Time Abnormal Returns), CTPRs (Calendar Time Portfolio Regression Returns); S (Significant), NS (Not Significant), ROA (Return on Assets), B/M (Book-to-Market). FF3 stands for the Fama-French models comprising 3 factors (market, size, and B/M). Paper Return type,
event window Sample size, country, and period
Performance measure Effect on performance
Results
Panel A. Ownership Structure and Family Firms Ben-Amar and André (2006)
SRS, [-1,+1] 327 completed deals, Canadian public acquirers, 1998-2002
CARs Positive Family firms earn 2.1%, non-family firms earn 0.2%.
Bauguess and Stegemoller (2008)
SRS, [-1,+1] 1,411 completed acquisitions, public S&P500 acquirers, 1994-2002
CARs Negative Family firms earn -0.74% lower returns, but +0.04% if large board and +0.26% if more insiders.
Basu et al. (2009) SRS, [0,+2] 221 completed deals, newly US public firms acquirers and/or targets, 1993-2004
CARs, corrected for self-selection
Positive Acquiring firms with low levels of family ownership earn 5% lower returns. Targets with low family ownership earn higher acquirer returns.
Shim and Okamuro (2011)
LRO, 3 years, [-3y,+3y]
253 completed merger deals, Japanese listed firms, 1955-1973
ROA, Tobin’s Q, sales growth, employment growth; all ind.-adj.
Negative Acquirer ROA increases by 0.6% in non-family firms, NS for family firms. Tobin’s Q decreases by 0.7% in family firms, employment grows by 0.4%.
Caprio et al. (2011) SRS, [-2,+2] and [-30,+30]
2,275 completed deals, public Cont. Eur. acquirers, 1998-2008
CARs NS
Panel B. Ownership Structure and Managerial Ownership Hubbard and Palia (1995)
SRS, [-4,+4] 172 completed mergers, public US acquirers, 1985-1991
CARs Non-linear If managerial ownership <5%, CARs are +0.33%; -0.16% if >5%, NS if > 25%.
Wright et al. (2002)
SRS, [-1,0] and [-3,+3]
US public acquirers and targets, 1993-1997
CARs, controlled for institutional ownership, acquisition experience, size, and relatedness.
Non-linear $100 million increase in value of CEO stock ownership increases returns by 6.7% (7.2%), unit increase in squared value of CEO stock ownership decreases returns by 2.8% (3%) over [-1,0] ([-3,+3]) window.
Schneider and Spalt (2017a)
SRS, [-1,+1] 3,538 takeover bids, public US targets and acquirers, 1987-2008.
CARs Negative Acquirer CARs are 0.87% lower if a CEO with high ownership acquires a risky target, and they are 0.36% lower if a CEO with lower ownership acquires a risky target (relative to a less risky target).
LRO, [-1y,+1y] ROA Negative Acquirer ROA decreases with 1% in the year after a deal announcement if target riskiness increases with one st. dev.
44
1.
WH
AT
GO
ES W
RO
NG
IN M
&A
S?
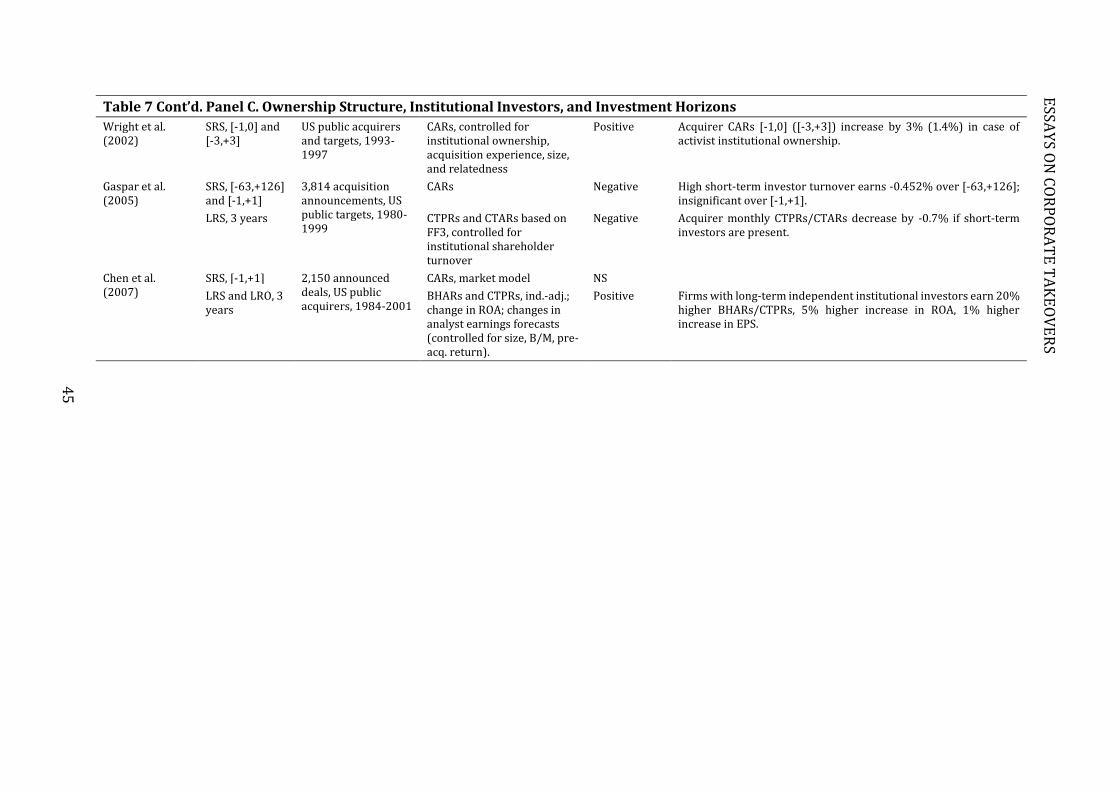
Table 7 Cont’d. Panel C. Ownership Structure, Institutional Investors, and Investment Horizons
Wright et al. (2002)
SRS, [-1,0] and [-3,+3]
US public acquirers and targets, 1993-1997
CARs, controlled for institutional ownership, acquisition experience, size, and relatedness
Positive Acquirer CARs [-1,0] ([-3,+3]) increase by 3% (1.4%) in case of activist institutional ownership.
Gaspar et al. (2005)
SRS, [-63,+126] and [-1,+1]
3,814 acquisition announcements, US public targets, 1980-1999
CARs Negative High short-term investor turnover earns -0.452% over [-63,+126]; insignificant over [-1,+1].
LRS, 3 years CTPRs and CTARs based on FF3, controlled for institutional shareholder turnover
Negative Acquirer monthly CTPRs/CTARs decrease by -0.7% if short-term investors are present.
Chen et al. (2007)
SRS, [-1,+1] 2,150 announced deals, US public acquirers, 1984-2001
CARs, market model NS
LRS and LRO, 3 years
BHARs and CTPRs, ind.-adj.; change in ROA; changes in analyst earnings forecasts (controlled for size, B/M, pre-acq. return).
Positive Firms with long-term independent institutional investors earn 20% higher BHARs/CTPRs, 5% higher increase in ROA, 1% higher increase in EPS.
45
ESSA
YS O
N C
OR
PO
RA
TE
TA
KE
OV
ER
S
1. WHAT GOES WRONG IN M&AS?
46
5.6.1 Family firms
Around the world, a large fraction of publicly listed firms have concentrated ownership
in the form of a dominant owner, in many cases a (founding) family.14 With the majority
of M&A research being based on US samples, it remains an important question as to
whether family firms are better at making takeover decisions than widely held
corporations. For the US, Bauguess and Stegemoller (2008) find significantly negative
announcement CARs for acquisitions by S&P500 family firms, however they discover that
these negative effects are alleviated if the bidding firm has a large board or more insiders.
Similarly, Shim and Okamuro (2011) consider Japanese listed family firms and report that
their long-run operating performance is significantly lower than that of non-family firms.
For stock-financed deals by public US family firms, Basu, Dimitrova, and Paeglis (2009)
report that the effect of family ownership on M&A value creation depends on the level of
ownership: although family entrenchment induces a negative relationship at low levels
of family ownership, a better alignment of family interests with those of minority
shareholders results in a positive relationship at high levels of family ownership. For
continental Europe, Caprio, Croci, and Del Giudice (2011) do not find evidence that
acquisitions by family-controlled firms are value-destroying, and for Canadian public
family firms, Ben-Amar and André (2006) even find significantly higher acquirer
announcement returns, that increase even more for firms where the acquirer’s CEO is a
member of the controlling family. Overall, these results indicate that the link between
family ownership and M&A performance varies considerably across countries, which
suggests that it may depend on the legal and institutional environment. The long-run
evidence on merger performance by family firms is still scarce and thus provides scope
for future research.
5.6.2 Managerial ownership
As predicted by agency theory, managerial ownership should have a beneficial effect on
merger performance, as it aligns the interests of management and shareholders.
Nevertheless, empirical studies provide here also mixed results. An early study by
Lewellen et al. (1985) unveils a positive relationship between the equity stake owned by
14 La Porta, Lopez-de-Silanes, and Shleifer (1999) report that 50% of all large public firms worldwide are family-
controlled. Although family ownership mostly predominates in continental Europe, Anderson and Reeb (2003)
still report that 16% of S&P500 firms are managed by the founding family.
ESSAYS ON CORPORATE TAKEOVERS
47
senior management and acquirer returns. More recent evidence, however, depicts a non-
linear relation between acquirer announcement returns and managerial ownership.
Returns are generally highest at moderate (between 5% and 25%) levels of ownership,
because at lower ownership levels agency costs such as perquisite consumption reduce
returns (Hubbard and Palia, 1995) and at higher levels of managerial ownership
beneficial risk-increasing strategies are replaced by non-value-maximizing risk-reducing
strategies because managers become more risk-averse (Wright et al., 2002). Therefore,
at high and low levels of ownership, misalignment of interests results in inefficient
takeover decisions and negative announcement returns, whereas management and
shareholder interests are most aligned at moderate levels of ownership. Schneider and
Spalt (2017a) provide evidence for a gambling channel through which CEOs with high
ownership (who have more power to influence takeover decisions) are more likely to
acquire riskier targets, defined as having high idiosyncratic stock volatility. Takeovers
involving risky targets perform worse in the short and in the long run, with a 1% decrease
in ROA in the year after the deal announcement for a one standard deviation change in
target risk Although these CEOs do not consciously make bad decisions for shareholders,
but they tend to go with their guts and systematically make mistakes.
5.6.3 Institutional investors and investment horizons
Investors can be distinguished based their type or degree of ownership concentration,
but the literature has further differentiated investors (and institutional investors in
particular) based on their investment horizons. Short-term investors have few incentives
to monitor management’s decision making as they have less time to learn about the firm
and are less likely to reap the corresponding benefits of monitoring which may take time
to be impounded in share prices, whereas long-term investors have stronger incentives
to monitor. As investor horizons are hard to identify for retail investors, the empirical
research is limited to analyses of institutional investors’ horizons. Monitoring by long-
term institutional investors reduces management-shareholder agency conflicts such that
acquirer announcement returns, long-term post-acquisition stock returns, and long-term
operating performance are significantly higher when long-horizon investors are present
(Gaspar, Massa, and Matos, 2005; Chen, Harford, and Li, 2007). Moreover, these firms are
also less likely to announce deals with the worst returns, but if announcement returns
1. WHAT GOES WRONG IN M&AS?
48
are indeed poor, firms with long-horizon institutional investors are more likely to
withdraw their bids.
5.7 Cultural distance
In the period 1986 to 2000, cross-border acquisitions accounted for about 26% of the
total value of acquisitions (Conn et al., 2005), but this share of cross-border mergers
doubled to 45% in 2007 (Erel, Liao, and Weisbach, 2012). Although cross-border mergers
enable firms to access new markets and benefit from economies of scale and scope, they
also complicate the integration process not only because rules and regulations are
different, but so are national cultures, norms, and values. Theoretically, cultural
differences can, on the one hand, create opportunities by enabling knowledge transfers
and exposing the firm to new practices and techniques (Morosini, Shane, and Singh, 1998;
Chakrabarti et al., 2008; Sarala and Vaara, 2010; Steigner and Sutton, 2011),15 while, on
the other hand, they can increase social conflicts and induce post-merger coordination
difficulties that curdle the achievement of synergies (Rahahleh and Wei, 2013; Aybar and
Ficici, 2009; Conn et al., 2005; Siegel, Licht, and Schwartz, 2011).
As a consequence, it is not surprising that the short- and long-term takeover
returns vary with the bidder’s and target’s country specificities (Gregory and
McCorriston, 2005). Ahern, Daminelli, and Fracassi (2012) mainly consider cultural
differences in trust and individualism, and although the short-run effects show some
evidence that mergers between firms in culturally closer countries result in higher
combined announcement effects, they find no consistent significant effect on long-run
acquirer stock returns. Other studies consider the effect of country cultures on M&A
intensity (Chan and Cheung, 2015) and merger premiums (Lim, Makhija, and Shenkar,
2016), but there are hardly any studies relating country culture and long-run deal
performance.
There is however some evidence on cultural differences in the context of
innovation and high-tech firms: Steigner and Sutton (2011) report that long-term
operating performance and stock returns are significantly higher in deals (a) with a large
cultural distance between target and acquirer and (b) where the acquirer has a high level
15 We will here discuss the main findings in the finance literature; for an overview in the management literature, see Stahl and Voigt (2008).

ESSAYS ON CORPORATE TAKEOVERS
49
of R&D. They thus conclude that the combination of a high level of intangibles or R&D
with a high cultural distance is key to internalizing synergetic benefits. Reus and Lamont
(2009) confirm this conclusion and state that a higher cultural distance negatively affects
returns, except in the case of acquisitions by high-tech firms or firms with a high level of
intangible assets. Cultural distance can thus increase shareholder returns in firms with
higher learning opportunities, such as those with a high level of intangibles and those in
high-tech and R&D-intensive industries.
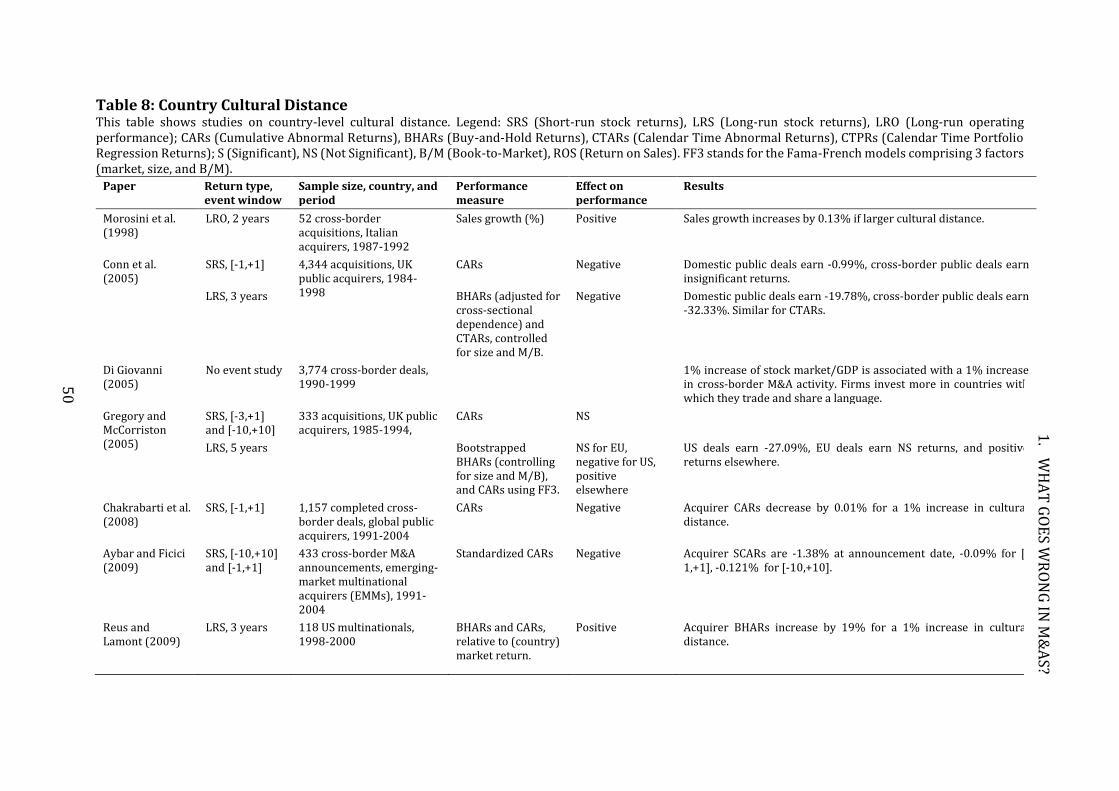
Table 8: Country Cultural Distance This table shows studies on country-level cultural distance. Legend: SRS (Short-run stock returns), LRS (Long-run stock returns), LRO (Long-run operating performance); CARs (Cumulative Abnormal Returns), BHARs (Buy-and-Hold Returns), CTARs (Calendar Time Abnormal Returns), CTPRs (Calendar Time Portfolio Regression Returns); S (Significant), NS (Not Significant), B/M (Book-to-Market), ROS (Return on Sales). FF3 stands for the Fama-French models comprising 3 factors (market, size, and B/M).
Paper Return type, event window
Sample size, country, and period
Performance measure
Effect on performance
Results
Morosini et al. (1998)
LRO, 2 years 52 cross-border acquisitions, Italian acquirers, 1987-1992
Sales growth (%) Positive Sales growth increases by 0.13% if larger cultural distance.
Conn et al. (2005)
SRS, [-1,+1] 4,344 acquisitions, UK public acquirers, 1984-1998
CARs Negative Domestic public deals earn -0.99%, cross-border public deals earn insignificant returns.
LRS, 3 years BHARs (adjusted for cross-sectional dependence) and CTARs, controlled for size and M/B.
Negative Domestic public deals earn -19.78%, cross-border public deals earn -32.33%. Similar for CTARs.
Di Giovanni (2005)
No event study 3,774 cross-border deals, 1990-1999
1% increase of stock market/GDP is associated with a 1% increase in cross-border M&A activity. Firms invest more in countries with which they trade and share a language.
Gregory and McCorriston (2005)
SRS, [-3,+1] and [-10,+10]
333 acquisitions, UK public acquirers, 1985-1994,
CARs NS
LRS, 5 years Bootstrapped BHARs (controlling for size and M/B), and CARs using FF3.
NS for EU, negative for US, positive elsewhere
US deals earn -27.09%, EU deals earn NS returns, and positive returns elsewhere.
Chakrabarti et al. (2008)
SRS, [-1,+1] 1,157 completed cross-border deals, global public acquirers, 1991-2004
CARs Negative Acquirer CARs decrease by 0.01% for a 1% increase in cultural distance.
Aybar and Ficici (2009)
SRS, [-10,+10] and [-1,+1]
433 cross-border M&A announcements, emerging-market multinational acquirers (EMMs), 1991-2004
Standardized CARs Negative Acquirer SCARs are -1.38% at announcement date, -0.09% for [-1,+1], -0.121% for [-10,+10].
Reus and Lamont (2009)
LRS, 3 years 118 US multinationals, 1998-2000
BHARs and CARs, relative to (country) market return.
Positive Acquirer BHARs increase by 19% for a 1% increase in cultural distance.
50
1.
WH
AT
GO
ES W
RO
NG
IN M
&A
S?
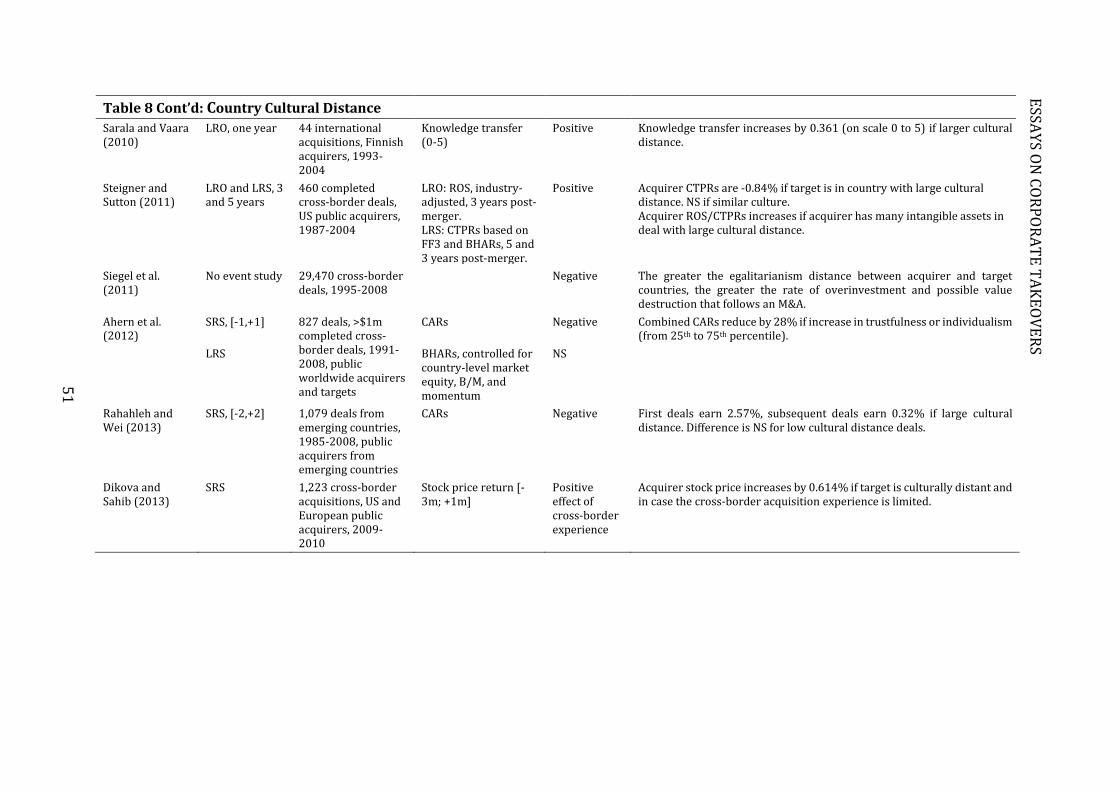
Table 8 Cont’d: Country Cultural Distance
Sarala and Vaara (2010)
LRO, one year 44 international acquisitions, Finnish acquirers, 1993-2004
Knowledge transfer (0-5)
Positive Knowledge transfer increases by 0.361 (on scale 0 to 5) if larger cultural distance.
Steigner and Sutton (2011)
LRO and LRS, 3 and 5 years
460 completed cross-border deals, US public acquirers, 1987-2004
LRO: ROS, industry-adjusted, 3 years post-merger. LRS: CTPRs based on FF3 and BHARs, 5 and 3 years post-merger.
Positive Acquirer CTPRs are -0.84% if target is in country with large cultural distance. NS if similar culture. Acquirer ROS/CTPRs increases if acquirer has many intangible assets in deal with large cultural distance.
Siegel et al. (2011)
No event study 29,470 cross-border deals, 1995-2008
Negative The greater the egalitarianism distance between acquirer and target countries, the greater the rate of overinvestment and possible value destruction that follows an M&A.
Ahern et al. (2012)
SRS, [-1,+1] 827 deals, >$1m completed cross-border deals, 1991-2008, public worldwide acquirers and targets
CARs Negative Combined CARs reduce by 28% if increase in trustfulness or individualism (from 25th to 75th percentile).
LRS BHARs, controlled for country-level market equity, B/M, and momentum
NS
Rahahleh and Wei (2013)
SRS, [-2,+2] 1,079 deals from emerging countries, 1985-2008, public acquirers from emerging countries
CARs Negative First deals earn 2.57%, subsequent deals earn 0.32% if large cultural distance. Difference is NS for low cultural distance deals.
Dikova and Sahib (2013)
SRS 1,223 cross-border acquisitions, US and European public acquirers, 2009-2010
Stock price return [-3m; +1m]
Positive effect of cross-border experience
Acquirer stock price increases by 0.614% if target is culturally distant and in case the cross-border acquisition experience is limited.
51
ESSA
YS O
N C
OR
PO
RA
TE
TA
KE
OV
ER
S
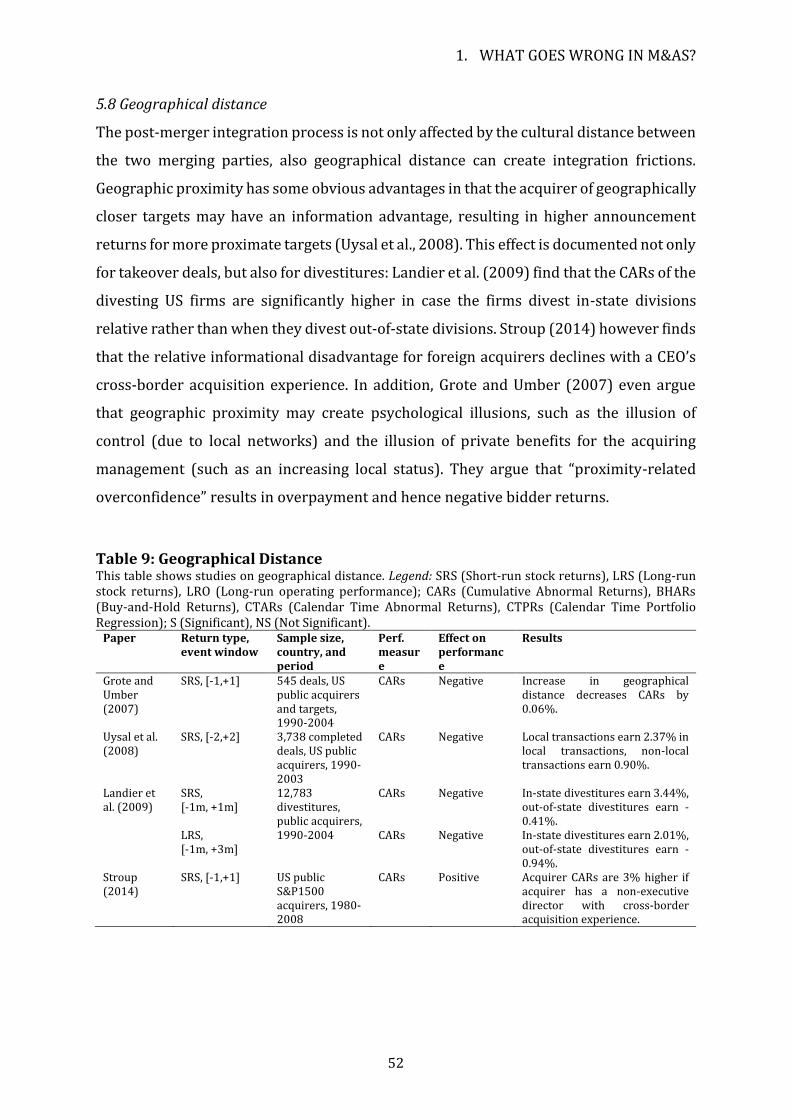
1. WHAT GOES WRONG IN M&AS?
52
5.8 Geographical distance
The post-merger integration process is not only affected by the cultural distance between
the two merging parties, also geographical distance can create integration frictions.
Geographic proximity has some obvious advantages in that the acquirer of geographically
closer targets may have an information advantage, resulting in higher announcement
returns for more proximate targets (Uysal et al., 2008). This effect is documented not only
for takeover deals, but also for divestitures: Landier et al. (2009) find that the CARs of the
divesting US firms are significantly higher in case the firms divest in-state divisions
relative rather than when they divest out-of-state divisions. Stroup (2014) however finds
that the relative informational disadvantage for foreign acquirers declines with a CEO’s
cross-border acquisition experience. In addition, Grote and Umber (2007) even argue
that geographic proximity may create psychological illusions, such as the illusion of
control (due to local networks) and the illusion of private benefits for the acquiring
management (such as an increasing local status). They argue that “proximity-related
overconfidence” results in overpayment and hence negative bidder returns.
Table 9: Geographical Distance This table shows studies on geographical distance. Legend: SRS (Short-run stock returns), LRS (Long-run stock returns), LRO (Long-run operating performance); CARs (Cumulative Abnormal Returns), BHARs (Buy-and-Hold Returns), CTARs (Calendar Time Abnormal Returns), CTPRs (Calendar Time Portfolio Regression); S (Significant), NS (Not Significant).
Paper Return type, event window
Sample size, country, and period
Perf. measure
Effect on performance
Results
Grote and Umber (2007)
SRS, [-1,+1] 545 deals, US public acquirers and targets, 1990-2004
CARs Negative Increase in geographical distance decreases CARs by 0.06%.
Uysal et al. (2008)
SRS, [-2,+2] 3,738 completed deals, US public acquirers, 1990-2003
CARs Negative Local transactions earn 2.37% in local transactions, non-local transactions earn 0.90%.
Landier et al. (2009)
SRS, [-1m, +1m]
12,783 divestitures, public acquirers, 1990-2004
CARs Negative In-state divestitures earn 3.44%, out-of-state divestitures earn -0.41%.
LRS, [-1m, +3m]
CARs Negative In-state divestitures earn 2.01%, out-of-state divestitures earn -0.94%.
Stroup (2014)
SRS, [-1,+1] US public S&P1500 acquirers, 1980-2008
CARs Positive Acquirer CARs are 3% higher if acquirer has a non-executive director with cross-border acquisition experience.
ESSAYS ON CORPORATE TAKEOVERS
53
5.9 Spillovers in corporate governance and investor protection
Although cross-border M&As can complicate the creation and realization of synergies,
they can also create additional sources of synergies. In deals where bidder and target are
subject to cross-country differences in corporate governance regulation and investor
protection, spillovers in governance standards can benefit both bidder and target
shareholders and bondholders. Bidder shareholders benefit in cross-border deals when
the bidder’s corporate governance standards are stricter (more shareholder-oriented)
than the target’s, as this facilitates the bidder’s ability to restructure the target and shifts
the focus (at the target level) to shareholder value creation rather than private
managerial benefits (Martynova and Renneboog, 2008b; Capron and Guillen, 2009). Such
effects have been shown to hold both in the short run and in the long run (Wang and Xie,
2009), and in an international setting (Martynova and Renneboog (2008b) for intra-
European deals, or Capron and Guillen (2009) for worldwide deals).
The wealth effects for target firms in deals where investor protection is better in
the acquirer country relative to the target country depend on the location of the target
firms: Starks and Wei (2004) report lower target returns (but they only consider US
target firms and stock-financed deals) whereas Bris and Cabolis (2008) and Martynova
and Renneboog (2008b) report higher target announcement returns for a global sample.
Not only differences in the level of shareholder protection can induce spillover effects,
acquirer stock and bond returns are also affected by creditor rights protection
(Renneboog and Szilagyi, 2008; Kuipers, Miller, and Patel, 2009; Renneboog, Szilagyi, and
Vansteenkiste, 2017) and employee rights protection (Capron and Guillen, 2009;
Dessaint, Golubov, and Volpin, 2017).
A higher level of employee rights protection in the target country reduces acquirer
returns, as this restricts the acquirer’s ability to restructure the target firm. Although a
higher level of creditor rights protection in the acquirer country also reduces acquirer
stock returns, acquirer bondholders react positively to stronger creditor protection in the
target’s country, as multinational insolvency regulations allow creditors to start main
insolvency proceedings under such a jurisdiction.
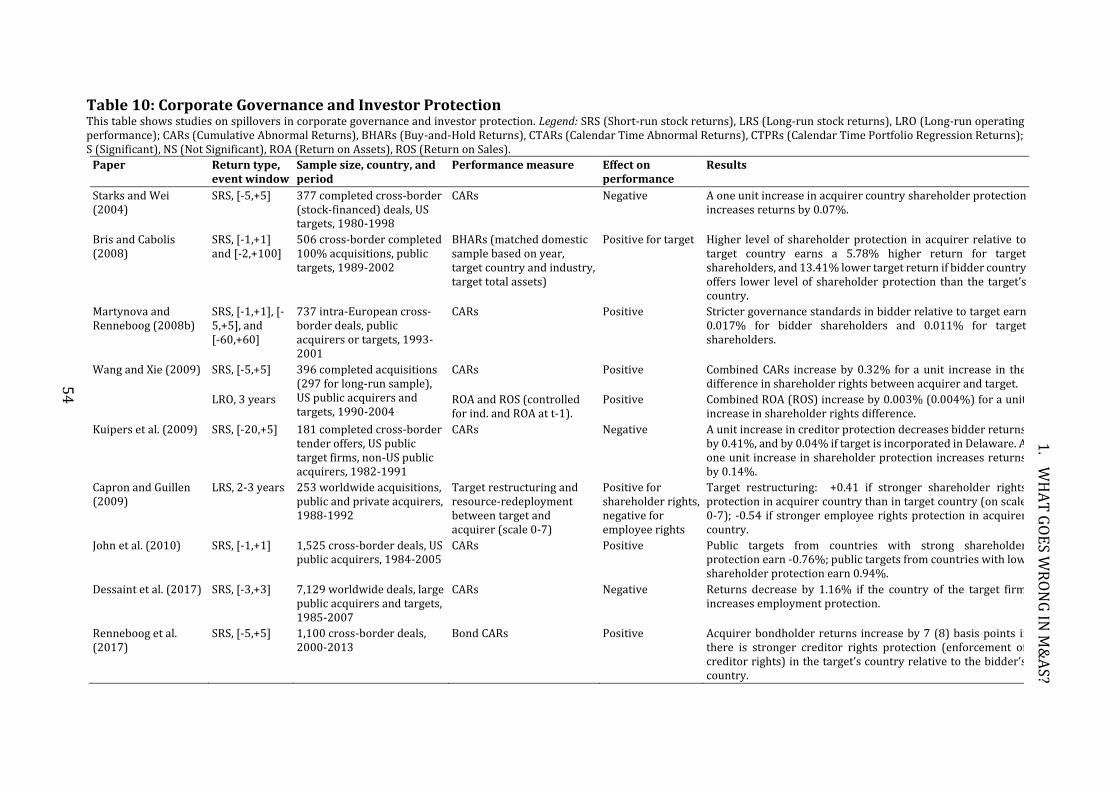
Table 10: Corporate Governance and Investor Protection This table shows studies on spillovers in corporate governance and investor protection. Legend: SRS (Short-run stock returns), LRS (Long-run stock returns), LRO (Long-run operating performance); CARs (Cumulative Abnormal Returns), BHARs (Buy-and-Hold Returns), CTARs (Calendar Time Abnormal Returns), CTPRs (Calendar Time Portfolio Regression Returns); S (Significant), NS (Not Significant), ROA (Return on Assets), ROS (Return on Sales).
Paper Return type, event window
Sample size, country, and period
Performance measure Effect on performance
Results
Starks and Wei (2004)
SRS, [-5,+5] 377 completed cross-border (stock-financed) deals, US targets, 1980-1998
CARs Negative A one unit increase in acquirer country shareholder protection increases returns by 0.07%.
Bris and Cabolis (2008)
SRS, [-1,+1] and [-2,+100]
506 cross-border completed 100% acquisitions, public targets, 1989-2002
BHARs (matched domestic sample based on year, target country and industry, target total assets)
Positive for target Higher level of shareholder protection in acquirer relative to target country earns a 5.78% higher return for target shareholders, and 13.41% lower target return if bidder country offers lower level of shareholder protection than the target’s country.
Martynova and Renneboog (2008b)
SRS, [-1,+1], [-5,+5], and [-60,+60]
737 intra-European cross-border deals, public acquirers or targets, 1993-2001
CARs Positive Stricter governance standards in bidder relative to target earn 0.017% for bidder shareholders and 0.011% for target shareholders.
Wang and Xie (2009) SRS, [-5,+5] 396 completed acquisitions (297 for long-run sample), US public acquirers and targets, 1990-2004
CARs Positive Combined CARs increase by 0.32% for a unit increase in the difference in shareholder rights between acquirer and target.
LRO, 3 years ROA and ROS (controlled for ind. and ROA at t-1).
Positive Combined ROA (ROS) increase by 0.003% (0.004%) for a unit increase in shareholder rights difference.
Kuipers et al. (2009) SRS, [-20,+5] 181 completed cross-border tender offers, US public target firms, non-US public acquirers, 1982-1991
CARs Negative A unit increase in creditor protection decreases bidder returns by 0.41%, and by 0.04% if target is incorporated in Delaware. A one unit increase in shareholder protection increases returns by 0.14%.
Capron and Guillen (2009)
LRS, 2-3 years 253 worldwide acquisitions, public and private acquirers, 1988-1992
Target restructuring and resource-redeployment between target and acquirer (scale 0-7)
Positive for shareholder rights, negative for employee rights
Target restructuring: +0.41 if stronger shareholder rights protection in acquirer country than in target country (on scale 0-7); -0.54 if stronger employee rights protection in acquirer country.
John et al. (2010) SRS, [-1,+1] 1,525 cross-border deals, US public acquirers, 1984-2005
CARs Positive Public targets from countries with strong shareholder protection earn -0.76%; public targets from countries with low shareholder protection earn 0.94%.
Dessaint et al. (2017) SRS, [-3,+3] 7,129 worldwide deals, large public acquirers and targets, 1985-2007
CARs Negative Returns decrease by 1.16% if the country of the target firm increases employment protection.
Renneboog et al. (2017)
SRS, [-5,+5] 1,100 cross-border deals, 2000-2013
Bond CARs Positive Acquirer bondholder returns increase by 7 (8) basis points if there is stronger creditor rights protection (enforcement of creditor rights) in the target’s country relative to the bidder’s country.
1.
WH
AT
GO
ES W
RO
NG
IN M
&A
S?
54
ESSAYS ON CORPORATE TAKEOVERS
55
5.10 Industry and product market relatedness
While we previously discussed differences in national and corporate cultures on the post-
merger integration process, we now turn to industry-relatedness of bidder and target,
product market overlap, and strategic compatibility, each of which may affect the post-
merger integration process. Related or focused acquisitions are expected to provide
better returns relative to diversifying mergers because the acquirer is more likely to have
the skills and resources required to operate and integrate the target firm (Rhodes-Kropf
and Robinson, 2008). Martynova, Oosting, and Renneboog (2007), however, do not find
evidence that the difference between pre- and post-takeover long term operating
performance (corrected for the performance of a matched sample of peer companies)
differs between focused and diversifying transactions.16
Moreover, although the risk of managers’ undiversified personal portfolios is
reduced in diversified firms, managerial entrenchment is intensified (Amihud and Lev,
1981; Shleifer and Vishny, 1989).17 Fan and Goyal (2006) find that vertical mergers result
in significantly larger combined announcement returns than diversifying mergers. Asset
complementarity (as proxied by industry relatedness) can thus considerably decrease
business risk by facilitating the post-acquisition integration process and leveraging the
acquiring firms’ pre-existing resources and strengths in new markets. This is confirmed
by Schoar (2002) in a study at the plant-level: firms that acquire plants in unrelated
industries experience a subsequent decline in total firm productivity, but acquired plants
integrated into an already diversified firm increase their productivity more than plants
moving from a diversified firm into a stand-alone firm.
16 Around the takeover announcement, Martynova and Renneboog (2011a) unveil that a diversifying bidder’s short-term CARs (capturing the announcement effect as well as the two-month price movement prior to the announcement) are 3% lower than those of a bidder with a focused takeover policy. The target shareholders subject to a diversifying bid benefit from CARs that are 6% larger than those subject to a focused bid. This evidence along with the evidence from the literature on the conglomerate discount (which frowns upon corporate diversification), implies that managers who undertake diversifying takeover transactions overpay for the target and their diversification policy may stem from empire-building intentions. 17 In the 1960s and 1970s, conglomerate mergers exhibited positive abnormal returns to acquirers (Matsusaka, 1993; Hubbard and Palia, 1999) because the internal capital markets of conglomerates made up for poorly functioning international capital markets. These effects are no longer observed in studies since the 1980s, however.
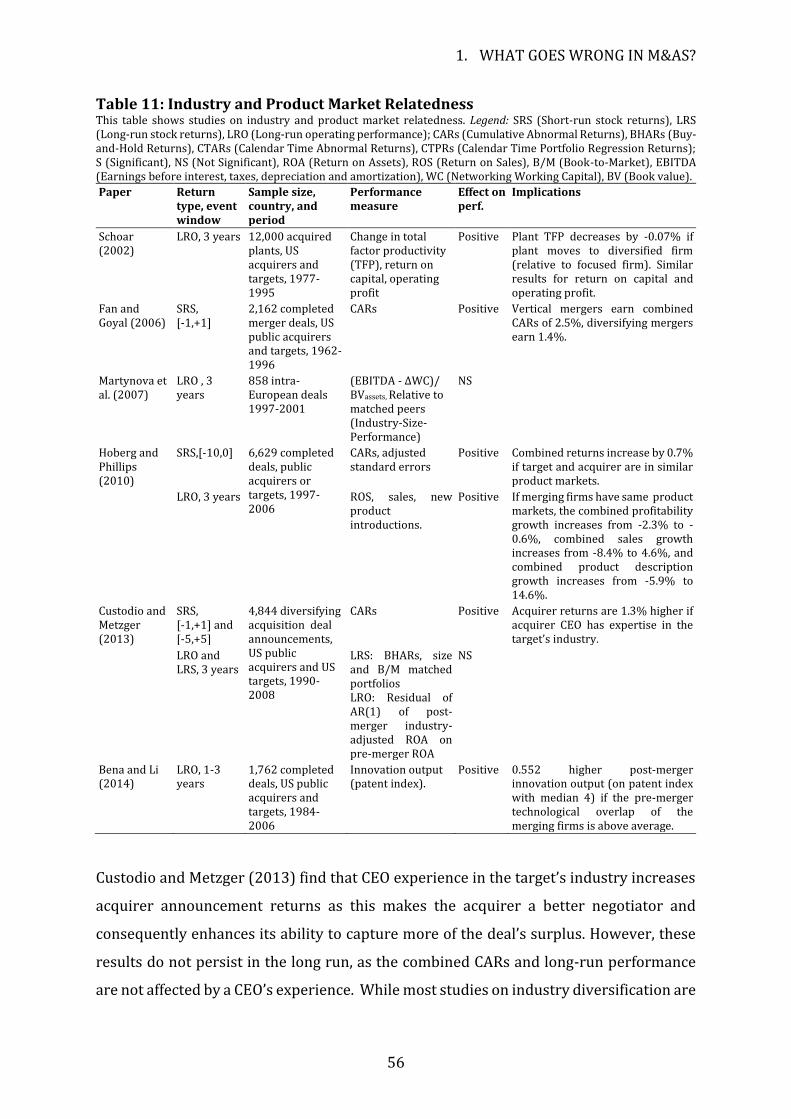
1. WHAT GOES WRONG IN M&AS?
56
Table 11: Industry and Product Market Relatedness This table shows studies on industry and product market relatedness. Legend: SRS (Short-run stock returns), LRS (Long-run stock returns), LRO (Long-run operating performance); CARs (Cumulative Abnormal Returns), BHARs (Buy-and-Hold Returns), CTARs (Calendar Time Abnormal Returns), CTPRs (Calendar Time Portfolio Regression Returns); S (Significant), NS (Not Significant), ROA (Return on Assets), ROS (Return on Sales), B/M (Book-to-Market), EBITDA (Earnings before interest, taxes, depreciation and amortization), WC (Networking Working Capital), BV (Book value).
Paper Return type, event window
Sample size, country, and period
Performance measure
Effect on perf.
Implications
Schoar (2002)
LRO, 3 years 12,000 acquired plants, US acquirers and targets, 1977-1995
Change in total factor productivity (TFP), return on capital, operating profit
Positive Plant TFP decreases by -0.07% if plant moves to diversified firm (relative to focused firm). Similar results for return on capital and operating profit.
Fan and Goyal (2006)
SRS, [-1,+1]
2,162 completed merger deals, US public acquirers and targets, 1962-1996
CARs Positive Vertical mergers earn combined CARs of 2.5%, diversifying mergers earn 1.4%.
Martynova et al. (2007)
LRO , 3 years
858 intra-European deals 1997-2001
(EBITDA - ∆WC)/ BVassets, Relative to matched peers (Industry-Size-Performance)
NS
Hoberg and Phillips (2010)
SRS,[-10,0] 6,629 completed deals, public acquirers or targets, 1997-2006
CARs, adjusted standard errors
Positive Combined returns increase by 0.7% if target and acquirer are in similar product markets.
LRO, 3 years ROS, sales, new product introductions.
Positive If merging firms have same product markets, the combined profitability growth increases from -2.3% to -0.6%, combined sales growth increases from -8.4% to 4.6%, and combined product description growth increases from -5.9% to 14.6%.
Custodio and Metzger (2013)
SRS, [-1,+1] and [-5,+5]
4,844 diversifying acquisition deal announcements, US public acquirers and US targets, 1990-2008
CARs
Positive Acquirer returns are 1.3% higher if acquirer CEO has expertise in the target’s industry.
LRO and LRS, 3 years
LRS: BHARs, size and B/M matched portfolios LRO: Residual of AR(1) of post-merger industry-adjusted ROA on pre-merger ROA
NS
Bena and Li (2014)
LRO, 1-3 years
1,762 completed deals, US public acquirers and targets, 1984-2006
Innovation output (patent index).
Positive 0.552 higher post-merger innovation output (on patent index with median 4) if the pre-merger technological overlap of the merging firms is above average.
Custodio and Metzger (2013) find that CEO experience in the target’s industry increases
acquirer announcement returns as this makes the acquirer a better negotiator and
consequently enhances its ability to capture more of the deal’s surplus. However, these
results do not persist in the long run, as the combined CARs and long-run performance
are not affected by a CEO’s experience. While most studies on industry diversification are
ESSAYS ON CORPORATE TAKEOVERS
57
based on industry SIC or NAIC codes, Hoberg and Phillips (2010) argue that these
industry classes do not accurately reflect potential asset complementarities. Using text-
analysis, they create industries based on a firm’s product descriptions. Their findings
confirm the superior performance of related mergers, since short-term stock returns and
long-term operating profitability and sales are higher for deals between firms with more
product market similarities. Bena and Li (2014) consider a different type of relatedness:
technological overlap. Post-merger innovation output (e.g. patents) increases for deals
where there was a pre-merger technological overlap between bidder and target, but they
do not study the long-run performance of the deal. Overall, almost all available evidence
supports the superior performance of related acquisitions relative to unrelated or
diversified acquisitions, regardless of whether relatedness is measured by means of
industry classifications, product market compatibility, complementariness in the supply
chain, or technological overlap.
5.11 Distressed target acquisitions
A small but important part of the market for corporate control comprises disciplinary
takeovers of poorly performing or financially distressed firms (Franks, Mayer, and
Renneboog, 2001). When a US firm becomes financially distressed, it can either
voluntarily file for bankruptcy and seek protection against its creditors (Chapter 11), or
its creditors can file the bankruptcy in order to liquidate the firm (Chapter 7). In the
former case, the debt and equity claims of the distressed firm are likely to be restated
following a majority approval by its claimants supervised by the court whereas in the
latter case, (part of) the firm’s assets can be liquidated. While there is considerable
empirical evidence on the wealth effects for the sellers of distressed assets, there is much
less evidence on the wealth effects for the buyers of such assets. On the one hand, sales of
distressed targets below their fundamental value may benefit acquirers as they can
purchase the firm at a discount. On the other hand, if acquirers who would benefit most
from acquiring the target operate in the same industry and if distress occurs at the
industry level, this may result in ultimately worse deals and worse overall returns
(Shleifer and Vishny, 1992).
Past research mainly focused on the costs associated with fire sales of distressed
or bankrupt assets. A number of studies from the 1990s examine acquisitions of bankrupt
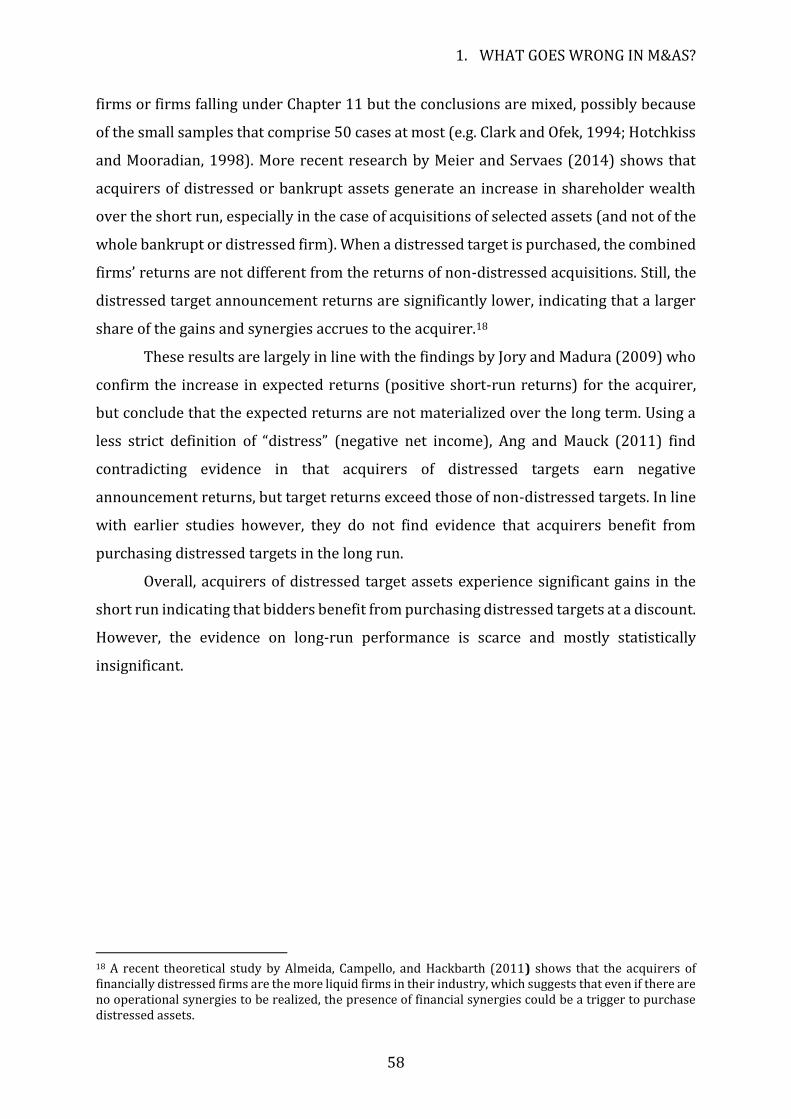
1. WHAT GOES WRONG IN M&AS?
58
firms or firms falling under Chapter 11 but the conclusions are mixed, possibly because
of the small samples that comprise 50 cases at most (e.g. Clark and Ofek, 1994; Hotchkiss
and Mooradian, 1998). More recent research by Meier and Servaes (2014) shows that
acquirers of distressed or bankrupt assets generate an increase in shareholder wealth
over the short run, especially in the case of acquisitions of selected assets (and not of the
whole bankrupt or distressed firm). When a distressed target is purchased, the combined
firms’ returns are not different from the returns of non-distressed acquisitions. Still, the
distressed target announcement returns are significantly lower, indicating that a larger
share of the gains and synergies accrues to the acquirer.18
These results are largely in line with the findings by Jory and Madura (2009) who
confirm the increase in expected returns (positive short-run returns) for the acquirer,
but conclude that the expected returns are not materialized over the long term. Using a
less strict definition of “distress” (negative net income), Ang and Mauck (2011) find
contradicting evidence in that acquirers of distressed targets earn negative
announcement returns, but target returns exceed those of non-distressed targets. In line
with earlier studies however, they do not find evidence that acquirers benefit from
purchasing distressed targets in the long run.
Overall, acquirers of distressed target assets experience significant gains in the
short run indicating that bidders benefit from purchasing distressed targets at a discount.
However, the evidence on long-run performance is scarce and mostly statistically
insignificant.
18 A recent theoretical study by Almeida, Campello, and Hackbarth (2011) shows that the acquirers of financially distressed firms are the more liquid firms in their industry, which suggests that even if there are no operational synergies to be realized, the presence of financial synergies could be a trigger to purchase distressed assets.
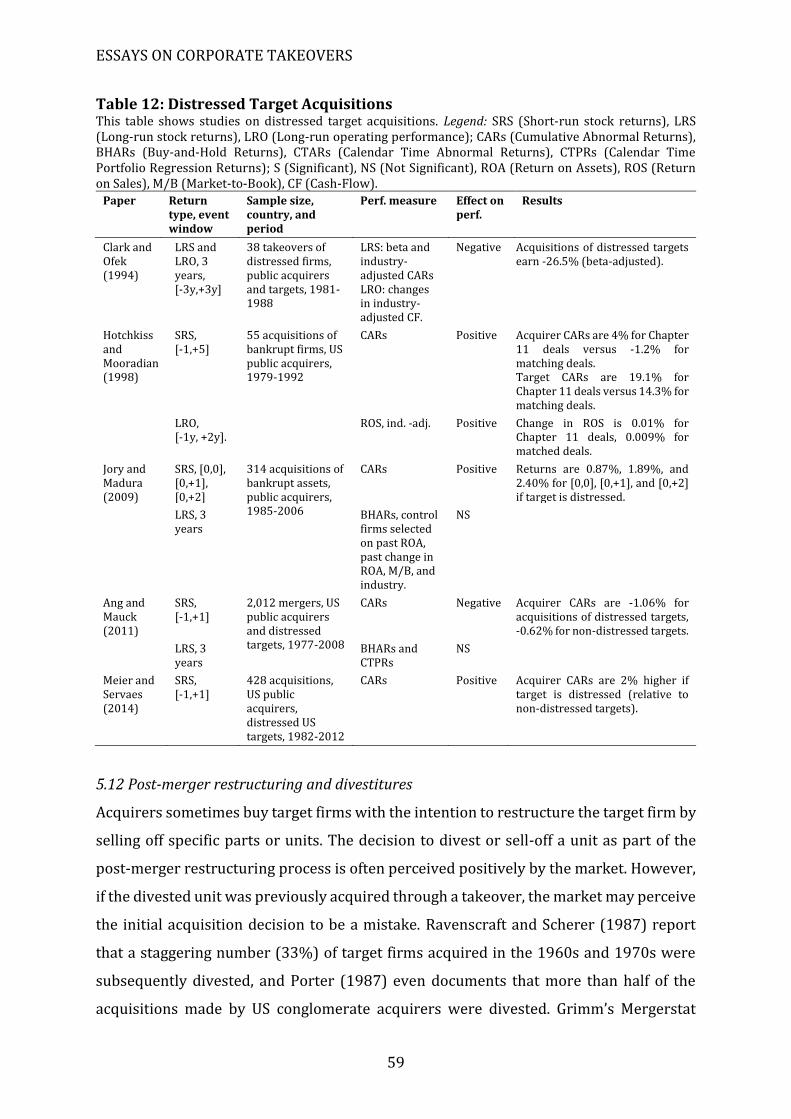
ESSAYS ON CORPORATE TAKEOVERS
59
Table 12: Distressed Target Acquisitions This table shows studies on distressed target acquisitions. Legend: SRS (Short-run stock returns), LRS (Long-run stock returns), LRO (Long-run operating performance); CARs (Cumulative Abnormal Returns), BHARs (Buy-and-Hold Returns), CTARs (Calendar Time Abnormal Returns), CTPRs (Calendar Time Portfolio Regression Returns); S (Significant), NS (Not Significant), ROA (Return on Assets), ROS (Return on Sales), M/B (Market-to-Book), CF (Cash-Flow).
Paper Return type, event window
Sample size, country, and period
Perf. measure Effect on perf.
Results
Clark and Ofek (1994)
LRS and LRO, 3 years, [-3y,+3y]
38 takeovers of distressed firms, public acquirers and targets, 1981-1988
LRS: beta and industry-adjusted CARs LRO: changes in industry-adjusted CF.
Negative Acquisitions of distressed targets earn -26.5% (beta-adjusted).
Hotchkiss and Mooradian (1998)
SRS, [-1,+5]
55 acquisitions of bankrupt firms, US public acquirers, 1979-1992
CARs Positive Acquirer CARs are 4% for Chapter 11 deals versus -1.2% for matching deals. Target CARs are 19.1% for Chapter 11 deals versus 14.3% for matching deals.
LRO, [-1y, +2y].
ROS, ind. -adj. Positive Change in ROS is 0.01% for Chapter 11 deals, 0.009% for matched deals.
Jory and Madura (2009)
SRS, [0,0], [0,+1], [0,+2]
314 acquisitions of bankrupt assets, public acquirers, 1985-2006
CARs Positive Returns are 0.87%, 1.89%, and 2.40% for [0,0], [0,+1], and [0,+2] if target is distressed.
LRS, 3 years
BHARs, control firms selected on past ROA, past change in ROA, M/B, and industry.
NS
Ang and Mauck (2011)
SRS, [-1,+1]
2,012 mergers, US public acquirers and distressed targets, 1977-2008
CARs Negative Acquirer CARs are -1.06% for acquisitions of distressed targets, -0.62% for non-distressed targets.
LRS, 3 years
BHARs and CTPRs
NS
Meier and Servaes (2014)
SRS, [-1,+1]
428 acquisitions, US public acquirers, distressed US targets, 1982-2012
CARs Positive Acquirer CARs are 2% higher if target is distressed (relative to non-distressed targets).
5.12 Post-merger restructuring and divestitures
Acquirers sometimes buy target firms with the intention to restructure the target firm by
selling off specific parts or units. The decision to divest or sell-off a unit as part of the
post-merger restructuring process is often perceived positively by the market. However,
if the divested unit was previously acquired through a takeover, the market may perceive
the initial acquisition decision to be a mistake. Ravenscraft and Scherer (1987) report
that a staggering number (33%) of target firms acquired in the 1960s and 1970s were
subsequently divested, and Porter (1987) even documents that more than half of the
acquisitions made by US conglomerate acquirers were divested. Grimm’s Mergerstat
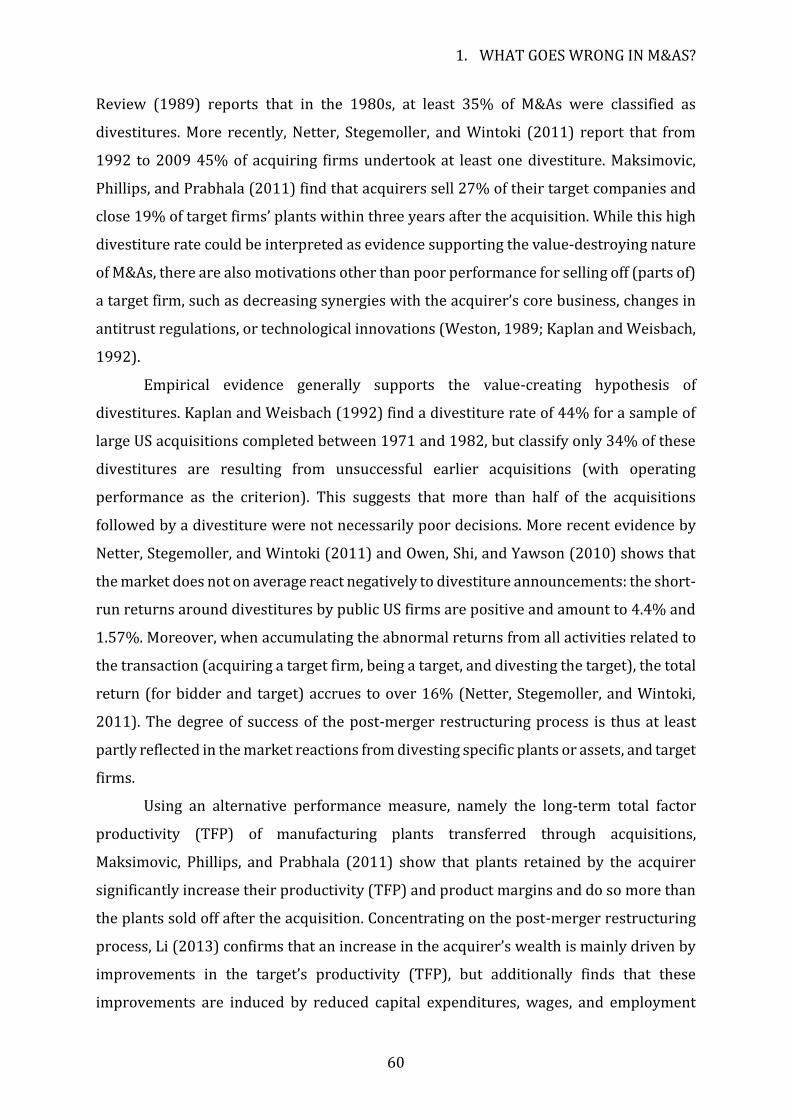
1. WHAT GOES WRONG IN M&AS?
60
Review (1989) reports that in the 1980s, at least 35% of M&As were classified as
divestitures. More recently, Netter, Stegemoller, and Wintoki (2011) report that from
1992 to 2009 45% of acquiring firms undertook at least one divestiture. Maksimovic,
Phillips, and Prabhala (2011) find that acquirers sell 27% of their target companies and
close 19% of target firms’ plants within three years after the acquisition. While this high
divestiture rate could be interpreted as evidence supporting the value-destroying nature
of M&As, there are also motivations other than poor performance for selling off (parts of)
a target firm, such as decreasing synergies with the acquirer’s core business, changes in
antitrust regulations, or technological innovations (Weston, 1989; Kaplan and Weisbach,
1992).
Empirical evidence generally supports the value-creating hypothesis of
divestitures. Kaplan and Weisbach (1992) find a divestiture rate of 44% for a sample of
large US acquisitions completed between 1971 and 1982, but classify only 34% of these
divestitures are resulting from unsuccessful earlier acquisitions (with operating
performance as the criterion). This suggests that more than half of the acquisitions
followed by a divestiture were not necessarily poor decisions. More recent evidence by
Netter, Stegemoller, and Wintoki (2011) and Owen, Shi, and Yawson (2010) shows that
the market does not on average react negatively to divestiture announcements: the short-
run returns around divestitures by public US firms are positive and amount to 4.4% and
1.57%. Moreover, when accumulating the abnormal returns from all activities related to
the transaction (acquiring a target firm, being a target, and divesting the target), the total
return (for bidder and target) accrues to over 16% (Netter, Stegemoller, and Wintoki,
2011). The degree of success of the post-merger restructuring process is thus at least
partly reflected in the market reactions from divesting specific plants or assets, and target
firms.
Using an alternative performance measure, namely the long-term total factor
productivity (TFP) of manufacturing plants transferred through acquisitions,
Maksimovic, Phillips, and Prabhala (2011) show that plants retained by the acquirer
significantly increase their productivity (TFP) and product margins and do so more than
the plants sold off after the acquisition. Concentrating on the post-merger restructuring
process, Li (2013) confirms that an increase in the acquirer’s wealth is mainly driven by
improvements in the target’s productivity (TFP), but additionally finds that these
improvements are induced by reduced capital expenditures, wages, and employment
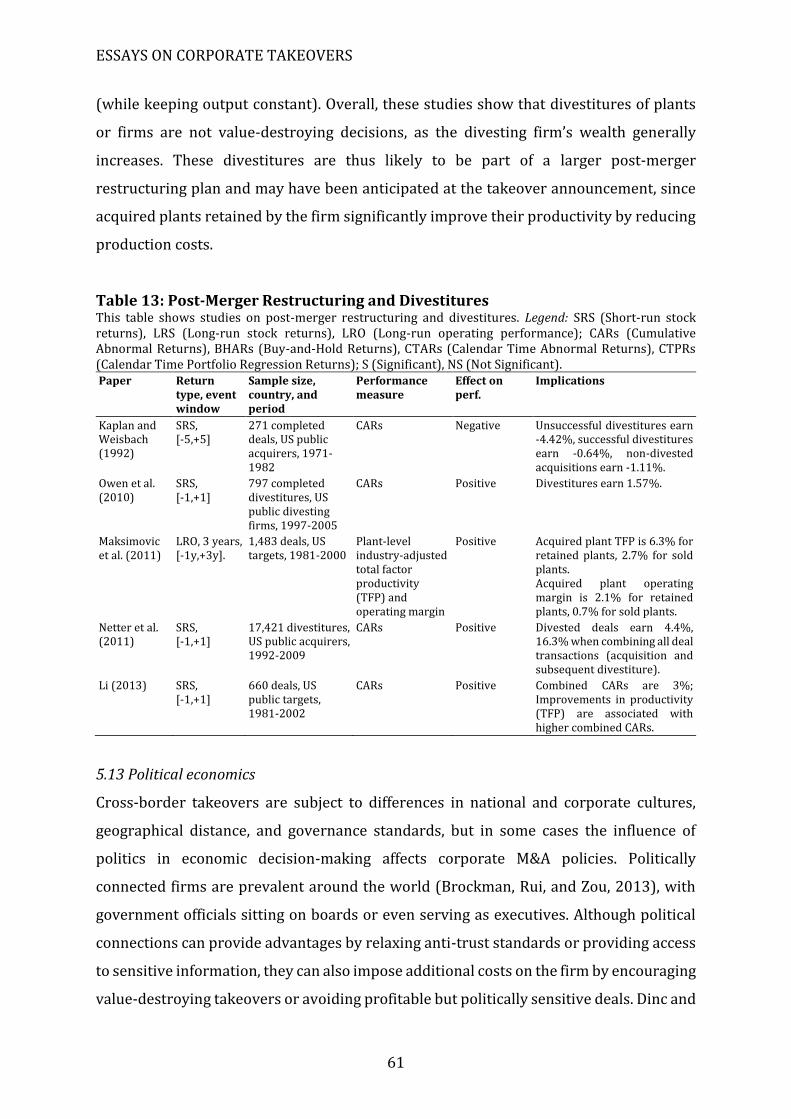
ESSAYS ON CORPORATE TAKEOVERS
61
(while keeping output constant). Overall, these studies show that divestitures of plants
or firms are not value-destroying decisions, as the divesting firm’s wealth generally
increases. These divestitures are thus likely to be part of a larger post-merger
restructuring plan and may have been anticipated at the takeover announcement, since
acquired plants retained by the firm significantly improve their productivity by reducing
production costs.
Table 13: Post-Merger Restructuring and Divestitures This table shows studies on post-merger restructuring and divestitures. Legend: SRS (Short-run stock returns), LRS (Long-run stock returns), LRO (Long-run operating performance); CARs (Cumulative Abnormal Returns), BHARs (Buy-and-Hold Returns), CTARs (Calendar Time Abnormal Returns), CTPRs (Calendar Time Portfolio Regression Returns); S (Significant), NS (Not Significant). Paper Return
type, event window
Sample size, country, and period
Performance measure
Effect on perf.
Implications
Kaplan and Weisbach (1992)
SRS, [-5,+5]
271 completed deals, US public acquirers, 1971-1982
CARs Negative Unsuccessful divestitures earn -4.42%, successful divestitures earn -0.64%, non-divested acquisitions earn -1.11%.
Owen et al. (2010)
SRS, [-1,+1]
797 completed divestitures, US public divesting firms, 1997-2005
CARs Positive Divestitures earn 1.57%.
Maksimovic et al. (2011)
LRO, 3 years, [-1y,+3y].
1,483 deals, US targets, 1981-2000
Plant-level industry-adjusted total factor productivity (TFP) and operating margin
Positive Acquired plant TFP is 6.3% for retained plants, 2.7% for sold plants. Acquired plant operating margin is 2.1% for retained plants, 0.7% for sold plants.
Netter et al. (2011)
SRS, [-1,+1]
17,421 divestitures, US public acquirers, 1992-2009
CARs Positive Divested deals earn 4.4%, 16.3% when combining all deal transactions (acquisition and subsequent divestiture).
Li (2013) SRS, [-1,+1]
660 deals, US public targets, 1981-2002
CARs Positive Combined CARs are 3%; Improvements in productivity (TFP) are associated with higher combined CARs.
5.13 Political economics
Cross-border takeovers are subject to differences in national and corporate cultures,
geographical distance, and governance standards, but in some cases the influence of
politics in economic decision-making affects corporate M&A policies. Politically
connected firms are prevalent around the world (Brockman, Rui, and Zou, 2013), with
government officials sitting on boards or even serving as executives. Although political
connections can provide advantages by relaxing anti-trust standards or providing access
to sensitive information, they can also impose additional costs on the firm by encouraging
value-destroying takeovers or avoiding profitable but politically sensitive deals. Dinc and
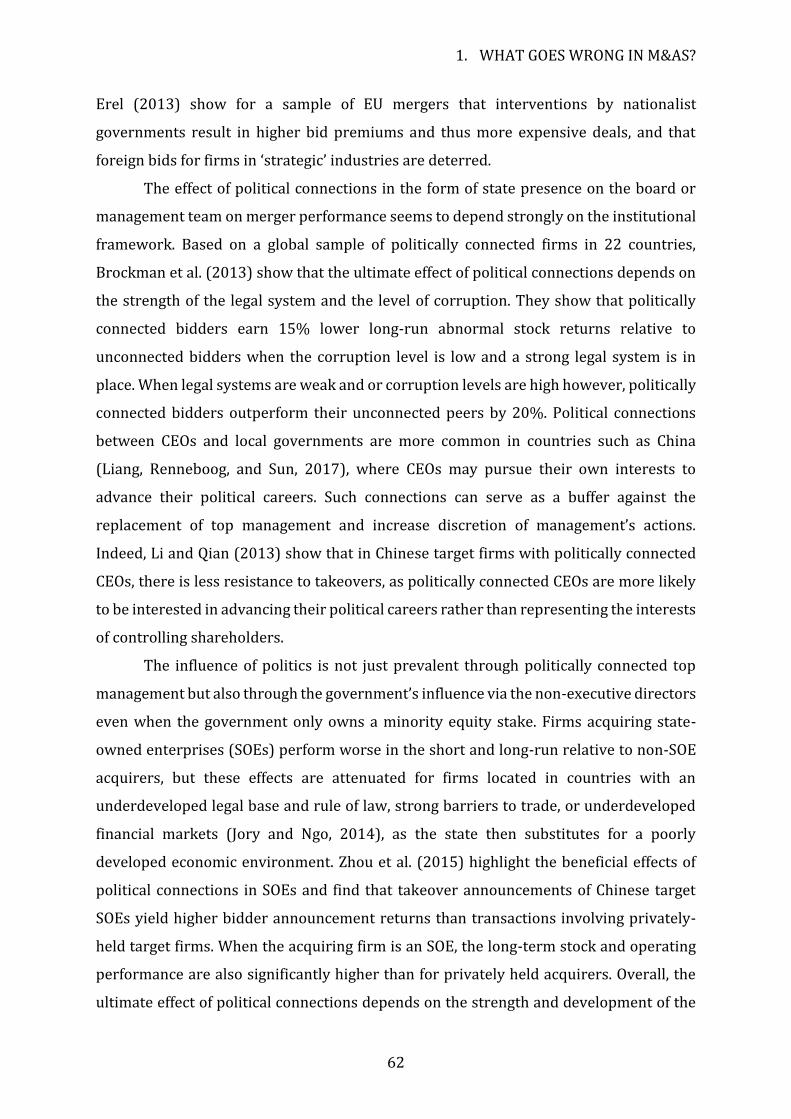
1. WHAT GOES WRONG IN M&AS?
62
Erel (2013) show for a sample of EU mergers that interventions by nationalist
governments result in higher bid premiums and thus more expensive deals, and that
foreign bids for firms in ‘strategic’ industries are deterred.
The effect of political connections in the form of state presence on the board or
management team on merger performance seems to depend strongly on the institutional
framework. Based on a global sample of politically connected firms in 22 countries,
Brockman et al. (2013) show that the ultimate effect of political connections depends on
the strength of the legal system and the level of corruption. They show that politically
connected bidders earn 15% lower long-run abnormal stock returns relative to
unconnected bidders when the corruption level is low and a strong legal system is in
place. When legal systems are weak and or corruption levels are high however, politically
connected bidders outperform their unconnected peers by 20%. Political connections
between CEOs and local governments are more common in countries such as China
(Liang, Renneboog, and Sun, 2017), where CEOs may pursue their own interests to
advance their political careers. Such connections can serve as a buffer against the
replacement of top management and increase discretion of management’s actions.
Indeed, Li and Qian (2013) show that in Chinese target firms with politically connected
CEOs, there is less resistance to takeovers, as politically connected CEOs are more likely
to be interested in advancing their political careers rather than representing the interests
of controlling shareholders.
The influence of politics is not just prevalent through politically connected top
management but also through the government’s influence via the non-executive directors
even when the government only owns a minority equity stake. Firms acquiring state-
owned enterprises (SOEs) perform worse in the short and long-run relative to non-SOE
acquirers, but these effects are attenuated for firms located in countries with an
underdeveloped legal base and rule of law, strong barriers to trade, or underdeveloped
financial markets (Jory and Ngo, 2014), as the state then substitutes for a poorly
developed economic environment. Zhou et al. (2015) highlight the beneficial effects of
political connections in SOEs and find that takeover announcements of Chinese target
SOEs yield higher bidder announcement returns than transactions involving privately-
held target firms. When the acquiring firm is an SOE, the long-term stock and operating
performance are also significantly higher than for privately held acquirers. Overall, the
ultimate effect of political connections depends on the strength and development of the
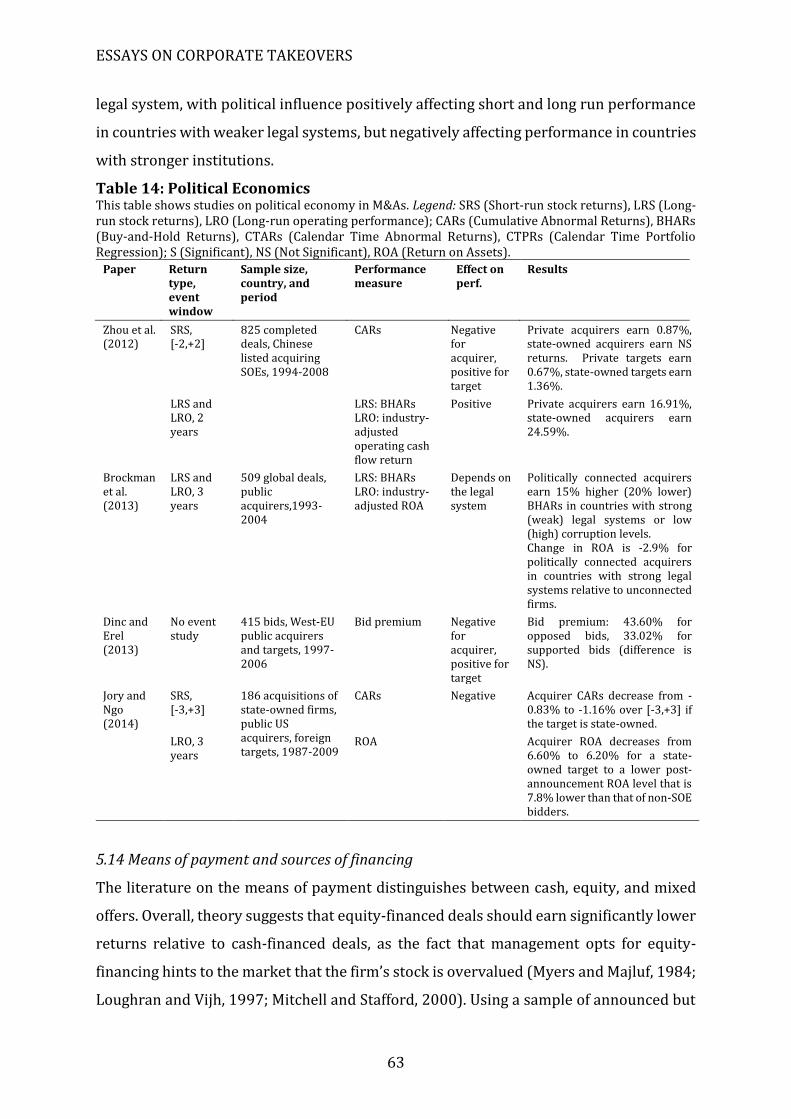
ESSAYS ON CORPORATE TAKEOVERS
63
legal system, with political influence positively affecting short and long run performance
in countries with weaker legal systems, but negatively affecting performance in countries
with stronger institutions.
Table 14: Political Economics This table shows studies on political economy in M&As. Legend: SRS (Short-run stock returns), LRS (Long-run stock returns), LRO (Long-run operating performance); CARs (Cumulative Abnormal Returns), BHARs (Buy-and-Hold Returns), CTARs (Calendar Time Abnormal Returns), CTPRs (Calendar Time Portfolio Regression); S (Significant), NS (Not Significant), ROA (Return on Assets).
Paper Return type, event window
Sample size, country, and period
Performance measure
Effect on perf.
Results
Zhou et al. (2012)
SRS, [-2,+2]
825 completed deals, Chinese listed acquiring SOEs, 1994-2008
CARs Negative for acquirer, positive for target
Private acquirers earn 0.87%, state-owned acquirers earn NS returns. Private targets earn 0.67%, state-owned targets earn 1.36%.
LRS and LRO, 2 years
LRS: BHARs LRO: industry-adjusted operating cash flow return
Positive Private acquirers earn 16.91%, state-owned acquirers earn 24.59%.
Brockman et al. (2013)
LRS and LRO, 3 years
509 global deals, public acquirers,1993-2004
LRS: BHARs LRO: industry-adjusted ROA
Depends on the legal system
Politically connected acquirers earn 15% higher (20% lower) BHARs in countries with strong (weak) legal systems or low (high) corruption levels. Change in ROA is -2.9% for politically connected acquirers in countries with strong legal systems relative to unconnected firms.
Dinc and Erel (2013)
No event study
415 bids, West-EU public acquirers and targets, 1997-2006
Bid premium Negative for acquirer, positive for target
Bid premium: 43.60% for opposed bids, 33.02% for supported bids (difference is NS).
Jory and Ngo (2014)
SRS, [-3,+3]
186 acquisitions of state-owned firms, public US acquirers, foreign targets, 1987-2009
CARs Negative Acquirer CARs decrease from -0.83% to -1.16% over [-3,+3] if the target is state-owned.
LRO, 3 years
ROA Acquirer ROA decreases from 6.60% to 6.20% for a state-owned target to a lower post-announcement ROA level that is 7.8% lower than that of non-SOE bidders.
5.14 Means of payment and sources of financing
The literature on the means of payment distinguishes between cash, equity, and mixed
offers. Overall, theory suggests that equity-financed deals should earn significantly lower
returns relative to cash-financed deals, as the fact that management opts for equity-
financing hints to the market that the firm’s stock is overvalued (Myers and Majluf, 1984;
Loughran and Vijh, 1997; Mitchell and Stafford, 2000). Using a sample of announced but
1. WHAT GOES WRONG IN M&AS?
64
later withdrawn stock-financed deals, Savor and Lu (2009) show that stock-financed
deals are not necessarily bad for shareholders, as bidders’ long-term shareholders are
still better off in a stock deal than they would have been if the firm did not pursue the deal
at all. Martynova, Oosting and Renneboog (2007) report that the excess long term
operating performance (relative to a matched sample of peer companies) increased by
1% measured over three years after the announcement and relative to the pre-
announcement performance for cash offers, and decreased by 1.2% and 1.9% for all-
equity and mixed offers, respectively. Still, the difference in excess operating
performance among the different type of offers is not statistically different from zero.
Then again, Fu, Lin, and Officer (2013) find evidence that overvalued acquirers using
stock as means of payment do significantly overpay for their targets and that these deals
do not create value, resulting in much lower bidder announcement returns and long-run
operating performance.
Although the means of payment (cash or equity) has been researched in depth,
little attention has been given to the sources of these funds. Deals funded by cash
resources can be based on either internally generated funds or externally generated
funds such as bank debt, bonds, other forms of debt, or equity issues. Nevertheless, the
limited amount of evidence shows consistent results. Bank or debt financing of M&As is
generally received positively in the market, most likely because of the monitoring effect
of banks and the disciplining effect of debt. Bharadwaj and Shivdasani (2003) suggest
that bank debt signals certification of the transaction and monitoring of the acquiring
firm, because they find that deals financed entirely by banks achieve highly positive
announcement returns, especially when acquirers are performing poorly or are subject
to information asymmetries. Martynova and Renneboog (2009) show that the decision
on the offered means of payment (cash vs equity) does not coincide with the decision on
how to finance the transaction, with the type of offer depending on how the transaction
can be funded. They disentangle the decision on what to offer the target and how to fund
the transaction: they distinguish between deals financed with internal funds, debt issues,
equity issues, or combinations of equity and debt, and demonstrate that acquisitions
financed partly or fully with equity perform worse than cash- or debt-financed deals.
Internally-funded deals however underperform debt-financed deals, which they believe
may be due to managerial empire-building motives in cash-rich firms. The majority of
large cash-financed deals are financed using newly issued debt, as internal funds often do
ESSAYS ON CORPORATE TAKEOVERS
65
not suffice, and such debt-financed deals outperform other sources of funding in terms of
short-run returns. This finding indicates the importance of debt as a bonding mechanism
which curbs management’s discretion of cash flows. Building on these findings, the
literature on acquirer leverage ratios unsurprisingly concludes that overleveraged
(relative to the firm’s target leverage ratio) acquiring firms are unlikely to take on more
debt in order to pay (a part of) the acquisition with cash (Harford et al., 2009; Uysal,
2011). These deals by overleveraged firms are thus more likely to be financed with
equity, resulting in lower returns. Overall, the evidence indicates that bank and other debt
financing embeds a monitoring and disciplining mechanism which positively affects
short-run merger returns and that the negative effect of equity financing arises from
overvalued stock or overleveraged acquirers. Although there is evidence that cash-
financed deals outperform equity-financed deals in the long run, long-run evidence on
the source of financing is scarce.
Table 15: Method of Payment and Source of Financing This table shows studies on the source of financing. Legend: SRS (Short-run stock returns), LRS (Long-run stock returns), LRO (Long-run operating performance); CARs (Cumulative Abnormal Returns), BHARs (Buy-and-Hold Returns), CTARs (Calendar Time Abnormal Returns), CTPRs (Calendar Time Portfolio Regression Returns); S (Significant), NS (Not Significant), ROA (Return on Assets).
Paper Return type, event window
Sample size, country, and period
Perf. measure
Effect on perf.
Results
Bharadwaj and Shivdasani (2003)
SR, [-1,0] and [-1,+1]
115 cash tender offers, public US acquirers and targets, 1990-1996
CARs Positive for bank/debt
Acquirer CARs are 2.08% over [-1,0] or 4% over [-1,+1] for bank-financed deals. -0.32% over [-1,0] for internally-financed deals, NS for [-1,+1].
Martynova et al. (2007)
LRO , 3 years
858 intra-European deals 1997-2001
(EBITDA - ∆WC)/ BVassets,
NS
Martynova and Renneboog (2009)
SR, [+2,+60]
1,361 acquisitions, public European acquirers European targets, 1993-2001
CARs Positive for bank/debt, negative for equity
Acquirer CAR are -3.4%, for equity-financed deals, -3.9% for mixed debt-and-equity financed deals, 3% for debt-financed deals, -0.1% for cash-financed (internally funded) deals.
Savor and Lu (2009)
LRS, 3 years
1,773 deals, US public acquirers, 1978-2003
BHARs and CTPR
Positive if equity-financed
Acquirer BHARs (CTPR) are 20.7% (14.2%) higher for completed equity-financed deals relative to withdrawn deals.
Uysal (2011) SR, [-1,+1]
7,814 completed deals, US public acquirers and US targets, 1990-2007
CARs Positive Acquirer CARs are 2.3% if acquirer is overleveraged, 1.7% if moderately leveraged.
LRS, 5 years
CTPR NS
Fu et al. (2013)
SR, [-42, compl.]
2,062 completed deals, US public targets and acquirers, 1985-2006
CARs Negative Acquirer CARs are -17.45% if overvalued acquirer & stock-financed, NS if not overvalued or cash-financed
LRO, 5 years
Ind.-adj. ROA
Acquirer ROA is -0.93 if overvalued acquirer & stock-financed, NS if not overvalued, 1.37 if cash-financed
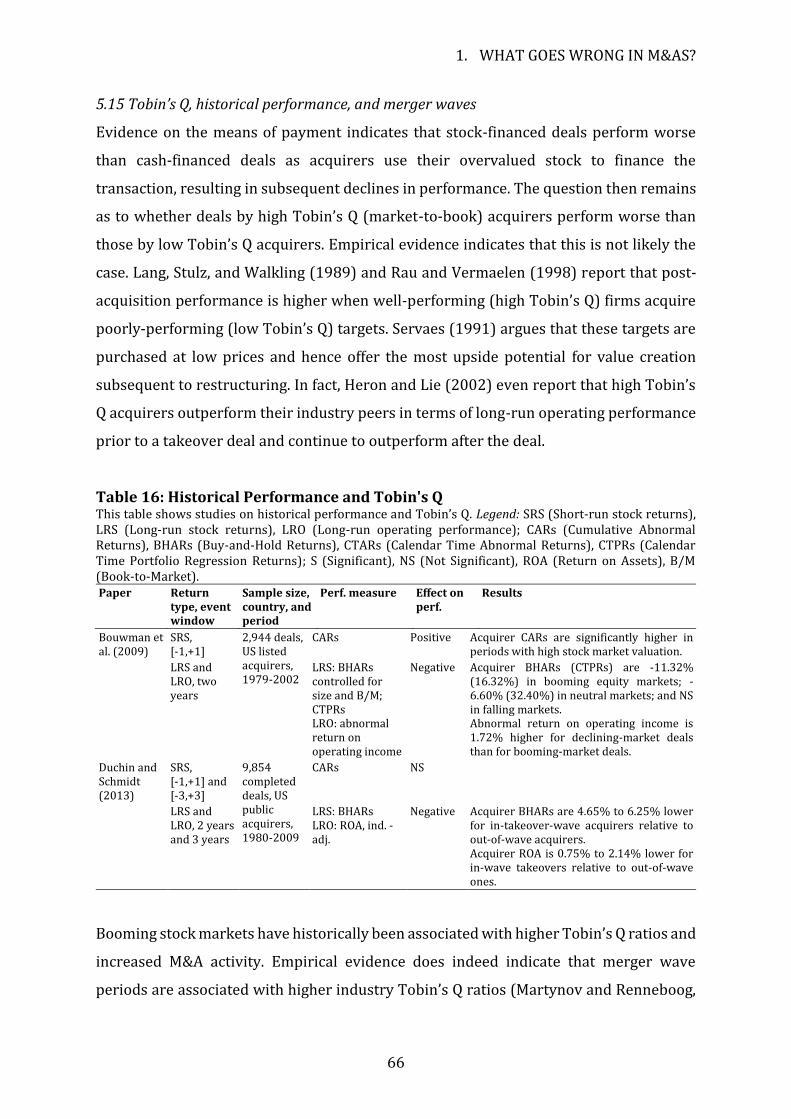
1. WHAT GOES WRONG IN M&AS?
66
5.15 Tobin’s Q, historical performance, and merger waves
Evidence on the means of payment indicates that stock-financed deals perform worse
than cash-financed deals as acquirers use their overvalued stock to finance the
transaction, resulting in subsequent declines in performance. The question then remains
as to whether deals by high Tobin’s Q (market-to-book) acquirers perform worse than
those by low Tobin’s Q acquirers. Empirical evidence indicates that this is not likely the
case. Lang, Stulz, and Walkling (1989) and Rau and Vermaelen (1998) report that post-
acquisition performance is higher when well-performing (high Tobin’s Q) firms acquire
poorly-performing (low Tobin’s Q) targets. Servaes (1991) argues that these targets are
purchased at low prices and hence offer the most upside potential for value creation
subsequent to restructuring. In fact, Heron and Lie (2002) even report that high Tobin’s
Q acquirers outperform their industry peers in terms of long-run operating performance
prior to a takeover deal and continue to outperform after the deal.
Table 16: Historical Performance and Tobin's Q This table shows studies on historical performance and Tobin’s Q. Legend: SRS (Short-run stock returns), LRS (Long-run stock returns), LRO (Long-run operating performance); CARs (Cumulative Abnormal Returns), BHARs (Buy-and-Hold Returns), CTARs (Calendar Time Abnormal Returns), CTPRs (Calendar Time Portfolio Regression Returns); S (Significant), NS (Not Significant), ROA (Return on Assets), B/M (Book-to-Market). Paper Return
type, event window
Sample size, country, and period
Perf. measure Effect on perf.
Results
Bouwman et al. (2009)
SRS, [-1,+1]
2,944 deals, US listed acquirers, 1979-2002
CARs Positive Acquirer CARs are significantly higher in periods with high stock market valuation.
LRS and LRO, two years
LRS: BHARs controlled for size and B/M; CTPRs LRO: abnormal return on operating income
Negative Acquirer BHARs (CTPRs) are -11.32% (16.32%) in booming equity markets; -6.60% (32.40%) in neutral markets; and NS in falling markets. Abnormal return on operating income is 1.72% higher for declining-market deals than for booming-market deals.
Duchin and Schmidt (2013)
SRS, [-1,+1] and [-3,+3]
9,854 completed deals, US public acquirers, 1980-2009
CARs NS
LRS and LRO, 2 years and 3 years
LRS: BHARs LRO: ROA, ind. -adj.
Negative Acquirer BHARs are 4.65% to 6.25% lower for in-takeover-wave acquirers relative to out-of-wave acquirers. Acquirer ROA is 0.75% to 2.14% lower for in-wave takeovers relative to out-of-wave ones.
Booming stock markets have historically been associated with higher Tobin’s Q ratios and
increased M&A activity. Empirical evidence does indeed indicate that merger wave
periods are associated with higher industry Tobin’s Q ratios (Martynov and Renneboog,
ESSAYS ON CORPORATE TAKEOVERS
67
2011a; Duchin and Schmidt, 2013; Harford, 2005) and higher short-run announcement
returns. However, long-run evidence in Bouwman, Fuller, and Nain (2009) indicates that
deals during such high-valuation markets earn lower long-term stock returns and lower
operating performance. They find that this type of underperformance occurs mainly in
firms who acquire other firms in the final stages of a merger wave and relate this to the
managerial herding hypothesis in that late acquirers ignore their own private signals
about the profitability of a merger and base their decisions on the actions of their
predecessors. Duchin and Schmidt (2013) confirm that end-of-wave mergers perform
worse in terms of long-term stock and operating performance and find that end-of-wave
mergers are undertaken by firms with poor corporate governance (lower managerial
equity-based compensation, low CEO ownership, and lack of block ownership).
5.16 Other dimensions
5.16.1 Cross-holdings
As the returns to acquiring firm shareholders tend to be negative or zero on average,
Matvos and Ostrovsky (2008) question why shareholders do not oppose these mergers
and hence avoid transactions not generating any value. They reveal that institutional
shareholders often hold large stakes in both the bidder and target firm, such that the
losses from the acquirers’ announcement returns are offset with the gains from the
targets’. Harford, Jenter, and Li (2011), in contrast, argue against this by showing that the
stakes of cross-owners in target firms are not sufficiently large to compensate losses in
the acquiring firms and that the lack of shareholder opposition to value-destroying
mergers remains a puzzle.
5.16.2 Target acquisitiveness
Phalippou et al. (2014) consider the target’s acquisitiveness in a sample of public US
acquiring and target firms, defining acquisitiveness based on the number of acquisitions
a target has made over the previous three years. They find that the acquirer’s
announcement returns are significantly lower for deals involving more acquisitive
targets relative to non-acquisitive target firms and that these effects are responsible for
half of the overall negative announcement returns. They argue that acquirers’ motivation
to engage in such value-destroying acquisitions often is of a defensive nature: acquirers
1. WHAT GOES WRONG IN M&AS?
68
acquire in order to not be acquired themselves. However, they find no significant
relationship for long-term stock returns.
5.16.3 Corporate social responsibility (CSR)
When a firm engages in a takeover, its existing relations with its stakeholders such as
employees, suppliers, or customers are often under pressure. Deng et al. (2013) argue
that by investing in CSR, the firm can incentivize stakeholders to contribute more
resources and effort to its operations, as CSR investment is associated with a stronger
reputation for remaining committed to implicit contracts such as job security promises
or customer service continuation. Consequently, they find that acquirer shareholders
benefit from mergers completed by firms investing more in CSR relative to low CSR
acquirers, as the former earn higher long-run stock returns and have higher profitability.
Aktas, de Bodt, and Cousin (2011) find that indirect investment in CSR is also rewarded
by the market, as announcement returns are higher for firms acquiring targets with high
levels of CSR.
5.16.4 Anti-takeover provisions
As firms that make value-destroying acquisitions are more likely to become a target in an
M&A deal themselves (Mitchell and Lehn, 1990), the takeover market can act as a
disciplinary mechanism to deter potential empire-building managers from reducing
shareholder value through bad acquisitions. However, anti-takeover provisions (ATPs)
in large firms can restrict the efficient functioning of the market for corporate control by
hindering or considerably delaying the acquisition process. This increases the costs of
acquiring the firm and makes it less vulnerable to potential management-disciplining
takeover bids. In other words, ATPs increase the scope for managerial entrenchment,
which can lead to corporate decisions that are detrimental to shareholders as there is no
serious threat to the management of losing de facto control over the corporation. There
is strong evidence that a higher degree of entrenchment is related to lower returns and
lower firm value (Franks, Mayer, and Renneboog, 2001; Gompers, Ishii, and Metrick,
2003; Bebchuk et al., 2009; Bebchuk and Cohen, 2005; Cremers and Nair, 2005).19 While
19 These studies are not further discussed here as they mainly look at the effects of the level of or change in takeover provisions on firm performance, not considering returns surrounding takeover deals or post-merger deal performance.
ESSAYS ON CORPORATE TAKEOVERS
69
these studies look at the effect of entrenchment (including ATPs) on overall firm
performance, several other studies relate ATPs to M&A returns. Masulis et al. (2007)
report that acquiring firms with more ATPs have lower announcement returns, even
when controlling for product market competition, leverage, CEO equity-based
compensation, institutional ownership, and board composition. Harford et al. (2008)
confirm this finding and add that managers of firms with strong ATPs and excess cash
(who may be most prone to empire building) have very high capital expenditures and
spend their cash on poor acquisitions. Harford, Humphery-Jenner, and Powell (2012)
investigate the sources of value-destruction in deals by entrenched managers. They find
that entrenched managers avoid making all-equity offers to public firms when a large
blockholder is present in the target firm and to private firms even when such deals are
value-creating, because such transactions would erode their control position (and reduce
the degree of entrenchment). In addition, entrenched managers overpay and tend to
choose targets with lower synergies, all resulting in lower short-run announcement
return and post-merger operating performance. Humphery-Jenner and Powell (2011)
take an alternative approach: they examine a sample of large acquiring firms in Australia,
where ATPs are prohibited. They find that these large acquirers earn positive abnormal
announcement returns and that post-takeover operating performance increases with
acquirer size. As studies based on similar samples of large US firms on average have
negative announcement returns and long-term operating performance, they conclude
that the absence of ATPs can promote value-enhancing takeover deals. In sum, these
studies indicate that antitakeover provisions in large firms restrict the disciplining
mechanism of the takeover market, resulting in more value-destroying acquisitions,
lower overall firm value, and lower merger announcement returns. The absence of these
provisions then increases both announcement returns and long-run operating
performance.
5.16.5 Takeover Strategy (Toeholds)
A large literature on toeholds shows that bidder announcement returns are on average
higher (or less negative) if the bidder owns a toehold in the target prior to making a
takeover offer. Toeholds reduce the target’s bargaining power as any increase in the
target’s share price will also partly accrue to the bidder with a toehold, enabling this
bidder to purchase control in the target more cheaply (at a lower premium). Betton,
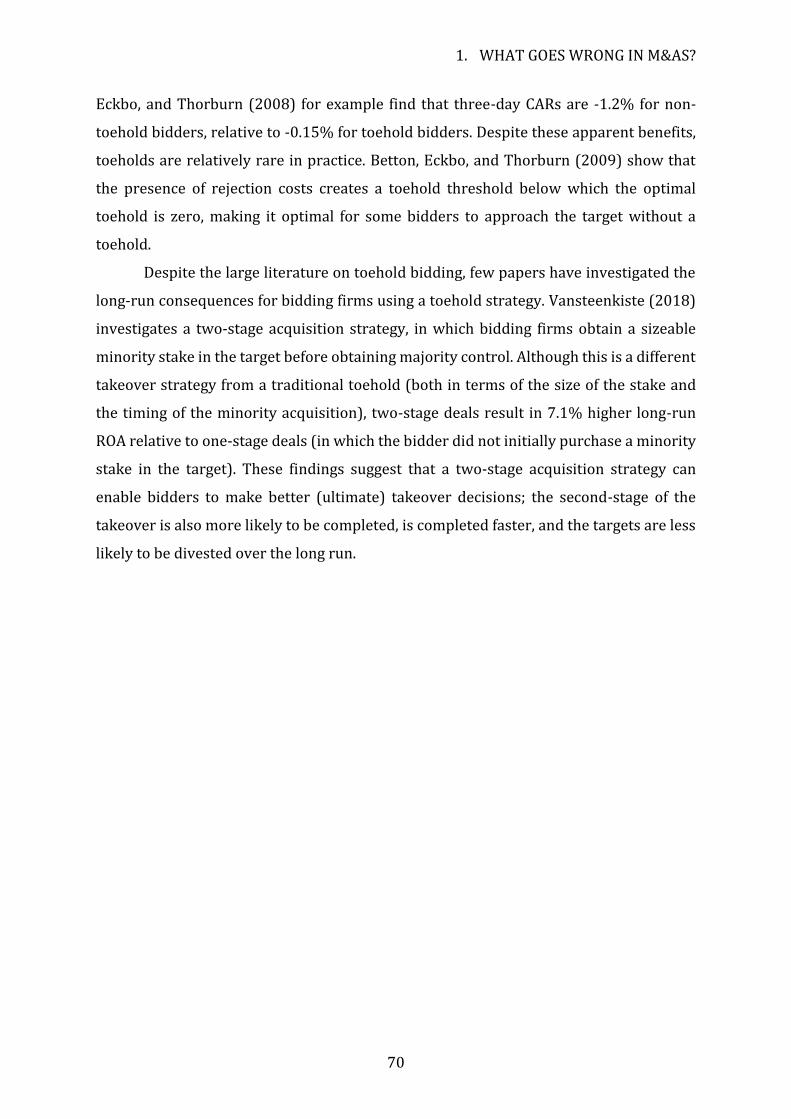
1. WHAT GOES WRONG IN M&AS?
70
Eckbo, and Thorburn (2008) for example find that three-day CARs are -1.2% for non-
toehold bidders, relative to -0.15% for toehold bidders. Despite these apparent benefits,
toeholds are relatively rare in practice. Betton, Eckbo, and Thorburn (2009) show that
the presence of rejection costs creates a toehold threshold below which the optimal
toehold is zero, making it optimal for some bidders to approach the target without a
toehold.
Despite the large literature on toehold bidding, few papers have investigated the
long-run consequences for bidding firms using a toehold strategy. Vansteenkiste (2018)
investigates a two-stage acquisition strategy, in which bidding firms obtain a sizeable
minority stake in the target before obtaining majority control. Although this is a different
takeover strategy from a traditional toehold (both in terms of the size of the stake and
the timing of the minority acquisition), two-stage deals result in 7.1% higher long-run
ROA relative to one-stage deals (in which the bidder did not initially purchase a minority
stake in the target). These findings suggest that a two-stage acquisition strategy can
enable bidders to make better (ultimate) takeover decisions; the second-stage of the
takeover is also more likely to be completed, is completed faster, and the targets are less
likely to be divested over the long run.
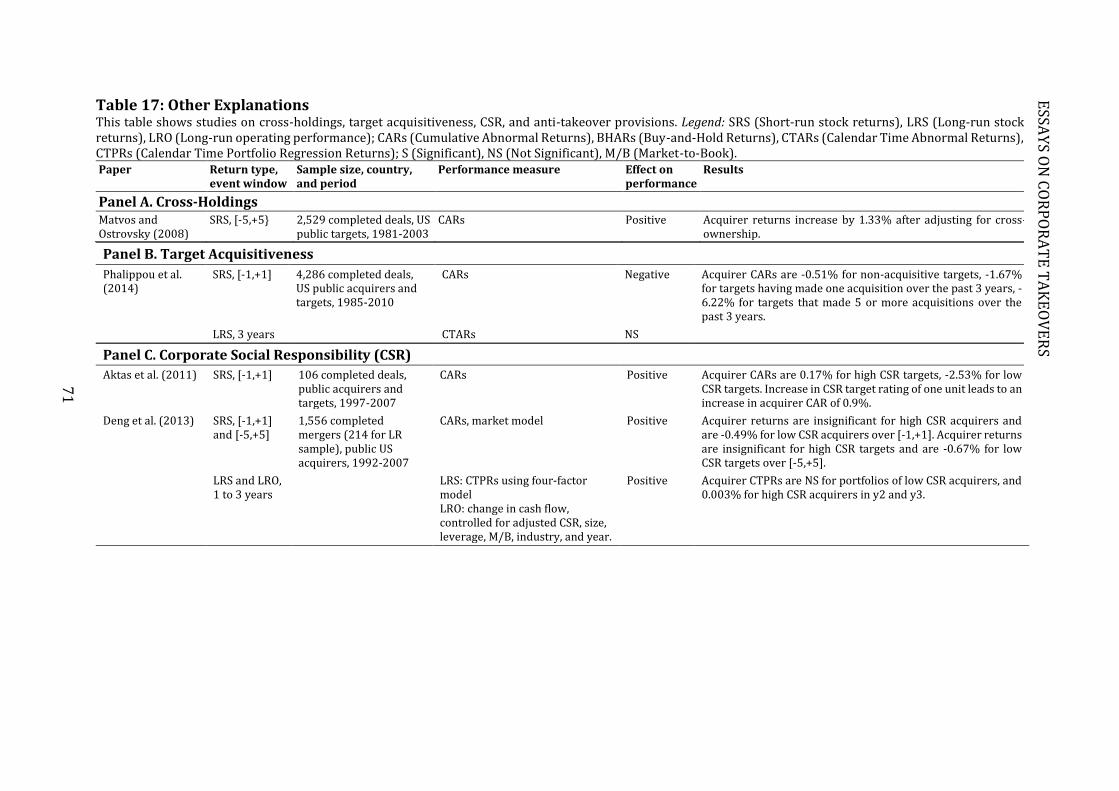
Table 17: Other Explanations This table shows studies on cross-holdings, target acquisitiveness, CSR, and anti-takeover provisions. Legend: SRS (Short-run stock returns), LRS (Long-run stock returns), LRO (Long-run operating performance); CARs (Cumulative Abnormal Returns), BHARs (Buy-and-Hold Returns), CTARs (Calendar Time Abnormal Returns), CTPRs (Calendar Time Portfolio Regression Returns); S (Significant), NS (Not Significant), M/B (Market-to-Book). Paper Return type,
event window Sample size, country, and period
Performance measure Effect on performance
Results
Panel A. Cross-Holdings
Matvos and Ostrovsky (2008)
SRS, [-5,+5} 2,529 completed deals, US public targets, 1981-2003
CARs Positive Acquirer returns increase by 1.33% after adjusting for cross-ownership.
Panel B. Target Acquisitiveness
Phalippou et al. (2014)
SRS, [-1,+1] 4,286 completed deals, US public acquirers and targets, 1985-2010
CARs Negative Acquirer CARs are -0.51% for non-acquisitive targets, -1.67% for targets having made one acquisition over the past 3 years, -6.22% for targets that made 5 or more acquisitions over the past 3 years.
LRS, 3 years CTARs NS
Panel C. Corporate Social Responsibility (CSR)
Aktas et al. (2011) SRS, [-1,+1] 106 completed deals, public acquirers and targets, 1997-2007
CARs Positive Acquirer CARs are 0.17% for high CSR targets, -2.53% for low CSR targets. Increase in CSR target rating of one unit leads to an increase in acquirer CAR of 0.9%.
Deng et al. (2013) SRS, [-1,+1] and [-5,+5]
1,556 completed mergers (214 for LR sample), public US acquirers, 1992-2007
CARs, market model Positive Acquirer returns are insignificant for high CSR acquirers and are -0.49% for low CSR acquirers over [-1,+1]. Acquirer returns are insignificant for high CSR targets and are -0.67% for low CSR targets over [-5,+5].
LRS and LRO, 1 to 3 years
LRS: CTPRs using four-factor model LRO: change in cash flow, controlled for adjusted CSR, size, leverage, M/B, industry, and year.
Positive Acquirer CTPRs are NS for portfolios of low CSR acquirers, and 0.003% for high CSR acquirers in y2 and y3.
71
ESSA
YS O
N C
OR
PO
RA
TE
TA
KE
OV
ER
S
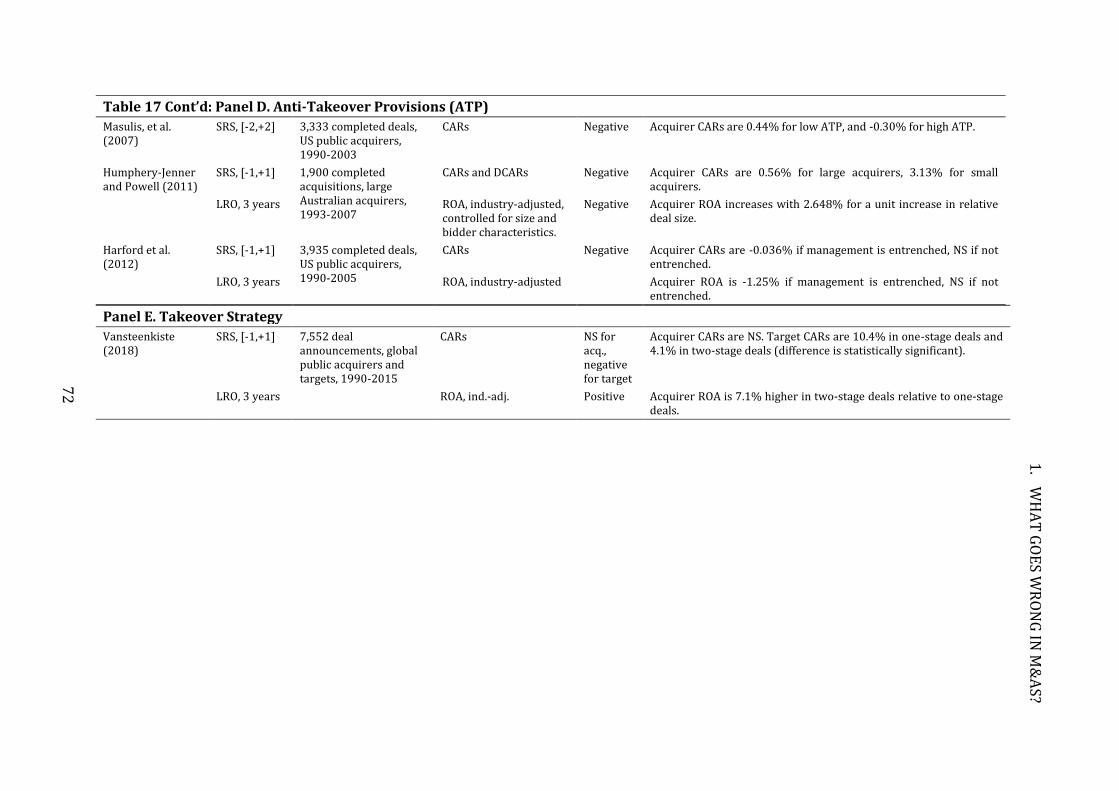
Table 17 Cont’d: Panel D. Anti-Takeover Provisions (ATP)
Masulis, et al. (2007)
SRS, [-2,+2] 3,333 completed deals, US public acquirers, 1990-2003
CARs Negative Acquirer CARs are 0.44% for low ATP, and -0.30% for high ATP.
Humphery-Jenner and Powell (2011)
SRS, [-1,+1] 1,900 completed acquisitions, large Australian acquirers, 1993-2007
CARs and DCARs Negative Acquirer CARs are 0.56% for large acquirers, 3.13% for small acquirers.
LRO, 3 years ROA, industry-adjusted, controlled for size and bidder characteristics.
Negative Acquirer ROA increases with 2.648% for a unit increase in relative deal size.
Harford et al. (2012)
SRS, [-1,+1] 3,935 completed deals, US public acquirers, 1990-2005
CARs Negative
Acquirer CARs are -0.036% if management is entrenched, NS if not entrenched.
LRO, 3 years ROA, industry-adjusted Acquirer ROA is -1.25% if management is entrenched, NS if not entrenched.
Panel E. Takeover Strategy
Vansteenkiste (2018)
SRS, [-1,+1] 7,552 deal announcements, global public acquirers and targets, 1990-2015
CARs NS for acq., negative for target
Acquirer CARs are NS. Target CARs are 10.4% in one-stage deals and 4.1% in two-stage deals (difference is statistically significant).
LRO, 3 years ROA, ind.-adj. Positive Acquirer ROA is 7.1% higher in two-stage deals relative to one-stage deals.
72
1.
WH
AT
GO
ES W
RO
NG
IN M
&A
S?
ESSAYS ON CORPORATE TAKEOVERS
73
6. Suggestions for future research
Despite the hundreds of academic studies written about M&As, the majority of the
evidence on whether these deals create value is based on the bidder’s, target’s, or
combined firm’s short-run stock market returns around the merger announcement.
Short-run announcement returns capture the market’s expectations regarding the deal’s
performance, which may however deviate from the actual long-term realizations.
Evidence based on short-run returns can thus not always be generalized to the deal’s
long-run performance. Despite this shortcoming, there is little consistent evidence
regarding the drivers of a takeover’s long-run stock and operating performance.
A reason that is often indicated to motivate the use of short-run returns is that
long-run performance measures suffer from a number of econometric issues, such as the
assumption of independently distributed observations and the choice of a correct
expected returns benchmark. However, a considerable number of studies have taken into
account these issues by introducing additional controls, adjusted standard errors,
calendar time measures, and portfolio approaches, which together significantly reduce
the likelihood of biased results.
Until recently, only the means of payment has been identified as a consistent
predictor of long-term performance. Although many papers have attempted to identify
other transaction characteristics that predict deal performance, analyses of long-run
stock and operating performance are still scarce. In fact, our study of the literature has
only indicated the acquirer’s acquisitiveness, performance- and equity-based
compensation contracts, specific board characteristics (board busyness below a certain
threshold, female directors), cross-country differences in governance standards, and
product market overlap to be relatively consistent predictors of long-run deal
performance.
We therefore propose some questions that may be addressed in future takeover
research agendas. First, although CEO overconfidence appears to be the main explanation
for serial acquirers’ declining performance, alternative explanations such as a decreasing
investment opportunity set or CEO bidding persistence could provide deeper insights
into the mechanism driving this underperformance. In addition, much of the evidence on
this topic is based on US samples and may not always be generalizable to other countries.
Second, worldwide evidence on the impact of professional connections and
networks on takeovers is mixed – even within countries - or often insignificant. This may
1. WHAT GOES WRONG IN M&AS?
74
imply that the positive – connected board members may have increased access to private
information - and negative – connections may act as substitutes for active information
collection and may proxy for managerial hubris - effects of networks on deal performance
offset each other to some extent. Future research could address the open question as to
what factors determine whether the beneficial or the detrimental effects of managers’,
directors’, and firms’ connections dominate, and in what setting.
Third, close to 50% of M&As are cross-border deals in which country- and firm-
level cultures and traditions may clash, such that resistance by employees and other
stakeholders may slow down the post-merger integration process. Evidence on culture
clashes in M&As in the finance and economics literature is scarce, despite a strong focus
on the post-merger process in the strategy and management literature. Future research
could thus use the insights from the studies in the latter fields to investigate the stock and
operating performance implications of such cross-border deal frictions.
Fourth, there is some evidence that the link between family ownership and M&A
performance varies considerably across countries, suggesting that it may depend
strongly on the legal and institutional environment. However, little to no empirical
studies show long-run evidence on merger performance by family firms, providing scope
for future research. In addition, there is also little long-run evidence on how geographic
proximity or sources of financing affect deal performance, despite consistent long-run
evidence on the means of payment.
Fifth, a number of studies find that acquirers of distressed target assets experience
significant gains in the short run, indicating that bidders benefit from purchasing
distressed targets at a discount. However, future research could focus more on the
returns to target shareholders and long-run performance. It may be interesting to further
investigate this issue in the context of post-merger restructuring and divestitures.
Finally, the literature has indicated a number of other dimensions that may
explain the on average negative long-run performance of M&As, including the effects of
institutional cross-holdings, the target’s acquisitiveness, corporate social responsibility,
and anti-takeover provisions. However, as before, there is little long-run stock or
operating performance evidence for these dimensions.
ESSAYS ON CORPORATE TAKEOVERS
75
7. Conclusion
Despite the vast amounts of money and resources spent on takeovers, many academic
studies have shown that the bidding firms’ shareholders either lose out at takeovers or
are expected to gain on average very little. Abnormal stock returns at the announcement
of the merger are on average close to zero, and long-run operating and stock performance
are often significantly negative, implying that the anticipated deal synergies are
frequently overestimated. A great number of studies have thus attempted to identify the
variables that determine the success of a takeover in terms of shareholder returns and
firm performance.
Despite the large literature on mergers and acquisitions, there have been
relatively few unambiguous and robust conclusions. Most of the M&A research has taken
a short-term view using event studies that show the short-run wealth effects capturing
the expectations of the takeovers’ success or failure. However, expectations regarding the
deal’s performance can deviate from the long-term realizations. As the firm restructures
and integrates the target firm in its own operations, the market corrects its initial short-
term predicted returns. Although long-term operating and stock performance measures
have their own drawbacks relative to short-run announcement returns, they should
capture the ultimate success of a takeover.
Whereas early evidence only indicated the deal’s means of payment (cash vs
equity) as a consistent predictor of long-term performance (with cash related to positive
and equity to negative performance), more recent papers have attempted to explain M&A
performance by looking at a wide range of firm, deal, management, board, or country
characteristics. In this paper, we compile the evidence on M&A success factors and
provide a broader answer to the question: What leads to success or failure in M&As?
Our study of the literature has identified a number of transaction characteristics
that prove to be relatively consistent predictors of long-run deal performance. First, serial
acquirers’ stock and operating performance declines deal by deal as the firm increases its
acquisitiveness. Most evidence indicates CEO overconfidence as the main driver of this
underperformance, because overconfident CEO’s overestimate their ability to select
profitable target firms and to create synergy gains. However, acquisition or operating
experience in the target’s industry can alleviate some of the negative effects.
Second, evidence on CEO performance- and equity-based compensation contracts
confirms the agency theory predictions in that such contracts deter managers from
1. WHAT GOES WRONG IN M&AS?
76
making value-destroying acquisitions through the negative effect on their own long-run
wealth, as long as the performance criteria are not directly related to firm growth through
acquisitions. Moreover, not only equity-based compensation can provide an incentive to
avoid value-destroying acquisitions, a higher likelihood of receiving fines or even being
fired also helps align managers’ and shareholders’ interests.
Third, certain characteristics of the board of directors can help managers make
better takeover decisions. The empirical evidence indicates that board members with
multiple directorships are more reputable and have better monitoring and advisory skills
through their increased access to information. This results in more value-generating
M&As and increased long-term firm performance, as long as the number of outside
directorships remains limited (and ‘board busyness’ is avoided). Moreover, target CEOs’
expertise and experience can increase deal performance, and female executives or
directors are less likely to overbid and make value-destroying acquisitions as these are
less likely to exhibit overconfident behaviour.
Fourth, cross-country differences in corporate governance standards and investor
protection can also be a source of deal synergies. For example, bidder shareholders
benefit when the bidder’s corporate governance standards are stricter (more
shareholder-oriented) than the target’s, as this facilitates the bidder’s ability to
restructure the target and shifts the focus to shareholder value creation. Such spillovers
in governance standards increase short- and long-run returns to bidder and target
shareholders across countries around the world.
Fifth, related or focused acquisitions outperform unrelated or diversifying
acquisitions both in the short run and in the long run, as acquirers in the former case are
more likely to have the skills and resources required to operate and integrate the target
firm. These findings hold regardless of whether relatedness is measured by means of
industry classifications, product market overlap, strategic compatibility,
complementariness in the supply chain, or technological overlap.
Many more dimensions have been identified in the literature as potential
determinants of deal performance and success. However, long-run evidence for these
variables is scarce, providing scope for future research. We thus also propose a future
research agenda, focusing on what factors determine a takeover’s long-run stock and
operating performance.
ESSAYS ON CORPORATE TAKEOVERS
77
References
Agrawal, A. & Jaffe, J.F., 2000. The post-merger performance puzzle. Advances in Mergers
and Acquisitions, 1(December 1999), 7–41.
Ahern, K.R., Daminelli, D. & Fracassi, C., 2012. Lost in translation? The effect of cultural
values on mergers around the world. Journal of Financial Economics, 1–25.
Ahn, S., Jiraporn, P. & Kim, Y.S., 2010. Multiple directorships and acquirer returns. Journal
of Banking and Finance, 34(9), 2011–2026.
Aktas, N., E. de Bodt, H. Bollaert, & R. Roll. 2015. CEO Narcissism and the Takeover
Process: From Private Initiation to Deal Completion. Journal of Financial and
Quantitative Analysis, forthcoming.
Aktas, N., de Bodt, E. & Cousin, J.G., 2011. Do financial markets care about SRI? Evidence
from mergers and acquisitions. Journal of Banking and Finance, 35(7), 1753–1761.
Aktas, N., de Bodt, E. & Roll, R., 2009. Learning, hubris and corporate serial acquisitions.
Journal of Corporate Finance, 15(5), 543–561.
Aktas, N., de Bodt, E. & Roll, R., 2011. Serial acquirer bidding: An empirical test of the
learning hypothesis. Journal of Corporate Finance, 17(1), 18–32.
Almeida, H., Campello, M. & Hackbarth, D., 2011. Liquidity mergers. Journal of Financial
Economics, 102(3), 526–558.
Andrade, G., Mitchell, M. & Stafford, E., 2001. New Evidence and Perspectives on Mergers.
Journal of Economic Perspectives, 15(2), 103–120.
Ang, J. & Mauck, N., 2011. Fire sale acquisitions: Myth vs. reality. Journal of Banking &
Finance, 35(3), 532–543.
Antoniou, A., Petmezas, D. & Zhao, H., 2007. Bidder gains and losses of firms involved in
many acquisitions. Journal of Business Finance and Accounting, 34(7-8), 1221–1244.
Amihud, Y. & Lev, B. 1981. Risk Reduction as a Managerial Motive for Conglomerate
Mergers. The Bell Journal of Economics, 12(2), 605-617.
Aras, G. & D. Crowther. 2010. Ahold’s Corporate Governance Structures, in A Handbook of
Corporate Governance and Social Responsibility, Gower Applied Business Research,
596-601.
Asquith, P., 1983. Merger bids, uncertainty, and stockholder returns. Journal of Financial
Economics. 11, 51–83.
1. WHAT GOES WRONG IN M&AS?
78
Aybar, B. & Ficici, A., 2009. Cross-border acquisitions and firm value: An analysis of
emerging-market multinationals. Journal of International Business Studies, 40(8),
1317–1338.
Barkema, H.G., & Schijven, M. 2008. How Do Firms Learn to Make Acquisitions? A Review
of Past Research and an Agenda for the Future. Journal of Management. 34(3), 594-
634.
Basu, N., Dimitrova, L. & Paeglis, I., 2009. Family control and dilution in mergers. Journal of
Banking and Finance, 33(5), 829–841.
Bauer, F. & Matzler, K. 2013. Antecedents of M&A success: The role of strategic
complementarity, cultural fit, and degree and speed of integration. Strategic
Management Journal 35(2), 269-291.
Bauguess, S. & Stegemoller, M., 2008. Protective governance choices and the value of
acquisition activity. Journal of Corporate Finance, 14(5), 550–566.
Bebchuk, L. & A. Cohen. 2005. Cost of Entrenched Boards. Journal of Financial
Economics.78, 409-433.
Bebchuk, L., A. Cohen, & A. Ferrell, 2009.What Matters in Corporate Governance? The
Review of Financial Studies, 22 (2), 783-827.
Bena, J. & Li, K., 2010. Corporate Innovations and Mergers and Acquisitions. Advances in
Mergers and Acquisitions, 3(5), 193–219.
Ben-Amar, W. & André, P., 2006. Separation of ownership from control and acquiring firm
performance: The case of family ownership in Canada. Journal of Business Finance
and Accounting, 33(3-4), 517–543.
Berger, P.G. & Ofek, E., 1996. Bustup Takeovers of Value-Destroying Diversified Firms.
Journal of Finance, 51(4), 1175–1200.
Bessembinder, H. & Zhang, F., 2013. Firm characteristics and long-run stock returns after
corporate events. Journal of Financial Economics, 109(1), 83–102.
Betton, S., Eckbo, B.E. & Thorburn, K.S., 2008. Corporate Takeovers. Handbook of Empirical
Corporate Finance SET, 1, 291–429.
Betton, S., Eckbo, B.E. & Thorburn, K.S. 2009. Merger Negotiations and the Toehold Puzzle.
Journal of Financial Economics, 91(2), 158-178.
Bharadwaj, A. & Shivdasani, A., 2003, Valuation Effects of Bank Financing in Acquisitions.
Journal of Financial Economics 67(1), 113-148.
ESSAYS ON CORPORATE TAKEOVERS
79
Billett, M.T. & Qian, Y., 2008. Are Overconfident CEOs Born or Made? Evidence of Self-
Attribution Bias from Frequent Acquirers. Management Science, 54(6), 1037–1051.
Bouwman, C.H.S., Fuller, K. & Nain, A.S., 2009. Market Valuation and Acquisition Quality:
Empirical Evidence. The Review of Financial Studies, 22(2), 633–679.
Bradley, M.H., Sundaram, A.K., 2004. Do acquisitions drive performance or does
performance drive acquisitions? SSRN Working Paper.
Brav, A., 2000. Inference in Long-Horizon Event Studies: A Bayesian Approach with
Application to Initial Public Offerings. Journal of Finance, 55(5), 1979–2016.
Bris, A. & Cabolis, C., 2008. The value of investor protection: Firm evidence from cross-
border mergers. Review of Financial Studies, 21(2), 605–648.
Brockman, P., Rui, O.M., & H. Zou. 2013. Institutions and the performance of politically
connected M&As. Journal of International Business Studies 44, 833-852.
Brown, W. O., and M. T. Maloney, 1999. Exit, voice, and the role of corporate directors:
Evidence from acquisition performance, Working Paper, Claremont McKenna
College.
Buono, A.F., Bowditch, J.L., & Lewis, J.W. 1985. When cultures collide: The anatomy of a
merger. Human Relations 38(5), 477-500.
Cai, Y. & Sevilir, M., 2012. Board connections and M&A transactions. Journal of Financial
Economics, 103(2), 327–349.
Caprio, L., Croci, E. & Del Giudice, A., 2011. Ownership structure, family control, and
acquisition decisions. Journal of Corporate Finance, 17(5), 1636–1657.
Capron, L. & Guillén, M., 2009. National corporate governance institutions and post-
acquisition target reorganization. Strategic Management Journal, 30(8), 803–833.
Chakrabarti, R., Gupta-Mukherjee, S. & Jayaraman, N., 2008. Mars–Venus marriages:
Culture and cross-border M&A. Journal of International Business Studies, 40(2),
216–236.
Chang, S., 1998. Takeovers of privately held targets, methods of payment, and bidder
returns. Journal of Finance. 53, 773–784.
Chatterjee, S., Lubatkin, M. H., Schweiger, D. M. & Weber, Y. 1992. Cultural differences and
shareholder value in related mergers: Linking equity and human capital. Strategic
Management Journal. 13, 319–334.
Chen, X., Harford, J. & Li, K., 2007. Monitoring: Which institutions matter? Journal of
Financial Economics, 86(2), 279–305.
1. WHAT GOES WRONG IN M&AS?
80
Chikh, S. & Filbien, J.Y., 2011. Acquisitions and CEO power: Evidence from French
networks. Journal of Corporate Finance, 17(5), 1221–1236.
Clark, K. & Ofek, E., 1994. Mergers as a means of restructuring distressed firms: an
empirical investigation. Journal of Financial Quantitative Analysis. 29 (4), 541–565.
Conn, R.L., A. Cosh, P. M. Guest, & A. Hughes, 2005. The impact on UK acquirers of
domestic, cross-border, public and private acquisitions. Journal of Business Finance
and Accounting, 32(5-6), 815–870.
Cosh, A.D., Guest, P.M., 2001. The long run performance of hostile takeovers: UK evidence,
Centre for Business Research Working Paper 215.
Cremers, K.J.M. & V.B. Nair. 2005. Governance Mechanisms and Equity Prices, Journal of
Finance, 60, 2859-2894.
Croci, E., 2007. Corporate raiders, performance, and governance in Europe. European
Financial Management. 13 (5), 949–978.
Croson, R. & Gneezy, U., 2009. Gender Differences in Preferences. Journal of Economic
Literature, 47(2), 448–474.
Custódio, C. & Metzger, D., 2013. How Do CEOs Matter ? The Effect of Industry Expertise on
Acquisition Returns. The Review of Financial Studies, 26(8), 2007–2047.
Datta, S., Iskandar-datta, M.A.I. & Raman, K., 2001. Executive Compensation and Corporate
Acquisition Decisions. Journal of Finance. 56(6). 2299-2336
Deng, X., Kang, J. & Low, B.S., 2013. Corporate social responsibility and stakeholder value
maximization: Evidence from mergers. Journal of Financial Economics, 110(1), 87–
109.
Dessaint, O., Golubov, A., & Volpin, P. 2017. Employment protection and takeovers, Journal
of Financial Economics, forthcoming.
Dhaliwal, D.S., Lamoreaux, P.T. & Neyland, J.B., 2015. Shared Auditors in Mergers and
Acquisitions, Journal of Accounting and Economics, Forthcoming.
Dikova, D. & Rao Sahib, P., 2013. Is cultural distance a bane or a boon for cross-border
acquisition performance? Journal of World Business, 48(1), 77–86.
Dixon, H. 2003. “Ahold Isn't First Corporate Fiasco To Take Place in the Netherlands,” Wall
Street Journal, 28 February.
http://www.wsj.com/articles/SB1046381405940639423.
Doukas, J. A. & Petmezas, D., 2007. Acquisitions, overconfident managers and self-
attribution bias. European Financial Management, 13(3), 531–577.

ESSAYS ON CORPORATE TAKEOVERS
81
Duchin, R. & Schmidt, B., 2013. Riding the merger wave: Uncertainty, reduced monitoring,
and bad acquisitions. Journal of Financial Economics, 107(1), 69–88.
Dutta, S. & Jog, V., 2009. The long-term performance of acquiring firms: A re-examination
of an anomaly. Journal of Banking & Finance, 33(8), 1400–1412.
Dutta, S., MacAulay, K. & Saadi, S., 2011. CEO power, M&A decisions, and market reactions.
Journal of Multinational Financial Management, 21(5), 257–278.
Eckbo, B.E., 1983. Horizontal mergers, collusion, and stockholder wealth. Journal of
Financial Economics. 11(1–4), 241–274.
Eckbo, B.S. & Langohr, H. 1989. Information disclosure, method of payment, and takeover
premiums: Public and private tender offers in France. Journal of Financial
Economics. 24(2), 363-403.
Erel, I., Jang, Y. & Weisbach, M.S.,2015. Do Acquisitions Relieve Target Firms’ Financial
Constraints? Journal of Finance. 70(1), 289-328.
Fama, E.F., 1970. Efficient Capital Markets: A Review of Theory and Empirical Work.
Journal of Finance. 25(2), 383-417.
Fama, E.F., 1998. Market efficiency, long-term returns, and behavioral finance. Journal of
Financial Economics. 49(3). 283–306.
Fan, J.P.H. & Goyal, V.K., 2006. On the Patterns and Wealth Effects of Vertical Mergers On
the Patterns and Wealth Effects of Vertical Mergers. Journal of Business, 79(2), 877–
902.
Feito-Ruiz, I. and L. Renneboog, 2017, Takeovers and (Excess) CEO Compensation, Journal
of International Financial Markets, Institutions & Money 50, 156-181.
Ferris, S.P., Jagannathan, M. & Pritchard, a. C., 2003. Too Busy to Mind the Business?
Monitoring by Directors with Multiple Board Appointments. Journal of Finance,
58(3), 1087–1111.
Field, L.C., & Mkrtchyan, A. 2017. The effect of director experience on acquisition
performance, Journal of Financial Economics 123(3), 488-511.
Fiordelisi, F. & Ricci, O., 2013. Corporate culture and CEO turnover. Journal of Corporate
Finance, 28, 66–82.
Franks, J., Harris, R., & Titman, S., 1991. The postmerger share-price performance of
acquiring firms. Journal of Financial Economics. 29, 81–96.
Franks, J., & Mayer, C., 1996. Hostile takeovers and the correction of managerial failure.
Journal of Financial Economics. 40, 163–181.
1. WHAT GOES WRONG IN M&AS?
82
Franks, J., C. Mayer, & L. Renneboog, 2001, Who Disciplines the Management of Poorly
Performing Companies?, Journal of Financial Intermediation 10, 209-248.
Frijns, B., A. Gilbert, T. Lehnert, & A. Tourani-Rad, 2013. Uncertainty avoidance, risk
tolerance and corporate takeover decisions. Journal of Banking and Finance, 37(7),
2457–2471.
Fu, F., Lin, L. & Officer, M.S., 2013. Acquisitions driven by stock overvaluation: Are they
good deals? Journal of Financial Economics. 109(1), 24-39.
Fuller, K., Netter, J. & Stegemoller, M., 2002. What Do Returns to Acquiring Firms Tell Us ?
Evidence from Firms That Make Many Acquisitions. Journal of Finance, 57(4), 1763-
1793.
Gaspar, J.M., Massa, M. & Matos, P., 2005. Shareholder investment horizons and the market
for corporate control. Journal of Financial Economics, 76(1), 135–165.
Goergen, M., M. Martynova, and L. Renneboog, 2005, Corporate Governance Convergence:
Evidence from Takeover Regulation Reforms in Europe, Oxford Review of Economic
Policy 21 (2), 243-68.
Ghosh, A. 2004. Increasing Market Share as a Rationale for Corporate Acquisitions. Journal
of Business Finance & Accounting, 31(1-2), 209–247.
Di Giovanni, J., 2005. What drives capital flows? The case of cross-border M&A activity and
financial deepening. Journal of International Economics, 65(1), 127–149.
Gomes, E., Angwin, D.N., Weber, Y. & Tarba S.Y. 2013. Critical Success Factors through the
Mergers and Acquisitions Process: Revealing Pre-and Post-M&A Connections for
Improved Performance. Thunderbird International Business Review. 55 (1), 13-35
Gompers P., J. Ishii & A. Metrick, 2003. Corporate Governance And Equity Prices, The
Quarterly Journal of Economics, 118 (1), 107-155.
Graham, J.R., Harvey, C.R. & Puri, M., 2013. Managerial attitudes and corporate actions.
Journal of Financial Economics, 109(1), 103–121.
Gregory, A. & McCorriston, S., 2005. Foreign acquisitions by UK limited companies: Short-
and long-run performance. Journal of Empirical Finance, 12(1), 99–125.
Grinstein, Y. & Hribar, P., 2004. CEO compensation and incentives: Evidence from M&A
bonuses. Journal of Financial Economics, 73(1), 119–143.
Grote, M.H., & Umber, M.P. 2007. Proximity preference in M&A transactions. SSRN Working
Paper. Available at SSRN: http://ssrn.com/abstract=1478863
ESSAYS ON CORPORATE TAKEOVERS
83
Haleblian, J., C. E. Devers, G. McNamara, M.A. Carpenter, & R.B. Davison, 2009. Taking Stock
of What We Know About Mergers and Acquisitions: A Review and Research
Agenda. Journal of Management, 35(3), 469–502.
Haleblian, J. & Finkelstein, S., 1999. The Influence of Organizational Experience on
Acquisition Performance: A Behavioral Learning Perspective. Administrative
Science Quarterly, 44(1), 29–56.
Harford, J., 2005. What Drives Merger Waves? Journal of Financial Economics. 77(3), 529-
560.
Harford, J., Humphery-Jenner, M. & Powell, R., 2012. The sources of value destruction in
acquisitions by entrenched managers. Journal of Financial Economics, 106(2), 247–
261.
Harford, J., Jenter, D. & Li, K., 2011. Institutional cross-holdings and their effect on
acquisition decisions. Journal of Financial Economics, 99(1), 27–39.
Harford, J., Klasa, S. & Walcott, N., 2009. Do firms have leverage targets? Evidence from
acquisitions. Journal of Financial Economics, 93(1), 1–14.
Harford, J. & Li, K., 2007. Decoupling CEO wealth and firm performance: The case of
acquiring CEOs. Journal of Finance, 62(2), 917–949.
Harford, J., Mansi, S. A. & Maxwell, W.F., 2008. Corporate governance and firm cash
holdings in the US. Journal of Financial Economics, 87(3), 535–555.
Hayward, M. & Hambrick, D., 1997. Explaining the premiums paid for large acquisitions:
Evidence of CEO hubris. Administrative Science Quarterly, 42(1), 103–127.
Healy, P.M., Palepu, K.G. & Ruback, R.S., 1992. Does corporate performance improve after
mergers? Journal of Financial Economics, 31(2), 135–175.
Heron, R. & Lie, E. 2002. Operating Performance and the Method of Payment in Takeovers.
Journal of Financial and Quantitative Analysis. 37(1), 137-155.
Hietala, P., Kaplan, S., & Robinson, D., 2003. What is the price of hubris: using takeover
battles to infer overpayments and synergy. Financial Management 32(3), 5-31.
Hilscher, J. & Şişli-Ciamarra, E., 2013. Conflicts of interest on corporate boards: The effect
of creditor-directors on acquisitions. Journal of Corporate Finance, 19(1), 140–158.
Hoberg, G. & Phillips, G., 2010. Product market synergies and competition in mergers and
acquisitions: A text-based analysis. Review of Financial Studies, 23(10), 3773–3811.
1. WHAT GOES WRONG IN M&AS?
84
Hotchkiss, E.S., Mooradian, R.M. & Thorburn, K.S., 2008. Bankruptcy and the Resolution of
Financial Distress, in Handbook of Corporate Finance: Empirical Corporate Finance,
Volume 2, Ed: B. Espen Eckbo, The Netherlands, Elsevier.
Huang, J. & Kisgen, D.J., 2013. Gender and corporate finance: Are male executives
overconfident relative to female executives? Journal of Financial Economics, 108(3),
822–839.
Hubbard, R.G. & Palia, D., 1995. Benefits of control, managerial ownership, and the stock
returns of acquiring firms. RAND Journal of Economics, 26(4), 782–792.
Hubbard, R.G., Palia, D., 1999. A reexamination of the conglomerate merger wave in the
1960s: an internal capital markets view. Journal of Finance, 54 (3), 1131–1152.
Humphery-Jenner, M.L. & Powell, R.G., 2011. Firm size, takeover profitability, and the
effectiveness of the market for corporate control: Does the absence of anti-takeover
provisions make a difference? Journal of Corporate Finance, 17(3), 418–437.
Ikenberry, D., Lakonishok, J. & Vermaelen, T. 1995. Market Underreaction to Open Market
Share Repurchases. Journal of Financial Economics, 39, 181-208.
Ishii, J. & Xuan, Y., 2014. Acquirer-target social ties and merger outcomes. Journal of
Financial Economics, 112(3), 344–363.
Ismail, A., 2008. Which acquirers gain more, single or multiple? Recent evidence from the
USA market. Global Finance Journal, 19(1), 72–84.
Jaffe, J., Pedersen, D. & Voetmann, T., 2013. Skill differences in corporate acquisitions.
Journal of Corporate Finance, 23, 166–181.
Jenter, D. & Lewellen, K., 2015. CEO Preferences and Acquisitions. Journal of Finance,
forthcoming.
John, K., Freund, S., D. Nguyen, & G. K. Vasudevan, 2010. Investor protection and cross-
border acquisitions of private and public targets. Journal of Corporate Finance,
16(3), 259–275.
Datta, D.K. & G. Puia. 1995. Cross-border acquisitions: an examination of the influence of
relatedness and cultural fit on shareholder value. Management International Review
35(4), 337-359.
De Jager, J. L., 1997. Albert Heijn: De Memoires van een Optimist. De Prom, Baarn.
De Jong, A., D.V. DeJong, G. Mertens, & P. Roosenboom, 2007. Investor relations,
reputational bonding, and corporate governance: The case of Royal Ahold. Journal
of Accounting and Public Policy, 26(3), pp.328–375.
ESSAYS ON CORPORATE TAKEOVERS
85
Jory, S.R. & Madura, J., 2009. Acquisitions of bankrupt assets. Quarterly Review of
Economics and Finance, 49(3), 748–759.
Jory, S.R. & Ngo, T.N., 2014. Cross-border acquisitions of state-owned enterprises. Journal
of International Business Studies, 45(9), 1096–1114.
Kaplan, S.N. & Weisbach, M.S., 1992. The Success of Acquisitions: Evidence from
Divestitures. Journal of Finance, 47(1), 107–138.
Kengelbach, J., Klemmer, D. & Schwetzler, B., 2011. An Anatomy of Serial Acquirers, M&A
Learning, and the Role of Post-Merger Integration. SSRN Working Paper. Available
at: http://papers.ssrn.com/sol3/papers.cfm?abstract_id=1946261.
Kim, J.J., Haleblian J.J. & Finkelstein, S., 2011. When Firms are Desperate to Grow via
Acquisition: The Effect of Growth Patterns and Acquisition Experience on
Acquisition Premiums, Administrative Science Quarterly, 56(1), 26–60.
King, D.R., D.R. Dalton, C.M. Daily, & J.G. Covin, 2004. Meta-analyses of post-acquisition
performance: Indications of unidentified moderators. Strategic Management
Journal, 25(2), 187–200.
Klasa, S. & Stegemoller, M., 2007. Takeover Activity as a Response to Time-Varying
Changes in Investment Opportunity Sets: Evidence from Takeover Sequences.
Financial Management, 36(2), 1–25.
Kolari, J.W. & Pynnönen, S., 2010. Event Study Testing with Cross-Sectional Correlation of
Abnormal Returns. Review of Financial Studies 23(11), 3996-4025.
Kose, J, Liu, Y & Taffler, R 2011, It Takes Two to Tango: Overpayment and Value
Destruction in M&A Deals. Paper presented at The 20th European Financial
Management Association (EFMA) (Paper accepted.), Braga, Portugal, 22/06/11.
Krishnan, H., Miller, A. & Judge, W.Q., 1997. Diversification and top management team
complementarity: is performance improved by merging similar or dissimilar
teams? Strategic Management Journal, 18(5), 361–374.
Kuipers, D.R., Miller, D.P. & Patel, A., 2009. The legal environment and corporate valuation:
Evidence from cross-border takeovers. International Review of Economics and
Finance, 18(4), 552–567.
Laamanen, T. & Keil, T., 2008. Performance of serial acquirers: Toward an acquisition
program perspective. Strategic Management Journal, 29(6), .663–672.
Landier, a., Nair, V.B. & Wulf, J., 2009. Trade-offs in Staying Close: Corporate Decision
Making and Geographic Dispersion. Review of Financial Studies, 22(3), 1119–1148.
1. WHAT GOES WRONG IN M&AS?
86
Lang, L.H.P., Stulz, R.M. & Walkling, R. a., 1991. A test of the free cash flow hypothesis - The
case of bidder returns. Journal of Financial Economics, 29(2), 315–335.
Lehn, K.M. & Zhao, M., 2006. CEO turnover after acquisitions: Are bad bidders fired?
Journal of Finance, 61(4), 1759–1811.
Levi, M., Li, K. & Zhang, F., 2014. Director gender and mergers and acquisitions. Journal of
Corporate Finance, 28, 185–200.
Lewellen, W., C. Loderer,& A. Rosenfeld. 1985. Merger Decisions and Executive Stock
Ownership. Journal of Accounting and Economics, 209-32.
Li, J. & Qian, C., 2013. Principal-principal conflicts under weak institutions: A study of
corporate takeovers in China. Strategic Management Journal, 34(4), 498–508.
Li, X., 2013. Productivity, restructuring, and the gains from takeovers. Journal of Financial
Economics, 109(1), 250–271.
Liang, H., L. Renneboog, & L. Sun, 2015, The Political Determinants of Executive
Compensation: Evidence from an Emerging Economy, Emerging Markets Review 25,
69-91.
Liang, H., Renneboog, L., & Vansteenkiste, C. 2017. Cross-border acquisitions and
employee relations, Working Paper.
Lin, C., Officer, M.S. & Zou, H., 2011. Directors’ and officers' liability insurance and
acquisition outcomes. Journal of Financial Economics, 102(3), 507–525.
Loughran, T. & Vijh, A.M. 1997. Do Long-Term Shareholders Benefit From Corporate
Acquisitions? Journal of Finance. 52(5), 1765-1790.
Luo, Y., 2005. Do insiders learn from outsiders? Evidence from mergers and acquisitions.
Journal of Finance, 60(4), 1951–1982.
Lyon, J.D., Barber, B.M. & Tsai, C., 1999. Improved Methods for Tests of Long-Run
Abnormal Stock Returns. Journal of Finance 54(1), 165-201.
Maksimovic, V., Phillips, G. & Prabhala, N.R., 2011. Post-merger restructuring and the
boundaries of the firm. Journal of Financial Economics, 102(2), 317–343.
Malmendier, U. & Tate, G. 2005. CEO Overconfidence and Corporate Investment. Journal of
Finance, 60(6), 2661–2700.
Malmendier, U. & Tate, G., 2008. Who makes acquisitions ? CEO overconfidence and the
market ’s reaction. Journal of Financial Economics. 88(1), 20–43.
Marks, M.L. & Mirvis, P.H. 2011. A framework for the human resources role in managing
culture in mergers and acquisitions. Human Resource Management 50(6), 859-877.
ESSAYS ON CORPORATE TAKEOVERS
87
Martynova, M., S. Oosting, L. Renneboog, 2007, The Long-term Operating Performance of
European Mergers and Acquisitions, in International Mergers and Acquisitions
Activity since 1990: Recent Research and Quantitative Analysis, G. Gregoriou and L.
Renneboog (eds.), Massachusetts: Elsevier, 79-116.
Martynova, M. & Renneboog, L., 2008a. A century of corporate takeovers: What have we
learned and where do we stand? Journal of Banking and Finance, 32(10), 2148–
2177.
Martynova, M. & Renneboog, L., 2008b. Spillover of corporate governance standards in
cross-border mergers and acquisitions. Journal of Corporate Finance, 14(3), 200–
223.
Martynova, M. & Renneboog, L., 2009. What determines the financing decision in
corporate takeovers : Cost of capital, agency problems, or the means of payment ?
Journal of Corporate Finance, 15(3), 290–315.
Martynova, M. and L. Renneboog, 2011a, The Performance of the European Market for
Corporate Control: Evidence from the 5th Takeover Wave, European Financial
Management 17 (2), 208-260.
Martynova, M. and L. Renneboog, 2011b, Evidence on the International Evolution and
Convergence of Corporate Governance Regulations, Journal of Corporate Finance 17
(5), 1531-1557.
Masulis, R.W., Wang, C. & Xie, F.E.I., 2007. Corporate Governance and Acquirer Returns.
Journal of Finance. 62(4), 1851-1889.
Matsusaka, J., 1993. Takeover motives during the conglomerate merger wave. RAND
Journal of Economics. 24, 357–379.
Matvos, G. & Ostrovsky, M., 2008. Cross-ownership, returns, and voting in mergers. Journal
of Financial Economics, 89(3), 391–403.
Meier, J.A. & Servaes, H., 2014. Distressed Acquisitions. ECGI - Finance Working Paper No.
435/2014. Available at SSRN: http://ssrn.com/abstract=2473123.
Milner, H.V. & D. Tingley. 2010. The Political Economy of US Foreign Aid: American
Legislators and the Domestic Politics of Aid. Economics & Politics, 22(2), 200-
232.Moeller, S.B., Schlingemann, F.P., and Stulz, R., 2004. Firm Size and Gains from
Acquisitions. Journal of Financial Economics 73, 201-228.
Morck, R., Shleifer, A. & Vishny, R.W., 1990. Do managerial objectives drive bad
acquisitions? Journal of Finance, 45(1), 31–48.
1. WHAT GOES WRONG IN M&AS?
88
Morosini, P., Shane, S. & Singh, H., 2007. National Cultural Distance and Cross-Border
Acquisition Performance. Journal of International Business Studies, 29(1), 137–158.
Napier, N.K., 1989. Mergers and acquisitions, human resource issues and outcomes: a
review and suggested typology. Journal of Management Studies, 26(3), 271–289.
Netter, J., Stegemoller, M. & Wintoki, M.B., 2011. Implications of data screens on merger
and acquisition analysis: A large sample study of mergers and acquisitions from
1992 to 2009. Review of Financial Studies, 24(7), 2317–2357.
Ollie, R. 1994. Shades of Culture and Institutions in International Mergers. Organization
Studies. 15(3), 381-405
Owen, S., Shi, L. & Yawson, A., 2010. Divestitures, wealth effects and corporate governance.
Accounting & Finance, 50(2). 389–415.
Pikulina, E. and L. Renneboog, 2015, Serial Takeovers, Large Shareholders, and CEOs’ Equity-
based Compensation, in J. Hill and R. Thomas (eds.), The Research Handbook on
Shareholder Power, Edward Elgar press, 297-318.
Phalippou, L., Xu, F. & Zhao, H., 2014. Acquiring Acquirers: New evidence on the drivers of
acquirer’s announcement returns in corporate takeovers. Review of Finance, 1–53.
Rahahleh, N. Al & Wei, P.P., 2013. Frequent cross-border acquirers from emerging
countries and cultural distance: Does the cultural difference of the initial deal
matter? Journal of Multinational Financial Management, 23(4), 356–373.
Rau, P.R. & Vermaelen, T., 1998. Glamour, value and the post-acquisition performance of
acquiring firms. Journal of Financial Economics, 49, 223-253.
Ravenscraft, D.J., & Scherer, F.M., 1987. Mergers, Sell-offs and Economic Efficiency. The
Brookings Institution, Washington, DC.
Ravenscraft, D.J. & Scherer, F.M., 1989. The profitability of mergers. International Journal
of Industrial Organization, 7(1). 101-116.
Renneboog, L. & P. Szilagyi, 2008, Corporate Restructuring and Bondholder Wealth,
European Financial Management 14, 792-819.
Renneboog, L. & Y. Zhao, 2011, Us Knows Us in the UK: On Director Networks and
Managerial Compensation, Journal of Corporate Finance 17, 1132-1157.
Renneboog, L. & Zhao, Y., 2014. Director networks and takeovers. Journal of Corporate
Finance 28, 218–234.
ESSAYS ON CORPORATE TAKEOVERS
89
Renneboog, L., Szilagyi, P., & Vansteenkiste, C. 2017. Creditor rights, claims enforcement,
and bond performance in mergers and acquisitions. Journal of International
Business Studies 48, 174-194.
Reus, T.H. & Lamont, B.T., 2009. The double-edged sword of cultural distance in
international acquisitions. Journal of International Business Studies, 40(8), 1298–
1316.
Rhodes-Kropf, M., & D. Robinson. 2008. The Market for Mergers and the Boundaries of the
Firm. Journal of Finance 63(3), 1169–1211.
Rossi, S. & Volpin, P.F., 2004. Cross-country determinants of mergers and acquisitions.
Journal of Financial Economics, 74(2), 277–304.
Rousseau, P. & C. Stroup, 2015. Director Histories and the Pattern of Acquisitions. Journal
of Financial and Quantitative Analysis 50(4), 1-28.
Sarala, R.M. & Vaara, E., 2009. Cultural differences, convergence, and crossvergence as
explanations of knowledge transfer in international acquisitions. Journal of
International Business Studies, 41(8), 1365–1390.
Schneider, C. & Spalt, O.G. 2017a. Acquisitions as Lotteries? The Selection of Target-Firm
Risk and its Impact on Merger Outcomes. Critical Finance Review 6 (1), 77-132.
Schneider, C. & Spalt, O.G. 2017b. Why Does Size Matter So Much for Bidder
Announcement Returns? Working Paper Tilburg University.
Schoar, A., 2002. Effects of Corporate Diversification on Productivity. Journal of Finance,
57(6), 2379–2404.
Schwert, G.W., 1996. Markup pricing in mergers and acquisitions. Journal of Financial
Economics. 41 (2), 153–162.
Serdar Dinc, I. & Erel, I., 2013. Economic Nationalism in Mergers and Acquisitions. Journal
of Finance, 68(6), 2471–2514.
Servaes, H. 1991. Tobin's Q and the Gains from Takeovers. Journal of Finance. 46, 409–419.
Shenkar, O. 2012. Culture distance revisited: Towards a more rigorous conceptualization
and measurement of cultural differences. Journal of International Business Studies
43(1), 1-11.
Shim, J. & Okamuro, H., 2011. Does ownership matter in mergers? A comparative study of
the causes and consequences of mergers by family and non-family firms. Journal of
Banking and Finance, 35(1), 193–203.
1. WHAT GOES WRONG IN M&AS?
90
Shleifer, A. & R. W. Vishny. 1989. Management Entrenchment: The Case of Manager-
Specific Investments. Journal of Financial Economics, 25, 123–139
Siegel, J.I., Licht, A.N. & Schwartz, S.H., 2011. Egalitarianism and international investment.
Journal of Financial Economics, 102(3), pp.621–642. Stahl, G.K. & Voigt, a., 2008. Do
Cultural Differences Matter in Mergers and Acquisitions? A Tentative Model and
Examination. Organization Science, 19(1), 160–176.
Smit, J. 2004. Het Drama Ahold. Balans, Amsterdam.
Stahl, G.K. & Voigt, A. 2008. Do cultural differences matter in mergers and acquisitions? A
tentative model and examination. Management Science 19(1), 160-176.
Starks, L.T. & Wei, K.D., 2013. Cross-Border Mergers and Differences in Corporate
Governance, International Review of Finance, 13(3), 265-297.
Steigner, T. & Sutton, N.K., 2011. How does national culture impact internalization benefits
in cross-border mergers and acquisitions? Financial Review, 46(1), 103–125.
Stroup, C., 2014. International Deal Experience and Cross-Border Acquisitions. Available
at SSRN: http://ssrn.com/abstract=2037512.
Uysal, V.B., 2011. Deviation from the target capital structure and acquisition choices.
Journal of Financial Economics, 102(3), 602–620.
Uysal, V.B., Kedia, S. & Panchapagesan, V., 2008. Geography and acquirer returns. Journal
of Financial Intermediation, 17(2), 256–275.
Vansteenkiste, C. 2018. Two-Stage Acquisitions and Deal Premiums. Working Paper,
Tilburg University.
Wang, C. & Xie, F., 2006. Corporate Governance Transfer and Synergistic Gains from
Mergers and Acquisitions. Review of Financial Studies, 22(2), 829–858.
Weber, R. A. & Camerer, C.F. 2003. Cultural conflict and merger failure: an experimental
approach. Management Science 49(4), 400-415.
Weber, Y., Shenkar, O., & Raveh, A. 1996. National and corporate culture fit in mergers and
acquisitions: An exploratory study. Management Science 42(8), 1215-1227.
Weber, Y. & Fried, Y. 2011. The dynamic of employees’ reactions during post-merger
integration process. Human Relations Management 50(6), 695-886.
Wright, P., M. Kroll, A. Lado, & B. Van Ness, 2002. The structure of ownership and
corporate acquisition strategies. Strategic Management Journal, 23(1),.41–53.

ESSAYS ON CORPORATE TAKEOVERS
91
Wu, Q., 2011. Information Conduit or Agency Cost: Top Management and Director
Interlock between Target and Acquirer .Midwest Finance Association 2012 Annual
Meetings Paper. Available at SSRN:http://ssrn.com/abstract=1927529.
Zhou, B., Guo, J., J. Hua, & A. J. Doukas, 2015. Does State Ownership Drive M&A
Performance? Evidence from China. European Financial Management, 21(1), 79-
105.
2. CREDITOR RIGHTS, CLAIMS ENFORCEMENT, AND BOND RETURNS IN M&AS
92
Chapter 2
Creditor rights, claims enforcement, and
bond performance in mergers and
acquisitions
with Luc Renneboog and Peter Szilagyi
Abstract – This paper shows that country-level differences in creditor protection affect
bond performance around cross-border M&A announcements. Using Eurobonds and a
global sample of 1,100 cross-border M&As, we find that the bondholders of bidding firms
respond more positively to deals that expose their firm to a jurisdiction with stronger
creditor rights and more efficient claims enforcement through courts. Positive creditor
protection spillovers are enhanced by now-global jurisdictional cooperation in
multinational insolvencies and creditors’ ability to do insolvency arbitrage. The spillover
effects we observe are stronger for firms with higher asset risk, longer maturity bonds,
and a higher likelihood of financial distress.
Keywords: Bondholder Value; Cross-Border Mergers and Acquisitions (M&As); Creditor
Rights; Legal Enforcement; Event Study; Eurobonds.
JEL Classification: G34, G32, G12, G14.
ESSAYS ON CORPORATE TAKEOVERS
93
1. Introduction
The market for corporate control has become increasingly global in the last two decades,
with cross-border mergers and acquisitions (M&As) now accounting for more than a
third of M&A activity worldwide (Erel et al., 2012) and exceeding domestic activity in
value terms (Albuquerque et al., 2014). One important aspect of this trend are the
spillovers in country-level regulatory conditions that cross-border deals facilitate.
Countries differ considerably in their governance structures, accounting standards and
disclosure practices, and protect investors to varying degrees. For individual firms,
country-level regulatory conditions have been shown to affect both performance
(Boubakri et al., 2015; La Porta et al., 2000) and governance and disclosure quality
(Doidge et al., 2007). The same conditions have at the same time been shown to spill
across borders through cross-border M&As, affecting both bidder and target stock
returns (Martynova and Renneboog, 2008), the takeover premium demanded by target
shareholders (Starks and Wei, 2013), and even the valuation of targets’ rival firms
(Albuquerque et al., 2014) and of entire industries (Servaes and Tamayo, 2014).
If spillovers of country-level regulatory conditions produce stock valuation effects in
cross-border M&As, it is reasonable to assume that they can also affect bond valuation.
Previous studies show that the performance and even design of corporate bonds are
significantly affected by the quality of regulatory protection adjudicated to creditors
(Choi et al., 2010; Francis et al., 2010; Miller and Reisel, 2012; Qi and Wald, 2008; Sevic
and Brawn, 2015). La Porta et al. (2000) argue that there are limitations to functional
creditor protection spillovers as a result of cross-border M&As, because corporate assets
remain under the jurisdiction of the country where they are physically located. However,
exposure to a more creditor-friendly jurisdiction should still have an effect on managerial
risk-taking. Moreover, complex multinational insolvencies have now inspired
jurisdictional cooperation among national authorities worldwide, which not only
enhances the threat and implications of insolvency proceedings if the firm goes into
financial distress, but potentially allows creditors to engage in insolvency arbitrage.20
20 Choi et al. (2010) examine how bonds perform in cross-border bank M&As using a small sample of 147 deals. The authors find that bank bondholders perceive these deals as risk-increasing activities, and that yield spread changes are affected by country differences in the regulatory banking environment. It is important to note that this study is different from our paper in terms of both focus and approach. Firstly, M&As within the banking industry are subject to very different regulatory considerations such as country-level bank regulation and supervision designed to prevent bank insolvencies. Secondly, Choi et al. (2010) explicitly exclude Eurobonds from their analysis and focus on domestic bonds. The use of Eurobonds is
2. CREDITOR RIGHTS, CLAIMS ENFORCEMENT, AND BOND RETURNS IN M&AS
94
This paper examines the bond performance of non-financial firms in cross-border
M&As, using a sample of 1,100 deals involving firms with outstanding Eurobonds in the
period 2000-2013. Our sample is among the largest studied in any bond market event
study on M&As.21 Importantly, Eurobonds are more appropriate to use than domestic
bonds for international bond market event studies. Firstly, the international Eurobond
market is significantly more liquid and standardized than often immature domestic bond
markets subject to local capital market regulation. Secondly, the firm-level effects of
changes in regulatory conditions are better captured using Eurobonds, which are
typically unsecured bearer bonds ill-protected by covenants, and their governing law
provisions in the bond indenture prevent their holders from doing insolvency arbitrage
themselves.22 The use of Eurobonds limits the scope of our analysis to relatively large and
creditworthy firms because, like domestic corporate bond markets outside the US, the
Eurobond market has low tolerance for public bonds by junk-grade issuers.23
Our empirical results indicate that bond performance in cross-border M&As is indeed
affected by country-level differences in creditor protection. The bondholders of bidding
firms tend to respond negatively to cross-border deals, but the abnormal bond returns
are systematically more positive when the deal exposes the firm to a jurisdiction with
stronger creditor rights and better enforcement of creditor claims through courts.
Subsample analysis further reveals that the positive creditor protection spillovers are
more appropriate for international bond event studies and a crucial part of our identification strategy. Thirdly, Choi et al. (2010) calculate abnormal bond yields using the mean-adjusted model rather than a matching portfolio method, against the recommendations of Bessembinder et al. (2009). 21 Bessembinder et al. (2009) find that bond market event studies rarely exceed 300 events with a median sample of 67. They show that a large sample is critical for the power of non-parametric tests. For example, the probability of detecting a shock of 10 basis points (bp) is less than 50% for 50 observations, but 100% for 500 observations. To the best of our knowledge, the largest studies focusing on M&As remain those of Billett et al. (2004) and Pereira da Silva et al. (2015) with 940 and 938 deals, respectively. 22 Eurobonds are typically issued in bearer form and large issue sizes, and exempt from withholding tax if exchange-distributed. These features attract huge demand from a very diverse set of mostly institutional investors, which makes their market competitive, efficient, and liquid with a relatively low risk of price anomalies. Eurobonds tend to be unsecured and carry few covenants, because their investors often prefer to stay anonymous and find recovering collateral and enforcing covenants too costly. Eurobonds are typically governed by English common law and listed on the Luxembourg Stock Exchange. The Luxembourg Stock Exchange was among the first to relax Eurobond issuing procedures in 1990, offering low fees, no withholding tax, and a quick approval of new listings. The bond’s governing law is specified in the bond contract, and is typically negotiated between the underwriter and the issuer. English common law is generally preferred because it permits collective action clauses that allow for timely and orderly renegotiations if the issuer defaults. English law also allows greater scope for the bond trustee to negotiate with the issuer, which sits well with Eurobond investors who wish to remain anonymous. 23 The Eurobonds in our sample are all investment-grade and tend to have large issue sizes, with the average issue size at €693 million. Domestic bond markets outside the US are also thin in junk-grade issues, however.
ESSAYS ON CORPORATE TAKEOVERS
95
stronger for firms that have higher asset volatility, longer maturity bonds, and a higher
likelihood of financial distress. We find no evidence of negative spillovers when the firm
is exposed to a country with inferior creditor protection, as creditors remain protected
by the jurisdictions they already have access to. The sensitivity of Eurobond holders to
positive spillovers implies that even relatively marginal new exposures affect the agency
costs of debt at the firm-level, benefiting all creditor classes regardless of their seniority
and ability to engage in legal arbitrage.
Our paper contributes to the growing literature on the economic impact and
implications of cross-border M&As. The international business literature offers ample
evidence on many aspects of these deals, including their impact on employee welfare
(Clougherty et al., 2014), level of value creation (Aybar and Ficici, 2009; Aybar and
Thanakijsombat, 2015; Doukas and Kan, 2006; Jory and Ngo, 2014; Lebedev et al., 2015;
Li et al., 2016; Shimizu et al., 2004), and relationship with national culture (Ahern et al.,
2015), legal systems (Jandik and Kali, 2009) and labor market regulations (Alimov,
2015). We add to this discussion by highlighting the substantial regulatory and
jurisdictional complexities that cross-border M&As generate. The complexities with
respect to cross-border insolvency are seldom discussed outside the legal literature but,
as our results indicate, they can potentially affect firm behavior and risk-taking through
altering creditors’ relative bargaining position.
2. Background and Hypotheses
The comparative corporate governance literature observes a lot of variation in the extent
to which countries accommodate creditor interests against the interests of the firm’s
other stakeholders. From the perspective of bondholders, notable features that set
countries apart are the quality and enforcement of regulatory protection adjudicated to
creditors, the extent to which minority investors are protected against expropriation by
management and majority shareholders, and the overall quality of the regulatory system.
An example of country-level differences in creditor protection is given by Davydenko and
Franks (2008). In France, insolvency proceedings are administered by courts, creditor
claims are subordinated to government and employee claims, and maintaining the firm
as a going concern is preferred. Thus, creditors can neither reliably count on recovering
their claims, nor control the timing and method of realizing collateral. In the UK, creditors
enjoy significant control in recovering claims and realizing collateral, and have strong
2. CREDITOR RIGHTS, CLAIMS ENFORCEMENT, AND BOND RETURNS IN M&AS
96
incentives to race against management and each other to do so. A creditor with a floating
charge can sell the entire firm without having to consider other claimants, and even
unsecured creditors have some liquidation rights.
La Porta et al. (2000) claim that there are limitations to functional spillovers in
country-level creditor protection in internationally diversified firms, because corporate
assets remain under the jurisdiction of the country where they are physically located.
This territoriality principle is often referred to as the “grab rule”, where each local court
takes the assets located in its geographic jurisdiction and distributes them only to those
creditors that go to court to present their claims. Nonetheless, the jurisdictional
exposures created by international diversification should still bring about non-trivial
benefits for creditors. Firstly, exposure to a more creditor-friendly jurisdiction can
subject management to an increased threat of insolvency proceedings and more serious
consequences if the firm goes into financial distress. This effect should occur even if the
firm is already present in that regime, because the more assets are up for grabs, the
greater the incentives of creditors to pursue them. Secondly, it is not actually certain that
a firm’s assets end up under the jurisdiction of the country where they are physically
located. Multinational insolvencies have inspired a worldwide wave of bankruptcy law
reforms to enhance cooperation among national authorities. A key template for these
reforms is the Model Law on Cross-Border Insolvency issued by the United Nations
Commission for International Trade Law (UNCITRAL) in 1997. The Model Law puts one
jurisdiction in charge of insolvency proceedings on a worldwide basis, thereby reducing
legal uncertainty, preventing firms from concealing or transferring assets, and ensuring
that all creditors are treated fairly. The main proceeding is opened in the jurisdiction of
the firm’s center of main interests (COMI), and any concurrent proceedings are
recognized and cooperate as secondary or non-main proceedings. The Model Law, which
proposes what is a modified form of the universality principle rather than territoriality,
has formally been enacted by 43 countries, and similar frameworks are in place in many
others including in the European Union (EU).24
24 The Model Law was drafted using previous cross-border insolvency agreements, including the Nordic Bankruptcy Convention of 1933, the Montevideo and Bustamente Conventions in force in much of South America, and the Convention on Insolvency Proceedings of the European Union, later enacted as the European Insolvency Regulation (EIR) of 2000. The US introduced the Model Law into the US Bankruptcy Code as Chapter 15 in 2005. However, it had already applied a modified form of universality, whereby it claimed worldwide jurisdiction over US-incorporated firms, but was prepared to cooperate with and possibly recognize the rulings of proceedings abroad to prevent the unequal treatment of foreign creditors.
ESSAYS ON CORPORATE TAKEOVERS
97
One notable aspect of such jurisdictional cooperation is that in addition to mitigating
legal uncertainties and the unequal treatment of foreign creditors, it may actually create
scope for creditors to engage in insolvency arbitrage. This phenomenon is known as
jurisdiction (or forum) shopping: if a firm operating in multiple jurisdictions becomes
financially distressed, creditors may race against management and each other to litigate
in a creditor-friendly jurisdiction to strengthen their legal position and obtain maximum
satisfaction for their claims. The scope for insolvency arbitrage is clearly increased by
cross-border M&As, resulting in a functional spillover of creditor protection across
countries.25
How jurisdictional cooperation can encourage insolvency arbitrage is best
demonstrated by the EU’s European Insolvency Regulation (EIR) introduced in 2000 and
amended in 2015.26 The EIR identifies a main proceeding based on the insolvent firm’s
COMI, but also allows creditors, wherever domiciled in the EU, to initiate non-main
proceedings in any Member State where the firm has an establishment. For example, it
allows French creditors to enforce their claims in the UK, even if the firm’s COMI is in a
third country. The EIR also extends the same right to national taxation and social security
authorities, eliminating the traditional rule against the enforcement of foreign revenue
debts. It defines an establishment fairly leniently, such that it may even encompass a
commercial agent of the firm.
Importantly, jurisdiction shopping can also be encouraged by ambiguities as to where
a firm’s COMI actually is. COMI is typically defined as the firm’s country of incorporation
in common law countries (incorporation doctrine), and the country where the firm’s
headquarters are in civil law countries (real seat doctrine). In practice, real seat countries
cannot exploit ambiguities in COMI to claim jurisdiction over insolvency cases, but
incorporation countries can. This has led UK administrators to shift a number of
insolvency cases from Continental Europe to the UK, including those of ISA Daisytek, MG
25 Jurisdiction shopping by creditors is a well-known phenomenon even within the US, and explains the popularity of specialized bankruptcy courts in Delaware and New York. While the US Bankruptcy code is federal, state courts enjoy considerable judicial discretion and protect creditor interests to varying degrees. Firms sometimes file for Chapter 11 bankruptcy preemptively to give them leverage against creditors. When they do not, however, creditors can submit an insolvency filing against the firm in any state in which it has an insolvent affiliate (BIS, 2002). 26 Council Regulation (EC) No. 1346/2000 of 29 May 2000, repealed by Regulation No. 2015/848 of 20 May 2015.
2. CREDITOR RIGHTS, CLAIMS ENFORCEMENT, AND BOND RETURNS IN M&AS
98
Rover, Enron Directo, Deutsche Nickel and Interedil.27 That creditors can do the same was
demonstrated in 2004 by the Bank of America, which preemptively got Eurofood, the
Irish subsidiary of Parmalat, under Irish jurisdiction despite a legal challenge by Italy
before the European Court of Justice.
It is important to recognize that the mere threat of insolvency arbitrage by creditors
should put added pressure on management to avoid excessive risk-taking, benefiting all
creditor classes whether or not arbitrage is feasible to them. Some creditors may not want
to access other jurisdictions because they have security rights (rights in rem) over assets
in a particular country.28 Eurobond holders are prevented from arbitrage altogether,
because Eurobonds are issued outside any jurisdiction, with a governing law specified in
the bond indenture for the event of legal conflicts. Nonetheless, large firms should always
have diligent creditors with the incentive to exploit disparate creditor protection
conditions if they go into financial distress. Eurobond holders should be highly sensitive
to the position and bargaining power of these diligent creditors vis-à-vis the firm – and all
the more so because the threat of insolvency litigation is less credible on their part, since
they hold unsecured bearer claims ill-protected by covenants, and tend to have low
recovery rates if the firm is liquidated.
Given the above discussion we expect that cross-border M&As generate significant
positive spillovers in country-level creditor protection, such that bondholders respond
more positively to deals that expose their firm to a jurisdiction with stronger regulatory
protection adjudicated to creditors.
The two key aspects of creditor protection are the quality of creditor rights in
insolvency proceedings, and the efficiency of local courts in enforcing creditor claims. On
one hand, the quality of creditor rights affects creditors’ bargaining power in insolvency
proceedings. On the other, well-functioning courts and strong legal enforcement can
27 Becht et al. (2008) discuss how Continental European firms reincorporate in the UK voluntarily to become subject to UK common law. This trend of cross-country incorporation mobility has been reinforced by a series of rulings by the European Court of Justice, which dictates that firms are free to select their country of incorporation within the EU independently of their real seat. The fact that real seat countries cannot export their law was demonstrated by the 2011 insolvency case of Mediasucre International, a French firm. Mediasucre’s French liquidator sought but was refused to include Rastelli Davide, an Italian firm intermixed with Mediasucre, in Mediasucre’s insolvency proceedings opened in France. 28 Rights in rem remain subject to the jurisdiction of the country where the assets are located and are strongly protected by the EIR. This should guarantee a relatively high percentage recovery to the creditors that hold them.
ESSAYS ON CORPORATE TAKEOVERS
99
effectively resolve disputes between corporate constituencies, and may even substitute
for weaker regulation (La Porta et al., 1998).
H1 Cross-border M&As that expose the firm to a jurisdiction with stronger creditor
rights generate higher abnormal bond returns around the deal announcement.
H2 Cross-border M&As that expose the firm to a jurisdiction with better claims
enforcement generate higher abnormal bond returns around the deal announcement.
Two further factors that are likely to affect the country-level protection enjoyed by
creditors are the extent to which minority shareholders are protected against
expropriation by management and majority shareholders, and the overall quality of the
regulatory environment. These factors do not drive creditors’ relative bargaining
position per se but affect all outside corporate constituencies. Firstly, strong shareholder
rights can harm creditors due to conflicts of interest with respect to the firm’s level of
risk-taking (Chava et al., 2009). However, the strong protection of minority shareholders
can actually help protect creditor interests, if it prevents expropriation of assets from the
firm that serve as collateral towards creditor claims (Djankov et al., 2008; Miller and
Reisel, 2012). Secondly, the efficient and complete enforcement of creditor rights
depends not only on well-functioning courts, but on the overall quality of the regulatory
system including the quality of property rights, control of corruption and fraud, and the
incidence of crime and violence.
H3 Cross-border M&As that expose the firm to a jurisdiction with stronger minority
shareholder protection generate higher abnormal bond returns around the deal
announcement.
H4 Cross-border M&As that expose the firm to a jurisdiction with better rule of law
generate higher abnormal bond returns around the deal announcements.
3. Sample Selection, Methodology, and Descriptive Statistics
3.1 Sample Selection and Methodology
We first construct our bond sample by retrieving Eurobonds with time series data from
Thomson Reuters Eikon. From the initial sample we exclude bonds with (i) special
features that have strong pricing implications (e.g. options) and (ii) missing or erroneous
prices and credit ratings. This search yields 1,703 Eurobonds issued by 532 firms. We
2. CREDITOR RIGHTS, CLAIMS ENFORCEMENT, AND BOND RETURNS IN M&AS
100
then use these bonds to create pricing benchmark portfolios segmented by currency,
credit rating, and duration as described below. Robust pricing benchmarks can only be
created for investment-grade euro, US dollar and pound sterling Eurobonds for the
period 2000-2013. The final sample of bonds that can be matched with corresponding
benchmarks includes 1,194 Eurobonds issued by 350 firms.
We then search the SDC, Zephyr and CapitalIQ databases for M&As involving the
issuers of the Eurobonds, excluding (i) acquisitions of assets and minority interests and
(ii) transactions involving banks, insurance companies and other financial firms (SIC
codes 6000-6900). Our final M&A sample comprises 1,100 cross-border deals involving
194 bidding firms with outstanding Eurobonds in the period 2000-2013, of which 26
deals also involve Eurobond-issuing targets.
The geographical distribution of the full sample is provided in Appendix 1. The
bidding firms, all Eurobond issuers, are most often domiciled in France (295 deals), the
UK (194), the US (129), the Netherlands (105) and Sweden (101). The target firm
countries are more widely dispersed, with most targets domiciled in the US (215 deals),
the UK (79), Germany (75), France (57), Brazil (52), Spain (52) and China (51).
Abnormal bond returns are defined as the sum of daily abnormal returns in the days
[-5,+5] surrounding deal announcements. Previous studies tend to use monthly returns,
but daily returns largely avoid confounding events and perform more accurately in
parametric tests (Bessembinder et al., 2009). Ederington et al. (2015) propose
standardizing bond returns by their estimated time series volatility, because bond
characteristics such as term-to-maturity and credit rating can lead to heteroskedasticity
in bond returns. For ease of interpretation we use unstandardized returns in the analysis,
but our results are robust to the use of standardized returns and are available on request.
Daily abnormal bond returns are calculated using a matching portfolio method that
outperforms other methods of return calculation (Bessembinder et al., 2009). Each firm
with multiple bonds is treated as a value-weighted portfolio of its bonds, where the
abnormal returns are weighted based on each bond’s market value two months before
the deal announcement. This mitigates problems with cross-correlation, and gives a more
accurate representation of how the firm’s bondholders are affected as a whole.
ESSAYS ON CORPORATE TAKEOVERS
101
Our final pricing benchmark portfolios are segmented by currency (euro, US dollar,
pound sterling), credit rating (BBB, A, AA, and AAA)29 and duration (1-3, 3-5, 5-7, 7-10,
and 10+ years).30 If a benchmark has multiple bonds by the same issuer, only the bond
with the largest issue size is included. If a benchmark has less than seven bonds, a reserve
benchmark is used with the same currency and bond rating but with a duration bracket
of 1-5 or 5+ years. We construct both equal and value-weighted benchmarks, with the
latter using each bond’s market value. Throughout the analysis we use the abnormal
returns calculated with the value-weighted benchmarks, since this approach performs
better when dealing with daily bond returns (Bessembinder et al., 2009). Nonetheless,
the results are robust to the equal-weighted approach and are available on request.
Before proceeding to the empirical analysis it is useful to determine what constitutes
economically significant abnormal bond returns. For stock returns, Brown and Warner
(1980) set economic significance at 1%, about one-sixth of the historical yearly stock
market risk premium. Bessembinder et al. (2009) infer that the threshold for abnormal
bond returns should be 15-25 basis points (bp), since the typical bond earns a yearly risk
premium of 100-150bp. However, the authors note that the yearly risk premium is much
lower for investment-grade bonds, and argue that an abnormal return as small as 5bp is
economically significant for high quality issues. We also adopt this threshold of 5bp, as
our sample consists of investment-grade Eurobonds with low risk premia.
It is useful to remind that using Eurobonds is more appropriate for cross-country
studies than using domestic bonds, and is a crucial part of our identification strategy.
Eurobonds confine our analysis to large and creditworthy firms because reliable pricing
benchmarks are difficult to construct in the market’s shallow junk-grade segment.
Ultimately, this dictates that whatever results we observe for Eurobond issuers are likely
to be more pronounced for other firms. That said, domestic corporate bond markets
outside the US are similarly thin in junk-grade issues.
29 Bond ratings are obtained from Standard and Poor’s or, when unavailable, Moody’s Investors Service to maximize sample coverage. This should not affect our results, as ratings and ratings changes for these two agencies are highly correlated. 30 Most public bond indices, including those published by Bank of America Merrill Lynch and iBoxx, are segmented by term-to-maturity. However, term-to-maturity incorrectly assumes that a bond’s market risk sensitivity is independent of its coupon payments. Benchmark portfolios could be segmented further based on factors such as size or liquidity. Bessembinder et al. (2009) find that further segmentation does not improve benchmark performance significantly.
2. CREDITOR RIGHTS, CLAIMS ENFORCEMENT, AND BOND RETURNS IN M&AS
102
Bond prices in Thomson Reuters Eikon are dealer quotes that can contain matrix
prices not separated from actual trade data. Matrix prices are not driven by firm-specific
information, which should reduce explanatory power in our analysis. However, actual
trade data are simply not reported in a systematic manner outside the US, and the
comparatively high liquidity of Eurobonds should ensure that Reuters data reflect actual
trades.31
3.2 Country-level Measures of Creditor Protection
We measure the quality of creditor rights in insolvency proceedings using the creditor
rights index of Djankov et al. (2007). The index ranges from zero to four, measuring the
number of laws protecting unsecured creditors from expropriation by more senior
secured creditors. It has been shown to not only matter for creditors but also explain
patterns in capital market development (Miller and Reisel, 2012). The index is available
for 129 countries as of 2003, with higher values indicating better creditor rights.
Following past studies, we use the 2003 index values for years in which the index is not
available, as creditor rights remain largely stable over our time window (Cao et al., 2015;
Qi and Wald, 2008).
The quality of debt claims enforcement through courts is measured using the debt
enforcement index of Djankov et al. (2007). The index measures the number of calendar
days needed to enforce a contract of unpaid debt worth half of the country’s GDP per
capita. It is available for 129 countries as of 2003.
We use Spamann’s (2010) anti-director rights index (ADRI) to measure the protection
of minority shareholders against expropriation by management or majority
shareholders. Spamann’s index updates earlier indices by La Porta et al. (1998) and
Djankov et al. (2008). It is available for 46 countries as of 2008, with higher values
indicating stronger minority rights.
We finally use the World Bank’s rule of law index to capture the quality of the general
regulatory environment. The index is one of the World Bank’s six Worldwide Governance
Indicators, and aggregates the quality of contract enforcement, property rights, the
effectiveness and predictability of the judiciary, the control of corruption, and the
31 The only comprehensive database of actual bond trades is the Trade Reporting and Compliance Engine (TRACE) database run by the US Financial Industry Regulatory Authority (FINRA). TRACE data are often used in academic research. However, Eurobonds are mostly ineligible for TRACE and in fact prohibited from trading by investment banks within the US due to their bearer form.
ESSAYS ON CORPORATE TAKEOVERS
103
likelihood of crime and violence. The index is available for 215 countries between 1996
and 2014. It ranges from zero to five, with higher values indicating a stronger regulatory
environment.
3.3 Descriptive Statistics
Table 1 shows descriptive statistics for our global sample of 1,100 cross-border M&As
involving 194 bidding firms and 26 target firms with outstanding Eurobonds between
2000 and 2013. Firm data are obtained for the end of the fiscal year preceding the deal
announcement from Worldscope, or if unavailable, CapitalIQ, Datastream, Orbis, or
Amadeus. The table shows that all 1,100 M&As involved Eurobond issuers on the bidder
side but only 26 on the target side. The small size of our target sample is not surprising,
since Eurobond issuers tend to be large and internationally diversified firms that are
rarely subject to takeover bids. Market capitalization and total assets are expressed in
2010 prices and, where applicable, converted into euro. Variable definitions are available
in Appendix 2.
The Eurobond issuers involved in the sample M&As as bidders are larger than those
involved as targets. The median book value of assets is €20.2 billion for the bidders and
€16.7 billion for the targets, with the difference much larger in terms of market
capitalization at €15.0 billion and €684 million, respectively. The differences between
bidders and targets are also significant in terms of return on assets, leverage, and asset
risk, with targets less profitable, riskier and more leveraged. The median bidder has a
credit rating of A, and two outstanding Eurobonds with an average term-to-maturity of
4.9 years and duration of 4.0 years. The median target is rated BBB, and has two
Eurobonds with an average term-to-maturity of 6.0 years and duration of 4.4 years.
The majority of the bidding firms are serial bidders, with the median firm involved in
23 deals over the 14-year sample period. Interestingly, the countries of the target firms
in Table 1 offer superior creditor protection to the bidding firm countries in terms of
creditor rights, claims enforcement quality, as well as the protection of minority
investors.
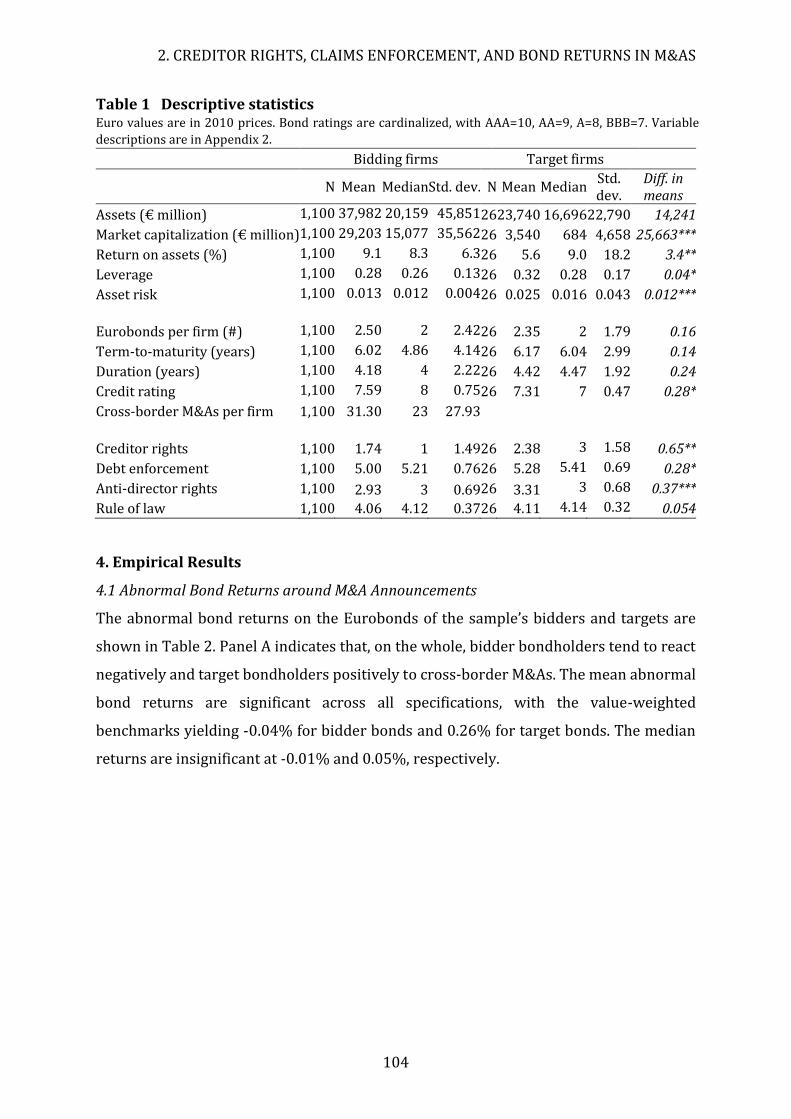
2. CREDITOR RIGHTS, CLAIMS ENFORCEMENT, AND BOND RETURNS IN M&AS
104
Table 1 Descriptive statistics Euro values are in 2010 prices. Bond ratings are cardinalized, with AAA=10, AA=9, A=8, BBB=7. Variable
descriptions are in Appendix 2.
Bidding firms Target firms
N Mean Median Std. dev. N Mean Median Std. dev.
Diff. in means
Assets (€ million) 1,100 37,982 20,159 45,851 26 23,740 16,696 22,790 14,241
Market capitalization (€ million) 1,100 29,203 15,077 35,562 26 3,540 684 4,658 25,663***
Return on assets (%) 1,100 9.1 8.3 6.3 26 5.6 9.0 18.2 3.4**
Leverage 1,100 0.28 0.26 0.13 26 0.32 0.28 0.17 0.04*
Asset risk 1,100 0.013 0.012 0.004 26 0.025 0.016 0.043 0.012***
Eurobonds per firm (#) 1,100 2.50 2 2.42 26 2.35 2 1.79 0.16
Term-to-maturity (years) 1,100 6.02 4.86 4.14 26 6.17 6.04 2.99 0.14
Duration (years) 1,100 4.18 4 2.22 26 4.42 4.47 1.92 0.24
Credit rating 1,100 7.59 8 0.75 26 7.31 7 0.47 0.28*
Cross-border M&As per firm 1,100 31.30 23 27.93
Creditor rights 1,100 1.74 1 1.49 26 2.38 3 1.58 0.65**
Debt enforcement 1,100 5.00 5.21 0.76 26 5.28 5.41 0.69 0.28*
Anti-director rights 1,100 2.93 3 0.69 26 3.31 3 0.68 0.37***
Rule of law 1,100 4.06 4.12 0.37 26 4.11 4.14 0.32 0.054
4. Empirical Results
4.1 Abnormal Bond Returns around M&A Announcements
The abnormal bond returns on the Eurobonds of the sample’s bidders and targets are
shown in Table 2. Panel A indicates that, on the whole, bidder bondholders tend to react
negatively and target bondholders positively to cross-border M&As. The mean abnormal
bond returns are significant across all specifications, with the value-weighted
benchmarks yielding -0.04% for bidder bonds and 0.26% for target bonds. The median
returns are insignificant at -0.01% and 0.05%, respectively.
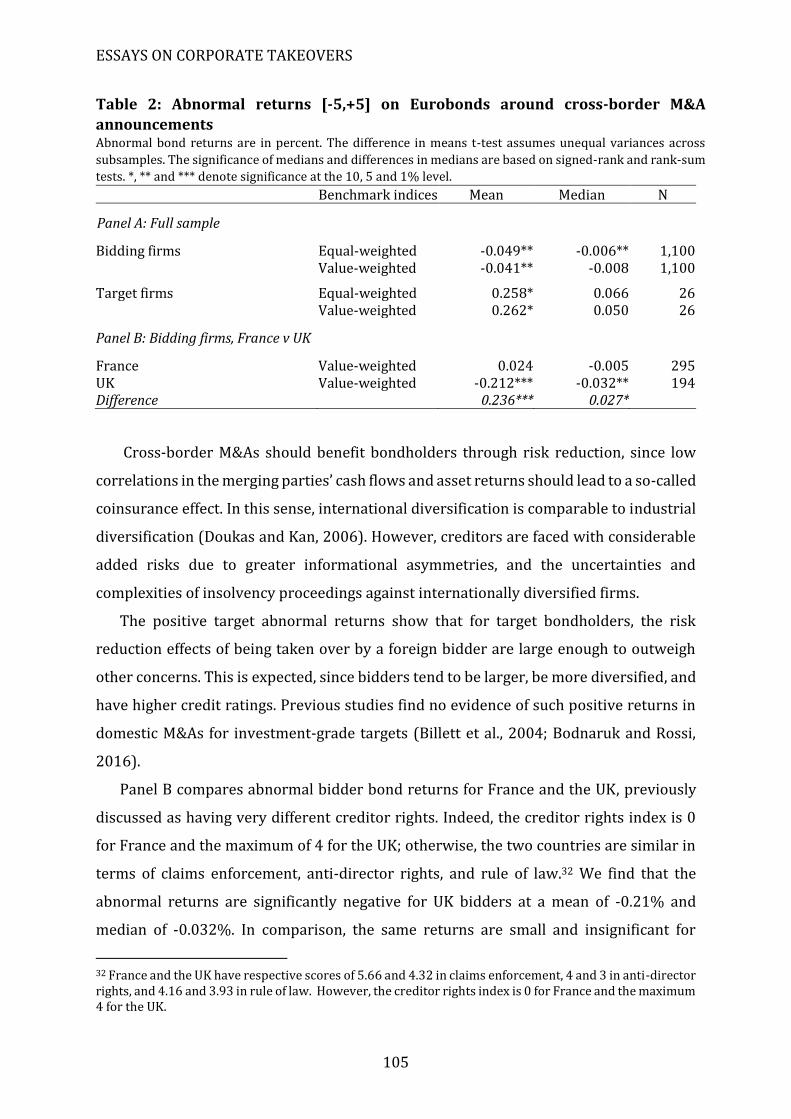
ESSAYS ON CORPORATE TAKEOVERS
105
Table 2: Abnormal returns [-5,+5] on Eurobonds around cross-border M&A
announcements Abnormal bond returns are in percent. The difference in means t-test assumes unequal variances across
subsamples. The significance of medians and differences in medians are based on signed-rank and rank-sum
tests. *, ** and *** denote significance at the 10, 5 and 1% level.
Benchmark indices Mean Median N
Panel A: Full sample
Bidding firms Equal-weighted -0.049** -0.006** 1,100 Value-weighted -0.041** -0.008 1,100
Target firms Equal-weighted 0.258* 0.066 26 Value-weighted 0.262* 0.050 26
Panel B: Bidding firms, France v UK
France Value-weighted 0.024 -0.005 295 UK Value-weighted -0.212*** -0.032** 194 Difference 0.236*** 0.027*
Cross-border M&As should benefit bondholders through risk reduction, since low
correlations in the merging parties’ cash flows and asset returns should lead to a so-called
coinsurance effect. In this sense, international diversification is comparable to industrial
diversification (Doukas and Kan, 2006). However, creditors are faced with considerable
added risks due to greater informational asymmetries, and the uncertainties and
complexities of insolvency proceedings against internationally diversified firms.
The positive target abnormal returns show that for target bondholders, the risk
reduction effects of being taken over by a foreign bidder are large enough to outweigh
other concerns. This is expected, since bidders tend to be larger, be more diversified, and
have higher credit ratings. Previous studies find no evidence of such positive returns in
domestic M&As for investment-grade targets (Billett et al., 2004; Bodnaruk and Rossi,
2016).
Panel B compares abnormal bidder bond returns for France and the UK, previously
discussed as having very different creditor rights. Indeed, the creditor rights index is 0
for France and the maximum of 4 for the UK; otherwise, the two countries are similar in
terms of claims enforcement, anti-director rights, and rule of law.32 We find that the
abnormal returns are significantly negative for UK bidders at a mean of -0.21% and
median of -0.032%. In comparison, the same returns are small and insignificant for
32 France and the UK have respective scores of 5.66 and 4.32 in claims enforcement, 4 and 3 in anti-director rights, and 4.16 and 3.93 in rule of law. However, the creditor rights index is 0 for France and the maximum 4 for the UK.
2. CREDITOR RIGHTS, CLAIMS ENFORCEMENT, AND BOND RETURNS IN M&AS
106
French bidders. Interestingly, we find similar results vis-à-vis the UK for other countries
with relatively weak creditor rights including the US.33 Whether this is attributable to
positive spillovers offsetting the negative effects of cross-border M&As is investigated in
the next sections.
Henceforth for the sake of brevity, we study the abnormal bond returns calculated
over the value-weighted benchmarks; the results using the equal-weighted approach are
similar and available on request.
4.2 Creditor Protection Spillover Effects in Cross-Border M&As
We now investigate whether country-level differences in creditor protection affect the
performance of the bidder Eurobonds in our global sample of 1,100 cross-border M&As.
We have hypothesized that cross-country spillovers of creditor protection are positive,
such that bondholders respond more positively to deals that expose their firm to a
jurisdiction with stronger creditor protection.
To examine the occurrence of positive spillovers, we create dummy variables
corresponding to each of our four creditor protection measures. Each variable is equal to
one if the target country offers above-median (strong) creditor protection and the bidder
country offers below-median (weak) creditor protection. The median values are
calculated using the entire sample. The dummy variables are equal to zero in all other
cases, with bidder bondholders expected to reap limited benefits from exposure to the
target jurisdiction.
Table 3 shows the abnormal bond returns stratified by each dummy variable. We find
evidence of positive creditor protection spillovers across all four creditor protection
measures, in line with each of Hypotheses (1) to (4). Bondholders’ response is strongest
to the relative quality of creditor rights, with the mean return positive at 0.05% when the
target country is more creditor-friendly, and negative at -0.06% otherwise. Both returns
are statistically and economically significant, and the difference between them is
significant at the 1% level. The measures capturing claims enforcement quality, anti-
director rights, and the general rule of law produce similar results. In each case, the mean
return is insignificantly positive (0.04%, 0.01%, 0.02%) when the target jurisdiction is
more creditor-friendly, and significantly negative at -0.06% otherwise. The differences in
33 The mean abnormal bond return is significantly negative at -0.21% for UK bidders, but insignificantly positive at 0.01% for US bidders. The US has a creditor rights score of 1, against a score of 4 for the UK.
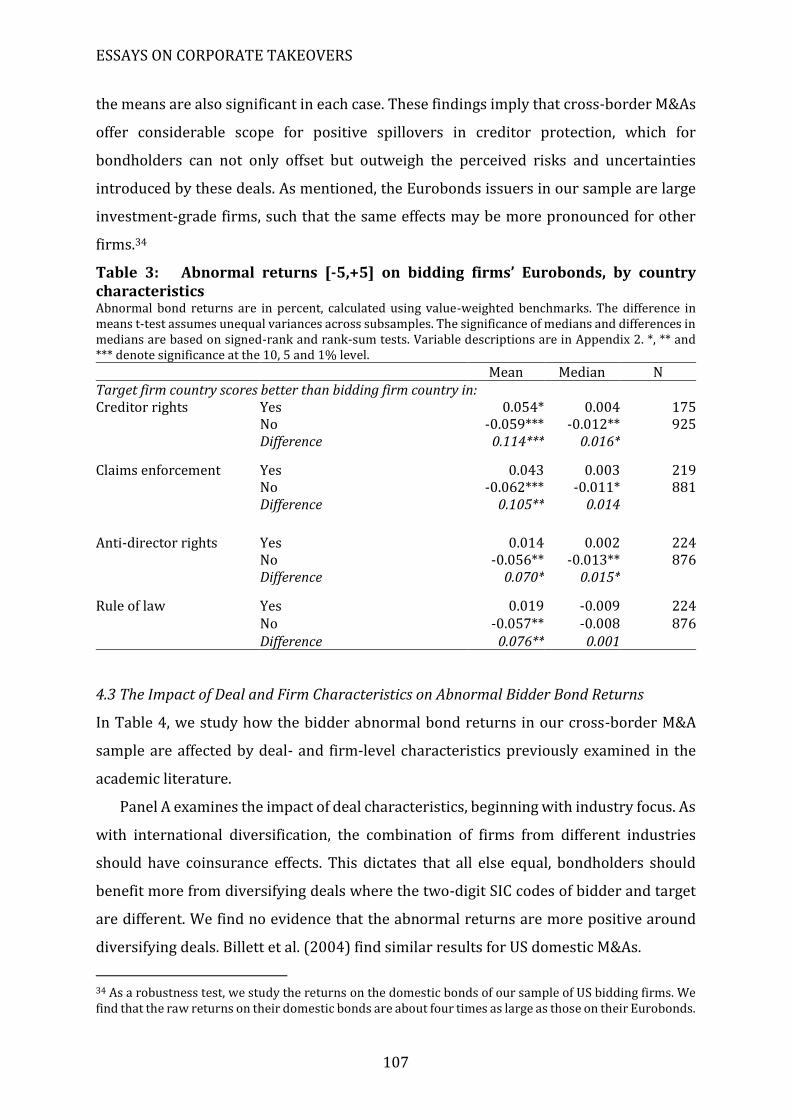
ESSAYS ON CORPORATE TAKEOVERS
107
the means are also significant in each case. These findings imply that cross-border M&As
offer considerable scope for positive spillovers in creditor protection, which for
bondholders can not only offset but outweigh the perceived risks and uncertainties
introduced by these deals. As mentioned, the Eurobonds issuers in our sample are large
investment-grade firms, such that the same effects may be more pronounced for other
firms.34
Table 3: Abnormal returns [-5,+5] on bidding firms’ Eurobonds, by country characteristics Abnormal bond returns are in percent, calculated using value-weighted benchmarks. The difference in means t-test assumes unequal variances across subsamples. The significance of medians and differences in medians are based on signed-rank and rank-sum tests. Variable descriptions are in Appendix 2. *, ** and *** denote significance at the 10, 5 and 1% level.
Mean Median N Target firm country scores better than bidding firm country in: Creditor rights Yes 0.054* 0.004 175
No -0.059*** -0.012** 925 Difference 0.114*** 0.016*
Claims enforcement Yes 0.043 0.003 219 No -0.062*** -0.011* 881 Difference 0.105** 0.014
Anti-director rights Yes 0.014 0.002 224 No -0.056** -0.013** 876 Difference 0.070* 0.015*
Rule of law Yes 0.019 -0.009 224 No -0.057** -0.008 876 Difference 0.076** 0.001
4.3 The Impact of Deal and Firm Characteristics on Abnormal Bidder Bond Returns
In Table 4, we study how the bidder abnormal bond returns in our cross-border M&A
sample are affected by deal- and firm-level characteristics previously examined in the
academic literature.
Panel A examines the impact of deal characteristics, beginning with industry focus. As
with international diversification, the combination of firms from different industries
should have coinsurance effects. This dictates that all else equal, bondholders should
benefit more from diversifying deals where the two-digit SIC codes of bidder and target
are different. We find no evidence that the abnormal returns are more positive around
diversifying deals. Billett et al. (2004) find similar results for US domestic M&As.
34 As a robustness test, we study the returns on the domestic bonds of our sample of US bidding firms. We find that the raw returns on their domestic bonds are about four times as large as those on their Eurobonds.
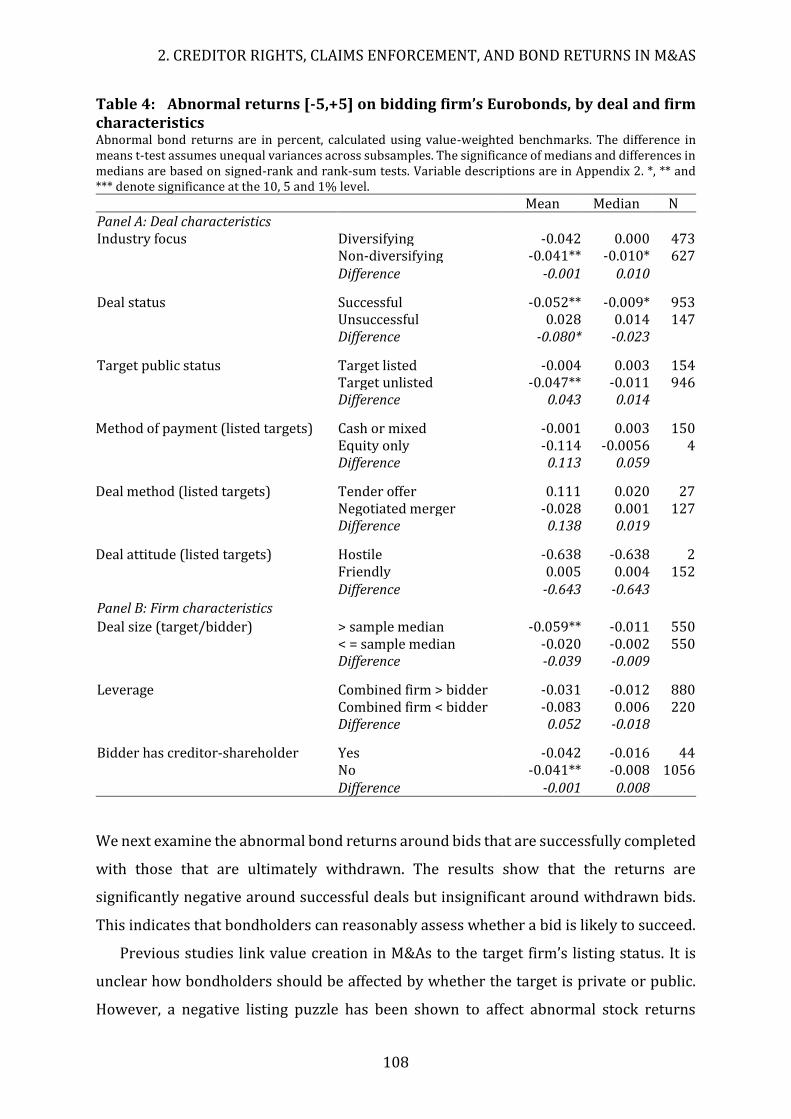
2. CREDITOR RIGHTS, CLAIMS ENFORCEMENT, AND BOND RETURNS IN M&AS
108
Table 4: Abnormal returns [-5,+5] on bidding firm’s Eurobonds, by deal and firm characteristics Abnormal bond returns are in percent, calculated using value-weighted benchmarks. The difference in means t-test assumes unequal variances across subsamples. The significance of medians and differences in medians are based on signed-rank and rank-sum tests. Variable descriptions are in Appendix 2. *, ** and *** denote significance at the 10, 5 and 1% level.
Mean Median N Panel A: Deal characteristics Industry focus Diversifying -0.042 0.000 473
Non-diversifying -0.041** -0.010* 627 Difference -0.001 0.010
Deal status Successful -0.052** -0.009* 953 Unsuccessful 0.028 0.014 147 Difference -0.080* -0.023
Target public status Target listed -0.004 0.003 154 Target unlisted -0.047** -0.011 946 Difference 0.043 0.014
Method of payment (listed targets) Cash or mixed -0.001 0.003 150 Equity only -0.114 -0.0056 4 Difference 0.113 0.059
Deal method (listed targets) Tender offer 0.111 0.020 27 Negotiated merger -0.028 0.001 127 Difference 0.138 0.019
Deal attitude (listed targets) Hostile -0.638 -0.638 2 Friendly 0.005 0.004 152 Difference -0.643 -0.643
Panel B: Firm characteristics
Deal size (target/bidder) > sample median -0.059** -0.011 550 < = sample median -0.020 -0.002 550 Difference -0.039 -0.009
Leverage Combined firm > bidder -0.031 -0.012 880 Combined firm < bidder -0.083 0.006 220 Difference 0.052 -0.018
Bidder has creditor-shareholder Yes -0.042 -0.016 44 No -0.041** -0.008 1056 Difference -0.001 0.008
We next examine the abnormal bond returns around bids that are successfully completed
with those that are ultimately withdrawn. The results show that the returns are
significantly negative around successful deals but insignificant around withdrawn bids.
This indicates that bondholders can reasonably assess whether a bid is likely to succeed.
Previous studies link value creation in M&As to the target firm’s listing status. It is
unclear how bondholders should be affected by whether the target is private or public.
However, a negative listing puzzle has been shown to affect abnormal stock returns
ESSAYS ON CORPORATE TAKEOVERS
109
around M&A announcements, which persist over time and across countries (Faccio et al.,
2006). We find no statistical evidence of a negative listing effect.
For our subsample of deals involving listed targets, we next examine the impact of the
payment method and the type and attitude of the takeover bid. Bidding firms may choose
to finance deals in a way that reverses any risk reductions arising from cash flow and
asset coinsurance effects. This implies that the abnormal bond returns should be lower
around cash-financed deals that are often funded with debt and reduce the collateral
available to creditors. Similar to Billett et al. (2004) we find no evidence that bondholders
respond more negatively to cash-financed deals, although cross-border M&As are
typically cash-financed so our sample contains few equity-financed deals.
Our results show no statistical evidence that the abnormal bond returns are different
for tender offers compared with negotiated mergers. Tender offers are often associated
with greater value creation to the extent that they indicate more confidence on the
bidder’s part in realizing efficiency gains (Loughran and Vijh, 1997). Bondholders seem
to respond negatively to hostile takeover bids, but cross-border M&As are rarely hostile
with only two hostile deals in the sample. The negative returns are not surprising since
hostile bids with aggressive bargaining leave little money on the table for the bidder, and
the target may adopt high-risk strategies to fend off takeover threats, including paying
out liquid assets and increasing leverage (Schwert, 2000).
Panel B examines how the abnormal bond returns are affected by firm-level
characteristics including deal size, the combined leverage of bidder and target relative to
that of the bidder, and whether the bidder has a creditor-shareholder. Of the 1,100 target
firms, accounting data are available for the 154 public firms and a further 222 private
firms. For the remaining 724 privately held targets, we are unable to retrieve data from
any of our databases. For the missing data we use mean imputation, replacing them with
industry averages at the country level. This allows us to keep these observations in the
sample, albeit at the expense of weakening explanatory power.
We first stratify the abnormal bond returns by whether the ratio of target to bidder
assets is above or below the sample median. The returns are insignificantly different
between the two groups, but are less negative and insignificant when the target firm is
relatively small. Billett et al. (2004) previously find that bidder bondholders respond
more positively to smaller targets in US domestic deals. The authors attribute this to the
2. CREDITOR RIGHTS, CLAIMS ENFORCEMENT, AND BOND RETURNS IN M&AS
110
difficulties of absorbing and realizing synergies on larger acquisitions, and managerial
hubris and agency concerns.
We next consider financial risk changes due to the combination of bidder and target
leverage. We calculate the combined firm’s book leverage using weights based on each
firm’s book value of assets. We find no evidence that the abnormal bond returns are more
negative when the combined leverage is higher than that of the pre-merger bidder. This
is in line with Billett et al. (2004), and is not surprising since management can adjust
leverage both through the payment method and after the takeover.
Lastly, we consider whether the bidding firm has a creditor-shareholder, a bank or
other financial institution that both lends to and invest in the firm. This dual holdership
phenomenon is well-documented for Continental Europe, but 10% of US shares are also
held by creditor-shareholders (Bodnaruk and Rossi, 2016). The influence of a creditor-
shareholder may not only make M&As more creditor-friendly, but facilitate access to debt
or better credit terms to finance the deal (Jiang et al., 2010). We find no statistical
evidence that the presence of a creditor-shareholder affects the abnormal bond returns.
4.4 Multivariate Analysis of Creditor Protection Spillovers
In Table 5 we employ multivariate regressions to examine whether country-level
differences in creditor protection affect the performance of bidding firms’ Eurobonds.35
In Models (1) to (4) we run separate regressions for each dummy variable corresponding
to our four creditor protection measures, with Model (5) including all four variables. The
regressions include the deal and firm-level characteristics previously studied in Table 4,
and control for bidder industry and year fixed effects. As a country-level control measure,
we include variables capturing the legal origin of the bidder and target countries.
35 In unreported regressions, we also examine whether the target firms’ Eurobonds are affected by country-level differences in creditor protection. Despite the small sample size of only 26 observations, we find evidence that target bondholders respond even more strongly to superior creditor protection in the bidder country. This is not surprising, since the target firms are smaller with lower credit ratings than the bidding firms, thus their bondholders should be more sensitive to creditor protection spillovers.
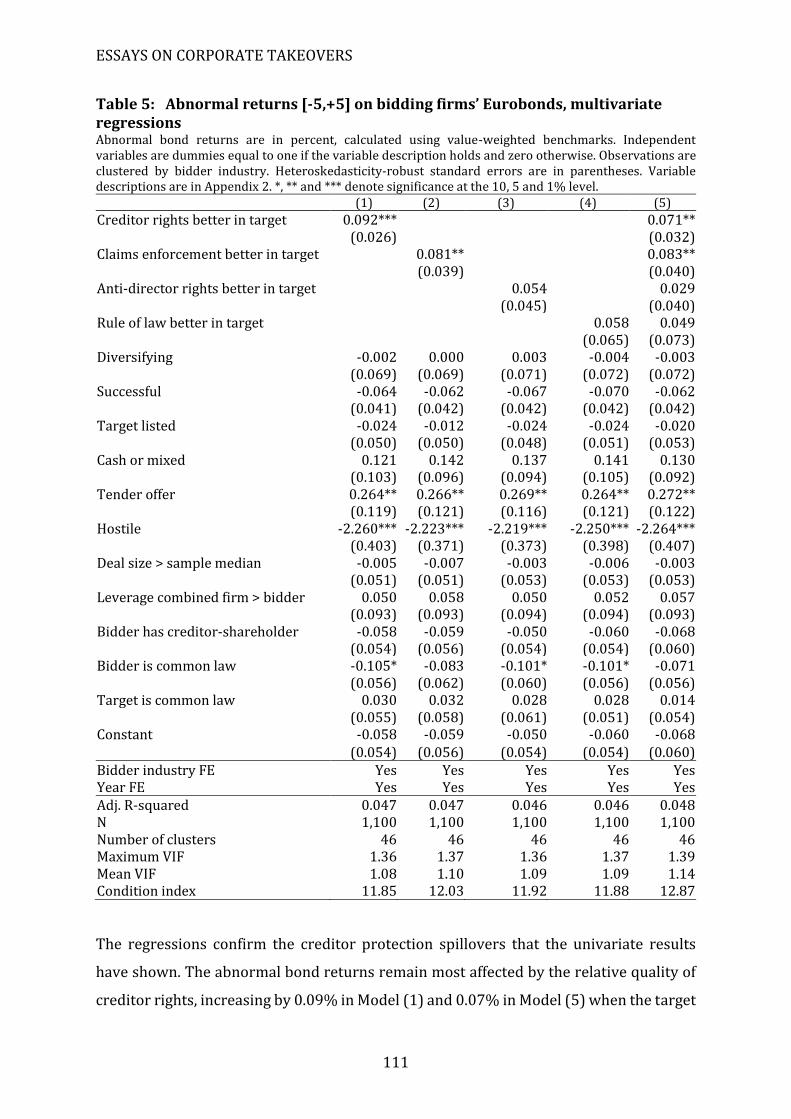
ESSAYS ON CORPORATE TAKEOVERS
111
Table 5: Abnormal returns [-5,+5] on bidding firms’ Eurobonds, multivariate regressions Abnormal bond returns are in percent, calculated using value-weighted benchmarks. Independent variables are dummies equal to one if the variable description holds and zero otherwise. Observations are clustered by bidder industry. Heteroskedasticity-robust standard errors are in parentheses. Variable descriptions are in Appendix 2. *, ** and *** denote significance at the 10, 5 and 1% level. (1) (2) (3) (4) (5)
Creditor rights better in target 0.092***
0.071** (0.026)
(0.032)
Claims enforcement better in target 0.081** 0.083**
(0.039) (0.040) Anti-director rights better in target
0.054 0.029
(0.045) (0.040) Rule of law better in target
0.058 0.049
(0.065) (0.073) Diversifying -0.002 0.000 0.003 -0.004 -0.003
(0.069) (0.069) (0.071) (0.072) (0.072) Successful -0.064 -0.062 -0.067 -0.070 -0.062
(0.041) (0.042) (0.042) (0.042) (0.042) Target listed -0.024 -0.012 -0.024 -0.024 -0.020
(0.050) (0.050) (0.048) (0.051) (0.053) Cash or mixed 0.121 0.142 0.137 0.141 0.130
(0.103) (0.096) (0.094) (0.105) (0.092) Tender offer 0.264** 0.266** 0.269** 0.264** 0.272**
(0.119) (0.121) (0.116) (0.121) (0.122) Hostile -2.260*** -2.223*** -2.219*** -2.250*** -2.264***
(0.403) (0.371) (0.373) (0.398) (0.407) Deal size > sample median -0.005 -0.007 -0.003 -0.006 -0.003
(0.051) (0.051) (0.053) (0.053) (0.053) Leverage combined firm > bidder 0.050 0.058 0.050 0.052 0.057
(0.093) (0.093) (0.094) (0.094) (0.093) Bidder has creditor-shareholder -0.058 -0.059 -0.050 -0.060 -0.068
(0.054) (0.056) (0.054) (0.054) (0.060) Bidder is common law -0.105* -0.083 -0.101* -0.101* -0.071 (0.056) (0.062) (0.060) (0.056) (0.056) Target is common law 0.030 0.032 0.028 0.028 0.014 (0.055) (0.058) (0.061) (0.051) (0.054) Constant -0.058 -0.059 -0.050 -0.060 -0.068
(0.054) (0.056) (0.054) (0.054) (0.060) Bidder industry FE Yes Yes Yes Yes Yes Year FE Yes Yes Yes Yes Yes Adj. R-squared 0.047 0.047 0.046 0.046 0.048 N 1,100 1,100 1,100 1,100 1,100 Number of clusters 46 46 46 46 46 Maximum VIF 1.36 1.37 1.36 1.37 1.39 Mean VIF 1.08 1.10 1.09 1.09 1.14 Condition index 11.85 12.03 11.92 11.88 12.87
The regressions confirm the creditor protection spillovers that the univariate results
have shown. The abnormal bond returns remain most affected by the relative quality of
creditor rights, increasing by 0.09% in Model (1) and 0.07% in Model (5) when the target
2. CREDITOR RIGHTS, CLAIMS ENFORCEMENT, AND BOND RETURNS IN M&AS
112
jurisdiction is more creditor-friendly. When the target country offers more efficient
claims enforcement, the abnormal returns increase by 0.08%. These return increases are
uniformly significant at least at the 5% level, confirming Hypotheses (1) and (2). They are
also considerably higher than the 5bp abnormal return that Bessembinder et al. (2009)
regard as being economically significant for high-quality bonds.
The anti-director rights and rule of law variables are positive but insignificant in the
regressions, thus our earlier univariate results for Hypotheses (3) and (4) are not
corroborated. This is not surprising and actually strengthens our identification strategy.
Minority investor protection and the quality of the regulatory system are indirect
measures of creditor protection that affect all outside corporate constituencies. However,
creditor rights and claims enforcement measure creditor protection directly, with their
significance showing that it is ultimately improvements in creditors’ relative bargaining
power that bondholders respond to in cross-border M&As.
Of the deal and firm-level controls, the abnormal bond returns are affected by the
takeover bid’s method and attitude. Contrary to our univariate results, the regressions
show that the returns are significantly higher around tender offers compared with
negotiated deals, and lower around hostile takeover bids. These results correspond to
our earlier conjectures that tender offers are associated with greater value creation,
while hostile bids are viewed as risk factors that otherwise leave little money on the table
for bidding firms (Loughran and Vijh, 1997; Schwert, 2000).
The returns show no statistical relationship with the deal’s industry focus, the
payment method or the target’s listing status, and the deal size, leverage, and creditor-
shareholder variables are also insignificant. Billett et al. (2004) previously study industry
focus, the payment method, deal size, and leverage for US domestic deals with public
targets only, and find no multivariate evidence that abnormal bond returns are affected
by these deal- and firm-level characteristics except deal size.36
Models (1), (3) and (4) show a statistical relationship between the abnormal returns
and the bidder country’s legal origin, with the returns lower for common law bidders.
Nonetheless, the legal origin variable is insignificant in the final Model (5) that includes
36 The deal size variable employed by Table 5 is a dummy variable equal to one if the deal size is greater than the sample median and zero otherwise. In unreported robustness tests we use the continuous deal size variable, defined as the ratio of the target’s book value of assets to the bidder’s book value of assets, but the results are unchanged. To avoid selection bias concerns, we additionally control for the bidder’s pre-merger leverage ratio and find that it does not affect our results.
ESSAYS ON CORPORATE TAKEOVERS
113
all four country-level creditor protection measures. This again indicates that the
importance of creditor rights and claims enforcement quality outweigh more indirect
measures of creditor protection.37
4.5 Subsample Analysis
In Table 6 we perform subsample analyses to corroborate our earlier results in Table
5. In order, we (i) exclude M&As by the same bidder that are announced within 30 days
of each other, (ii) exclude serial bidders that made more than ten takeover bids over a
three-year period, (iii) exclude deals where the bidder issued Eurobonds within three
months around the deal announcement, and (iv) include M&As involving US and
European bidders only. The results once again confirm positive spillovers in both creditor
rights and claims enforcement quality in cross-border M&As.
The motivation for excluding overlapping deals and serial bidders is that bidder
bondholders are likely to respond more strongly to one-time takeover bids, and recent or
ongoing M&As may continue to have lingering valuation effects. The exclusion of
overlapping deals has no material impact on the regression.38 We find that the exclusion
of serial bidders cuts our sample in half to 502 deals, and greatly magnifies bondholder
sensitivity to positive creditor protection spillovers. Indeed, the abnormal bond returns
now increase by 0.11% in response to both superior creditor rights and more efficient
claims enforcement in the target jurisdiction. It is notable that the anti-director rights
index capturing minority investor protection is now also significant, increasing the
abnormal returns by 0.13%.
37 In unreported regressions we also control for the difference in GDP per capita between the bidder and target countries, to the extent that country wealth proxies for the quality of creditor protection. We find no evidence that the relative wealth of the bidder and target countries affects the abnormal returns. 38 In unreported robustness tests we also exclude overlapping deals announced within 40 days and 50 days of each other, with similar results.
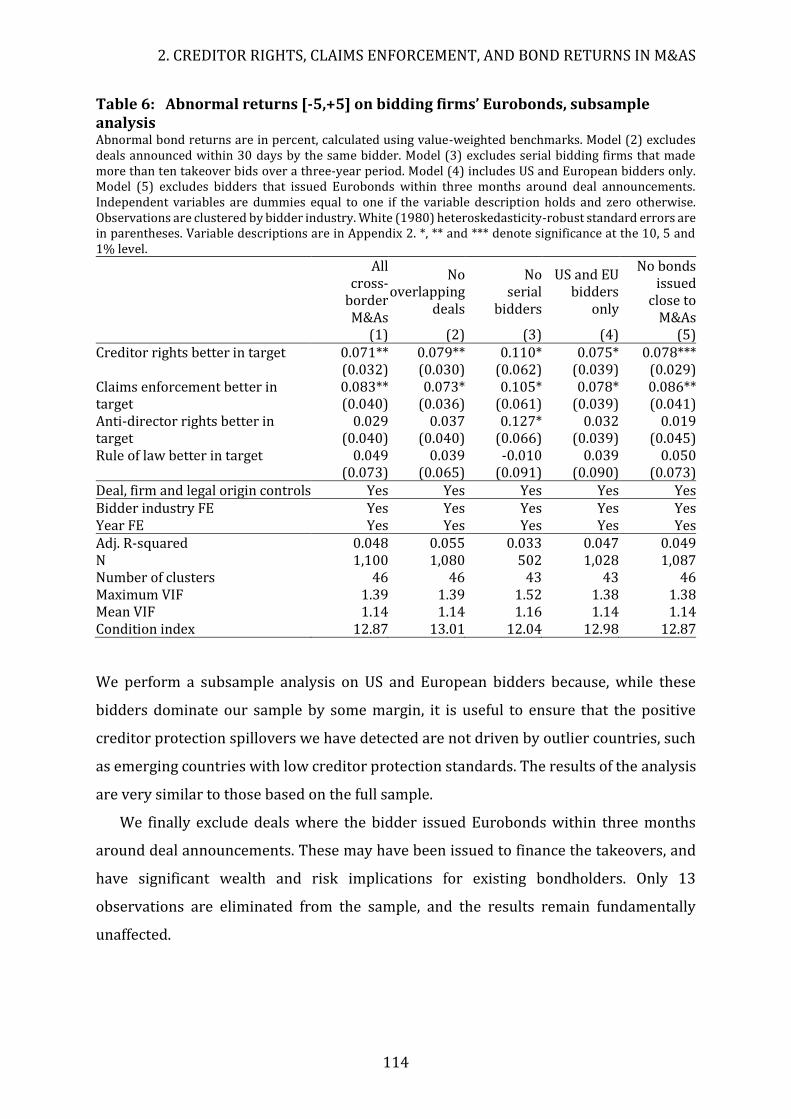
2. CREDITOR RIGHTS, CLAIMS ENFORCEMENT, AND BOND RETURNS IN M&AS
114
Table 6: Abnormal returns [-5,+5] on bidding firms’ Eurobonds, subsample analysis Abnormal bond returns are in percent, calculated using value-weighted benchmarks. Model (2) excludes deals announced within 30 days by the same bidder. Model (3) excludes serial bidding firms that made more than ten takeover bids over a three-year period. Model (4) includes US and European bidders only. Model (5) excludes bidders that issued Eurobonds within three months around deal announcements. Independent variables are dummies equal to one if the variable description holds and zero otherwise. Observations are clustered by bidder industry. White (1980) heteroskedasticity-robust standard errors are in parentheses. Variable descriptions are in Appendix 2. *, ** and *** denote significance at the 10, 5 and 1% level.
All cross-
border M&As
No overlapping
deals
No serial
bidders
US and EU bidders
only
No bonds issued
close to M&As
(1) (2) (3) (4) (5) Creditor rights better in target 0.071** 0.079** 0.110* 0.075* 0.078***
(0.032) (0.030) (0.062) (0.039) (0.029) Claims enforcement better in target
0.083** 0.073* 0.105* 0.078* 0.086** (0.040) (0.036) (0.061) (0.039) (0.041)
Anti-director rights better in target
0.029 0.037 0.127* 0.032 0.019 (0.040) (0.040) (0.066) (0.039) (0.045)
Rule of law better in target 0.049 0.039 -0.010 0.039 0.050 (0.073) (0.065) (0.091) (0.090) (0.073)
Deal, firm and legal origin controls Yes Yes Yes Yes Yes Bidder industry FE Yes Yes Yes Yes Yes Year FE Yes Yes Yes Yes Yes Adj. R-squared 0.048 0.055 0.033 0.047 0.049 N 1,100 1,080 502 1,028 1,087 Number of clusters 46 46 43 43 46 Maximum VIF 1.39 1.39 1.52 1.38 1.38 Mean VIF 1.14 1.14 1.16 1.14 1.14 Condition index 12.87 13.01 12.04 12.98 12.87
We perform a subsample analysis on US and European bidders because, while these
bidders dominate our sample by some margin, it is useful to ensure that the positive
creditor protection spillovers we have detected are not driven by outlier countries, such
as emerging countries with low creditor protection standards. The results of the analysis
are very similar to those based on the full sample.
We finally exclude deals where the bidder issued Eurobonds within three months
around deal announcements. These may have been issued to finance the takeovers, and
have significant wealth and risk implications for existing bondholders. Only 13
observations are eliminated from the sample, and the results remain fundamentally
unaffected.
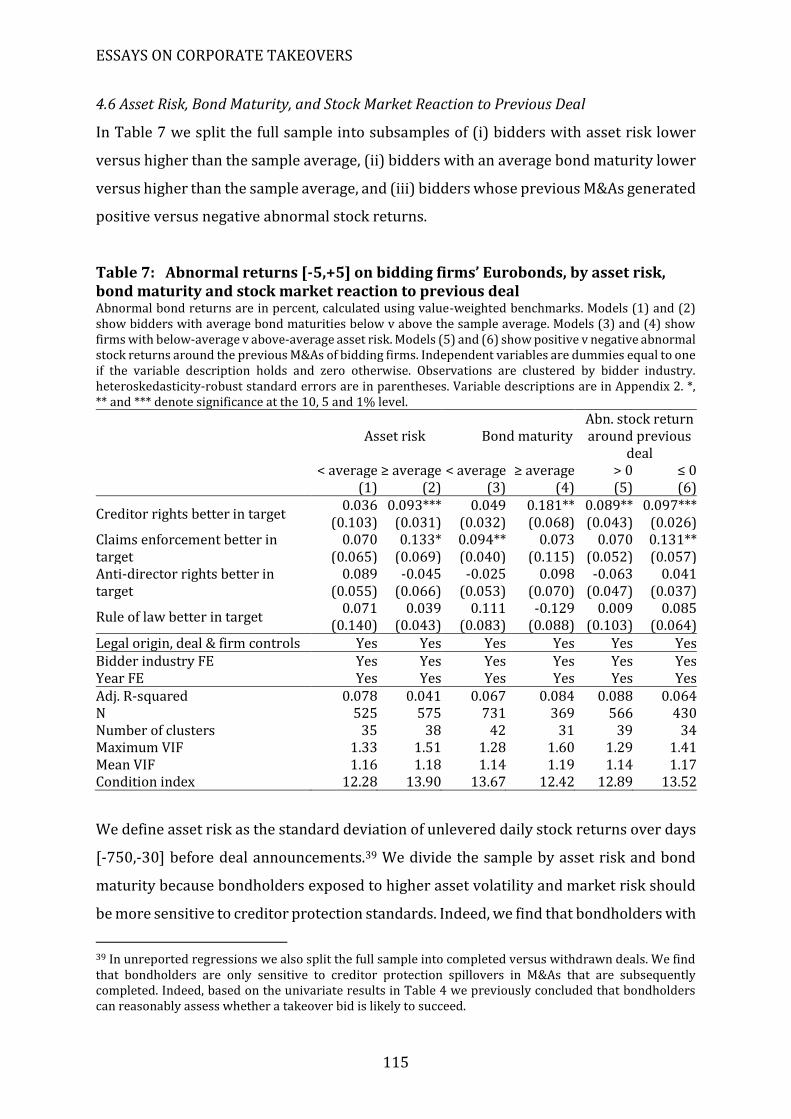
ESSAYS ON CORPORATE TAKEOVERS
115
4.6 Asset Risk, Bond Maturity, and Stock Market Reaction to Previous Deal
In Table 7 we split the full sample into subsamples of (i) bidders with asset risk lower
versus higher than the sample average, (ii) bidders with an average bond maturity lower
versus higher than the sample average, and (iii) bidders whose previous M&As generated
positive versus negative abnormal stock returns.
Table 7: Abnormal returns [-5,+5] on bidding firms’ Eurobonds, by asset risk, bond maturity and stock market reaction to previous deal Abnormal bond returns are in percent, calculated using value-weighted benchmarks. Models (1) and (2) show bidders with average bond maturities below v above the sample average. Models (3) and (4) show firms with below-average v above-average asset risk. Models (5) and (6) show positive v negative abnormal stock returns around the previous M&As of bidding firms. Independent variables are dummies equal to one if the variable description holds and zero otherwise. Observations are clustered by bidder industry. heteroskedasticity-robust standard errors are in parentheses. Variable descriptions are in Appendix 2. *, ** and *** denote significance at the 10, 5 and 1% level.
Asset risk Bond maturity
Abn. stock return around previous
deal < average ≥ average < average ≥ average > 0 ≤ 0
(1) (2) (3) (4) (5) (6)
Creditor rights better in target 0.036 0.093*** 0.049 0.181** 0.089** 0.097***
(0.103) (0.031) (0.032) (0.068) (0.043) (0.026) Claims enforcement better in target
0.070 0.133* 0.094** 0.073 0.070 0.131** (0.065) (0.069) (0.040) (0.115) (0.052) (0.057)
Anti-director rights better in target
0.089 -0.045 -0.025 0.098 -0.063 0.041 (0.055) (0.066) (0.053) (0.070) (0.047) (0.037)
Rule of law better in target 0.071 0.039 0.111 -0.129 0.009 0.085
(0.140) (0.043) (0.083) (0.088) (0.103) (0.064) Legal origin, deal & firm controls Yes Yes Yes Yes Yes Yes Bidder industry FE Yes Yes Yes Yes Yes Yes Year FE Yes Yes Yes Yes Yes Yes Adj. R-squared 0.078 0.041 0.067 0.084 0.088 0.064 N 525 575 731 369 566 430 Number of clusters 35 38 42 31 39 34 Maximum VIF 1.33 1.51 1.28 1.60 1.29 1.41 Mean VIF 1.16 1.18 1.14 1.19 1.14 1.17 Condition index 12.28 13.90 13.67 12.42 12.89 13.52
We define asset risk as the standard deviation of unlevered daily stock returns over days
[-750,-30] before deal announcements.39 We divide the sample by asset risk and bond
maturity because bondholders exposed to higher asset volatility and market risk should
be more sensitive to creditor protection standards. Indeed, we find that bondholders with
39 In unreported regressions we also split the full sample into completed versus withdrawn deals. We find that bondholders are only sensitive to creditor protection spillovers in M&As that are subsequently completed. Indeed, based on the univariate results in Table 4 we previously concluded that bondholders can reasonably assess whether a takeover bid is likely to succeed.
2. CREDITOR RIGHTS, CLAIMS ENFORCEMENT, AND BOND RETURNS IN M&AS
116
greater asset risk exposures respond more strongly to positive spillovers in creditor
protection. For high asset risk bondholders, the abnormal returns are higher by 0.09%
when the target country has strong creditor rights, and 0.13% when it has more efficient
claims enforcement. For low asset risk bondholders, the return increases are both smaller
and insignificant.
The subsamples partitioned by bond maturity also show evidence for the greater
sensitivity of bondholders exposed to higher market risk. For M&As where the target
country has strong creditor rights, the increase in the abnormal returns is hugely
significant at 0.18% on above-average maturity bonds but insignificant at 0.05% on
below-average maturity bonds. The same result does not hold for the quality of claims
enforcement, with the increase in the returns similar in size, but insignificant for above-
maturity bonds while significant for below-maturity bonds.
We partition bidders by the abnormal stock returns on their previous M&As because
we expect bondholders to be more sensitive to creditor protection standards after earlier
transactions badly received by the market. This is because bidding firm performance has
been shown to consistently deteriorate deal by deal, with bidders actually inching closer
and closer to financial distress (Laamanen and Keil, 2008). We confirm that bidder
bondholders are more sensitive to creditor protection spillovers after ill-received M&As.
If the bidder’s previous deal generated negative abnormal stock returns, the abnormal
bond returns around its current transaction increase by 0.10% for stronger creditor
rights and 0.13% for better claims enforcement in the target country. If the abnormal
stock returns were previously positive, the increases in the current abnormal bond
returns are smaller and only significant for stronger creditor rights.
4.7 Further Robustness Tests
We now perform a variety of additional robustness tests to corroborate our earlier
results and provide further insight into positive creditor protection spillovers. 40 In Table
8, we provide evidence that exogenous shocks in creditor protection generate positive
spillover effects. We study the 49 cross-border M&As involving Italian target firms, and
40 We perform a range of robustness tests even beyond those reported in the paper. Notably, to reduce concerns about endogeneity and selection bias, we use a nearest-neighbor and propensity score matching approach to match bidders with targets. Using a nearest-neighbor estimator, the treatment effects in terms of the abnormal bond returns are 0.08% and 0.19% for creditor rights and claims enforcement, respectively. The treatment effects using propensity score matching are even higher at 0.11% and 0.28%, respectively.
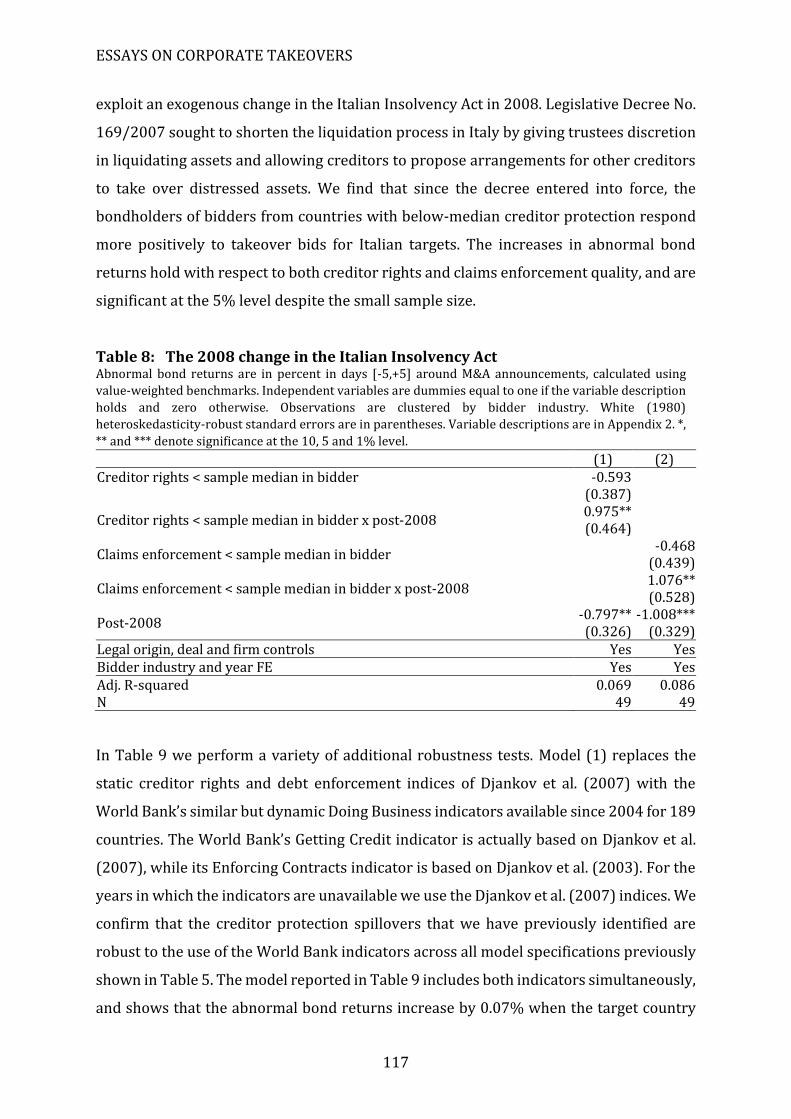
ESSAYS ON CORPORATE TAKEOVERS
117
exploit an exogenous change in the Italian Insolvency Act in 2008. Legislative Decree No.
169/2007 sought to shorten the liquidation process in Italy by giving trustees discretion
in liquidating assets and allowing creditors to propose arrangements for other creditors
to take over distressed assets. We find that since the decree entered into force, the
bondholders of bidders from countries with below-median creditor protection respond
more positively to takeover bids for Italian targets. The increases in abnormal bond
returns hold with respect to both creditor rights and claims enforcement quality, and are
significant at the 5% level despite the small sample size.
Table 8: The 2008 change in the Italian Insolvency Act Abnormal bond returns are in percent in days [-5,+5] around M&A announcements, calculated using
value-weighted benchmarks. Independent variables are dummies equal to one if the variable description
holds and zero otherwise. Observations are clustered by bidder industry. White (1980)
heteroskedasticity-robust standard errors are in parentheses. Variable descriptions are in Appendix 2. *,
** and *** denote significance at the 10, 5 and 1% level.
(1) (2) Creditor rights < sample median in bidder
-0.593 (0.387)
Creditor rights < sample median in bidder x post-2008 0.975** (0.464)
Claims enforcement < sample median in bidder -0.468 (0.439)
Claims enforcement < sample median in bidder x post-2008 1.076** (0.528)
Post-2008 -0.797** -1.008*** (0.326) (0.329)
Legal origin, deal and firm controls Yes Yes Bidder industry and year FE Yes Yes Adj. R-squared 0.069 0.086 N 49 49
In Table 9 we perform a variety of additional robustness tests. Model (1) replaces the
static creditor rights and debt enforcement indices of Djankov et al. (2007) with the
World Bank’s similar but dynamic Doing Business indicators available since 2004 for 189
countries. The World Bank’s Getting Credit indicator is actually based on Djankov et al.
(2007), while its Enforcing Contracts indicator is based on Djankov et al. (2003). For the
years in which the indicators are unavailable we use the Djankov et al. (2007) indices. We
confirm that the creditor protection spillovers that we have previously identified are
robust to the use of the World Bank indicators across all model specifications previously
shown in Table 5. The model reported in Table 9 includes both indicators simultaneously,
and shows that the abnormal bond returns increase by 0.07% when the target country
2. CREDITOR RIGHTS, CLAIMS ENFORCEMENT, AND BOND RETURNS IN M&AS
118
offers stronger creditor protection as measured by both Getting Credit and Enforcing
Contracts.
Model (2) examines the subsample of only those 376 deals where accounting data are
available for the target firms. We have previously used mean imputation to fill accounting
data unavailable from known sources for 724 privately held targets. While this has
enabled us to keep these observations in the full sample, the use of non-firm specific
information affects the explanatory power of our regressions. Indeed, the regression’s R-
squared is close to three times as high as in the previous regressions. The abnormal bond
returns are now also 0.14% higher when creditor rights are stronger in the target
jurisdiction. The coefficient on the claims enforcement variable is insignificant in the
model, but it is significant in unreported regressions that omit the creditor rights index.
Models (3) and (4) divide the sample into partial acquisitions of majority control and
full takeovers of 100% equity. We expect that bondholders are more responsive to
creditor protection spillovers in full takeovers, as these better integrate the target into
the bidder and create greater scope for target country regulation to affect managerial
behavior and risk-taking. Indeed, the increase in the abnormal bond returns is only
significant for full takeovers, at 0.10% and 0.07% if the target jurisdiction offers stronger
creditor rights and better claims enforcement, respectively.
Models (5) to (7) confirm the robustness of our findings to three more alternative
model specifications. Model (5) includes controls for the bidding firm’s credit rating and
average bond duration. Model (6) controls for both bidder industry and target industry
fixed effects simultaneously. The regressions show that our results are fundamentally
unchanged. Model (7) controls for fixed effects at the level of the bidding firm rather than
bidder industry. The objective of this robustness test is to control for any time-invariant
firm-level omitted variables and to reduce selection bias concerns. In the model, the effect
of creditor rights on the abnormal bond returns remains significant, both statistically and
economically, at 0.08%, while the effect of claims enforcement becomes smaller and
insignificant.
In Model (8), we study an expanded sample that includes both domestic and cross-
border M&As by the 350 Eurobond issuers contained in our sample of 1,194 Eurobonds.
During the selection of our sample we identified 781 domestic deals involving these firms
as bidders, mostly for the US (187 deals), the UK (152), France (109), Italy (74), the
Netherlands (50) and Germany (45). The combined sample brings the total number of
ESSAYS ON CORPORATE TAKEOVERS
119
M&As to 1,881. As expected, the inclusion of domestic M&As has no material impact on
the results, since these deals do not generate creditor protection spillovers.
The final Model (9) tests our earlier conjecture that cross-border M&As generate
positive but not negative spillovers in creditor protection. We did not expect negative
spillovers to occur because creditors retain their ability to litigate in jurisdictions that
their firm already operates in. To check for any negative spillovers we create new dummy
variables for each creditor protection measure, which equal one if the bidder country
offers above-median (strong) creditor protection and the target country offers below-
median (weak) creditor protection. We find no evidence of negative spillovers across any
of the model specifications previously shown in Table 5. In the model reported in Table
9, each creditor protection variable has a negative sign but is statistically insignificant.41
41 We also perform a similar analysis for our sample of 26 cross-border M&As involving target firms with outstanding Eurobonds. The results again show no evidence of negative spillovers.
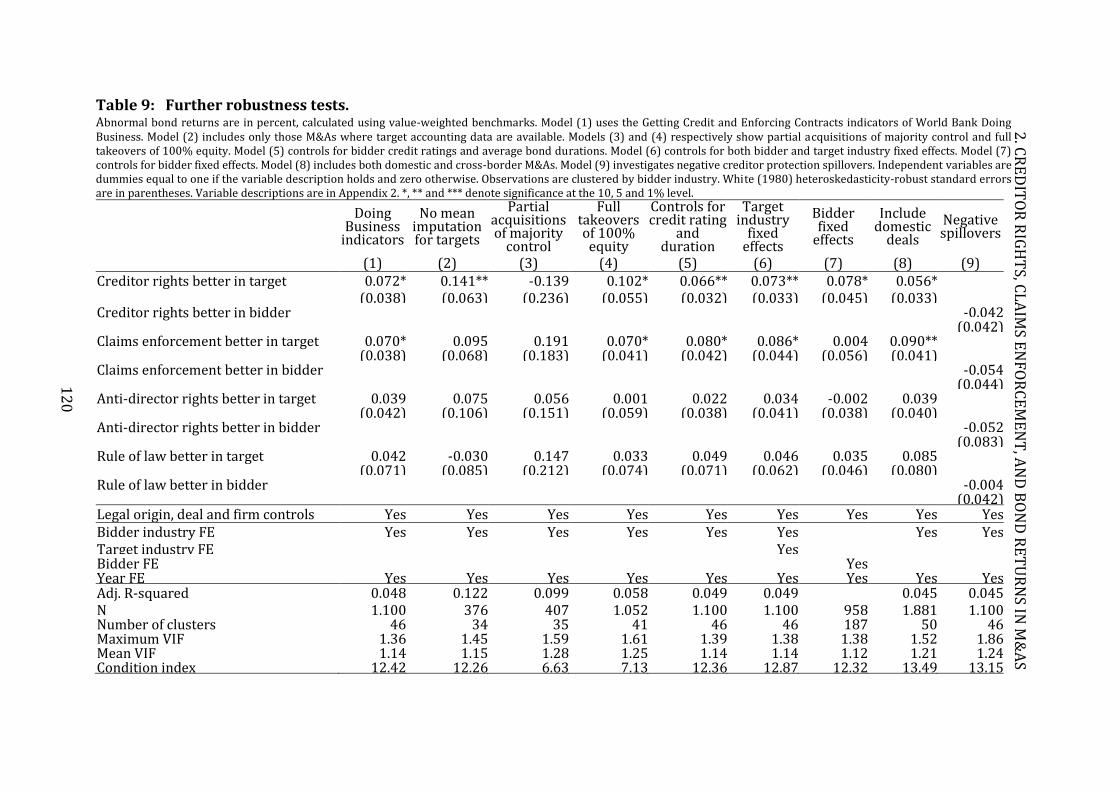
Table 9: Further robustness tests. Abnormal bond returns are in percent, calculated using value-weighted benchmarks. Model (1) uses the Getting Credit and Enforcing Contracts indicators of World Bank Doing Business. Model (2) includes only those M&As where target accounting data are available. Models (3) and (4) respectively show partial acquisitions of majority control and full takeovers of 100% equity. Model (5) controls for bidder credit ratings and average bond durations. Model (6) controls for both bidder and target industry fixed effects. Model (7) controls for bidder fixed effects. Model (8) includes both domestic and cross-border M&As. Model (9) investigates negative creditor protection spillovers. Independent variables are dummies equal to one if the variable description holds and zero otherwise. Observations are clustered by bidder industry. White (1980) heteroskedasticity-robust standard errors are in parentheses. Variable descriptions are in Appendix 2. *, ** and *** denote significance at the 10, 5 and 1% level.
Doing
Business indicators
No mean imputation for targets
Partial acquisitions of majority
control
Full takeovers of 100%
equity
Controls for credit rating
and duration
Target industry
fixed effects
Bidder fixed
effects
Include domestic
deals
Negative spillovers
(1) (2) (3) (4) (5) (6) (7) (8) (9) Creditor rights better in target 0.072* 0.141** -0.139 0.102* 0.066** 0.073** 0.078* 0.056*
(0.038) (0.063) (0.236) (0.055) (0.032) (0.033) (0.045) (0.033) Creditor rights better in bidder -0.042
(0.042) Claims enforcement better in target 0.070* 0.095 0.191 0.070* 0.080* 0.086* 0.004 0.090**
(0.038) (0.068) (0.183) (0.041) (0.042) (0.044) (0.056) (0.041) Claims enforcement better in bidder -0.054
(0.044) Anti-director rights better in target 0.039 0.075 0.056 0.001 0.022 0.034 -0.002 0.039
(0.042) (0.106) (0.151) (0.059) (0.038) (0.041) (0.038) (0.040) Anti-director rights better in bidder -0.052
(0.083) Rule of law better in target 0.042 -0.030 0.147 0.033 0.049 0.046 0.035 0.085
(0.071) (0.085) (0.212) (0.074) (0.071) (0.062) (0.046) (0.080) Rule of law better in bidder -0.004
(0.042) Legal origin, deal and firm controls Yes Yes Yes Yes Yes Yes Yes Yes Yes Bidder industry FE Yes Yes Yes Yes Yes Yes Yes Yes Target industry FE Yes Bidder FE Yes Year FE Yes Yes Yes Yes Yes Yes Yes Yes Yes Adj. R-squared 0.048 0.122 0.099 0.058 0.049 0.049 0.045 0.045 N 1,100 376 407 1,052 1,100 1,100 958 1,881 1,100 Number of clusters 46 34 35 41 46 46 187 50 46 Maximum VIF 1.36 1.45 1.59 1.61 1.39 1.38 1.38 1.52 1.86 Mean VIF 1.14 1.15 1.28 1.25 1.14 1.14 1.12 1.21 1.24 Condition index 12.42 12.26 6.63 7.13 12.36 12.87 12.32 13.49 13.15
12
0
2. C
RE
DIT
OR
RIG
HT
S, CL
AIM
S EN
FO
RC
EM
EN
T, A
ND
BO
ND
RE
TU
RN
S IN M
&A
S
ESSAYS ON CORPORATE TAKEOVERS
121
5. Conclusion
This paper has shown that bond performance around cross-border M&As is affected by
country-level creditor protection rules and regulations. We have studied a large global
sample of 1,100 cross-border deals involving non-financial firms, investigated returns on
Eurobonds rather than domestic bonds, and employed a robust matching portfolio
method with hand-constructed pricing benchmarks. The use of Eurobonds rather than
domestic bonds is more appropriate for international bond market event studies and has
been a crucial part of our identification strategy.
Previous studies have often argued that there are limitations to functional spillovers
in creditor protection as a result of cross-border M&As. We have shown that positive
spillovers both occur and are economically significant. These results are stronger for
firms with higher asset volatility, longer maturity bonds, and a higher likelihood of
financial distress, and are robust to a variety of robustness tests. We have also discussed
in great institutional detail how the spillover mechanism works. Exposure to a more
creditor-friendly jurisdiction can subject management to an increased threat of
insolvency proceedings and more serious consequences if the firm goes into financial
distress. More importantly, jurisdictional cooperation in multinational insolvencies blurs
national boundaries in creditor protection, and actually creates scope for insolvency
arbitrage by firms, governments, and creditors alike.
The findings and institutional discussions presented in this paper fit nicely into the
international business literature on cross-border M&As. Our results provide further
evidence that the economic impact and implications of cross-border M&As should not be
underestimated. The fact that international diversification allows creditors to arbitrage
across legal systems is rarely discussed outside the legal literature and is not widely
known. Corporate managers engaging in cross-border M&As should be aware of the
issues raised here because should their firm go into financial distress, they may find that
the relative bargaining power of their creditors and other constituencies with respect to
insolvency proceedings is quite different from what they expected. At the same time, it is
important for the international business literature to further consider the effects of
country-level differences in national regulation on the behavior and operations of
multinational firms.
2. CREDITOR RIGHTS, CLAIMS ENFORCEMENT, AND BOND RETURNS IN M&AS
122
References
Ahern, K. R., Daminelli, D., & Fracassi, C. 2015. Lost in translation? The effect of cultural
values on mergers around the world. Journal of Financial Economics, 117(1): 165-189.
Albuquerque, R. A., Ferreira, M.A., Marques, L.B., & Matos, P.P. 2014. International
corporate governance spillovers: Evidence from cross-border mergers and
acquisitions. European Corporate Governance Institute (ECGI) Finance Working
Paper No. 390/2014.
Alimov, A. 2015. Labor market regulations and cross-border mergers and acquisitions.
Journal of International Business Studies, 46(8): 984-1009.
Aybar, B., & Ficici, A. 2009. Cross-border acquisitions and firm value: An analysis of
emerging-market multinationals. Journal of International Business Studies, 40(8):
1317-1338.
Aybar, B., & Thanakijsombat, T. 2015. Financing decisions and gains from cross-border
acquisitions by emerging-market acquirers. Emerging Markets Review, 24(C): 69-80.
Becht, M., Mayer, C., & Wagner, H. 2008. Where do firms incorporate? Deregulation and
the cost of entry. Journal of Corporate Finance, 14(3): 241-256.
Bessembinder, H., Kahle, K., Maxwell, W., & Xu, D. 2009. Measuring abnormal bond
performance. Review of Financial Studies, 22(10): 4220-4258
Billett, M. T., King, T.D., & Mauer, D.C. 2004. Bondholder wealth effects in mergers and
acquisitions: New evidence from the 1980s and 1990s. Journal of Finance, 59(1): 107-
135.
BIS (Bank for International Settlements). 2002. Insolvency arrangements and contract
enforceability: Report of the Contact Group on the Legal and Institutional
Underpinnings of the International Financial System. Basel, Switzerland: BIS.
Bodnaruk, A., & Rossi, M. 2016. Dual ownership, returns, and voting in mergers. Journal
of Financial Economics, 120(1): 58-80.
Boubakri, N., El Ghoul, S., & Saffar, W. 2015. Firm growth and political institutions. Journal
of Multinational Financial Management, 31(C): 104-125
Brown, S., & Warner, J. 1980. Measuring security price performance. Journal of Financial
Economics, 8(3): 205-258.
Cao, J., Cumming, D., Qian, M., & Wang, X. 2015. Cross-border LBOs. Journal of Banking and
Finance, 50(C): 69-80.
ESSAYS ON CORPORATE TAKEOVERS
123
Chava, S., Livdan, D., & Purnanandam, A. 2009. Do shareholder rights affect the cost of
bank loans? Review of Financial Studies, 22(8): 2973-3004.
Choi, S., B. Francis, & Hasan, I. 2010. Cross-border bank M&As and risk: Evidence from
the bond market. Journal of Money, Credit, and Banking, 42(4): 615-645.
Clougherty, J.A., Gugler, K., Sorgard, L., & Szucs, F.W. 2014. Cross-border mergers and
domestic-firm wages: Integrating “spillover effects” and “bargaining effects”. Journal
of International Business Studies, 45(4): 450-470.
Davydenko, S., & Franks, J. 2008. Do bankruptcy codes matter? A study of defaults in
France, Germany and the UK. Journal of Finance, 63(2): 565-608.
Djankov, S., LaPorta, R., Lopez-de-Silanes, F., & Shleifer, A. 2003. Courts. Journal of Political
Economy, 118(2): 453-517.
Djankov, S., McLiesh, C., & Shleifer, A. 2007. Private credit in 129 countries. Journal of
Financial Economics, 84(2): 299-329.
Djankov, S., La Porta, R., Lopez-de-Silanes, F., & Shleifer, A. 2008. The law and economics
of self-dealing. Journal of Financial Economics, 88(3): 430-465.
Doidge, C., Karolyi, A., & Stulz, R. 2007. Why do countries matter so much for corporate
governance?” Journal of Financial Economics, 86(1): 1-39.
Doukas, J. & Kan, O. 2006, Does global diversification destroy firm value? Journal of
International Business Studies, 37(3): 352-371.
Ederington, L., Guan, W., & Yang, L. 2015. Bond market event study methodology. Journal
of Banking and Finance, 58: 281-293.
Edwards, A.K., Harris, L.E., & Piwowar, M.S. 2007. Corporate bond market transaction
costs and transparency, Journal of Finance, 62(3): 1421-1451.
Erel, I., Liao, R., & Weisbach, M. 2012. Determinants of cross-border mergers and
acquisitions. Journal of Finance, 67(3): 1045-1082.
Faccio, M., McConnell, J., & Stolin, D. 2006. Returns to acquirers of listed and unlisted
targets. Journal of Financial and Quantitative Analysis, 41(1): 197-220.
Francis, B. B., Hasan, I., John, K., & Waisman, M. 2010. The effect of state antitakeover laws
on the firm’s bondholders. Journal of Financial Economics, 96(1): 127-154.
Jandik, T., & Kalin, R. 2009. Legal systems, information asymmetry, and firm boundaries:
Cross-border mergers, joint ventures, or strategic alliances. Journal of International
Business Studies, 40(4): 578-599.
2. CREDITOR RIGHTS, CLAIMS ENFORCEMENT, AND BOND RETURNS IN M&AS
124
Jiang, W., Li, K., & Shao, P. 2010. When shareholders are creditors: Effects of the
simultaneous holding of equity and debt by non-commercial banking institutions.
Review of Financial Studies, 23(10): 3595-3637.
Jory, S.R. & Ngo, T.N., 2014. Cross-border acquisitions of state-owned enterprises. Journal
of International Business Studies, 45(9): 1096-1114.
La Porta, R., Lopez-de-Silanes, F., Shleifer, A., & Vishny, R. 1998. Law and finance. Journal
of Political Economy, 106(6): 1113-1155.
La Porta, R., Lopez-de-Silanes, F., Shleifer, A., & Vishny, R. 2000. Investor protection and
corporate governance. Journal of Financial Economics, 58(1-2): 3-27.
Laamanen, T., & Keil, T. 2008. Performance of serial acquirers: Toward an acquisition
program perspective. Strategic Management Journal, 29(6): 663-672.
Lebedev, S., Peng, M.W., Xie, E., & Stevens, C.E. 2015. Mergers and acquisitions in and out
of emerging economies. Journal of World Business, 50(4): 651-662.
Li, J., Li, P., & Wang, B. 2016. Do cross-border acquisitions create value? Evidence from
overseas acquisitions by Chinese firms. International Business Review, 25(2): 471-483.
Loughran, T., & Vijh, A. 1997. Do long-term shareholders benefit from corporate
acquisitions? Journal of Finance, 52(5): 1765-1790.
Martynova, M., & Renneboog, L. 2008. Spillover of corporate governance standards in
cross-border mergers and acquisitions. Journal of Corporate Finance, 14(3): 200-223.
Miller, D.P., & Reisel, N. 2012. Do country-level investor protections affect security-level
contract design? Evidence from foreign bond covenants. Review of Financial Studies,
25(2): 408-438.
Pereira da Silva, P., Vieira, I., & Vieira, C. 2015. M&A operations: Further evidence of
informed trading in the CDS market. Journal of Multinational Financial Management,
32-33: 116-130.
Qi Y., & Wald, J. 2008. State laws and debt covenants. Journal of Law and Economics, 51(1):
179-207.
Schwert, G. 2000. Hostility in takeovers: In the eyes of the beholder? Journal of Finance,
55(6): 2599-2640.
Sevic, A., & Brawn, D. 2015. Do demographic changes matter? A cross-country
perspective. Journal of Multinational Financial Management, 30(C): 36-61.
Servaes, J., & Tamayo, A. 2014. How do industry peers respond to control threats?
Management Science, 60(2): 380-399.
ESSAYS ON CORPORATE TAKEOVERS
125
Shimizu, K., Hitt, M.A., Vaidyanath, D., & Pisano, V. 2004. Theoretical foundations of cross-
border mergers and acquisitions: A review of current research and recommendations
for the future. Journal of International Management, 10(3): 307-353.
Spamann, H. 2010. The “Antidirector Rights Index” revisited. Review of Financial Studies,
23(2): 467-486.
Starks, L.T., & Wei, K.D. 2013. Cross-border mergers and differences in corporate
governance. International Review of Finance, 13(3): 265–297.
White, H. 1980. A heteroskedasticity-consistent covariance matrix estimator and a direct
test for heteroskedasticity. Econometrica, 48(4): 817-38.
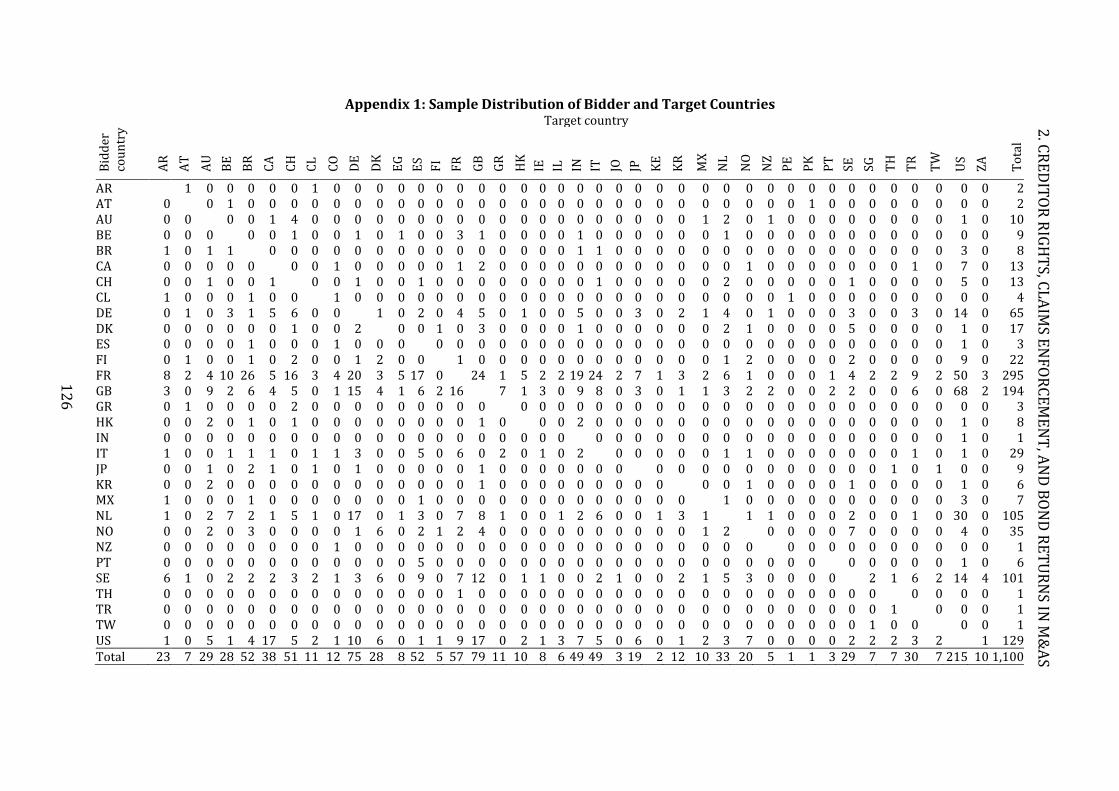
Appendix 1: Sample Distribution of Bidder and Target Countries B
idd
er
cou
ntr
y Target country
AR
AT
AU
BE
BR
CA
CH
CL
CO
DE
DK
EG
ES
FI
FR
GB
GR
HK
IE
IL
IN
IT
JO
JP
KE
KR
MX
NL
NO
NZ
PE
PK
PT
SE
SG
TH
TR
TW
US
ZA
To
tal
AR 1 0 0 0 0 0 1 0 0 0 0 0 0 0 0 0 0 0 0 0 0 0 0 0 0 0 0 0 0 0 0 0 0 0 0 0 0 0 0 2 AT 0 0 1 0 0 0 0 0 0 0 0 0 0 0 0 0 0 0 0 0 0 0 0 0 0 0 0 0 0 0 1 0 0 0 0 0 0 0 0 2 AU 0 0 0 0 1 4 0 0 0 0 0 0 0 0 0 0 0 0 0 0 0 0 0 0 0 1 2 0 1 0 0 0 0 0 0 0 0 1 0 10 BE 0 0 0 0 0 1 0 0 1 0 1 0 0 3 1 0 0 0 0 1 0 0 0 0 0 0 1 0 0 0 0 0 0 0 0 0 0 0 0 9 BR 1 0 1 1 0 0 0 0 0 0 0 0 0 0 0 0 0 0 0 1 1 0 0 0 0 0 0 0 0 0 0 0 0 0 0 0 0 3 0 8 CA 0 0 0 0 0 0 0 1 0 0 0 0 0 1 2 0 0 0 0 0 0 0 0 0 0 0 0 1 0 0 0 0 0 0 0 1 0 7 0 13 CH 0 0 1 0 0 1 0 0 1 0 0 1 0 0 0 0 0 0 0 0 1 0 0 0 0 0 2 0 0 0 0 0 1 0 0 0 0 5 0 13 CL 1 0 0 0 1 0 0 1 0 0 0 0 0 0 0 0 0 0 0 0 0 0 0 0 0 0 0 0 0 1 0 0 0 0 0 0 0 0 0 4 DE 0 1 0 3 1 5 6 0 0 1 0 2 0 4 5 0 1 0 0 5 0 0 3 0 2 1 4 0 1 0 0 0 3 0 0 3 0 14 0 65 DK 0 0 0 0 0 0 1 0 0 2 0 0 1 0 3 0 0 0 0 1 0 0 0 0 0 0 2 1 0 0 0 0 5 0 0 0 0 1 0 17 ES 0 0 0 0 1 0 0 0 1 0 0 0 0 0 0 0 0 0 0 0 0 0 0 0 0 0 0 0 0 0 0 0 0 0 0 0 0 1 0 3 FI 0 1 0 0 1 0 2 0 0 1 2 0 0 1 0 0 0 0 0 0 0 0 0 0 0 0 1 2 0 0 0 0 2 0 0 0 0 9 0 22 FR 8 2 4 10 26 5 16 3 4 20 3 5 17 0 24 1 5 2 2 19 24 2 7 1 3 2 6 1 0 0 0 1 4 2 2 9 2 50 3 295 GB 3 0 9 2 6 4 5 0 1 15 4 1 6 2 16 7 1 3 0 9 8 0 3 0 1 1 3 2 2 0 0 2 2 0 0 6 0 68 2 194 GR 0 1 0 0 0 0 2 0 0 0 0 0 0 0 0 0 0 0 0 0 0 0 0 0 0 0 0 0 0 0 0 0 0 0 0 0 0 0 0 3 HK 0 0 2 0 1 0 1 0 0 0 0 0 0 0 0 1 0 0 0 2 0 0 0 0 0 0 0 0 0 0 0 0 0 0 0 0 0 1 0 8 IN 0 0 0 0 0 0 0 0 0 0 0 0 0 0 0 0 0 0 0 0 0 0 0 0 0 0 0 0 0 0 0 0 0 0 0 0 0 1 0 1 IT 1 0 0 1 1 1 0 1 1 3 0 0 5 0 6 0 2 0 1 0 2 0 0 0 0 0 1 1 0 0 0 0 0 0 0 1 0 1 0 29 JP 0 0 1 0 2 1 0 1 0 1 0 0 0 0 0 1 0 0 0 0 0 0 0 0 0 0 0 0 0 0 0 0 0 0 1 0 1 0 0 9 KR 0 0 2 0 0 0 0 0 0 0 0 0 0 0 0 1 0 0 0 0 0 0 0 0 0 0 0 1 0 0 0 0 1 0 0 0 0 1 0 6 MX 1 0 0 0 1 0 0 0 0 0 0 0 1 0 0 0 0 0 0 0 0 0 0 0 0 0 1 0 0 0 0 0 0 0 0 0 0 3 0 7 NL 1 0 2 7 2 1 5 1 0 17 0 1 3 0 7 8 1 0 0 1 2 6 0 0 1 3 1 1 1 0 0 0 2 0 0 1 0 30 0 105 NO 0 0 2 0 3 0 0 0 0 1 6 0 2 1 2 4 0 0 0 0 0 0 0 0 0 0 1 2 0 0 0 0 7 0 0 0 0 4 0 35 NZ 0 0 0 0 0 0 0 0 1 0 0 0 0 0 0 0 0 0 0 0 0 0 0 0 0 0 0 0 0 0 0 0 0 0 0 0 0 0 0 1 PT 0 0 0 0 0 0 0 0 0 0 0 0 5 0 0 0 0 0 0 0 0 0 0 0 0 0 0 0 0 0 0 0 0 0 0 0 0 1 0 6 SE 6 1 0 2 2 2 3 2 1 3 6 0 9 0 7 12 0 1 1 0 0 2 1 0 0 2 1 5 3 0 0 0 0 2 1 6 2 14 4 101 TH 0 0 0 0 0 0 0 0 0 0 0 0 0 0 1 0 0 0 0 0 0 0 0 0 0 0 0 0 0 0 0 0 0 0 0 0 0 0 0 1 TR 0 0 0 0 0 0 0 0 0 0 0 0 0 0 0 0 0 0 0 0 0 0 0 0 0 0 0 0 0 0 0 0 0 0 0 1 0 0 0 1 TW 0 0 0 0 0 0 0 0 0 0 0 0 0 0 0 0 0 0 0 0 0 0 0 0 0 0 0 0 0 0 0 0 0 0 1 0 0 0 0 1 US 1 0 5 1 4 17 5 2 1 10 6 0 1 1 9 17 0 2 1 3 7 5 0 6 0 1 2 3 7 0 0 0 0 2 2 2 3 2 1 129 Total 23 7 29 28 52 38 51 11 12 75 28 8 52 5 57 79 11 10 8 6 49 49 3 19 2 12 10 33 20 5 1 1 3 29 7 7 30 7 215 10 1,100
12
6
2. C
RE
DIT
OR
RIG
HT
S, CL
AIM
S EN
FO
RC
EM
EN
T, A
ND
BO
ND
RE
TU
RN
S IN M
&A
S
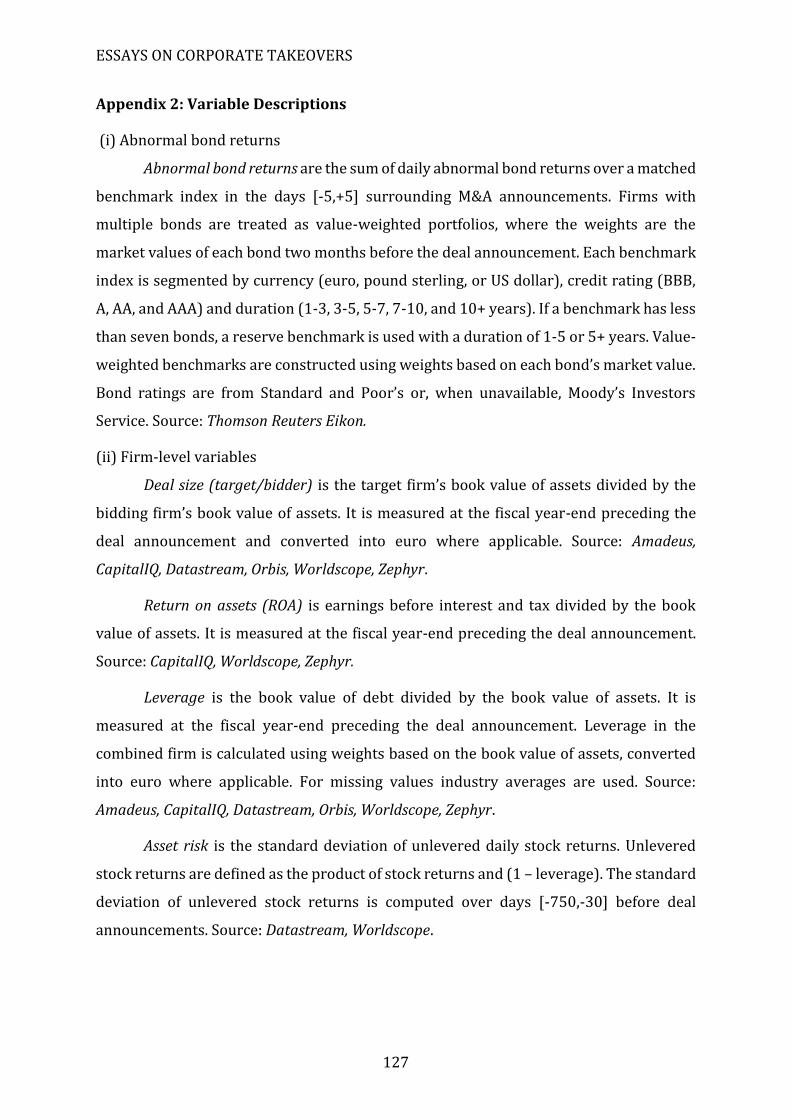
ESSAYS ON CORPORATE TAKEOVERS
127
Appendix 2: Variable Descriptions
(i) Abnormal bond returns
Abnormal bond returns are the sum of daily abnormal bond returns over a matched
benchmark index in the days [-5,+5] surrounding M&A announcements. Firms with
multiple bonds are treated as value-weighted portfolios, where the weights are the
market values of each bond two months before the deal announcement. Each benchmark
index is segmented by currency (euro, pound sterling, or US dollar), credit rating (BBB,
A, AA, and AAA) and duration (1-3, 3-5, 5-7, 7-10, and 10+ years). If a benchmark has less
than seven bonds, a reserve benchmark is used with a duration of 1-5 or 5+ years. Value-
weighted benchmarks are constructed using weights based on each bond’s market value.
Bond ratings are from Standard and Poor’s or, when unavailable, Moody’s Investors
Service. Source: Thomson Reuters Eikon.
(ii) Firm-level variables
Deal size (target/bidder) is the target firm’s book value of assets divided by the
bidding firm’s book value of assets. It is measured at the fiscal year-end preceding the
deal announcement and converted into euro where applicable. Source: Amadeus,
CapitalIQ, Datastream, Orbis, Worldscope, Zephyr.
Return on assets (ROA) is earnings before interest and tax divided by the book
value of assets. It is measured at the fiscal year-end preceding the deal announcement.
Source: CapitalIQ, Worldscope, Zephyr.
Leverage is the book value of debt divided by the book value of assets. It is
measured at the fiscal year-end preceding the deal announcement. Leverage in the
combined firm is calculated using weights based on the book value of assets, converted
into euro where applicable. For missing values industry averages are used. Source:
Amadeus, CapitalIQ, Datastream, Orbis, Worldscope, Zephyr.
Asset risk is the standard deviation of unlevered daily stock returns. Unlevered
stock returns are defined as the product of stock returns and (1 – leverage). The standard
deviation of unlevered stock returns is computed over days [-750,-30] before deal
announcements. Source: Datastream, Worldscope.
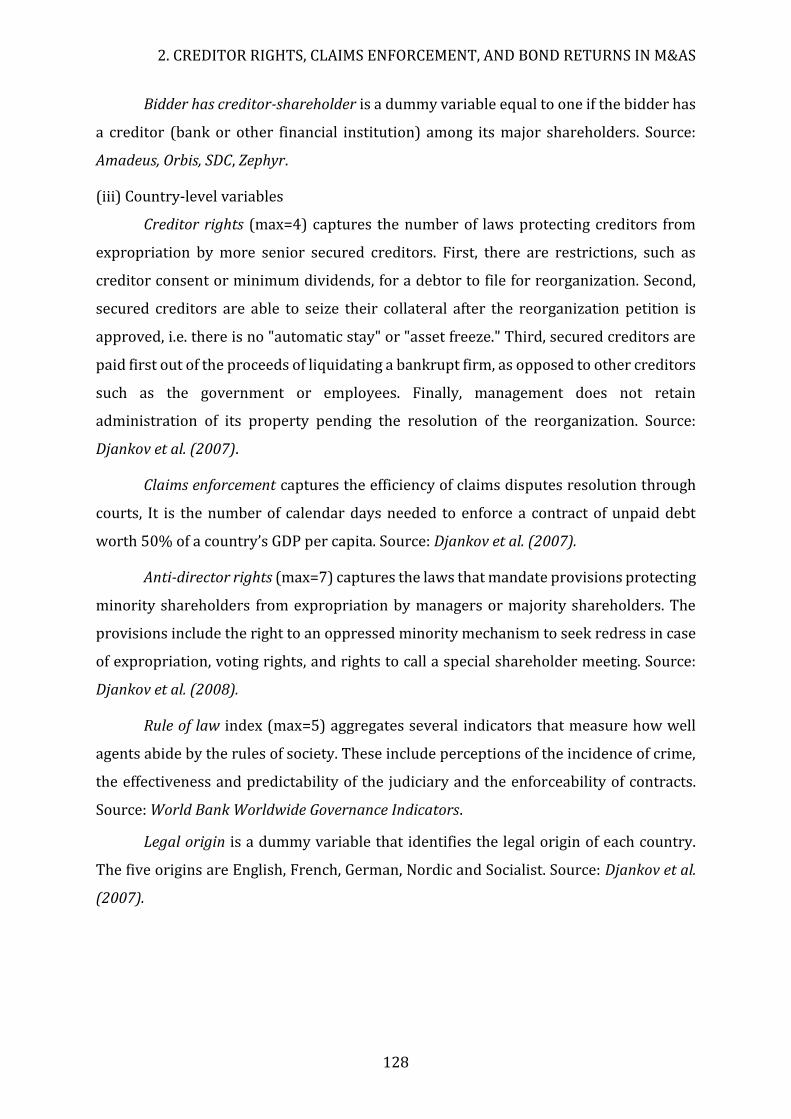
2. CREDITOR RIGHTS, CLAIMS ENFORCEMENT, AND BOND RETURNS IN M&AS
128
Bidder has creditor-shareholder is a dummy variable equal to one if the bidder has
a creditor (bank or other financial institution) among its major shareholders. Source:
Amadeus, Orbis, SDC, Zephyr.
(iii) Country-level variables
Creditor rights (max=4) captures the number of laws protecting creditors from
expropriation by more senior secured creditors. First, there are restrictions, such as
creditor consent or minimum dividends, for a debtor to file for reorganization. Second,
secured creditors are able to seize their collateral after the reorganization petition is
approved, i.e. there is no "automatic stay" or "asset freeze." Third, secured creditors are
paid first out of the proceeds of liquidating a bankrupt firm, as opposed to other creditors
such as the government or employees. Finally, management does not retain
administration of its property pending the resolution of the reorganization. Source:
Djankov et al. (2007).
Claims enforcement captures the efficiency of claims disputes resolution through
courts, It is the number of calendar days needed to enforce a contract of unpaid debt
worth 50% of a country’s GDP per capita. Source: Djankov et al. (2007).
Anti-director rights (max=7) captures the laws that mandate provisions protecting
minority shareholders from expropriation by managers or majority shareholders. The
provisions include the right to an oppressed minority mechanism to seek redress in case
of expropriation, voting rights, and rights to call a special shareholder meeting. Source:
Djankov et al. (2008).
Rule of law index (max=5) aggregates several indicators that measure how well
agents abide by the rules of society. These include perceptions of the incidence of crime,
the effectiveness and predictability of the judiciary and the enforceability of contracts.
Source: World Bank Worldwide Governance Indicators.
Legal origin is a dummy variable that identifies the legal origin of each country.
The five origins are English, French, German, Nordic and Socialist. Source: Djankov et al.
(2007).
Appendix 3: Correlation Matrix
Cre
dit
or
righ
ts
bet
ter
in t
arge
t
Cla
ims
enfo
rcem
ent
bet
ter
in t
arge
t
An
ti-d
irec
tor
righ
ts
bet
ter
in t
arge
t
Ru
le o
f la
w
bet
ter
in t
arge
t
Div
ersi
fyin
g
Succ
essf
ul
Tar
get
list
ed
Cas
h o
r m
ixed
Ten
der
off
er
Ho
stil
e
Dea
l siz
e >
med
ian
Lev
erag
e co
mb
ined
fi
rm >
bid
der
Bid
der
has
cr
edit
or-
shar
eho
lder
Bid
der
is
com
mo
n la
w
Tar
get
is
com
mo
n la
w
Creditor rights better in target 1 Claims enforcement better in target -0.012 1 Anti-director rights better in target 0.243 0.200 1 Rule of law better in target 0.323 -0.043 -0.020 1 Diversifying 0.009 -0.019 -0.070 0.049 1 Successful -0.041 -0.018 -0.007 0.033 -0.021 1 Target listed 0.032 -0.057 0.050 0.037 -0.139 -0.227 1 Cash or mixed 0.026 -0.008 -0.007 -0.007 0.022 0.021 -0.150 1 Tender offer 0.011 -0.035 -0.022 0.022 -0.007 -0.024 0.393 0.088 1 Hostile 0.040 -0.021 -0.022 0.031 -0.037 -0.046 0.106 -0.003 0.131 1 Deal size > sample median -0.015 0.004 -0.051 -0.007 -0.005 -0.077 -0.115 0.031 -0.077 0.022 1 Leverage combined firm > bidder 0.019 -0.035 0.016 0.005 0.058 0.011 -0.191 -0.045 -0.097 0.021 0.134 1 Bidder has creditor-shareholder 0.025 0.061 -0.023 0.081 -0.027 0.026 -0.029 -0.012 0.058 -0.009 -0.009 0.044 1 Bidder is common law -0.026 -0.331 -0.134 -0.085 0.096 -0.002 -0.017 0.042 0.016 0.016 0.008 -0.043 -0.003 1 Target is common law 0.010 0.033 0.183 0.179 0.062 0.023 0.004 0.021 0.007 -0.037 0.070 0.029 -0.034 0.101 1
ESSA
YS O
N C
OR
PO
RA
TE
TA
KE
OV
ER
S
12
9
3. CROSS-BORDER ACQUISITIONS AND EMPLOYEE RELATIONS
130
Chapter 3
Cross-Border Acquisitions and Employee
Relations with Hao Liang and Luc Renneboog
Abstract – Using novel firm-level data on employee relations in an international sample
of M&A deals, we find that shareholders react positively to an acquirer’s provision of
employee-friendly policies around domestic acquisitions, but negatively in cross-border
acquisitions. These effects are primarily driven by the provision of monetary incentives,
and cannot be explained by country-level labor regulations or by target-level employee
relations, and are concentrated on the acquirer’s returns rather than the target’s returns.
Our findings suggest that acquirer shareholders view treating employees well favorably,
as this can potentially reduce labor adjustment costs during a firm’s reorganization, but
they dislike such generous employment benefits in cross-border acquisitions when
uncertainties regarding post-merger integration are high.
Keywords: employee relations, labor protection, monetary incentives, takeovers, cross-
border mergers and acquisitions.
JEL Classifications: G34, M14, J2
ESSAYS ON CORPORATE TAKEOVERS
131
1. Introduction
Cross-border merger and acquisition (M&A) volume has boomed over the past 20
years—from 23% of the total deal value in 1998 to more than 50% of total value in
2016—with some individual transaction values being close to that of a small country’s
GDP.42 Cross-border acquisitions enable firms to expand their boundaries across national
borders and provide new sources of value creation resulting from cross-country
differences in product markets (DeGiovanni, 2005), regulations and governance
standards (Bris and Cabolis, 2008; Chari, Ouimet, and Tesar, 2010), taxation regimes
(Huizinga and Voget, 2009), currencies (Erel, Liao, and Weisbach, 2012), industry
specialization (Frésard, Hege, and Phillips, 2017), and degree of development of the
financial system (Alquist, Mukherjee, and Tesar, 2014). However, cross-country takeover
also induce significant frictions that reduce merger gains. Indeed, recent studies have
attempted to explain the marked differences in merger gains between domestic and
cross-border takeovers using factors such as language and cultural distance (Ahern,
Daminelli, and Fracassi, 2015), economic nationalism (Dinc and Erel, 2013), geography
and bilateral trade (Erel et al., 2012), investor protection and corporate governance
(Rossi and Volpin, 2004; Bris and Cabolis, 2008), as well as government ownership
(Karolyi and Liao, 2017). Despite these frictions and the related negative announcement
returns to the acquirers, companies worldwide are increasingly acquiring abroad.
A widely recognized yet largely unexplored friction related to cross-border
acquisitions is the significant risks and difficulties in post-merger integration, especially
with regard to integration of employees (e.g., Datta, 1991). Employees are crucial to the
firm’s performance: they are involved in the firm’s daily operations and have contractual
claims on the company in the form of salaries and bonuses. Their relations with the firm
are believed to be one of the most important determinants of returns around M&As, as
M&As involve restructuring, integrating, and reconfiguring the firm’s workforce with the
aim of reducing costs and profiting from larger economies of scale and scope
(Maksimovic, Phillips, and Prabhala, 2011). A growing literature on employees and labor
markets as a source of friction focuses on how country- or state-level employment
protection regulations and union forces can affect merger synergies and the efficiency of
42 For example, the 2016 deal between the German drug company Bayer and US-based Monsanto was valued at $66 billion, which Bayer clinched with improved $66 billion bid, exceeding the 2015 GDP of Luxembourg ($57.8 billion), Source: Reuters, Sep. 15th 2016. http://www.reuters.com/article/us-monsanto-m-a-bayer-deal-idUSKCN11K128.
3. CROSS-BORDER ACQUISITIONS AND EMPLOYEE RELATIONS
132
integration, concluding that stronger employment protection reduces takeover activity
and merger synergies (John, Knyazeva, and Knyazeva, 2015; Tian and Wang, 2016;
Dessaint, Golubov, and Volpin, 2017; although the opposite is found by Alimov (2015)).
However, labor market regulation and employment protection can only set the lower
bound regarding the treatment of employees in the context of M&As, and do not paint a
complete picture of the supply and the demand for employee welfare at the firm level.
Arguably, a more significant part of the labor effect may result from the firm’s own
investment in implementing employment policies and incentivizing employees, over and
beyond the regulatory requirements.
Motivated by the increasing recognition of labor and human capital’s importance in
M&As and the lack of firm-level evidence on employee relations, this paper focuses on
how a firm’s treatment of its employees—voluntary policies and practices that aim to
enhance a firm’s human capital and employee relations by providing higher
compensation and job security—differentially affects value generation in domestic and
cross-border takeovers. Although some recent studies investigate firm-level labor
relations (Pagano and Volpin, 2005; Cronqvist et al., 2009; Masulis, Wang, and Xie, 2016),
they mostly focus on the agency aspects of investing in employee relations i.e., the
detrimental effect of manager-employee alliances on shareholder value. Moreover, they
are limited to samples of US firms, in which the roles of labor during the reorganization
process are different from the rest of the world (Atanassov and Kim, 2009). To date, there
is little evidence on the effect of firms’ voluntary investment in employee relations on
deal performance on a global scale.
The lack of research is partially due to the lack of data with detailed information on
firm-level investment in employee relations, especially in a multi-country context. We
utilize a newly assembled global dataset on firm-level corporate investment in employee-
related issues to investigate how cross-firm heterogeneity in employee relations (that is
distinct from country-level labor regulations) translates into short- and long-run firm
performance when conducting domestic and foreign acquisitions. Underlying our
empirical investigation is the recognition that acquirers usually experience negative
market reactions due to market frictions such as overbidding (Eckbo, 2009) and
expensive labor adjustment costs (Antanassov and Kim, 2009; Ghaly, Dang, and
ESSAYS ON CORPORATE TAKEOVERS
133
Stathopoulos, 2017),43 resulting in great uncertainties about the success of post-merger
integration. However, treating employees well and providing generous employment
benefits can—even prior to the merger—reduce some of these costs and increase
investors’ beliefs about post-merger integration success. This can happen because the
acquirer avoids the large costs associated with dissatisfaction and replacement of its own
employees during the post-merger integration process, and because target employees
can also benefit from the acquirer’s employee friendly culture, smoothing the integration
process. Nevertheless, investors of acquiring firms may be concerned with their
management offering generous employment benefits when the uncertainties regarding
post-merger integration are high, which is a key issue in cross-border M&A deals.
Consequently, acquirer shareholders perceive generous policies as a waste of money and
outweigh their costs, which may result in negative shareholder reactions around cross-
border M&A deals, despite target employees welcoming these policies.
What frictions may arise in cross-border deals that affect the returns to
shareholders and firm value when investing in employee relations?44 Obviously,
managing the integration of employee policies in different national, cultural, and
organizational contexts is likely to create a host of uncertainties (Aguilera and Dencker,
2004). In addition, in most jurisdictions, a buyer of a firm cannot legally change the
human capital employed at a target company nor can it change the contracts that a target
firm has adopted, which limits its ability to implement and integrate its own employment
policies in the target firm.45 We therefore argue that, although acquirer shareholders
43 The notion of labor adjustment costs was raised by Dixit (1997), who argues that a firm cannot adjust its labor demand costlessly. That is, when a firm adjusts its labor demand, it incurs the costs of firing, search, selection, hiring, and training, as well as costs associated with productivity losses. This labor market friction leads the firm to have the incentive to minimize its labor turnover. 44 A notable example, albeit not in the context of M&As, is the recent frustration of the greenfield investment in the US by the Chinese company Fuyao Glass Industry Group. Motivated by lower manufacturing costs, Fuyao entered into the US and invested in General Motors’ abandoned plants in Ohio State. But the Chinese company soon faced a strong culture clash with its workforce as many workers questioned the company’s commitment to operating under American supervision and American norms. The Chinese company faced an acrimonious union campaign by the United Automobile Workers, endless complaints by US employees regarding unfair treatment in paid time-off, and a lawsuit by a former US manager, in spite of a favorable stock market reaction when Fuyao announced its US investment plan in 2014. For detailed description, see: “Culture Clash at a Chinese-Owned Plant in Ohio.” New York Times, June 10, 2017. https://www.nytimes.com/2017/06/10/business/economy/ohio-factory-jobs-china.html. 45 For example, a sale of a firm triggers the “transfer of undertakings protection of employment” (TUPE) regulations of 1981, which stems from the European Acquired Rights directive. This regulation states that “all the [seller’s] rights, powers, duties and liabilities under or in connection with [an employee’s contract of employment], shall be transferred to the [buyer].” Furthermore, the buyer assumes the liability for “anything done before the transfer is completed by or in relation to the [seller] in respect of that contract
3. CROSS-BORDER ACQUISITIONS AND EMPLOYEE RELATIONS
134
view treating employees well favourably as it can reduce labor adjustment costs and
enhance firm performance in domestic takeovers, these shareholders may view such
generous employment benefits negatively in a cross-border acquisition, where
uncertainties about post-merger workforce integration are systematically higher.
Based on a global sample of 2,363 acquiring firms from 48 countries engaging in
4,565 M&A deals, we find that there is considerable heterogeneity in firm-level policies of
and investment in employee relations that are distinct from state-imposed country-level
labor regulations. We show that the acquirer’s employee treatment in terms of monetary
benefits and job security is positively related to the takeover deal’s announcement
returns and long-term performance when acquiring a domestic target, but that this effect
reverses when acquiring a foreign target. A one-standard deviation increase in industry-
adjusted investment in employee relations results in a 22 basis points increase in CARs
in domestic deals, but a 43 basis points decrease in cross-border deals.46 This finding
holds even after controlling for cross-country differences in labor regulations and other
macroeconomic factors, as well as acquirer-level fixed effects in a sample of firms that
acquire both domestically and internationally, indicating that our results are not driven
by time-invariant acquirer characteristics. In addition, we show that this finding stems
neither from the fact that cross-border deals on average destroy value, as these deals
have higher announcement returns than domestic deals, nor from other workforce-
related dimensions (such as health and safety, workforce diversity, or training and
development), but that it is mainly driven by the acquirer’s (and not the target’s)
provision of generous employee benefits. Our results are also robust to a propensity score
matching approach to control for observable deal, firm, country, and industry-level
characteristics. Moreover, the results on long-run post-merger performance are in line
with those from the CARs estimations. We also show that our findings are mainly driven
by the acquirer’s investment in pecuniary incentives and monetary compensation, and
less so by factors representing job security factors such as employment retention and
trade union relations, consistent with human relations theories (Herzberg, 1959; 1964;
1966).
or a person employed in that undertaking or part” (Calcagno and Renneboog, 2007). TUPE states that such an act “shall be deemed to have been done by or in relation to the [buyer].” 46 These effects are economically significant as three-day acquirer CARs range between -50 and +50 basis points, on average.

ESSAYS ON CORPORATE TAKEOVERS
135
We explore a few potential channels through which labor-related frictions in cross-
border acquisitions may account for the relationship between firm-level employee
treatment and deal performance. We show that factors such as acquisition experience
and some characteristics of the workforce can reduce labor-related frictions in cross-
border deals. The negative correlation is weaker when the acquirer has takeover
experience in the target’s country, when social security laws and economic nationalism
in the target’s country are low, when strong labor unions in the acquirer’s and target’s
countries are absent, and when both parties are in low-tech industries.
We further show that, for a subsample of deals for which we have both acquirer- and
target-level data on employee relations, our results are not likely to be driven by the
target’s, but rather by the acquirer’s level of investment in employee relations. These
effects concentrate in the acquirer’s CARs instead of in the target’s CARs, indicating that
our results are not driven by a value redistribution effect. We also rule out a host of
alternative explanations including the levels of or differences in country-level labor
regulations, firms’ decisions to engage in a domestic or cross-border M&A, geographical
distance between acquirer and target, differences in their countries’ economic
development, the target employees’ receptiveness towards job security incentives, or a
back-firing effect of an acquirer over-investing in employee relations. Our results are
robust to a propensity-score matching approach, to excluding serial acquirers, excluding
targets from developing countries, and to excluding US acquirers from the sample.
Of course, these results should be interpreted with caution. We do not claim that
what drives the effect of employee relations is simply whether the target is domestic or
foreign. Arguably, there are many frictions such as regulatory and cultural differences
that may shape how a firm employs, transfers, and integrates its human capital during its
reorganization, which we have tried to take into account in our analyses using various
control variables and fixed effects. Instead, our findings highlight the importance of firm-
level treatment of employees to explain the marked differences in deal performance and
shareholder value redistribution between domestic and cross-border M&As around the
world.
3. CROSS-BORDER ACQUISITIONS AND EMPLOYEE RELATIONS
136
2. Data and Method
2.1 Data
We measure a firm’s employee relations using data from Thomson Reuters’ ASSET4
Environmental, Social, and Corporate Governance (ESG) database. This firm-level
database provides information and ratings on firms’ practice on social, corporate
governance, economic, and environmental issues (“pillars”) and covers more than 4,000
companies worldwide, including the members of the S&P 500, Russell 1000, NASDAQ
100, MSCI Europe, FTSE 250, ASX 300, STOXX 600, the MSCI World Index, and the MSCI
Emerging Market, index since 2002. The ASSET4 data is obtained from publicly available
sources such as annual reports, 10-K statements, and CSR reports. The ASSET4 ratings
consist of more than 750 ESG sub-dimensions (data points). Every data point results from
a multi-step verification process, including a series of data entry checks, automated
quality rules, and historical comparisons. Each data point is constructed by means of
more than 280 key performance indicators and are rated as both a normalized score (0
to 100, with 50 as the industry mean) and the actual computed value. The equally-
weighted average is then normalized by ASSET4 so that each firm is given a score relative
to the performance of all firms in the same industry around the world. All ratings are
provided on a yearly basis. For all companies, at least three years of history are available,
and most companies are covered from 2005 onward. Firms are rated on the basis of their
ESG compliance (regulatory requirements) and their ESG engagement (voluntary
initiatives). Therefore, the ESG ratings reflect a comprehensive evaluation of how a firm
engages in stakeholder issues and complies with regulations.
Our main focus is on the variables related to the firm’s workforce under the “social”
(“S”) pillar, in particular those describing the firms’ commitment and effectiveness with
regard to the provision of high-quality employment benefits and job security, which we
label as Employment Quality. Employment Quality is an equally-weighted average of a set
of underlying elements. It consists of measures of the firm’s salary level, wage
distribution, trade union relations, bonus plans for at least middle management, fringe
benefits such as health insurance provision, employment awards, employment creation,
personnel turnover, lay-offs, management departures, strikes, job security policies, and
employment controversies in the media such as strikes. This way we can test the
importance the aggregate measure of employment quality, but also go one level deeper
and test the monetary incentive factors as well as job security factors on shareholder
ESSAYS ON CORPORATE TAKEOVERS
137
returns around M&A announcements. As employment quality is the main empirical proxy
for an acquirer’s employee relations, we use these two terms interchangeably throughout
the paper.
The Employment Quality score is, as are all other ESG scores mentioned above,
normalized by ASSET4 such that each firm is given a z-score relative to the performance
of all firms in the same industry. The normalization to a scale of 100 implies that, by
construction, firms with scores higher than 50 perform above the median in terms of
employee relations. These measures enable us to assess a firm’s orientation towards
employee issues relative to the industry benchmark, and provide us with a natural
yardstick to gauge whether the firm excessively engages in employee relations. This way,
we can compare corporate employee relations across firms with a similar demand for
labor skills and operating in similar labor markets but with a different geographical focus
in takeovers.
We obtain data on M&A deals from the SDC Mergers and Acquisitions database. In
order to be included in our sample, the transactions should meet the following criteria:
(1) the deal was announced between January 1st, 2002 and December 31st, 2014 and the
SDC database contains detailed information on this transaction;47 (2) the acquiring firm
is publicly listed and its accounting and stock return data are available in Datastream; (3)
the acquiring firm owns less than 50% of the target’s shares before the offer and makes
an offer with the intention to own more than 50% of the target’s shares subsequent to a
successful acquisition; (4) the acquiring firm has data available in ASSET4 for the fiscal
year before the deal announcement; and (5) labor protection data for both the acquirer’s
and target’s countries are available in the Botero et al. (2004) labor regulation indices.
Merging the information from ASSET4 with our sample of M&A deals from SDC
results in a final sample of 4,565 deals by 2,009 acquiring firms from 48 countries. Of
these deals, 2,550 (56%) are domestic and 2,015 (44%) are cross-border. The
descriptions of our key variables are given in Appendix A. Appendix B shows the sample
distribution by acquirer industry and year. The acquiring firms in our sample are mostly
active in Business Services (10%), Trading (8%), and Banking (7%) industries.48
Appendix C shows the sample distribution by acquirer country. Acquiring firms originate
47 It is not meaningful to include the deals announced before 2002 as the ASSET4 coverage starts in 2002. 48 To keep a sufficiently large number of observations, we do not exclude the financials and utilities industries. However, our conclusions remain unaffected after excluding these from the sample (results are available on request).
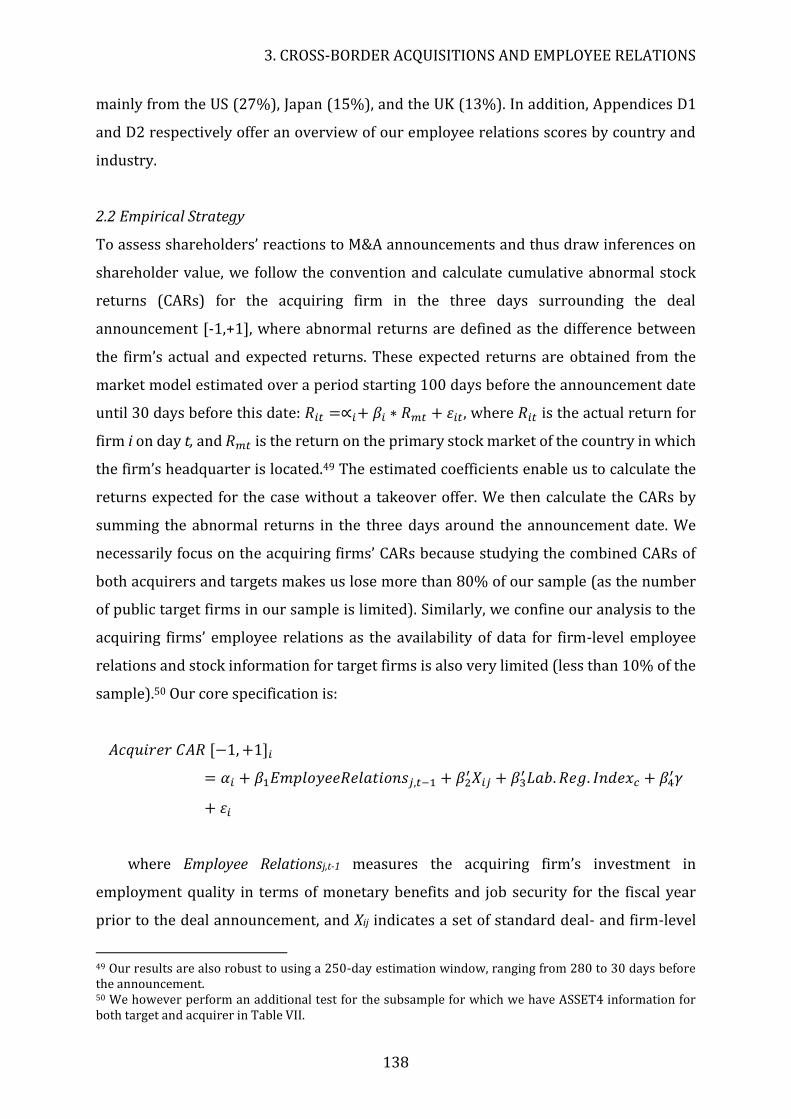
3. CROSS-BORDER ACQUISITIONS AND EMPLOYEE RELATIONS
138
mainly from the US (27%), Japan (15%), and the UK (13%). In addition, Appendices D1
and D2 respectively offer an overview of our employee relations scores by country and
industry.
2.2 Empirical Strategy
To assess shareholders’ reactions to M&A announcements and thus draw inferences on
shareholder value, we follow the convention and calculate cumulative abnormal stock
returns (CARs) for the acquiring firm in the three days surrounding the deal
announcement [-1,+1], where abnormal returns are defined as the difference between
the firm’s actual and expected returns. These expected returns are obtained from the
market model estimated over a period starting 100 days before the announcement date
until 30 days before this date: 𝑅𝑖𝑡 =∝𝑖+ 𝛽𝑖 ∗ 𝑅𝑚𝑡 + 𝜀𝑖𝑡, where 𝑅𝑖𝑡 is the actual return for
firm i on day t, and 𝑅𝑚𝑡 is the return on the primary stock market of the country in which
the firm’s headquarter is located.49 The estimated coefficients enable us to calculate the
returns expected for the case without a takeover offer. We then calculate the CARs by
summing the abnormal returns in the three days around the announcement date. We
necessarily focus on the acquiring firms’ CARs because studying the combined CARs of
both acquirers and targets makes us lose more than 80% of our sample (as the number
of public target firms in our sample is limited). Similarly, we confine our analysis to the
acquiring firms’ employee relations as the availability of data for firm-level employee
relations and stock information for target firms is also very limited (less than 10% of the
sample).50 Our core specification is:
𝐴𝑐𝑞𝑢𝑖𝑟𝑒𝑟 𝐶𝐴𝑅 [−1, +1]𝑖
= 𝛼𝑖 + 𝛽1𝐸𝑚𝑝𝑙𝑜𝑦𝑒𝑒𝑅𝑒𝑙𝑎𝑡𝑖𝑜𝑛𝑠𝑗,𝑡−1 + 𝛽2′ 𝑋𝑖𝑗 + 𝛽3
′ 𝐿𝑎𝑏. 𝑅𝑒𝑔. 𝐼𝑛𝑑𝑒𝑥𝑐 + 𝛽4′𝛾
+ 𝜀𝑖
where Employee Relationsj,t-1 measures the acquiring firm’s investment in
employment quality in terms of monetary benefits and job security for the fiscal year
prior to the deal announcement, and Xij indicates a set of standard deal- and firm-level
49 Our results are also robust to using a 250-day estimation window, ranging from 280 to 30 days before the announcement. 50 We however perform an additional test for the subsample for which we have ASSET4 information for both target and acquirer in Table VII.
ESSAYS ON CORPORATE TAKEOVERS
139
control variables including acquirer ROA, acquirer leverage, acquirer size, a serial
acquirer dummy, relative deal size, and dummies for toeholds, multiple bidders, all-cash
financed deals, hostile deals, diversifying deals, and public targets.
Lab. Reg. Indexc is a set of four (target and/or acquirer) country-level labor
regulation indices from Botero et al. (2004), which have been widely used in studies on
the role of labor protection in corporate investment (e.g. Atanassov and Kim, 2009;
Levine et al., 2015). These indices consist of (1) an employment laws index, which
measures the protection of labor and employment contracts; (2) a collective relations
laws index, which measures the statutory protection and power of labor unions as well
as protection of workers during collective disputes; (3) a social security laws index, which
measures social security benefits related to old age, disability, death, sickness, and
unemployment; and (4) a civil rights index, which captures the degree of statutory
protection of vulnerable groups against employment discrimination. As our goal is to
examine the role of firm-level employee relations, it is important to control for these
country-level labor regulation variables so as to disentangle the firm-level effects of
(voluntary) labor-orientation from the effects resulting from country-level (mandatory)
labor protection regulations.
Finally, γ is a set of year, acquirer- and target-industry fixed effects, and “acquirer-
region × target-region” fixed effects that we include to further reduce concerns related to
a potential omitted variable bias in the relationship between corporate employee
relations and stock returns around M&A announcements.
In addition, we explore the potential mechanisms that account for the differential
relations between employee relations and shareholder returns in domestic and cross-
border deals by considering a set of sub-dimensional factors of our main Employment
Quality score (e.g. monetary incentives such as bonus plans for at least middle
management, fringe benefits such as health insurance, the wage ratio of employees/CEO,
trade union relations policies, employment growth/loss, job security policies, etc.). We
also interact these employee relations measures with country- and firm-level variables
that capture labor-related frictions. Definitions of all variables are available in Appendix
A.
3. CROSS-BORDER ACQUISITIONS AND EMPLOYEE RELATIONS
140
3. Results
3.1 Descriptive Statistics
Panel A in Table 1 reports descriptive statistics for our main measure of firm-level
employee relations for the acquiring firms in domestic and cross-border deals,
respectively. Our main explanatory variable on firm-level employee relations is
Employment Quality in terms of monetary incentives and job security. It is measured by
means of industry-adjusted normalized scores (ranging from 0 to 100) and captures a
firm’s employee relations relative to its industry peers. In domestic deals, Employment
Quality is close to the sample mean (of 50), whereas in cross-border deals, it is
considerably higher than the sample mean. The difference of 9 points on a scale of 100 is
both economically and statistically significant (Table I, Panel A).
The other variables shown in Panel A represent a set of sub-dimensional factors used to
construct the Employment Quality score (see Appendix A for variable descriptions); in
domestic deals, an average of 39% of the acquiring firms offer a bonus plan to their
employees, 43% provide fringe benefits such as pension funds or health insurance, the
average acquirer increased its workforce by 3.5% in the year prior to the acquisition,
18% of the acquiring firms has a policy in place for maintaining good relations with trade
unions, and 6% of firms have policy to enhance job security. In contrast, acquirers
engaging in cross-border deals are more likely to offer a bonus plan to their employees
(48%), are more likely to have a policy for maintaining good relations with trade unions
(32%), and are more likely to have a job security policy in place (11%).
Overall, these results suggest that firms conducting cross-border acquisitions are
different from those conducting domestic acquisitions in terms of their relations with
employees, and also appear to have above-average employee relations.
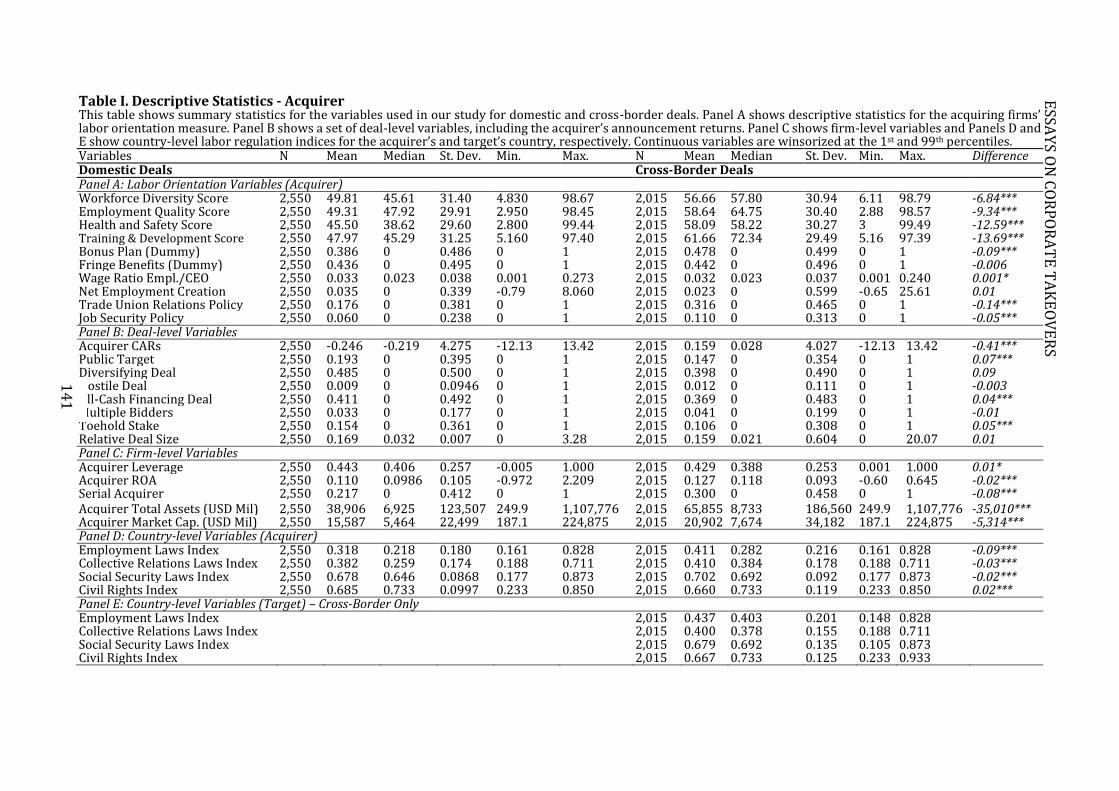
Table I. Descriptive Statistics - Acquirer This table shows summary statistics for the variables used in our study for domestic and cross-border deals. Panel A shows descriptive statistics for the acquiring firms’ labor orientation measure. Panel B shows a set of deal-level variables, including the acquirer’s announcement returns. Panel C shows firm-level variables and Panels D and E show country-level labor regulation indices for the acquirer’s and target’s country, respectively. Continuous variables are winsorized at the 1st and 99th percentiles. Variables N Mean Median St. Dev. Min. Max. N Mean Median St. Dev. Min. Max. Difference Domestic Deals Cross-Border Deals Panel A: Labor Orientation Variables (Acquirer) Workforce Diversity Score 2,550 49.81 45.61 31.40 4.830 98.67 2,015 56.66 57.80 30.94 6.11 98.79 -6.84*** Employment Quality Score 2,550 49.31 47.92 29.91 2.950 98.45 2,015 58.64 64.75 30.40 2.88 98.57 -9.34*** Health and Safety Score 2,550 45.50 38.62 29.60 2.800 99.44 2,015 58.09 58.22 30.27 3 99.49 -12.59*** Training & Development Score 2,550 47.97 45.29 31.25 5.160 97.40 2,015 61.66 72.34 29.49 5.16 97.39 -13.69*** Bonus Plan (Dummy) 2,550 0.386 0 0.486 0 1 2,015 0.478 0 0.499 0 1 -0.09*** Fringe Benefits (Dummy) 2,550 0.436 0 0.495 0 1 2,015 0.442 0 0.496 0 1 -0.006 Wage Ratio Empl./CEO 2,550 0.033 0.023 0.038 0.001 0.273 2,015 0.032 0.023 0.037 0.001 0.240 0.001* Net Employment Creation 2,550 0.035 0 0.339 -0.79 8.060 2,015 0.023 0 0.599 -0.65 25.61 0.01 Trade Union Relations Policy 2,550 0.176 0 0.381 0 1 2,015 0.316 0 0.465 0 1 -0.14*** Job Security Policy 2,550 0.060 0 0.238 0 1 2,015 0.110 0 0.313 0 1 -0.05*** Panel B: Deal-level Variables Acquirer CARs 2,550 -0.246 -0.219 4.275 -12.13 13.42 2,015 0.159 0.028 4.027 -12.13 13.42 -0.41*** Public Target 2,550 0.193 0 0.395 0 1 2,015 0.147 0 0.354 0 1 0.07*** Diversifying Deal 2,550 0.485 0 0.500 0 1 2,015 0.398 0 0.490 0 1 0.09 Hostile Deal 2,550 0.009 0 0.0946 0 1 2,015 0.012 0 0.111 0 1 -0.003 All-Cash Financing Deal 2,550 0.411 0 0.492 0 1 2,015 0.369 0 0.483 0 1 0.04*** Multiple Bidders 2,550 0.033 0 0.177 0 1 2,015 0.041 0 0.199 0 1 -0.01 Toehold Stake 2,550 0.154 0 0.361 0 1 2,015 0.106 0 0.308 0 1 0.05*** Relative Deal Size 2,550 0.169 0.032 0.007 0 3.28 2,015 0.159 0.021 0.604 0 20.07 0.01 Panel C: Firm-level Variables Acquirer Leverage 2,550 0.443 0.406 0.257 -0.005 1.000 2,015 0.429 0.388 0.253 0.001 1.000 0.01* Acquirer ROA 2,550 0.110 0.0986 0.105 -0.972 2.209 2,015 0.127 0.118 0.093 -0.60 0.645 -0.02*** Serial Acquirer 2,550 0.217 0 0.412 0 1 2,015 0.300 0 0.458 0 1 -0.08*** Acquirer Total Assets (USD Mil) 2,550 38,906 6,925 123,507 249.9 1,107,776 2,015 65,855 8,733 186,560 249.9 1,107,776 -35,010*** Acquirer Market Cap. (USD Mil) 2,550 15,587 5,464 22,499 187.1 224,875 2,015 20,902 7,674 34,182 187.1 224,875 -5,314*** Panel D: Country-level Variables (Acquirer) Employment Laws Index 2,550 0.318 0.218 0.180 0.161 0.828 2,015 0.411 0.282 0.216 0.161 0.828 -0.09*** Collective Relations Laws Index 2,550 0.382 0.259 0.174 0.188 0.711 2,015 0.410 0.384 0.178 0.188 0.711 -0.03*** Social Security Laws Index 2,550 0.678 0.646 0.0868 0.177 0.873 2,015 0.702 0.692 0.092 0.177 0.873 -0.02*** Civil Rights Index 2,550 0.685 0.733 0.0997 0.233 0.850 2,015 0.660 0.733 0.119 0.233 0.850 0.02*** Panel E: Country-level Variables (Target) – Cross-Border Only Employment Laws Index 2,015 0.437 0.403 0.201 0.148 0.828 Collective Relations Laws Index 2,015 0.400 0.378 0.155 0.188 0.711 Social Security Laws Index 2,015 0.679 0.692 0.135 0.105 0.873 Civil Rights Index 2,015 0.667 0.733 0.125 0.233 0.933
14
1
ESSA
YS O
N C
OR
PO
RA
TE
TA
KE
OV
ER
S
3. CROSS-BORDER ACQUISITIONS AND EMPLOYEE RELATIONS
142
Panel B reports descriptive statistics for deal-level characteristics, starting with the
acquirer’s CARs over the window [-1, 1]. Consistent with findings in the literature,
acquirer shareholders in domestic deals do not gain from M&A deals: the mean and
median CARs are -25 and -22 basis points, respectively. About 41% of our sample consists
of cross-border deals, and in these deals acquirer shareholders earn positive mean and
median returns of 16 and 3 basis points, respectively. Although shareholders of acquirers
conducting cross-border deals earn more positive returns on average, the median return
is close to zero. Cross-border acquirers are less likely to acquire public targets, make all-
cash offers, and acquire toehold stakes. Cross-border deal values are comparable to
domestic deal values (16% of the acquirer’s market capitalization in cross-border deals
and 17% in domestic deals).
The firm-level variables in Panel C show that firms acquiring domestically are
comparable to firms acquiring cross-border targets in terms of leverage and profitability
(as, although the difference in means is statistically significant, it is economically small),
but are smaller in size and are less likely to be serial acquirers.51 Panels D and E compare
the acquirer’s and target’s country-level labor protection indices: acquiring firms in
domestic deals tend to be located in countries with slightly lower protection in terms of
employment, collective relations, and social security, but with stronger civil rights than
acquiring firms in cross-border deals. Also, targets in cross-border deals have a higher
employment laws index than acquirers in domestic deals. These statistics are consistent
with Alimov (2015).
We can derive some interesting insights from our descriptive statistics: compared to
acquirers in domestic deals, those engaging in cross-border deals have on average more
generous employment policies at the firm-level, and their deals also earn higher
announcement returns compared to domestic acquirers. However, they also differ on a
number of deal-, firm-, and country-level characteristics. It is thus not clear whether the
higher announcement returns in cross-border deals are causally related to better
employee relations, which as we will show below, is in fact not likely the case.
51 A serial acquiring firm is defined as a firm engaging in more than 10 takeover deals across our sample period. Alternatively, when we define serial acquirers as firms engaging in more than two takeover deals per year, our conclusions are not affected. A relatively large number of deals—they make up 25% of our sample—involve serial acquiring firms.
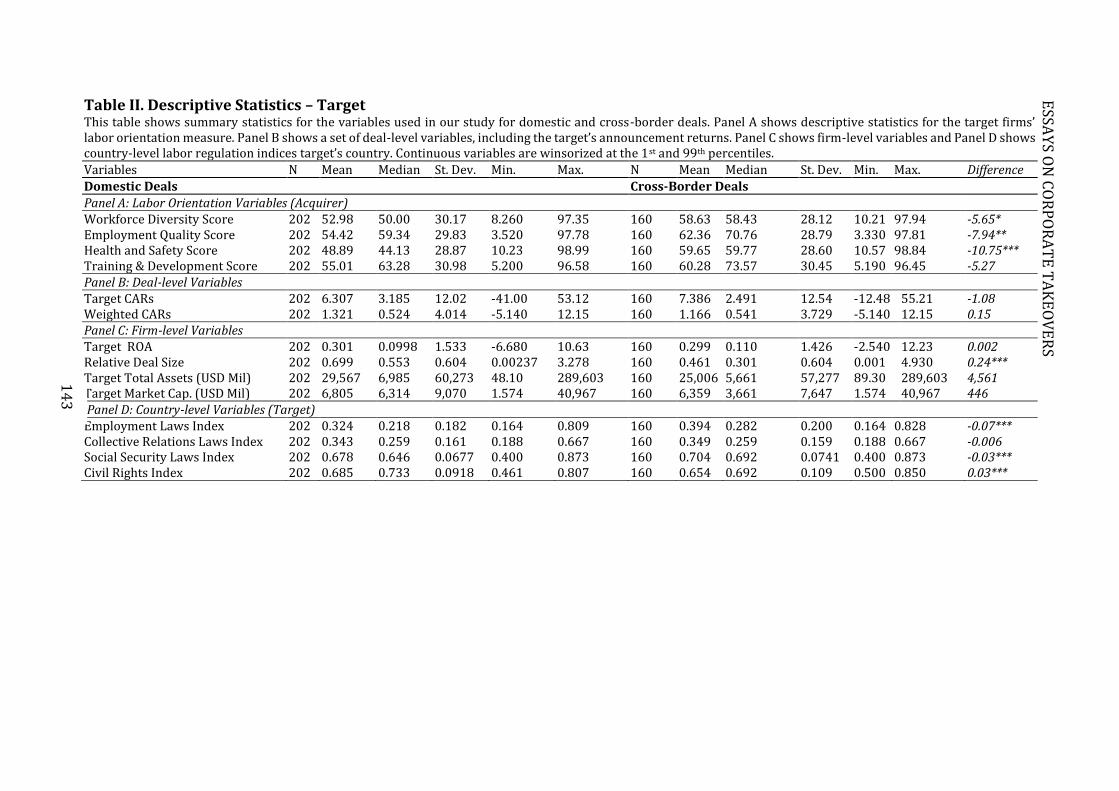
Table II. Descriptive Statistics – Target This table shows summary statistics for the variables used in our study for domestic and cross-border deals. Panel A shows descriptive statistics for the target firms’ labor orientation measure. Panel B shows a set of deal-level variables, including the target’s announcement returns. Panel C shows firm-level variables and Panel D shows country-level labor regulation indices target’s country. Continuous variables are winsorized at the 1st and 99th percentiles.
Variables N Mean Median St. Dev. Min. Max. N Mean Median St. Dev. Min. Max. Difference
Domestic Deals Cross-Border Deals
Panel A: Labor Orientation Variables (Acquirer) Workforce Diversity Score 202 52.98 50.00 30.17 8.260 97.35 160 58.63 58.43 28.12 10.21 97.94 -5.65* Employment Quality Score 202 54.42 59.34 29.83 3.520 97.78 160 62.36 70.76 28.79 3.330 97.81 -7.94** Health and Safety Score 202 48.89 44.13 28.87 10.23 98.99 160 59.65 59.77 28.60 10.57 98.84 -10.75*** Training & Development Score 202 55.01 63.28 30.98 5.200 96.58 160 60.28 73.57 30.45 5.190 96.45 -5.27 Panel B: Deal-level Variables Target CARs 202 6.307 3.185 12.02 -41.00 53.12 160 7.386 2.491 12.54 -12.48 55.21 -1.08 Weighted CARs 202 1.321 0.524 4.014 -5.140 12.15 160 1.166 0.541 3.729 -5.140 12.15 0.15 Panel C: Firm-level Variables Target ROA 202 0.301 0.0998 1.533 -6.680 10.63 160 0.299 0.110 1.426 -2.540 12.23 0.002 Relative Deal Size 202 0.699 0.553 0.604 0.00237 3.278 160 0.461 0.301 0.604 0.001 4.930 0.24*** Target Total Assets (USD Mil) 202 29,567 6,985 60,273 48.10 289,603 160 25,006 5,661 57,277 89.30 289,603 4,561 Target Market Cap. (USD Mil) 202 6,805 6,314 9,070 1.574 40,967 160 6,359 3,661 7,647 1.574 40,967 446 Panel D: Country-level Variables (Target) Employment Laws Index 202 0.324 0.218 0.182 0.164 0.809 160 0.394 0.282 0.200 0.164 0.828 -0.07*** Collective Relations Laws Index 202 0.343 0.259 0.161 0.188 0.667 160 0.349 0.259 0.159 0.188 0.667 -0.006 Social Security Laws Index 202 0.678 0.646 0.0677 0.400 0.873 160 0.704 0.692 0.0741 0.400 0.873 -0.03*** Civil Rights Index 202 0.685 0.733 0.0918 0.461 0.807 160 0.654 0.692 0.109 0.500 0.850 0.03***
14
3
ESSA
YS O
N C
OR
PO
RA
TE
TA
KE
OV
ER
S
3. CROSS-BORDER ACQUISITIONS AND EMPLOYEE RELATIONS
144
We also show similar descriptive statistics for target firms in Table II, but only for the
small subsample for which employee relations data (Employment Quality score) are
available, as ASSET4 mostly covers large firms included in the major global equity indices.
Again, target firms’ Employment Quality score is higher for cross-border deals than for
domestic deals.
Consistent with the M&A literature, target firms also enjoy positive announcement
CARs, which are higher for cross-border deals. Targets are smaller in size compared to
acquirers, but they are more profitable. The relative deal size is much larger in this small
subsample compared to the full sample in Table I, which is of course due to ASSET4 only
covering large publicly-listed firms. Overall, the descriptive statistics in Tables I and II
indicate that there are substantial differences in employee relations and firm
characteristics between acquirers and targets, and between domestic deals and cross-
border deals.
3.2 Employee Relations and Shareholder Returns in Domestic and Cross-Border Takeovers
We now formally test the relation between firm-level employee relations and acquirer
returns. As we argue above, a firm’s treatment of its employees can reduce labor
adjustment costs, which is perceived favorably by its investors. However, investors’
perception can be reversed when an acquisition takes place across national borders,
which increases uncertainty about post-merger workforce integration.
In contrast to domestic deals, cross-border deals face additional risks and labor
adjustment costs resulting from the transfer and integration of employment policies
across borders. We test this hypothesis in Table III, where we consider two subsamples
for domestic and cross-border deals in Panel A, and interact a cross-border deal dummy
with the firm’s Employment Quality score on the full sample in Panel B. Using these two
types of models enables us to include different types of fixed effects that would otherwise
absorb, for example, the cross-border deal indicator. All models include the firm- and
deal-level controls specified in Section II (acquirer ROA, leverage, market capitalization,
a serial acquirer indicator, relative deal size, and dummies for toeholds, multiple bidders,
all-cash financed deals, hostile deals, diversifying deals, and public targets), along with
acquirer and target country-level labor protection indices or country fixed effects, and
year, acquirer- and target-industry, and acquirer region by target region fixed effects.
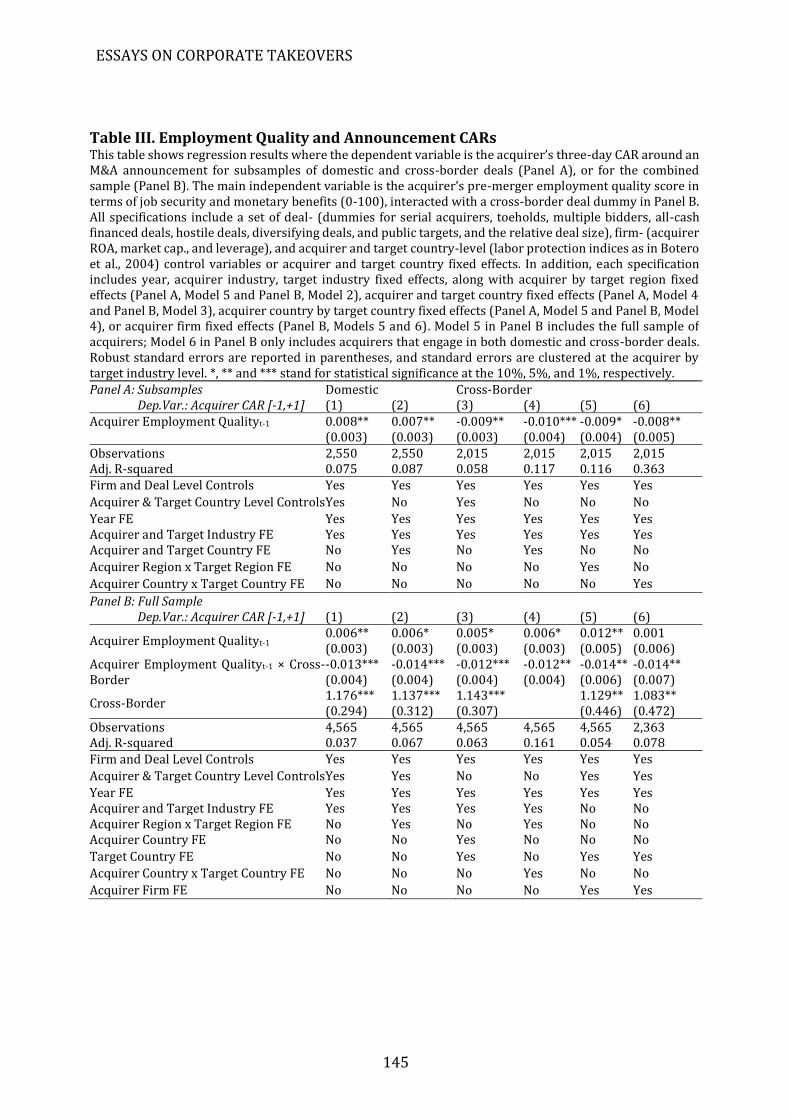
ESSAYS ON CORPORATE TAKEOVERS
145
Table III. Employment Quality and Announcement CARs This table shows regression results where the dependent variable is the acquirer’s three-day CAR around an M&A announcement for subsamples of domestic and cross-border deals (Panel A), or for the combined sample (Panel B). The main independent variable is the acquirer’s pre-merger employment quality score in terms of job security and monetary benefits (0-100), interacted with a cross-border deal dummy in Panel B. All specifications include a set of deal- (dummies for serial acquirers, toeholds, multiple bidders, all-cash financed deals, hostile deals, diversifying deals, and public targets, and the relative deal size), firm- (acquirer ROA, market cap., and leverage), and acquirer and target country-level (labor protection indices as in Botero et al., 2004) control variables or acquirer and target country fixed effects. In addition, each specification includes year, acquirer industry, target industry fixed effects, along with acquirer by target region fixed effects (Panel A, Model 5 and Panel B, Model 2), acquirer and target country fixed effects (Panel A, Model 4 and Panel B, Model 3), acquirer country by target country fixed effects (Panel A, Model 5 and Panel B, Model 4), or acquirer firm fixed effects (Panel B, Models 5 and 6). Model 5 in Panel B includes the full sample of acquirers; Model 6 in Panel B only includes acquirers that engage in both domestic and cross-border deals. Robust standard errors are reported in parentheses, and standard errors are clustered at the acquirer by target industry level. *, ** and *** stand for statistical significance at the 10%, 5%, and 1%, respectively. Panel A: Subsamples Domestic Cross-Border
Dep.Var.: Acquirer CAR [-1,+1] (1) (2) (3) (4) (5) (6) Acquirer Employment Qualityt-1 0.008** 0.007** -0.009** -0.010*** -0.009* -0.008** (0.003) (0.003) (0.003) (0.004) (0.004) (0.005) Observations 2,550 2,550 2,015 2,015 2,015 2,015 Adj. R-squared 0.075 0.087 0.058 0.117 0.116 0.363 Firm and Deal Level Controls Yes Yes Yes Yes Yes Yes
Acquirer & Target Country Level Controls Yes No Yes No No No
Year FE Yes Yes Yes Yes Yes Yes Acquirer and Target Industry FE Yes Yes Yes Yes Yes Yes Acquirer and Target Country FE No Yes No Yes No No
Acquirer Region x Target Region FE No No No No Yes No
Acquirer Country x Target Country FE No No No No No Yes
Panel B: Full Sample Dep.Var.: Acquirer CAR [-1,+1] (1) (2) (3) (4) (5) (6)
Acquirer Employment Qualityt-1 0.006** 0.006* 0.005* 0.006* 0.012** 0.001 (0.003) (0.003) (0.003) (0.003) (0.005) (0.006)
Acquirer Employment Qualityt-1 × Cross-Border
-0.013*** -0.014*** -0.012*** -0.012** -0.014** -0.014** (0.004) (0.004) (0.004) (0.004) (0.006) (0.007)
Cross-Border 1.176*** 1.137*** 1.143*** 1.129** 1.083** (0.294) (0.312) (0.307) (0.446) (0.472)
Observations 4,565 4,565 4,565 4,565 4,565 2,363 Adj. R-squared 0.037 0.067 0.063 0.161 0.054 0.078 Firm and Deal Level Controls Yes Yes Yes Yes Yes Yes
Acquirer & Target Country Level Controls Yes Yes No No Yes Yes
Year FE Yes Yes Yes Yes Yes Yes Acquirer and Target Industry FE Yes Yes Yes Yes No No Acquirer Region x Target Region FE No Yes No Yes No No Acquirer Country FE No No Yes No No No
Target Country FE No No Yes No Yes Yes
Acquirer Country x Target Country FE No No No Yes No No
Acquirer Firm FE No No No No Yes Yes
3. CROSS-BORDER ACQUISITIONS AND EMPLOYEE RELATIONS
146
Models (1) and (2) in Panel A indicate that a higher level of employment quality in
terms of monetary incentives and job security is positively related to shareholder returns
around domestic deal announcements. This is consistent with the notion that providing
high-level incentives can reduce labor adjustment costs during the firm’s reorganization
process and is viewed favorably by shareholders. We find that the effect reverses in cross-
border deals, consistent with our conjecture that the provision of generous employment
benefits may be viewed unfavorably by shareholders when there is considerable
uncertainty about post-merger integration across national borders. In Models (3)
through (6), we consistently find that higher levels of employment quality are negatively
related to CARs. Importantly, we find that this effect is not eroded by the inclusion of
acquirer region-by-target region or even acquirer country-by-target country fixed effects.
This suggests that the effect is not driven by, for example, time-invariant agreements or
capital flows between a pair of countries or differences in labor regulations between a
pair of countries.
In Panel B, we consider the full sample of deals, and interact Employment Quality
with a cross-border deal indicator. The results in Models (1) through (6) are consistently
in line with those in Panel A: better employee relations in the acquiring firm are positively
related to announcement CARs in domestic deals, but negatively in cross-border deals.
These models also consistently show that cross-border deals earn higher CARs, in line
with findings in the extant literature (e.g., Doukas and Travlos, 1988; Chari, Ouimet and
Tesar, 2010). Importantly, we find that our results hold after controlling for acquirer and
target country fixed effects (Model (2)), acquirer region by target region fixed effects
(Model (4)), and even acquirer firm fixed effects (Models (5) and (6)). The former two
specifications indicate that our results are unlikely to be driven by acquirer or target level
labor regulations. Whereas Model (5) includes acquirer fixed effects for the full sample,
Model (6) only considers acquirers that engaged in both domestic and cross-border
acquisitions over the sample period. Notably, the finding that the negative effect in cross-
border deals holds even in Model (6) suggests that our results are not likely to be driven
by time-invariant acquirer characteristics, i.e., acquirers treating employees well and
acquiring domestically may be inherently different from those that acquire
internationally. In terms of economic significance, a one standard deviation increase (+
30) in the acquirer’s score on Employment Quality is associated with an increase in CARs
of 0.18% (18 bps) in domestic deals, but the increase in returns around cross-border
ESSAYS ON CORPORATE TAKEOVERS
147
deals drops from 1.14% to 0.90% (a 24 bps decrease) in Model (4). Combining these
results, we can conclude that, despite the summary statistics in Table I indicating that
cross-border acquirers have higher levels of employee relations and experience on
average higher announcement returns, these higher returns are unlikely to result from
the acquirer’s better treatment of its employees. Instead, acquiring across national
borders induces concerns for shareholders regarding labor-related frictions and
uncertainty, which is priced by the stock market around such deals.
It is important to note that we control in all specifications for labor regulations in the
acquirer’s and—in cross-border deals—also the target’s country, in addition to acquirer
region by target region fixed effects. In line with Dessaint et al. (2017), we find that in
domestic deals a country’s labor laws regarding employment regulation (which to a large
extent measures the labor rigidity faced by a firm) are negatively related to
announcement returns.52 However, the inclusion of country-level labor regulation indices
does not erode the significance of our firm-specific employment quality score. This
suggests that government-imposed labor protection regulations are not perfect
substitutes for voluntary employment policies at the firm level.
In addition, the signs and significance for our other control variables are comparable
to those found in the literature (e.g. Lin, Officer, and Zou, 2011): acquiring a public target
negatively affects the returns to shareholders, whereas most firm-level characteristics
and the financial performance of acquirers do not seem to play a significant role in driving
the acquirer’s own returns. In our robustness tests, we additionally control for, and
interact our Employment Quality variable with the acquirer’s and target’s country GDP
and GDP per capita, as well as other country-level characteristics. None of these controls
affects the significance of our measure of employee relations.
3.3 Unbundling Employee Incentives
Next, we investigate the mechanisms underlying our above-documented effects of
employee relations. Our aim is to disentangle different dimensions of an acquiring firm’s
provision of employment benefits and how these are viewed by shareholders (i.e., which
aspects of employee relations matters). As documented both theoretically (Herzberg et
al., 1959) and empirically (Edmans, 2011), employees are motivated most by the
52 To save space, these control variables are not reported in Table III. Appendix G reports the full results (including control variables) for Panel B in Table III.
3. CROSS-BORDER ACQUISITIONS AND EMPLOYEE RELATIONS
148
provision of monetary incentives. Such incentives may augment their productivity and
loyalty, and thus reduce labor adjustment costs, which may in turn be reflected in
shareholder value. Therefore, our results are expected to be mainly driven by factors
related to the provision of monetary incentives.
To test this hypothesis, we dig deeper into the ASSET4 database and we decompose
Employment Quality into two broad categories capturing employees’ monetary incentives
(including fair salaries, bonus plans, and other fringe benefits such as health insurance)
on the one hand and job security incentives (including growth in the workforce, trade
union relations, and the presence of a job security policy) on the other hand. The former
set of incentives represent how much the firm values the specificity of human assets
(Williamson, 1981) by linking compensation to firm performance, providing a fair wage,
attracting talented employees, and encouraging diligence. The latter set of incentives is
directly related to employee loyalty and commitment and is thus a more direct measure
of the employment insurance dimension of employee relations.53 They represent the
collective governance of human assets which are not necessarily employee-specific, and
may not directly translate into superior labor productivity (Williamson, 1981).
We test these decomposed employee relations measures in Table IV. In Panel A, we
consider three forms of monetary incentives: (i) the provision of a bonus plan to at least
middle management (Acquirer Bonus Plan Dummy), (ii) the provision of fringe benefits
such as pension funds and health insurance (Acquirer Fringe Benefits Dummy), and (iii)
the wage ratio of the average worker’s salary and the CEO’s income (Acquirer Wage Ratio
Employees/CEO).54 We include the latter based on the argument that a smaller wage gap
is likely to increase employees’ perception of being paid a fair wage, which may increase
their retention and productivity. As before, we interact these monetary incentive
variables with the cross-border indicator.
53 This classification conceptually matches the dichotomy by Herzberg et al. (1959) who distinguish between “motivational” factors (such as monetary incentives) and “maintenance” factors (such as job retention policies and improving working conditions). 54 The effect of the firm’s industry is controlled for by including industry fixed effects in all models.
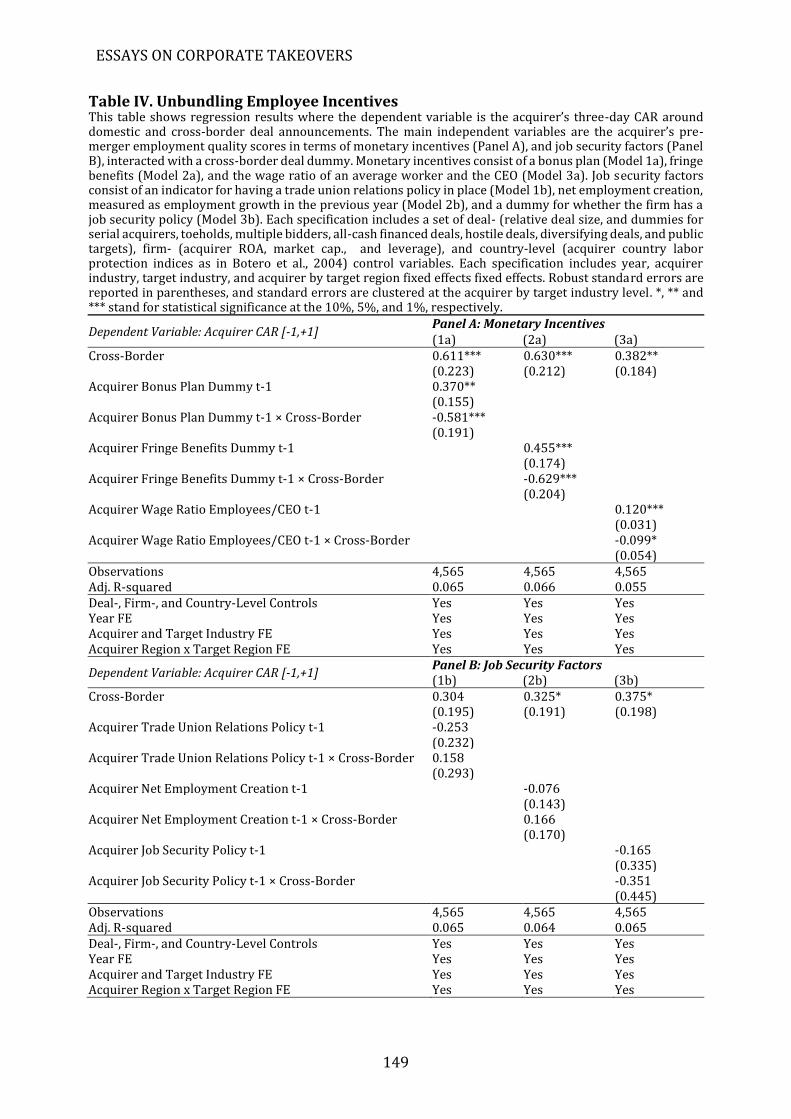
ESSAYS ON CORPORATE TAKEOVERS
149
Table IV. Unbundling Employee Incentives This table shows regression results where the dependent variable is the acquirer’s three-day CAR around domestic and cross-border deal announcements. The main independent variables are the acquirer’s pre-merger employment quality scores in terms of monetary incentives (Panel A), and job security factors (Panel B), interacted with a cross-border deal dummy. Monetary incentives consist of a bonus plan (Model 1a), fringe benefits (Model 2a), and the wage ratio of an average worker and the CEO (Model 3a). Job security factors consist of an indicator for having a trade union relations policy in place (Model 1b), net employment creation, measured as employment growth in the previous year (Model 2b), and a dummy for whether the firm has a job security policy (Model 3b). Each specification includes a set of deal- (relative deal size, and dummies for serial acquirers, toeholds, multiple bidders, all-cash financed deals, hostile deals, diversifying deals, and public targets), firm- (acquirer ROA, market cap., and leverage), and country-level (acquirer country labor protection indices as in Botero et al., 2004) control variables. Each specification includes year, acquirer industry, target industry, and acquirer by target region fixed effects fixed effects. Robust standard errors are reported in parentheses, and standard errors are clustered at the acquirer by target industry level. *, ** and *** stand for statistical significance at the 10%, 5%, and 1%, respectively.
Dependent Variable: Acquirer CAR [-1,+1] Panel A: Monetary Incentives (1a) (2a) (3a)
Cross-Border 0.611*** 0.630*** 0.382** (0.223) (0.212) (0.184) Acquirer Bonus Plan Dummy t-1 0.370** (0.155) Acquirer Bonus Plan Dummy t-1 × Cross-Border -0.581*** (0.191) Acquirer Fringe Benefits Dummy t-1 0.455***
(0.174)
Acquirer Fringe Benefits Dummy t-1 × Cross-Border -0.629*** (0.204) Acquirer Wage Ratio Employees/CEO t-1
0.120***
(0.031) Acquirer Wage Ratio Employees/CEO t-1 × Cross-Border -0.099* (0.054) Observations 4,565 4,565 4,565 Adj. R-squared 0.065 0.066 0.055 Deal-, Firm-, and Country-Level Controls Yes Yes Yes Year FE Yes Yes Yes Acquirer and Target Industry FE Yes Yes Yes Acquirer Region x Target Region FE Yes Yes Yes
Dependent Variable: Acquirer CAR [-1,+1] Panel B: Job Security Factors (1b) (2b) (3b)
Cross-Border 0.304 0.325* 0.375* (0.195) (0.191) (0.198) Acquirer Trade Union Relations Policy t-1 -0.253
(0.232)
Acquirer Trade Union Relations Policy t-1 × Cross-Border 0.158 (0.293) Acquirer Net Employment Creation t-1
-0.076
(0.143)
Acquirer Net Employment Creation t-1 × Cross-Border 0.166 (0.170) Acquirer Job Security Policy t-1
-0.165
(0.335) Acquirer Job Security Policy t-1 × Cross-Border -0.351
(0.445) Observations 4,565 4,565 4,565 Adj. R-squared 0.065 0.064 0.065 Deal-, Firm-, and Country-Level Controls Yes Yes Yes Year FE Yes Yes Yes Acquirer and Target Industry FE Yes Yes Yes Acquirer Region x Target Region FE Yes Yes Yes
3. CROSS-BORDER ACQUISITIONS AND EMPLOYEE RELATIONS
150
In line with theory and empirical evidence, we find that each of our monetary incentive
variables is positively related to acquirer announcement returns. In addition, echoing our
results in Table III, cross-border deals, which arguably may entail more labor-related
frictions, seem to limit the extent to which these incentives can be translated into
productivity and firm value. Employee compensation schemes differ significantly across
countries (e.g., Card, Heining, and Kline, 2013; Mueller, Ouimet, and Simintzi, 2017) and
an overly generous compensation policy for all employees with different backgrounds
and cultural values may be perceived as a waste of money by acquirer shareholders.
Although target employees may value such benefits, the additional uncertainty regarding
post-merger integration in cross-border deals may result in the benefits being
outweighed by the costs from the perspective of acquirer shareholders.
Moreover, in line with Herzberg’s theory that job security does not directly lead to
superior performance, we find no significant effects for the provision of job security
incentives on shareholder CARs in Panel B. We measure job security incentives by (i)
whether or not the firm has a trade union relations policy (Acquirer Trade Union Relations
Policy), (ii) employment growth (Acquirer Net Employment Creation), and (iii) whether
the firm has a job security policy (Acquirer Job Security Policy).55 This indicates that the
additional risks and costs related to the transfer and integration of employee policies in
cross-border deals only affect the transformation of monetary incentives in productivity
and shareholder value, whereas they do not matter much for the employment insurance
dimension. This is not unsurprising, as earlier evidence has indicated that employment
protection and insurance in cross-border M&As is generally affected by country-level
labor regulations (Dessaint et al., 2017). The monetary incentives captured using our
employee relations measures go beyond labor regulations (which only provide
employees with a safety net), and reflect the firm’s voluntary and stronger commitment
to employee relations.
55 In addition, we test a set of alternative variables related to job security (not reported): the percentage of trade unionization in the acquirer firm, the rate of turnover in the workforce, and the number of labor-related controversies reported in the media (e.g. strikes). As before, none of these are significantly related to CARs.
ESSAYS ON CORPORATE TAKEOVERS
151
3.4 Labor-Related Frictions in Cross-Border Deals: Channels
We now delve deeper into the channels of labor-related frictions in cross-border deals.
In other words, what types of frictions may account for the negative interaction effects
shown in Table III? Relative to domestic deals, cross-border deals are considerably more
complex transactions which make the integration of firms with different employee
policies and different national, cultural, and organizational contexts more difficult
(Aguilera and Dencker, 2004). In this section, we attempt to identify the channels through
which such difficulties arise. In particular, we focus on five variables at the firm-level,
industry-level, and the country-level, and interact them with Employment Quality for the
subsample of cross-border deals, as reported in Table V. Again, all variable descriptions
are given in Appendix A. As before, we find in each specification that the main effect of
employment quality is significantly negative.
The first variable captures whether or not the transaction is a repeat acquisition in
the target’s country. Repeatedly acquiring firms in the same country familiarizes the
acquirer with the target’s country’s employment cultures and labor market, which
reduces frictions and uncertainty regarding the integration of the workforce from the
perspective of acquirer shareholders. As shown in Model (1) of Table V, while the
coefficient on Employment Quality is negative, the interaction term “Acquirer Employment
Quality t-1 × Repeat Acquisition” is positive and statistically significant at the 5% level,
supporting the above argument. In economic terms, a 30 point increase in Employment
Quality (one standard deviation) increases CARs by 0.15% if the acquirer has acquisition
experience in the target’s country, relative to a -0.36% decrease if this were not the case.
The second variable captures the uncertainty that rises from differences in labor
regulations between the target’s and the acquirer’s countries. If the acquirer’s CARs are
indeed driven by investors’ concerns about labor-related uncertainty when buying
foreign targets, this effect should be attenuated if the labor protection laws are weaker in
the target country. Weaker social security regulations in the target country make
implementation and integration of acquirer’s employment policies smoother and lessen
acquirer shareholders’ concerns about “wasting money” on target employees. Given our
above findings on the importance of an acquirer’s provision of monetary incentives such
as fringe benefits, we specifically focus on the social security aspect of labor regulations
(which includes state-imposed provision of health benefits and other pecuniary
3. CROSS-BORDER ACQUISITIONS AND EMPLOYEE RELATIONS
152
incentives). We do this by using the social security law index from Botero et al. (2004).
We regress acquirer CAR on the interaction of the acquirer’s employee relations with an
indicator for whether the target’s country has a lower social security laws index than the
acquirer’s country, and indeed find a positive coefficient of the interaction term,
indicating that weaker labor protection with regards to social security can resolve
acquirer shareholders’ concerns about post-merger integration uncertainties.56
The third variable captures the absence of economic nationalism in the target
country’s government as, in the inverse case foreign acquirers face more resistance from
target countries’ governments who may fear that foreign acquirers will infringe national
interests and that corporate restructuring result in massive lay-offs in the target firm. If
such “economic nationalism” is low, foreign acquirers with better employee relations
may face less political opposition and hence less labor-related uncertainty about the
integration of the workforce. Such integration is likely to be more effective in target
countries with weaker protectionist attitudes relative to countries with stronger
protectionist attitudes. We follow Dinc and Erel (2013) and use the ruling of a liberal
government (a dummy variable indicating whether the ruling government is right-wing;
data obtained from the Database of Political Institutions) in the target’s country to proxy
for the absence of economic nationalism, as (rightwing-)liberal parties usually and
traditionally favor more free trade (Dinc and Erel, 2013). This argument is supported by
the positive coefficient on the interaction term “Acquirer Employment Quality t-1 ×
(Absence of Economic Nationalism in Target Country)” in Model (4), which indicates that
the absence of strong economic nationalism reduces the effect of labor-related
uncertainty on shareholder returns.
56 These results only hold for the social security laws index. The other three dimensions of labor regulations - employment laws (firing workers, increasing working hours, dismissal procedures), collective relations laws, and civil rights laws are less directly related to incentives such as health insurance benefits. These results also suggest that our previous results on firm-level Employment Quality are not entirely explained by country-level labor regulations. Although others have documented that labor market regulations and ownership structure are substitutive governance mechanisms (e.g., Bennedsen, Huang, Wagner, and Zeume, 2015), we show that this may not be the case for firm-level employment policies; firm- and country-level measures of employee policies capture different aspects and cannot be used as substitutes.
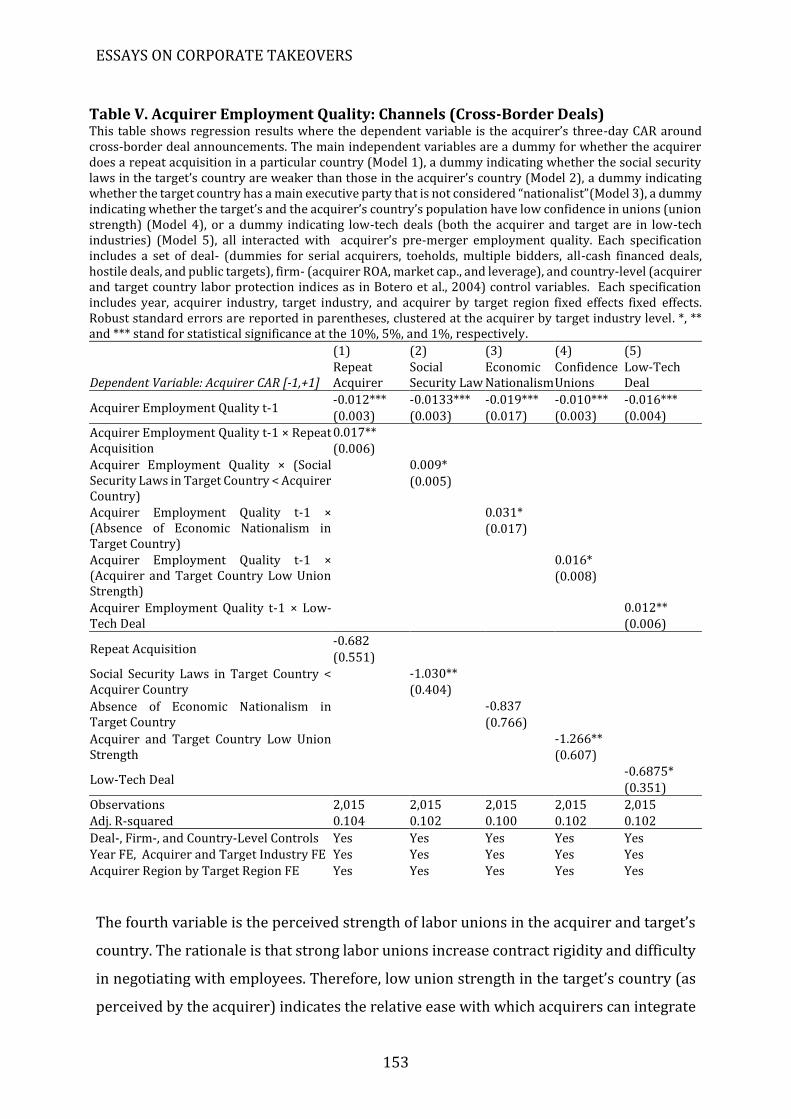
ESSAYS ON CORPORATE TAKEOVERS
153
The fourth variable is the perceived strength of labor unions in the acquirer and target’s
country. The rationale is that strong labor unions increase contract rigidity and difficulty
in negotiating with employees. Therefore, low union strength in the target’s country (as
perceived by the acquirer) indicates the relative ease with which acquirers can integrate
Table V. Acquirer Employment Quality: Channels (Cross-Border Deals) This table shows regression results where the dependent variable is the acquirer’s three-day CAR around cross-border deal announcements. The main independent variables are a dummy for whether the acquirer does a repeat acquisition in a particular country (Model 1), a dummy indicating whether the social security laws in the target’s country are weaker than those in the acquirer’s country (Model 2), a dummy indicating whether the target country has a main executive party that is not considered “nationalist”(Model 3), a dummy indicating whether the target’s and the acquirer’s country’s population have low confidence in unions (union strength) (Model 4), or a dummy indicating low-tech deals (both the acquirer and target are in low-tech industries) (Model 5), all interacted with acquirer’s pre-merger employment quality. Each specification includes a set of deal- (dummies for serial acquirers, toeholds, multiple bidders, all-cash financed deals, hostile deals, and public targets), firm- (acquirer ROA, market cap., and leverage), and country-level (acquirer and target country labor protection indices as in Botero et al., 2004) control variables. Each specification includes year, acquirer industry, target industry, and acquirer by target region fixed effects fixed effects. Robust standard errors are reported in parentheses, clustered at the acquirer by target industry level. *, ** and *** stand for statistical significance at the 10%, 5%, and 1%, respectively.
(1) (2) (3) (4) (5)
Dependent Variable: Acquirer CAR [-1,+1] Repeat Acquirer
Social Security Law
Economic Nationalism
Confidence Unions
Low-Tech Deal
Acquirer Employment Quality t-1 -0.012*** -0.0133*** -0.019*** -0.010*** -0.016*** (0.003) (0.003) (0.017) (0.003) (0.004)
Acquirer Employment Quality t-1 × Repeat Acquisition
0.017** (0.006)
Acquirer Employment Quality × (Social Security Laws in Target Country < Acquirer Country)
0.009* (0.005)
Acquirer Employment Quality t-1 × (Absence of Economic Nationalism in Target Country)
0.031*
(0.017)
Acquirer Employment Quality t-1 × (Acquirer and Target Country Low Union Strength)
0.016*
(0.008)
Acquirer Employment Quality t-1 × Low-Tech Deal
0.012** (0.006)
Repeat Acquisition -0.682 (0.551)
Social Security Laws in Target Country < Acquirer Country
-1.030** (0.404)
Absence of Economic Nationalism in Target Country
-0.837 (0.766)
Acquirer and Target Country Low Union Strength
-1.266** (0.607)
Low-Tech Deal -0.6875* (0.351)
Observations 2,015 2,015 2,015 2,015 2,015 Adj. R-squared 0.104 0.102 0.100 0.102 0.102
Deal-, Firm-, and Country-Level Controls Yes Yes Yes Yes Yes Year FE, Acquirer and Target Industry FE Yes Yes Yes Yes Yes Acquirer Region by Target Region FE Yes Yes Yes Yes Yes
3. CROSS-BORDER ACQUISITIONS AND EMPLOYEE RELATIONS
154
post-merger employment policies. Of course, if in the acquirer country there are strong
labor unions, the employees of the acquiring firm may attempt to resist the
implementation of favorable employment policies in the target firm as this may shift
resources from the acquirer’s to the target’s employees. We therefore specifically
consider the case in which both the acquirer and target countries’ have low perceived
union strength (“low” is defined as being in the bottom tercile of the distribution), where
perceived union strength is measured by “Confidence in Unions”, also from the World
Value Survey. As shown in Model (5), the interaction term “Acquirer Employment Quality
× (Acquirer and Target Country Low Union Strength)” has a positive loading, suggesting
that the negative effect of employee relations in cross-border deals becomes less negative
when both acquirer and target country have low perceived union strength.
In Model (5), we test whether labor-related uncertainty is smaller in low-tech deals
(in which target and acquirer are both in low-tech industries), relative to deals in which
at least one of the parties is in a high-tech industry. Firms in high-tech industries are more
vulnerable to labor-related shocks as the retention and incentivization of high-skilled
workers are more crucial to their operations (Ghaly, Dang, and Stathopoulos, 2017). We
thus expect that there are higher labor adjustment costs when acquiring a high-tech
target. In low-tech deals on the other hand, these costs should be lower, as integrating
workforce and employee policies for low-skilled employees is less difficult and costly. As
shown in Model (6), “Acquirer Employment Quality × Low-Tech deal” is significantly
positive, indicating that acquirer shareholders react more positively to cross-border
deals undertaken by high-employment quality acquirers that engage in low-tech deals.
For firms in low-tech industries, uncertainty regarding post-merger integration is likely
to be lower, such that the benefits of providing generous employment benefits are more
likely to outweigh the costs.
Overall, the results in Table V identify specific contexts in which the uncertainties
and costs associated with integrating employment policies are lower, such that the
inverse effect of employee relations on shareholder returns in cross-border M&As
becomes weaker, and can even be completely off-set. Combining this with the fact that
cross-border deals usually achieve higher abnormal returns, our results indicate that the
negative interaction between employment quality and cross-border deals as found in
Table III is not due to a deal being cross-border per se. Instead, there appears to be a
unique aspect of cross-border deals that induces new risks and costs associated with the
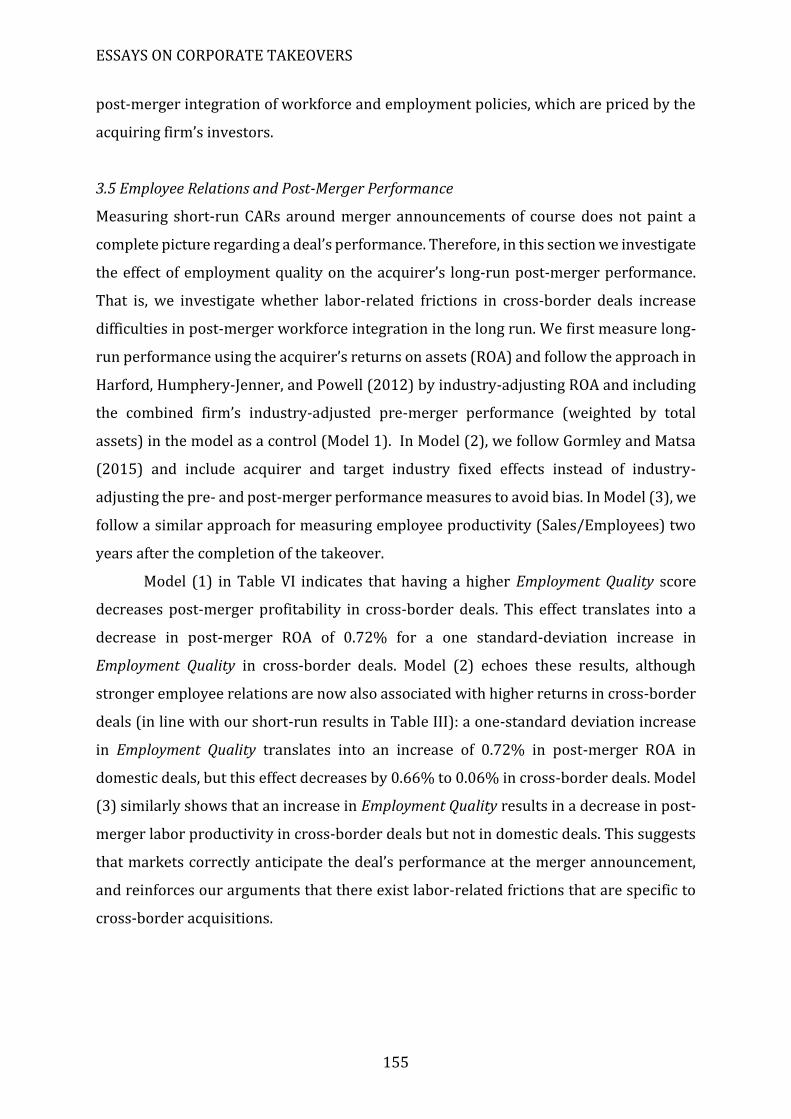
ESSAYS ON CORPORATE TAKEOVERS
155
post-merger integration of workforce and employment policies, which are priced by the
acquiring firm’s investors.
3.5 Employee Relations and Post-Merger Performance
Measuring short-run CARs around merger announcements of course does not paint a
complete picture regarding a deal’s performance. Therefore, in this section we investigate
the effect of employment quality on the acquirer’s long-run post-merger performance.
That is, we investigate whether labor-related frictions in cross-border deals increase
difficulties in post-merger workforce integration in the long run. We first measure long-
run performance using the acquirer’s returns on assets (ROA) and follow the approach in
Harford, Humphery-Jenner, and Powell (2012) by industry-adjusting ROA and including
the combined firm’s industry-adjusted pre-merger performance (weighted by total
assets) in the model as a control (Model 1). In Model (2), we follow Gormley and Matsa
(2015) and include acquirer and target industry fixed effects instead of industry-
adjusting the pre- and post-merger performance measures to avoid bias. In Model (3), we
follow a similar approach for measuring employee productivity (Sales/Employees) two
years after the completion of the takeover.
Model (1) in Table VI indicates that having a higher Employment Quality score
decreases post-merger profitability in cross-border deals. This effect translates into a
decrease in post-merger ROA of 0.72% for a one standard-deviation increase in
Employment Quality in cross-border deals. Model (2) echoes these results, although
stronger employee relations are now also associated with higher returns in cross-border
deals (in line with our short-run results in Table III): a one-standard deviation increase
in Employment Quality translates into an increase of 0.72% in post-merger ROA in
domestic deals, but this effect decreases by 0.66% to 0.06% in cross-border deals. Model
(3) similarly shows that an increase in Employment Quality results in a decrease in post-
merger labor productivity in cross-border deals but not in domestic deals. This suggests
that markets correctly anticipate the deal’s performance at the merger announcement,
and reinforces our arguments that there exist labor-related frictions that are specific to
cross-border acquisitions.
3. CROSS-BORDER ACQUISITIONS AND EMPLOYEE RELATIONS
156
Table VI. Long-Run Operating Performance This table shows regression results where the dependent variables are the acquirer’s average 2-year post-merger industry-adjusted ROA (defined as net income/assets) (Model 1), the acquirer’s 2-year post-merger ROA (Model 2), or the acquirer’s Sales-to-Employees ratio (Model 3) following completed domestic and cross-border deal announcements. The independent variables are the acquirer’s pre-merger employment quality score and the combined firm’s pre-merger (industry-adjusted) ROA (Models 1 and 2), or the combined industry-adjusted Sales-to-Employees ratio (Model 3). Each specification includes a set of deal- (relative deal size, dummies for serial acquirers, toeholds, multiple bidders, all-cash financed deals, hostile deals, diversifying deals, and public targets), firm- (acquirer ROA and leverage), and country-level (acquirer and target country labor protection indices as in Botero et al., 2004) control variables. Robust standard errors are reported in parentheses, and standard errors are clustered at the acquirer by target industry level. *, ** and *** stand for statistical significance at the 10%, 5%, and 1%, respectively.
Dependent variable:
(1)
2-Year Post-Merger
Acq. ROA (Ind. Adj.)
(2)
2-Year Post-Merger
Acq. ROA
(3)
2-Year Post-Merger Acq.
Sales/Employee
Acquirer Employment Quality 0.018 0.024** 0.012
(0.012) (0.011) (0.010)
Cross-Border 1.027 1.396 1.018 (1.080) (0.132) (0.659)
Acquirer Employment Quality x Cross-
Border
-0.024* -0.022* -0.018* (0.014) (0.012) (0.009)
Pre-Merger Combined ROA (Ind. Adj.) -0.014
(0.048)
Pre-Merger Combined ROA -0.024 (0.036)
Pre-Merger Combined Sales/Employees
Ratio
1.228***
(0.213)
Deal-, Firm-, and Country-Level Controls Yes Yes Yes
Acquirer and Target Industry Fixed
Effects
No Yes Yes
Observations 655 655 85
Adj. R-squared 0.126 0.481 0.928
3.6 The Role of the Target Firm’s Employee Relations and Announcement Returns
One could wonder whether our above results are driven by the target’s employee
relations, rather than the acquirer’s. Empirically this is a difficult question because we
have relatively few data on the targets’ employment quality scores in the ASSET4
database. ASSET4 mainly covers large firms included in the major global equity indices,
so most (small) targets do not receive a rating from ASSET4. Nevertheless, we conduct
tests on a subsample of deals with employment quality data available for both the target
and the acquiring firm (362 deals in total).
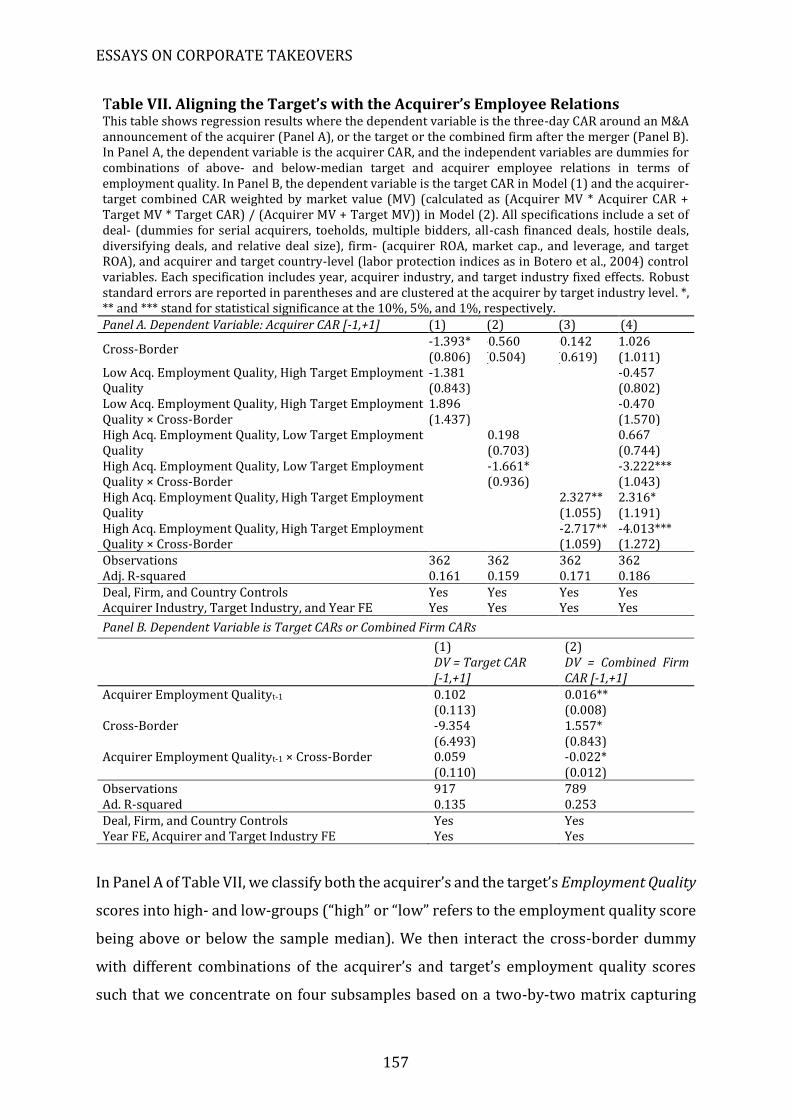
ESSAYS ON CORPORATE TAKEOVERS
157
Table VII. Aligning the Target’s with the Acquirer’s Employee Relations This table shows regression results where the dependent variable is the three-day CAR around an M&A announcement of the acquirer (Panel A), or the target or the combined firm after the merger (Panel B). In Panel A, the dependent variable is the acquirer CAR, and the independent variables are dummies for combinations of above- and below-median target and acquirer employee relations in terms of employment quality. In Panel B, the dependent variable is the target CAR in Model (1) and the acquirer-target combined CAR weighted by market value (MV) (calculated as (Acquirer MV * Acquirer CAR + Target MV * Target CAR) / (Acquirer MV + Target MV)) in Model (2). All specifications include a set of deal- (dummies for serial acquirers, toeholds, multiple bidders, all-cash financed deals, hostile deals, diversifying deals, and relative deal size), firm- (acquirer ROA, market cap., and leverage, and target ROA), and acquirer and target country-level (labor protection indices as in Botero et al., 2004) control variables. Each specification includes year, acquirer industry, and target industry fixed effects. Robust standard errors are reported in parentheses and are clustered at the acquirer by target industry level. *, ** and *** stand for statistical significance at the 10%, 5%, and 1%, respectively.
Panel A. Dependent Variable: Acquirer CAR [-1,+1] (1) (2) (3) (4)
Cross-Border -1.393* -0.560 -0.142 1.026 (0.806) (0.504) (0.619) (1.011)
Low Acq. Employment Quality, High Target Employment Quality
-1.381 -0.457 (0.843) (0.802)
Low Acq. Employment Quality, High Target Employment Quality × Cross-Border
1.896 -0.470 (1.437) (1.570)
High Acq. Employment Quality, Low Target Employment Quality
0.198 0.667 (0.703) (0.744)
High Acq. Employment Quality, Low Target Employment Quality × Cross-Border
-1.661* -3.222*** (0.936) (1.043)
High Acq. Employment Quality, High Target Employment Quality
2.327** 2.316* (1.055) (1.191)
High Acq. Employment Quality, High Target Employment Quality × Cross-Border
-2.717** -4.013*** (1.059) (1.272)
Observations 362 362 362 362 Adj. R-squared 0.161 0.159 0.171 0.186 Deal, Firm, and Country Controls Yes Yes Yes Yes Acquirer Industry, Target Industry, and Year FE Yes Yes Yes Yes
Panel B. Dependent Variable is Target CARs or Combined Firm CARs
(1) (2) DV = Target CAR
[-1,+1] DV = Combined Firm CAR [-1,+1]
Acquirer Employment Qualityt-1 0.102 0.016** (0.113) (0.008) Cross-Border -9.354 1.557* (6.493) (0.843) Acquirer Employment Qualityt-1 × Cross-Border 0.059 -0.022* (0.110) (0.012) Observations 917 789 Ad. R-squared 0.135 0.253 Deal, Firm, and Country Controls Yes Yes Year FE, Acquirer and Target Industry FE Yes Yes
In Panel A of Table VII, we classify both the acquirer’s and the target’s Employment Quality
scores into high- and low-groups (“high” or “low” refers to the employment quality score
being above or below the sample median). We then interact the cross-border dummy
with different combinations of the acquirer’s and target’s employment quality scores
such that we concentrate on four subsamples based on a two-by-two matrix capturing
3. CROSS-BORDER ACQUISITIONS AND EMPLOYEE RELATIONS
158
high/low scores by acquirers/targets, as shown in Table VII. We first investigate each
dimension separately in Models (1) – (3), and combine them in Model (4) (the “Acquirer
Low, Target Low” combination is omitted as it is the benchmark case). We find that our
results are almost exclusively valid for those cases with an above-median level of
employment quality in the acquirer, regardless of the target’s employment quality score.
In other words, the target’s employee relations do not seem to affect the impact of the
enhanced employee incentives of the acquirer and the labor-related frictions that we
identify.
Given the insignificant effect of the target’s employee relations, we again focus on
the acquirer’s employee relations, and test its effect on the announcement returns of the
target and of the combined firm. The results are shown in Panel B of Table VII. Column
(1) has the target’s CARs as the dependent variable, and shows that the coefficient on the
acquirer’s Employee Quality is insignificant. This is intuitive as target shareholders care
less about post-merger integration frictions and uncertainties. Given that they sell their
shares to the acquirer, they are much more likely to react to, for example, a higher deal
premium or the likelihood of deal completion. Column (2) has the combined firm CARs as
the dependent variable, and shows significant effects consistent with our earlier findings
(Column (2)). This significance seems completely driven by the acquirer’s CARs, as the
signs and magnitudes of the coefficients are in line with those in our baseline results using
the acquirer’s CARs (Table III). Of course, these results should be interpreted with
caution as they come from a relatively small subsample, but they are consistent with our
arguments and earlier results.
In the next section, we investigate the robustness of our results by performing a
placebo test and an instrumental variable test, and we rule out a large set of alternative
stories.
4. Robustness and Alternative Explanations
4.1 Placebo Test on Employee Relations and Propensity Score Matching
Are our results unique to the employment quality measure, or are the relations
hardwired in the rating metrics of the ASSET4 database? In Panel A of Table VIII, we show
results for a placebo test in which we investigate alternative dimensions of employee
relations that are not related to the provision of monetary incentives and which should
not be affected by frictions regarding firms’ abilities to incentivize employees. Model (1)
ESSAYS ON CORPORATE TAKEOVERS
159
repeats our analysis in Model (4) of Panel B in Table III, which we show here as a
benchmark. Models (2)-(4) show the results for 3 alternative dimensions of employee
relations, namely Workforce Health & Safety, Workforce Diversity, and Training &
Development. We combine them with Employment Quality in Model (5). We find that only
Employment Quality is significantly related to CARs, which supports our argument that
we capture labor-related frictions that affect monetary incentives but no other
dimensions of employee relations. Therefore, it is plausible to argue that employees are
more incentivized by benefits in terms of monetary compensation, than by the
improvement of their working environment or workforce diversity (Herzberg et al.,
1959).
Next, we perform a propensity score matching analysis as an alternative way to
control for differences in deal, firm, country, and industry-level characteristics. We match
deals involving acquirers with above-median Employment Quality with deals by acquirers
with below-median Employment Quality, and we use as matching variables the control
variables in our baseline specification (acquirer and target country-level labor indices,
serial acquirers, acquirer ROA, acquirer leverage, acquirer market capitalization,
toeholds, multiple bidders, all-cash financing, hostile deals, diversifying deals, and public
targets) as well as industries and years. As we estimate propensity scores, we bootstrap
the reported standard errors. The results in Panel B confirm that acquirers with high
Employment Quality earn 55 basis points higher returns in domestic deals relative to
matched firms with low Employment Quality, but this effect reverses for cross-border
deals. Again, this suggests that, although investing in employee relations can be beneficial
to firm value in domestic deals, there are additional labor-related costs when acquiring a
foreign target.
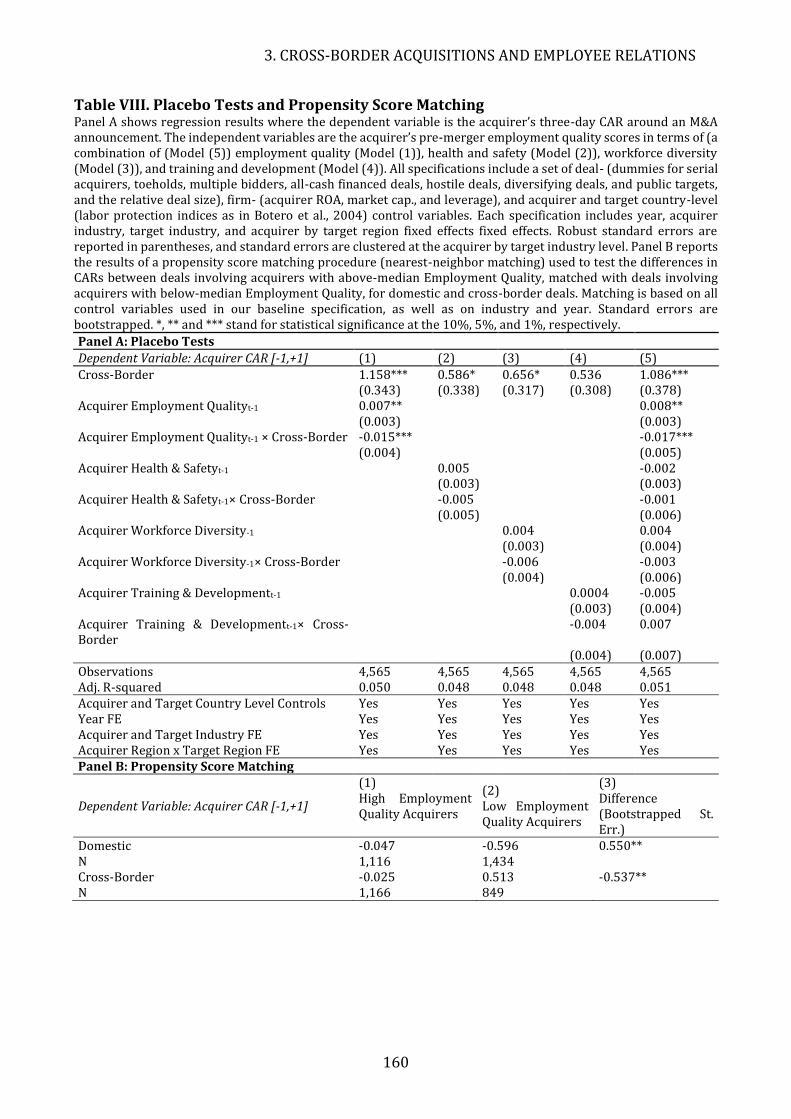
3. CROSS-BORDER ACQUISITIONS AND EMPLOYEE RELATIONS
160
Table VIII. Placebo Tests and Propensity Score Matching Panel A shows regression results where the dependent variable is the acquirer’s three-day CAR around an M&A announcement. The independent variables are the acquirer’s pre-merger employment quality scores in terms of (a combination of (Model (5)) employment quality (Model (1)), health and safety (Model (2)), workforce diversity (Model (3)), and training and development (Model (4)). All specifications include a set of deal- (dummies for serial acquirers, toeholds, multiple bidders, all-cash financed deals, hostile deals, diversifying deals, and public targets, and the relative deal size), firm- (acquirer ROA, market cap., and leverage), and acquirer and target country-level (labor protection indices as in Botero et al., 2004) control variables. Each specification includes year, acquirer industry, target industry, and acquirer by target region fixed effects fixed effects. Robust standard errors are reported in parentheses, and standard errors are clustered at the acquirer by target industry level. Panel B reports the results of a propensity score matching procedure (nearest-neighbor matching) used to test the differences in CARs between deals involving acquirers with above-median Employment Quality, matched with deals involving acquirers with below-median Employment Quality, for domestic and cross-border deals. Matching is based on all control variables used in our baseline specification, as well as on industry and year. Standard errors are bootstrapped. *, ** and *** stand for statistical significance at the 10%, 5%, and 1%, respectively.
Panel A: Placebo Tests
Dependent Variable: Acquirer CAR [-1,+1] (1) (2) (3) (4) (5)
Cross-Border 1.158*** 0.586* 0.656* 0.536 1.086*** (0.343) (0.338) (0.317) (0.308) (0.378)
Acquirer Employment Qualityt-1 0.007** 0.008** (0.003) (0.003) Acquirer Employment Qualityt-1 × Cross-Border -0.015*** -0.017***
(0.004) (0.005) Acquirer Health & Safetyt-1 0.005 -0.002 (0.003) (0.003) Acquirer Health & Safetyt-1× Cross-Border -0.005 -0.001
(0.005) (0.006) Acquirer Workforce Diversity-1 0.004 0.004 (0.003) (0.004) Acquirer Workforce Diversity-1× Cross-Border -0.006 -0.003
(0.004) (0.006) Acquirer Training & Developmentt-1 0.0004 -0.005 (0.003) (0.004) Acquirer Training & Developmentt-1× Cross-Border
-0.004 0.007
(0.004) (0.007)
Observations 4,565 4,565 4,565 4,565 4,565 Adj. R-squared 0.050 0.048 0.048 0.048 0.051 Acquirer and Target Country Level Controls Yes Yes Yes Yes Yes Year FE Yes Yes Yes Yes Yes Acquirer and Target Industry FE Yes Yes Yes Yes Yes Acquirer Region x Target Region FE Yes Yes Yes Yes Yes Panel B: Propensity Score Matching
Dependent Variable: Acquirer CAR [-1,+1]
(1) High Employment Quality Acquirers
(2) Low Employment Quality Acquirers
(3) Difference (Bootstrapped St. Err.)
Domestic N
-0.047 1,116
-0.596 1,434
0.550**
Cross-Border N
-0.025 1,166
0.513 849
-0.537**
ESSAYS ON CORPORATE TAKEOVERS
161
4.2 Alternative Explanations
In Table IX, we further conduct several more tests to rule out other alternative
explanations for our results that may be unrelated to labor-related frictions in cross-
border M&As. First, the attenuating effect of cross-border deals that we identify may
simply capture the geographical distance between the acquirer’s and target’s country.
Although such an argument does not explain why only monetary incentives are affected,
we nevertheless interact Employment Quality with an indicator for whether the
geographical distance between the acquirer’s and target’s countries is above the sample
median (Model (1)). Similarly, many have documented that the acquirer and target
countries sharing a common language or a common border may explain the propensity
and returns of cross-border deals. We therefore interact Employment Quality with
indicator variables capturing whether the acquirer’s and target’s countries have a
language in common (Model (2)), or a share a common border (Model (3)). Third, our
results may also be driven by a difference in GDP per capita between the acquirer’s and
the target’s countries. That is, if acquirers providing generous employee welfare (i.e., high
employment quality) are firms from high GDP per capita countries that acquire targets in
low GDP per capita countries, it could be that it is such difference in economic
development that drives the negative CARs around cross-border deals. We therefore
interact Employment Quality with the difference between the two countries’ GDP per
capita (in logarithm) (Model (4)). Fourth, the level of employee relations may be driven
by the difference between the cultures of the target’s and the acquirer’s countries that
are unrelated to labor issues (Ahern, Daminelli, and Fracassi, 2015). Hence, in Models (5)
and (6), we interact the Employment Quality score with two World Value Survey variables
capturing the difference between the acquirer’s and target’s countries in terms of
people’s attitudes towards work. We consider the percentage of people considering
“Responsibility Is Important” and “Job Security Is Important.” The latter dimension is an
important test, as we found that our results are almost exclusively driven by monetary
incentives. Therefore, we should not expect to find that the relative importance of job
security incentives induces labor-related frictions when acquiring a foreign target. As
expected, we find that none of the above mentioned interactions have significant
coefficients.
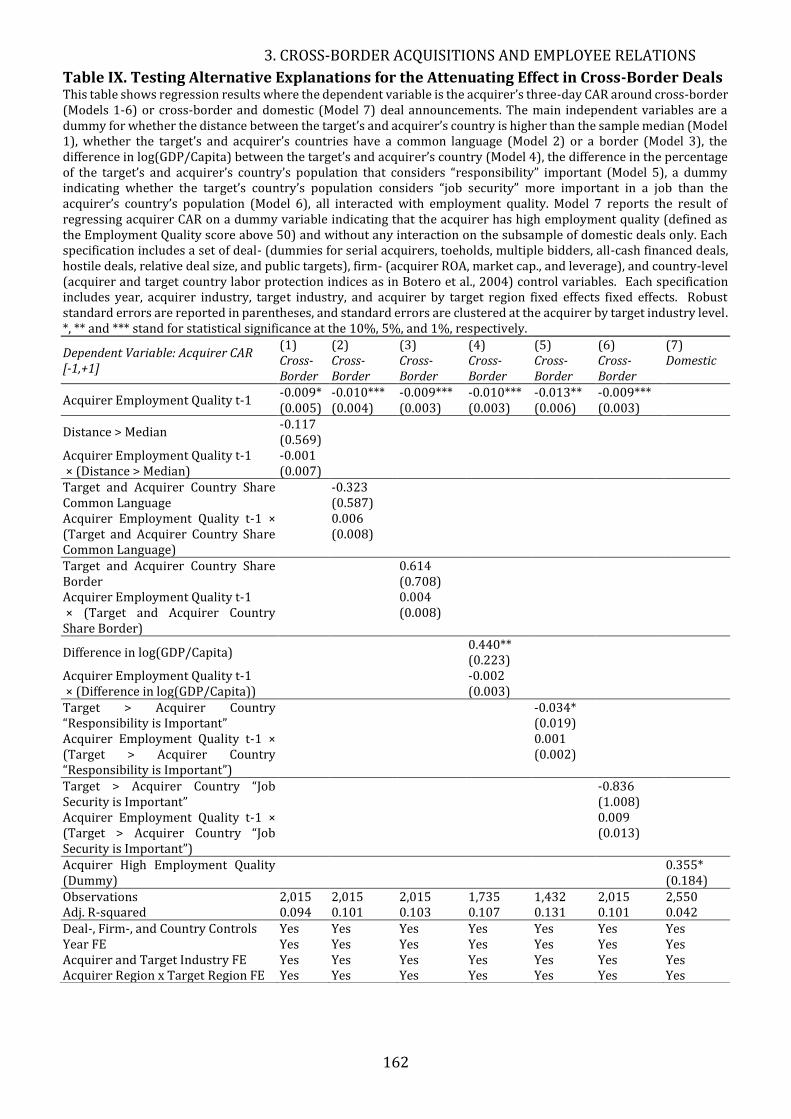
3. CROSS-BORDER ACQUISITIONS AND EMPLOYEE RELATIONS
162
Table IX. Testing Alternative Explanations for the Attenuating Effect in Cross-Border Deals This table shows regression results where the dependent variable is the acquirer’s three-day CAR around cross-border (Models 1-6) or cross-border and domestic (Model 7) deal announcements. The main independent variables are a dummy for whether the distance between the target’s and acquirer’s country is higher than the sample median (Model 1), whether the target’s and acquirer’s countries have a common language (Model 2) or a border (Model 3), the difference in log(GDP/Capita) between the target’s and acquirer’s country (Model 4), the difference in the percentage of the target’s and acquirer’s country’s population that considers “responsibility” important (Model 5), a dummy indicating whether the target’s country’s population considers “job security” more important in a job than the acquirer’s country’s population (Model 6), all interacted with employment quality. Model 7 reports the result of regressing acquirer CAR on a dummy variable indicating that the acquirer has high employment quality (defined as the Employment Quality score above 50) and without any interaction on the subsample of domestic deals only. Each specification includes a set of deal- (dummies for serial acquirers, toeholds, multiple bidders, all-cash financed deals, hostile deals, relative deal size, and public targets), firm- (acquirer ROA, market cap., and leverage), and country-level (acquirer and target country labor protection indices as in Botero et al., 2004) control variables. Each specification includes year, acquirer industry, target industry, and acquirer by target region fixed effects fixed effects. Robust standard errors are reported in parentheses, and standard errors are clustered at the acquirer by target industry level. *, ** and *** stand for statistical significance at the 10%, 5%, and 1%, respectively.
Dependent Variable: Acquirer CAR [-1,+1]
(1) (2) (3) (4) (5) (6) (7) Cross-Border
Cross-Border
Cross-Border
Cross-Border
Cross-Border
Cross-Border
Domestic
Acquirer Employment Quality t-1 -0.009* -0.010*** -0.009*** -0.010*** -0.013** -0.009*** (0.005) (0.004) (0.003) (0.003) (0.006) (0.003)
Distance > Median -0.117 (0.569)
Acquirer Employment Quality t-1 × (Distance > Median)
-0.001 (0.007)
Target and Acquirer Country Share Common Language
-0.323 (0.587)
Acquirer Employment Quality t-1 × (Target and Acquirer Country Share Common Language)
0.006 (0.008)
Target and Acquirer Country Share Border
0.614 (0.708)
Acquirer Employment Quality t-1 × (Target and Acquirer Country Share Border)
0.004 (0.008)
Difference in log(GDP/Capita) 0.440** (0.223)
Acquirer Employment Quality t-1 × (Difference in log(GDP/Capita))
-0.002 (0.003)
Target > Acquirer Country “Responsibility is Important”
-0.034* (0.019)
Acquirer Employment Quality t-1 × (Target > Acquirer Country “Responsibility is Important”)
0.001 (0.002)
Target > Acquirer Country “Job Security is Important”
-0.836 (1.008)
Acquirer Employment Quality t-1 × (Target > Acquirer Country “Job Security is Important”)
0.009 (0.013)
Acquirer High Employment Quality (Dummy)
0.355* (0.184)
Observations 2,015 2,015 2,015 1,735 1,432 2,015 2,550 Adj. R-squared 0.094 0.101 0.103 0.107 0.131 0.101 0.042 Deal-, Firm-, and Country Controls Yes Yes Yes Yes Yes Yes Yes Year FE Yes Yes Yes Yes Yes Yes Yes Acquirer and Target Industry FE Yes Yes Yes Yes Yes Yes Yes Acquirer Region x Target Region FE Yes Yes Yes Yes Yes Yes Yes
ESSAYS ON CORPORATE TAKEOVERS
163
What remains unclear is whether the negative effect when acquiring a foreign target is
the result of labor-related frictions specific to cross-border deals, or whether it results
from simply over-engaging in providing employee welfare which could be too costly and
thus reduces firm value. The descriptive statistics in Panel A of Table II indicate that these
two effects may coincide, and we need to disentangle them to further pin down the exact
mechanism. Therefore, we consider an indicator for whether the acquirer’s Employment
Quality score is above the score of 50 (larger than the industry average, which we
consider as “over-investment” in employee relations), but we investigate its effect on the
subsample of domestic deals only. If the over-investment story holds, we expect a
significant and negative coefficient of the “High Employment Quality” dummy in this
subsample of domestic deals. The positive coefficient in Model (7) refutes this, and
suggests that the negative effect of employment quality in cross-border deals does not
arise from the acquirer over-investment in employee relations in general.
4.3 Instrumental Variable Approach
In earlier specifications, we have shown that our results are not likely to be driven by
time-invariant underlying characteristics of firms that acquire domestically or
internationally (see Model (6) in Panel B of Table III). In addition, it seems unlikely that
acquirers adjust their level of employment quality because they may do a takeover bid in
the next year. To reduce a potential omitted variable bias, we included industry, year,
region by region, country by country, and acquirer firm fixed effects, along with a large
number of control variables in our specifications. However, to further account for
potential endogeneity issues from unobservable omitted variables, we perform a two-
stage instrumental variable (IV) regression as a robustness test. Specifically, we use the
acquirer’s industry peers’ average employee wages and benefits as an IV for Employment
Quality. Whereas a firm’s expenses in terms of wages and benefits are influenced by the
wage expenses by its industry peers (satisfying the relevance requirement of
instrumental variables), it is unlikely that these expenses by industry peers affect the
firm’s announcement returns directly or through channels other than the focal firm’s
employment policies, thus satisfying the exclusion condition.57 Similar arguments on peer
57 One potential concern is that the firm’s employment quality and its peer firms’ wages and benefits expenses are affected by transitory political or economic situations (e.g. “Brexit”). However, as our employment quality score is adjusted for the firm’s global industry peers rather than its national peers, such local events should not affect our identification in a substantial way.
3. CROSS-BORDER ACQUISITIONS AND EMPLOYEE RELATIONS
164
effects are made for other corporate policies such as capital structure (Leary and Roberts,
2014), corporate financial policies (Ferrell, Liang, and Renneboog, 2016), corporate
social responsibility (Cao, Liang, and Zhan, 2017; Liang and Renneboog, 2017), and
corporate culture (Fiordelisi, Li, Stentella-Lopes, and Ricci, 2016). We take the within-
sample mean of the lagged employee salaries and benefits expenses (as obtained from
Worldscope) for the focal company’s peer firms by industry and by year (industry-year
average) as the IV. The results for the first- and second-stage regressions are presented
in Appendix E. We find that the industry peers’ average wage expenses are strongly
positively related to Employment Quality and that using an IV approach does not affect
our conclusions from Table 3: higher levels of employment quality (as predicted in the
first stage) is positively related to CARs in domestic deals, and the effect again reverses
in cross-border deals. This increases our confidence that the effects on shareholder value
we have identified are indeed driven by the acquirer’s level of employee relations.
4.4 Other Robustness Tests
We further conduct a few other sample-specific robustness tests. First, based on our
sample distributions, one could argue that our results may be driven by US acquirers, as
they make up 27% of our sample (Appendix C). In Appendix F, we repeat our results for
a sample excluding US acquirers. We find that our results remain qualitatively unchanged,
suggesting that we are identifying a global phenomenon. Similarly, our results may be
driven a small subsample of serial acquiring firms that have radically different strategies
for acquiring domestic versus foreign targets. Excluding serial acquiring firms also does
not affect our results, however. Next, we investigate whether our results may be driven
by a demand-side story in which employees demand for stronger monetary
compensation with the threat that they may otherwise leave the firm. Although such an
explanation is hard to reconcile with our earlier evidence, we test this by comparing
subsamples of deals involving targets from OECD targets versus those from non-OECD
targets. The costs of rewarding employees from targets in developing countries with
strong monetary incentives may outweigh the benefits, as these employees are unlikely
to have many outside options. They are thus unlikely to threaten to leave the firm if their
demands are not met, such that the costs of providing strong incentives do not outweigh
the benefits of retaining employees. We find that such an effect does not drive our results,
as all our results appear in the sample consisting of OECD targets and not in the sample
ESSAYS ON CORPORATE TAKEOVERS
165
consisting of non-OECD targets. Last, we investigate a different dimension of the demand-
side story, by interacting employment quality with a proxy for the firm’s reputation. We
construct an indicator for whether the firm won an employee award as such firms likely
have better reputations. In these firms, employees may not threaten to leave if their
demands are not met as firm reputation acts as an incentive by itself. However, we find
no significant effects, indicating that our results are more likely to be driven by a supply-
side argument rather than a demand-side argument.
We also examine whether a firm’s level of employee relations drives the returns
around domestic and cross-border M&A deals through its effect on increasing/reducing
the likelihood of engaging in a domestic versus a cross-border M&A. We use a Heckman
selection model to estimate the relation between the firm’s employment quality and the
likelihood of the firm embarking on a domestic versus a cross-border takeover
transaction, conditional on the firm having decided on performing an M&A transaction.
Gao and Ma (2016) and Ouimet and Zarutskie (2016) find that labor regulation is strongly
related to takeover propensity. Our results, based on firm-level data (which go beyond
the country-level regulations), show that a firm’s employment quality is positively related
to engaging in M&A deals (in the first stage), but that the magnitudes are economically
very small. In addition, the firm’s employment quality is not significantly related to the
choice between domestic and cross-border deals (2nd stage regressions; tables available
upon request). This implies that a firm’s treatment of its employees (over and beyond a
country’s labor regulations) is not likely to be a significant driver of management’s
decision to engage in domestic or cross-border M&A deals, but it does affect the value
creation in these deals.
5. Conclusions
Despite the plethora of studies on how cross-border takeovers differ from domestic ones,
the roles of human capital and employee relations remain under-explored. In this paper,
we have provided novel evidence on how human capital at the firm-level matters in M&As
by investigating the effects of an acquiring firm’s treatment of employees in terms of
monetary and job security incentives on the returns to shareholders around M&A
announcements for a sample of large public corporations around the world. We find
acquirers with stronger employee relations (especially in terms of monetary
compensation) earn substantially higher returns around domestic M&A announcements,
3. CROSS-BORDER ACQUISITIONS AND EMPLOYEE RELATIONS
166
but this effect is reversed in cross-border acquisitions. We attribute this reversal effect to
shareholders’ negative perception of uncertainties regarding the post-merger integration
of the workforce. The underlying idea is that treating employees well can reduce labor
adjustment costs during the post-merger reorganization process, but the increased
uncertainties in cross-border deals may result in acquirer shareholders’ perception of the
costs outweighing the benefits on providing generous employment policies. We do not
find consistent evidence that (differences in) economic development, culture,
geographical distance, or language drive our results. Furthermore, our main findings
stem from the acquirer’s treatment of employees rather than the target’s, and they are
mainly driven by the provision of monetary incentives rather than by job security
incentives. Our results are also robust to acquirer fixed effects, to propensity score
matching, to using instrumental variables, and to the construction of different samples,
and we also find that the short-run results are echoed by the acquirer’s long-run
performance.
Our study adds to the literature on the determinants of value creation in cross-
border acquisitions. By acquiring a foreign target, firms can take advantage of cross-
country differences in legal environments and investor protection (Rossi and Volpin,
2004; Bris and Cabolis, 2008), product markets (DeGiovanni, 2005), financial
development (Alquist et al., 2014), and tax rules (Huizinga and Voget, 2009). However,
such differences also induce additional complexity and uncertainties (Aguilera and
Dencker, 2004) arising from cultural and organizational differences that affect post-
merger coordination and the realization of merger synergies (Siegel, Licht, and Schwartz,
2012; Ahern et al., 2015). This paper provides evidence for a new source of frictions
arising in cross-border acquisitions, namely those related to the transfer and integration
of workforce and corporate employment policies across national borders.
Our study is also related to the growing literature on human capital in M&As. While
some recent studies look at labor relations in the context of corporate restructuring and
takeovers (Atanassov and Kim, 2009; Masulis et al., 2016; John, Knyazeva, and Knyazava,
2015; Dessaint et al., 2016; Levine et al., 2015; Kim et al., 2015; Lin, Schmid, and Xuan,
2017; Ahmad and Lambert, 2016), these studies consider the country-level rather than
the firm-level. In addition, a large fraction of studies investigates these issues in a single-
country setting, generally based on the US framework (Pagano and Volpin, 2005;
Cronqvist et al., 2009; Edmans, 2011; 2012; Edmans, Li, and Zhang, 2015); Masulis et al.,
ESSAYS ON CORPORATE TAKEOVERS
167
2016). Instead, this paper is among the first to provide global evidence on firm-level
investment in employee relations and how labor-related frictions in cross-border M&A
deals affect the link between a company’s employee relations and deal performance.
Taken together, our findings suggest an explanation for the marked differences in deal
performance between domestic and cross-border takeovers, as well as for the conflicting
findings in the existing literature on the role of labor orientation in driving firm and
shareholder value. Perhaps the most intuitive implication of our results is that firms and
shareholders should not consider generous employee benefits as being absolutely good
or bad for firm value in the context of firm reorganization. A trade-off exists between
value-enhancing incentive effects and the labor-related frictions brought about by cross-
border deals. Overall, our findings reinforce the notion that employees play a
fundamental yet nuanced role in a corporation, and highlight the importance of taking
into account such nuances when studying M&As and the interplay between finance and
labor, which remain a fruitful area for future research.
3. CROSS-BORDER ACQUISITIONS AND EMPLOYEE RELATIONS
168
References
Aguilera, R. V. and Dencker, J.C. 2004. The Role of Human Resource Management in Cross-
Border Mergers and Acquisitions. International Journal of Human Resource
Management 15(8), 1335-1370.
Ahern, K. R., and Weston, J.F. 2007. M&As: The Good, the Bad, and the Ugly. Journal of
Applied Finance 17(1), 5-20.
Ahern, K. R., D. Daminelli, and Fracassi, C. 2015. Lost in Translation? The Effect of Cultural
Values on Mergers Around the World, Journal of Financial Economics 117(1), 165-
189.
Ahmad, F. and Lambert, T. 2016. Collective Bargaining and Takeover Activity around the
World. Working Paper available at SSRN: https://ssrn.com/abstract=2625952.
Alimov, A. 2015. Labor Market Regulations and Cross-Border Mergers and Acquisitions.
Journal of International Business Studies 46, 984–1009.
Alquist, R., R. Mukherjee, and Tesar, L. 2014. Liquidity-Driven Foreign Direct Investment.
Working Paper no. 17/2014, Graduate Institute of International and Development
Studies.
Atanassov, J. and Kim, E.H. 2009. Labor and Corporate Governance: International
Evidence from Restructuring Decisions. Journal of Finance, 64: 341–374.
Belo, F., X. Lin, and Bazdresch, S. 2014. Labor Hiring, Investment, and Stock Return
Predictability In The Cross-Section. Journal of Political Economy 122 (1), 129-177.
Bennedsen, M., S. Huang, H. F. Wagner, and Zeume, S. 2015. Family Firms and Labor
Market Regulation. Working Paper available at SSRN:
https://ssrn.com/abstract=2511044.
Botero, J. C., S. Djankov, R. La Porta, F. Lopez-de-Silanes, and Shleifer, A. 2004. The
Regulation of Labor. The Quarterly Journal of Economics 119 (4), 1339-1382.
Bris, A. and Cabolis, C. 2008. The Value of Investor Protection: Firm Evidence from Cross-
Border Mergers. Review of Financial Studies 21, 605-648.
Calcagno, R. and Renneboog, L. 2007. The Incentive to Give Incentives: On the Relative
Seniority of Debt Claims and Managerial Compensation, Journal of Banking and
Finance 31 (6), 1795-1815.
Cao, J., H. Liang, and Zhan, X. 2016. Peer Effects of Corporate Social Responsibility.
Working paper available at SSRN: https://ssrn.com/abstract=2831834.
ESSAYS ON CORPORATE TAKEOVERS
169
Card, D., J. Heining, and Kline, P. 2013. Workplace Heterogeneity and the Rise of West
German Wage Inequality. The Quarterly Journal of Economics 128(3), 967-1015.
Chari, A., P.P. Ouimet, and Tesar, L.L. 2010. The Value of Control in Emerging Markets.
Review of Financial Studies, 23(4): 1741-1770.
Cronqvist, H., F. Heyman, M. Nilsson, H. Svaleryd, and Vlachos, J. 2009. Do Entrenched
Managers Pay Their Workers More? Journal of Finance, 64: 309–339.
Datta, D. K. 1991. Organizational Fit and Acquisition Performance: Effect of Post-
Acquisition Integration. Strategic Management Journal 12(4): 281-297.
DeGiovanni, J. 2005. What Drives Capital Flows? The Case of Cross-Border M&A Activity
and Financial Deepening. Journal of International Economics 65, 127-149.
Deng, X., J. Kang, and Low, B.S. 2013. Corporate Social Responsibility and Stakeholder
Value Maximization: Evidence from Mergers. Journal of Financial Economics 110 (1),
87-109.
Dessaint, O., A. Golubov, and Volpin, P.F. 2017. Employment Protection and Takeovers.
Journal of Financial Economics 125(2): 369-388.
Dinc, I. S. and Erel, I. 2013. Economic Nationalism in Mergers and Acquisitions. Journal of
Finance 68 (6), 2471-2514.
Dixit, A. 1997. Investment and Employment Dynamics in the Short Run and the Long Run.
Oxford Economic Papers 49: 1-20.
Doukas, J., and Travlos, N. 1988. The Effect of Corporate Multinationalism on
Shareholders’ Wealth: Evidence from International Acquisitions, Journal of Finance
53(5), 1161-1175.
Eckbo, B.E. 2009. Bidding Strategies and Takeover Premiums: A Review, Journal of
Corporate Finance 15(1), 149-178.
Edmans, A. 2011. Does the Stock Market Fully Value Intangibles? Employee Satisfaction
and Equity Prices. Journal of Financial Economics 101 (3), 621-640.
Edmans, A. 2012. The Link between Job Satisfaction and Firm Value, With Implications
for Corporate Social Responsibility. Academy of Management Perspectives 26(4), 1-
19.
Edmans, A., L. Li, and Zhang, C. 2015. Employee Satisfaction, Labor Market Flexibility, and
Stock Returns around The World. European Corporate Governance Institute (ECGI) -
Finance Working Paper No. 433/2014. Available at SSRN:
https://ssrn.com/abstract=2461003.
3. CROSS-BORDER ACQUISITIONS AND EMPLOYEE RELATIONS
170
Erel, I., C. Liao, and Weisbach, M.S. 2012. Determinants of Cross-Border Mergers and
Acquisitions, Journal of Finance 67(3), 1045-1082.
Ferrell, A., H. Liang, and Renneboog, L. 201.) Socially Responsible Firms. Journal of
Financial Economics, 122(3), 585-606.
Fiordelisi, F., K. Li, S. Stentella-Lopes, and Ricci, O. 2016. Corporate Culture and Mergers
and Acquisitions, Working Paper.
Frésard, L., U. Hege, and Phillips, G. 2017. Extending Industry Specialization through
Cross-Border Acquisitions. Review of Financial Studies 30(5), 1540-1582.
Fulghieri, P. and Sevilir, M. 2011. Mergers, Spinoffs, and Employee Incentives. Review of
Financial Studies 24 (7), 2207-2241.
Gao, H. and Ma, Y. 2016. Human Capital Driven Acquisition: Evidence from the Inevitable
Disclosure Doctrine. Working Paper available at SSRN:
https://ssrn.com/abstract=2713600.
Ghaly, M., V.A. Dang, and Stathopoulos, K. 2017. Cash Holdings and Labor Heterogeneity:
The Role of Skilled Labor. Review of Financial Studies 30(10): 3636-3668.
Harford, J., M. Humphery-Jenner, and Powell, R. 2012. The Sources of Value Destruction
in Acquisitions by Entrenched Managers. Journal of Financial Economics 106 (2),
247-261.
Herzberg, F., B. Mausner, and Snyderman, B.B. 1959. The Motivation to Work (2nd ed).
New York: John Wiley & Sons.
Herzberg, F. 1964. The Motivation-Hygiene Concept and Problems of Manpower.
Personnel Administrator 27, 3-7.
Herzberg, F. 1966. Work and The Nature Of Man. Cleveland, OH: World Publishing
Economy.
Huizinga, H., and Voget, J. 2009. International Taxation and the Direction and Volume of
Cross-Border M&As. Journal of Finance 64, 1217-1249.
John, K., A. Knyazeva, and Knyazeva, D. 2015. Employee Rights and Acquisitions. Journal
of Financial Economics 118, 46-69.
Karolyi, G.A., and Liao, R.C. 2017. State Capitalism’s Global Reach: Evidence from Foreign
Acquisitions by State-Owned Companies, Journal of Corporate Finance 42, 367-391.
Kim, E., Maug, E. G. and Schneider, C. 2015. Labor Representation in Governance as an
Insurance Mechanism. European Corporate Governance Institute (ECGI) - Finance
ESSAYS ON CORPORATE TAKEOVERS
171
Working Paper No. 411/2014. Available at
SSRN: https://ssrn.com/abstract=2399399.
Leary, M.T., and Roberts, M.R. 2014. Do Peer Firms Affect Corporate Financial Policy,
Journal of Finance 69(1), 139-178.
Levine, R., C. Lin, and Shen, B. 2015. Cross-Border Acquisitions: Do Labor Regulations
Affect Acquirer Returns? Working Paper.
Liang, H., and Renneboog, L. 2016. Corporate Donations and Shareholder Value. Oxford
Review of Economic Policy 33(2): 278-316.
Lin, C., M. S. Officer, and Zou, H. 2011. Directors’ and Officers’ Liability Insurance And
Acquisition Outcomes. Journal of Financial Economics 102 (3), 507-525.
Lin, C., T. Schmid, and Xuan, Y. 2017. Employee Representation and Financial Leverage,
Journal of Financial Economics, forthcoming.
Maksimovic, V., Phillips, G., Prabhala, N. R. 2011. Post-Merger Restructuring and the
Boundaries of the Firm. Journal of Financial Economics 102, 317–343.
Masulis, R., C. Wang, and Xie, F. 2016. Employee-Manager Alliances and Shareholder
Returns from Acquisitions, Working Paper available at SSRN:
https://ssrn.com/abstract=2895745.
Mueller, H., P. Ouimet, and E. Simintzi. 2017. Wage Inequality and Firm Growth. Review of
Financial Studies, forthcoming.
Ouimet, P. P., and Zarutskie, R. 2016. Acquiring Labor. Working Paper available at SSRN:
https://ssrn.com/abstract=1571891.
Pagano, M. and Volpin, P.F. 2005. Managers, Workers, and Corporate Control. Journal of
Finance, 60: 841–868.
Rossi, S., and Volpin, P.F. 2004. Cross-Country Determinants of Mergers and Acquisitions.
Journal of Financial Economics, 74 (2), 277-304.
Siegel, J.I., A.N. Licht, and Schwartz, S.H. 2012. Egalitarianism, Cultural Distance, and
Foreign Direct Investment: A New Approach. Organization Science 24(4), 1174-
1194.
Tian, X., Wang, W. 2016. Hard Marriage with Heavy Burdens: Labor Unions as Takeover
Deterrents. Unpublished working paper. Indiana University and Tsinghua
University, Bloomington, IN, and Beijing, China.
Williamson, O. 1981. The Economics of Organization: The Transaction Cost Approach.
American Journal of Sociology 87, 548-577.
3. CROSS-BORDER ACQUISITIONS AND EMPLOYEE RELATIONS
172
Appendix Appendix A. Variable Descriptions Deal Characteristics
Cross-Border A dummy equal to one if the deal is labelled as “Cross-Border” in SDC, and zero otherwise. Source: SDC Mergers and Acquisitions Database.
Public Target A dummy equal to one if the target’s public status is “Listed”, and zero otherwise. Source: SDC Mergers and Acquisitions Database.
Diversifying Deal A dummy equal to one if the acquirer’s 2-digit SIC code is different from the target’s 2-digit SIC code, and zero otherwise. Source: SDC Mergers and Acquisitions Database.
Hostile Deal A dummy equal to one if the deal’s attitude is labelled as “Hostile” in SDC, and zero otherwise. Source: SDC Mergers and Acquisitions Database.
All-Cash Financing A dummy equal to one if the deal is fully financed in cash, and zero otherwise. Source: SDC Mergers and Acquisitions Database.
Multiple Bidders A dummy equal to one if more than one bidding firm was involved in the deal, and zero otherwise. Source: SDC Mergers and Acquisitions Database.
Firm Characteristics
Toehold A dummy equal to one if the acquiring firm had a toehold before the acquisition, and zero otherwise. Source: SDC Mergers and Acquisitions Database.
Relative Deal Size Value of the deal, divided by the market value of equity of the acquiring firm. Source: SDC Mergers and Acquisitions Database.
Acquirer Total Assets Log of the acquirer’s total assets. Source: Datastream.
Acquirer Market Cap. Log of the acquirer’s market capitalization (market value of equity). Source: Datastream.
Acquirer Leverage Book value of the acquirer’s total liabilities, divided by the market value of assets. Source: Datastream.
Acquirer ROA Acquirer’s EBITDA, divided by the book value of assets. Source: Datastream.
Serial Acquirer A dummy equal to one if the acquiring firm made more than 10 takeover announcements over the sample period, and zero otherwise.
Country Labor Regulations
Employment Laws Index
Measures the protection of labor and employment laws, calculated as the average of (i) alternative employment contracts; (ii) cost of increasing hours worked; (iii) cost of firing workers; and (iv) dismissal procedures. Source: Botero et al. (2004).
Collective Relations Laws Index
Measures the protection of collective relations laws, calculated as the average of (i) labor union power and (ii) collective disputes. Source: Botero et al. (2004).
Social Security Laws Index
Measures social security benefits, based on measures of (i) old age, disability and death benefits; (ii) sickness and health benefits; and (iii) unemployment benefits. Source: Botero et al. (2004).
Civil Rights Index
Measures the degree of protection of vulnerable groups against employment discrimination, based on measures of (i) labor discrimination on grounds of race is expressly prohibited by law, (ii) labor discrimination on grounds of gender is expressly prohibited by law, (iii) statutory duration of maternity leave with retention of 100% of earnings,
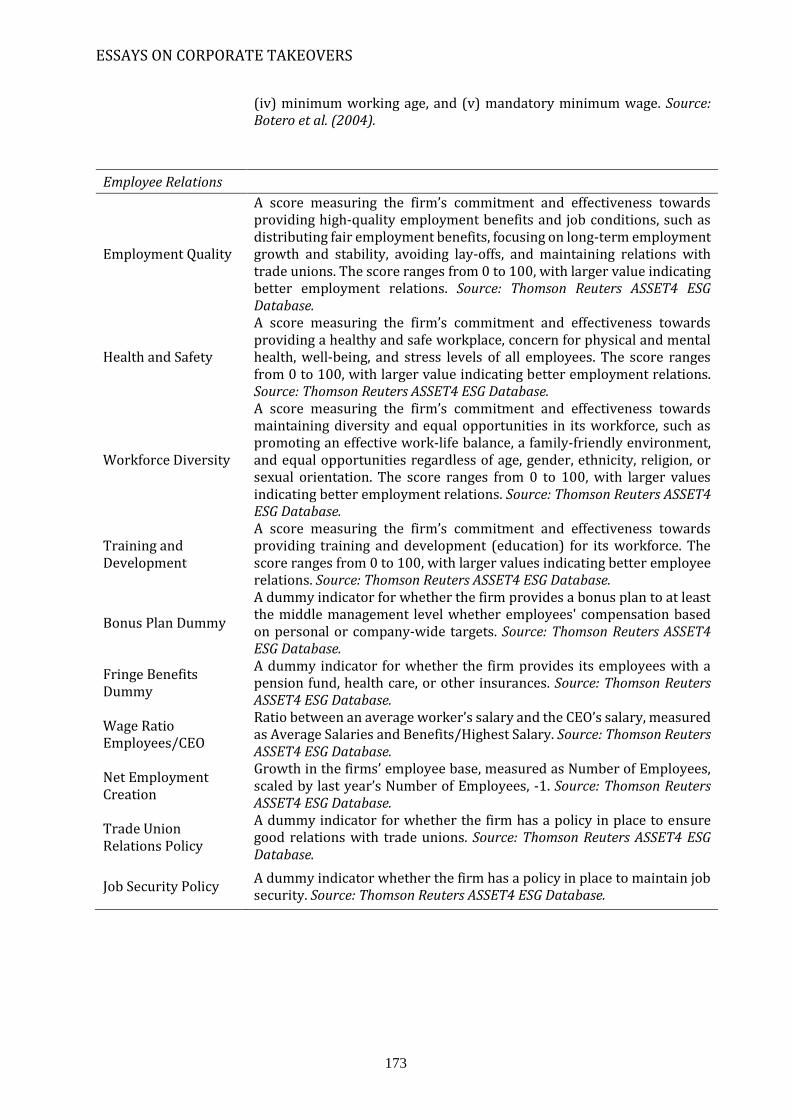
ESSAYS ON CORPORATE TAKEOVERS
173
(iv) minimum working age, and (v) mandatory minimum wage. Source: Botero et al. (2004).
Employee Relations
Employment Quality
A score measuring the firm’s commitment and effectiveness towards providing high-quality employment benefits and job conditions, such as distributing fair employment benefits, focusing on long-term employment growth and stability, avoiding lay-offs, and maintaining relations with trade unions. The score ranges from 0 to 100, with larger value indicating better employment relations. Source: Thomson Reuters ASSET4 ESG Database.
Health and Safety
A score measuring the firm’s commitment and effectiveness towards providing a healthy and safe workplace, concern for physical and mental health, well-being, and stress levels of all employees. The score ranges from 0 to 100, with larger value indicating better employment relations. Source: Thomson Reuters ASSET4 ESG Database.
Workforce Diversity
A score measuring the firm’s commitment and effectiveness towards maintaining diversity and equal opportunities in its workforce, such as promoting an effective work-life balance, a family-friendly environment, and equal opportunities regardless of age, gender, ethnicity, religion, or sexual orientation. The score ranges from 0 to 100, with larger values indicating better employment relations. Source: Thomson Reuters ASSET4 ESG Database.
Training and Development
A score measuring the firm’s commitment and effectiveness towards providing training and development (education) for its workforce. The score ranges from 0 to 100, with larger values indicating better employee relations. Source: Thomson Reuters ASSET4 ESG Database.
Bonus Plan Dummy
A dummy indicator for whether the firm provides a bonus plan to at least the middle management level whether employees' compensation based on personal or company-wide targets. Source: Thomson Reuters ASSET4 ESG Database.
Fringe Benefits Dummy
A dummy indicator for whether the firm provides its employees with a pension fund, health care, or other insurances. Source: Thomson Reuters ASSET4 ESG Database.
Wage Ratio Employees/CEO
Ratio between an average worker’s salary and the CEO’s salary, measured as Average Salaries and Benefits/Highest Salary. Source: Thomson Reuters ASSET4 ESG Database.
Net Employment Creation
Growth in the firms’ employee base, measured as Number of Employees, scaled by last year’s Number of Employees, -1. Source: Thomson Reuters ASSET4 ESG Database.
Trade Union Relations Policy
A dummy indicator for whether the firm has a policy in place to ensure good relations with trade unions. Source: Thomson Reuters ASSET4 ESG Database.
Job Security Policy A dummy indicator whether the firm has a policy in place to maintain job security. Source: Thomson Reuters ASSET4 ESG Database.
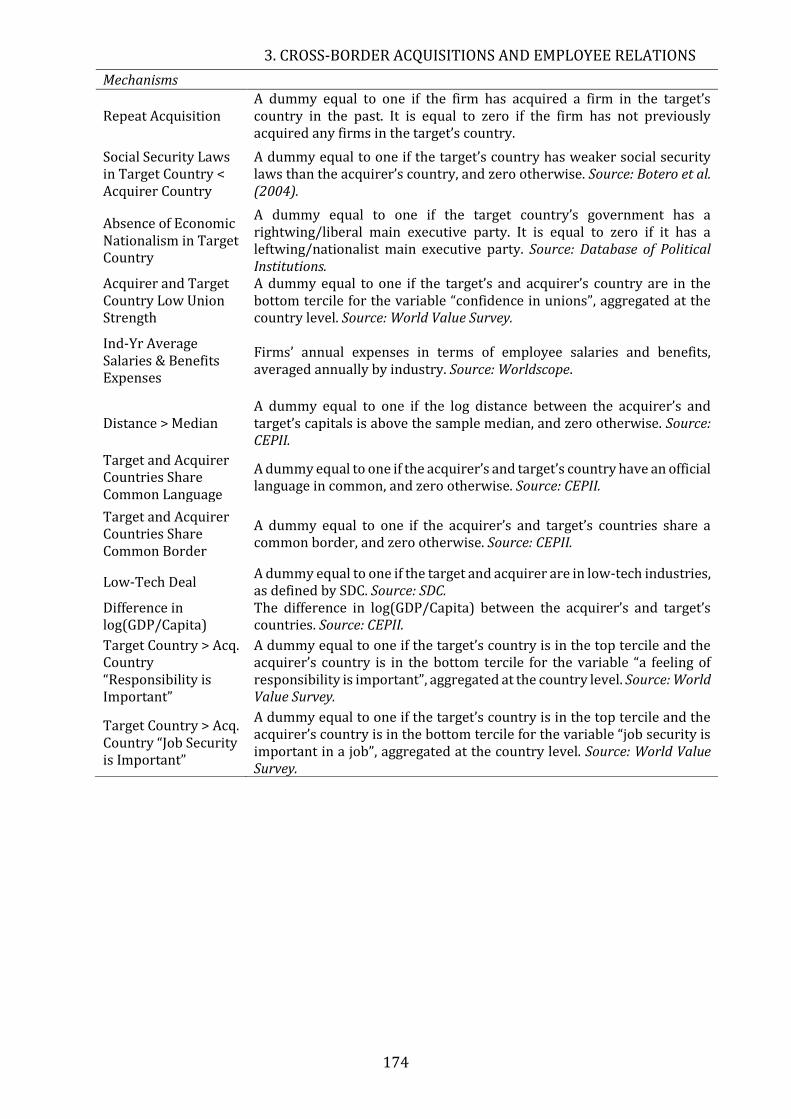
3. CROSS-BORDER ACQUISITIONS AND EMPLOYEE RELATIONS
174
Mechanisms
Repeat Acquisition A dummy equal to one if the firm has acquired a firm in the target’s country in the past. It is equal to zero if the firm has not previously acquired any firms in the target’s country.
Social Security Laws in Target Country < Acquirer Country
A dummy equal to one if the target’s country has weaker social security laws than the acquirer’s country, and zero otherwise. Source: Botero et al. (2004).
Absence of Economic Nationalism in Target Country
A dummy equal to one if the target country’s government has a rightwing/liberal main executive party. It is equal to zero if it has a leftwing/nationalist main executive party. Source: Database of Political Institutions.
Acquirer and Target Country Low Union Strength
A dummy equal to one if the target’s and acquirer’s country are in the bottom tercile for the variable “confidence in unions”, aggregated at the country level. Source: World Value Survey.
Ind-Yr Average Salaries & Benefits Expenses
Firms’ annual expenses in terms of employee salaries and benefits, averaged annually by industry. Source: Worldscope.
Distance > Median A dummy equal to one if the log distance between the acquirer’s and target’s capitals is above the sample median, and zero otherwise. Source: CEPII.
Target and Acquirer Countries Share Common Language
A dummy equal to one if the acquirer’s and target’s country have an official language in common, and zero otherwise. Source: CEPII.
Target and Acquirer Countries Share Common Border
A dummy equal to one if the acquirer’s and target’s countries share a common border, and zero otherwise. Source: CEPII.
Low-Tech Deal A dummy equal to one if the target and acquirer are in low-tech industries, as defined by SDC. Source: SDC.
Difference in log(GDP/Capita)
The difference in log(GDP/Capita) between the acquirer’s and target’s countries. Source: CEPII.
Target Country > Acq. Country “Responsibility is Important”
A dummy equal to one if the target’s country is in the top tercile and the acquirer’s country is in the bottom tercile for the variable “a feeling of responsibility is important”, aggregated at the country level. Source: World Value Survey.
Target Country > Acq. Country “Job Security is Important”
A dummy equal to one if the target’s country is in the top tercile and the acquirer’s country is in the bottom tercile for the variable “job security is important in a job”, aggregated at the country level. Source: World Value Survey.
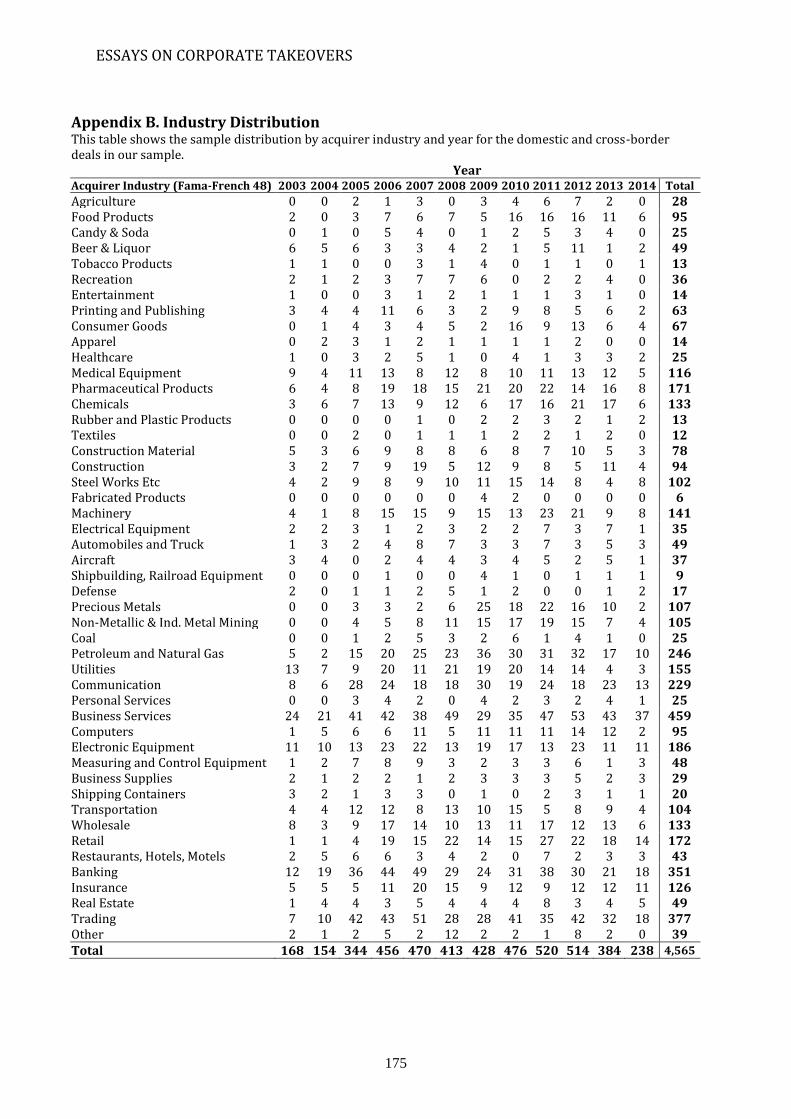
ESSAYS ON CORPORATE TAKEOVERS
175
Appendix B. Industry Distribution This table shows the sample distribution by acquirer industry and year for the domestic and cross-border deals in our sample.
Year Acquirer Industry (Fama-French 48) 2003 2004 2005 2006 2007 2008 2009 2010 2011 2012 2013 2014 Total
Agriculture 0 0 2 1 3 0 3 4 6 7 2 0 28 Food Products 2 0 3 7 6 7 5 16 16 16 11 6 95 Candy & Soda 0 1 0 5 4 0 1 2 5 3 4 0 25 Beer & Liquor 6 5 6 3 3 4 2 1 5 11 1 2 49 Tobacco Products 1 1 0 0 3 1 4 0 1 1 0 1 13 Recreation 2 1 2 3 7 7 6 0 2 2 4 0 36 Entertainment 1 0 0 3 1 2 1 1 1 3 1 0 14 Printing and Publishing 3 4 4 11 6 3 2 9 8 5 6 2 63 Consumer Goods 0 1 4 3 4 5 2 16 9 13 6 4 67 Apparel 0 2 3 1 2 1 1 1 1 2 0 0 14 Healthcare 1 0 3 2 5 1 0 4 1 3 3 2 25 Medical Equipment 9 4 11 13 8 12 8 10 11 13 12 5 116 Pharmaceutical Products 6 4 8 19 18 15 21 20 22 14 16 8 171 Chemicals 3 6 7 13 9 12 6 17 16 21 17 6 133 Rubber and Plastic Products 0 0 0 0 1 0 2 2 3 2 1 2 13 Textiles 0 0 2 0 1 1 1 2 2 1 2 0 12 Construction Material 5 3 6 9 8 8 6 8 7 10 5 3 78 Construction 3 2 7 9 19 5 12 9 8 5 11 4 94 Steel Works Etc 4 2 9 8 9 10 11 15 14 8 4 8 102 Fabricated Products 0 0 0 0 0 0 4 2 0 0 0 0 6 Machinery 4 1 8 15 15 9 15 13 23 21 9 8 141 Electrical Equipment 2 2 3 1 2 3 2 2 7 3 7 1 35 Automobiles and Truck 1 3 2 4 8 7 3 3 7 3 5 3 49 Aircraft 3 4 0 2 4 4 3 4 5 2 5 1 37 Shipbuilding, Railroad Equipment 0 0 0 1 0 0 4 1 0 1 1 1 9 Defense 2 0 1 1 2 5 1 2 0 0 1 2 17 Precious Metals 0 0 3 3 2 6 25 18 22 16 10 2 107 Non-Metallic & Ind. Metal Mining 0 0 4 5 8 11 15 17 19 15 7 4 105 Coal 0 0 1 2 5 3 2 6 1 4 1 0 25 Petroleum and Natural Gas 5 2 15 20 25 23 36 30 31 32 17 10 246 Utilities 13 7 9 20 11 21 19 20 14 14 4 3 155 Communication 8 6 28 24 18 18 30 19 24 18 23 13 229 Personal Services 0 0 3 4 2 0 4 2 3 2 4 1 25 Business Services 24 21 41 42 38 49 29 35 47 53 43 37 459 Computers 1 5 6 6 11 5 11 11 11 14 12 2 95 Electronic Equipment 11 10 13 23 22 13 19 17 13 23 11 11 186 Measuring and Control Equipment 1 2 7 8 9 3 2 3 3 6 1 3 48 Business Supplies 2 1 2 2 1 2 3 3 3 5 2 3 29 Shipping Containers 3 2 1 3 3 0 1 0 2 3 1 1 20 Transportation 4 4 12 12 8 13 10 15 5 8 9 4 104 Wholesale 8 3 9 17 14 10 13 11 17 12 13 6 133 Retail 1 1 4 19 15 22 14 15 27 22 18 14 172 Restaurants, Hotels, Motels 2 5 6 6 3 4 2 0 7 2 3 3 43 Banking 12 19 36 44 49 29 24 31 38 30 21 18 351 Insurance 5 5 5 11 20 15 9 12 9 12 12 11 126 Real Estate 1 4 4 3 5 4 4 4 8 3 4 5 49 Trading 7 10 42 43 51 28 28 41 35 42 32 18 377 Other 2 1 2 5 2 12 2 2 1 8 2 0 39 Total 168 154 344 456 470 413 428 476 520 514 384 238 4,565
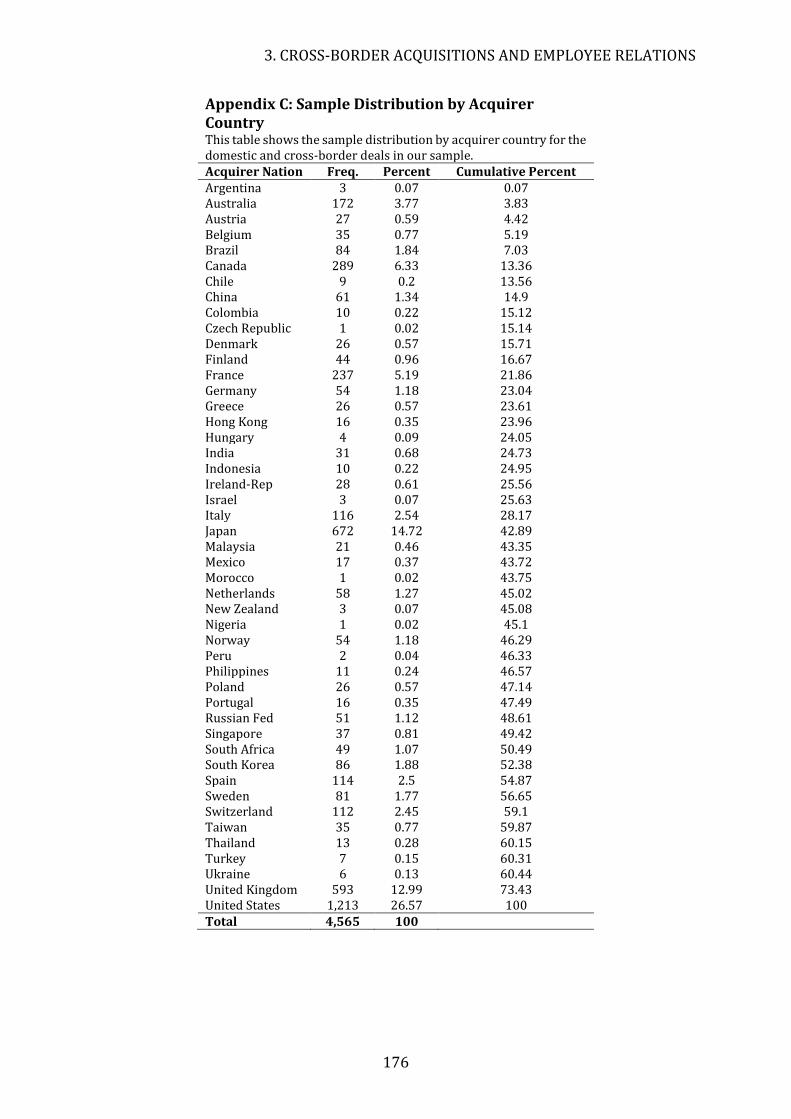
3. CROSS-BORDER ACQUISITIONS AND EMPLOYEE RELATIONS
176
Appendix C: Sample Distribution by Acquirer Country This table shows the sample distribution by acquirer country for the domestic and cross-border deals in our sample. Acquirer Nation Freq. Percent Cumulative Percent Argentina 3 0.07 0.07 Australia 172 3.77 3.83 Austria 27 0.59 4.42 Belgium 35 0.77 5.19 Brazil 84 1.84 7.03 Canada 289 6.33 13.36 Chile 9 0.2 13.56 China 61 1.34 14.9 Colombia 10 0.22 15.12 Czech Republic 1 0.02 15.14 Denmark 26 0.57 15.71 Finland 44 0.96 16.67 France 237 5.19 21.86 Germany 54 1.18 23.04 Greece 26 0.57 23.61 Hong Kong 16 0.35 23.96 Hungary 4 0.09 24.05 India 31 0.68 24.73 Indonesia 10 0.22 24.95 Ireland-Rep 28 0.61 25.56 Israel 3 0.07 25.63 Italy 116 2.54 28.17 Japan 672 14.72 42.89 Malaysia 21 0.46 43.35 Mexico 17 0.37 43.72 Morocco 1 0.02 43.75 Netherlands 58 1.27 45.02 New Zealand 3 0.07 45.08 Nigeria 1 0.02 45.1 Norway 54 1.18 46.29 Peru 2 0.04 46.33 Philippines 11 0.24 46.57 Poland 26 0.57 47.14 Portugal 16 0.35 47.49 Russian Fed 51 1.12 48.61 Singapore 37 0.81 49.42 South Africa 49 1.07 50.49 South Korea 86 1.88 52.38 Spain 114 2.5 54.87 Sweden 81 1.77 56.65 Switzerland 112 2.45 59.1 Taiwan 35 0.77 59.87 Thailand 13 0.28 60.15 Turkey 7 0.15 60.31 Ukraine 6 0.13 60.44 United Kingdom 593 12.99 73.43 United States 1,213 26.57 100 Total 4,565 100
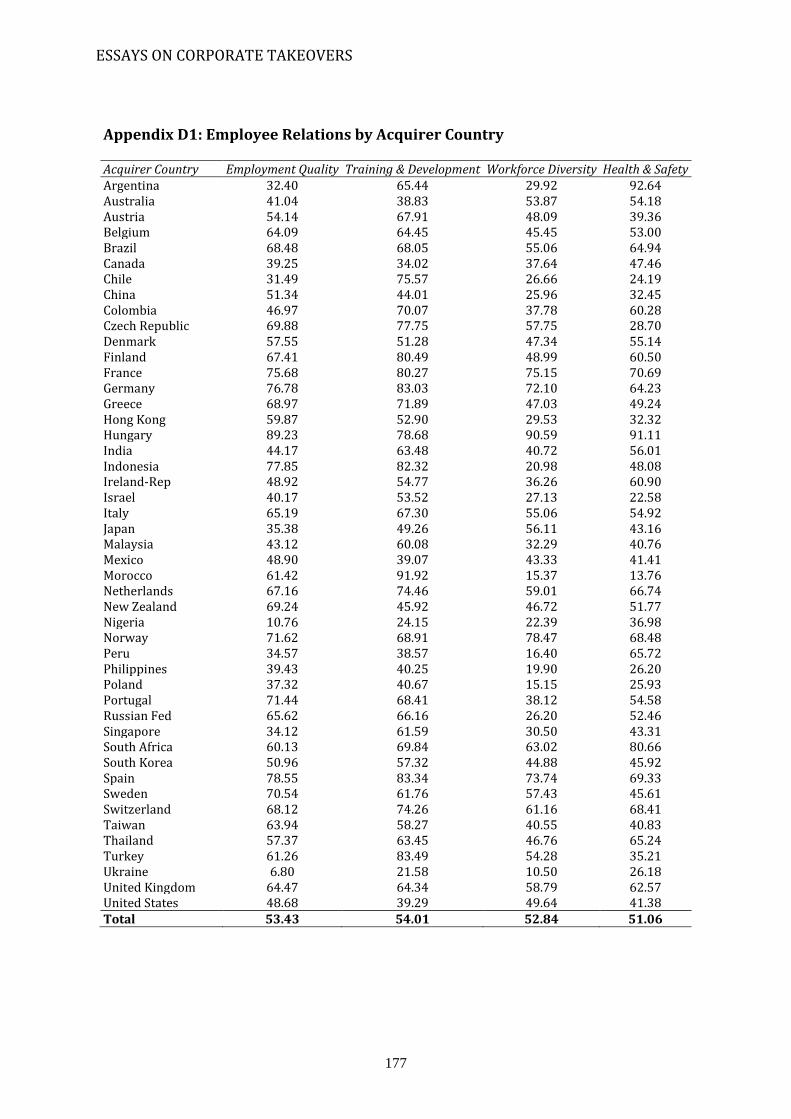
ESSAYS ON CORPORATE TAKEOVERS
177
Appendix D1: Employee Relations by Acquirer Country
Acquirer Country Employment Quality Training & Development Workforce Diversity Health & Safety Argentina 32.40 65.44 29.92 92.64 Australia 41.04 38.83 53.87 54.18 Austria 54.14 67.91 48.09 39.36 Belgium 64.09 64.45 45.45 53.00 Brazil 68.48 68.05 55.06 64.94 Canada 39.25 34.02 37.64 47.46 Chile 31.49 75.57 26.66 24.19 China 51.34 44.01 25.96 32.45 Colombia 46.97 70.07 37.78 60.28 Czech Republic 69.88 77.75 57.75 28.70 Denmark 57.55 51.28 47.34 55.14 Finland 67.41 80.49 48.99 60.50 France 75.68 80.27 75.15 70.69 Germany 76.78 83.03 72.10 64.23 Greece 68.97 71.89 47.03 49.24 Hong Kong 59.87 52.90 29.53 32.32 Hungary 89.23 78.68 90.59 91.11 India 44.17 63.48 40.72 56.01 Indonesia 77.85 82.32 20.98 48.08 Ireland-Rep 48.92 54.77 36.26 60.90 Israel 40.17 53.52 27.13 22.58 Italy 65.19 67.30 55.06 54.92 Japan 35.38 49.26 56.11 43.16 Malaysia 43.12 60.08 32.29 40.76 Mexico 48.90 39.07 43.33 41.41 Morocco 61.42 91.92 15.37 13.76 Netherlands 67.16 74.46 59.01 66.74 New Zealand 69.24 45.92 46.72 51.77 Nigeria 10.76 24.15 22.39 36.98 Norway 71.62 68.91 78.47 68.48 Peru 34.57 38.57 16.40 65.72 Philippines 39.43 40.25 19.90 26.20 Poland 37.32 40.67 15.15 25.93 Portugal 71.44 68.41 38.12 54.58 Russian Fed 65.62 66.16 26.20 52.46 Singapore 34.12 61.59 30.50 43.31 South Africa 60.13 69.84 63.02 80.66 South Korea 50.96 57.32 44.88 45.92 Spain 78.55 83.34 73.74 69.33 Sweden 70.54 61.76 57.43 45.61 Switzerland 68.12 74.26 61.16 68.41 Taiwan 63.94 58.27 40.55 40.83 Thailand 57.37 63.45 46.76 65.24 Turkey 61.26 83.49 54.28 35.21 Ukraine 6.80 21.58 10.50 26.18 United Kingdom 64.47 64.34 58.79 62.57 United States 48.68 39.29 49.64 41.38 Total 53.43 54.01 52.84 51.06
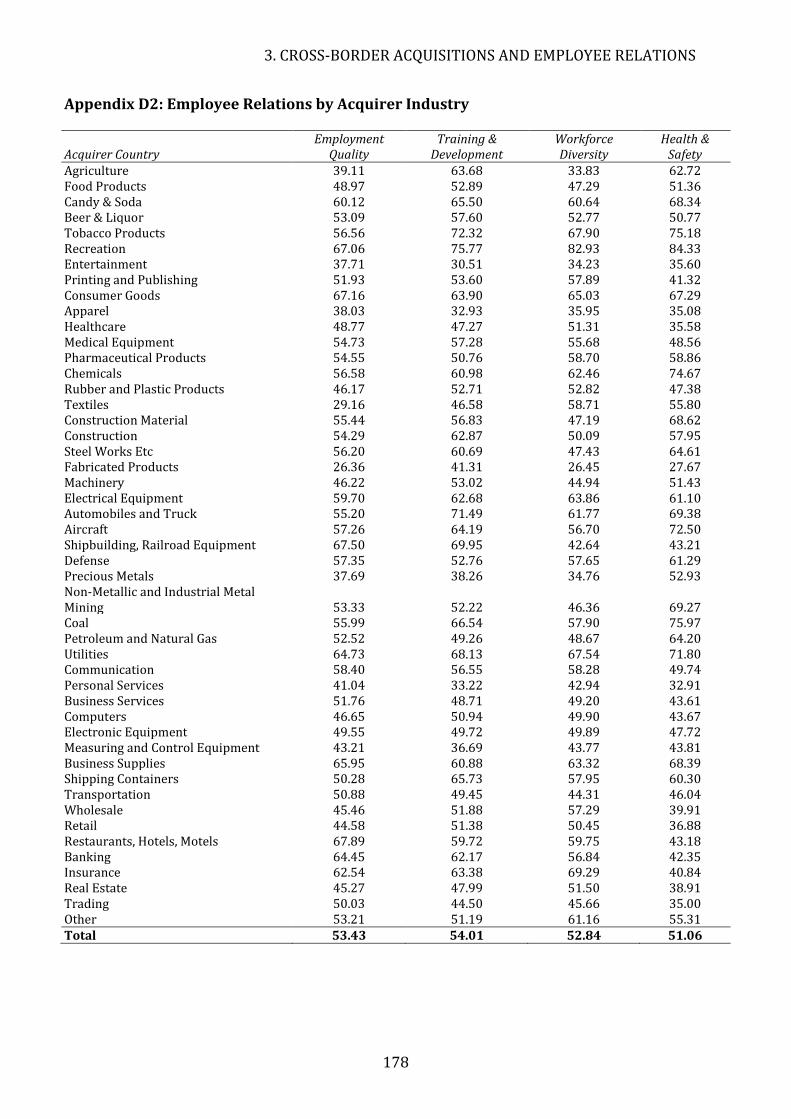
3. CROSS-BORDER ACQUISITIONS AND EMPLOYEE RELATIONS
178
Appendix D2: Employee Relations by Acquirer Industry
Acquirer Country Employment
Quality Training &
Development Workforce Diversity
Health & Safety
Agriculture 39.11 63.68 33.83 62.72 Food Products 48.97 52.89 47.29 51.36 Candy & Soda 60.12 65.50 60.64 68.34 Beer & Liquor 53.09 57.60 52.77 50.77 Tobacco Products 56.56 72.32 67.90 75.18 Recreation 67.06 75.77 82.93 84.33 Entertainment 37.71 30.51 34.23 35.60 Printing and Publishing 51.93 53.60 57.89 41.32 Consumer Goods 67.16 63.90 65.03 67.29 Apparel 38.03 32.93 35.95 35.08 Healthcare 48.77 47.27 51.31 35.58 Medical Equipment 54.73 57.28 55.68 48.56 Pharmaceutical Products 54.55 50.76 58.70 58.86 Chemicals 56.58 60.98 62.46 74.67 Rubber and Plastic Products 46.17 52.71 52.82 47.38 Textiles 29.16 46.58 58.71 55.80 Construction Material 55.44 56.83 47.19 68.62 Construction 54.29 62.87 50.09 57.95 Steel Works Etc 56.20 60.69 47.43 64.61 Fabricated Products 26.36 41.31 26.45 27.67 Machinery 46.22 53.02 44.94 51.43 Electrical Equipment 59.70 62.68 63.86 61.10 Automobiles and Truck 55.20 71.49 61.77 69.38 Aircraft 57.26 64.19 56.70 72.50 Shipbuilding, Railroad Equipment 67.50 69.95 42.64 43.21 Defense 57.35 52.76 57.65 61.29 Precious Metals 37.69 38.26 34.76 52.93 Non-Metallic and Industrial Metal Mining 53.33 52.22 46.36 69.27 Coal 55.99 66.54 57.90 75.97 Petroleum and Natural Gas 52.52 49.26 48.67 64.20 Utilities 64.73 68.13 67.54 71.80 Communication 58.40 56.55 58.28 49.74 Personal Services 41.04 33.22 42.94 32.91 Business Services 51.76 48.71 49.20 43.61 Computers 46.65 50.94 49.90 43.67 Electronic Equipment 49.55 49.72 49.89 47.72 Measuring and Control Equipment 43.21 36.69 43.77 43.81 Business Supplies 65.95 60.88 63.32 68.39 Shipping Containers 50.28 65.73 57.95 60.30 Transportation 50.88 49.45 44.31 46.04 Wholesale 45.46 51.88 57.29 39.91 Retail 44.58 51.38 50.45 36.88 Restaurants, Hotels, Motels 67.89 59.72 59.75 43.18 Banking 64.45 62.17 56.84 42.35 Insurance 62.54 63.38 69.29 40.84 Real Estate 45.27 47.99 51.50 38.91 Trading 50.03 44.50 45.66 35.00 Other 53.21 51.19 61.16 55.31 Total 53.43 54.01 52.84 51.06
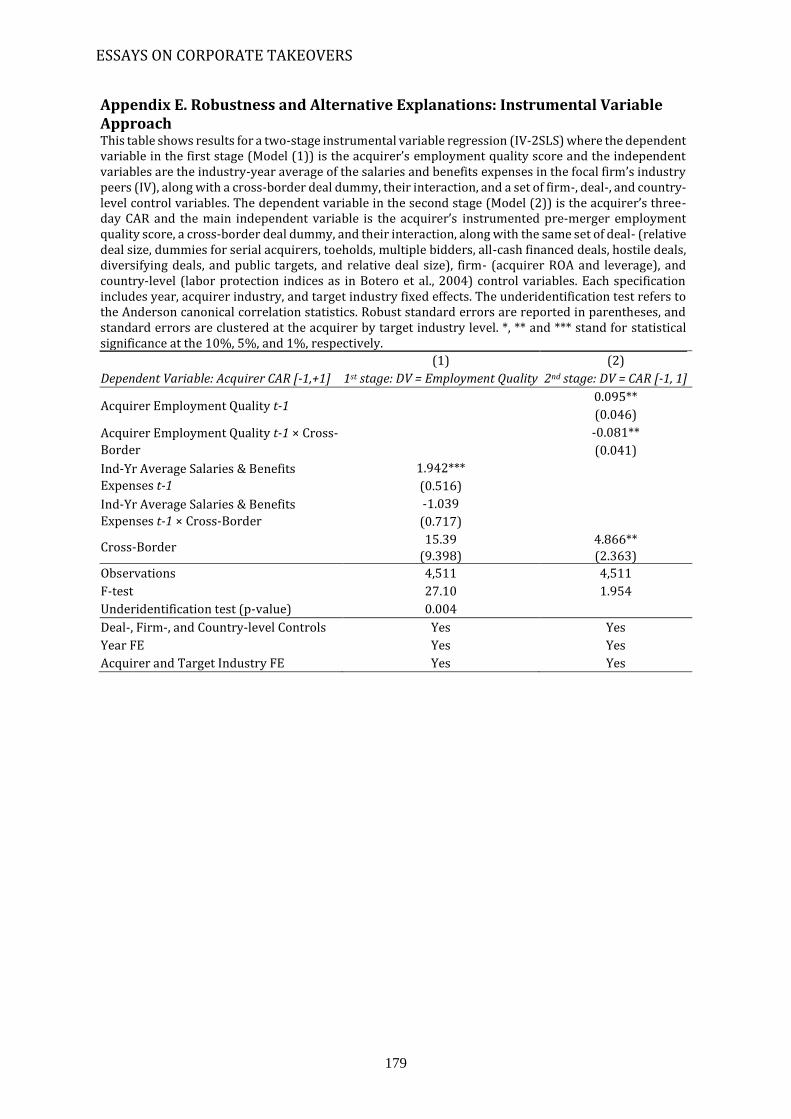
ESSAYS ON CORPORATE TAKEOVERS
179
Appendix E. Robustness and Alternative Explanations: Instrumental Variable Approach This table shows results for a two-stage instrumental variable regression (IV-2SLS) where the dependent variable in the first stage (Model (1)) is the acquirer’s employment quality score and the independent variables are the industry-year average of the salaries and benefits expenses in the focal firm’s industry peers (IV), along with a cross-border deal dummy, their interaction, and a set of firm-, deal-, and country-level control variables. The dependent variable in the second stage (Model (2)) is the acquirer’s three-day CAR and the main independent variable is the acquirer’s instrumented pre-merger employment quality score, a cross-border deal dummy, and their interaction, along with the same set of deal- (relative deal size, dummies for serial acquirers, toeholds, multiple bidders, all-cash financed deals, hostile deals, diversifying deals, and public targets, and relative deal size), firm- (acquirer ROA and leverage), and country-level (labor protection indices as in Botero et al., 2004) control variables. Each specification includes year, acquirer industry, and target industry fixed effects. The underidentification test refers to the Anderson canonical correlation statistics. Robust standard errors are reported in parentheses, and standard errors are clustered at the acquirer by target industry level. *, ** and *** stand for statistical significance at the 10%, 5%, and 1%, respectively.
(1) (2)
Dependent Variable: Acquirer CAR [-1,+1] 1st stage: DV = Employment Quality 2nd stage: DV = CAR [-1, 1]
Acquirer Employment Quality t-1 0.095**
(0.046)
Acquirer Employment Quality t-1 × Cross-
Border
-0.081**
(0.041)
Ind-Yr Average Salaries & Benefits
Expenses t-1
1.942***
(0.516)
Ind-Yr Average Salaries & Benefits
Expenses t-1 × Cross-Border
-1.039
(0.717)
Cross-Border 15.39 4.866**
(9.398) (2.363)
Observations 4,511 4,511
F-test 27.10 1.954
Underidentification test (p-value) 0.004
Deal-, Firm-, and Country-level Controls Yes Yes
Year FE Yes Yes
Acquirer and Target Industry FE Yes Yes
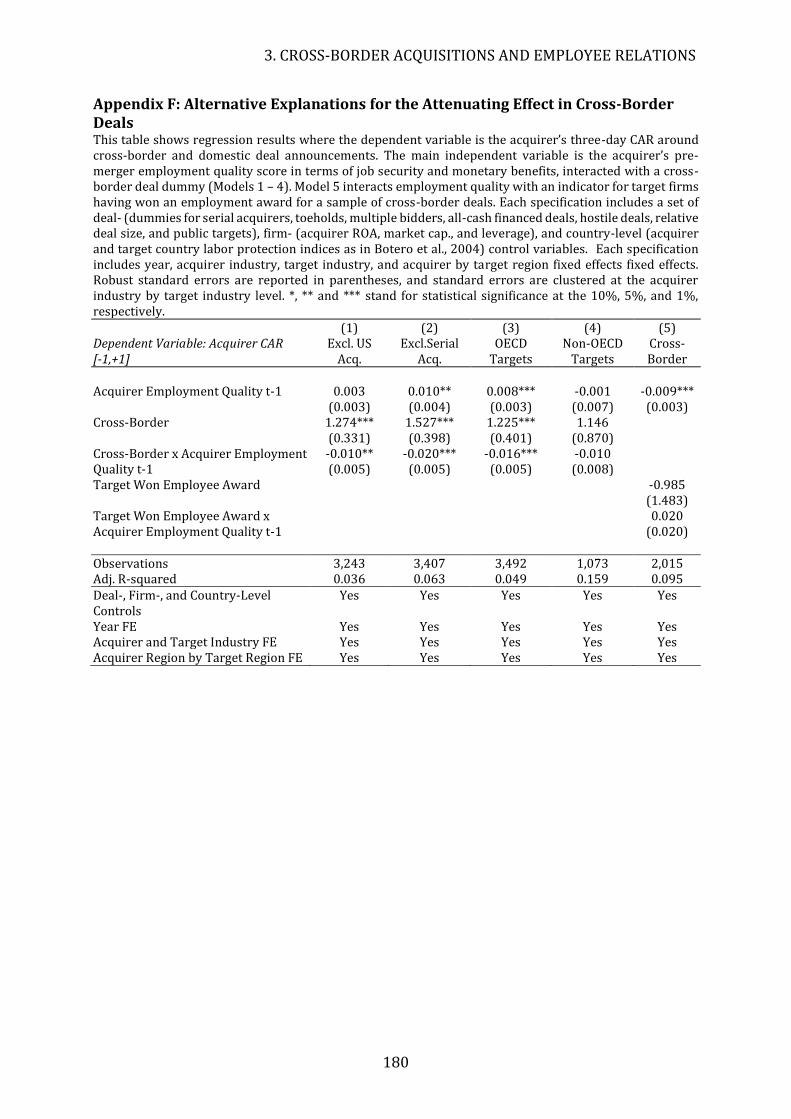
3. CROSS-BORDER ACQUISITIONS AND EMPLOYEE RELATIONS
180
Appendix F: Alternative Explanations for the Attenuating Effect in Cross-Border Deals This table shows regression results where the dependent variable is the acquirer’s three-day CAR around cross-border and domestic deal announcements. The main independent variable is the acquirer’s pre-merger employment quality score in terms of job security and monetary benefits, interacted with a cross-border deal dummy (Models 1 – 4). Model 5 interacts employment quality with an indicator for target firms having won an employment award for a sample of cross-border deals. Each specification includes a set of deal- (dummies for serial acquirers, toeholds, multiple bidders, all-cash financed deals, hostile deals, relative deal size, and public targets), firm- (acquirer ROA, market cap., and leverage), and country-level (acquirer and target country labor protection indices as in Botero et al., 2004) control variables. Each specification includes year, acquirer industry, target industry, and acquirer by target region fixed effects fixed effects. Robust standard errors are reported in parentheses, and standard errors are clustered at the acquirer industry by target industry level. *, ** and *** stand for statistical significance at the 10%, 5%, and 1%, respectively.
(1) (2) (3) (4) (5) Dependent Variable: Acquirer CAR [-1,+1]
Excl. US Acq.
Excl.Serial Acq.
OECD Targets
Non-OECD Targets
Cross-Border
Acquirer Employment Quality t-1 0.003 0.010** 0.008*** -0.001 -0.009*** (0.003) (0.004) (0.003) (0.007) (0.003) Cross-Border 1.274*** 1.527*** 1.225*** 1.146 (0.331) (0.398) (0.401) (0.870) Cross-Border x Acquirer Employment Quality t-1
-0.010** -0.020*** -0.016*** -0.010 (0.005) (0.005) (0.005) (0.008)
Target Won Employee Award -0.985 (1.483) Target Won Employee Award x Acquirer Employment Quality t-1
0.020 (0.020)
Observations 3,243 3,407 3,492 1,073 2,015 Adj. R-squared 0.036 0.063 0.049 0.159 0.095 Deal-, Firm-, and Country-Level Controls
Yes Yes Yes Yes Yes
Year FE Yes Yes Yes Yes Yes Acquirer and Target Industry FE Yes Yes Yes Yes Yes Acquirer Region by Target Region FE Yes Yes Yes Yes Yes
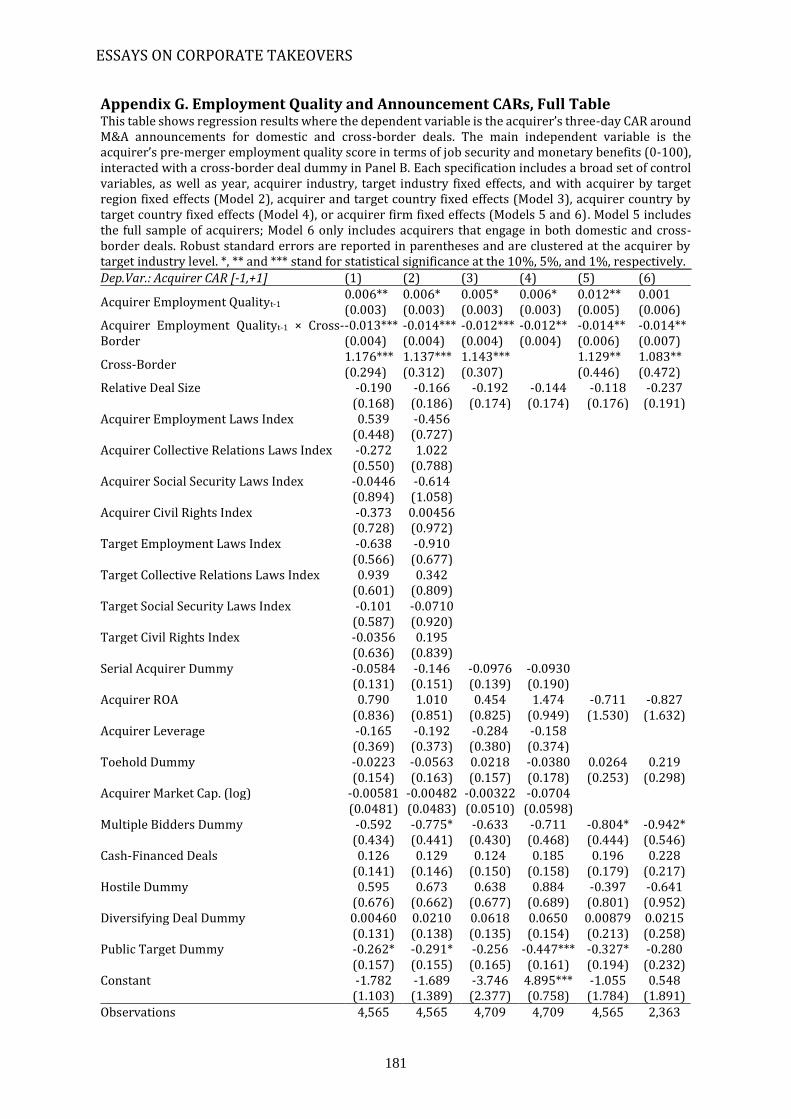
ESSAYS ON CORPORATE TAKEOVERS
181
Appendix G. Employment Quality and Announcement CARs, Full Table This table shows regression results where the dependent variable is the acquirer’s three-day CAR around M&A announcements for domestic and cross-border deals. The main independent variable is the acquirer’s pre-merger employment quality score in terms of job security and monetary benefits (0-100), interacted with a cross-border deal dummy in Panel B. Each specification includes a broad set of control variables, as well as year, acquirer industry, target industry fixed effects, and with acquirer by target region fixed effects (Model 2), acquirer and target country fixed effects (Model 3), acquirer country by target country fixed effects (Model 4), or acquirer firm fixed effects (Models 5 and 6). Model 5 includes the full sample of acquirers; Model 6 only includes acquirers that engage in both domestic and cross-border deals. Robust standard errors are reported in parentheses and are clustered at the acquirer by target industry level. *, ** and *** stand for statistical significance at the 10%, 5%, and 1%, respectively.
Dep.Var.: Acquirer CAR [-1,+1] (1) (2) (3) (4) (5) (6)
Acquirer Employment Qualityt-1 0.006** 0.006* 0.005* 0.006* 0.012** 0.001 (0.003) (0.003) (0.003) (0.003) (0.005) (0.006)
Acquirer Employment Qualityt-1 × Cross-Border
-0.013*** -0.014*** -0.012*** -0.012** -0.014** -0.014** (0.004) (0.004) (0.004) (0.004) (0.006) (0.007)
Cross-Border 1.176*** 1.137*** 1.143*** 1.129** 1.083** (0.294) (0.312) (0.307) (0.446) (0.472)
Relative Deal Size -0.190 -0.166 -0.192 -0.144 -0.118 -0.237 (0.168) (0.186) (0.174) (0.174) (0.176) (0.191) Acquirer Employment Laws Index 0.539 -0.456 (0.448) (0.727) Acquirer Collective Relations Laws Index -0.272 1.022 (0.550) (0.788) Acquirer Social Security Laws Index -0.0446 -0.614 (0.894) (1.058) Acquirer Civil Rights Index -0.373 0.00456 (0.728) (0.972) Target Employment Laws Index -0.638 -0.910 (0.566) (0.677) Target Collective Relations Laws Index 0.939 0.342 (0.601) (0.809) Target Social Security Laws Index -0.101 -0.0710 (0.587) (0.920) Target Civil Rights Index -0.0356 0.195 (0.636) (0.839) Serial Acquirer Dummy -0.0584 -0.146 -0.0976 -0.0930 (0.131) (0.151) (0.139) (0.190) Acquirer ROA 0.790 1.010 0.454 1.474 -0.711 -0.827 (0.836) (0.851) (0.825) (0.949) (1.530) (1.632) Acquirer Leverage -0.165 -0.192 -0.284 -0.158 (0.369) (0.373) (0.380) (0.374) Toehold Dummy -0.0223 -0.0563 0.0218 -0.0380 0.0264 0.219 (0.154) (0.163) (0.157) (0.178) (0.253) (0.298) Acquirer Market Cap. (log) -0.00581 -0.00482 -0.00322 -0.0704 (0.0481) (0.0483) (0.0510) (0.0598) Multiple Bidders Dummy -0.592 -0.775* -0.633 -0.711 -0.804* -0.942* (0.434) (0.441) (0.430) (0.468) (0.444) (0.546) Cash-Financed Deals 0.126 0.129 0.124 0.185 0.196 0.228 (0.141) (0.146) (0.150) (0.158) (0.179) (0.217) Hostile Dummy 0.595 0.673 0.638 0.884 -0.397 -0.641 (0.676) (0.662) (0.677) (0.689) (0.801) (0.952) Diversifying Deal Dummy 0.00460 0.0210 0.0618 0.0650 0.00879 0.0215 (0.131) (0.138) (0.135) (0.154) (0.213) (0.258) Public Target Dummy -0.262* -0.291* -0.256 -0.447*** -0.327* -0.280 (0.157) (0.155) (0.165) (0.161) (0.194) (0.232) Constant -1.782 -1.689 -3.746 4.895*** -1.055 0.548 (1.103) (1.389) (2.377) (0.758) (1.784) (1.891) Observations 4,565 4,565 4,709 4,709 4,565 2,363

3. CROSS-BORDER ACQUISITIONS AND EMPLOYEE RELATIONS
182
Adj. R-squared 0.037 0.067 0.063 0.161 0.054 0.078 Firm and Deal Level Controls Yes Yes Yes Yes Yes Yes
Acquirer and Target Country Level
Controls
Yes Yes No No No No
Acquirer and Target Industry FE, Year FE Yes Yes Yes Yes No No Acquirer Region x Target Region FE No Yes No Yes No No Acquirer Country FE No No Yes No No No
Target Country FE No No Yes No Yes Yes
Acquirer Country x Target Country FE No No No Yes No No
Acquirer Firm FE No No No No Yes Yes
4. TWO-STAGE ACQUISITIONS AND DEAL PREMIUMS
183
Chapter 4
Two-Stage Acquisitions and Deal Premiums
Abstract – Between 1990 and 2015, the fraction of M&A deals in which an acquirer
obtained a minority stake in the target firm before making a majority stake offer
amounted to almost 20% of the global public M&A volume. This paper investigates how
such a two-stage acquisition strategy affects the takeover process in terms of bid
premiums, shareholder returns, and post-deal performance. Using a treatment effects
model for a global sample of M&A deals, I find that a two-stage acquisition strategy
reduces information asymmetries and mitigates pre-emptive overbidding. I confirm
these results for a US sample using the increase in trade secret protection across states
as an exogenous shock to target value uncertainty and the reduction in import tariffs
across industries as an exogenous shock to potential bidder competition. Overall, my
results suggest that two-stage acquisitions can offer benefits to acquiring firms when
information asymmetries increase or when potential bidder competition is high.
Keywords: Mergers and Acquisitions, Minority Acquisitions, Overbidding, Information
Asymmetries, Trade Secret Protection
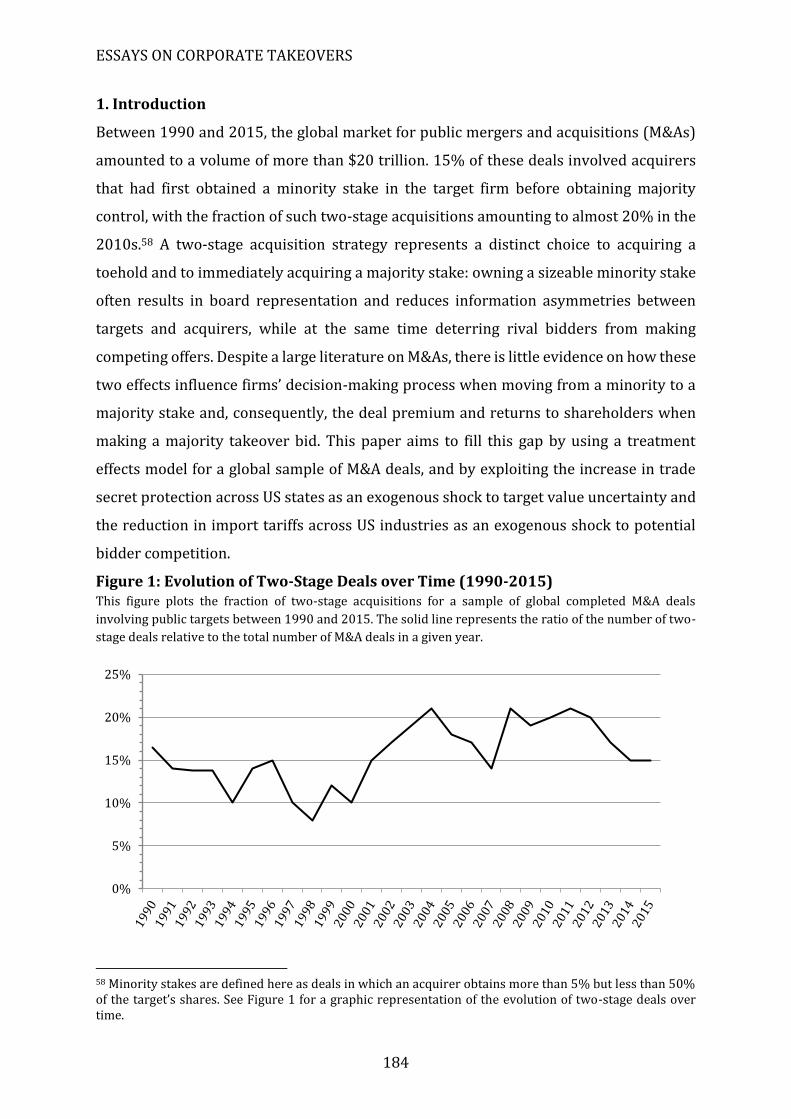
ESSAYS ON CORPORATE TAKEOVERS
184
1. Introduction
Between 1990 and 2015, the global market for public mergers and acquisitions (M&As)
amounted to a volume of more than $20 trillion. 15% of these deals involved acquirers
that had first obtained a minority stake in the target firm before obtaining majority
control, with the fraction of such two-stage acquisitions amounting to almost 20% in the
2010s.58 A two-stage acquisition strategy represents a distinct choice to acquiring a
toehold and to immediately acquiring a majority stake: owning a sizeable minority stake
often results in board representation and reduces information asymmetries between
targets and acquirers, while at the same time deterring rival bidders from making
competing offers. Despite a large literature on M&As, there is little evidence on how these
two effects influence firms’ decision-making process when moving from a minority to a
majority stake and, consequently, the deal premium and returns to shareholders when
making a majority takeover bid. This paper aims to fill this gap by using a treatment
effects model for a global sample of M&A deals, and by exploiting the increase in trade
secret protection across US states as an exogenous shock to target value uncertainty and
the reduction in import tariffs across US industries as an exogenous shock to potential
bidder competition.
Figure 1: Evolution of Two-Stage Deals over Time (1990-2015) This figure plots the fraction of two-stage acquisitions for a sample of global completed M&A deals
involving public targets between 1990 and 2015. The solid line represents the ratio of the number of two-
stage deals relative to the total number of M&A deals in a given year.
58 Minority stakes are defined here as deals in which an acquirer obtains more than 5% but less than 50% of the target’s shares. See Figure 1 for a graphic representation of the evolution of two-stage deals over time.
0%
5%
10%
15%
20%
25%
4. TWO-STAGE ACQUISITIONS AND DEAL PREMIUMS
185
Ex-ante, it is not obvious whether two-stage acquisitions should have higher or lower
premiums compared to direct (one-stage) majority acquisitions in which the acquirer
does not hold a minority stake prior to making the offer. On the one hand, two-stage
acquisitions may increase deal premiums by reducing target value uncertainty. In the
presence of information asymmetries between acquirers and targets, acquirers reduce
their offered premiums to avoid overpaying for “bad” targets (Akerlof, 1970; Coff, 1999;
Povel and Singh, 2006). Two-stage acquirers however own a minority stake in the target,
which encourages information sharing and cooperation through board seats and
informal meetings with management and employees (Fee, Hadlock, and Thomas, 2006).
They are therefore able to assess the target’s value – including the value of potential
merger synergies and post-merger restructuring benefits – more accurately, resulting in
relatively higher premiums.
On the other hand, two-stage deals may decrease deal premiums by deterring rival
firms from making competing offers. Pre-emptive bidding theory states that, when there
is more potential bidder competition, acquirers strategically raise their bids to deter rival
bidders from making competing offers (Fishman, 1989).59 However, two-stage acquirers’
minority stakes can also deter competing offers, as rival bidders have to offer a
considerably higher price to get the minority stake acquirer to sell (Betton, Eckbo, and
Thorburn, 2009). Two-stage acquirers thus have fewer incentives to strategically raise
their bids, resulting in lower premiums being offered relative to one-stage acquirers
without a minority stake.
Despite the popularity of M&As as a field of study, there is little evidence on how
two-stage acquisitions affect the acquisition process and deal premiums. A first
important challenge is acquirers’ choice of using a two-stage versus a one-stage
acquisition strategy. This is a non-random choice, based on a set of deal and firm
characteristics that may also affect the deal premium. A second challenge is the
identification of the channels through which two-stage acquisitions affect the takeover
process. There is an inherent relationship between acquirer-target information
asymmetries, potential bidder competition, and other acquirer- and target-level
characteristics that affect deal premiums and the decision to use a two-stage acquisition
59 In the takeover of Cadbury by Kraft for example, Kraft raised its offer when a counteroffer by Hershey became likely, although it never materialized. Therefore, the potential for competing offers to arise is enough to induce pre-emptive bidding. Aktas, de Bodt, and Roll (2010) indeed report that bid premiums are higher when there is more potential competition.
ESSAYS ON CORPORATE TAKEOVERS
186
strategy. Existing studies have therefore not been able to fully disentangle the
information channel from the competition channel and from other acquirer-, target, and
deal-level effects, such as firms’ innovation level or product market effects. This paper
attempts to resolve these issues by using a treatment effects model to account for firms’
selection into one- and two-stage acquisitions, and by using a difference-in-difference
analysis based on two US events to investigate the channels through which two-stage
deals affect the takeover process.
First, I investigate the effect of mitigating pre-emptive bidding and resolving
uncertainty in a global sample of one-stage and two-stage M&A deals. I estimate a
treatment effects model to control for the likelihood of engaging in a two-stage versus a
one-stage acquisition, and show that two-stage acquirers pay on average 20% to 30%
lower premiums than one-stage acquirers, even after taking into account the minority
stake premium and controlling for acquirer firm fixed effects. Consistent with two-stage
deals not being affected by target value uncertainty, two-stage acquirers increase their
offers by 11% when target industry stock volatility is high. This uncertainty-resolving
effect is also stronger when targets and acquirers are geographically closer, as this
facilitates the transfer of information. When there is a higher number of potential bidders
in the target’s industry or when there is a merger wave in the target’s industry, one-stage
acquirers increase their bids by 2.2% to deter competing offers. Two-stage acquirers
however reduce their offers, consistent with these deals not being affected by bidder
competition and pre-emptive bidding behavior.
I then exploit two events in a sample of US deals to further identify the channels
through which two-stage deals affect the takeover process. To identify an exogenous
increase in target value uncertainty, I use the staggered adoption of the Uniform Trade
Secrets Act, or UTSA, across 48 US states between 1975 and 2013. The UTSA resulted in
a dramatic increase in trade secret protection (Png, 2017). It became harder and costlier
for acquirers to obtain information on the target’s value and its competitive advantage
relative to its industry peers, as trade secrets are generally not disclosed to outsiders, not
even in the due diligence process following a takeover bid (Castellaneta, Conti, and
Kacperczyk, 2017). Two-stage acquirers are however expected to suffer less from such
an information disadvantage as they have easier access to the firm’s trade secrets through
their presence at board meetings and informal contacts with key employees.
4. TWO-STAGE ACQUISITIONS AND DEAL PREMIUMS
187
I use reductions in import tariff rates across US industries to identify an exogenous
increase in the number of potential rival bidders. Lower import tariff rates lower the cost
of entry for foreign rivals, increasing the level of product market competition faced by
domestic firms (Frésard and Valta, 2016). Such an industry shock triggers a re-allocation
of resources and increases M&A activity between incumbent domestic firms (Breinlich,
2008; Srinivasan, 2014), in turn increasing the level of bidder competition. Therefore, as
holding a minority stake deters competing offers without having to raise the bid
premium, two-stage acquirers should not increase their premiums following an increase
in potential M&A competition.
My results confirm that one-stage acquirers respond to the increase in
information asymmetries following the UTSA enactment by offering 2.3% lower
premiums. Two-stage acquirers however increase their offers by 11%, suggesting that
they are not affected by this increase in information asymmetries. These findings are
echoed by the acquirer, target, and combined-firm announcement returns which are
significantly more positive for two-stage deals post-UTSA enactment, and by the increase
in the use of two-stage deals after the increase in trade secrets protection. I document
that in the year following a large decrease in import tariff rates, bidder competition
significantly increases. Consistent with two-stage acquirers not having to raise their
offers to win (or deter) a potential takeover contest, two-stage acquirers respond to the
increase in bidder competition by decreasing their offers, whereas one-stage acquirers
do not decrease their offers. These benefits are echoed by the significantly more positive
acquirer, target, and combined firm CARs for two-stage acquirers and the increased use
of two-stage deals following an exogenous increase in M&A competition.
My sample also allows me to investigate if and how the uncertainty-resolving and
competition-reducing effects of minority acquisitions affect firms’ decision-making
process when expanding a minority stake to a majority stake. Using a Cox hazard model
to estimate the time between the minority and majority acquisition, I find that both
effects play a role. Consistent with the idea that processing information to resolve
uncertainty takes time, targets with more uncertain valuations delay acquirers’ decisions
to expand. An increase in potential competition in the target’s industry however does not
delay the decision to expand, but it increases the likelihood of a minority stake being sold.
Moreover, when a minority stake is sold, acquirers can obtain returns of 35%,
particularly when selling to a third-party majority acquirer.
ESSAYS ON CORPORATE TAKEOVERS
188
Lastly, I find that two-stage deals also affect deal completion and long-run
performance. A staged acquisition strategy significantly increases the likelihood of a deal
being completed and, conditional on deal completion, two-stage deals are completed
significantly faster. Targets in two-stage deals are also less likely to be divested, and they
perform better in terms of long-term profitability. In a set of robustness tests, I rule out
that my findings are driven by anti-trust issues, target undervaluation, negative events in
the target, specific countries, or alternative uses of the money invested in the minority
stake. Taken together, these results indicate that two-stage acquisitions increase the
efficiency and accuracy of the takeover bidding process by resolving target value
uncertainty and mitigating overpayment triggered by pre-emptive bidding. In addition,
they trigger significantly more positive announcement returns for both target and
acquirer shareholders, indicating that shareholders value the benefits of two-stage deals.
This paper contributes to several strands of the academic literature. It relates to
the large literature on toeholds, which investigates the motives and price implications for
toehold bidding in M&A contests. In contrast to the minority acquisitions in my sample,
toeholds are generally small stakes acquired in a relatively short period leading up to the
majority takeover bid with the goal of reducing the number of shares that must be
purchased at the full takeover price. Although the effects I investigate can also be applied
to toehold bidding60, my analysis differs on a number of important dimensions. First, the
minority stakes in my sample are considerably larger than what is generally considered
a toehold61 (they are on average 26% of the target’s outstanding shares) and they are
held for a longer time before the majority stake offer is made (about 1.4 years). 62 Second,
most studies on toeholds indicate that the acquirer held target shares prior to the
takeover bid, but do not investigate when or at what price the toehold was acquired.63 In
contrast, my sample enables me to study in detail the timing and premium of the minority
60 Betton and Eckbo (2000) for example report that toeholds are associated with lower offer premiums and argue that is consistent with a competition-deterring effect of toeholds. However, to the best of my knowledge, no papers have directly investigated the competition-deterring or the uncertainty-reducing effect for toeholds. 61 In theory, toeholds in the US should be just under 5% of the target’s outstanding shares as this does not require firms to file a form 13D stating the acquirer’s intentions. 62 Standstill agreements may limit the acquisition of a toehold in the two to six months before the public announcement of the offer (Bruner, 2004; Boone and Mulherin, 2007). However, the minority stakes in my sample are on average held for 1.5 years, indicating that these are likely to be different types of transactions. 63 The only exception is Betton, Eckbo, and Thorburn (2009) who – due to data limitations in SDC – are only able to distinguish between short-term and long-term toeholds that were held less or more than 6 months before the takeover bid.
4. TWO-STAGE ACQUISITIONS AND DEAL PREMIUMS
189
acquisition that precedes a majority stake offer. Third, many studies investigate toeholds
in the context of takeover contests involving multiple bidders. My study only focuses on
single-bidder contests to rule out effects from strategic bids by competing rivals. Fourth,
given that toeholds should theoretically be small stakes acquired close to the initial
takeover bid that do not yield board seats, it is unlikely that they are able to resolve
uncertainty to the same extent as the minority stakes in my sample. By not limiting the
sample to stakes acquired close to the majority takeover bid, I can investigate how the
flow of information between target and acquirer affects merger premiums and
performance.
This paper also contributes to the literature on minority acquisitions. Most of
these studies investigate why minority acquisitions are preferred over complete
independence, and find that they can facilitate cooperation between two independent
firms (e.g. customers and suppliers) in an incomplete-contracts framework by better
aligning the acquirer’s and target’s incentives and by encouraging information sharing
between trading parties (Allen and Phillips, 2000; Fee et al., 2006). In transactions
involving relationship-specific effort or assets (where the value of the asset depends on
firms’ continued interaction and cannot be used outside of the transaction), it is often
unrealistic to write a complete contract on all possible states of nature (and even if it were
possible, there are certain states of natures that are not ex-ante contractible because they
cannot be verified ex-post by third parties such as courts) (Grossman and Hart, 1986;
Hart and Moore, 1990). In the context of M&A, a hold-up problem may limit an acquirer’s
incentives to invest in the deal if it fears opportunistic behavior by the target and it may
limit a target’s incentives to provide information if it fears opportunistic behavior by the
acquirer. By aligning firms’ incentives and encouraging information sharing and
cooperation, equity stakes play an important role in reducing the risk of expropriation
and hold-up problems (Fee et al., 2006).
Empirical and anecdotal64 evidence indeed shows that resolving uncertainty is a
key driver for firms to acquire minority stakes. Filson and Morales (2006) focus on equity
stakes in biotechnology alliances and develop a model showing that minority stakes
facilitate monitoring and allow acquirers to reduce their uncertainty about the target’s
64 For example, in May 2016, the UK software company Sage Group took a 21% stake in Fairsail, a fast-growing tech scale-up, with the aim of providing capital for Fairsail and developing a shared product. One year later, once the shared product has been proven successful, Sage Group announced it would fully acquire Fairsail.
ESSAYS ON CORPORATE TAKEOVERS
190
R&D before committing more resources to the joint project. Ouimet (2013) explains the
trade-off between minority and majority acquisitions and shows that minority
acquisitions are more likely when it is important to keep target managerial incentives
intact, when the value of the target is uncertain, and when a financially constrained target
can benefit from certification by the acquiring firm. The latter finding is confirmed for a
global sample by Liao (2014), who also reports that minority stakes are more likely in
industries with high R&D expenses in countries with good minority shareholder
protection. However, these studies focus on the decision to acquire a minority stake and
do not examine what happens after the stake is obtained. In contrast, this study
investigates how and when firms decide to expand a minority stake to a majority stake
and how the premium and shareholder returns are affected when expanding to a majority
stake.
Finally, this study relates to the young literature on Corporate Venture Capital
(CVC), venture capital firms that are structured as subsidiaries of traditional corporations
and that systematically make minority stake investments in early-stage entrepreneurial
ventures. As in two-stage acquisitions, firms engage in CVC investments to acquire
information and increase their innovative knowledge (Macmillan et al., 2008). In contrast
to two-stage acquisitions however, the information and innovation knowledge acquired
through CVC is typically internalized by the firm and used to recover a deteriorating
innovation level, rather than to make efficient takeover decisions (Ma (2016) reports that
less than 5% of a CVC investor’s portfolio companies are ultimately acquired). Moreover,
CVC companies tend to own a portfolio of investments and their sole purpose is to actively
build this portfolio. They are generally pooled together with traditional VC firms, which
are excluded from my sample, limiting the concern that the acquirers in this paper are
CVC investors.
The paper is organized as follows. Section 2 describes the data sources,
identification strategy, and summary statistics. Section 3 examines the premium
difference between two-stage and one-stage acquisitions, and Section 4 investigates the
decision to expand or sell a minority stake. Robustness tests are presented in Section 5
and Section 6 concludes.
4. TWO-STAGE ACQUISITIONS AND DEAL PREMIUMS
191
2. Data, Sample Selection, and Identification
2.1 Data Sources and Sample Selection
I obtain information on global minority and majority acquisitions from the Securities
Data Corporation (SDC) M&A database. I include all deals announced between 1990 and
2015 for which information on the premium offered is available.65 Minority acquisitions
are defined as deals where less than 50% but more than 5%66 of the target’s shares are
acquired, and majority acquisitions are defined as deals where more than 50% of the
target’s shares are acquired.67 I then define two-stage acquisitions as deals in which I can
match the target’s and acquirer’s identifiers in both the minority and the majority
acquisition sample and where the minority acquisition preceded the majority acquisition
with no other acquirer obtaining control in the target after the initial minority acquisition.
One-stage acquisitions are defined as deals in which the acquirer did not hold shares
before making the majority bid. I match this sample with accounting and stock price
information in Compustat North America and CRSP using the CUSIP identifier for US
firms, and I match non-US firms based on their SEDOL or Datastream Code with
accounting information in Compustat Global and Worldscope and with stock price
information in Datastream. I also update non-matched European observations based on
name, country, and industry with accounting data in Bureau van Dijk’s Amadeus
database.
I follow the literature and exclude acquirers in highly regulated industries such as
financial firms (SIC codes 6000-6999) and firms in the utilities industries (SIC codes
4900-4949). I also drop deals in which the acquirer and target have the same ultimate
parent firm, as these deals are often part of a firm’s internal restructuring process. As
some firms acquire small stakes in the same target multiple days in a row, I only include
the last minority stake acquisition in my main analysis to avoid double-counting such
deals (note that my conclusions are not affected when considering the first minority stake
65 This requirement restricts my sample to publicly listed targets. Although the uncertainty-reducing effect of two-stage acquisitions should be stronger for private targets, they are excluded from the sample due to the unavailability of information on merger premiums. 66 The 5% lower boundary for minority acquisitions is included to make sure the initial minority stake is meaningful to both target and acquirer. Removing this restriction does not alter my conclusions however, as only 7% of my sample consists of equity stakes smaller than 5%. This in line with Ouimet (2013), who reports that only 16% of her minority acquisition sample represent such small equity stakes. 67 I use a 50% cut-off to identify important expansions of minority stakes, as this always results in an acquirer obtaining majority control. However, my conclusions can be applied to any situation where an acquirer first obtains a small equity stake before deciding to commit more resources to the target, such as de facto control acquisitions of less than 50%.
ESSAYS ON CORPORATE TAKEOVERS
192
acquisition, instead). I also exclude deals that were part of a takeover contest involving
multiple bidders and in which multiple bidders made offers for the same target within a
limited time period. This is to ensure I do not capture firms’ and markets’ reactions to
rival offers.
Deal premiums are calculated following the approach in Officer (2003) and
Moeller et al. (2004), as the takeover premiums provided by SDC are subject to large
outliers.68 My specifications use the majority acquisition premium, as well as a weighted
premium that takes into account the premium paid at the minority stake acquisition. For
two-stage acquirers, the weighted premium equals the combination of the minority and
majority stake premium, weighted by the fraction of shares acquired in each transaction.
In additional tests, I also investigate the acquirer and target’s market reactions at the deal
announcement. These are calculated as the three-day CARs in the [-1,+1] window around
the deal announcement. Combined firm CARs are calculated as the market value-
weighted average of the acquirer and target CARs.
Appendix A shows the sample distribution by target country. US targets make up
52% of the total sample, followed by Canadian (13%) and UK (9%) targets. The large
fraction of US targets mainly arises due to availability of information on bid premiums in
SDC. If this requirement were to be removed, US targets would make up less than 30% of
the sample. This large share of US targets does not affect the significance of my results
however, as I show in the robustness tests in Section 5. Splitting the sample in one-stage
and two-stage acquisitions, Appendix A shows that two-stage acquisitions occur
relatively more often in Japan (22%) and Australia (16%), with US targets only making
up 15% of the targets in two-stage deals.
The sample distribution by target 2-digit SIC industry is shown in Appendix B. The
largest industries in the full sample are business services (16%), oil and gas extraction
(8%), and metal mining (8%). The distribution of two-stage acquisitions is similar to that
of the full sample (the top three industries are business services (9%), metal mining (9%),
and communications (7%)), indicating that the results are not driven by particular
industries.
68 SDC provides different data sources for the reported takeover premiums, which give inconsistent premium estimates. Officer (2003) mitigates this problem by calculating a combined premium estimate, which integrates the different data sources and limits the premium estimate to be between 0 and 2, with the premium being left missing if it is outside these boundaries. Variable definitions are given in Appendix I.
4. TWO-STAGE ACQUISITIONS AND DEAL PREMIUMS
193
2.2 Identification Strategy
2.2.1 Treatment Effects Model
The model used to estimate the effect of a two-stage acquisition strategy on the merger
premium is described below. The main dependent variable is the weighted premium
offered in a majority takeover bid, which equals the majority stake premium for one-stage
acquirers and the combination of the minority and majority premiums, weighted by the
fraction of shares acquired, for two-stage acquirers. However, the decision to engage in a
two-stage acquisition versus a one-stage acquisition is an endogenous choice which may
be driven by observable and unobservable variables that also affect the merger premium.
To take into account firms’ selection into a one- or two-stage acquisition strategy, I
estimate a treatment effects model. Similar to the standard Heckman model, it is a two-
stage model that corrects for self-selection by including the inverse Mills ratio in the
second stage. It differs from the Heckman model in that it includes both the self-selected
and unselected samples (whereas the standard Heckman model only estimates the self-
selected subsample) and it has an endogenous indicator variable (Two-stage Acquisition)
as one of the independent variables.
The first stage estimates the likelihood of a target being acquired in a two-stage
acquisition versus a one-stage acquisition based on a probit model, using a set of firm-,
deal-, industry-, and country-level control variables and fixed effects as described below.
As an identifying variable, it includes an indicator capturing whether an acquirer is likely
to be financially constrained, proxied by having an above-median HP index.69 The HP
index is constructed as in Hadlock and Pierce (2010) and is argued to be a more
exogenous measure of financial constraints relative to more endogenous measures such
as the leverage ratio or the Kaplan and Zingales (1997) index, as it is based on relatively
exogenous firm characteristics such as the firm’s size and age. Financially constrained
acquirers may not have sufficient resources to immediately acquire a majority stake in a
target firm, making them more likely to use a two-stage strategy (Ouimet, 2013).
However, financial constraints should only affect the premium through their effect on the
inverse Mills ratio. Although it is not possible to statistically test the validity of the
69 Although the Hadlock and Pierce (2010) HP index is arguably a less endogenous measure of financial constraints, I also investigate several other measures in Appendix D, including indicators for whether the acquirer has a top quartile leverage ratio, top-quartile HP index, and the acquirer’s FC index (variable definitions are in Appendix I).
ESSAYS ON CORPORATE TAKEOVERS
194
exclusion restriction, I provide theoretical and empirical arguments to support the use of
the financial constraints proxy.
First, Gorbenko and Malenko (2017) theoretically show that, although financial
constraints affect the likelihood of doing an M&A and the method of payment, they do not
directly affect a bidder’s willingness to pay: a bidder will increase its offer until the
premium reflects the value of the target under the bidder’s ownership, and the winning
bidder will signal its type (high or low synergy) through the method of payment rather
than through the premium.
Second, one way through which the premium could still be affected is if financially
constrained acquirers have higher valuations of non-constrained targets than non-
constrained acquirers, as constrained acquirers may incorporate the benefits from
accessing the target’s financial resources in their offers. In that case, financially
constrained acquirers should be willing to offer higher premiums for non-constrained
targets relative to non-constrained acquirers. I empirically investigate this concern in
Appendix E, and find no supportive evidence for financially constrained acquirers
offering higher premiums for non-constrained targets.
Third, financial constraints could affect the deal premium if these deals are done
by serial acquirers. Serial acquirers are more likely to be overconfident, and
overconfident managers are known to overpay for their acquisitions (Billett and Qian,
2008; Malmendier and Tate, 2008). If serial acquirers are more likely to be financially
constrained at the end of their takeover sequence, this could result in a positive relation
between an acquirer’s financial constraints and the deal premium. Column (2) in
Appendix E rules out this alternative explanation.
In addition, given that I also use the treatment effects model to study how two-
stage deals affect other aspects of the deal process, any theory explaining a direct relation
between acquirer financial constraints and the deal premium also has to explain the
relation between financial constraints and the time to deal completion, likelihood of
divestiture, and long-run deal performance. I am not aware of a theory that is able to
explain such relations. The first stage regression specification is therefore as follows:
P(Two-Stage Acquisitioni)= α + βAbove-Median Acq. HP Indexjt+γFjkt+δDi+Ijk+θt+Ck+εjkt (1)
4. TWO-STAGE ACQUISITIONS AND DEAL PREMIUMS
195
Fjkt indicates a set of firm-level control variables, including the target’s and
acquirer’s leverage ratios and return on assets, the acquirer’s market capitalization,
indicators for high-tech targets and acquirers, an indicator for targets in volatile
industries, and the target’s MTB ratio. Accounting variables are measured the year before
the minority acquisition for two-stage acquirers, and the year before the majority
acquisition for one-stage acquirers. Di indicates a set of deal-level control variables,
including the relative deal size and indicators for cross-border, hostile, stock-financed,
tender offers, and diversifying deals, and an indicator capturing merger waves in the
target’s industry.70 The model includes target and acquirer industry fixed effects (Ijk) and
year (θt) fixed effects. As different countries may have different regulations regarding
acquisitions of minority stakes before making a takeover bid, target country (Ck) fixed
effects are also included.
Premiumi= α + 𝛽1𝑇𝑤𝑜𝑆𝑡𝑎𝑔𝑒 𝐴𝑐𝑞𝑢𝑖𝑠𝑖𝑡𝑖𝑜𝑛 + 𝛽2IMRi+γFjkt+δDi+Ijk+θt+Ck+εjkt (2)
The second stage model then estimates the premium difference between two-
stage and one-stage deals using a similar set of firm-, deal-, and industry-level control
variables (with the exception of the above-median HP index indicator) along with
measures of the target country’s rule of law and accounting standards, and adds the
inverse Mills ratio to adjust for potential selection bias. Standard errors are corrected for
the use of a two-step estimation procedure (Heckman, 1979).
2.2.2 Uniform Trade Secrets Act
Measuring target value uncertainty is not straightforward, as the level of information
asymmetries between bidders and targets is likely related to other firm- or deal-level
characteristics that affect the deal premium. I therefore need an exogenous source of
variation in uncertainty to test the effect of target value uncertainty on the takeover
premium in one-stage and two-stage acquisitions. I exploit the staggered enactment of
the Uniform Trade Secrets Act (UTSA) in the US, which was aimed at alleviating the
uneven development of trade secrets regulations across states. Prior to the enactment,
70 Although not reported, my results do not qualitatively change when including the target’s or acquirer’s run-up as control variables in the second step of the treatment effects model. Results are available on request.
ESSAYS ON CORPORATE TAKEOVERS
196
trade secrets were governed by state-level common law, which varied greatly from state
to state. After the enactment, trade secret protection became more extensive and clarified
the remedies and penalties for misappropriation, thereby strengthening overall
protection (Samuels and Johnson, 1990; Malsberger et al., 2008; Png, 2017). Specifically,
it increased protection by stating that the improper acquisition of a trade secret, without
its actual use or disclosure, qualifies as a misappropriation and that information does not
need to be used continuously in order to qualify as a trade secret. It also gave the owner
of a trade secret three years after misappropriation to begin legal action, and it increased
the severity of punishment by allowing punitive damages of up to twice the actual
damage.
The UTSA was enacted by 48 US states between 1975 and 2013, with the exception
of Massachusetts and New York. Although my sample period only starts in 1990, it still
includes the UTSA enactment by Michigan (1998), Missouri (1995), New Jersey (2012),
Ohio (1994), Pennsylvania (2004), South Carolina (1992), Tennessee (2000), Texas
(2013), Vermont (1996), and Wyoming (2006). Importantly, Png (2017) and Castellaneta
et al. (2017) show that the timing of the UTSA enactment across states was unrelated to
economic or political conditions and to corporate lobbying. In unreported tests, I indeed
find no significant differences between treated and untreated states in terms of GDP and
GDP growth before the enactment. Although M&As are often governed by the law of the
state in which the target firm is incorporated, my identification uses the state of the
target’s headquarters: the applicable law is that of the state where the misappropriation
of trade secrets actually occurred, which is more likely to be the firm’s main state of
business.
Trade secrets encompass information on firms’ marketing data, manufacturing
know-how, chemical processes, and technical data and are an important dimension of a
firm’s intellectual capital and hence its overall value (Jorda et al., 2007). Following the
increase in trade secret protection, certain information that was unprotected became
eligible for protection and thus became harder to obtain.71 Although stronger protection
of trade secrets reduces the risk of misappropriation by competitors, it also limits the
amount of firm-specific information available to potential acquirers, increasing
information asymmetries between targets and acquirers. Moreover, even if the target
71 For example, the UTSA extended the definition of trade secrets to also cover “negative know-how”, knowledge about attempted but failed techniques and technologies (Malsberger et al., 2008).
4. TWO-STAGE ACQUISITIONS AND DEAL PREMIUMS
197
itself does not own valuable trade secrets, its competitors may still be affected by the
increase in trade secret protection. As information about competitors’ assets is key to
establishing whether a target owns a competitive advantage, this also constrains
information regarding the target’s potential value (Peteraf, 1993). An increase in trade
secret protection thus increases the uncertainty about the target’s value from the bidder’s
perspective, even if the target does not own trade secrets itself or if it would disclose its
trade secrets in the due diligence process.72 These increased information asymmetries
between targets and acquirers then result in lower premiums after the UTSA enactment,
as shown by Castellaneta et al. (2017).
Two-stage acquirers that own a minority stake in the target may however have a
comparative advantage. As important blockholders, they can more easily obtain valuable
private data and information on trade secrets through their formal presence at annual
meetings73 or through informal talks with CEOs, employees, and customers. An increase
in trade secret protection therefore increases the information asymmetries for one-stage
acquirers, but it should not affect two-stage acquirers to the same extent. Premiums in
two-stage acquisitions should then be higher than in one-stage deals, as one-stage
acquirers are more likely to respond to the increase in trade secret protection by offering
lower premiums. 74
2.2.3 Reductions in Import Tariff Rates
To test the effect of a potential increase in M&A competition, I use large reductions in
industry-level import tariff rates in the US as an exogenous shock to the number of
potential bidders. Decreasing entry barriers increases the likelihood that foreign rivals
will enter and compete on the product market with domestic firms. The literature on
trade liberalization shows that tariff reductions substantially increase domestic
(Breinlich, 2008) and cross-border (Neary, 2007) M&A activity, as more intense product
market competition triggers a re-allocation of assets across firms and industries, making
72 This is however unlikely, as firms rarely disclose core information in the due diligence process before the transaction is concluded (Weakley, 2014). 73 Minority blockholders owning more than 10% of the firm’s shares are considered to be insiders by US regulations as they can often claim board seat(s) and hence influence the firm’s decisions. 74 The UTSA likely affects firm value and hence the deal premium through channels other than target value uncertainty. High-skilled workers and innovative projects may for example become more valuable as they are better protected. However, in order to explain my results, they should have differential effects on the merger premium for one-stage and two-stage acquirers. This is unlikely to occur through channels other than through the reduction in uncertainty.
ESSAYS ON CORPORATE TAKEOVERS
198
specific assets cheaper and increasing overall M&A activity.75 I indeed find that M&A
activity increases by 15% in the year after a (large) reduction in import tariff rates.
Similar to the effect of merger waves on bid premiums, this implies that deals involving
targets in industries subject to large tariff cuts face an increase in the number of potential
bidders, which should translate in higher premiums being offered. As before, two-stage
acquirers are expected to be less affected by an increase in the potential number of rival
bidders as their minority stake deters competing offers. They should then offer lower
premiums relative to one-stage acquirers.
Industry-level import tariff reductions are arguably exogenous to the premium
offered in takeovers and M&A activity in general. In the US, any tariff reductions done by
the USITC (United States International Trade Commission) should be in accordance with
the GATT/WTO agreements. Although they are not randomly assigned and they are not
entirely unanticipated – the WTO agreements include a roadmap for phased tariff
reductions – there is considerable ex-ante uncertainty regarding the extent to which
foreign firms will be successful in penetrating the domestic market (Bernard, Jensen,
Redding, and Schott, 2012). In addition, any firm-level variables affected by tariff cuts
would have to influence the premiums paid by two-phase acquirers in a systematically
different manner than those paid by one-phase acquirers in order to invalidate the
results.76 Import tariff cuts can thus be considered exogenous industry-level shocks to US
domestic firms in terms of their effect on the merger premium.
I obtain data on US import tariffs at the four-digit SIC level from Schott (2010) up
to 2005, and update it up to 2015 using the data on imports and exports on Schott’s
website.77 Following the literature (Frésard, 2010; Valta, 2012, Xu, 2012), a large tariff
75 Moreover, foreign firms have stronger incentives to acquire production capacity through M&As in order to benefit from improved trading conditions (Breinlich, 2008). There may however also be a counterbalancing effect for horizontal M&As in that decreases in trade costs make it easier to serve a foreign market via exports, reducing the incentives to establish production capacity via M&As. Although empirical evidence is inconsistent on which effect dominates, I focus on domestic M&A activity to reduce concerns regarding this effect. 76 For example, Lileeva and Trefler (2010) show that import tariff cuts increase foreign competitors’ innovation output, implying that target firms that rely heavily on innovation face a stronger increase in competition. It could however be that those targets are also more uncertain to potential acquirers, and hence are more likely to be acquired using a two-stage acquisition strategy. Two-phase acquirers then face a stronger increase in competition relative to one-stage acquirers, such that foreign competitors’ increase in innovation biases against finding evidence for a competition-reducing effect of two-stage acquisitions. The effects documented in Table 5 should thus be stronger in the absence of such an effect. 77 http://faculty.som.yale.edu/peterschott/sub_international.htm
4. TWO-STAGE ACQUISITIONS AND DEAL PREMIUMS
199
reduction is defined as a yearly drop in an industry’s import tariff rate that is larger than
twice the median tariff rate reduction in that industry over the whole sample period.
2.3 Descriptive Statistics
Table 1 reports summary statistics for the sample of one-stage and two-stage acquisitions
for which at least the bid premium for the majority stake acquisition is available. Panel A
reports firm-level characteristics for bidders and targets, with accounting variables
measured the year before the minority stake bid for the two-stage acquirers, and the year
before the majority takeover bid for the one-stage acquirers. The difference in means
shows that targets and acquirers in two-stage acquisitions differ on a large number of
dimensions relative to those in one-stage acquisitions. Two-stage acquirers have
significantly higher industry-adjusted leverage ratios and Hadlock and Pierce (2010) HP
indices relative to one-stage acquirers. This suggests that acquirers may prefer two-stage
acquisitions when they do not have sufficient funds available to acquire a majority stake
in one step.78 Two-stage acquisitions are also less likely to occur in countries with a
better rule of law and better accounting standards, as in these countries there are less
information asymmetries regarding the target’s value and hence a lower need for two-
stage acquisitions to resolve this uncertainty.
Panel B reports deal-level characteristics. Targets are relatively smaller than
acquirers in two-stage relative to one-stage acquisitions, which may indicate that these
are less mature firms for which less information is available. Consistent with the idea that
targets in foreign countries and in different industries are harder to value, two-stage
acquisitions are more likely to involve foreign targets and targets in different industries.
One-stage acquisitions are also more likely to be fully stock financed. As stock financing
is often used to reduce information asymmetries between targets and acquirers, two-
stage acquisitions can reduce such uncertainty without resorting to stock financing. The
results also confirm that, in contrast to toeholds, minority stakes provide acquirers with
board seats: two-stage acquirers are 22% more likely to be present on the target’s board
before making a majority stake offer. Note that this dummy variable is coded to equal
zero when information about the target’s board composition is unavailable in BoardEx.
78 . Given that capital structures and financial constraints are industry-dependent (Rajan and Zingales, 1998), the leverage ratio and HP index are adjusted for the 2-digit SIC industry mean. Consistent with the use of two-stage acquisitions by financially constrained acquirers, Ouimet (2013) reports that acquirers in minority stake acquisitions are more financially constrained than acquirers in majority stake acquisitions.
ESSAYS ON CORPORATE TAKEOVERS
200
This retains the number of observations, but biases against finding a significant
difference in board presence between one- and two-stage acquirers: when excluding
these observations, I find that two-stage acquirers are almost eight times more likely to
be present on the target’s board (62% in two-stage deals, relative to 9% in one-stage
deals).79 In addition, the last two rows indicate that two-stage acquirers on average own
26% of the target’s shares prior to the majority takeover bid and that acquirers wait on
average 1.4 years before expanding a minority stake to a majority stake.
The pricing implications are reported in Panel C. Both the majority stake premium
and the weighted premium are significantly lower in two-stage acquisitions relative to
one-stage acquisitions. This suggests a competition-deterring effect of acquiring a target
in two stages, but this will be investigated in more detail in subsequent tests. The control
premium (if any) in minority stake acquisitions is generally much smaller than that in
majority acquisitions. It is therefore not surprising that the premium difference between
one-stage and two-stage acquisitions becomes larger when considering the weighted
premium. Target CARs are significantly lower for two-stage acquisitions relative to one-
stage acquisitions, which may reflect the lower premiums in two-stage deals as they are
not affected by pre-emptive bidding. Acquirer shareholders do not react significantly
differently, which may seem surprising as two-stage deals should offer considerable
benefits to acquirers in terms of resolving valuation uncertainty and deterring
competition. However, acquirer CARs are traditionally small and close to zero (Moeller et
al., 2004), making it harder to find significant effects. Consequently, the combined CARs
mainly reflect the reactions of target shareholders, resulting in significantly lower returns
for two-stage deals relative to one-stage deals.
79 I confirm these results using a treatment effects model as in Section 3.1, but which has the acquirer’s presence on the target’s board as the dependent variable in the second stage estimation (results not reported). Two-stage acquisitions are strongly positively related to an acquirer having target board seats before the majority stake bid.
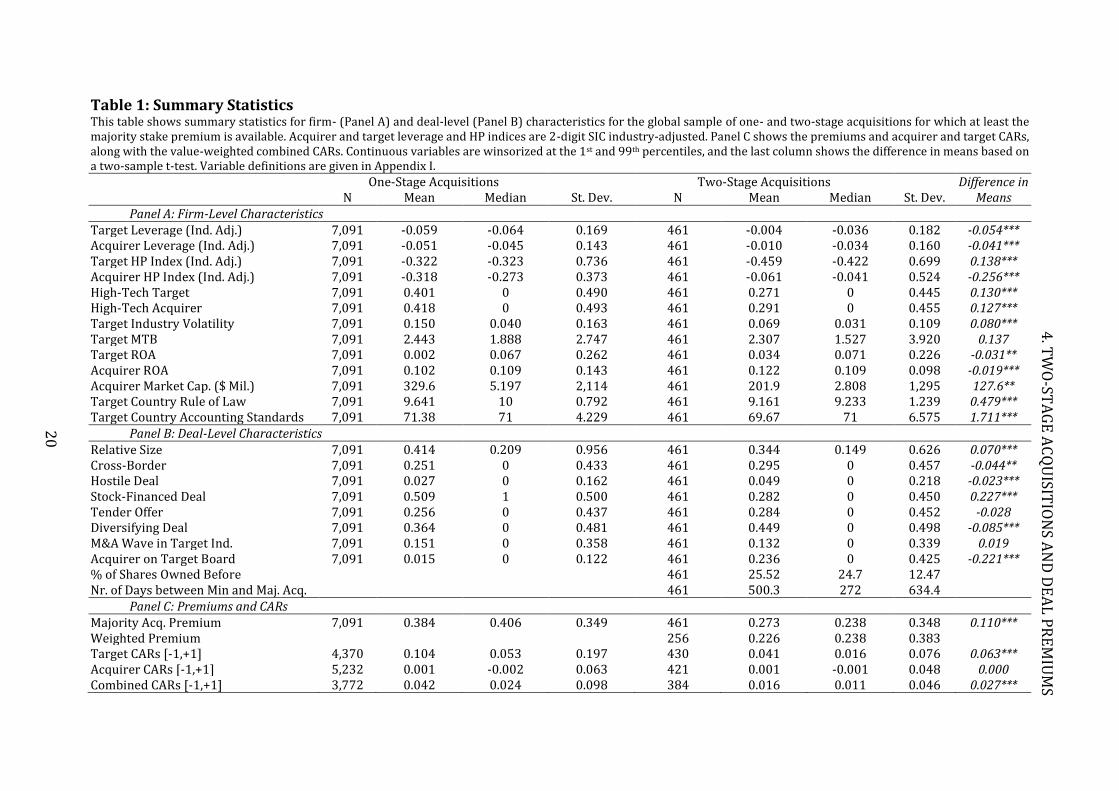
Table 1: Summary Statistics This table shows summary statistics for firm- (Panel A) and deal-level (Panel B) characteristics for the global sample of one- and two-stage acquisitions for which at least the majority stake premium is available. Acquirer and target leverage and HP indices are 2-digit SIC industry-adjusted. Panel C shows the premiums and acquirer and target CARs, along with the value-weighted combined CARs. Continuous variables are winsorized at the 1st and 99th percentiles, and the last column shows the difference in means based on a two-sample t-test. Variable definitions are given in Appendix I.
One-Stage Acquisitions Two-Stage Acquisitions Difference in Means N Mean Median St. Dev. N Mean Median St. Dev.
Panel A: Firm-Level Characteristics Target Leverage (Ind. Adj.) 7,091 -0.059 -0.064 0.169 461 -0.004 -0.036 0.182 -0.054*** Acquirer Leverage (Ind. Adj.) 7,091 -0.051 -0.045 0.143 461 -0.010 -0.034 0.160 -0.041*** Target HP Index (Ind. Adj.) 7,091 -0.322 -0.323 0.736 461 -0.459 -0.422 0.699 0.138*** Acquirer HP Index (Ind. Adj.) 7,091 -0.318 -0.273 0.373 461 -0.061 -0.041 0.524 -0.256*** High-Tech Target 7,091 0.401 0 0.490 461 0.271 0 0.445 0.130*** High-Tech Acquirer 7,091 0.418 0 0.493 461 0.291 0 0.455 0.127*** Target Industry Volatility 7,091 0.150 0.040 0.163 461 0.069 0.031 0.109 0.080*** Target MTB 7,091 2.443 1.888 2.747 461 2.307 1.527 3.920 0.137 Target ROA 7,091 0.002 0.067 0.262 461 0.034 0.071 0.226 -0.031** Acquirer ROA 7,091 0.102 0.109 0.143 461 0.122 0.109 0.098 -0.019*** Acquirer Market Cap. ($ Mil.) 7,091 329.6 5.197 2,114 461 201.9 2.808 1,295 127.6** Target Country Rule of Law 7,091 9.641 10 0.792 461 9.161 9.233 1.239 0.479*** Target Country Accounting Standards 7,091 71.38 71 4.229 461 69.67 71 6.575 1.711*** Panel B: Deal-Level Characteristics Relative Size 7,091 0.414 0.209 0.956 461 0.344 0.149 0.626 0.070*** Cross-Border 7,091 0.251 0 0.433 461 0.295 0 0.457 -0.044** Hostile Deal 7,091 0.027 0 0.162 461 0.049 0 0.218 -0.023*** Stock-Financed Deal 7,091 0.509 1 0.500 461 0.282 0 0.450 0.227*** Tender Offer 7,091 0.256 0 0.437 461 0.284 0 0.452 -0.028 Diversifying Deal 7,091 0.364 0 0.481 461 0.449 0 0.498 -0.085*** M&A Wave in Target Ind. 7,091 0.151 0 0.358 461 0.132 0 0.339 0.019 Acquirer on Target Board 7,091 0.015 0 0.122 461 0.236 0 0.425 -0.221*** % of Shares Owned Before 461 25.52 24.7 12.47 Nr. of Days between Min and Maj. Acq. 461 500.3 272 634.4 Panel C: Premiums and CARs Majority Acq. Premium 7,091 0.384 0.406 0.349 461 0.273 0.238 0.348 0.110*** Weighted Premium 256 0.226 0.238 0.383 Target CARs [-1,+1] 4,370 0.104 0.053 0.197 430 0.041 0.016 0.076 0.063*** Acquirer CARs [-1,+1] 5,232 0.001 -0.002 0.063 421 0.001 -0.001 0.048 0.000 Combined CARs [-1,+1] 3,772 0.042 0.024 0.098 384 0.016 0.011 0.046 0.027***
20
4
4. T
WO
-STA
GE
AC
QU
ISITIO
NS A
ND
DE
AL
PR
EM
IUM
S
ESSAYS ON CORPORATE TAKEOVERS
202
3. Two-Stage Acquisitions and Bid Premiums
3.1 Treatment Effects Model
3.1.1 Two-Stage Acquisitions and Deal Premiums
I investigate the premium difference between one-stage and two-stage acquisitions using
the treatment effects model described in Section 2.1.80 Columns (1) and (3) in Table 2
report the results for the first-stage model which estimates the likelihood of a target being
acquired in a two-stage deal relative to a one-stage deal, using the acquirer’s financial
constraints (as measured by an above-median HP index) as an identifying variable. As
expected, two-stage acquisitions are more likely when the acquirer is more financially
constrained. This is consistent with acquirers preferring to use two-stage deals when
they do not have sufficient funds to acquire the target in one transaction.81 Targets in
different industries from those of the acquirer are more likely to be acquired in a two-
stage deal, and stock-financed deals are less likely to be done in two steps. Two-stage
acquisitions are also more likely when the acquirer is more profitable and when the
target’s MTB ratio is below the industry median. Consistent with the idea that two-stage
acquisitions may be used to fend off rival bidders, M&A waves in the target’s industry
increase the likelihood of a two-stage deal. 82
Columns (2) and (4) show the results for the second-stage model using the
majority stake premium and the weighted premium as dependent variables, respectively.
Both models include the indicator for two-stage acquisitions and the inverse Mills ratio,
in addition to firm-, deal-, and country-level control variables and year and industry fixed
effects. Two-stage acquirers appear to offer significantly lower premiums relative to one-
stage acquirers, which suggests that two-stage acquisitions may play a role in deterring
competition, resulting in lower premiums. The premium difference increases from -20%
80 Appendix C shows the estimates for a regular OLS model, which does not include the inverse Mills ratio. As expected, the coefficient on two-stage acquisitions is slightly larger, but the overall conclusions remain unchanged. 81 Note that these financial constraints proxies are not industry-adjusted as the specification includes acquirer and target industry fixed effects. I re-estimate the treatment effects model in Appendix D using indicators for whether the acquirer’s leverage ratio (Column (1)) or HP index (Column (3)) is in the top quartile of the sample distribution. In Column (5), I include the acquirer’s FC index. The FC index ranges from 0 to 3 and adds 1 if the acquirer did not pay a dividend, has a top-quartile leverage ratio, or has a top-quartile HP index. The results from these estimations are similar in size and significance to those based on the HP index in Table 2. 82 The insignificant coefficient on relative size is likely because, on the one hand, relatively larger targets are harder to fund, making it more likely that acquirers need two stages to acquire majority control in the target. On the other hand, because smaller targets are easier to fund, they also attract a higher number of potential competitors. A higher level of potential competition may then increase the likelihood of using a two-stage acquisition strategy.
4. TWO-STAGE ACQUISITIONS AND DEAL PREMIUMS
203
to -25% when considering the weighted premium, indicating that acquirers do not pay
excessively large premiums at the minority stake acquisition which off-sets the lower
premium at the majority stake acquisition. In addition, the results indicate that lower
premiums are offered in diversifying deals and in relatively larger deals. Premiums are
higher when the target and acquirer are more profitable and when the deal is financed
using stock, but acquirer leverage is negatively related to the premium. The coefficient
on the inverse Mills ratio is significantly positive, indicating that without correcting for
selection bias, the coefficient on Two-Stage Acquisition would have been upward-biased.
In other words, factors that increase the likelihood of a two-stage deal are associated with
higher bid premiums. The OLS results in Appendix C confirm this, as the coefficients on
the Two-Stage Acquisition indicator more than halve in size to -5% and -8%.
Although the treatment effects model corrects for a potential selection bias, there
may still be unobservable factors at the acquirer level that affect the likelihood of
engaging in a two-stage acquisition and the premium offered. I therefore also estimate an
acquirer firm fixed effects model for a sample of serial acquirers to take into account time-
invariant variables at the acquirer level (Column 5).83 I find that the coefficient for two-
stage acquisitions increases in size to -30%, although it becomes less significant.
The results in Column 4 show that two-stage acquirers still pay significantly lower
premiums even when taking into account the premium paid for their minority stake,
indicating that the premium difference at the majority stake acquisition is not off-set by
an excessively high premium at the minority stake acquisition. However, it is not obvious
whether targets in two-stage deals should receive higher or lower premiums at the
minority stake acquisition relative to those in minority acquisitions that were not
followed by a majority stake offer. Column 1 in Appendix F shows that two-stage
acquirers pay 7% higher premiums at the minority acquisition relative to acquirers that
did not make a subsequent majority acquisition. This suggests that the minority stake
premium includes the value of the “option to wait” in two-stage acquisitions, which
should be more valuable for more uncertain targets. Indeed, Column 2 in Appendix F
shows that minority stake premiums by two-stage acquirers are 12% higher than
premiums by other minority stake acquirers if the target is in a volatile industry relative
to only 4% higher premiums if the target’s industry is less volatile.
83 Serial acquirers are defined here as firms acquiring more than 5 targets over the sample period.
ESSAYS ON CORPORATE TAKEOVERS
204
An alternative explanation for the negative effect of two-stage acquisitions on the
merger premium is that disappointing information about the target’s value has become
available between the minority and the majority stake acquisition, such that the acquirer
can purchase majority control in the target at a lower premium. Although such an
explanation is hard to disentangle from the competition-reducing effect of two-stage
acquisitions, I investigate such negative uncertainty resolution using large changes in the
target’s return on assets in a robustness test in Table 10. I find that controlling for
negative events between the minority and majority acquisition does not erode the
negative effect of two-stage acquisitions on the merger premium. In addition, all
specifications control for the target’s return on assets and leverage ratio in the year
before the majority stake acquisition. In unreported tests, I also control for declines in
target performance using an indicator for whether the target had a negative EBITDA,
which does not affect my conclusions.
Overall, these results show that two-stage acquisitions are associated with lower
premiums than one-stage acquisitions, with this effect not being driven by the lack of
control premium in the minority stake acquisition, a selection bias effect, or unobservable
time-invariant acquirer characteristics. In addition, although two-stage acquirers pay
higher premiums at the minority acquisition relative to other minority stake acquirers,
this does not off-set the lower premiums at the majority acquisition.
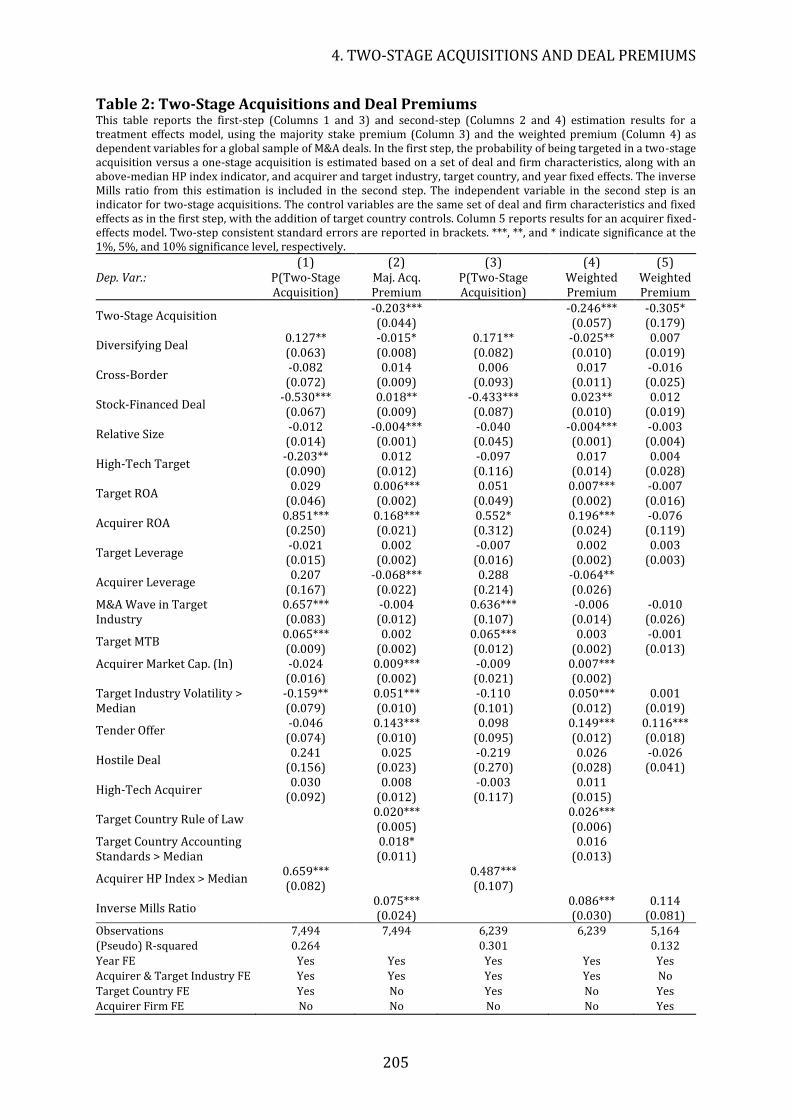
4. TWO-STAGE ACQUISITIONS AND DEAL PREMIUMS
205
Table 2: Two-Stage Acquisitions and Deal Premiums This table reports the first-step (Columns 1 and 3) and second-step (Columns 2 and 4) estimation results for a treatment effects model, using the majority stake premium (Column 3) and the weighted premium (Column 4) as dependent variables for a global sample of M&A deals. In the first step, the probability of being targeted in a two-stage acquisition versus a one-stage acquisition is estimated based on a set of deal and firm characteristics, along with an above-median HP index indicator, and acquirer and target industry, target country, and year fixed effects. The inverse Mills ratio from this estimation is included in the second step. The independent variable in the second step is an indicator for two-stage acquisitions. The control variables are the same set of deal and firm characteristics and fixed effects as in the first step, with the addition of target country controls. Column 5 reports results for an acquirer fixed-effects model. Two-step consistent standard errors are reported in brackets. ***, **, and * indicate significance at the 1%, 5%, and 10% significance level, respectively. (1) (2) (3) (4) (5) Dep. Var.: P(Two-Stage
Acquisition) Maj. Acq. Premium
P(Two-Stage Acquisition)
Weighted Premium
Weighted Premium
Two-Stage Acquisition -0.203*** -0.246*** -0.305* (0.044) (0.057) (0.179)
Diversifying Deal 0.127** -0.015* 0.171** -0.025** 0.007 (0.063) (0.008) (0.082) (0.010) (0.019)
Cross-Border -0.082 0.014 0.006 0.017 -0.016 (0.072) (0.009) (0.093) (0.011) (0.025)
Stock-Financed Deal -0.530*** 0.018** -0.433*** 0.023** 0.012 (0.067) (0.009) (0.087) (0.010) (0.019)
Relative Size -0.012 -0.004*** -0.040 -0.004*** -0.003 (0.014) (0.001) (0.045) (0.001) (0.004)
High-Tech Target -0.203** 0.012 -0.097 0.017 0.004 (0.090) (0.012) (0.116) (0.014) (0.028)
Target ROA 0.029 0.006*** 0.051 0.007*** -0.007
(0.046) (0.002) (0.049) (0.002) (0.016)
Acquirer ROA 0.851*** 0.168*** 0.552* 0.196*** -0.076 (0.250) (0.021) (0.312) (0.024) (0.119)
Target Leverage -0.021 0.002 -0.007 0.002 0.003 (0.015) (0.002) (0.016) (0.002) (0.003)
Acquirer Leverage 0.207 -0.068*** 0.288 -0.064**
(0.167) (0.022) (0.214) (0.026) M&A Wave in Target Industry
0.657*** -0.004 0.636*** -0.006 -0.010 (0.083) (0.012) (0.107) (0.014) (0.026)
Target MTB 0.065*** 0.002 0.065*** 0.003 -0.001 (0.009) (0.002) (0.012) (0.002) (0.013)
Acquirer Market Cap. (ln) -0.024 0.009*** -0.009 0.007*** (0.016) (0.002) (0.021) (0.002) Target Industry Volatility > Median
-0.159** 0.051*** -0.110 0.050*** 0.001 (0.079) (0.010) (0.101) (0.012) (0.019)
Tender Offer -0.046 0.143*** 0.098 0.149*** 0.116*** (0.074) (0.010) (0.095) (0.012) (0.018)
Hostile Deal 0.241 0.025 -0.219 0.026 -0.026
(0.156) (0.023) (0.270) (0.028) (0.041)
High-Tech Acquirer 0.030 0.008 -0.003 0.011
(0.092) (0.012) (0.117) (0.015)
Target Country Rule of Law 0.020*** 0.026*** (0.005) (0.006)
Target Country Accounting Standards > Median
0.018* 0.016 (0.011) (0.013)
Acquirer HP Index > Median 0.659*** 0.487*** (0.082) (0.107)
Inverse Mills Ratio 0.075*** 0.086*** 0.114 (0.024) (0.030) (0.081)
Observations 7,494 7,494 6,239 6,239 5,164
(Pseudo) R-squared 0.264 0.301 0.132
Year FE Yes Yes Yes Yes Yes
Acquirer & Target Industry FE Yes Yes Yes Yes No
Target Country FE Yes No Yes No Yes
Acquirer Firm FE No No No No Yes
ESSAYS ON CORPORATE TAKEOVERS
206
3.1.2 Target Value Uncertainty
Next, I investigate several situations in which the competition-deterring effect of
acquiring a minority stake on the one hand and the uncertainty-resolving effect on the
other hand are more likely to dominate. The control variables are not reported in the next
tables to save space, but all estimations include the set of control variables and fixed
effects reported in Table 2, along with the inverse Mills ratio to correct for selection bias.
Acquiring a minority stake in a target firm before making a majority takeover bid
increases the information available to the acquirer about the target’s operations and
management, and hence about its value. Minority stake acquirers become blockholders
in the target firm and may thus be present on the target’s board, or they may simply have
better access to informal meetings with the target’s employees, management, and board
directors (Barclay and Holderness, 1991). This informational advantage should then be
reflected in the takeover premium. On average, targets with more uncertain valuations
receive lower offers as acquirers want to avoid overpaying for “bad” targets (Coff, 1999;
Povel and Singh, 2006).84 Therefore, to the extent that two-stage acquirers can better
assess the value of the target’s operational processes and are hence faced with less
uncertainty, they should decrease their offers less relative to one-stage acquirers.
Following the literature, I proxy target value uncertainty with the target’s industry
stock volatility in the year preceding the takeover bid (Bhagwat, Dam, and Harford,
2016). Column (1) in Table 3 reports the results from interacting the two-stage
acquisition indicator with an indicator for above-median target industry stock volatility.
I find that although two-stage acquisitions are related to lower premiums when target
industry stock volatility is low – reflecting the competition-deterring effect of minority
stake acquisitions as the uncertainty-reducing effect is less likely to play a role for these
targets – the effect is weakened when target value uncertainty is high. Specifically,
premiums are 38% lower in two-stage deals relative to one-stage deals when uncertainty
is low, but above-median target industry stock volatility offsets this effect by 11%.
Gomes-Casseres, Hagedoorn, and Jaffe (2006) find that knowledge flows between allied
firms are greatest when firms are geographically close to each other as it is more costly
84 Alternatively, targets with more uncertain valuations may end up receiving higher offers if acquirers are likely to overvalue the target and hence overpay. Two-stage acquisitions then result in lower premiums because they are less subject to overpayment. There is however little theoretical or empirical evidence indicating that more uncertainty is related to overpayment and higher premiums. Moreover, Columns (3) and (4) of Table 3 indicate that the lower premiums in two-stage acquisitions are more likely due to the competition-deterring effect.
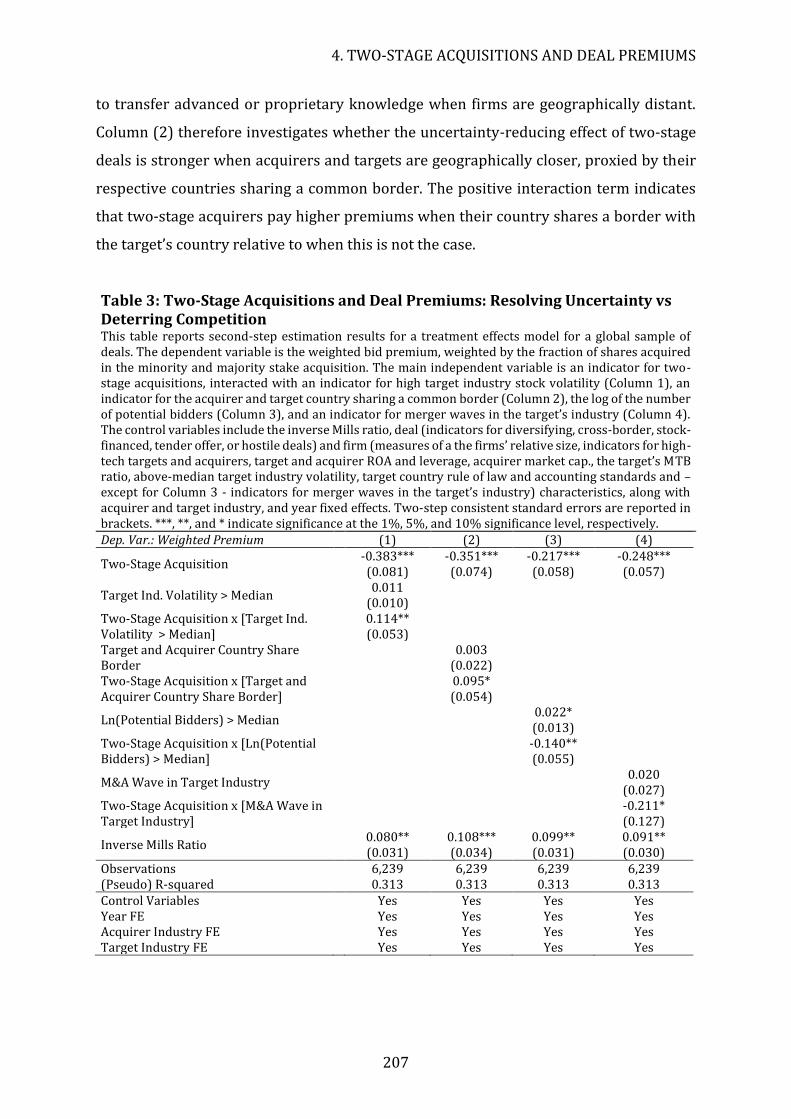
4. TWO-STAGE ACQUISITIONS AND DEAL PREMIUMS
207
to transfer advanced or proprietary knowledge when firms are geographically distant.
Column (2) therefore investigates whether the uncertainty-reducing effect of two-stage
deals is stronger when acquirers and targets are geographically closer, proxied by their
respective countries sharing a common border. The positive interaction term indicates
that two-stage acquirers pay higher premiums when their country shares a border with
the target’s country relative to when this is not the case.
Table 3: Two-Stage Acquisitions and Deal Premiums: Resolving Uncertainty vs Deterring Competition This table reports second-step estimation results for a treatment effects model for a global sample of deals. The dependent variable is the weighted bid premium, weighted by the fraction of shares acquired in the minority and majority stake acquisition. The main independent variable is an indicator for two-stage acquisitions, interacted with an indicator for high target industry stock volatility (Column 1), an indicator for the acquirer and target country sharing a common border (Column 2), the log of the number of potential bidders (Column 3), and an indicator for merger waves in the target’s industry (Column 4). The control variables include the inverse Mills ratio, deal (indicators for diversifying, cross-border, stock-financed, tender offer, or hostile deals) and firm (measures of a the firms’ relative size, indicators for high-tech targets and acquirers, target and acquirer ROA and leverage, acquirer market cap., the target’s MTB ratio, above-median target industry volatility, target country rule of law and accounting standards and – except for Column 3 - indicators for merger waves in the target’s industry) characteristics, along with acquirer and target industry, and year fixed effects. Two-step consistent standard errors are reported in brackets. ***, **, and * indicate significance at the 1%, 5%, and 10% significance level, respectively. Dep. Var.: Weighted Premium (1) (2) (3) (4)
Two-Stage Acquisition -0.383*** -0.351*** -0.217*** -0.248*** (0.081) (0.074) (0.058) (0.057)
Target Ind. Volatility > Median 0.011 (0.010)
Two-Stage Acquisition x [Target Ind. Volatility > Median]
0.114** (0.053)
Target and Acquirer Country Share Border
0.003 (0.022)
Two-Stage Acquisition x [Target and Acquirer Country Share Border]
0.095* (0.054)
Ln(Potential Bidders) > Median 0.022* (0.013)
Two-Stage Acquisition x [Ln(Potential Bidders) > Median]
-0.140** (0.055)
M&A Wave in Target Industry 0.020 (0.027)
Two-Stage Acquisition x [M&A Wave in Target Industry]
-0.211* (0.127)
Inverse Mills Ratio 0.080** 0.108*** 0.099** 0.091** (0.031) (0.034) (0.031) (0.030)
Observations 6,239 6,239 6,239 6,239 (Pseudo) R-squared 0.313 0.313 0.313 0.313 Control Variables Yes Yes Yes Yes Year FE Yes Yes Yes Yes Acquirer Industry FE Yes Yes Yes Yes Target Industry FE Yes Yes Yes Yes
ESSAYS ON CORPORATE TAKEOVERS
208
3.1.3 Potential Bidder Competition
Based on theoretical (Fishman, 1989) and empirical (Aktas, de Bodt, and Roll, 2010)
evidence, majority stake acquirers should increase their offers more if there is more
potential competition in order to deter rival bidders from entering the contest.85 An
alternative deterrent strategy however is to acquire a minority stake, as this increases
the price rival bidders have to offer to get the minority stake acquirer to sell its stake,
keeping them from making an offer in the first place (Betton et al., 2009). Consequently,
two-stage acquirers should not have to raise their bids when there is more potential
competition, resulting in lower premiums relative to one-stage acquirers. Following
Aktas et al. (2010), I proxy potential competition with a dummy taking the value of one
when there is an M&A wave in the target’s industry as competition for targets is stronger
during merger waves (Column (3)). As a second proxy for potential competition, I follow
Povel and Sertsios (2014) by assuming that the potential number of interested bidders in
a target is proportional to the number of public companies in the target’s industry and
related industries (Column (4)). I calculate the probability that a firm in industry i is
acquired by a firm in industry j and I multiply this probability for each industry i with the
probability that an acquirer belongs to industry j times the number of public companies
in industry j one year before the takeover offer is made. The potential number of bidders
at time t in industry i is then the sum of these products across industries.
The results in Columns (3) and (4) indicate that, even when potential competition
is low, two-stage acquirers offer lower premiums relative to one-stage acquirers. This
likely reflects the lack of a control premium in the minority stake acquisition, which
lowers the weighted deal premium in the majority stake acquisition. When potential
competition is high however, the premium difference becomes even larger. In Column
(3), an above-median level of potential bidders decreases premiums by 14% for two-
stage acquirers, whereas it increases premiums by 2% for one-stage acquirers. This is
consistent with increased potential competition inducing pre-emptive bidding behavior
in one-stage acquirers. For two-stage acquirers however, the minority stake already acts
as a deterring mechanism, mitigating the need to raise offer premiums. These results are
confirmed by using M&A waves in the target’s industry as a proxy for potential
85 It is important to look at potential competition rather than the observed number of bidders as the number of bidders reported by sources such as SDC only reflects official bids, not taking into account interested firms that did not submit official bids (Boone and Mulherin, 2008). Moreover, the potential number of bidders is less likely to be endogenous to the decision to take a minority stake.
4. TWO-STAGE ACQUISITIONS AND DEAL PREMIUMS
209
competition, although the pre-emptive bidding behavior by one-stage acquirers is found
to be weaker.
3.2 Exogenous Variation in Target Value Uncertainty and M&A Competition
3.2.1 UTSA Enactment across US States
Although the treatment effects model accounts for a potential selection bias in estimating
the premium difference between two-stage and one-stage acquirers, there may still be
omitted variables that affect the likelihood of being acquired in a two-stage deal and the
offered premium. I therefore consider two arguably exogenous sources of variation in
target value uncertainty and potential competition.
First, I exploit the staggered introduction of the Uniform Trade Secrets Acts
(UTSA) across US target states. The UTSA statutes considerably increased trade secret
protection in the states that enacted them, providing better protection against imitation
by rivals, but also reducing information available to potential bidders about firms’
operational processes, customer lists, and other aspects of their intellectual capital. I
therefore expect that the enactment of UTSA statutes decreased the premiums offered by
one-stage acquirers. Two-stage acquirers may however have an increased advantage as
they are present on the board’s meetings or have informal contacts with the target’s
employees, customers, and suppliers. Two-stage acquirers should thus not reduce their
bid premiums following an increase in uncertainty. If anything, they may value stronger
trade secret protection as it increases the target’s competitive advantage, and
consequently offer higher premiums to reflect this.86
86 An alternative explanation could be that an increase in trade secret protection increases the value of those firms that are also more likely to be acquired in a two-stage acquisition, such that the higher premiums in two-stage acquisitions simply reflect the increase in value. This story does not however explain why targets in one-stage acquisitions (that should thus not be affected by an increase in trade secret protection) receive lower premiums following UTSA enactment.
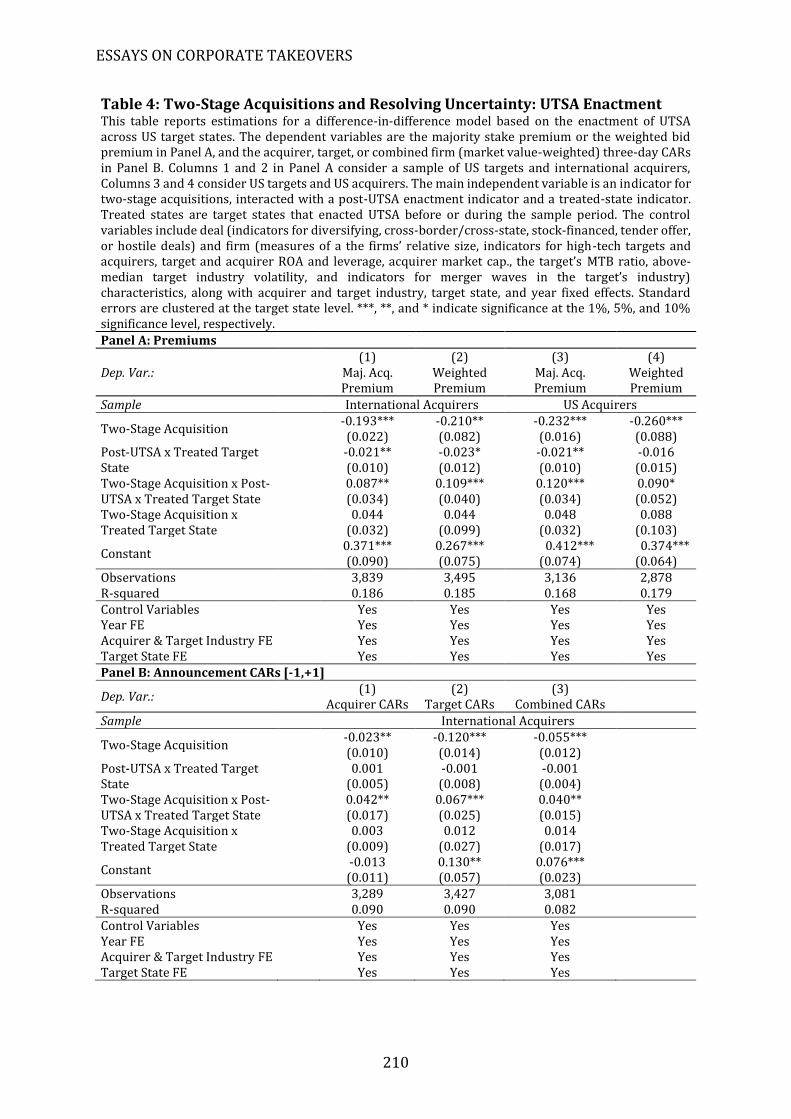
ESSAYS ON CORPORATE TAKEOVERS
210
Table 4: Two-Stage Acquisitions and Resolving Uncertainty: UTSA Enactment This table reports estimations for a difference-in-difference model based on the enactment of UTSA across US target states. The dependent variables are the majority stake premium or the weighted bid premium in Panel A, and the acquirer, target, or combined firm (market value-weighted) three-day CARs in Panel B. Columns 1 and 2 in Panel A consider a sample of US targets and international acquirers, Columns 3 and 4 consider US targets and US acquirers. The main independent variable is an indicator for two-stage acquisitions, interacted with a post-UTSA enactment indicator and a treated-state indicator. Treated states are target states that enacted UTSA before or during the sample period. The control variables include deal (indicators for diversifying, cross-border/cross-state, stock-financed, tender offer, or hostile deals) and firm (measures of a the firms’ relative size, indicators for high-tech targets and acquirers, target and acquirer ROA and leverage, acquirer market cap., the target’s MTB ratio, above-median target industry volatility, and indicators for merger waves in the target’s industry) characteristics, along with acquirer and target industry, target state, and year fixed effects. Standard errors are clustered at the target state level. ***, **, and * indicate significance at the 1%, 5%, and 10% significance level, respectively. Panel A: Premiums
Dep. Var.: (1)
Maj. Acq. Premium
(2) Weighted Premium
(3) Maj. Acq. Premium
(4) Weighted Premium
Sample International Acquirers US Acquirers
Two-Stage Acquisition -0.193*** -0.210** -0.232*** -0.260*** (0.022) (0.082) (0.016) (0.088)
Post-UTSA x Treated Target State
-0.021** -0.023* -0.021** -0.016 (0.010) (0.012) (0.010) (0.015)
Two-Stage Acquisition x Post-UTSA x Treated Target State
0.087** 0.109*** 0.120*** 0.090* (0.034) (0.040) (0.034) (0.052)
Two-Stage Acquisition x Treated Target State
0.044 0.044 0.048 0.088 (0.032) (0.099) (0.032) (0.103)
Constant 0.371*** 0.267*** 0.412*** 0.374*** (0.090) (0.075) (0.074) (0.064)
Observations 3,839 3,495 3,136 2,878 R-squared 0.186 0.185 0.168 0.179 Control Variables Yes Yes Yes Yes Year FE Yes Yes Yes Yes Acquirer & Target Industry FE Yes Yes Yes Yes Target State FE Yes Yes Yes Yes Panel B: Announcement CARs [-1,+1]
Dep. Var.: (1)
Acquirer CARs (2)
Target CARs (3)
Combined CARs
Sample International Acquirers
Two-Stage Acquisition -0.023** -0.120*** -0.055*** (0.010) (0.014) (0.012)
Post-UTSA x Treated Target State
0.001 -0.001 -0.001 (0.005) (0.008) (0.004)
Two-Stage Acquisition x Post-UTSA x Treated Target State
0.042** 0.067*** 0.040** (0.017) (0.025) (0.015)
Two-Stage Acquisition x Treated Target State
0.003 0.012 0.014 (0.009) (0.027) (0.017)
Constant -0.013 0.130** 0.076*** (0.011) (0.057) (0.023)
Observations 3,289 3,427 3,081 R-squared 0.090 0.090 0.082 Control Variables Yes Yes Yes Year FE Yes Yes Yes Acquirer & Target Industry FE Yes Yes Yes Target State FE Yes Yes Yes
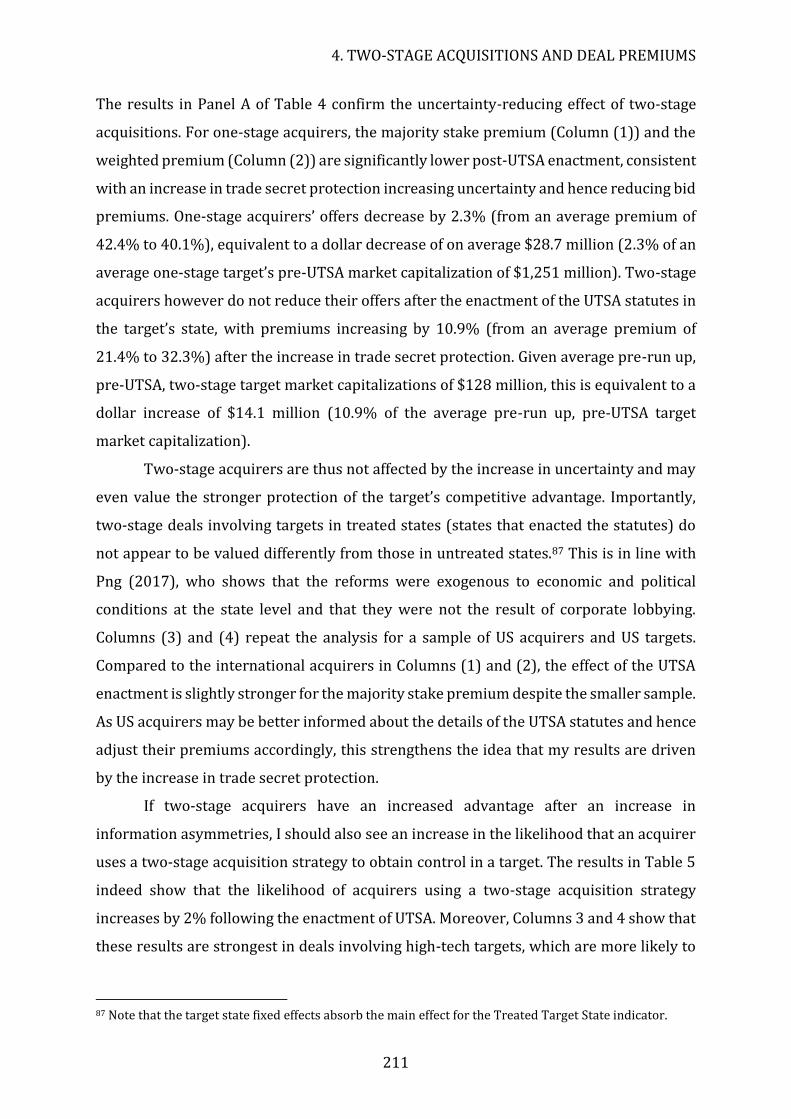
4. TWO-STAGE ACQUISITIONS AND DEAL PREMIUMS
211
The results in Panel A of Table 4 confirm the uncertainty-reducing effect of two-stage
acquisitions. For one-stage acquirers, the majority stake premium (Column (1)) and the
weighted premium (Column (2)) are significantly lower post-UTSA enactment, consistent
with an increase in trade secret protection increasing uncertainty and hence reducing bid
premiums. One-stage acquirers’ offers decrease by 2.3% (from an average premium of
42.4% to 40.1%), equivalent to a dollar decrease of on average $28.7 million (2.3% of an
average one-stage target’s pre-UTSA market capitalization of $1,251 million). Two-stage
acquirers however do not reduce their offers after the enactment of the UTSA statutes in
the target’s state, with premiums increasing by 10.9% (from an average premium of
21.4% to 32.3%) after the increase in trade secret protection. Given average pre-run up,
pre-UTSA, two-stage target market capitalizations of $128 million, this is equivalent to a
dollar increase of $14.1 million (10.9% of the average pre-run up, pre-UTSA target
market capitalization).
Two-stage acquirers are thus not affected by the increase in uncertainty and may
even value the stronger protection of the target’s competitive advantage. Importantly,
two-stage deals involving targets in treated states (states that enacted the statutes) do
not appear to be valued differently from those in untreated states.87 This is in line with
Png (2017), who shows that the reforms were exogenous to economic and political
conditions at the state level and that they were not the result of corporate lobbying.
Columns (3) and (4) repeat the analysis for a sample of US acquirers and US targets.
Compared to the international acquirers in Columns (1) and (2), the effect of the UTSA
enactment is slightly stronger for the majority stake premium despite the smaller sample.
As US acquirers may be better informed about the details of the UTSA statutes and hence
adjust their premiums accordingly, this strengthens the idea that my results are driven
by the increase in trade secret protection.
If two-stage acquirers have an increased advantage after an increase in
information asymmetries, I should also see an increase in the likelihood that an acquirer
uses a two-stage acquisition strategy to obtain control in a target. The results in Table 5
indeed show that the likelihood of acquirers using a two-stage acquisition strategy
increases by 2% following the enactment of UTSA. Moreover, Columns 3 and 4 show that
these results are strongest in deals involving high-tech targets, which are more likely to
87 Note that the target state fixed effects absorb the main effect for the Treated Target State indicator.
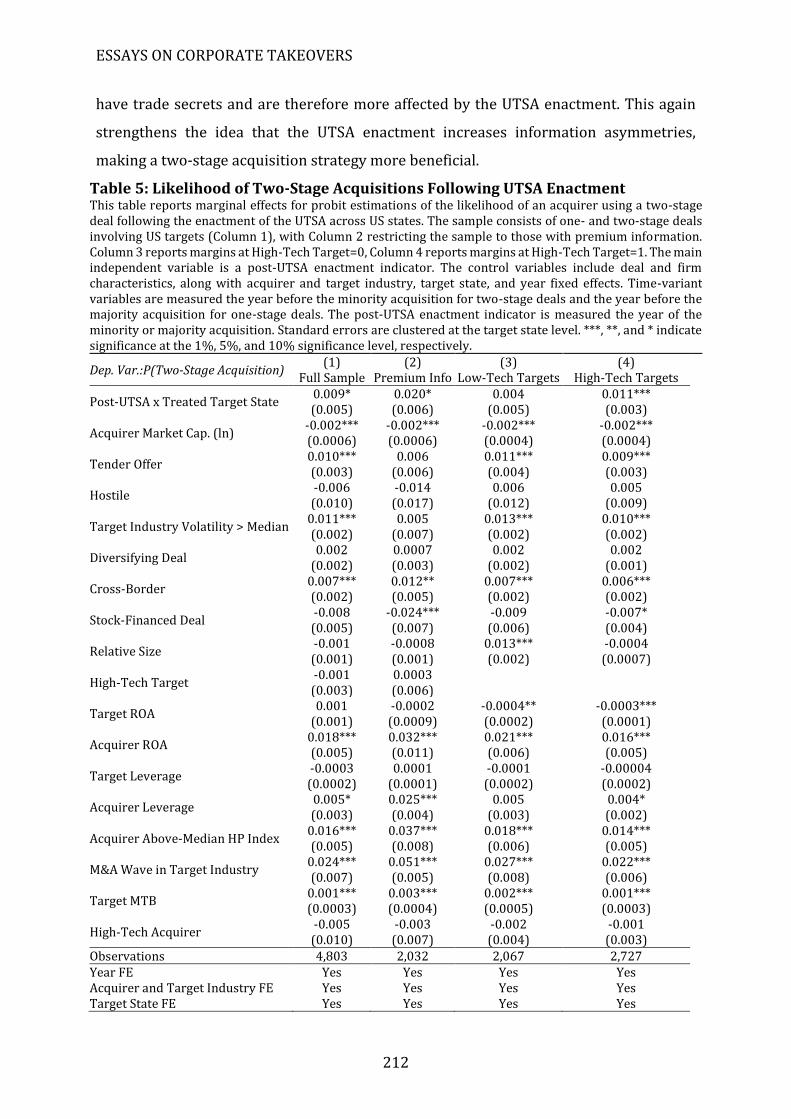
ESSAYS ON CORPORATE TAKEOVERS
212
have trade secrets and are therefore more affected by the UTSA enactment. This again
strengthens the idea that the UTSA enactment increases information asymmetries,
making a two-stage acquisition strategy more beneficial.
Table 5: Likelihood of Two-Stage Acquisitions Following UTSA Enactment This table reports marginal effects for probit estimations of the likelihood of an acquirer using a two-stage deal following the enactment of the UTSA across US states. The sample consists of one- and two-stage deals involving US targets (Column 1), with Column 2 restricting the sample to those with premium information. Column 3 reports margins at High-Tech Target=0, Column 4 reports margins at High-Tech Target=1. The main independent variable is a post-UTSA enactment indicator. The control variables include deal and firm characteristics, along with acquirer and target industry, target state, and year fixed effects. Time-variant variables are measured the year before the minority acquisition for two-stage deals and the year before the majority acquisition for one-stage deals. The post-UTSA enactment indicator is measured the year of the minority or majority acquisition. Standard errors are clustered at the target state level. ***, **, and * indicate significance at the 1%, 5%, and 10% significance level, respectively.
Dep. Var.:P(Two-Stage Acquisition) (1)
Full Sample (2)
Premium Info (3)
Low-Tech Targets (4)
High-Tech Targets
Post-UTSA x Treated Target State 0.009* 0.020* 0.004 0.011*** (0.005) (0.006) (0.005) (0.003)
Acquirer Market Cap. (ln) -0.002*** -0.002*** -0.002*** -0.002*** (0.0006) (0.0006) (0.0004) (0.0004)
Tender Offer 0.010*** 0.006 0.011*** 0.009*** (0.003) (0.006) (0.004) (0.003)
Hostile -0.006 -0.014 0.006 0.005 (0.010) (0.017) (0.012) (0.009)
Target Industry Volatility > Median 0.011*** 0.005 0.013*** 0.010*** (0.002) (0.007) (0.002) (0.002)
Diversifying Deal 0.002 0.0007 0.002 0.002
(0.002) (0.003) (0.002) (0.001)
Cross-Border 0.007*** 0.012** 0.007*** 0.006*** (0.002) (0.005) (0.002) (0.002)
Stock-Financed Deal -0.008 -0.024*** -0.009 -0.007* (0.005) (0.007) (0.006) (0.004)
Relative Size -0.001 -0.0008 0.013*** -0.0004 (0.001) (0.001) (0.002) (0.0007)
High-Tech Target -0.001 0.0003 (0.003) (0.006)
Target ROA 0.001 -0.0002 -0.0004** -0.0003***
(0.001) (0.0009) (0.0002) (0.0001)
Acquirer ROA 0.018*** 0.032*** 0.021*** 0.016*** (0.005) (0.011) (0.006) (0.005)
Target Leverage -0.0003 0.0001 -0.0001 -0.00004 (0.0002) (0.0001) (0.0002) (0.0002)
Acquirer Leverage 0.005* 0.025*** 0.005 0.004* (0.003) (0.004) (0.003) (0.002)
Acquirer Above-Median HP Index 0.016*** 0.037*** 0.018*** 0.014*** (0.005) (0.008) (0.006) (0.005)
M&A Wave in Target Industry 0.024*** 0.051*** 0.027*** 0.022*** (0.007) (0.005) (0.008) (0.006)
Target MTB 0.001*** 0.003*** 0.002*** 0.001*** (0.0003) (0.0004) (0.0005) (0.0003)
High-Tech Acquirer -0.005 -0.003 -0.002 -0.001 (0.010) (0.007) (0.004) (0.003)
Observations 4,803 2,032 2,067 2,727 Year FE Yes Yes Yes Yes Acquirer and Target Industry FE Yes Yes Yes Yes Target State FE Yes Yes Yes Yes
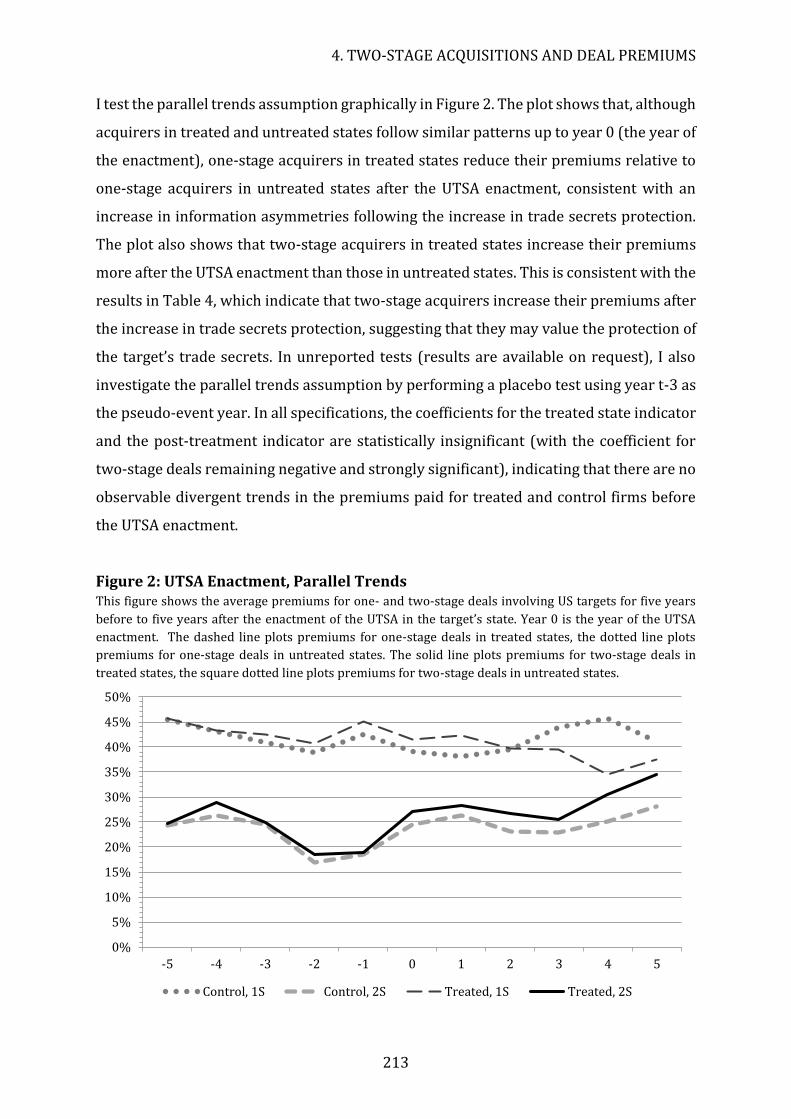
4. TWO-STAGE ACQUISITIONS AND DEAL PREMIUMS
213
I test the parallel trends assumption graphically in Figure 2. The plot shows that, although
acquirers in treated and untreated states follow similar patterns up to year 0 (the year of
the enactment), one-stage acquirers in treated states reduce their premiums relative to
one-stage acquirers in untreated states after the UTSA enactment, consistent with an
increase in information asymmetries following the increase in trade secrets protection.
The plot also shows that two-stage acquirers in treated states increase their premiums
more after the UTSA enactment than those in untreated states. This is consistent with the
results in Table 4, which indicate that two-stage acquirers increase their premiums after
the increase in trade secrets protection, suggesting that they may value the protection of
the target’s trade secrets. In unreported tests (results are available on request), I also
investigate the parallel trends assumption by performing a placebo test using year t-3 as
the pseudo-event year. In all specifications, the coefficients for the treated state indicator
and the post-treatment indicator are statistically insignificant (with the coefficient for
two-stage deals remaining negative and strongly significant), indicating that there are no
observable divergent trends in the premiums paid for treated and control firms before
the UTSA enactment.
Figure 2: UTSA Enactment, Parallel Trends This figure shows the average premiums for one- and two-stage deals involving US targets for five years
before to five years after the enactment of the UTSA in the target’s state. Year 0 is the year of the UTSA
enactment. The dashed line plots premiums for one-stage deals in treated states, the dotted line plots
premiums for one-stage deals in untreated states. The solid line plots premiums for two-stage deals in
treated states, the square dotted line plots premiums for two-stage deals in untreated states.
0%
5%
10%
15%
20%
25%
30%
35%
40%
45%
50%
-5 -4 -3 -2 -1 0 1 2 3 4 5
Control, 1S Control, 2S Treated, 1S Treated, 2S
ESSAYS ON CORPORATE TAKEOVERS
214
Note that the sample in Tables 4, 5, 6 and 7 only consists of US targets (and/or US
acquirers), which could cause concerns regarding the generalizability of my conclusions.
Although I do not have information on increases in trade secret protection in other
contexts, it is reasonable to believe that any regulation change that shields trade secrets
from expropriation by competitors increases the information asymmetries between the
target and outside parties. Moreover, Table 10 shows that my main results on the effect
of two-stage deals on the merger premium remain when excluding the US.
Panel B considers the acquirer, target, and combined (value-weighted) firm CARs.
If two-stage acquisitions indeed enable acquirers to better assess the target’s competitive
advantage following an increase in uncertainty, this should be reflected by the
shareholder’s reactions. On the one hand, a premium that more accurately reflects the
target’s value is beneficial to acquirer shareholders as they are less likely to overpay, and
it is beneficial to target shareholders as it increases the likelihood of the offer being
successful. On the other hand, a two-stage acquisition may not be beneficial to acquirer
shareholders if the value increase from reducing information asymmetries is completely
captured by the target shareholders. The results in Panel B show that both acquirer and
target shareholders react significantly more positive to deals announced by two-stage
acquirers following an increase in trade secret protection. The increase in acquirer
shareholder returns by 4.2% indicates that, despite the higher premium, there is still
value left on the table for acquirer shareholders, who perceive the bid as being more
accurate and less subject to overpayment. Unsurprisingly, target shareholders respond
positively to receiving a higher premium, which is also reflected in the 6.7% higher
combined (market value-weighted) firm returns. Taken together, these results suggest
that a two-stage acquisition strategy reduces information asymmetries by enabling
acquirers to better assess the target’s value-creating processes. This mitigates the
adverse selection problem, resulting in bid premiums that are less subject to information
asymmetries, and higher acquirer, target, and combined firm returns.
4. TWO-STAGE ACQUISITIONS AND DEAL PREMIUMS
215
3.2.2 Reductions in Import Tariff Rates
Second, I use large import tariff reductions across US industries as a source of exogenous
variation in potential bidder competition.88 The literature on trade liberalization shows
that reducing barriers to entry for foreign rivals substantially increases both domestic
(Breinlich, 2008) and cross-border (Neary, 2007) M&A activity. More intense product
market competition in a particular industry triggers a re-allocation of assets across firms
and industries, making certain targets in that industry cheaper and increasing domestic
M&A activity. Indeed, I find that M&A activity increases by 11% in the year after a
reduction in import tariff rates. Consequently, deals involving targets in industries
subject to large tariff cuts face an increase in the number of potential bidders. The results
in Table 6 confirm this, showing that both the number of bidders in a particular deal and
the fraction of deals with multiple bidders increase in the year after the import tariff
reduction (Columns 2 and 3). Given that the observed number of bids is a lower boundary
of the number of potential bidders, the increase in potential bidder competition is
considerably larger at 4.8% (Column 1). As before, two-stage acquirers should be less
affected by an increase in the (potential) number of rival bidders as their minority stake
deters competing offers, and Column 4 confirms that the use of two-stage deals indeed
increases by 0.8% in the year after the import tariff reduction.
88 As a particular industry may be subject to large import tariff reductions more than once, I use an indicator for whether a reduction occurred in the year preceding the takeover bid. This should capture a large fraction of the total effect, as most M&A activity should occur immediately following the reduction in entry barriers.
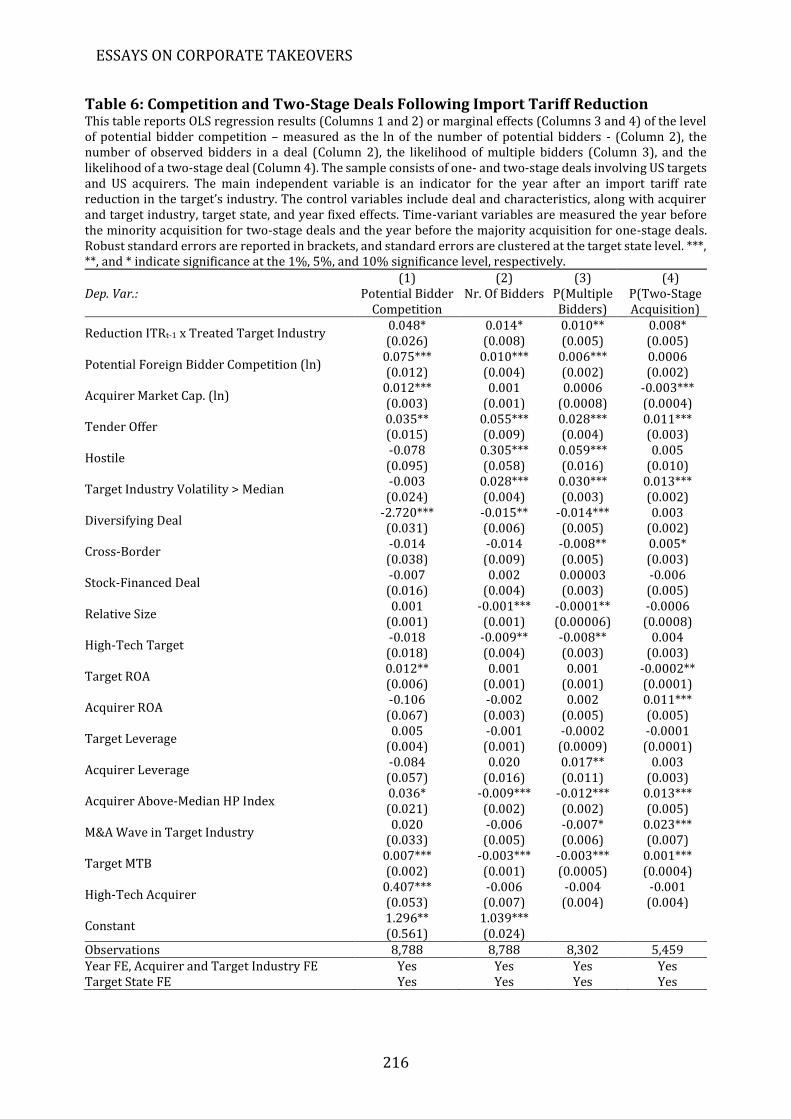
ESSAYS ON CORPORATE TAKEOVERS
216
Table 6: Competition and Two-Stage Deals Following Import Tariff Reduction This table reports OLS regression results (Columns 1 and 2) or marginal effects (Columns 3 and 4) of the level of potential bidder competition – measured as the ln of the number of potential bidders - (Column 2), the number of observed bidders in a deal (Column 2), the likelihood of multiple bidders (Column 3), and the likelihood of a two-stage deal (Column 4). The sample consists of one- and two-stage deals involving US targets and US acquirers. The main independent variable is an indicator for the year after an import tariff rate reduction in the target’s industry. The control variables include deal and characteristics, along with acquirer and target industry, target state, and year fixed effects. Time-variant variables are measured the year before the minority acquisition for two-stage deals and the year before the majority acquisition for one-stage deals. Robust standard errors are reported in brackets, and standard errors are clustered at the target state level. ***, **, and * indicate significance at the 1%, 5%, and 10% significance level, respectively.
Dep. Var.: (1)
Potential Bidder Competition
(2) Nr. Of Bidders
(3) P(Multiple Bidders)
(4) P(Two-Stage Acquisition)
Reduction ITRt-1 x Treated Target Industry 0.048* 0.014* 0.010** 0.008* (0.026) (0.008) (0.005) (0.005)
Potential Foreign Bidder Competition (ln) 0.075*** 0.010*** 0.006*** 0.0006 (0.012) (0.004) (0.002) (0.002)
Acquirer Market Cap. (ln) 0.012*** 0.001 0.0006 -0.003*** (0.003) (0.001) (0.0008) (0.0004)
Tender Offer 0.035** 0.055*** 0.028*** 0.011*** (0.015) (0.009) (0.004) (0.003)
Hostile -0.078 0.305*** 0.059*** 0.005 (0.095) (0.058) (0.016) (0.010)
Target Industry Volatility > Median -0.003 0.028*** 0.030*** 0.013*** (0.024) (0.004) (0.003) (0.002)
Diversifying Deal -2.720*** -0.015** -0.014*** 0.003 (0.031) (0.006) (0.005) (0.002)
Cross-Border -0.014 -0.014 -0.008** 0.005* (0.038) (0.009) (0.005) (0.003)
Stock-Financed Deal -0.007 0.002 0.00003 -0.006 (0.016) (0.004) (0.003) (0.005)
Relative Size 0.001 -0.001*** -0.0001** -0.0006
(0.001) (0.001) (0.00006) (0.0008)
High-Tech Target -0.018 -0.009** -0.008** 0.004 (0.018) (0.004) (0.003) (0.003)
Target ROA 0.012** 0.001 0.001 -0.0002** (0.006) (0.001) (0.001) (0.0001)
Acquirer ROA -0.106 -0.002 0.002 0.011*** (0.067) (0.003) (0.005) (0.005)
Target Leverage 0.005 -0.001 -0.0002 -0.0001
(0.004) (0.001) (0.0009) (0.0001)
Acquirer Leverage -0.084 0.020 0.017** 0.003 (0.057) (0.016) (0.011) (0.003)
Acquirer Above-Median HP Index 0.036* -0.009*** -0.012*** 0.013*** (0.021) (0.002) (0.002) (0.005)
M&A Wave in Target Industry 0.020 -0.006 -0.007* 0.023***
(0.033) (0.005) (0.006) (0.007)
Target MTB 0.007*** -0.003*** -0.003*** 0.001*** (0.002) (0.001) (0.0005) (0.0004)
High-Tech Acquirer 0.407*** -0.006 -0.004 -0.001 (0.053) (0.007) (0.004) (0.004)
Constant 1.296** 1.039*** (0.561) (0.024)
Observations 8,788 8,788 8,302 5,459 Year FE, Acquirer and Target Industry FE Yes Yes Yes Yes Target State FE Yes Yes Yes Yes
4. TWO-STAGE ACQUISITIONS AND DEAL PREMIUMS
217
The increase in potential bidder competition should translate in higher premiums being
offered, as acquirers have stronger incentives to pre-emptively raise their bids.89 Lower
import tariffs may however also make it easier for foreign firms to serve the market via
exports, reducing the incentives to establish production capacity via M&As. I therefore
control for the level of potential bidder competition by foreign bidders, where potential
foreign bidder competition is measured at the industry level as in Table 3: it is based on
the fraction of cross-border deals between the acquirer’s and target’s industries relative
to the total number of cross-border deals in the target’s industry, multiplied with the
number of foreign firms in the acquirer’s industry and summed across industries. I then
take the log of this number and include it as an additional control variable.
The results of this test are reported in Table 7. Panel A shows that the premium
difference between two-stage acquisitions and one-stage acquisitions becomes
significantly larger following a large reduction in import tariff rates, both in terms of the
majority stake premium (Column (1)) and the weighted premium (Column (2)). Although
one-stage acquirers do not appear to increase their offers after the reduction in import
tariff rates (with average premiums remaining at 44.8% in treated states), two-stage
acquirers decrease their offers by 38.8% (from 30.5% to a negative -8.3% - note that this
negative premium may (i) arise from the effect of the minority stake premium on the
weighted premium, and (ii) from a negative effect of the import tariff reduction on the
target’s market value during the year of the reduction). This however does not imply that
one-stage acquirers do not strategically raise their offers to deter rival bidders, as these
results effect may reflect the offsetting effect of an overall decrease in the value of target
firms. The coefficients on the treated industry indicators show that deals involving
targets in industries that are affected by tariff reductions do not receive significantly
different premiums, although two-stage deals in treated industries in Column (1) receive
on average higher premiums. Nevertheless, this positive effect is not sufficient to off-set
the negative effect on the premium when tariffs are reduced. In Column (2), this
interaction is no longer significant, reducing concerns that my effects may be driven by
industry-specific factors that affect the likelihood of being acquired in a two-stage
89 Alternatively, there is some evidence that tariff reductions in the acquirer’s industry also increase M&A activity, as domestic firms respond to increases in foreign competition by making acquisitions (Srinivasan, 2014). I therefore repeat my analysis using import tariff reductions in the acquirer’s industry rather than the target’s industry (results available on request). My conclusions remain unaffected; an increase in M&A competition is significantly negatively related to bid premiums by two-stage acquirers, indicating that these acquirers are not triggered to raise their bids in order to fend off rival offers.
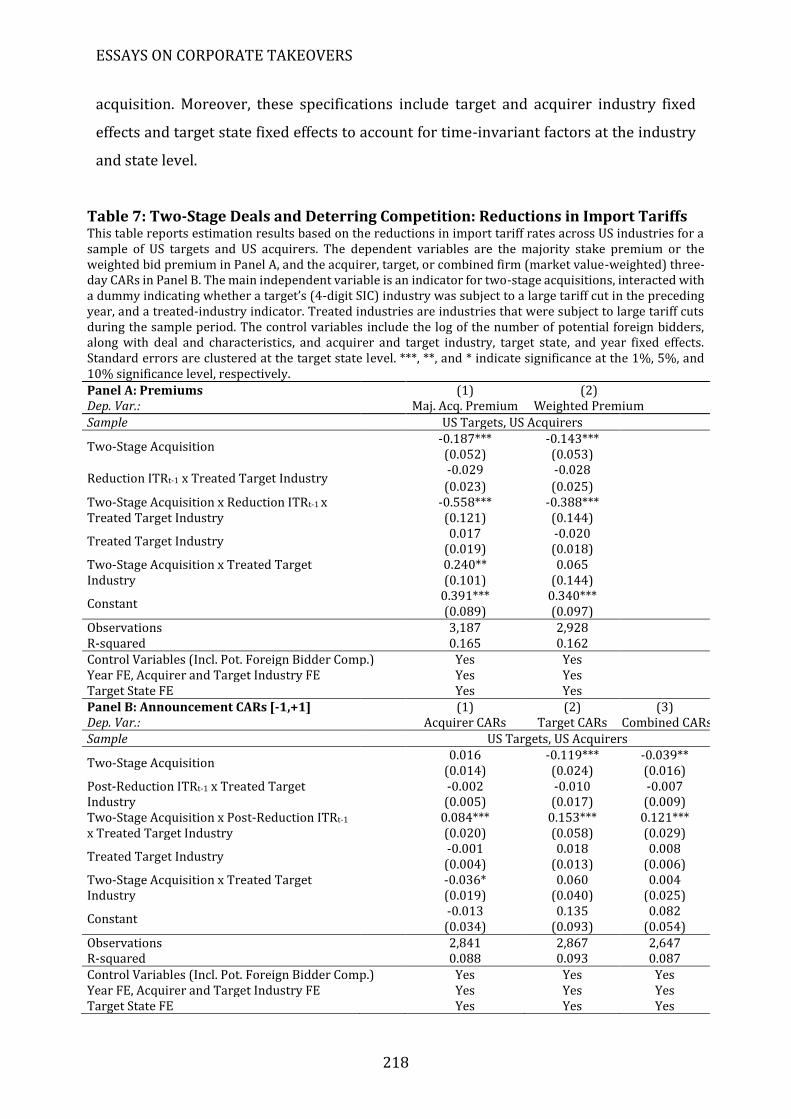
ESSAYS ON CORPORATE TAKEOVERS
218
acquisition. Moreover, these specifications include target and acquirer industry fixed
effects and target state fixed effects to account for time-invariant factors at the industry
and state level.
Table 7: Two-Stage Deals and Deterring Competition: Reductions in Import Tariffs This table reports estimation results based on the reductions in import tariff rates across US industries for a sample of US targets and US acquirers. The dependent variables are the majority stake premium or the weighted bid premium in Panel A, and the acquirer, target, or combined firm (market value-weighted) three-day CARs in Panel B. The main independent variable is an indicator for two-stage acquisitions, interacted with a dummy indicating whether a target’s (4-digit SIC) industry was subject to a large tariff cut in the preceding year, and a treated-industry indicator. Treated industries are industries that were subject to large tariff cuts during the sample period. The control variables include the log of the number of potential foreign bidders, along with deal and characteristics, and acquirer and target industry, target state, and year fixed effects. Standard errors are clustered at the target state level. ***, **, and * indicate significance at the 1%, 5%, and 10% significance level, respectively.
Panel A: Premiums Dep. Var.:
(1) Maj. Acq. Premium
(2) Weighted Premium
Sample US Targets, US Acquirers
Two-Stage Acquisition -0.187*** -0.143*** (0.052) (0.053)
Reduction ITRt-1 x Treated Target Industry -0.029 -0.028
(0.023) (0.025) Two-Stage Acquisition x Reduction ITRt-1 x Treated Target Industry
-0.558*** -0.388*** (0.121) (0.144)
Treated Target Industry 0.017 -0.020 (0.019) (0.018)
Two-Stage Acquisition x Treated Target Industry
0.240** 0.065 (0.101) (0.144)
Constant 0.391*** 0.340*** (0.089) (0.097)
Observations 3,187 2,928 R-squared 0.165 0.162 Control Variables (Incl. Pot. Foreign Bidder Comp.) Yes Yes Year FE, Acquirer and Target Industry FE Yes Yes Target State FE Yes Yes Panel B: Announcement CARs [-1,+1] Dep. Var.:
(1) Acquirer CARs
(2) Target CARs
(3) Combined CARs
Sample US Targets, US Acquirers
Two-Stage Acquisition 0.016 -0.119*** -0.039** (0.014) (0.024) (0.016)
Post-Reduction ITRt-1 x Treated Target Industry
-0.002 -0.010 -0.007 (0.005) (0.017) (0.009)
Two-Stage Acquisition x Post-Reduction ITRt-1 x Treated Target Industry
0.084*** 0.153*** 0.121*** (0.020) (0.058) (0.029)
Treated Target Industry -0.001 0.018 0.008 (0.004) (0.013) (0.006)
Two-Stage Acquisition x Treated Target Industry
-0.036* 0.060 0.004 (0.019) (0.040) (0.025)
Constant -0.013 0.135 0.082 (0.034) (0.093) (0.054)
Observations 2,841 2,867 2,647 R-squared 0.088 0.093 0.087 Control Variables (Incl. Pot. Foreign Bidder Comp.) Yes Yes Yes Year FE, Acquirer and Target Industry FE Yes Yes Yes Target State FE Yes Yes Yes
4. TWO-STAGE ACQUISITIONS AND DEAL PREMIUMS
219
Panel B reports the announcement returns for acquirer (Column (1)) and target (Column
(2)) shareholders, and the value-weighted average of both firms (Column (3)). Both
target and acquirer shareholders react positively to two-stage acquisitions following a
large tariff reduction, with acquirer returns increasing by 8.4%. This effect is
economically large given that acquirer shareholders tend to earn on average zero returns,
and it suggests that acquirer shareholders value the lack of pre-emptive bidding behavior
by two-stage acquirers which could result in excessive overpayment. Surprisingly, also
target shareholders respond positively to two-stage acquirers’ lower premiums. Target
returns increase by 15.3% after the reduction in import tariff rates, which may reflect
that an offer which better reflects the target’s value increases the likelihood of the deal
being successful. With both the target’s and acquirer’s shareholders reacting positively
to lower premiums offered by two-stage acquirers, the combined firm returns are also
positively significant. Taken together, these results suggest that two-stage acquisitions
enable acquirers to offer lower premiums when faced with increased potential bidder
competition as the presence of a minority stake deters competing offers.
Overall, the results in Tables 4 and 7 suggest that two-stage acquisitions offer
considerable benefits to both target and acquirers: they allow acquirers to better assess
the target’s value, resulting less frictions in the takeover process, and increased returns.
In addition, the presence of a minority stake deters pre-emptive bidding, such that two-
stage acquirers do not need to raise their premiums when faced with potential competing
offers. Again, this results in more efficient takeover bidding and higher shareholder
returns.
4. Selling vs Expanding a Minority Stake
So far, my sample of minority stakes is limited to those that were followed by a majority
stake. However, not all minority stakes that firms acquire result in a majority takeover
offer. In fact, if a minority stake acquisition enables acquirers to resolve information
asymmetries and assess potential merger synergies, some of the acquired stakes are
likely to be sold (or at least not increased) if the target proves to be an unsuitable merger
partner. At each point in time, an acquirer of a minority stake thus has to decide whether
to retain, sell, or expand the minority position to a majority stake, and at which price to
ESSAYS ON CORPORATE TAKEOVERS
220
do so. Despite the growing number of studies investigating equity blocks and minority
acquisitions, this issue has remained largely unexplored.90
4.1 Investigating the Decision-Making Process when Expanding a Minority Stake
First, I will investigate the determinants of an acquirer’s decision to sell, retain, or expand
a minority stake. One such determinant is the level of uncertainty in the target’s economic
environment. Minority stakes in targets that have larger information asymmetries with
respect to the acquirer should take longer to be expanded to a majority stake, or may not
even be expanded at all. The longer a stake has been held by the acquirer, the more
information has been able to flow between the two firms. I therefore expect that more
uncertain targets decrease the likelihood of a minority stake being expanded, and if it is
expanded, it should take more time for the acquirer to decide to do so. I proxy for
uncertainty using a set of static and time-varying deal-, firm-, and industry-level
variables. At the deal level, I consider whether the target and acquirer are located in
different countries and whether they are in different industries. Acquirers located in the
same country as the target firm have an information advantage over more remote
acquirers, as they have easier access to information about the target’s value through
informal talks with CEOs, employees, customers, or on-site visits (Malloy, 2005; Kang and
Kim, 2008). Acquirers that are in similar industries face less uncertainty as they have an
easier time valuing the target’s operating processes given that they are more familiar
with the industry, relative to acquirers that are in different industries. At the firm level, I
consider whether the target is in a high-tech industry. High-tech targets’ activities’ tend
to be more uncertain, as their projects require more R&D expenses and have more risky
outcomes. At the industry level, I take into account the volatility of the target industry’s
stock market returns, as targets in more volatile industries have more uncertain
operations (Ouimet, 2013).
90 The majority of the studies investigating equity blocks focus on one particular group of investors, namely institutional investors such as mutual funds or private equity funds. However, institutional investors have very different motives for acquiring an equity stake in a target firm compared to corporate investors.
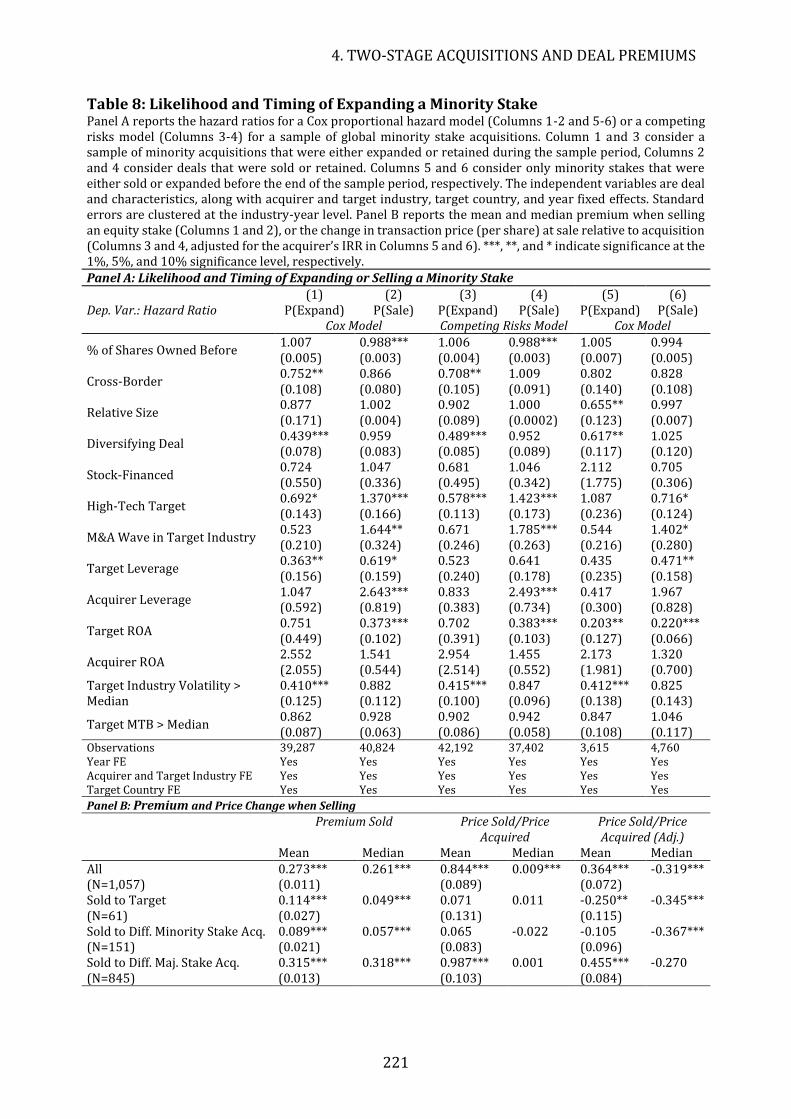
4. TWO-STAGE ACQUISITIONS AND DEAL PREMIUMS
221
Table 8: Likelihood and Timing of Expanding a Minority Stake Panel A reports the hazard ratios for a Cox proportional hazard model (Columns 1-2 and 5-6) or a competing risks model (Columns 3-4) for a sample of global minority stake acquisitions. Column 1 and 3 consider a sample of minority acquisitions that were either expanded or retained during the sample period, Columns 2 and 4 consider deals that were sold or retained. Columns 5 and 6 consider only minority stakes that were either sold or expanded before the end of the sample period, respectively. The independent variables are deal and characteristics, along with acquirer and target industry, target country, and year fixed effects. Standard errors are clustered at the industry-year level. Panel B reports the mean and median premium when selling an equity stake (Columns 1 and 2), or the change in transaction price (per share) at sale relative to acquisition (Columns 3 and 4, adjusted for the acquirer’s IRR in Columns 5 and 6). ***, **, and * indicate significance at the 1%, 5%, and 10% significance level, respectively. Panel A: Likelihood and Timing of Expanding or Selling a Minority Stake
(1) (2) (3) (4) (5) (6) Dep. Var.: Hazard Ratio P(Expand) P(Sale) P(Expand) P(Sale) P(Expand) P(Sale) Cox Model Competing Risks Model Cox Model
% of Shares Owned Before 1.007 0.988*** 1.006 0.988*** 1.005 0.994 (0.005) (0.003) (0.004) (0.003) (0.007) (0.005)
Cross-Border 0.752** 0.866 0.708** 1.009 0.802 0.828 (0.108) (0.080) (0.105) (0.091) (0.140) (0.108)
Relative Size 0.877 1.002 0.902 1.000 0.655** 0.997 (0.171) (0.004) (0.089) (0.0002) (0.123) (0.007)
Diversifying Deal 0.439*** 0.959 0.489*** 0.952 0.617** 1.025 (0.078) (0.083) (0.085) (0.089) (0.117) (0.120)
Stock-Financed 0.724 1.047 0.681 1.046 2.112 0.705 (0.550) (0.336) (0.495) (0.342) (1.775) (0.306)
High-Tech Target 0.692* 1.370*** 0.578*** 1.423*** 1.087 0.716* (0.143) (0.166) (0.113) (0.173) (0.236) (0.124)
M&A Wave in Target Industry 0.523 1.644** 0.671 1.785*** 0.544 1.402* (0.210) (0.324) (0.246) (0.263) (0.216) (0.280)
Target Leverage 0.363** 0.619* 0.523 0.641 0.435 0.471** (0.156) (0.159) (0.240) (0.178) (0.235) (0.158)
Acquirer Leverage 1.047 2.643*** 0.833 2.493*** 0.417 1.967 (0.592) (0.819) (0.383) (0.734) (0.300) (0.828)
Target ROA 0.751 0.373*** 0.702 0.383*** 0.203** 0.220*** (0.449) (0.102) (0.391) (0.103) (0.127) (0.066)
Acquirer ROA 2.552 1.541 2.954 1.455 2.173 1.320 (2.055) (0.544) (2.514) (0.552) (1.981) (0.700)
Target Industry Volatility > Median
0.410*** 0.882 0.415*** 0.847 0.412*** 0.825 (0.125) (0.112) (0.100) (0.096) (0.138) (0.143)
Target MTB > Median 0.862 0.928 0.902 0.942 0.847 1.046 (0.087) (0.063) (0.086) (0.058) (0.108) (0.117)
Observations 39,287 40,824 42,192 37,402 3,615 4,760 Year FE Yes Yes Yes Yes Yes Yes Acquirer and Target Industry FE Yes Yes Yes Yes Yes Yes Target Country FE Yes Yes Yes Yes Yes Yes
Panel B: Premium and Price Change when Selling
Premium Sold Price Sold/Price Acquired
Price Sold/Price Acquired (Adj.)
Mean Median Mean Median Mean Median All (N=1,057)
0.273*** 0.261*** 0.844*** 0.009*** 0.364*** -0.319*** (0.011) (0.089) (0.072)
Sold to Target (N=61)
0.114*** 0.049*** 0.071 0.011 -0.250** -0.345*** (0.027) (0.131) (0.115)
Sold to Diff. Minority Stake Acq. (N=151)
0.089*** 0.057*** 0.065 -0.022 -0.105 -0.367*** (0.021) (0.083) (0.096)
Sold to Diff. Maj. Stake Acq. (N=845)
0.315*** 0.318*** 0.987*** 0.001 0.455*** -0.270 (0.013) (0.103) (0.084)
ESSAYS ON CORPORATE TAKEOVERS
222
It is a well-known fact that M&A activity follows a wave pattern in terms of deal value and
numbers, triggered by periods of rapid credit expansion and booming stock markets
(Martynova and Renneboog, 2008). Moreover, M&A activity also tends to cluster by
industry, as there is significant inter-industry variation in the rate of takeover activity
(Mitchell and Mulherin, 1996; Andrade et al., 2001). Deal premiums are often excessively
high at the peak of merger waves, which may incentivize minority stake acquirers to sell
their stakes at excessively high prices to third-party bidders. I thus expect to find that
acquirers are more likely to sell their stakes at the peak of merger waves.
Minority acquisitions are used by acquirers whose external financing costs are too
high to finance a majority acquisition (Ouimet, 2013). This implies that a reduction in the
acquirer’s financial constraints over time should be related to a higher likelihood of
expanding the minority stake to a majority stake. On the other hand, an increase in
financing constraints may be a signal of financial distress, increasing the likelihood of
selling the equity stake, often at a fire sale discount (Dinc, Erel, and Liao, 2017).
In Table 8, I use a Cox proportional hazard model to estimate the likelihood that a
minority stake is expanded, retained, or sold at a specific point in time. Relative to regular
logit models, the Cox model is able to incorporate both the likelihood of an event
happening, and the time at which it happens. In Panel A, Column (1) considers a sample
of equity stakes that were either expanded before the end of the sample period or for
whom the outcome is unknown (censored), thereby excluding all sold equity stakes. In
Column (2), I do the same for sold equity stakes, excluding all expanded equity stakes.
The Cox model will thus indicate the likelihood of (i) expanding a minority stake to a
majority stake or (ii) selling the stake versus retaining the stake for each year after the
minority stake acquisition. It is able to accommodate the fact that the likelihood of a stake
being sold or expanded is a function of time passed since the initial acquisition, as well as
other static and time-varying variables.
In Column (1), the coefficients for cross-border deals, diversifying deals, and high-
tech targets are in line with the hypothesis that more uncertain targets and stakes
involving more information asymmetries are less likely to be expanded to majority
stakes. An equity stake in a target in a different country is 25% less likely to be expanded
relative to domestic deals. This is consistent with the notion that acquirers located near
the target firm have an information advantage over more remote acquirers. Similarly, I
find that an equity stake in a target in a different industry is 57% less likely to be
4. TWO-STAGE ACQUISITIONS AND DEAL PREMIUMS
223
expanded relative to deals in the same industry, as acquirers that are in similar industries
have an easier time valuing the target’s operating processes given that they are more
familiar with the industry relative to acquirers that are in different industries. Equity
stakes involving targets in highly volatile industries are 56% less likely to be expanded,
consistent with targets in these industries being harder to value. High-tech targets are
31% less likely to be expanded, as high-tech targets’ activities’ tend to be more uncertain
and their projects generally require more R&D expenses with risky outcomes. The results
also show that a unit increase in leverage (from 0 to 100%) decreases the likelihood of
an expansion by 64%.
Column (2) investigates the determinants of a stake being sold. I find that stakes
in high-tech targets are 40% more likely to be sold relative to other targets, and that more
profitable targets are 64% less likely to be sold. The results also show that target and
acquirer leverage are important determinants: an increase in target leverage decreases
the likelihood of a sale by 37%, whereas an increase in acquirer leverage increases the
likelihood of a sale by 164%. To the extent that leverage acts as a proxy for financial
distress, this indicates that distressed acquirers are more likely to sell their equity stakes
in target firms, potentially at fire sale prices. These results are consistent with Dinc et al.
(2017), who find that distressed acquirers are more likely to sell equity stakes in third-
party firms at large discounts.
Columns (3) and (4) repeat the previous analysis using a competing risks model
(Lunn and McNeil (1995)). Such a model can estimate the differential effects of the
explanatory variables on the likelihood of selling an equity stake, given that expanding
the stake is an alternative option. The estimated coefficients in the competing risks model
are subhazard rates, which can be interpreted similar to hazard rates in the Cox model. A
hazard rate greater than 1 implies that the variable is associated with a higher likelihood
of selling (expanding) the equity stake, controlling for the fact that it is also possible that
the acquirer expands (sells) its stake, also controlling for all other independent variables.
The results remain qualitatively unchanged.
Columns (5) and (6) focus on a subsample of deals that were either expanded
(Column (5)) or sold (Column (6)), excluding all deals for which the outcome is unknown
at the end of the sample period. This allows me investigate the timing of the decision to
expand or sell, rather than the likelihood of expanding versus selling. The results echo
those in Columns (1) and (2). More uncertain targets in terms of industry diversification
ESSAYS ON CORPORATE TAKEOVERS
224
and industry volatility take longer to be expanded, as well as more profitable and smaller
targets. More uncertain high-tech targets also take longer to be sold, as are more levered
targets and more profitable targets. As expected, an M&A wave in the target’s industry
speeds up the decision to sell, as acquirers may sell their stake at inflated prices.
In Appendix G, I investigate whether a two-stage acquirer may be more likely to
sell or expand its stake after a negative or positive event (e.g. a successful product launch
or a failed R&D project) has resolved some of the uncertainty regarding the target’s value.
I construct an indicator for whether the target experienced a large decrease (Columns
(1), (3), and (5)) or increase (Columns (2), (4), and (6)) in ROA to proxy for such negative
or positive uncertainty resolution, as events such as a successful or failed R&D project are
reflected in the firm’s profitability.91 A negative event, proxied by a large decrease in ROA,
decreases the likelihood of a stake being expanded or sold (Columns (1) and (3)) and also
delays the decision to expand (Column (5)). This suggests that acquirers are less likely to
expand if disappointing information about the target has become available, but they are
also reluctant to sell their minority stake in case of negative uncertainty resolution. A
positive event does not affect the likelihood or timing of the decision to expand (Columns
(2) and (6)), but it does decrease the likelihood of selling the stake (Column (4)).
4.2 At What Price Does a Minority Stake Acquirer Sell?
The price at which a minority stake acquirer can sell its equity stake is crucial to
determining whether a two-stage acquisition is a profitable takeover strategy. Although
the previous results have shown that a minority stake can reduce information
asymmetries and pre-emptive overbidding, and that it results in on average 25% lower
deal premiums when expanding to a majority stake, a two-stage deal may not be
profitable if there is a high likelihood of having to sell the equity stake at a substantial
loss. Panel B of Table 8 therefore investigates not only the premium at which a minority
stake is sold, but also the change in price per share received when selling the stake
relative to the price per share paid when buying.
Columns 1 and 2 show that equity stakes are sold at a premium of on average 27%,
but that this premium mainly arises from stakes that are sold to third-party majority
91 A large decrease (increase) is defined as the ROA being lower (higher) than the firm’s average ROA over the sample period minus (plus) two times the standard deviation.
4. TWO-STAGE ACQUISITIONS AND DEAL PREMIUMS
225
acquirers (that fully acquire the target firm). Premiums are much lower at around 10%
when considering stakes that are sold back to the target firm or to third-party minority
acquirers (the difference is statistically significant at the 1% level). Consistent with the
competition channel, this indicates that minority stake acquirers have substantial
bargaining power and can obtain higher premiums when a third-party bidder wants to
obtain control in the target.
However, an acquirer may still incur substantial losses on its equity stake
acquisition if the market value of the target has decreased, despite receiving a high
premium. Columns 3 and 4 therefore compare the price at which the acquirer sells its
stake, relative to the price at which it bought the stake, adjusted for the acquirer’s internal
rate of return (IRR) in Columns 5 and 6.92 The results show that acquirers can sell their
equity stakes at an on average 84% higher price relative to the price at which they bought
the stake, although this effect reduces to 36% when taking into account the IRR.
Moreover, these effects are again mainly driven by stakes that are sold to third-party
majority bidders, with the price changes being insignificantly different from zero if the
stake is sold to a third-party minority acquirer, and the acquirer losing on average 25%
on its acquisition if it sells the stake back to the target (parent) firm. These effects become
even more pronounced when investigating the median change in price: the IRR-adjusted
return on the equity stake acquisition is -31%, indicating that the return distribution is
positively skewed.93
Taken together, Panel B shows that minority stake acquirers can sell their equity
stakes at 10% to 32% premiums, but that – when adjusting the return for the acquirer’s
IRR – the return on the equity stake investment is positive only when selling to a third-
party majority acquirer, and insignificantly different from zero or negative when selling
to a third-party minority acquirer or when selling back to the target firm. In a back-of-
the-envelope calculation, it can then be calculated that, given that 80% of equity stakes is
sold to a majority acquirer, the IRR-adjusted return on a minority equity stake acquisition
92 Columns 5 and 6 multiply the transaction value of the minority stake acquisition with a proxy for the acquirer’s (IRR) for each year between the acquisition and the sale of the equity stake. This takes into account that the acquirer could have used to money invested in the minority stake for alternative investment purposes. 93 Appendix H, Panel A investigates the determinants of the minority stake return in an OLS regression, confirming that stakes sold to majority acquirers earn 60% higher returns, but that the number of years passed since the acquisition decreases the return by 6% per year. This is confirmed in Panel B, which shows a declining trend in the price sold/price acquired ratio for each year the acquirer held the equity stake.
ESSAYS ON CORPORATE TAKEOVERS
226
is on average still 35%. Combining the 57% (43%) likelihood of a stake being sold
(expanded) with the on average 22% lower deal premiums when expanding to a majority
stake acquisition and the 35% return when selling, minority stake acquirers earn a return
of approximately 29%. The benefits of a two-stage acquisition strategy thus seem to
outweigh the costs.
5. Deal Completion, Long-Run Performance and Robustness Tests
5.1 Deal Completion and Long-Run Performance
If two-stage acquisitions increase the efficiency of the takeover process by enhancing
cooperation, enabling acquirers to make better informed bids, and reducing the potential
for competing offers, then the likelihood of an acquirer withdrawing its bid should be
lower for two-stage acquirers relative to one-stage acquirers. Offers that follow
information sharing and cooperation between targets and acquirers and that better
reflect the target’s value should also be less likely to encounter resistance by the target’s
management or by the target’s or the acquirer’s shareholders, resulting in a higher
likelihood of an offer being completed and reducing the time required to complete the
deal. In addition, if these are more efficient takeovers, they should also lower the
likelihood of a target being subsequently divested and they should result in better long-
run performance.
Column (1) in Table 9 indeed shows that two-stage deals are 13% more likely to
be completed than one-stage deals. An acquirer that has held a minority stake for a longer
time is more likely to actively cooperate with the target’s shareholders or management
when expanding its stake. Column (2) investigates the number of days between the
announcement of the majority stake acquisition and the effective completion of the deal.
Consistent with two-stage acquisitions reducing the need for renegotiation, the results
show that two-stage deals decrease the number of days to completion by 63%, equivalent
to an on average 44 day decrease in completion time.
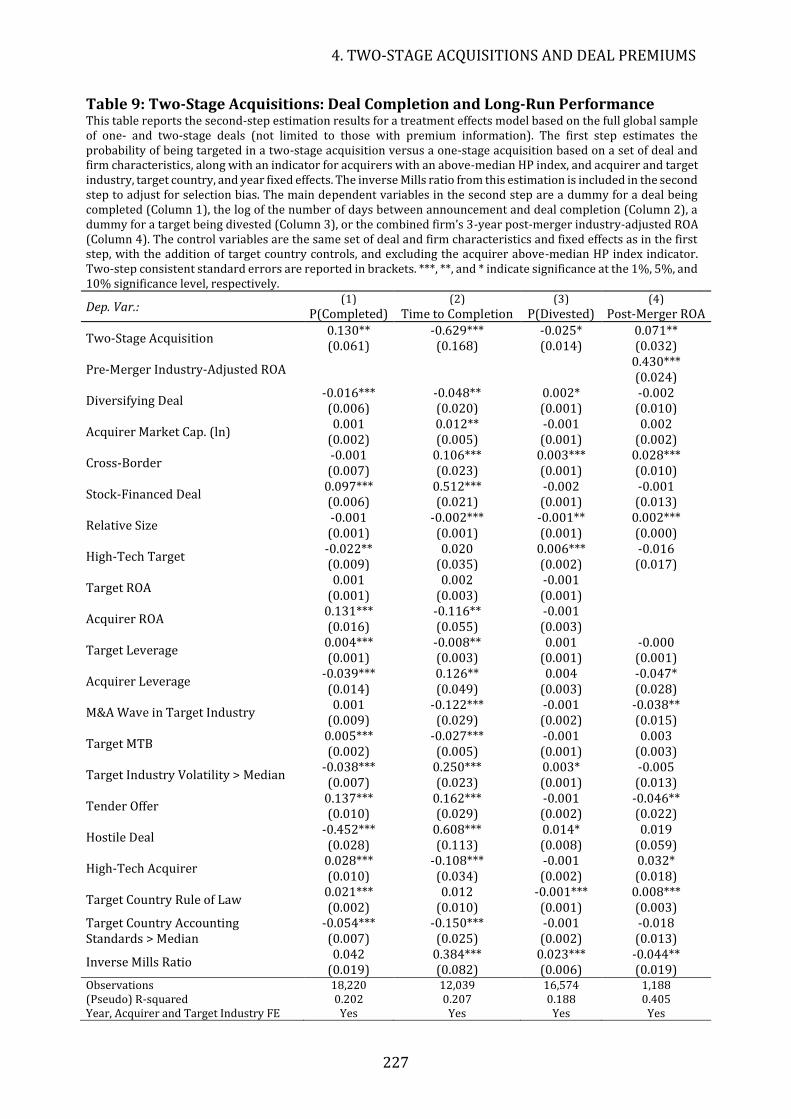
4. TWO-STAGE ACQUISITIONS AND DEAL PREMIUMS
227
Table 9: Two-Stage Acquisitions: Deal Completion and Long-Run Performance This table reports the second-step estimation results for a treatment effects model based on the full global sample of one- and two-stage deals (not limited to those with premium information). The first step estimates the probability of being targeted in a two-stage acquisition versus a one-stage acquisition based on a set of deal and firm characteristics, along with an indicator for acquirers with an above-median HP index, and acquirer and target industry, target country, and year fixed effects. The inverse Mills ratio from this estimation is included in the second step to adjust for selection bias. The main dependent variables in the second step are a dummy for a deal being completed (Column 1), the log of the number of days between announcement and deal completion (Column 2), a dummy for a target being divested (Column 3), or the combined firm’s 3-year post-merger industry-adjusted ROA (Column 4). The control variables are the same set of deal and firm characteristics and fixed effects as in the first step, with the addition of target country controls, and excluding the acquirer above-median HP index indicator. Two-step consistent standard errors are reported in brackets. ***, **, and * indicate significance at the 1%, 5%, and 10% significance level, respectively.
Dep. Var.: (1) (2) (3) (4)
P(Completed) Time to Completion P(Divested) Post-Merger ROA
Two-Stage Acquisition 0.130** -0.629*** -0.025* 0.071** (0.061) (0.168) (0.014) (0.032)
Pre-Merger Industry-Adjusted ROA 0.430*** (0.024)
Diversifying Deal -0.016*** -0.048** 0.002* -0.002 (0.006) (0.020) (0.001) (0.010)
Acquirer Market Cap. (ln) 0.001 0.012** -0.001 0.002
(0.002) (0.005) (0.001) (0.002)
Cross-Border -0.001 0.106*** 0.003*** 0.028*** (0.007) (0.023) (0.001) (0.010)
Stock-Financed Deal 0.097*** 0.512*** -0.002 -0.001 (0.006) (0.021) (0.001) (0.013)
Relative Size -0.001 -0.002*** -0.001** 0.002*** (0.001) (0.001) (0.001) (0.000)
High-Tech Target -0.022** 0.020 0.006*** -0.016 (0.009) (0.035) (0.002) (0.017)
Target ROA 0.001 0.002 -0.001
(0.001) (0.003) (0.001)
Acquirer ROA 0.131*** -0.116** -0.001 (0.016) (0.055) (0.003)
Target Leverage 0.004*** -0.008** 0.001 -0.000 (0.001) (0.003) (0.001) (0.001)
Acquirer Leverage -0.039*** 0.126** 0.004 -0.047* (0.014) (0.049) (0.003) (0.028)
M&A Wave in Target Industry 0.001 -0.122*** -0.001 -0.038**
(0.009) (0.029) (0.002) (0.015)
Target MTB 0.005*** -0.027*** -0.001 0.003 (0.002) (0.005) (0.001) (0.003)
Target Industry Volatility > Median -0.038*** 0.250*** 0.003* -0.005 (0.007) (0.023) (0.001) (0.013)
Tender Offer 0.137*** 0.162*** -0.001 -0.046** (0.010) (0.029) (0.002) (0.022)
Hostile Deal -0.452*** 0.608*** 0.014* 0.019 (0.028) (0.113) (0.008) (0.059)
High-Tech Acquirer 0.028*** -0.108*** -0.001 0.032* (0.010) (0.034) (0.002) (0.018)
Target Country Rule of Law 0.021*** 0.012 -0.001*** 0.008*** (0.002) (0.010) (0.001) (0.003)
Target Country Accounting Standards > Median
-0.054*** -0.150*** -0.001 -0.018 (0.007) (0.025) (0.002) (0.013)
Inverse Mills Ratio 0.042 0.384*** 0.023*** -0.044**
(0.019) (0.082) (0.006) (0.019) Observations 18,220 12,039 16,574 1,188 (Pseudo) R-squared 0.202 0.207 0.188 0.405 Year, Acquirer and Target Industry FE Yes Yes Yes Yes
ESSAYS ON CORPORATE TAKEOVERS
228
If two-stage deals decrease the likelihood that an acquirer makes a bad acquisition, the
targets in these deals should be less likely to be divested in the years following the
majority takeover. For a sample of completed majority acquisitions, Column (3) confirms
that target firms are 2.5% less likely to be sold or divested by two-stage acquirers in the
years following the majority takeover relative to one-stage acquirers. Finally, Column (4)
considers the deal’s long-run operating performance by investigating the combined
firm’s average return on assets over the three years following the merger announcement,
adjusted for 2-digit SIC industry performance, and controlling for the acquirer’s 3-year
pre-merger industry-adjusted ROA. Consistent with two-stage deals improving deal
performance, the results show that two-stage acquirers have an 7.1% higher long-run
industry-adjusted ROA relative to one-stage acquirers. Overall, the results in Table 9
confirm that two-stage deals increase the efficiency of the takeover process, reflected in
a lower likelihood of a bid being withdrawn, a lower time to completion, a lower
likelihood of target being divested, and increased long-run operating performance.
5.2 Robustness Tests
Table 10 shows a set of robustness tests. In Column (1), I investigate the size of the stake
acquired in the minority acquisition preceding a majority acquisition. As the acquired
stake in the minority acquisition becomes smaller, the competition-deterring effect of
two-stage acquisitions on the merger premium becomes relatively weaker. I therefore
expect that the negative effect of mitigating pre-emptive bidding is mainly driven by
larger minority stakes. Column (1) shows that the interaction of the two-stage
acquisitions indicator with an indicator for small (<15%) minority stakes is insignificant,
confirming that small minority stakes in two-stage acquisitions have less of a
competition-deterring effect. Unreported tests based on minority stakes smaller than 10
or 20% show similar results.94
In Column (2), I re-estimate the weighted premium, adjusting for the fact that the
acquirer could have used the capital invested in the minority stake for other investment
projects. I take the value of the money invested in the minority stake, and multiply it with
the firm’s average annual return rate for each year after the minority acquisition. I then
take this adjusted transaction value to calculate the weighted premium for two-stage
94 Smaller minority stakes are also less likely to earn board seats, hence weakening the uncertainty-reducing effect. However, as for the full sample, the competition-deterring effect appears to be the strongest in the sample of large stakes.
4. TWO-STAGE ACQUISITIONS AND DEAL PREMIUMS
229
acquirers. I proxy the rate of return on alternative investment projects by taking the
acquirer’s average ROA in the years before the minority stake acquisition. As precise
estimates of expected returns are difficult to obtain, I follow Qian and Zhu (2017) in using
an accounting-based measure of how efficiently the firm deploys its capital. Although
ROA is a crude proxy for the firm’s rate of return, it is unlikely that using a more precise
measure of the IRR will completely undo the premium difference between one-stage and
two-stage acquirers: using the adjusted weighted premium decreases the premium
difference by a mere 4%.
Column (3) investigates the effect of potential anti-trust issues when moving from
a minority to a majority stake, as acquirers can use a two-stage acquisition strategy to
strategically reduce the competitive intensity with the aim of getting the antitrust
authority to approve a merger (Shekhar and Wey, 2017). I therefore exclude deals that
are likely to be subject to scrutiny by anti-trust regulators.95 This again does not affect my
conclusions. Column (4) excludes US targets from the sample. The target country sample
distribution in Appendix A shows that US targets make up 50% of the total sample and
13% of the two-stage acquisitions sample. My results remain unchanged when excluding
these deals, as two-stage acquisitions are still associated with 17% lower premiums.
An alternative explanation for the negative effect of two-stage acquisitions on the
merger premium is that disappointing information about the target’s value has become
available between the minority and the majority stake acquisition, such that the acquirer
can purchase majority control in the target at a lower premium. In Columns (5) and (6), I
investigate such negative uncertainty resolution by constructing an indicator for whether
the target experienced a large decrease (Column (5)) or increase (Column (6)) in ROA
between the two transactions.96 Column (5) shows that controlling for negative events
between the minority and majority acquisition does not erode the negative effect of two-
stage acquisitions on the merger premium. This confirms that my results are not driven
by new negative information enabling the acquirer to purchase the target at a lower
95 Whether a deal is likely to be affected by anti-trust regulations is defined based on EU antitrust regulations, which states that antitrust policy is likely to be enforced when the merger would increase post-transaction market share for the acquiring firm to more than 35% in any overlapping market. In an unreported test, I control for anti-trust regulations using a dummy indicator, which also does not affect the results. 96 The indicator for large decreases (increases) is equal to one if the target’s ROA was lower (higher) than its average time-series ROA minus (plus) two times the standard deviation at some point between the minority and majority stake acquisition for two-stage acquisitions, and zero otherwise. Replacing the time-series average ROA with the pre-minority acquisition ROA does not affect my conclusions.
ESSAYS ON CORPORATE TAKEOVERS
230
premium. This is in line with the results in Table 8 showing that negative events do not
increase the likelihood of a stake being expanded. Column (6) however shows that
positive events increase the premium at which a two-stage acquirer obtains majority
control. Nevertheless, on average two-stage acquirers still pay lower premiums than one-
stage acquirers, indicating that the negative effect of two-stage acquisitions on merger
premiums is not driven by positive or negative uncertainty resolution between the
minority and majority acquisition.
Column (7) controls for the number of years between the minority and majority
stake announcement for two-stage acquisitions. Having held a minority stake for a longer
time may on the one hand reinforce the competition-deterring effect as it signals
commitment to the target to rival bidders. On the other hand, as more information has
been able to flow between the target and the acquirer, the uncertainty-reducing effect
may also be stronger. Overall, the negative coefficient on the number of years variable
indicates that as more time passes between the minority and majority stake
announcement, the competition-deterring effect of two-stage acquisitions becomes
stronger.
Obtaining a minority equity stake often implies that the acquirer becomes a
blockholder in the target firm and therefore obtains a seat on the target’s board of
directors (in an unreported test, I confirm that the likelihood of an acquirer being present
on the target’s board is significantly higher in two-stage deals relative to one-stage deals).
It could thus be that the uncertainty-reducing and competition-deterring effect of two-
stage acquisitions is driven by the acquirer’s presence on the target’s board, rather than
the acquisition of a minority stake (a potential acquirer can have a seat on the target’s
board without owning equity). I investigate this explanation in Column (8) by interacting
the two-stage acquisition indicator with an indicator for whether the acquirer is present
on the target’s board before the majority acquisition announcement. Information on
board composition is obtained from BoardEx and I manually match the names and
identifiers of the affiliations of the target’s directors with the names and identifiers of the
acquirers in my sample. The results confirm that the lower premiums for two-stage
acquirers are not driven solely by the acquirer’s presence on the board, as the main effect
for the two-stage deal indicator remains strongly significant. The interaction term is
negative but insignificant, which may reflect the uncertainty-reducing and competition-
deterring effects evening out: the combination of owning an equity stake and being
4. TWO-STAGE ACQUISITIONS AND DEAL PREMIUMS
231
present on the board (and therefore having a say in the target firm) may further deterring
rival bids, but it may also further increase information sharing.
Lastly, the lower premiums in two-stage deals could be driven by targets’
undervaluation, which enables insiders such as minority blockholders to expand their
stakes at a cheaper price. I proxy target undervaluation by constructing a dummy equal
to one if the target’s MTB ratio is lower than the industry-average MTB ratio (averaged
across all target firms in the sample). The results in Column (9) do not support the
undervaluation argument: the main effect for two-stage deals is still significantly
negative, but the interaction coefficient with the indicator for undervalued targets is
insignificant. In contrast, undervalued targets in one-stage deals are associated with 2.5%
lower premiums, consistent with undervaluation allowing firms to purchase targets at a
cheaper price.
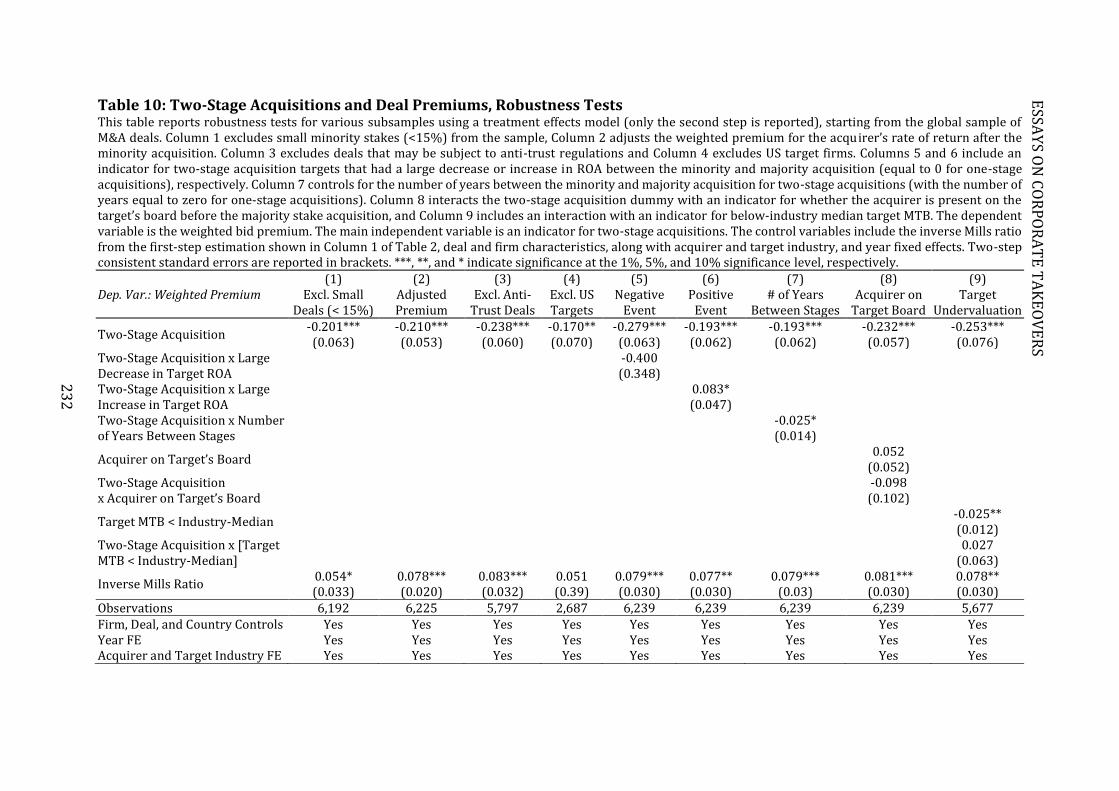
Table 10: Two-Stage Acquisitions and Deal Premiums, Robustness Tests This table reports robustness tests for various subsamples using a treatment effects model (only the second step is reported), starting from the global sample of M&A deals. Column 1 excludes small minority stakes (<15%) from the sample, Column 2 adjusts the weighted premium for the acqu irer’s rate of return after the minority acquisition. Column 3 excludes deals that may be subject to anti-trust regulations and Column 4 excludes US target firms. Columns 5 and 6 include an indicator for two-stage acquisition targets that had a large decrease or increase in ROA between the minority and majority acquisition (equal to 0 for one-stage acquisitions), respectively. Column 7 controls for the number of years between the minority and majority acquisition for two-stage acquisitions (with the number of years equal to zero for one-stage acquisitions). Column 8 interacts the two-stage acquisition dummy with an indicator for whether the acquirer is present on the target’s board before the majority stake acquisition, and Column 9 includes an interaction with an indicator for below-industry median target MTB. The dependent variable is the weighted bid premium. The main independent variable is an indicator for two-stage acquisitions. The control variables include the inverse Mills ratio from the first-step estimation shown in Column 1 of Table 2, deal and firm characteristics, along with acquirer and target industry, and year fixed effects. Two-step consistent standard errors are reported in brackets. ***, **, and * indicate significance at the 1%, 5%, and 10% significance level, respectively.
(1) (2) (3) (4) (5) (6) (7) (8) (9) Dep. Var.: Weighted Premium Excl. Small
Deals (< 15%) Adjusted Premium
Excl. Anti-Trust Deals
Excl. US Targets
Negative Event
Positive Event
# of Years Between Stages
Acquirer on Target Board
Target Undervaluation
Two-Stage Acquisition -0.201*** -0.210*** -0.238*** -0.170** -0.279*** -0.193*** -0.193*** -0.232*** -0.253*** (0.063) (0.053) (0.060) (0.070) (0.063) (0.062) (0.062) (0.057) (0.076)
Two-Stage Acquisition x Large Decrease in Target ROA
-0.400 (0.348)
Two-Stage Acquisition x Large Increase in Target ROA
0.083* (0.047)
Two-Stage Acquisition x Number of Years Between Stages
-0.025* (0.014)
Acquirer on Target’s Board 0.052 (0.052)
Two-Stage Acquisition x Acquirer on Target’s Board
-0.098 (0.102)
Target MTB < Industry-Median -0.025** (0.012)
Two-Stage Acquisition x [Target MTB < Industry-Median]
0.027 (0.063)
Inverse Mills Ratio 0.054* 0.078*** 0.083*** 0.051 0.079*** 0.077** 0.079*** 0.081*** 0.078** (0.033) (0.020) (0.032) (0.39) (0.030) (0.030) (0.03) (0.030) (0.030)
Observations 6,192 6,225 5,797 2,687 6,239 6,239 6,239 6,239 5,677 Firm, Deal, and Country Controls Yes Yes Yes Yes Yes Yes Yes Yes Yes Year FE Yes Yes Yes Yes Yes Yes Yes Yes Yes Acquirer and Target Industry FE Yes Yes Yes Yes Yes Yes Yes Yes Yes
23
2
ESSA
YS O
N C
OR
PO
RA
TE
TA
KE
OV
ER
S
4. TWO-STAGE ACQUISITIONS AND DEAL PREMIUMS
233
6. Conclusion
This paper examines how a two-stage acquisition strategy in which the acquirer
purchases a minority stake in the target before committing to a majority stake affects
takeover premiums and merger gains. Using a global sample of minority and majority
stake acquisitions between 1990 and 2015 in a treatment effects model that controls for
the decision to engage in a two-stage acquisition, I find evidence suggesting that two-
stage deals reduce information asymmetries when target value uncertainty is high and
that they limit pre-emptive bidding when faced with potential bidder competition.
Moreover, they are associated with a higher likelihood of deal completion and faster deal
completion, a lower likelihood of divestiture, and increased long-run profitability. I
confirm these findings by exploiting the increase in trade secret protection across US
states and the reduction in import tariffs across US industries as exogenous sources of
variation in target value uncertainty and potential bidder competition, respectively.
When faced with increased information asymmetries, two-stage acquirers do not
decrease their offers, whereas one-stage acquirers do, and this is perceived positively by
both acquirer and target shareholders. When faced with an increase in potential bidder
competition, two-stage acquirers respond by decreasing their offers rather than pre-
emptively increasing them, again resulting in higher acquirer and target announcement
returns. Two-stage deals can thus play a role in optimizing the takeover bidding process
by reducing information asymmetries and mitigating pre-emptive bidding behavior. They
enable firms to make better informed decisions, resulting in deal premiums that are less
subject to frictions, higher target and acquirer announcement returns, faster deal
completion, and better long-run performance.
ESSAYS ON CORPORATE TAKEOVERS
234
References
Akerlof, G., 1970. The market for "lemons": Quality uncertainty and the market
mechanism, The
Quarterly Journal of Economics 84, 488-500.
Aktas, N., de Bodt, E., and Roll, R., 2010. Negotiations under the threat of an auction.
Journal of Financial Economics 98, 241–255.
Allen, J.W., and G.M. Phillips. 2000. Corporate equity ownership, strategic alliances, and
product market relationships. Journal of Finance 55(6), 2791-2815.
Andrade, G., Mitchell, M., and E. Stafford. 2001. New evidence and perspectives on
mergers. Journal of Economic Perspectives 15, 103 – 120.
Barclay, M.J., and Holderness, C.G. 1991. Negotiated block trades and corporate control.
Journal of Finance 44, 861-877.
Bernard, A.B., Jensen, J.B., Redding, S.J., and Schott, P.K. 2012. The empirics of firm
heterogeneity and international trade. Annual Review of Economics 4, 283-313.
Betton, S., and Eckbo. B.E. 2000. Toeholds, bid jumps, and expected payoff in takeovers,
Review of Financial Studies 13, 841–882.
Betton, S., Eckbo, B.E., and Thorburn, K.S., 2009. Merger negotiations and the toehold
puzzle. Journal of Financial Economics 91, 158–178.
Bhagwat, V., Dam, R. and J. Harford. 2016. The real effects of uncertainty on merger
activity. Review of Financial Studies 29(11), 3000-3034.
Billett, M.T., and Qian, Y. 2008. Are overconfident CEOs born or made? Evidence of self-
attribution bias from frequent acquirers. Management Science 54(6), 1037-1051.
Boone, A., and H. Mulherin, 2007. How are firms sold? Journal of Finance 62, 847–875.
Boone, A., and H. Mulherin, 2008. Do private equity consortiums impede takeover
competition? Working paper, Kansas State University and University of Georgia.
Breinlich, H. 2008. Trade liberalization and industrial restructuring through mergers
and acquisitions, Journal of International Economics.
Bruner, R. F. 2004. Applied mergers and acquisitions. Hoboken, N.J.: J. Wiley.
Castellaneta, F., Conti, R., and A. Kacperczyk. 2017. Money secrets: how does trade
secret legal protection affect firm market value? Evidence from the uniform trade
secret act. Strategic Management Journal 38, 834-853.
4. TWO-STAGE ACQUISITIONS AND DEAL PREMIUMS
235
Coff, R.W. 1999. When competitive advantage doesn't lead to performance: The
resource-based view and stakeholder bargaining power. Organization Science
10(2), 119-133.
Dinc, S., Erel, I., and R. Liao. 2017. Fire sale discount: evidence from the sale of minority
equity stakes. Journal of Financial Economics, Forthcoming.
Fee, C.E., Hadlock, C. J. and Thomas, S. 2006. Corporate equity ownership and the
governance of product market relationships. The Journal of Finance 61, 1217-
1251.
Filson, D. and Morales, R. 2006. Equity links and information acquisition in
biotechnology alliances. Journal of Economic Behavior & Organization 59, 1-28.
Fishman, M., 1989. Pre-emptive bidding and the role of the medium of exchange in
acquisitions, Journal of Finance 44, 41–57.
Frésard, L. 2010. Financial strength and product market behavior: the real effects of
corporate cash holdings. Journal of Finance 65, 1097–1122.
Frésard, L. and P. Valta. 2016. How does corporate investment respond to increased
entry threats? Review of Corporate Finance Studies 5, 1-35.
Gomes-Cassares, B., Hagedoorn, J., Jaffe, A.B. 2006. Do alliances promote knowledge
flows? Journal of Financial Economics 80, 5-33.
Gorbenko, A.S., and Malenko, A. 2017. The timing and method of payment in mergers
when acquirers are financially constrained, Review of Financial Studies,
forthcoming.
Grossman, S.J., and Hart, O.D. 1986. The costs and benefits of ownership: a theory of
vertical and lateral integration, Journal of Political Economy 94, 691-719.
Hadlock, C.J., and J.R. Pierce. 2010. New evidence on measuring financial constraints:
Moving beyond the KZ index. Review of Financial Studies 23(5), 1909-1940.
Hart, O.D., and Moore, J. 1990. Property rights and the nature of the firm, Journal of
Political Economy 98, 1119-1158.
Heckman, J.J. 1979. Sample selection bias as a specification error, Econometrica 47, 153-
161.
Jorda, K.F, Krattiger, A., Mahoney, R.T., Nelson, L., Thomson, J.A., Bennett, A.B., and S.P.
Kowalski. 2007. Trade secrets and trade-secret licensing. Intellectual property
management in health and agricultural innovation: a handbook of best practices, 1
and 2, 1043-1057.

ESSAYS ON CORPORATE TAKEOVERS
236
Kang, J.-K., and J.-M. Kim. 2008. The geography of block acquisitions. Journal of Finance
63(6), 1827-2858.
Kaplan, S.N., and Zingales, L. 1997. Do investment-cash flow sensitivities provide useful
measures of financing constraints? Quarterly Journal of Economics 112(1), 169-
215.
Liao, R.C. 2014. What drives corporate minority acquisitions around the world? The
case for financial constraints. Journal of Corporate Finance 26, 78-95.
Lileeva, A., and D.Trefler. 2010. Improved access to foreign markets raises plant-level
productivity… for some plants. Quarterly Journal of Economics 125(3), 1051-1099.
Ma, S. 2016. The life cycle of corporate venture capital. Working Paper.
Macmillan, I., Roberts, E., Livada, V., and Wang, A. 2008. Corporate venture capital (cvc)
seeking innovation and strategic growth, recent patterns in cvc mission, structure,
and investment. NIST GCR 08-96.
Malloy, C.J. 2005. The geography of equity analysis. Journal of Finance 60(2), 179-755.
Malmendier, U., and Tate, G. 2008. Who makes acquisitions? CEO overconfidence and
the market’s reaction. Journal of Financial Economics 89(1), 20-43.
Malsberger, B.M., Pedowitz, A.H., and S.M. Brock. 2008. Trade secrets: a state-by-state
survey. Bureau of National Affairs: Washington, DC.
Martynova, M. and L. Renneboog, 2008. A century of corporate takeovers: What have we
learned and where do we stand? Journal of Banking & Finance 32(10), 2148-2177.
Mitchell, M., and J.H. Mulherin 1996. The impact of industry shocks on takeover and
restructuring activity. Journal of Financial Economics 41, 193-229.
Moeller, S., Schlingemann, F., and Stulz, R., 2004. Firm size and the gains from
acquisitions. Journal of Financial Economics 73, 201-228.
Neary, J.P. 2007. Cross-border mergers as instruments of comparative advantage.
Review of Economic Studies 74(4), 1229-1257.
Officer, M.S. 2003. Termination fees in mergers and acquisitions, Journal of Financial
Economics 69(3), 431-467.
Ouimet, P.P. 2013. What motivates minority acquisitions? The trade-offs between a
partial equity stake and complete integration. The Review of Financial Studies 26,
1021.
Peteraf, M.A. 1993. The cornerstones of competitive advantage: a resource-based view.
Strategic Mangement Journal 14(14), 179-191.
4. TWO-STAGE ACQUISITIONS AND DEAL PREMIUMS
237
Png, I.P. 2017. Law and innovation: evidence from state trade secret laws. Review of
Economics and Statistics 99(1), 167-179.
Povel, P., and Singh, R. 2006. Takeover contests with asymmetric bidders, Review of
Financial Studies 19, 1399–1431.
Povel, P., and Sertsios, G. 2014. Getting to know each other: the role of toeholds in
acquisitions, Journal of Corporate Finance 26, 201-224.
Qian, J., and Zhu, J.L. 2017. Return to invested capital and the performance of mergers
and acquisitions, Management Science, Forthcoming.
Rajan, R.G., and Zingales, L. 1998. Financial dependence and growth. American Economic
Review 88, 393-410.
Samuels, L.B., and B.K. Johnson. 1990. The uniform trade secrets act: the states’
response. Creighton Law Review 24, 49-98.
Schott, P. 2010. U.S. manufacturing exports and imports by SIC and NAICS category and
partner country, 1972–2005. Working paper, Yale School of Management.
Shekhar, S. and Wey, C. 2017. Uncertain merger synergies, passive partial ownership,
and merger control. Düsseldorf Institute for Competition Economics Discussion
Paper N.260.
Srinivasan, S. 2014. Acquisitions and foreign competition. SSRN Working Paper.
Valta, P. 2012. Competition and the cost of debt. Journal of Financial Economics 105,
661–682.
Weakley, S.L. 2014. Intellectual property in business transactions. Continuing Education
of the Bar: Oakland, CA.
Xu, J. 2012. Profitability and capital structure: evidence from import penetration.
Journal of Financial Economics 106, 427–446.
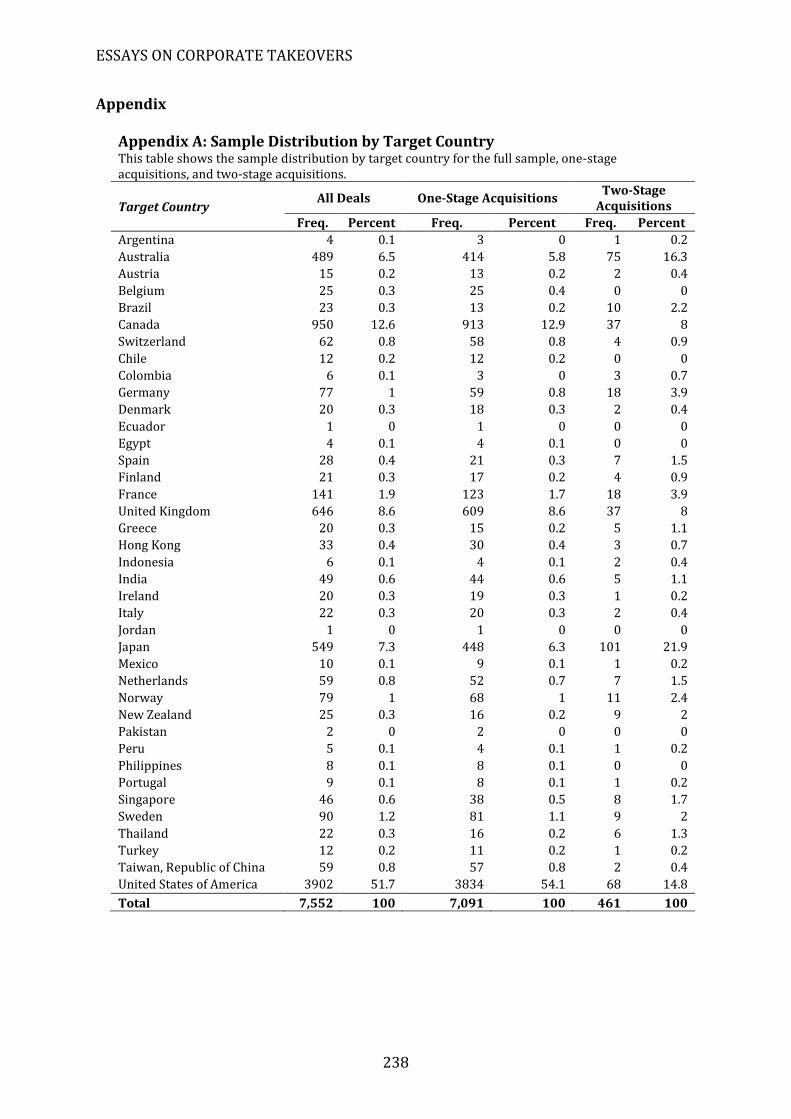
ESSAYS ON CORPORATE TAKEOVERS
238
Appendix
Appendix A: Sample Distribution by Target Country This table shows the sample distribution by target country for the full sample, one-stage acquisitions, and two-stage acquisitions.
Target Country All Deals One-Stage Acquisitions
Two-Stage Acquisitions
Freq. Percent Freq. Percent Freq. Percent
Argentina 4 0.1 3 0 1 0.2
Australia 489 6.5 414 5.8 75 16.3
Austria 15 0.2 13 0.2 2 0.4
Belgium 25 0.3 25 0.4 0 0
Brazil 23 0.3 13 0.2 10 2.2
Canada 950 12.6 913 12.9 37 8
Switzerland 62 0.8 58 0.8 4 0.9
Chile 12 0.2 12 0.2 0 0
Colombia 6 0.1 3 0 3 0.7
Germany 77 1 59 0.8 18 3.9
Denmark 20 0.3 18 0.3 2 0.4
Ecuador 1 0 1 0 0 0
Egypt 4 0.1 4 0.1 0 0
Spain 28 0.4 21 0.3 7 1.5
Finland 21 0.3 17 0.2 4 0.9
France 141 1.9 123 1.7 18 3.9
United Kingdom 646 8.6 609 8.6 37 8
Greece 20 0.3 15 0.2 5 1.1
Hong Kong 33 0.4 30 0.4 3 0.7
Indonesia 6 0.1 4 0.1 2 0.4
India 49 0.6 44 0.6 5 1.1
Ireland 20 0.3 19 0.3 1 0.2
Italy 22 0.3 20 0.3 2 0.4
Jordan 1 0 1 0 0 0
Japan 549 7.3 448 6.3 101 21.9
Mexico 10 0.1 9 0.1 1 0.2
Netherlands 59 0.8 52 0.7 7 1.5
Norway 79 1 68 1 11 2.4
New Zealand 25 0.3 16 0.2 9 2
Pakistan 2 0 2 0 0 0
Peru 5 0.1 4 0.1 1 0.2
Philippines 8 0.1 8 0.1 0 0
Portugal 9 0.1 8 0.1 1 0.2
Singapore 46 0.6 38 0.5 8 1.7
Sweden 90 1.2 81 1.1 9 2
Thailand 22 0.3 16 0.2 6 1.3
Turkey 12 0.2 11 0.2 1 0.2
Taiwan, Republic of China 59 0.8 57 0.8 2 0.4
United States of America 3902 51.7 3834 54.1 68 14.8
Total 7,552 100 7,091 100 461 100
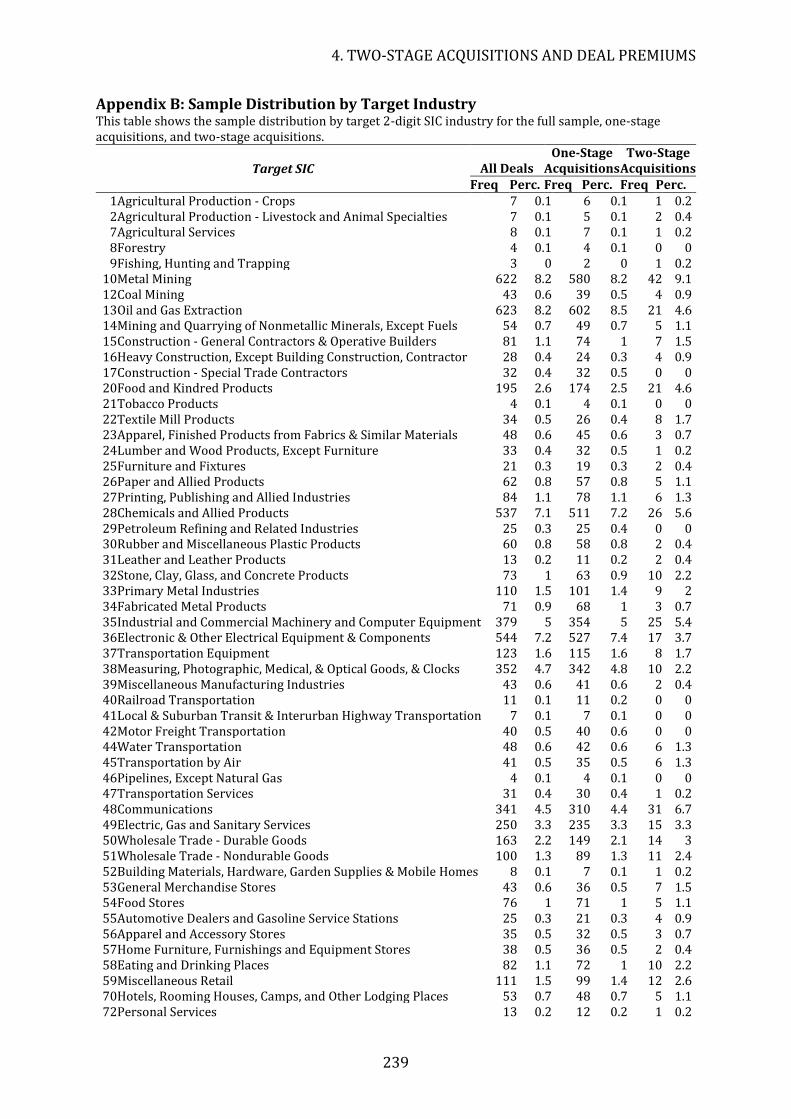
4. TWO-STAGE ACQUISITIONS AND DEAL PREMIUMS
239
239
Appendix B: Sample Distribution by Target Industry This table shows the sample distribution by target 2-digit SIC industry for the full sample, one-stage acquisitions, and two-stage acquisitions.
Target SIC All Deals One-Stage
Acquisitions Two-Stage
Acquisitions Freq Perc. Freq Perc. Freq Perc.
1 Agricultural Production - Crops 7 0.1 6 0.1 1 0.2 2 Agricultural Production - Livestock and Animal Specialties 7 0.1 5 0.1 2 0.4 7 Agricultural Services 8 0.1 7 0.1 1 0.2 8 Forestry 4 0.1 4 0.1 0 0 9 Fishing, Hunting and Trapping 3 0 2 0 1 0.2
10 Metal Mining 622 8.2 580 8.2 42 9.1 12 Coal Mining 43 0.6 39 0.5 4 0.9 13 Oil and Gas Extraction 623 8.2 602 8.5 21 4.6 14 Mining and Quarrying of Nonmetallic Minerals, Except Fuels 54 0.7 49 0.7 5 1.1 15 Construction - General Contractors & Operative Builders 81 1.1 74 1 7 1.5 16 Heavy Construction, Except Building Construction, Contractor 28 0.4 24 0.3 4 0.9 17 Construction - Special Trade Contractors 32 0.4 32 0.5 0 0 20 Food and Kindred Products 195 2.6 174 2.5 21 4.6 21 Tobacco Products 4 0.1 4 0.1 0 0 22 Textile Mill Products 34 0.5 26 0.4 8 1.7 23 Apparel, Finished Products from Fabrics & Similar Materials 48 0.6 45 0.6 3 0.7 24 Lumber and Wood Products, Except Furniture 33 0.4 32 0.5 1 0.2 25 Furniture and Fixtures 21 0.3 19 0.3 2 0.4 26 Paper and Allied Products 62 0.8 57 0.8 5 1.1 27 Printing, Publishing and Allied Industries 84 1.1 78 1.1 6 1.3 28 Chemicals and Allied Products 537 7.1 511 7.2 26 5.6 29 Petroleum Refining and Related Industries 25 0.3 25 0.4 0 0 30 Rubber and Miscellaneous Plastic Products 60 0.8 58 0.8 2 0.4 31 Leather and Leather Products 13 0.2 11 0.2 2 0.4 32 Stone, Clay, Glass, and Concrete Products 73 1 63 0.9 10 2.2 33 Primary Metal Industries 110 1.5 101 1.4 9 2 34 Fabricated Metal Products 71 0.9 68 1 3 0.7 35 Industrial and Commercial Machinery and Computer Equipment 379 5 354 5 25 5.4 36 Electronic & Other Electrical Equipment & Components 544 7.2 527 7.4 17 3.7 37 Transportation Equipment 123 1.6 115 1.6 8 1.7 38 Measuring, Photographic, Medical, & Optical Goods, & Clocks 352 4.7 342 4.8 10 2.2 39 Miscellaneous Manufacturing Industries 43 0.6 41 0.6 2 0.4 40 Railroad Transportation 11 0.1 11 0.2 0 0 41 Local & Suburban Transit & Interurban Highway Transportation 7 0.1 7 0.1 0 0 42 Motor Freight Transportation 40 0.5 40 0.6 0 0 44 Water Transportation 48 0.6 42 0.6 6 1.3 45 Transportation by Air 41 0.5 35 0.5 6 1.3 46 Pipelines, Except Natural Gas 4 0.1 4 0.1 0 0 47 Transportation Services 31 0.4 30 0.4 1 0.2 48 Communications 341 4.5 310 4.4 31 6.7 49 Electric, Gas and Sanitary Services 250 3.3 235 3.3 15 3.3 50 Wholesale Trade - Durable Goods 163 2.2 149 2.1 14 3 51 Wholesale Trade - Nondurable Goods 100 1.3 89 1.3 11 2.4 52 Building Materials, Hardware, Garden Supplies & Mobile Homes 8 0.1 7 0.1 1 0.2 53 General Merchandise Stores 43 0.6 36 0.5 7 1.5 54 Food Stores 76 1 71 1 5 1.1 55 Automotive Dealers and Gasoline Service Stations 25 0.3 21 0.3 4 0.9 56 Apparel and Accessory Stores 35 0.5 32 0.5 3 0.7 57 Home Furniture, Furnishings and Equipment Stores 38 0.5 36 0.5 2 0.4 58 Eating and Drinking Places 82 1.1 72 1 10 2.2 59 Miscellaneous Retail 111 1.5 99 1.4 12 2.6 70 Hotels, Rooming Houses, Camps, and Other Lodging Places 53 0.7 48 0.7 5 1.1 72 Personal Services 13 0.2 12 0.2 1 0.2

ESSAYS ON CORPORATE TAKEOVERS
240
73 Business Services 1189 15.7 1145 16.1 44 9.5 75 Automotive Repair, Services and Parking 10 0.1 7 0.1 3 0.7 76 Miscellaneous Repair Services 1 0 1 0 0 0 78 Motion Pictures 71 0.9 63 0.9 8 1.7 79 Amusement and Recreation Services 57 0.8 49 0.7 8 1.7 80 Health Services 152 2 147 2.1 5 1.1 82 Educational Services 17 0.2 15 0.2 2 0.4 83 Social Services 9 0.1 8 0.1 1 0.2 84 Museums, Art Galleries and Botanical and Zoological Gardens 1 0 1 0 0 0 87 Engineering, Accounting, Research, and Management Services 183 2.4 176 2.5 7 1.5 89 Services, Not Elsewhere Classified 1 0 1 0 0 0 95 Administration of Environmental Quality and Housing Programs 0 0 0 0 0 0 96 Administration of Economic Programs 2 0 2 0 0 0
Total 7,552 100 7,091 100 461 100
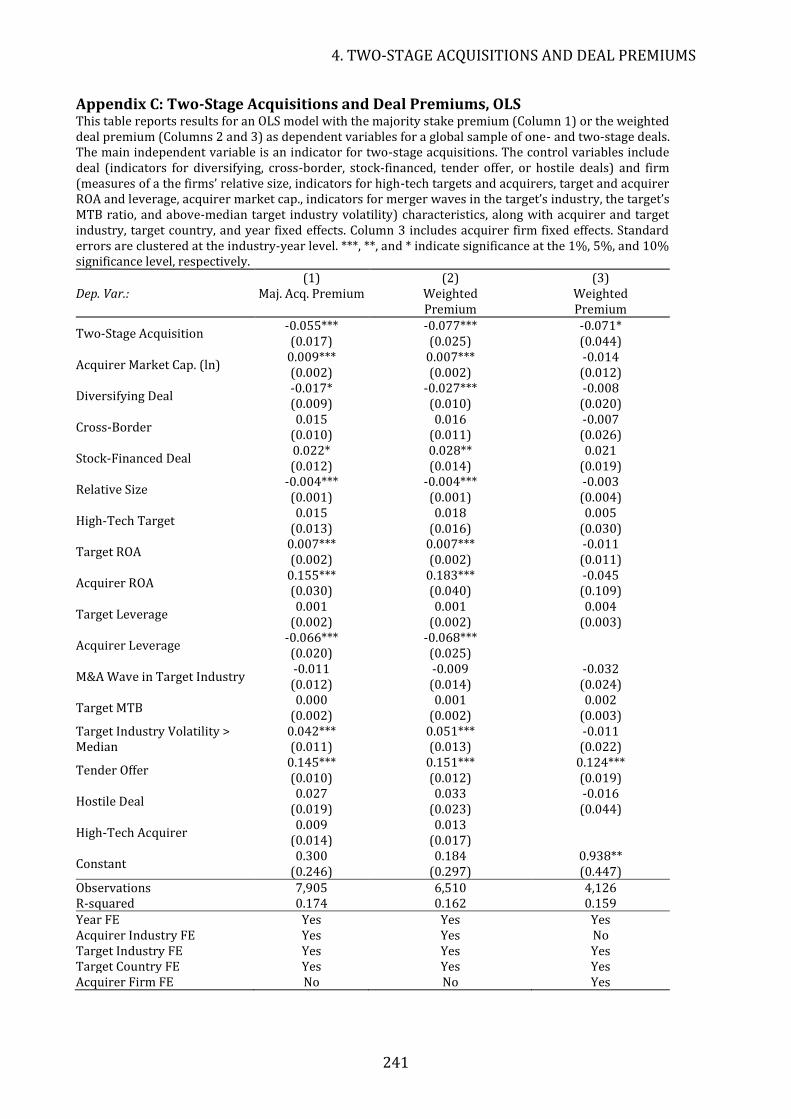
4. TWO-STAGE ACQUISITIONS AND DEAL PREMIUMS
241
241
Appendix C: Two-Stage Acquisitions and Deal Premiums, OLS This table reports results for an OLS model with the majority stake premium (Column 1) or the weighted deal premium (Columns 2 and 3) as dependent variables for a global sample of one- and two-stage deals. The main independent variable is an indicator for two-stage acquisitions. The control variables include deal (indicators for diversifying, cross-border, stock-financed, tender offer, or hostile deals) and firm (measures of a the firms’ relative size, indicators for high-tech targets and acquirers, target and acquirer ROA and leverage, acquirer market cap., indicators for merger waves in the target’s industry, the target’s MTB ratio, and above-median target industry volatility) characteristics, along with acquirer and target industry, target country, and year fixed effects. Column 3 includes acquirer firm fixed effects. Standard errors are clustered at the industry-year level. ***, **, and * indicate significance at the 1%, 5%, and 10% significance level, respectively. (1) (2) (3) Dep. Var.: Maj. Acq. Premium Weighted
Premium Weighted Premium
Two-Stage Acquisition -0.055*** -0.077*** -0.071* (0.017) (0.025) (0.044)
Acquirer Market Cap. (ln) 0.009*** 0.007*** -0.014 (0.002) (0.002) (0.012)
Diversifying Deal -0.017* -0.027*** -0.008 (0.009) (0.010) (0.020)
Cross-Border 0.015 0.016 -0.007
(0.010) (0.011) (0.026)
Stock-Financed Deal 0.022* 0.028** 0.021 (0.012) (0.014) (0.019)
Relative Size -0.004*** -0.004*** -0.003 (0.001) (0.001) (0.004)
High-Tech Target 0.015 0.018 0.005
(0.013) (0.016) (0.030)
Target ROA 0.007*** 0.007*** -0.011 (0.002) (0.002) (0.011)
Acquirer ROA 0.155*** 0.183*** -0.045 (0.030) (0.040) (0.109)
Target Leverage 0.001 0.001 0.004
(0.002) (0.002) (0.003)
Acquirer Leverage -0.066*** -0.068*** (0.020) (0.025)
M&A Wave in Target Industry -0.011 -0.009 -0.032 (0.012) (0.014) (0.024)
Target MTB 0.000 0.001 0.002
(0.002) (0.002) (0.003) Target Industry Volatility > Median
0.042*** 0.051*** -0.011 (0.011) (0.013) (0.022)
Tender Offer 0.145*** 0.151*** 0.124*** (0.010) (0.012) (0.019)
Hostile Deal 0.027 0.033 -0.016
(0.019) (0.023) (0.044)
High-Tech Acquirer 0.009 0.013
(0.014) (0.017)
Constant 0.300 0.184 0.938**
(0.246) (0.297) (0.447) Observations 7,905 6,510 4,126 R-squared 0.174 0.162 0.159 Year FE Yes Yes Yes Acquirer Industry FE Yes Yes No Target Industry FE Yes Yes Yes Target Country FE Yes Yes Yes Acquirer Firm FE No No Yes
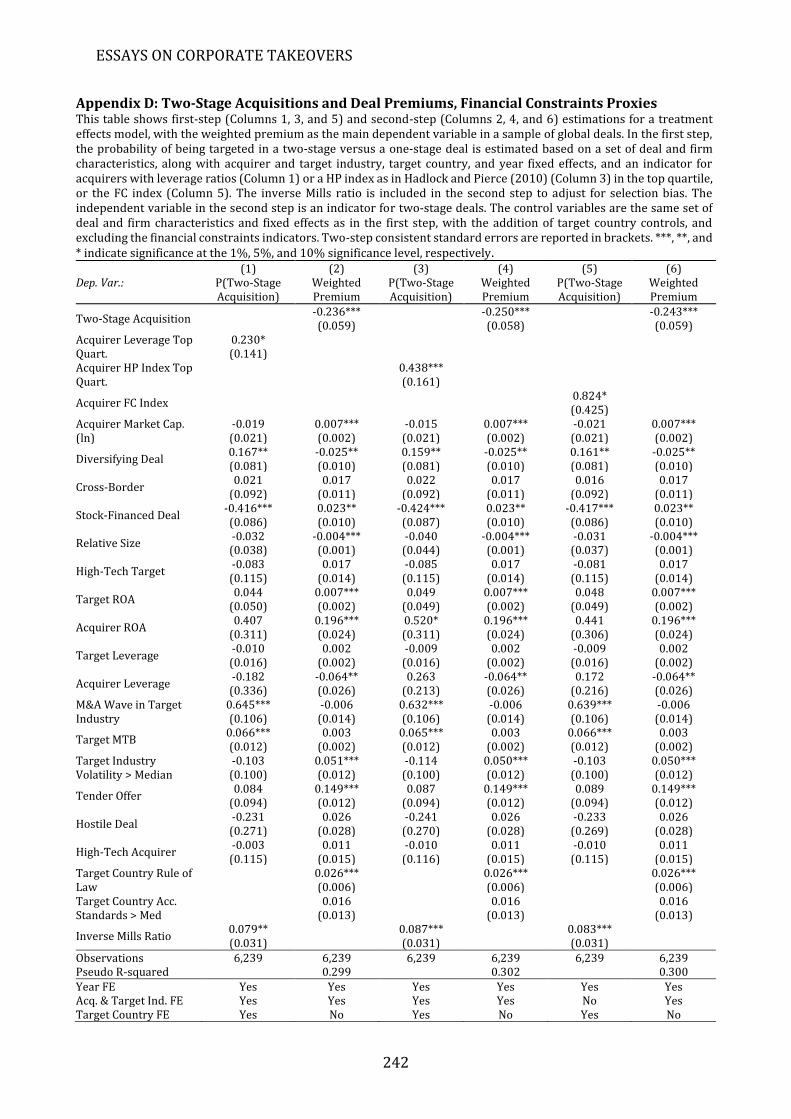
ESSAYS ON CORPORATE TAKEOVERS
242
Appendix D: Two-Stage Acquisitions and Deal Premiums, Financial Constraints Proxies This table shows first-step (Columns 1, 3, and 5) and second-step (Columns 2, 4, and 6) estimations for a treatment effects model, with the weighted premium as the main dependent variable in a sample of global deals. In the first step, the probability of being targeted in a two-stage versus a one-stage deal is estimated based on a set of deal and firm characteristics, along with acquirer and target industry, target country, and year fixed effects, and an indicator for acquirers with leverage ratios (Column 1) or a HP index as in Hadlock and Pierce (2010) (Column 3) in the top quartile, or the FC index (Column 5). The inverse Mills ratio is included in the second step to adjust for selection bias. The independent variable in the second step is an indicator for two-stage deals. The control variables are the same set of deal and firm characteristics and fixed effects as in the first step, with the addition of target country controls, and excluding the financial constraints indicators. Two-step consistent standard errors are reported in brackets. ***, **, and * indicate significance at the 1%, 5%, and 10% significance level, respectively. (1) (2) (3) (4) (5) (6) Dep. Var.: P(Two-Stage
Acquisition) Weighted Premium
P(Two-Stage Acquisition)
Weighted Premium
P(Two-Stage Acquisition)
Weighted Premium
Two-Stage Acquisition -0.236*** -0.250*** -0.243*** (0.059) (0.058) (0.059)
Acquirer Leverage Top Quart.
0.230* (0.141)
Acquirer HP Index Top Quart.
0.438*** (0.161)
Acquirer FC Index 0.824* (0.425)
Acquirer Market Cap. (ln)
-0.019 0.007*** -0.015 0.007*** -0.021 0.007*** (0.021) (0.002) (0.021) (0.002) (0.021) (0.002)
Diversifying Deal 0.167** -0.025** 0.159** -0.025** 0.161** -0.025** (0.081) (0.010) (0.081) (0.010) (0.081) (0.010)
Cross-Border 0.021 0.017 0.022 0.017 0.016 0.017
(0.092) (0.011) (0.092) (0.011) (0.092) (0.011)
Stock-Financed Deal -0.416*** 0.023** -0.424*** 0.023** -0.417*** 0.023** (0.086) (0.010) (0.087) (0.010) (0.086) (0.010)
Relative Size -0.032 -0.004*** -0.040 -0.004*** -0.031 -0.004*** (0.038) (0.001) (0.044) (0.001) (0.037) (0.001)
High-Tech Target -0.083 0.017 -0.085 0.017 -0.081 0.017 (0.115) (0.014) (0.115) (0.014) (0.115) (0.014)
Target ROA 0.044 0.007*** 0.049 0.007*** 0.048 0.007***
(0.050) (0.002) (0.049) (0.002) (0.049) (0.002)
Acquirer ROA 0.407 0.196*** 0.520* 0.196*** 0.441 0.196***
(0.311) (0.024) (0.311) (0.024) (0.306) (0.024)
Target Leverage -0.010 0.002 -0.009 0.002 -0.009 0.002 (0.016) (0.002) (0.016) (0.002) (0.016) (0.002)
Acquirer Leverage -0.182 -0.064** 0.263 -0.064** 0.172 -0.064** (0.336) (0.026) (0.213) (0.026) (0.216) (0.026)
M&A Wave in Target Industry
0.645*** -0.006 0.632*** -0.006 0.639*** -0.006 (0.106) (0.014) (0.106) (0.014) (0.106) (0.014)
Target MTB 0.066*** 0.003 0.065*** 0.003 0.066*** 0.003 (0.012) (0.002) (0.012) (0.002) (0.012) (0.002)
Target Industry Volatility > Median
-0.103 0.051*** -0.114 0.050*** -0.103 0.050*** (0.100) (0.012) (0.100) (0.012) (0.100) (0.012)
Tender Offer 0.084 0.149*** 0.087 0.149*** 0.089 0.149***
(0.094) (0.012) (0.094) (0.012) (0.094) (0.012)
Hostile Deal -0.231 0.026 -0.241 0.026 -0.233 0.026 (0.271) (0.028) (0.270) (0.028) (0.269) (0.028)
High-Tech Acquirer -0.003 0.011 -0.010 0.011 -0.010 0.011 (0.115) (0.015) (0.116) (0.015) (0.115) (0.015)
Target Country Rule of Law
0.026*** 0.026*** 0.026*** (0.006) (0.006) (0.006)
Target Country Acc. Standards > Med
0.016 0.016 0.016 (0.013) (0.013) (0.013)
Inverse Mills Ratio 0.079** 0.087*** 0.083*** (0.031) (0.031) (0.031)
Observations 6,239 6,239 6,239 6,239 6,239 6,239 Pseudo R-squared 0.299 0.302 0.300 Year FE Yes Yes Yes Yes Yes Yes Acq. & Target Ind. FE Yes Yes Yes Yes No Yes Target Country FE Yes No Yes No Yes No
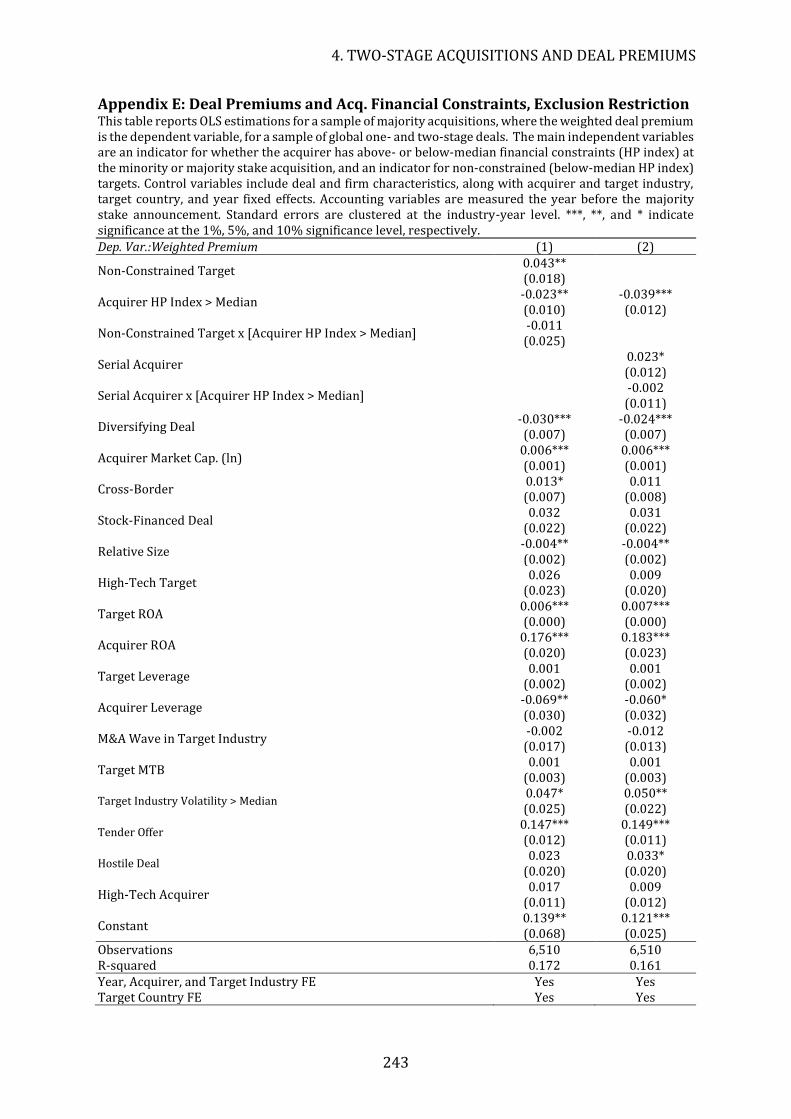
4. TWO-STAGE ACQUISITIONS AND DEAL PREMIUMS
243
243
Appendix E: Deal Premiums and Acq. Financial Constraints, Exclusion Restriction This table reports OLS estimations for a sample of majority acquisitions, where the weighted deal premium is the dependent variable, for a sample of global one- and two-stage deals. The main independent variables are an indicator for whether the acquirer has above- or below-median financial constraints (HP index) at the minority or majority stake acquisition, and an indicator for non-constrained (below-median HP index) targets. Control variables include deal and firm characteristics, along with acquirer and target industry, target country, and year fixed effects. Accounting variables are measured the year before the majority stake announcement. Standard errors are clustered at the industry-year level. ***, **, and * indicate significance at the 1%, 5%, and 10% significance level, respectively. Dep. Var.:Weighted Premium (1) (2)
Non-Constrained Target 0.043** (0.018)
Acquirer HP Index > Median -0.023** -0.039*** (0.010) (0.012)
Non-Constrained Target x [Acquirer HP Index > Median] -0.011 (0.025)
Serial Acquirer 0.023* (0.012)
Serial Acquirer x [Acquirer HP Index > Median] -0.002 (0.011)
Diversifying Deal -0.030*** -0.024*** (0.007) (0.007)
Acquirer Market Cap. (ln) 0.006*** 0.006*** (0.001) (0.001)
Cross-Border 0.013* 0.011 (0.007) (0.008)
Stock-Financed Deal 0.032 0.031
(0.022) (0.022)
Relative Size -0.004** -0.004** (0.002) (0.002)
High-Tech Target 0.026 0.009
(0.023) (0.020)
Target ROA 0.006*** 0.007*** (0.000) (0.000)
Acquirer ROA 0.176*** 0.183*** (0.020) (0.023)
Target Leverage 0.001 0.001
(0.002) (0.002)
Acquirer Leverage -0.069** -0.060* (0.030) (0.032)
M&A Wave in Target Industry -0.002 -0.012 (0.017) (0.013)
Target MTB 0.001 0.001
(0.003) (0.003)
Target Industry Volatility > Median 0.047* 0.050** (0.025) (0.022)
Tender Offer 0.147*** 0.149*** (0.012) (0.011)
Hostile Deal 0.023 0.033*
(0.020) (0.020)
High-Tech Acquirer 0.017 0.009
(0.011) (0.012)
Constant 0.139** 0.121*** (0.068) (0.025)
Observations 6,510 6,510 R-squared 0.172 0.161 Year, Acquirer, and Target Industry FE Yes Yes Target Country FE Yes Yes
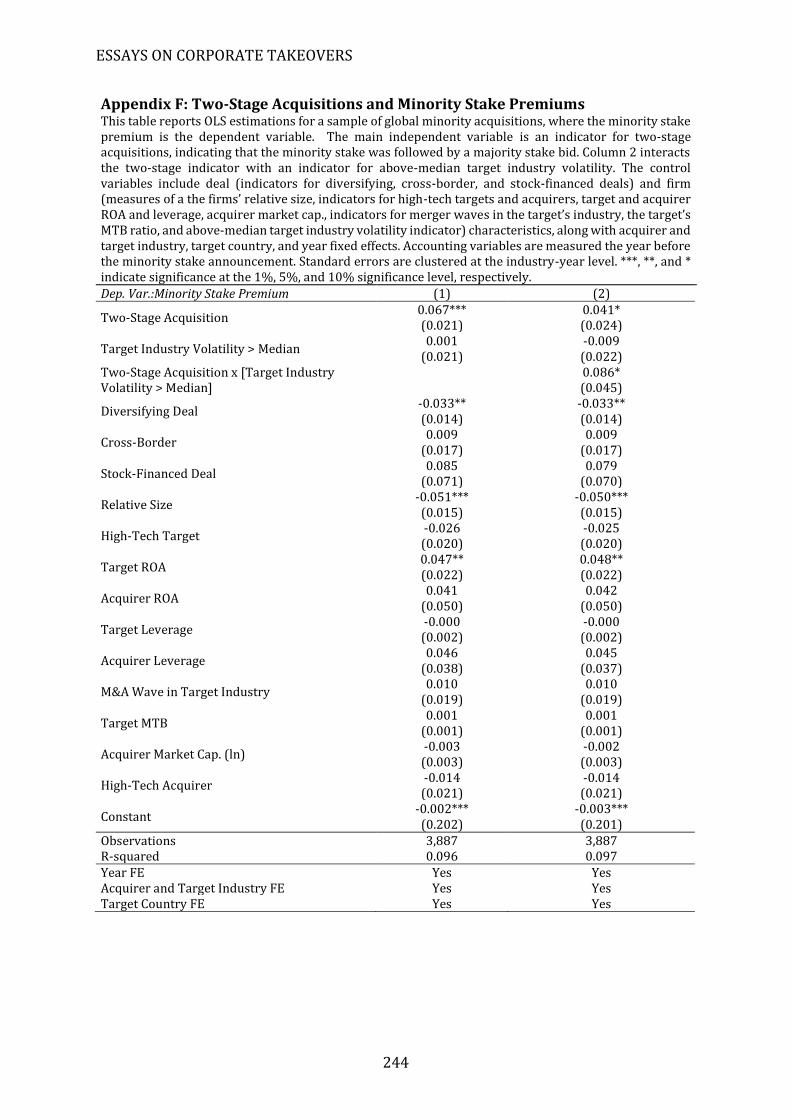
ESSAYS ON CORPORATE TAKEOVERS
244
Appendix F: Two-Stage Acquisitions and Minority Stake Premiums This table reports OLS estimations for a sample of global minority acquisitions, where the minority stake premium is the dependent variable. The main independent variable is an indicator for two-stage acquisitions, indicating that the minority stake was followed by a majority stake bid. Column 2 interacts the two-stage indicator with an indicator for above-median target industry volatility. The control variables include deal (indicators for diversifying, cross-border, and stock-financed deals) and firm (measures of a the firms’ relative size, indicators for high-tech targets and acquirers, target and acquirer ROA and leverage, acquirer market cap., indicators for merger waves in the target’s industry, the target’s MTB ratio, and above-median target industry volatility indicator) characteristics, along with acquirer and target industry, target country, and year fixed effects. Accounting variables are measured the year before the minority stake announcement. Standard errors are clustered at the industry-year level. ***, **, and * indicate significance at the 1%, 5%, and 10% significance level, respectively. Dep. Var.:Minority Stake Premium (1) (2)
Two-Stage Acquisition 0.067*** 0.041* (0.021) (0.024)
Target Industry Volatility > Median 0.001 -0.009
(0.021) (0.022) Two-Stage Acquisition x [Target Industry Volatility > Median]
0.086* (0.045)
Diversifying Deal -0.033** -0.033** (0.014) (0.014)
Cross-Border 0.009 0.009
(0.017) (0.017)
Stock-Financed Deal 0.085 0.079
(0.071) (0.070)
Relative Size -0.051*** -0.050*** (0.015) (0.015)
High-Tech Target -0.026 -0.025 (0.020) (0.020)
Target ROA 0.047** 0.048** (0.022) (0.022)
Acquirer ROA 0.041 0.042
(0.050) (0.050)
Target Leverage -0.000 -0.000 (0.002) (0.002)
Acquirer Leverage 0.046 0.045
(0.038) (0.037)
M&A Wave in Target Industry 0.010 0.010
(0.019) (0.019)
Target MTB 0.001 0.001
(0.001) (0.001)
Acquirer Market Cap. (ln) -0.003 -0.002 (0.003) (0.003)
High-Tech Acquirer -0.014 -0.014 (0.021) (0.021)
Constant -0.002*** -0.003*** (0.202) (0.201)
Observations 3,887 3,887 R-squared 0.096 0.097 Year FE Yes Yes Acquirer and Target Industry FE Yes Yes Target Country FE Yes Yes
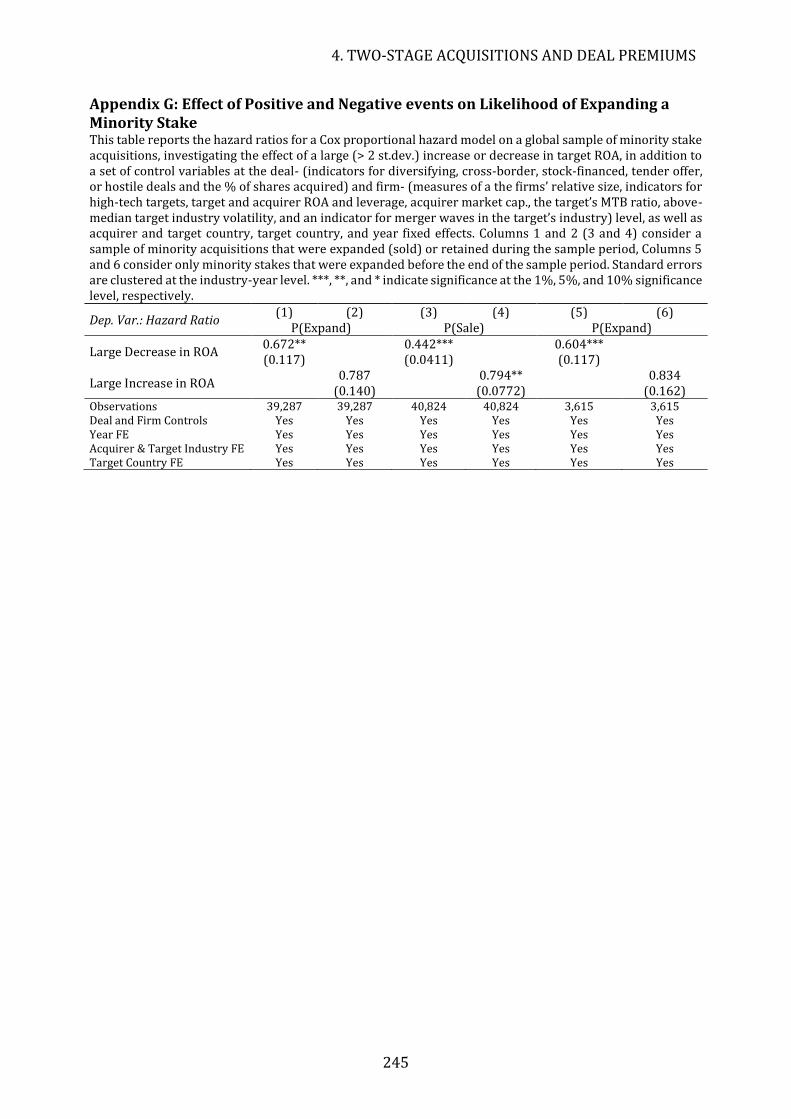
4. TWO-STAGE ACQUISITIONS AND DEAL PREMIUMS
245
245
Appendix G: Effect of Positive and Negative events on Likelihood of Expanding a Minority Stake This table reports the hazard ratios for a Cox proportional hazard model on a global sample of minority stake acquisitions, investigating the effect of a large (> 2 st.dev.) increase or decrease in target ROA, in addition to a set of control variables at the deal- (indicators for diversifying, cross-border, stock-financed, tender offer, or hostile deals and the % of shares acquired) and firm- (measures of a the firms’ relative size, indicators for high-tech targets, target and acquirer ROA and leverage, acquirer market cap., the target’s MTB ratio, above-median target industry volatility, and an indicator for merger waves in the target’s industry) level, as well as acquirer and target country, target country, and year fixed effects. Columns 1 and 2 (3 and 4) consider a sample of minority acquisitions that were expanded (sold) or retained during the sample period, Columns 5 and 6 consider only minority stakes that were expanded before the end of the sample period. Standard errors are clustered at the industry-year level. ***, **, and * indicate significance at the 1%, 5%, and 10% significance level, respectively.
Dep. Var.: Hazard Ratio (1) (2) (3) (4) (5) (6)
P(Expand) P(Sale) P(Expand)
Large Decrease in ROA 0.672** 0.442*** 0.604*** (0.117) (0.0411) (0.117)
Large Increase in ROA 0.787 0.794** 0.834 (0.140) (0.0772) (0.162)
Observations 39,287 39,287 40,824 40,824 3,615 3,615 Deal and Firm Controls Yes Yes Yes Yes Yes Yes Year FE Yes Yes Yes Yes Yes Yes Acquirer & Target Industry FE Yes Yes Yes Yes Yes Yes Target Country FE Yes Yes Yes Yes Yes Yes
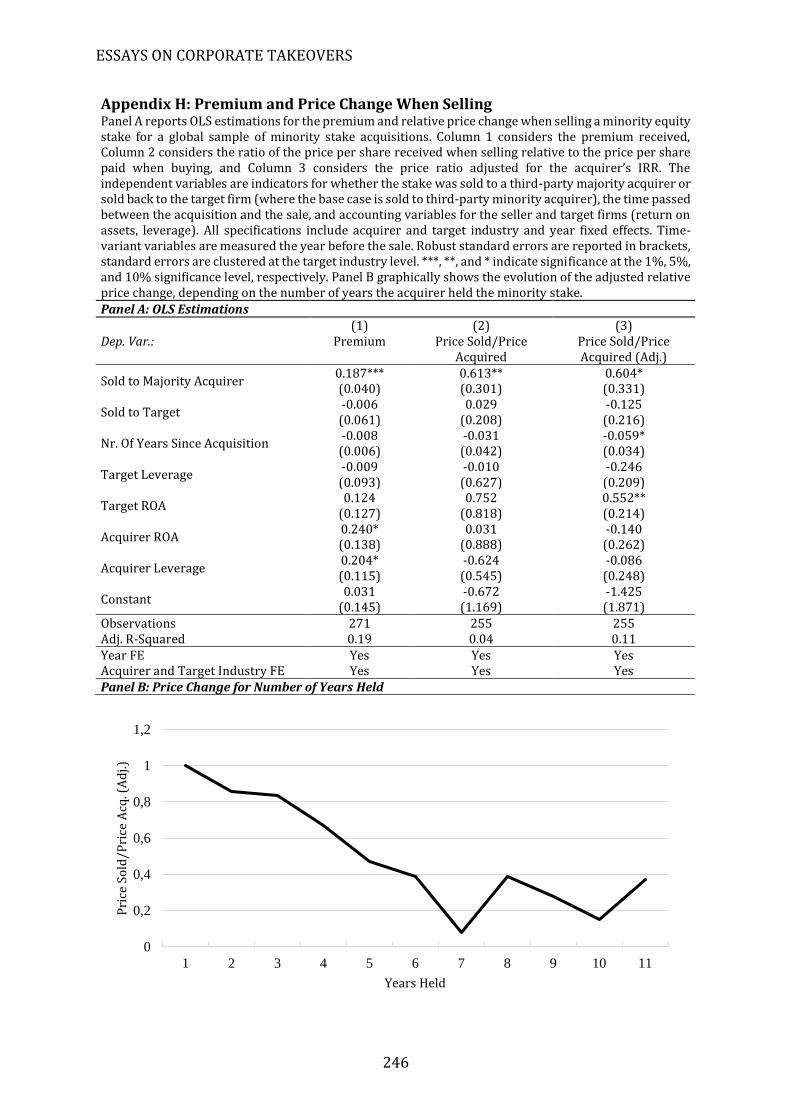
ESSAYS ON CORPORATE TAKEOVERS
246
Appendix H: Premium and Price Change When Selling Panel A reports OLS estimations for the premium and relative price change when selling a minority equity stake for a global sample of minority stake acquisitions. Column 1 considers the premium received, Column 2 considers the ratio of the price per share received when selling relative to the price per share paid when buying, and Column 3 considers the price ratio adjusted for the acquirer’s IRR. The independent variables are indicators for whether the stake was sold to a third-party majority acquirer or sold back to the target firm (where the base case is sold to third-party minority acquirer), the time passed between the acquisition and the sale, and accounting variables for the seller and target firms (return on assets, leverage). All specifications include acquirer and target industry and year fixed effects. Time-variant variables are measured the year before the sale. Robust standard errors are reported in brackets, standard errors are clustered at the target industry level. ***, **, and * indicate significance at the 1%, 5%, and 10% significance level, respectively. Panel B graphically shows the evolution of the adjusted relative price change, depending on the number of years the acquirer held the minority stake.
Panel A: OLS Estimations
Dep. Var.: (1)
Premium (2)
Price Sold/Price Acquired
(3) Price Sold/Price Acquired (Adj.)
Sold to Majority Acquirer 0.187*** 0.613** 0.604* (0.040) (0.301) (0.331)
Sold to Target -0.006 0.029 -0.125 (0.061) (0.208) (0.216)
Nr. Of Years Since Acquisition -0.008 -0.031 -0.059* (0.006) (0.042) (0.034)
Target Leverage -0.009 -0.010 -0.246 (0.093) (0.627) (0.209)
Target ROA 0.124 0.752 0.552**
(0.127) (0.818) (0.214)
Acquirer ROA 0.240* 0.031 -0.140 (0.138) (0.888) (0.262)
Acquirer Leverage 0.204* -0.624 -0.086 (0.115) (0.545) (0.248)
Constant 0.031 -0.672 -1.425
(0.145) (1.169) (1.871) Observations 271 255 255 Adj. R-Squared 0.19 0.04 0.11 Year FE Yes Yes Yes Acquirer and Target Industry FE Yes Yes Yes Panel B: Price Change for Number of Years Held
0
0,2
0,4
0,6
0,8
1
1,2
1 2 3 4 5 6 7 8 9 10 11
Pri
ce S
old
/Pri
ce A
cq. (
Ad
j.)
Years Held
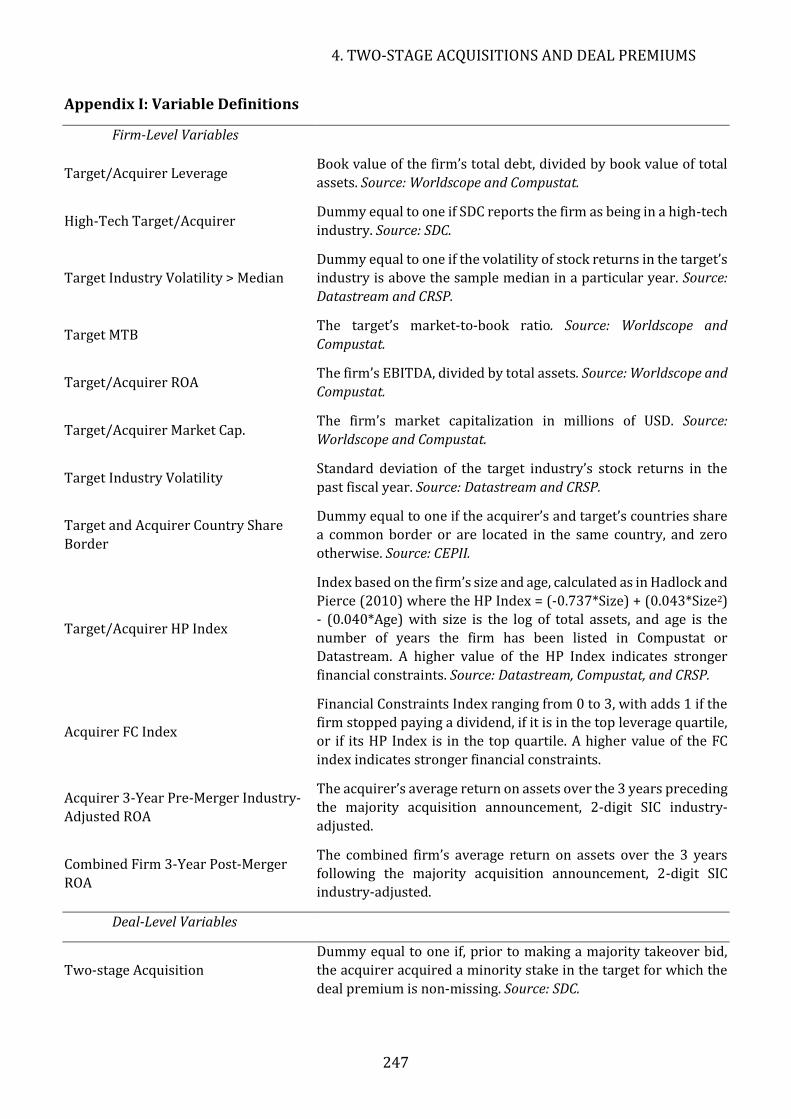
4. TWO-STAGE ACQUISITIONS AND DEAL PREMIUMS
247
247
Appendix I: Variable Definitions
Firm-Level Variables
Target/Acquirer Leverage Book value of the firm’s total debt, divided by book value of total
assets. Source: Worldscope and Compustat.
High-Tech Target/Acquirer Dummy equal to one if SDC reports the firm as being in a high-tech
industry. Source: SDC.
Target Industry Volatility > Median
Dummy equal to one if the volatility of stock returns in the target’s
industry is above the sample median in a particular year. Source:
Datastream and CRSP.
Target MTB The target’s market-to-book ratio. Source: Worldscope and
Compustat.
Target/Acquirer ROA The firm’s EBITDA, divided by total assets. Source: Worldscope and
Compustat.
Target/Acquirer Market Cap. The firm’s market capitalization in millions of USD. Source:
Worldscope and Compustat.
Target Industry Volatility Standard deviation of the target industry’s stock returns in the
past fiscal year. Source: Datastream and CRSP.
Target and Acquirer Country Share
Border
Dummy equal to one if the acquirer’s and target’s countries share
a common border or are located in the same country, and zero
otherwise. Source: CEPII.
Target/Acquirer HP Index
Index based on the firm’s size and age, calculated as in Hadlock and
Pierce (2010) where the HP Index = (-0.737*Size) + (0.043*Size2)
- (0.040*Age) with size is the log of total assets, and age is the
number of years the firm has been listed in Compustat or
Datastream. A higher value of the HP Index indicates stronger
financial constraints. Source: Datastream, Compustat, and CRSP.
Acquirer FC Index
Financial Constraints Index ranging from 0 to 3, with adds 1 if the
firm stopped paying a dividend, if it is in the top leverage quartile,
or if its HP Index is in the top quartile. A higher value of the FC
index indicates stronger financial constraints.
Acquirer 3-Year Pre-Merger Industry-
Adjusted ROA
The acquirer’s average return on assets over the 3 years preceding
the majority acquisition announcement, 2-digit SIC industry-
adjusted.
Combined Firm 3-Year Post-Merger
ROA
The combined firm’s average return on assets over the 3 years
following the majority acquisition announcement, 2-digit SIC
industry-adjusted.
Deal-Level Variables
Two-stage Acquisition
Dummy equal to one if, prior to making a majority takeover bid,
the acquirer acquired a minority stake in the target for which the
deal premium is non-missing. Source: SDC.
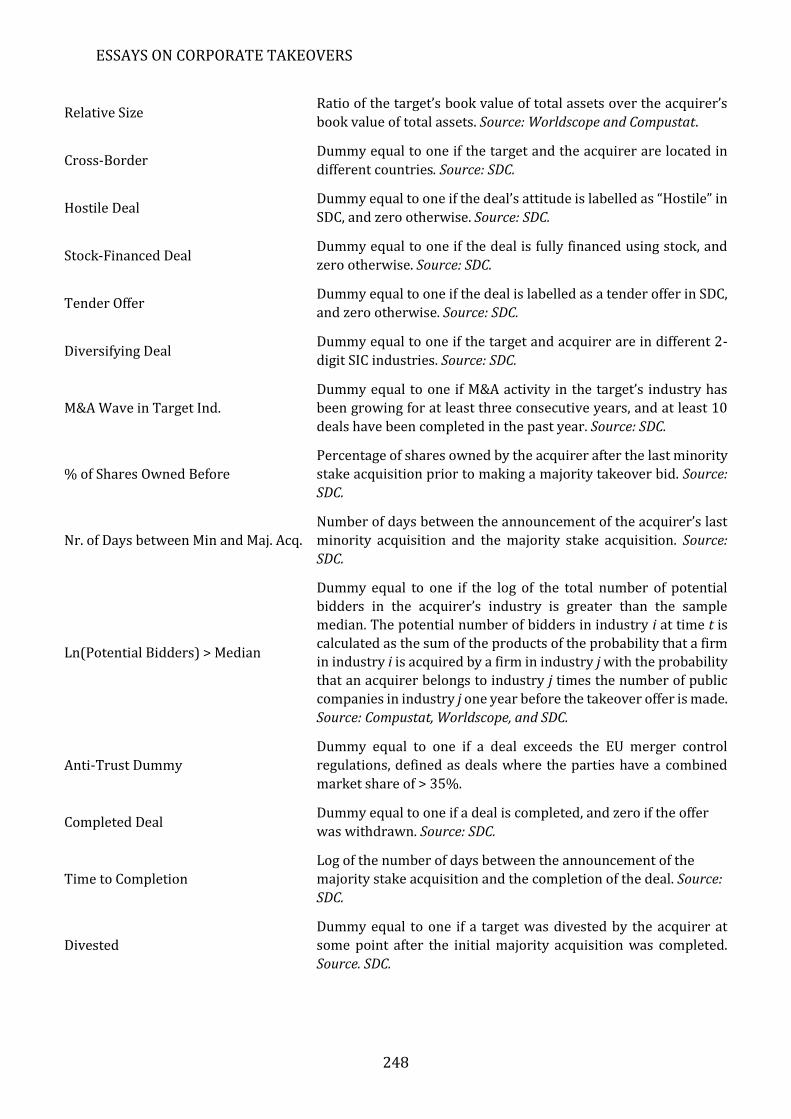
ESSAYS ON CORPORATE TAKEOVERS
248
Relative Size Ratio of the target’s book value of total assets over the acquirer’s
book value of total assets. Source: Worldscope and Compustat.
Cross-Border Dummy equal to one if the target and the acquirer are located in
different countries. Source: SDC.
Hostile Deal Dummy equal to one if the deal’s attitude is labelled as “Hostile” in
SDC, and zero otherwise. Source: SDC.
Stock-Financed Deal Dummy equal to one if the deal is fully financed using stock, and
zero otherwise. Source: SDC.
Tender Offer Dummy equal to one if the deal is labelled as a tender offer in SDC,
and zero otherwise. Source: SDC.
Diversifying Deal Dummy equal to one if the target and acquirer are in different 2-
digit SIC industries. Source: SDC.
M&A Wave in Target Ind.
Dummy equal to one if M&A activity in the target’s industry has
been growing for at least three consecutive years, and at least 10
deals have been completed in the past year. Source: SDC.
% of Shares Owned Before
Percentage of shares owned by the acquirer after the last minority
stake acquisition prior to making a majority takeover bid. Source:
SDC.
Nr. of Days between Min and Maj. Acq.
Number of days between the announcement of the acquirer’s last
minority acquisition and the majority stake acquisition. Source:
SDC.
Ln(Potential Bidders) > Median
Dummy equal to one if the log of the total number of potential
bidders in the acquirer’s industry is greater than the sample
median. The potential number of bidders in industry i at time t is
calculated as the sum of the products of the probability that a firm
in industry i is acquired by a firm in industry j with the probability
that an acquirer belongs to industry j times the number of public
companies in industry j one year before the takeover offer is made.
Source: Compustat, Worldscope, and SDC.
Anti-Trust Dummy
Dummy equal to one if a deal exceeds the EU merger control
regulations, defined as deals where the parties have a combined
market share of > 35%.
Completed Deal Dummy equal to one if a deal is completed, and zero if the offer
was withdrawn. Source: SDC.
Time to Completion
Log of the number of days between the announcement of the
majority stake acquisition and the completion of the deal. Source:
SDC.
Divested
Dummy equal to one if a target was divested by the acquirer at
some point after the initial majority acquisition was completed.
Source. SDC.
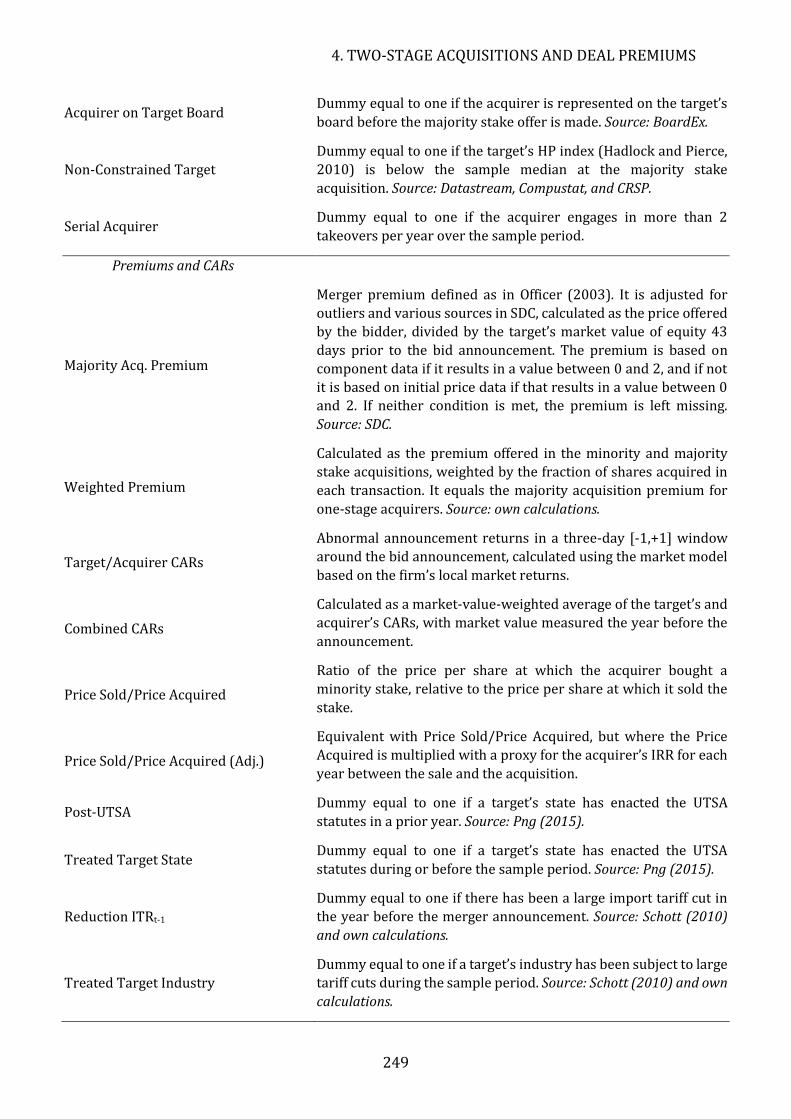
4. TWO-STAGE ACQUISITIONS AND DEAL PREMIUMS
249
249
Acquirer on Target Board Dummy equal to one if the acquirer is represented on the target’s
board before the majority stake offer is made. Source: BoardEx.
Non-Constrained Target
Dummy equal to one if the target’s HP index (Hadlock and Pierce,
2010) is below the sample median at the majority stake
acquisition. Source: Datastream, Compustat, and CRSP.
Serial Acquirer Dummy equal to one if the acquirer engages in more than 2
takeovers per year over the sample period.
Premiums and CARs
Majority Acq. Premium
Merger premium defined as in Officer (2003). It is adjusted for
outliers and various sources in SDC, calculated as the price offered
by the bidder, divided by the target’s market value of equity 43
days prior to the bid announcement. The premium is based on
component data if it results in a value between 0 and 2, and if not
it is based on initial price data if that results in a value between 0 and 2. If neither condition is met, the premium is left missing.
Source: SDC.
Weighted Premium
Calculated as the premium offered in the minority and majority
stake acquisitions, weighted by the fraction of shares acquired in
each transaction. It equals the majority acquisition premium for
one-stage acquirers. Source: own calculations.
Target/Acquirer CARs
Abnormal announcement returns in a three-day [-1,+1] window
around the bid announcement, calculated using the market model
based on the firm’s local market returns.
Combined CARs
Calculated as a market-value-weighted average of the target’s and
acquirer’s CARs, with market value measured the year before the
announcement.
Price Sold/Price Acquired
Ratio of the price per share at which the acquirer bought a
minority stake, relative to the price per share at which it sold the
stake.
Price Sold/Price Acquired (Adj.)
Equivalent with Price Sold/Price Acquired, but where the Price
Acquired is multiplied with a proxy for the acquirer’s IRR for each
year between the sale and the acquisition.
Post-UTSA Dummy equal to one if a target’s state has enacted the UTSA
statutes in a prior year. Source: Png (2015).
Treated Target State Dummy equal to one if a target’s state has enacted the UTSA
statutes during or before the sample period. Source: Png (2015).
Reduction ITRt-1
Dummy equal to one if there has been a large import tariff cut in
the year before the merger announcement. Source: Schott (2010)
and own calculations.
Treated Target Industry
Dummy equal to one if a target’s industry has been subject to large
tariff cuts during the sample period. Source: Schott (2010) and own
calculations.

ESSAYS ON CORPORATE TAKEOVERS
250
Foreign Potential Bidder Competition
Log of the total number of potential foreign bidders, where the
potential number of foreign bidders in industry i at time t is
calculated as the sum of the products of the probability that a firm
in industry i is acquired by a foreign firm in industry j with the
probability that a foreign acquirer belongs to industry j times the
number of public foreign companies in industry j one year before
the takeover offer is made. Source: Compustat, Worldscope, and
SDC.