Embed Size (px)
Citation preview

Tilburg University
Consumption-based learning about brand quality
Szymanowski, M.G.
Publication date:2009
Link to publication
Citation for published version (APA):Szymanowski, M. G. (2009). Consumption-based learning about brand quality: Essays on how private labelsshare and borrow reputation Tilburg: CentER, Center for Economic Research
General rightsCopyright and moral rights for the publications made accessible in the public portal are retained by the authors and/or other copyright ownersand it is a condition of accessing publications that users recognise and abide by the legal requirements associated with these rights.
? Users may download and print one copy of any publication from the public portal for the purpose of private study or research ? You may not further distribute the material or use it for any profit-making activity or commercial gain ? You may freely distribute the URL identifying the publication in the public portal
Take down policyIf you believe that this document breaches copyright, please contact us providing details, and we will remove access to the work immediatelyand investigate your claim.
Download date: 09. apr. 2016

Consumption-based learning about brand quality:
Essays on how private labels share and borrow reputation
Proefschrift ter verkrijging van de graad van doctor aan de Universiteit van Tilburg, op gezag van de rector magnificus, prof.dr. Ph. Eijlander, in het openbaar te verdedigen ten overstaan van een door het college voor promoties aangewezen commissie in de aula van de Universiteit op maandag 7 december 2009 om 16.15 uur door
Maciej Szymanowski
geboren op 26 oktober 1977 te Kraków, Polen.

Promotor:
Prof. Dr. Els Gijsbrechts

Committee:
Prof. Dr. Kusum Ailawadi, Charles Jordan 1911 TU'12 Professor of Marketing, Tuck
School of Business at Dartmouth, Dartmouth College, USA.
Prof. Dr. Bart Bronnenberg, Professor of Quantitative Marketing, Department of
Marketing, Faculty of Economics and Business Administration, Tilburg University, the
Netherlands.
Prof. Dr. Marnik Dekimpe, Research Professor of Marketing, Department of
Marketing, Faculty of Economics and Business Administration, Tilburg University, the
Netherlands, and Professor of Marketing, Department of Marketing and Organization Studies,
Faculty of Economics, Catholic University of Leuven, Belgium.
Prof. Dr. Els Gijsbrechts, Professor of Quantitative Marketing, Department of
Marketing, Faculty of Economics and Business Administration, Tilburg University, the
Netherlands.
Prof. Dr. Puneet Manchanda, Professor of Marketing, Stephen M. Ross School of
Business, University of Michigan, USA.
Prof. Dr. Stijn Van Osselaer, Professor of Marketing , Department of Marketing
Management, Rotterdam School of Management, Erasmus University, the Netherlands


To Marta


i
Acknowledgments
The process of writing this thesis would not be this educating and exciting without
generous support of and stimulating interaction with many people. First and foremost I would
like to thank my advisor, Els Gijsbrechts. Dear Els, your brilliantly sharp and to the point
feedback on my work has kept me on course. Your patience, dependability, and devotion to
our cooperation exceeded what I could ask for and touched me personally.
Second, I would like to thank the other members of my doctoral committee Kusum
Ailawadi, Bart Bronenberg, Marnik Dekimpe, Puneet Manchanda, and Stijn van Osselaer. I
am very honored that such distinguished researchers have accepted this role. I am very
grateful for their deep and well-informed comments on draft of this thesis. I am particularly
thankful to them for aiding me in fitting more tightly the theory, models, interpretation, and
implications and thus making the thesis more rigorous and managerially relevant. I am also
thankful to them for broadening my horizons where it comes to research on learning.
Moreover, I am very grateful to Marnik Dekimpe for the great support and wise advice I
received from him over the past years.

ii
I would like to thank my wife, Marta. I cannot find words expressing how great it was
to have such a wonderful partner along the way. Her intelligence, empathy, selflessness were
invaluable. With her next to me, I could never doubt in ideals and this gave me the strength to
strive for them.
I also want to thank my colleagues from Tilburg. You all made me feel complete
during this period. I would definitely feel something is missing without running (including
everything that was part of it, discussions, laughs, challenges) with Harald, Leo, Tammo,
Carlos, Rutger, Davy, George, Femke, Nelleke and Vincent. If not you, I would miss long
night discussions like those with Simon, Michaela, Ania, George, Giselle, Carlos, Rutger, and
Marie. I would feel lonely without shared experiences and challenges with my academic
siblings, Jia and Man-Wai and support of my older academic brothers and sisters, Berk,
Martijn, Rita, Robert, Valentina, Ralf, Jorna, and Fleur. Without inhaling wisdom exhaled by
such vibrant minds as Rik and Jan-Benedict I would not get this excited with what I am doing.
Without personal warmth of Peter, Roger, Cedric, and Hans I would feel detached. I would not
develop as a researcher if well-wishing and inspiring Inge, Dirk, and Stefan were not around.
Without racing on a bicycle with Rik, Michel, and Gerrit I would not know what is the true
spirit of passion. My memories from Tilburg would be worse if Aniek, Annemiek, Diederik,
Heidi, Henk, Jan, Maike, Martyna, Petra, Scarlet, Sofie, and other members of the group were
not there.
I am also very thankful to my colleagues from the Rotterdam group. I will be very
brief here since Rotterdam already belongs to the next chapter in my life. Still, I spent here the

iii
last and most critical period of writing my thesis and I am very grateful to each and every one
of you for your support.
Almost last, but not least, I am grateful to my entire family and dear friends in
Kraków. Dad, your belief in me and in my work was a powerful driver for me. Mom, thank
you for cultivating my inquisitiveness – it has made me what I am professionally. Magda,
Mateusz, Piotrek, time spent with you is always the best way to charge my batteries! You all
are a demanding audience and a good check if what I am doing makes broader sense.
Finally, I would like to thank you, the reader of this thesis for being my audience. I hope
you will benefit from it in some way, please let me know (or my academic ancestors) if you
have comments or questions.

v
Contents
Acknowledgments .......................................................................................................................... i
Contents ..........................................................................................................................................v
1 Introduction............................................................................................................................1
2 Consumption-based learning in packaged goods: An exploratory multi-category
study .....................................................................................................................................13
2.1 Introduction.........................................................................................................13
2.2 Stage 1: Magnitude of consumption-based learning...........................................15
2.2.1 Data...............................................................................................................15
2.2.2 Method development ....................................................................................18
2.2.3 Results: The amount of consumption-based learning across households
and categories 24
2.3 Stage 2: Drivers of learning magnitude ..............................................................28
2.3.1 Drivers of consumption-based quality learning: Data and variables ............28
2.3.2 Method ..........................................................................................................34
2.3.3 Results...........................................................................................................36
2.4 Discussion, limitations and future research ........................................................38
3 Conditional Cross-Brand Learning: When Are Private Labels Really Private? ..........43
3.1 Introduction.........................................................................................................43
3.2 Conceptual Framework: Quality learning across Private Label brands .............46
3.2.1 Private Label Brands as a Mental Category..................................................46
3.2.2 Strength of Cross-Brand Learning Among Private Labels ...........................48
3.3 Model Development ...........................................................................................49
3.3.1 Utility in the Presence of Brand Quality Uncertainty and Risk Aversion ....49
3.3.2 Quality Learning and Forgetting Based on Consumption ............................51
3.3.3 Cross-Brand Learning Among Private Labels..............................................53
3.3.4 Strength of Cross-Brand Learning Among Private Labels ...........................55
3.3.5 Model Estimation..........................................................................................58
vi
3.4 Empirical Analysis............................................................................................. 60
3.4.1 Data .............................................................................................................. 60
3.4.2 Estimation Results........................................................................................ 64
3.5 Reputation spillovers and PL quality positioning .............................................. 69
3.5.1 Quality Belief and Brand Familiarity Spillovers ......................................... 69
3.5.2 Net Spillovers and Quality Positioning........................................................ 73
3.6 Conclusions, Limitations, and Further Research ............................................... 78
4 Copycat Private Labels: Friend or Foe? Quality Belief Spillovers and Choice Share
Effects for Imitating Retailer and Imitated National Brands........................................ 85
4.1 Introduction........................................................................................................ 85
4.2 Literature – Conceptual Framework .................................................................. 87
4.2.1 Quality learning from the imitated brand to the copycat. ............................ 89
4.2.2 Learning from copycat consumption. .......................................................... 90
4.3 Model Development........................................................................................... 93
4.3.1 Base model without cross-learning. ............................................................. 93
4.3.2 Modeling consumption spillovers from the imitated national brand to the
copycat 96
4.3.3 Model extensions: memory confusion, contingent cross-learning and
experience-based reactance or rewarding. ............................................................................ 98
4.3.4 Estimation................................................................................................... 101
4.4 Empirical Analysis......................................................................................... 101
4.4.1 Data and setting.......................................................................................... 101
4.4.2 Estimation Results...................................................................................... 106
4.4.3 Parameter estimates.................................................................................... 108
4.4.4 Implications for choice shares.................................................................... 112
4.5 Conclusions, limitations and future research ................................................... 120
4.5.1 Conclusions................................................................................................ 120
4.5.2 Limitations and Directions for Future research. ........................................ 124
5 General conclusions and directions for future research................................................ 127
5.1 Summary of Findings....................................................................................... 128
5.2 Implications...................................................................................................... 130
5.3 Future research................................................................................................. 133
Appendix 1................................................................................................................................. 139
Appendix 2................................................................................................................................. 147
Appendix 3................................................................................................................................. 153
References .................................................................................................................................. 157
Samenvatting (Summary in Dutch)......................................................................................... 167
Strzeszczenie (Summary in Polish).......................................................................................... 175

1
1 Introduction
The emergence of information economics (Nelson 1970; Stigler 1961) has drawn the
attention of researchers in both economics (e.g. Johnson and Myatt 2006; Miller 1984) and
business (e.g. Eckstein and Wolpin 1989; Narayanan and Manchanda 2009) to the role of
uncertainty and learning in the decisions of economic actors. Learning in the context of
economics has generally been defined as “the cognitive or non-cognitive processing of
information signals by economic agents that leads to a direct or latent change in their
economic behavior, or to a change of cognitive pattern that influences future learning
processes” (Brenner 1999). Extant studies have mostly focused on economic agents’ learning
about characteristics of a decision object, such as consumers’ learning about product attribute
levels. A growing body of research shows that choices made by economic agents are not based
on the actual state of affairs, but rather on their beliefs thereof. Moreover, those beliefs are
held with uncertainty which, for risk-avoiding decision makers, will lower the objects’ utility.
This uncertainty, however, can be reduced as agents learn (or increased as agents forget). It is
this phenomenon of learning and, more specifically, how it shapes agents’ beliefs about
objects and agents’ subsequent decisions to adopt (or not to adopt) those objects, that is central
to this thesis.
A common approach to modeling learning in business and economics research is the
Bayesian learning formulation (Erdem and Keane 1996; Miller 1984; Roberts and Urban
2
1988). This formulation specifies how consumers integrate their prior beliefs about objects
with new information signals, using a Bayesian updating rule, and it is often embedded in
purchase incidence or choice models concerning these objects. In quantitative marketing,
Bayesian learning models have been applied in a host of interesting studies that vary in the
agents who learn, in the nature of the objects and dimensions that these agents learn about, and
in the information sources that their learning is based on. While some of these studies have
considered learning by intermediaries or specialists (such as, e.g., Narayanan and Manchanda
2009; or Narayanan et al. 2005 studies on physician learning and drug-prescribing behavior),
most studies focus on consumers. The object of learning is typically brand quality (an
exception being Iyengar et al. 2007, who model consumer learning about their service usage
level) . This learning about brand quality has been modeled for services, such as insurances
(Israel 2005) and online grocery stores (Goettler and Clay 2009), as well as for products, like
pharmaceuticals (Akcura et al. 2004; Camacho et al. 2008; Crawford and Shum 2005;
Janakiraman et al. 2008; Narayanan and Manchanda 2009), ski resorts (Moeltner and Englin
2004) and packaged goods (Ackerberg 2003; Erdem and Keane 1996; Mehta et al. 2004; Shin
et al. 2007). Taken together, these studies have shown that consumers may infer brand quality
from prices (Erdem et al. 2009) and advertising (Ackerberg 2003) or from other forms of
marketing communication, such as pharmaceutical detailing (Narayanan and Manchanda
2009). Most Bayesian learning models in marketing, however, have looked at brand
consumption as the source of information about brand quality. This thesis fits into this
research stream: it focuses on how consumers’ brand consumption experiences allow them to
learn about brand quality, and affect their brand choice behavior.
Extant research in this area has produced relevant insights for both academics and
practitioners. For one, it is shown that consumption-based learning about brand quality is an
important phenomenon that may substantially affect brand performance (choice, adoption)
over time. Second, this learning phenomenon carries implications for the way brands are
managed. In particular, learning is found to influence the payoffs from brand quality
improvements (Mitra and Golder 2006) and product innovation (Narayanan and Manchanda
2009) or – on the negative side – the consequences of product harm crises (Van Heerde et al.
3
2007). Moreover, learning affects the impact of price promotions (Akcura et al. 2004; Erdem
et al. 2008),free samples (Erdem 1998), and umbrella branding (Erdem 1998; Erdem and Sun
2002) – findings that brand managers can put to proper use. With the development of these
insights, however, new questions and challenges have come to the fore.
Consumer learning is expected to be prevalent in ‘turbulent’ markets, that is, when
brands are new to consumers or when they have important new features (Erdem and Keane
1996; Heilman et al. 2000). Indeed, numerous studies document the presence of learning in
such markets, for instance in pharmaceuticals (e.g. Narayanan et al. 2005). However, it has
been shown that learning also takes place in rather stable, mature categories such as ketchup
(Erdem et al. 2008), yogurt (Ackerberg 2003), liquid laundry detergent (Erdem and Keane
1996; Erdem et al. 2004; Mehta et al. 2004), margarine, toilet paper (Erdem et al. 2004),
toothpaste (Erdem 1998; Erdem and Sun 2002; Shin et al. 2007), and toothbrushes (Erdem
1998; Erdem and Sun 2002). The focus in this thesis will be on learning in such consumer
packaged goods.
The evidence of consumer learning in mature contexts suggests of the presence of
quality uncertainty. There are a number of reasons why consumers are not perfectly
knowledgeable about quality of brands. For example numerous consumptions of the same
brand may be required to completely resolve brand quality uncertainty (Darby and Karni
1973; Nelson 1970). This could be, as suggested by Erdem (1998), because the effects of
brand quality may take time or multiple consumptions to materialize, as in the case of teeth
whitening toothpaste. Or, it may be difficult for the consumer to isolate the quality of the
brand from other confounding factors. With toothpaste, for instance, the cavity-fighting ability
of a brand is difficult to assess, as there are many causes for cavities that can develop even if
the toothpaste is relatively effective. Similar arguments can be constructed for other product
categories. Hoch and Deighton (1989) state that “a beer consumer who follows Lowenbrau’s
suggestion that ‘tonight is kind of special’ and serves Lowenbrau, will have difficulty
untangling the effect of the occasion from the effect of the brand.” As another example, the
impact of a detergent on clothing fabric can take time to materialize, and deterioration of the
fabric’s color or durability can be difficult to ascribe to a detergent’s poor quality. But also in
4
food categories, multiple attributes such as a brand’s health impact, storability, or even taste
assessment in different use contexts, can be the subject of ongoing learning.
Furthermore, consumers generally buy and consume products sequentially rather than
simultaneously, hampering effective brand comparisons and therefore learning (Hoch and Ha
1986; Warlop et al. 2005). Posing an additional challenge, the memory of brand quality
deteriorates over time, between consumption and purchase occasions (Mehta et al. 2004;
Warlop et al. 2005). Learning can also persist in mature environments as consumers change
their consumption patterns over the life cycle (Du and Kamakura 2006), and some of their
knowledge may need to be updated or even replaced (Heilman et al. 2000). These examples
suggest that consumers may, indeed, gradually learn about brand quality from their
experiences in packaged goods categories. However, the examples also suggest that the degree
of learning about these products may well vary across consumers and categories – an issue
largely unexplored as of yet, and one that we touch upon in chapter two of this thesis.
It is important to note that the vast majority of studies focus on within-brand learning –
that is, how information pertaining to a particular brand impacts consumer beliefs about that
same brand. There may be instances, however, where one brand’s quality is expected by the
consumer to also carry information about the quality of other brands. This can be the case
when consumers categorize brands into the same “mental category,” or when brands share
certain attributes that are accessible to consumers and perceived to be diagnostic (Janakiraman
et al. 2008). In such a setting, consumers may use new information obtained for one brand,
e.g. based on consumption experiences with that brand, to update their quality beliefs about
the other brand. Such cross-brand learning appears conceptually close to within-brand
spillovers between attributes of the same product (Bradlow et al. 2004), between products of
the same brand within the same category (Balachander and Ghose 2003), and between
products of the same brand in different categories (Erdem 1998; Erdem and Sun 2002). While
the latter are quite well documented, cross-brand learning has not received any attention in the
literature, aside from a recent study by Janakiraman et al. (2008) that looks at learning
between an original drug and its generic version. This is an important gap, as cross-brand
5
spillovers of consumption experiences may have far-reaching brand management
consequences that differ greatly from within-brand learning principles.
The main contributions of this thesis are in the area of cross-brand learning. More
specifically, we study cross-learning in the context of private label (PL) brands for consumer
packaged goods. These brands, which are the retailers’ own brands, as opposed to national
brands (NBs) belonging to manufacturers, have gradually grown in popularity over the last
decades and currently constitute a sizable portion of package goods sold: 16% in the United
States (AC Nielsen 2005), 39.6% in the United Kingdom, 46% in Switzerland (Planet Retail
2007 p.7). Selling own brands allows retailers to cash in larger margins (Ailawadi and Harlam
2004), build power vis-à-vis manufacturers (Ailawadi 2001), and compete more effectively
with hard discounters (Boston Consulting Group 2004). The success of PLs constitutes a
challenge for NBs, which once dominated packaged goods markets (Steenkamp and Dekimpe
1997).
Research on private labels stresses the importance of perceived brand quality in
determining consumer private label usage (Ailawadi et al. 2003a; Dhar and Hoch 1997; Hoch
and Banerji 1993; Steenkamp and Dekimpe 1997). Not only the perceived quality level of
private labels is suggested to play a role, but also the degree of quality uncertainty (Batra and
Sinha 2000; Erdem et al. 2004). While the importance of consumer beliefs about private
labels’ quality is well established, less is known about how consumers build these beliefs,
particularly when it comes to learning processes, which set private labels apart from national
brands.
In this thesis we study two different instances of cross-brand learning involving private
labels. First, we investigate consumption spillovers across private label brands of different
(rival) retailers, which may be perceived by consumers as similar to one another (Ailawadi
2001; Richardson 1997). Second, we explore the nature and impact of consumption-based
cross-learning between leading NBs and copycat PLs that imitate their package design
(Kapferer 1995; Sayman et al. 2002; Scott-Morton and Zettelmeyer 2004).
6
All studies included in the thesis employ a Bayesian learning model. In essence, the
choice model including Bayesian learning is an extension of a traditional brand choice model
featuring brand intercepts, marketing mix variables, and an error term. Traditionally, brand
intercepts are constant over time and capture consumers’ average utility from a brand when
other variables equal zero. In the Bayesian learning model, the intercept is not restricted to be
constant over time. Instead, consistent with information economics theory, the intercept is
argued to capture the evolution of a consumer’s beliefs about the true quality of a brand. The
household’s quality belief, captured by the intercept, is broken down into two parts, one
referring to the level of the quality belief and one capturing the uncertainty in the consumer’s
quality belief. Both of these values evolve over time as consumers learn about true brand
quality and forget earlier acquired knowledge.
In applications allowing for consumer specific true brand quality, like ours, the true
quality of a brand is defined as an aggregate representation of the fit between the positioning
of the brand across brand attributes on the one hand, and the consumer’s preferences on the
other. Thus, it does not equal the “objective quality” about which one could learn for instance
through tests by Consumer Reports. It is consumer specific, and depends on both objective
levels of brand attributes and individual consumer preferences for these attribute levels.
The model allows for learning from brand consumption. Each consumption experience
can provide some information about the brand’s true quality, but this information can be noisy
e.g., as a result of variability in brand quality or of the consumer’s inability to observe quality
during consumption. If learning from consumption is indeed observed, we expect the level of
perceived quality to gradually converge to the (consumer’s) true brand quality, and the
variance of the quality to diminish. The model also allows for consumer forgetting, which
would entail a gradual increase in uncertainty over time. A Bayesian rule is used to reflect
how consumers combine their current knowledge with the new information obtained through
consumption. We describe this model, which has been used in previous literature, in detail in
chapter 2 and our extensions of the model in chapters 3 and 4. In most applications of the
Bayesian learning model, including ours, the researcher does not observe information signals
obtained by the consumer from each consumption experience. Therefore, instead, the
7
researcher specifies a distribution for these consumption signals (typically a normal density) of
which the mean and variance are estimated, and then integrates over a large number of draws
(possible consumption signals) implied by that distribution. Related to this, available scanner
panel data typically only provide information on the timing of purchases, not of consumption
experiences – the implicit assumption being that units will be consumed between one purchase
and the next. In view of this, ‘purchase-based learning’ would be a more accurate description
of what is captured by the model estimates. Still, to avoid confusion, we follow the literature
in adopting the terminology ‘consumption-based learning’, while fully recognizing that our
results – like those in previous research - provide only an approximation of this experience-
based process.
Our main interest in this thesis is in consumers’ over-time (brand choice) reaction to
aspects of retailers’ branding policy, namely: the quality positioning of their PL brand, the
extent to which it is communicated to the consumers as being a private label, and whether or
not it copycats a leading national brand. A challenge when studying these types of problems is
that major shifts in those policies take place only sporadically, if ever. Moreover, if a policy
change takes place (e.g. a brand policy change from copycatting to not copycatting), this often
goes along with other changes (e.g. no longer imitating the national brand requires a change in
the trade dress of the brand). This makes it difficult for the researcher to assess the impact of
policy changes directly, and or to isolate this impact from other, co-occurring changes. Like
previous researchers, we deal with this problem by focusing on variation in behavior of
individual households. We can examine the presence and magnitude of specific consumer-
level brand choice dynamics, which we argue are linked with the brand policies of interest.
Subsequently, using simulations in which some aspects of the brand policies are altered, or
comparing settings/brands for which different policies apply, we get a feel for their effect on
the variables of interest, e.g. brand choice shares. Naturally, the absence of major over-time
policy shifts in our data limits the strength of our conclusions: it requires us to limit our
inferences to smaller changes (e.g. small quality positioning shifts) and/or to be cautious in
making causal statements about the effect of major policy shifts.
8
Applications of Bayesian learning models make different assumptions about whether
consumers maximize current utility, or are forward-looking. Current utility maximization
means that a consumer chooses the brand with the highest expected utility. Forward-looking
implies that consumers optimize their longer-horizon utility and may, for instance, choose
brands strategically in order to learn about their quality and make better choices in the future.
Previous literature suggests that the presence of forward-looking behavior depends on the
context. For instance, Erdem and Keane (1996), having found no difference in predictive
power of a current utility-maximization model and a forward-looking model, conclude that
“forward looking models may be most useful in product categories where there is a substantial
amount of uncertainty and, hence, the expected benefit associated with sampling different
brands in order to learn about them is high”. Given that our applications are for stable, fast
moving consumer goods similar to those used by Erdem and Keane (1996), and given that
accounting for forward-looking would make our already complicated cross-effect models even
more complex, we decided not to include forward looking behavior for reasons of parsimony.
The likely impact of such a restriction is that we do not take explorative purchases into
account and therefore underestimate consumer dynamics. If this holds true, it would imply that
our conclusions on the presence and strength of (cross) learning effects are conservative.
The thesis comprises five chapters. Chapter two is a “warm-up” chapter, which explores
the magnitude and drivers of within-brand learning in a diverse set of packaged goods
categories. This chapter sets the stage by making the reader familiar with the Bayesian
learning model imbedded in a brand choice specification. We calibrate this household-level
brand model in 20 categories of frequently purchase consumer products, and obtain category-
and household-specific posterior estimates of the parameters indicating the extent to which
consumers update their knowledge with new consumption-based information. From a
substantive viewpoint, the chapter sheds some additional light on the prevalence and
magnitude of learning for packaged goods, the variation in learning across categories and
across households, and the underlying learning drivers. We find that learning is present and
significant in almost all categories, yet varies in strength across categories and across
households. Interestingly, we observe very low correlations between households’ learning in
9
different categories, suggesting that consumption-based knowledge updating is not a
household trait. At the same time, we find that learning is negatively associated with variety
seeking, positively linked to perceived category risk and category expensiveness, and more
predominant among consumers with high category purchase frequency – observations that
have face validity.
While chapter two fleshes out a familiar process (within-brand learning) using a well-
established methodology (Bayesian quality-belief updating from same-brand consumption) by
broadening the empirical evidence and exploring its underlying drivers, the main contributions
of the thesis stem from chapters three and four. In these chapters, we focus on a phenomenon
that has not been previously documented – across-brand consumption-based learning – and we
introduce our novel hypotheses and provide empirical evidence using enhanced learning
models. A common thread in these chapters is that consumers use consumption experiences
with one brand to update their quality beliefs about another, and that at least one of the
considered brands is a private label. Apart from these similarities, the chapters deal with very
different realities that present quite different challenges and implications for retailers and
manufacturers.
In chapter three, we study cross-brand learning among PL brands of different retailers.
The study aims to bridge two views of private labels that seem present among academics and
practitioners. One view holds that private labels are a way for retailers to differentiate
themselves from competing chains. The opposite view is that private labels are “non-brands”
(generic products) and that consumers do not differentiate between PLs offered by different
retail chains. Our premise is that consumers learn across PL brands to a certain extent: we
expect such cross-brand learning to be moderated by the perceived similarity between PL
brands in terms of quality, with lower (higher) similarity being associated with weaker
(stronger) cross-brand learning among rival chains’ PLs. Moreover, we expect such cross-
brand learning to evolve over time, as consumers develop more accurate beliefs about the
quality of each PL brand. To test these expectations, we extend the traditional Bayesian
learning model by including cross-brand learning contingent on perceived brand similarity.
We use household scanner data from the liquid dish detergent category wherein we observe

10
consumer brand choices and firm’s marketing variables over time. Given our focus on
consumption-based learning across PLs of different retailers, we focus on consumers who
engage in purchases for this category in at least two chains. We use our model to infer how
these consumers learn about brand quality from consumption, to what extent PL cross-brand
learning takes place and how it depends on the PL brands’ perceived similarity.
Our findings point to substantial cross-brand learning. Its dependence on perceived
similarity is statistically significant, but a managerially meaningful decrease in cross-brand
learning is observed only when brands are perceived to be very different from one another,
that is, more different than the majority of sample households consider these brands to be. Our
counterfactual simulations shed light on the implications of the unveiled cross-brand learning
process. We show that it substantially reduces the potential of PLs to differentiate retailers in
the eyes of multiple store shoppers. At the same time, we discover that PLs involved in cross-
brand learning may gain market share vis-à-vis NBs. This is because learning about one PL
brand from other PL brands reduces its uncertainty and, by doing so, increases its utility.
Taken together, these findings carry an interesting caveat for retailers. If they aim to use their
PLs to differentiate themselves from other chains, they need to set their quality markedly
higher than that of other retailers. However, by doing so, they are likely to forego the benefits
of cross-brand learning in terms of gaining market share from the NBs.
While chapter three considers consumption experience spillovers between PL brands,
the fourth chapter takes a different angle: it deals with learning between a leading NB brand
and a PL imitating its package design, and seeks to elucidate the extent to which the success of
copycat private labels can be ascribed to the imitation strategy. Even though the copycat
phenomenon is widespread, its over-time effects on the imitating brand are unclear, as little
empirical evidence is available on its brand choice consequences, especially in actual choice
settings. Moreover, generalizability of the extant copycat research to private label copycats is
hampered by the fact that most of the present research focuses on “blunt” copies that also
involve imitation of the original’s brand name. The effect of such imitations is driven mostly
by consumer brand confusion (Warlop and Alba 2004). PL copycats, by contrast, are seldom
“blunt” imitations: they carry different names, and, though the trade-dress similarity is
11
apparent, its difference from the copied original is still clearly noticeable. Such an imitation
tactic is unlikely to lead to brand confusion (Warlop and Alba 2004). Yet, it may constitute a
trigger for cross-brand learning. On the one hand, positive consumption experiences with the
imitated national brand may enhance quality beliefs about the copycat PL, and entail a transfer
of market share from the original NB to the copycat. Yet, at the same time, the imitation
strategy can backfire on the retailer. If the quality gap between the original brand and imitating
brand leads to contrast effects, the evaluation of the original brand can increase – the so-called
“rewarding effect” (Zaichkowsky and Simpson 1996). Or, it can make consumers interpret the
package similarity as an attempt on the part of the retailer to mislead them, and produce a
“reactance effect” (Warlop and Alba 2004).
To assess these potential effects of copycatting, we specify a Bayesian learning model
that incorporates both within-brand learning and across-brand learning among the original NB
and the copycat PL brand, and accommodates possible post-consumption reactance or
rewarding behavior. We calibrate the model on data from two product categories, powdered
laundry detergent and liquid dish detergents, in two different chains. Our findings shed light
on whether PL imitations constitute a ‘friend’ for the original NBs (ultimately rewarding the
original brand for being superior in quality and hard to imitate) or a ‘foe’ (stealing market
share by piggy-backing on its quality reputation). We find that the impact of copycatting on a
brand’s choice share is dominated by one-directional learning from the original brand to the
copycat. This results in a reduction of quality uncertainty for the copycat and increases its
choice share among risk-averse consumers. This choice share gain for the copycat mostly
occurs at the expense of the original brand, and persists even after consumers become aware of
the copycat’s true quality – implying that copycat PLs predominantly constitute a ‘foe’ to their
original NB counterparts.
Chapters two, three and four present the detailed underpinnings of these findings. Each
chapter provides a conceptual framework pertaining to the issue at hand, and outlines the data
and model specifics. Each chapter also contains a separate section with managerial
implications. In chapter five, the concluding chapter of this thesis, we integrate the different

12
findings, and place them in a broader perspective. We also point to remaining caveats and to
new research angles to be addressed by future research.
13
2 Consumption-based learning in packaged goods:
An exploratory multi-category study
2.1 Introduction
Traditional consumer behavior models (Pechmann and Ratneshwar 1992; Wright and
Lynch 1995) as well as studies in the field of information economics (Miller 1984; Nelson
1970) argue that consumer choices over time are driven by uncertainty and learning.
Consumption-based learning is expected to prevail in settings with ‘complex decision making’
(Narayanan et al. 2007), and in infrequently purchased, high involvement or strongly evolving
categories such as insurance, pharmaceuticals, or telephone services (Akcura et al. 2004; Israel
2005; Narayanan et al. 2007; Narayanan and Manchanda 2009). However, recent evidence
suggests that consumption-based quality learning can occur beyond these categories. Several
studies report that consumers rely on consumption experiences to update their quality beliefs
and adjust their brand choice in categories like ketchup, liquid laundry detergent, toothpaste
and toothbrushes (Erdem 1998; Erdem et al. 2008; Mehta et al. 2004). From a managerial
perspective, this phenomenon is important as it drives the effectiveness of brand quality
improvements (Mitra and Golder 2006) or breakdowns (Van Heerde et al. 2007) and,
indirectly, influences the impact of price promotions (Akcura et al. 2004; Erdem et al. 2008),
free samples (Erdem 1998), product innovation (Narayanan and Manchanda 2009), and

14
umbrella branding (Erdem 1998; Erdem and Sun 2002). Yet, available evidence on
consumption-based learning in packaged goods is limited to just a few product categories,
raising questions as to when this type of learning prevails. Broader knowledge would assist
managers in their decisions on where and how to introduce strategies and tactics that rely on
consumer learning.
Our study aims to address this knowledge gap. In particular, we are interested in the
following research questions.
- Is consumption-based quality learning prevalent in consumer packaged goods (CPG)
categories? Given that packaged goods categories are typically frequently purchased,
low involvement, and mature categories in which consumers are expected to have
some knowledge of brands, we are curious to see whether the CPG categories where
learning was previously reported are an exception or a rule.
- How strong is learning in specific CPG categories and what are the differences in
learning magnitude across categories? Estimating the amount of learning is important
in judging the economic significance of the effect and, hence, its managerial relevance.
Moreover, identifying categories where consumers learn the most can help
manufacturers and retailers in the design of their marketing programs, by, for instance,
offering more free samples in categories where consumption-based learning is
stronger.
- Do all households learn? How heterogeneous are households in terms of learning
magnitude, and is learning a universal or rather a fringe behavior?
- What are the drivers of consumption-based quality learning? Assessing the category-
or household-related antecedents of this phenomenon not only enhances our
understanding, but also guides managers in targeting their learning-related actions.
To address these questions, we use purchase data from a stable panel of 192 households
in a major retail chain, covering purchases of the top 3 brands in 20 product categories over a
period of 2.5 years. Our approach is similar to that of Nijs et al. (2001) and Bolton (1989) in

15
that, for reasons of tractability, we conduct our analysis into two stages. In the first stage, we
calibrate household-level brand choice models with Bayesian learning in each of these
categories. We then obtain category- and household-specific posterior estimates of the
consumption signal variance parameters, indicating the extent to which consumers update their
knowledge on brand quality with new consumption-based information. Next, we use these
estimates to assess the statistical significance and amount of learning, and establish to what
extent it varies between categories and households. In the second stage, we use regression
analysis to explore the link between the posterior learning parameters and a set of potential
category- and household-related antecedents.
The remainder of the chapter is organized as follows. In the next section, we zoom in on
the first stage of the analysis. We present the data and learning-based choice models, and
report on the magnitude and co-variation of the estimated learning effects across households
and categories. Section 3 then documents the approach and outcomes of the second stage. It
introduces potential learning drivers, and tests their association with the estimated amount of
consumption-based quality updating. Section 4 presents conclusions, discusses managerial
implications, and indicates limitations and suggestions for future research.
2.2 Stage 1: Magnitude of consumption-based learning
In this section we discuss the first stage of our analysis. It is aimed at measuring the
magnitude of consumption-based learning, and at exploring the learning co-variation, across
households and categories.
2.2.1 Data
Our main data source consists of household panel data covering purchases made by a
stable sample of 192 households in a major Dutch retail chain, across twenty product
categories. The categories cover a wide range of items, from both the food and non-food
supermarket sections. Households are selected so as to maximize the overlap across
categories, while maintaining a minimum, yet sufficient, sample size in each category. While
16
this procedure implies that our household sample is not strictly random, it has the important
advantage of allowing for meaningful cross-category comparisons of household behavior,
while ensuring parameter stability in each category. In particular, we focus on households that
made a purchase in at least two categories. From this subgroup, we randomly select 100
households for each category (in categories where fewer than 100 households were left, we
retain all those households in the final sample). Next, all households that are present in one
category are also included in the other categories in which they made purchases. Finally, for
categories with fewer than 100 selected households but where more households are available,
we randomly draw additional households and also include them in all other categories in
which they are present. In all, this final sample covers 43964 purchases across the twenty
categories.
Our data include brand-level information on the quantities bought and the corresponding
prices and promotions in the focal chain, over a period of 2.5 years. In each category, we
consider the top three brands (for similar approaches see Chen and Yang 2007; Dekimpe et al.
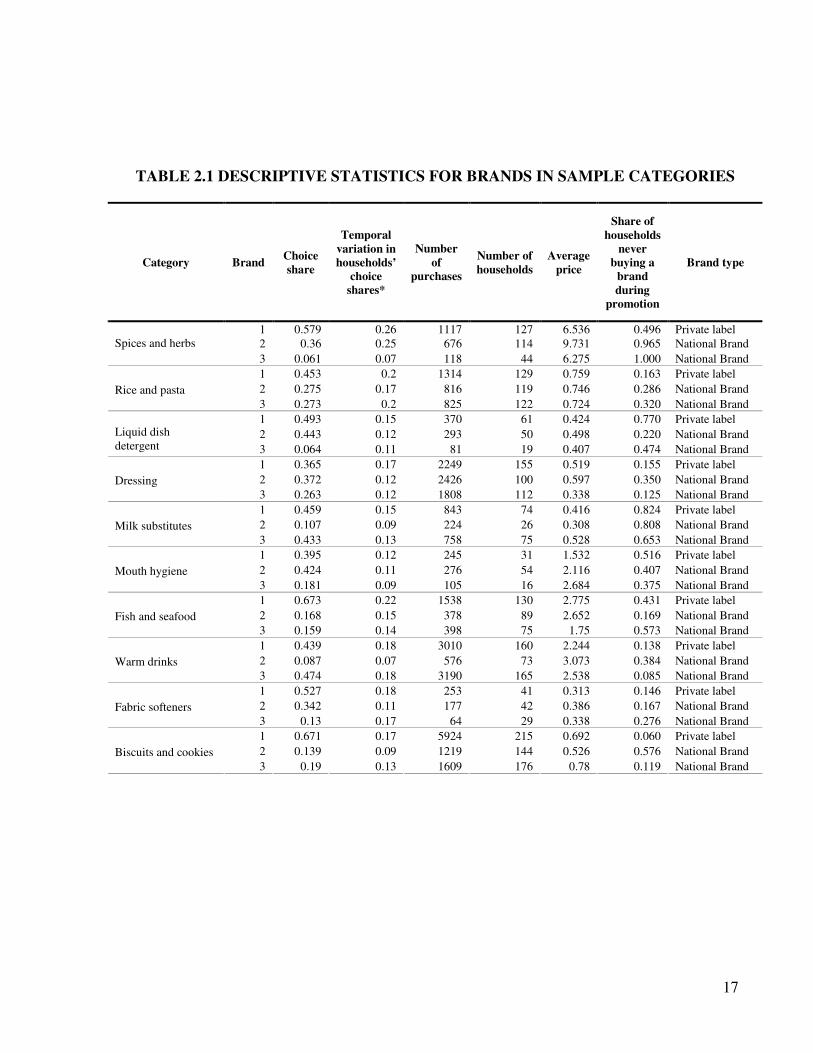
1999; Nijs et al. 2007). Table 2.1 lists our sample categories together with the descriptive
statistics for category brands. It indicates that categories vary in terms of concentration, with
the top 3 brands’ share ranging from 80% in the Vinegar category to 34% in the Liquid
laundry detergent category. The price variation within categories, also, differs considerably,
the highest-to-lowest price ratio ranging from 1.02 for Female hygiene and diapers, to 4.19 in
the Cleaning materials category.
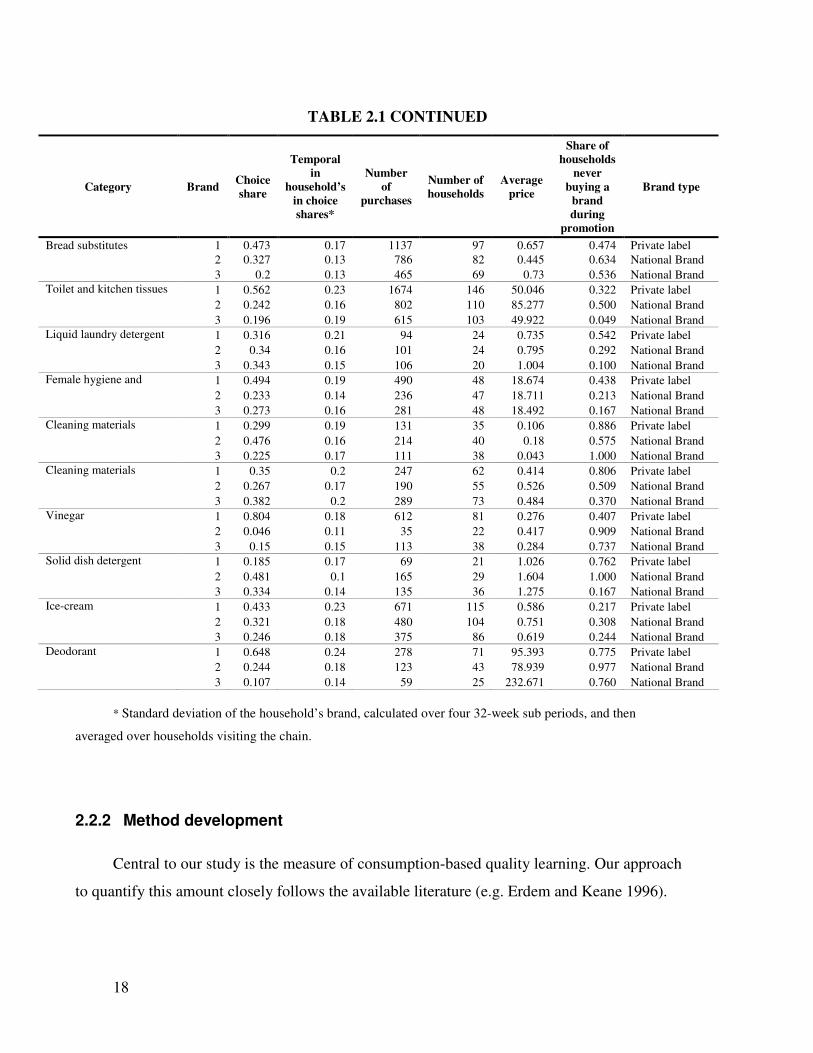
Table 2.1 also sheds light on the temporal variation in household brand choices. To
construct this table, we divide the data into four 32 week-periods, and compute the choice
shares for each brand per household and period. Next, we calculate the over-time standard
deviation of those shares per brand and household. The figures suggest that in most categories,
there are substantial consumer level dynamics, which do not appear to be entirely due to
promotional activity as 47% of households who do buy PLs do not make any PL purchase
during price promotion. The model developed in the next section will shed light on whether
these dynamics are consistent with consumer consumption-based learning.
17
TABLE 2.1 DESCRIPTIVE STATISTICS FOR BRANDS IN SAMPLE CATEGORIES
Category Brand Choice
share
Temporal
variation in
households’
choice
shares*
Number
of
purchases
Number of
households
Average
price
Share of
households
never
buying a
brand
during
promotion
Brand type
1 0.579 0.26 1117 127 6.536 0.496 Private label
2 0.36 0.25 676 114 9.731 0.965 National Brand Spices and herbs
3 0.061 0.07 118 44 6.275 1.000 National Brand
1 0.453 0.2 1314 129 0.759 0.163 Private label
2 0.275 0.17 816 119 0.746 0.286 National Brand Rice and pasta
3 0.273 0.2 825 122 0.724 0.320 National Brand
1 0.493 0.15 370 61 0.424 0.770 Private label
2 0.443 0.12 293 50 0.498 0.220 National Brand
Liquid dish
detergent
3 0.064 0.11 81 19 0.407 0.474 National Brand
1 0.365 0.17 2249 155 0.519 0.155 Private label
2 0.372 0.12 2426 100 0.597 0.350 National Brand Dressing
3 0.263 0.12 1808 112 0.338 0.125 National Brand
1 0.459 0.15 843 74 0.416 0.824 Private label
2 0.107 0.09 224 26 0.308 0.808 National Brand Milk substitutes
3 0.433 0.13 758 75 0.528 0.653 National Brand
1 0.395 0.12 245 31 1.532 0.516 Private label
2 0.424 0.11 276 54 2.116 0.407 National Brand Mouth hygiene
3 0.181 0.09 105 16 2.684 0.375 National Brand
1 0.673 0.22 1538 130 2.775 0.431 Private label
2 0.168 0.15 378 89 2.652 0.169 National Brand Fish and seafood
3 0.159 0.14 398 75 1.75 0.573 National Brand
1 0.439 0.18 3010 160 2.244 0.138 Private label
2 0.087 0.07 576 73 3.073 0.384 National Brand Warm drinks
3 0.474 0.18 3190 165 2.538 0.085 National Brand
1 0.527 0.18 253 41 0.313 0.146 Private label
2 0.342 0.11 177 42 0.386 0.167 National Brand Fabric softeners
3 0.13 0.17 64 29 0.338 0.276 National Brand
1 0.671 0.17 5924 215 0.692 0.060 Private label
2 0.139 0.09 1219 144 0.526 0.576 National Brand Biscuits and cookies
3 0.19 0.13 1609 176 0.78 0.119 National Brand
18
TABLE 2.1 CONTINUED
Category Brand Choice
share
Temporal
in
household’s
in choice
shares*
Number
of
purchases
Number of
households
Average
price
Share of
households
never
buying a
brand
during
promotion
Brand type
Bread substitutes 1 0.473 0.17 1137 97 0.657 0.474 Private label
2 0.327 0.13 786 82 0.445 0.634 National Brand
3 0.2 0.13 465 69 0.73 0.536 National Brand
Toilet and kitchen tissues
1 0.562 0.23 1674 146 50.046 0.322 Private label
2 0.242 0.16 802 110 85.277 0.500 National Brand
3 0.196 0.19 615 103 49.922 0.049 National Brand
Liquid laundry detergent
1 0.316 0.21 94 24 0.735 0.542 Private label
2 0.34 0.16 101 24 0.795 0.292 National Brand
3 0.343 0.15 106 20 1.004 0.100 National Brand
Female hygiene and
diapers 1 0.494 0.19 490 48 18.674 0.438 Private label
2 0.233 0.14 236 47 18.711 0.213 National Brand
3 0.273 0.16 281 48 18.492 0.167 National Brand
Cleaning materials
1 0.299 0.19 131 35 0.106 0.886 Private label
2 0.476 0.16 214 40 0.18 0.575 National Brand
3 0.225 0.17 111 38 0.043 1.000 National Brand
Cleaning materials
1 0.35 0.2 247 62 0.414 0.806 Private label
2 0.267 0.17 190 55 0.526 0.509 National Brand
3 0.382 0.2 289 73 0.484 0.370 National Brand
Vinegar
1 0.804 0.18 612 81 0.276 0.407 Private label
2 0.046 0.11 35 22 0.417 0.909 National Brand
3 0.15 0.15 113 38 0.284 0.737 National Brand
Solid dish detergent
1 0.185 0.17 69 21 1.026 0.762 Private label
2 0.481 0.1 165 29 1.604 1.000 National Brand
3 0.334 0.14 135 36 1.275 0.167 National Brand
Ice-cream
1 0.433 0.23 671 115 0.586 0.217 Private label
2 0.321 0.18 480 104 0.751 0.308 National Brand
3 0.246 0.18 375 86 0.619 0.244 National Brand
Deodorant
1 0.648 0.24 278 71 95.393 0.775 Private label
2 0.244 0.18 123 43 78.939 0.977 National Brand
3 0.107 0.14 59 25 232.671 0.760 National Brand
* Standard deviation of the household’s brand, calculated over four 32-week sub periods, and then
averaged over households visiting the chain.
2.2.2 Method development
Central to our study is the measure of consumption-based quality learning. Our approach
to quantify this amount closely follows the available literature (e.g. Erdem and Keane 1996).
19
One of the parameters in this model, the variance of the consumption signal, reflects the
amount of quality information conveyed by a single ‘consumption experience’ (to be specified
below). This parameter is used as a measure of learning magnitude. Since we estimate a
choice model for each product category and adopt a random effects specification to capture
household heterogeneity, we can use the posterior parameters as household- and category-
specific (Train 2003) measures of the learning magnitude.
Category-specific choice models with Bayesian learning
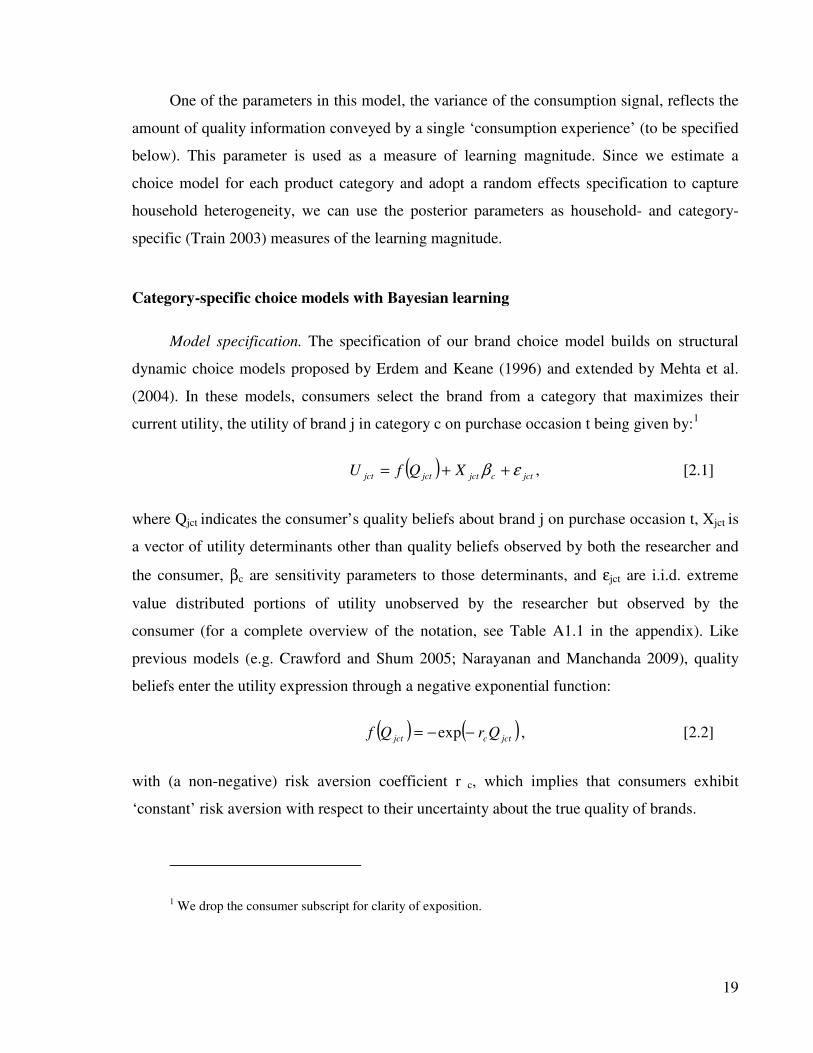
Model specification. The specification of our brand choice model builds on structural
dynamic choice models proposed by Erdem and Keane (1996) and extended by Mehta et al.
(2004). In these models, consumers select the brand from a category that maximizes their
current utility, the utility of brand j in category c on purchase occasion t being given by:1
( ) jctcjctjctjct XQfU εβ ++= , [2.1]
where Qjct indicates the consumer’s quality beliefs about brand j on purchase occasion t, Xjct is
a vector of utility determinants other than quality beliefs observed by both the researcher and
the consumer, βc are sensitivity parameters to those determinants, and εjct are i.i.d. extreme
value distributed portions of utility unobserved by the researcher but observed by the
consumer (for a complete overview of the notation, see Table A1.1 in the appendix). Like
previous models (e.g. Crawford and Shum 2005; Narayanan and Manchanda 2009), quality
beliefs enter the utility expression through a negative exponential function:
( ) ( )jctcjct QrQf −−= exp , [2.2]
with (a non-negative) risk aversion coefficient r c, which implies that consumers exhibit
‘constant’ risk aversion with respect to their uncertainty about the true quality of brands.
1 We drop the consumer subscript for clarity of exposition.
20
Consumers’ quality belief about brand j in category c on purchase occasion t, Qjct, is
normally distributed with mean µjct and variance (or uncertainty) σ jct2. Given the distribution
of Qjct, and using [2,1], we can rewrite the expected utility of brand j in category c on purchase
occasion t as (Narayanan and Manchanda (2009):
[ ] jctcjct
jct
cjctctjct XrrIUE εβσ
µ ++
−−−=
2exp|
2
. [2.3]
where It is the information available to the consumer at time t.
Similar to previous learning models, we assume that consumers do not know brands’
true quality, and we model their learning from consumption. Consumption of each unit of
quantity (e.g. gram) of brand j in category c in period t – 1, provides a new quality experience
g jct, which we assume to be i.i.d. normally distributed with mean equal to the true brand
quality qjc and variance σgc2: g jct~N(q jct, σgc
2). We denote a series of Mct consumption units of
brand j in category c at time t as
=∑
=
ct
gc
jc
ct
M
m
jctm
jctM
qNM
g
G
ct
2
1 ,~σ
.
Consumers’ uncertainty is reduced gradually as they learn, but it can also increase again
due to forgetting (Mehta et al. 2004). In the absence of consumption at t – 1, we expect σjct2
to
increase exponentially,)(2
1
2 1* −−
−= tctcc wwb
jctjct eσσ , where bc is an estimated decay parameter for
category c, and wct – wct-1 refers to the time elapsed between purchase occasions t and t – 1 in
category c.
Like previous studies, we assume that on each occasion t in category c, the consumer
adopts only one brand, such that ∑ =j
cjtd 1, where dcjt = 1 if brand j in category c were chosen
at t and 0 otherwise. We also assume that consumption of the brand bought at t – 1 takes place
right before the purchase in t, such that at the time of the update in t, the consumer has not
forgotten the consumption signals gcjtm.
21
Consumption based learning is modeled using the conventional expression (e.g. de
Groot 1970), consumers’ mean quality belief of brand j in category c on purchase occasion t
(µjct) and the variance of this quality belief ( 2
jctσ ) are then as follows:
1
2
1
)*(2
1
2
1
)*(2
1
1
11
1*
−
−
−
−
−
−
−
−
+∗
+∗
=−−
ct
gc
jct
wwb
jct
ct
gc
jctjct
wwb
jct
jct
jct
M
d
e
M
Gd
e ctctcctct σσσσ
µµ [2.4]
and
1
2
1
)(*2
1
2*1
1
−
−
−
−
+
∗=
−
gc
jctct
wwb
jct
jct
dM
e ctctc σσσ [2.5]
In essence, this new, updated, belief is a weighted sum of the prior quality belief ( 1−jctµ )
and the consumption signal ( jctG ), with weights equal to the prior quality uncertainty ( 21−jctσ )
and the consumption signal variance (σgc2), resp. As we elaborate more extensively below,
σgc2 is a model parameter that captures how much consumption based learning takes place in a
given category (Please note that the subscript g indicates that this is the variance linked to the
consumption signal G. The subscript c, in contrast, reflects that this variance is category-
specific).Like previous studies, we assume that the consumption signal variance, σgc2, is
pooled across brands. It is important to note, however, that this does not imply that the
magnitude of learning is the same for all brands. For instance, brands that are more established
will experience weaker learning, to the extent that consumers’ uncertainty about their
quality, 21−jctσ , is lower than for new, less established brands – thereby placing more weight on
the first term in [2.4].
Capturing the magnitude of learning
22
In the above model, the magnitude of learning is captured by the value of the
consumption signal variance – that is, relative to the uncertainty in brand quality before the
consumption takes place. As implied by Equation [2.4], when the variance of the consumption
signal 2
gcσ is smaller (larger) than the prior brand quality uncertainty 2
1−jctσ , the impact on the
consumer’s quality belief jctµ of a new consumption signal jctg is larger (smaller) than the
impact of the consumer’s prior beliefs. Hence, holding uncertiaty constant, the smaller (larger)
the consumption signal variance, the stronger (weaker) learning from consumption.
For identification, we fix the prior quality uncertainty at time t=0 by setting it equal to 1
(see Erdem and Keane 1996; Mehta et al. 2004). Hence, the estimated value of the
consumption signal variance (relative to this fixed value of one) is going to capture the
magnitude of learning, and therefore constitutes the focal parameter in our study. For
convenience, in the subsequent sections of this chapter we refer to this parameter as the
‘learning parameter’.
An intuitive metric of the learning magnitude, based on this parameter, will be the
weight of the consumption signal in the consumer’s first update of his quality belief. For
instance, when the prior uncertainty and the consumption signal variance are equal (i.e.,
2
gcσ = 20jcσ ), the prior quality belief and the first consumption signal contribute equally (50%
each) to the posterior quality belief – as can be seen in Equation [2.4]. As the consumption
signal variance is larger (smaller), ceteris paribus, the share of the posterior quality belief
based on the consumption experience becomes smaller (larger). Note that over time, as also
indicated by Equation [2.5], consumers’ quality uncertainty decreases as they learn from
consumption whereas the consumption signal variance is constant. Therefore, disregarding
forgetting, the magnitude of learning (i.e., the share of the quality belief based on the new
consumption signal) decreases with each subsequent consumption.
Household differences. We accommodate unobserved household heterogeneity by using
a random effects specification. Using i as a household indicator, the parameters qjc,i and βc,i are
23
normally distributed, while σcg, i, bc,i, and rc,i have lognormal distributions (to ensure positive
values).
Estimation. For identification, in each of the category-specific models we fix the
population mean of the true quality parameter of the first brand to zero, and, as indicated
above, set the uncertainty regarding brand quality at the beginning of the sample period to 1
(i.e., 20cσ = 1). Thus, the parameters of our random effects model are the listed population
means and variances. We estimate the parameters using simulated maximum likelihood. The
appendix 1 provides details pertaining to the log likelihood function and the estimation
procedure (similar to Mehta et al. 2004).
Issues in cross-category comparisons of learning magnitude
Household- and category-specific learning parameters. The outcomes of the category-
specific models allow us to assess the amount of learning for each household and category.
Specifically, based on the estimated mixing distributions of the consumption signal variance
by category, we can obtain a posterior estimate of this consumption signal variance for each
sampled household in that category, following the approach indicated in Train (2003).
Consumption units. Our measure of learning pertains to the precision of the information
contained in one consumption unit. For category comparisons, a crucial question then becomes
how a consumption unit is defined. To enable meaningful cross-category assessments, we
normalize the measurement units such that a category’s ‘consumption unit’ in our model
corresponds to the average purchase volume, across consumers, per purchase occasion in that
category. More specifically, we specify the number of normalized units adopted by the
household in category c at time t as 1
* **( )ct ct cM M M
−−
= where *
ctM is the number of ‘original
units’ adopted by the household in category c at that time (e.g., 500 grams of coffee), and
*
cM−
the average number of original units adopted across all households and purchase occasions
in category c (e.g., 250 grams, such that the normalized number of units becomes ctM =2).
24
Note that in most categories, the normalization constant *
cM−
by and large coincides with a
‘standard’ or most commonly adopted package size. In the second stage of the analysis, we
also control for the fact that this average purchase quantity may last for a different length of
time (that is, cover a different number of average consumption-weeks) in different categories.
We elaborate on this control variable in Section 3.
Comparing estimates across data sets. In logit models estimated on different data sets
the scale of the parameters depends on the variance of the error term in the utility function
(Swait and Louviere 1993). Therefore, direct comparison of estimates across different data
sets confounds the parameter with the scale. This problem can be avoided by comparing ratios
of parameters because the scale cancels out (see e.g. Erdem et al. 2004). In our case, the
consumption signal variance parameter estimates are in fact a ratio of the initial uncertainty
variance (which we fix for identification) and the consumption signal variance, and hence are
comparable across categories.
2.2.3 Results: The amount of consumption-based learning across households
and categories
Below, we first report the estimation results of the category-specific choice models with
Bayesian learning. Next, based on the posterior learning parameters, we analyze the degree of
learning across categories. The last subsection then zooms in on the household level, and
explores whether experience-based quality learning is a household trait.
Estimation results
Model fit. Table A1.2 in the appendix summarizes the fit statistics of the proposed
Bayesian learning model in each category, compared to a benchmark model with no purchase
dynamics. We find that, in each category, incorporation of the Bayesian learning mechanism
into the brand choice model results in an improvement in the AIC and BIC statistics,
suggesting that consumption-based learning about brand quality does take place in these
25
categories (save for the Vinegar and the Dressing categories, where the AIC and BIC
deteriorate slightly).
Learning parameter estimates. To take a closer look at the amount of learning occurring,
we turn our attention to the consumption signal variance parameter, or learning parameter (the
complete set of estimation results, for all categories and variables, can be found in the
appendix, Table A1.3). As the learning parameter is log-normally distributed across
households and this mixing distribution is asymmetric, we focus on the median rather than the
mean as a summary statistic.
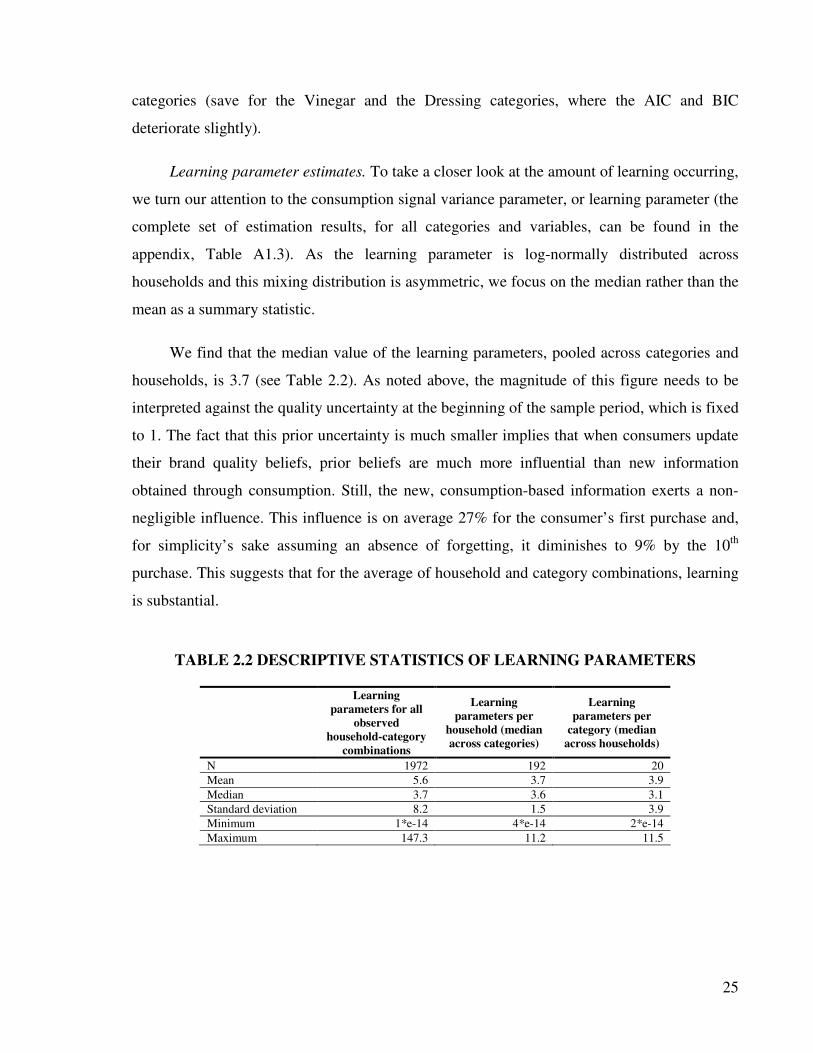
We find that the median value of the learning parameters, pooled across categories and
households, is 3.7 (see Table 2.2). As noted above, the magnitude of this figure needs to be
interpreted against the quality uncertainty at the beginning of the sample period, which is fixed
to 1. The fact that this prior uncertainty is much smaller implies that when consumers update
their brand quality beliefs, prior beliefs are much more influential than new information
obtained through consumption. Still, the new, consumption-based information exerts a non-
negligible influence. This influence is on average 27% for the consumer’s first purchase and,
for simplicity’s sake assuming an absence of forgetting, it diminishes to 9% by the 10th
purchase. This suggests that for the average of household and category combinations, learning
is substantial.
TABLE 2.2 DESCRIPTIVE STATISTICS OF LEARNING PARAMETERS
Learning
parameters for all
observed
household-category
combinations
Learning
parameters per
household (median
across categories)
Learning
parameters per
category (median
across households)
N 1972 192 20
Mean 5.6 3.7 3.9
Median 3.7 3.6 3.1
Standard deviation 8.2 1.5 3.9
Minimum 1*e-14 4*e-14 2*e-14
Maximum 147.3 11.2 11.5
26
Comparing the standard deviation of the category-specific and household-specific
learning parameters (third and fourth columns of Table 2.2), indicates that both dimensions are
characterized by substantial variation. While the variation has the same order of magnitude
(standard deviation of 1.5 and 3.9 respectively), we find more homogeneity in the learning
parameters (standard deviation less than half as large) across categories than across
households.
In which categories is learning most prevalent?
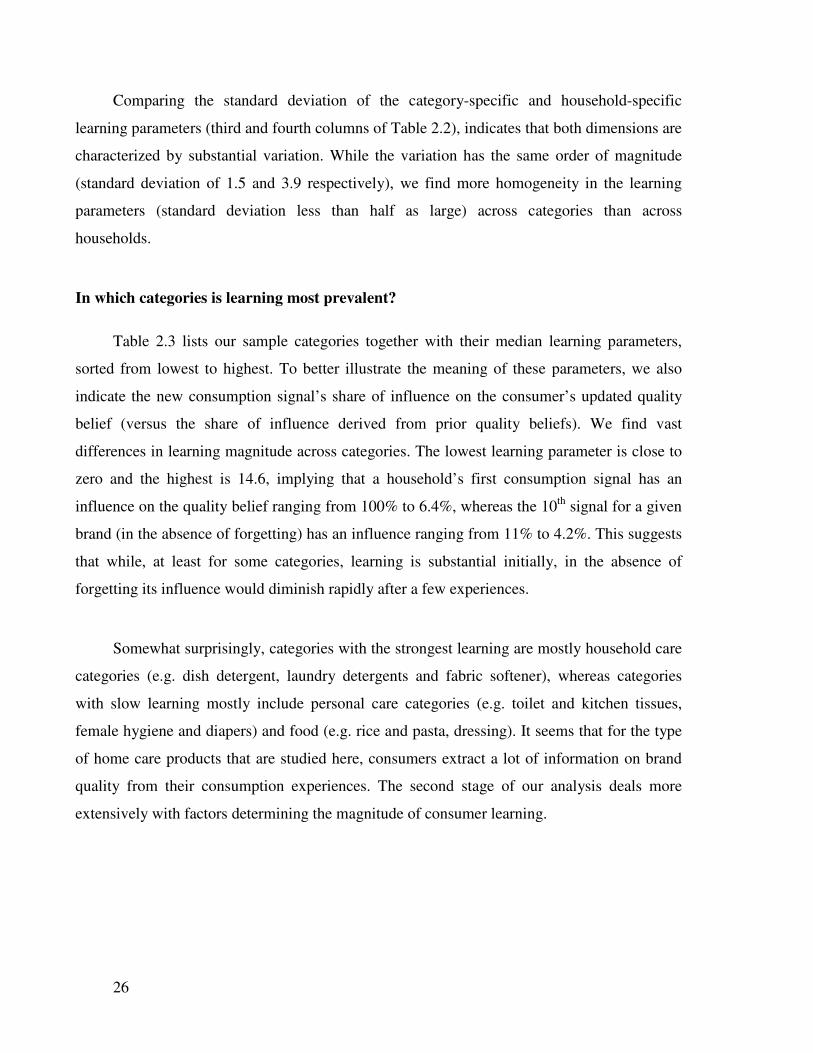
Table 2.3 lists our sample categories together with their median learning parameters,
sorted from lowest to highest. To better illustrate the meaning of these parameters, we also
indicate the new consumption signal’s share of influence on the consumer’s updated quality
belief (versus the share of influence derived from prior quality beliefs). We find vast
differences in learning magnitude across categories. The lowest learning parameter is close to
zero and the highest is 14.6, implying that a household’s first consumption signal has an
influence on the quality belief ranging from 100% to 6.4%, whereas the 10th
signal for a given
brand (in the absence of forgetting) has an influence ranging from 11% to 4.2%. This suggests
that while, at least for some categories, learning is substantial initially, in the absence of
forgetting its influence would diminish rapidly after a few experiences.
Somewhat surprisingly, categories with the strongest learning are mostly household care
categories (e.g. dish detergent, laundry detergents and fabric softener), whereas categories
with slow learning mostly include personal care categories (e.g. toilet and kitchen tissues,
female hygiene and diapers) and food (e.g. rice and pasta, dressing). It seems that for the type
of home care products that are studied here, consumers extract a lot of information on brand
quality from their consumption experiences. The second stage of our analysis deals more
extensively with factors determining the magnitude of consumer learning.
27
TABLE 2.3 COMPARISON OF LEARNING MAGNITUDE ACROSS CATEGORIES
Product category Median learning
parameter
Influence of the first
consumption signal
on quality belief
Influence of the
10th consumption
signal on quality
belief
Solid dish detergent 2.15E-14 100.00% 11.11%
Vinegar 3.54E-14 100.00% 11.11%
Liquid dish detergent 0.002 99.83% 11.11%
Fabric softeners 0.457 68.66% 10.57%
Liquid laundry detergent 0.784 56.05% 10.22%
Mouth hygiene 0.888 52.98% 10.11%
Milk substitutes 1.016 49.61% 9.98%
Biscuits and cookies 1.311 43.27% 9.70%
Cleaning materials 1.695 37.11% 9.35%
Deodorant 2.978 25.14% 8.35%
Fish and seafood 3.814 20.77% 7.80%
Cleaners 3.881 20.49% 7.76%
Ice-cream 4.028 19.89% 7.68%
Spices and herbs 5.288 15.90% 7.00%
Bread substitutes 6.491 13.35% 6.46%
Female hygiene and diapers 8.635 10.38% 5.67%
Warm drinks 9.642 9.40% 5.36%
Dressing 11.631 7.92% 4.85%
Rice and pasta 14.311 6.53% 4.29%
Toilet and kitchen tissues 14.631 6.40% 4.23%
Is learning a household trait?
Table 2.2 indicates that households, overall, tend to differ in their degree of consumption-
based learning. A next question is whether a given household exhibits ‘consistent’ learning
behavior across categories; is there substantial co-variation in households’ learning parameters
for different products? To investigate this, we compute, for each category pair, the correlation
in learning parameters across households that are active in both categories. The resulting
correlation matrix is presented in table A1.4 in the appendix. This matrix shows, for each
category pair, whether households that are relatively strong learners in one category are also
28
strong learners in the other category. Interestingly, we find these correlations to be rather low.
The mean absolute correlation is 0.19 (see Table A1.3 in the appendix). Moreover, out of the
210 correlations, close to half (104) are negative, with the average correlation amounting to
only .005. This indicates that the degree of learning in different categories varies widely from
household to household, and, hence, is not a consumer trait. While it is apparent that there is
no clear clustering of the categories, it seems that food categories and non-food categories
constitute two subgroups with higher within-group, and lower across-group, correlations. This
suggests that some households are strong learners in food categories and others in non-food
categories, with relatively few households that are strong learners for both food and non-food
products. This finding, however, needs to be treated with caution as our category models were
not estimated simultaneously and Ainslie and Rossi (1998) demonstrate that such an approach
leads to underestimation in the cross-category correlations of model parameters.,
A key question for managers is: What drives these category and household differences?
We turn to this topic next.
2.3 Stage 2: Drivers of learning magnitude
In this section, we explore the drivers of consumption-based learning. We first identify
three dimensions along which learning is expected to vary and construct measures that tap into
these dimensions. Next, we discuss the method used for this second stage of our analysis.
Finally, we report on the effect of the learning drivers.2
2.3.1 Drivers of consumption-based quality learning: Data and variables
When selecting the variables to be included in the second stage model, we reflect on
what drives consumers to exhibit stronger consumption-based learning about brand quality.
2 Our choice of a two-step procedure over a one-step procedure is driven by the computational demands of
the latter option: a one-step procedure would require simultaneous estimation of both stages and all 20 category
models, which is infeasible.

29
We expect the dimensions underlying this learning magnitude to be: the level of uncertainty,
the consumers’ incentives to learn, and variety seeking. Below we discuss each of these
dimensions in more detail, and propose variables that tap into them. To make the discussion
more concrete, we start by giving a brief overview of the data sources available to
operationalize the learning antecedents.
Data
We aim to include a number of learning drivers as independent variables in the second
stage model. To operationalize these drivers, we access information from three data sources:
the scanner data and two surveys. The first survey is administered to the panel members by
GfK. This survey records households’ scores on a number of items related to their shopping
behavior, and can be linked with the panel members’ individual purchase histories. The
second survey, by contrast, is administered3 to Dutch consumers who are not members of the
panel, and yields summary measures on a number of category characteristics that do not vary
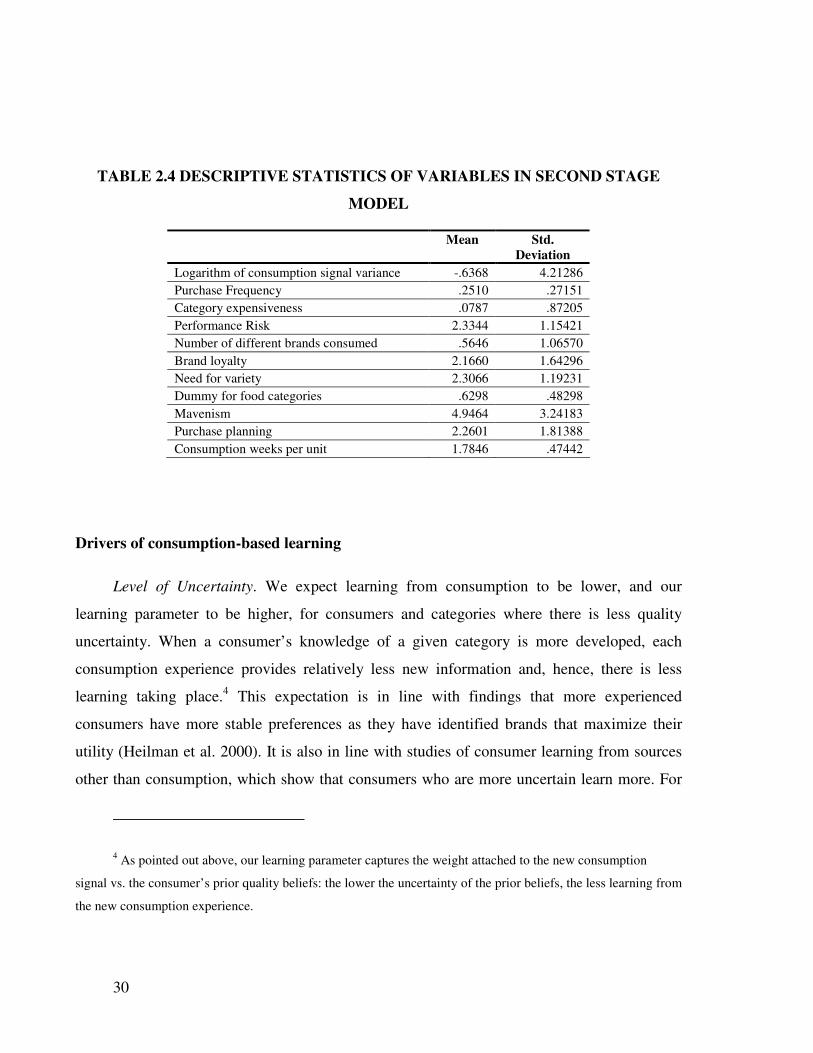
across households or over time. Table 2.4 presents descriptive statistics of the variables
(please see Table 2.5 for detailed variable operationalizations).
3 These data were collected in the context of a “Global Private Label” study by AIMARK. We thank Inge
Geyskens and Jan-Benedict Steenkamp for making part of the information available to us for this research.
30
TABLE 2.4 DESCRIPTIVE STATISTICS OF VARIABLES IN SECOND STAGE
MODEL
Mean Std.
Deviation
Logarithm of consumption signal variance -.6368 4.21286
Purchase Frequency .2510 .27151
Category expensiveness .0787 .87205
Performance Risk 2.3344 1.15421
Number of different brands consumed .5646 1.06570
Brand loyalty 2.1660 1.64296
Need for variety 2.3066 1.19231
Dummy for food categories .6298 .48298
Mavenism 4.9464 3.24183
Purchase planning 2.2601 1.81388
Consumption weeks per unit 1.7846 .47442
Drivers of consumption-based learning
Level of Uncertainty. We expect learning from consumption to be lower, and our
learning parameter to be higher, for consumers and categories where there is less quality
uncertainty. When a consumer’s knowledge of a given category is more developed, each
consumption experience provides relatively less new information and, hence, there is less
learning taking place.4 This expectation is in line with findings that more experienced
consumers have more stable preferences as they have identified brands that maximize their
utility (Heilman et al. 2000). It is also in line with studies of consumer learning from sources
other than consumption, which show that consumers who are more uncertain learn more. For
4 As pointed out above, our learning parameter captures the weight attached to the new consumption
signal vs. the consumer’s prior quality beliefs: the lower the uncertainty of the prior beliefs, the less learning from
the new consumption experience.
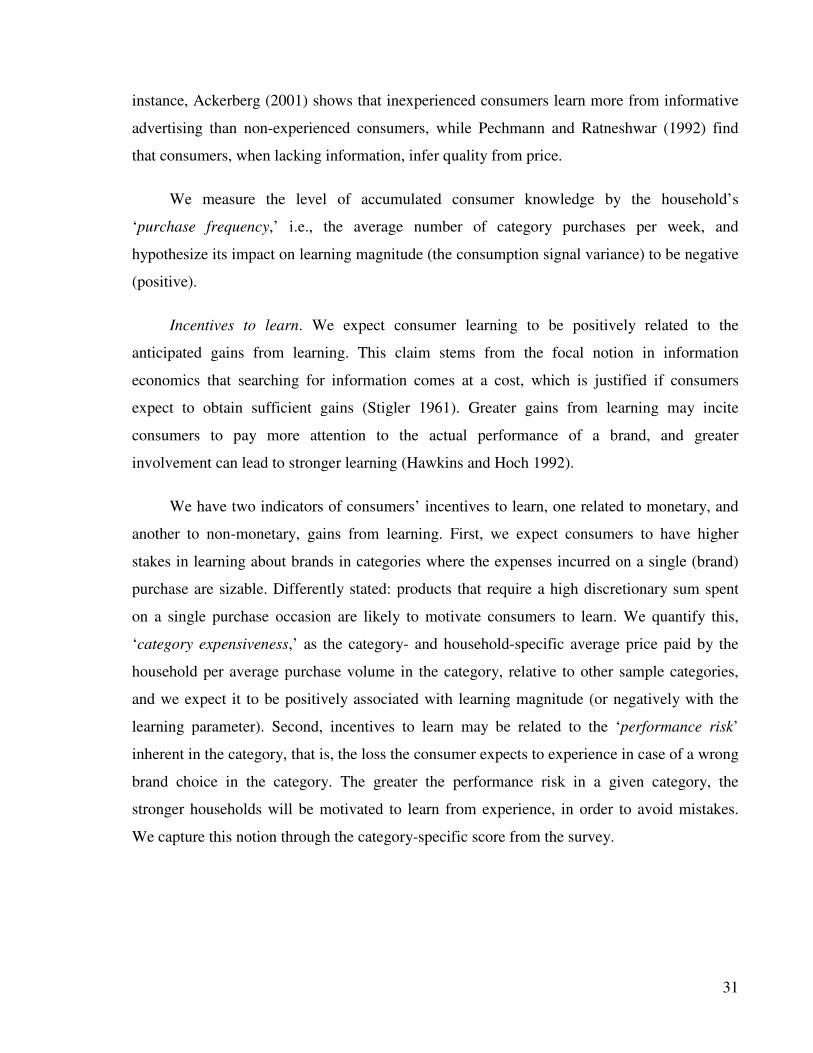
31
instance, Ackerberg (2001) shows that inexperienced consumers learn more from informative
advertising than non-experienced consumers, while Pechmann and Ratneshwar (1992) find
that consumers, when lacking information, infer quality from price.
We measure the level of accumulated consumer knowledge by the household’s
‘purchase frequency,’ i.e., the average number of category purchases per week, and
hypothesize its impact on learning magnitude (the consumption signal variance) to be negative
(positive).
Incentives to learn. We expect consumer learning to be positively related to the
anticipated gains from learning. This claim stems from the focal notion in information
economics that searching for information comes at a cost, which is justified if consumers
expect to obtain sufficient gains (Stigler 1961). Greater gains from learning may incite
consumers to pay more attention to the actual performance of a brand, and greater
involvement can lead to stronger learning (Hawkins and Hoch 1992).
We have two indicators of consumers’ incentives to learn, one related to monetary, and
another to non-monetary, gains from learning. First, we expect consumers to have higher
stakes in learning about brands in categories where the expenses incurred on a single (brand)
purchase are sizable. Differently stated: products that require a high discretionary sum spent
on a single purchase occasion are likely to motivate consumers to learn. We quantify this,
‘category expensiveness,’ as the category- and household-specific average price paid by the
household per average purchase volume in the category, relative to other sample categories,
and we expect it to be positively associated with learning magnitude (or negatively with the
learning parameter). Second, incentives to learn may be related to the ‘performance risk’
inherent in the category, that is, the loss the consumer expects to experience in case of a wrong
brand choice in the category. The greater the performance risk in a given category, the
stronger households will be motivated to learn from experience, in order to avoid mistakes.
We capture this notion through the category-specific score from the survey.
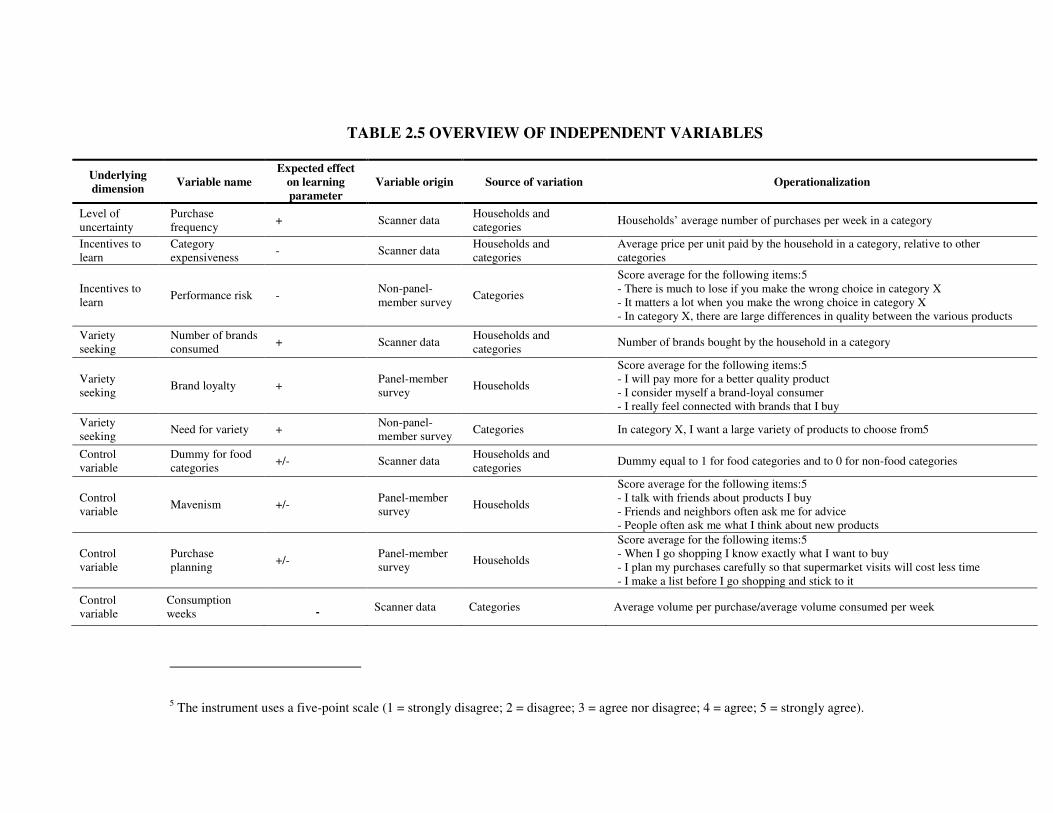
TABLE 2.5 OVERVIEW OF INDEPENDENT VARIABLES
Underlying
dimension Variable name
Expected effect
on learning
parameter
Variable origin Source of variation Operationalization
Level of
uncertainty
Purchase
frequency + Scanner data
Households and
categories Households’ average number of purchases per week in a category
Incentives to
learn
Category
expensiveness - Scanner data
Households and
categories
Average price per unit paid by the household in a category, relative to other
categories
Incentives to
learn Performance risk -
Non-panel-
member survey Categories
Score average for the following items:5
- There is much to lose if you make the wrong choice in category X
- It matters a lot when you make the wrong choice in category X
- In category X, there are large differences in quality between the various products
Variety
seeking
Number of brands
consumed + Scanner data
Households and
categories Number of brands bought by the household in a category
Variety
seeking Brand loyalty +
Panel-member
survey Households
Score average for the following items:5
- I will pay more for a better quality product
- I consider myself a brand-loyal consumer
- I really feel connected with brands that I buy
Variety
seeking Need for variety +
Non-panel-
member survey Categories In category X, I want a large variety of products to choose from5
Control
variable
Dummy for food
categories +/- Scanner data
Households and
categories Dummy equal to 1 for food categories and to 0 for non-food categories
Control
variable Mavenism +/-
Panel-member
survey Households
Score average for the following items:5
- I talk with friends about products I buy
- Friends and neighbors often ask me for advice
- People often ask me what I think about new products
Control
variable
Purchase
planning +/-
Panel-member
survey Households
Score average for the following items:5
- When I go shopping I know exactly what I want to buy
- I plan my purchases carefully so that supermarket visits will cost less time
- I make a list before I go shopping and stick to it
Control
variable
Consumption
weeks - Scanner data Categories Average volume per purchase/average volume consumed per week
5 The instrument uses a five-point scale (1 = strongly disagree; 2 = disagree; 3 = agree nor disagree; 4 = agree; 5 = strongly agree).
33
Variety seeking. Variety seeking is the third dimension we associate with the magnitude
of consumption-based learning. Variety seeking and learning are associated with different
underlying processes and patterns of behavior. While learning is driven by the desire to
maximize the expected quality of brands consumed, variety seeking is associated with the
desire to mitigate boredom and satiation (Gijsbrechts et al. 2000; McAlister and Pessemier
1982). Previous research has documented that consumers with an intrinsic desire for variety in
a given category may be willing to give up quality in return for variety (Kahn and Raju 1991;
Trivedi and Morgan 2003). Therefore, we expect variety seeking consumers to take less
interest in learning about the quality of specific brands and hence learn less. We adopt three
indicators of variety seeking. Our first measure is the ‘number of different brands purchased’
by a household in a given category, which we expect to reduce the amount of learning
(increase the learning parameter). While this behavioral measure has the advantage of being
both household- and category-specific, it does not directly tap into the consumers’ intrinsic
need for variation (but may, for instance, reflect deal proneness or exploratory behavior). Our
second indicator is a consumer characteristic obtained from the panel-member survey data,
and reflects the panel member’s typical degree of ‘brand loyalty,’ or commitment to his/her
favorite brand in different categories. We expect low values of this variable to indicate high
variety seeking and, hence, weak learning. The third variable is a category-specific, survey-
based measure that quantifies the ‘typical need for variety in the category.’ We expect higher
values for this variable to be associated with less learning (and higher learning parameters).
Control variables. Apart from these hypothesized drivers, we include several control
variables. First, we incorporate a dummy variable for food categories to distinguish them from
non-food categories. Next, we include two household characteristics, obtained as summated
scales from the panel-member survey. One of these variables, mavenism, reflects the extent to
which the consumer acts as an opinion leader and shares his/her product information and
experience with other consumers. The other variable captures the consumer’s degree of
purchase planning through, for instance, use of a shopping list. As we expect shopping
34
mavens or planned buyers to be more involved grocery shoppers (who are more eager to
learn), but also more knowledgeable shoppers (who have little left to learn), we offer no
directional hypotheses on their degree of consumption-based learning. Finally, as indicated in
Section 2, our estimated learning parameter reflects the amount of information (or lack
thereof) in one ‘unit’ where a ‘unit’ is resized in each category to reflect average purchase
volume. Yet, these consumption units may represent higher ‘numbers’ of consumption
experiences in some categories – for instance, in easily storable, non-perishable categories –
than in others. For instance, the average purchase volume for coffee may be one 250gr
package, and the average household may consume one such pack per week. For liquid
detergents, the average purchase volume may be a one liter bottle, and the average household
may use up one such bottle every month. To accommodate this, we introduce the variable
consumption weeks per unit, which is defined as the average purchase volume divided by the
average weekly consumption rate in the category across households. Hence, it captures the
number of weeks a typical consumer will get by after adopting the volume equivalent of one
unit. For instance, in our coffee example, the variable ‘consumption weeks per unit’ would
equal 0ne, and for liquid detergents it would equal four. We expect the effect of this variable
on the learning parameter to be negative, with consumers learning more from packs that cover
more consumption-weeks.
Table 2.5 provides an overview of the learning drivers included in the second stage
model, together with the underlying dimensions, and their operationalizations.
2.3.2 Method
As indicated above, the second stage of analysis uses the posterior learning parameters
across households and categories as dependent variables in an exploratory model with the
category- and household-related learning antecedents as independent variables. Given that the
dependent variable (variance of the consumption signal) is constrained to be positive, we
adopt a log-linear specification in the regression model (except for the explanatory variable
consumption weeks per unit, which also enters in log form for reasons specified below). In
35
fact, the logarithm of the learning parameter, our dependent variable in the second stage
regression, is the value that was estimated in the first stage equation.
We employ a hierarchical linear model (HLM) to account for the fact that our data
includes two, naturally distinguishable levels:
ciiiccigci wwDrBDrBDrB 213322112
*** ++++=σ [2.6]
In this expression, 2
gciσ is the posterior estimate of the learning parameter for household
i and category c, based on the stage 1 analysis. B1, B2, and B3 are parameter vectors capturing
the sensitivity of this learning parameter to the variables in matrices Dr1, Dr2, and Dr3 , which
are household-, category-, or household and category specific. w1 is a household-specific error
term such that w1~N(0,δw1), and w2 is a household- and category-specific error.
Since our dependent variable is a posterior of an estimated parameter, with an associated
sampling error that may vary across observations and, this calls for the use of weighting. To
assess the sampling error, we compute for each category and household a range of posterior
values of the learning parameter, using sets of parameters drawn from the multivariate
normal/log-normal mixing distribution obtained from the Bayesian learning models. We then
compute, for each category and household, the standard deviation of the resulting posteriors of
the learning parameter. In each case, the sampling error turns out to be very small, rendering
weighting superfluous.
The second source of potential heteroskedasticity stems from cross-category differences
in the error variance in the second-stage regression. To accommodate this, we first run the
model described in equation [2.6] using maximum likelihood, and then use the estimated error
variances by category to construct the weights (i.e., we use the inverse of the standard
deviation of the model [2.6] error term within categories for a second-round weighted-HLM.
36
2.3.3 Results
Table 2.6 reports the results of the second stage regression. With an adjusted R2 of 33.8
%, the model fit is quite good and, taken together, the learning drivers explain a significant
portion of the learning parameter variation (p<.00). The variance inflation factors in our model
all remain below 6, indicating that we do not have severe collinearity problems.
For interpretation of the results it is important to recall that our dependent variable is a
posterior of the learning parameter (i.e., the consumption signal variance), and that the lower
this parameter, the more learning takes place. Thus, variables associated with negative
coefficients will imply less variance in the consumption signal and more learning. In order to
facilitate the comparison of the effects across variables, we focus on standardized coefficients.
The results support our expectation that consumer learning is associated with incentives
to learn and variety seeking. More specifically, as expected, we find that learning is higher
(β=-.418, p<.01) in categories characterized by high performance risk: consumers are reducing
their level of uncertainty by closely monitoring their consumption experiences in these
categories. In line with expectations, consumption-based learning is stronger in expensive
categories (β= -.086, p<.05) where, again, the stakes for consumers are expected to be higher.
Further, as anticipated, variety seeking tends to reduce the degree of experience-based quality
updating: the learning parameter is significantly higher in categories with a high need for
variety (β=.571, p<.01) and in which the consumer buys many different brands (β=.107,
p<.01). The consumers’ general tendency to be brand loyal, however, proves insignificant. In
all, these findings are in line with previous results that category-specific variety seeking, rather
than variety seeking in general, is a good predictor of consumers’ behavior (Campo 1997).
Surprisingly, contrary to our expectations, consumers update their consumption quality
beliefs more strongly (β= -1.647, p<.01) if they frequently purchase from a category. In
hindsight, the underlying explanation may be that purchase frequency reflects consumers’
stakes in the category (i.e., their incentives to learn) rather than their level of knowledge. It
seems that purchase frequency motivates consumers, despite any extensive category
experience, to closely keep track of the brand’s performance.
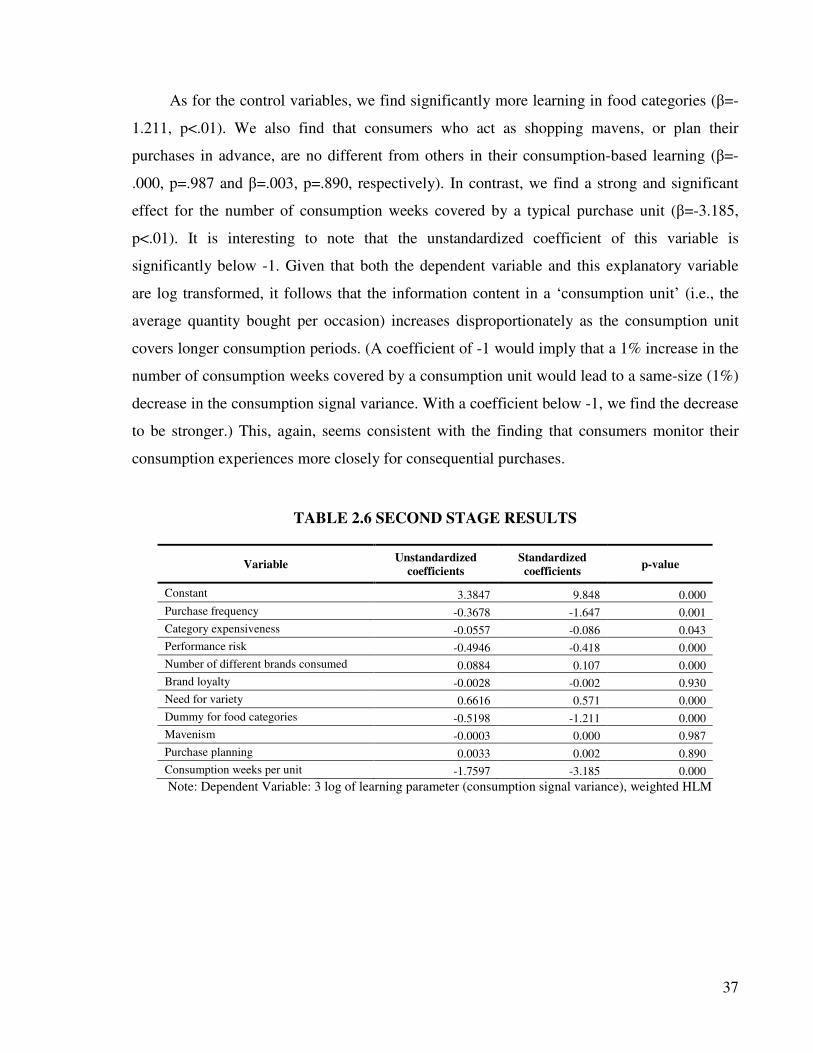
37
As for the control variables, we find significantly more learning in food categories (β=-
1.211, p<.01). We also find that consumers who act as shopping mavens, or plan their
purchases in advance, are no different from others in their consumption-based learning (β=-
.000, p=.987 and β=.003, p=.890, respectively). In contrast, we find a strong and significant
effect for the number of consumption weeks covered by a typical purchase unit (β=-3.185,
p<.01). It is interesting to note that the unstandardized coefficient of this variable is
significantly below -1. Given that both the dependent variable and this explanatory variable
are log transformed, it follows that the information content in a ‘consumption unit’ (i.e., the
average quantity bought per occasion) increases disproportionately as the consumption unit
covers longer consumption periods. (A coefficient of -1 would imply that a 1% increase in the
number of consumption weeks covered by a consumption unit would lead to a same-size (1%)
decrease in the consumption signal variance. With a coefficient below -1, we find the decrease
to be stronger.) This, again, seems consistent with the finding that consumers monitor their
consumption experiences more closely for consequential purchases.
TABLE 2.6 SECOND STAGE RESULTS
Variable Unstandardized
coefficients
Standardized
coefficients p-value
Constant 3.3847 9.848 0.000
Purchase frequency -0.3678 -1.647 0.001
Category expensiveness -0.0557 -0.086 0.043
Performance risk -0.4946 -0.418 0.000
Number of different brands consumed 0.0884 0.107 0.000
Brand loyalty -0.0028 -0.002 0.930
Need for variety 0.6616 0.571 0.000
Dummy for food categories -0.5198 -1.211 0.000
Mavenism -0.0003 0.000 0.987
Purchase planning 0.0033 0.002 0.890
Consumption weeks per unit -1.7597 -3.185 0.000
Note: Dependent Variable: 3 log of learning parameter (consumption signal variance), weighted HLM
38
2.4 Discussion, limitations and future research
Recent empirical findings have already suggested that consumption-based quality
learning not only occurs in infrequently purchased, high involvement or strongly evolving
categories, but also prevails for consumer packaged goods. However, the findings to date were
restricted to only a few categories, which begged the question of generalizability. In this study,
we assess the prevalence of consumer learning across a set of 20 packaged goods categories.
Moreover, we study the co-variation of households’ learning magnitude across these
categories, and investigate household and category characteristics that drive learning.
Findings. Our main findings are as follows.
First, we find some evidence of learning in almost all of the categories: for each of the
considered products, consumers are found to update their beliefs about brand quality based on
their consumption experiences, and this leads to a significant improvement in fit in 18 out of
20 cases. At the same time, the degree of learning does vary substantially across products. For
instance, we find that after a first consumption experience, households range from basing their
quality beliefs entirely on the initial consumption signal in some categories (e.g., dish
detergents) to updating less than 10% of their quality beliefs in others (e.g., rice and pasta). In
some categories, learning is really minimal. This is, for instance, the case for toilet and kitchen
tissue, where only 4.2% of the brand’s quality is influenced by the initial purchase.
Second, we find that households vary in their degree of consumption-based learning; the
across-category variation is more than twice greater than across-household within-category
variation. Interestingly, we observe very low (absolute) correlations in households’ learning
across categories, and the pair-wise correlations are as often negative as they are positive. This
suggests that consumption-based knowledge updating is not predominantly a household trait,
and that households that are strong learners in some categories may be weak learners in others.
Third, our results reveal that both household- and category-related characteristics
significantly affect the degree of consumption-based learning. As expected, consumers attach
more weight to experienced consumption quality in categories with high performance risk.
39
Furthermore, they update their quality beliefs more strongly in categories that they purchase
frequently, and for products where a typical purchase is expensive and/or lasts for several
consumption weeks. Higher ‘stakes’ in these categories mean that households have extra
incentive to learn. Conversely, the need for variation and the tendency to buy multiple brands
detract from consumption-based updating.
Managerial implications. Our findings have several implications for managers. First,
since learning does prevail in many packaged goods, investment in product quality is likely to
have an impact on brand choice that builds up gradually over subsequent consumption
occasions. Conversely, quality deterioration is expected to be particularly detrimental in these
same categories and brands. The size of the impact (both the immediate effect and the impact
after several consumption occasions) varies across categories. Our results suggest that
investments in product improvements are more likely to pay off in categories that are
expensive, that are perceived to have high performance risk, and where variety seeking and
satiation is not much of an issue.
Second, the finding suggesting that the learning magnitude is not a household trait and
that consumers differ in their degree of learning within categories, may be relevant to
managers. The low cross-category correlations in learning magnitude may pose a challenge for
brand extensions: consumers who learned about the original brand may fail to update their
quality beliefs in the extension category. Moreover, consumer heterogeneity suggests that
managers may wish to target their quality improvements to households that learn well. Since
positive consumption experiences are especially impactful with frequent category buyers and
consumers who do not seek variety, managers should focus quality monitoring and investment
on product versions preferred by these consumers – for example, ‘mainstream’ flavors or
varieties, like strawberry jam or regular tea. These products should have upscale positioning
and come in larger packs, unlike the small-sized fringe varieties, like raspberry-coconut tea.
Also, our results seem to imply that true quality improvements do not automatically and
equally present themselves to all product users. In all categories we observe consumers who
do not learn, and marketers need to find ways to reach both learning and non-learning
consumers. For instance, non-learners (e.g., variety seekers, bargain seekers, or small pack
40
buyers) might benefit from extra communications support in order to appreciate true quality
changes.
Limitations and future research
Our study suffers from a number of limitations that open up interesting opportunities for
future research. First, the inclusion of more products would allow exploration of additional
category characteristics of learning – something we could not comfortably achieve with 20
categories under study. Second, the inclusion of more brands than just the top three brands
should increase the generalizablity of the findings. It could also lead us to discover stronger
learning, as top brands are likely to be better known to consumers than less popular brands,
and, therefore, subject to weaker learning. In that sense, we expect our analysis to provide a
conservative estimate of the degree of learning – something to be verified in future studies.
Third, even though our model results are significant, they still leave a sizable portion of
variation unexplained, especially household-category-related variation. Extending the list of
learning drivers by perceptual and attitudinal variables could further improve our ability to
explain when and why households learn from consumption. Our findings of low cross-
category correlation in learning magnitude suggest that variables that are both household- and
category-specific, or interactions of category-specific and household-specific variables, are
most promising in explaining magnitude of consumer learning.
On the methodological side, we imposed the distribution of the learning parameter in
each category to be log-normal. Testing alternative formulations could result in more precise
estimates of the learning parameter. Additionally, simultaneous estimation of the category-
specific Bayesian learning models, in which the learning parameter is a function of learning
drivers, could yield more efficient estimates (Ainslie and Rossi 1998). From a broader
perspective, our measure of learning – as is the case in previous choice models with Bayesian
updating – is an implicit one, since brand quality beliefs are latent and unobserved. Future
research could replicate our study of learning drivers in packaged goods using alternative,
more direct ways of assessing consumer learning and knowledge, for example, laboratory or
natural experiments and surveys. Also, a challenge in our type of learning models for

41
frequently purchased goods is that we seldom observe the start of the consumption history,
which renders estimation of the initial quality beliefs and variances non-trivial. Moreover, we
do not observe consumers’ purchases in all stores where they can purchase the sample brands,
which may bias the learning parameter estimate. A small simulation exercise indicates that the
magnitude of the bias is related with the share of the household’s brand purchases observed:
the greater the share of observed purchases, the smaller the upward bias. The bias is also
greater if unobserved brand purchases take place early in the consumer’s purchase history, a
problem largely mitigated by our use of an initialization period. Studies focusing on new
markets, and new consumers to a market, could facilitate the development and assessment of
methods for estimating prior quality beliefs and the learning magnitude.
Finally, our analysis focused on brand learning only within categories. Analyzing
whether and how consumers update their beliefs about umbrella brands, across categories, is a
challenging topic for future study.

42
43
3 Conditional Cross-Brand Learning: When Are Private
Labels Really Private?
3.1 Introduction
The growth of retailer-owned or private label (PL) brands represents one of the most
notable trends in marketing in recent decades. Private labels constitute 17% of the sales value
of fast moving consumer goods worldwide, including 16% in the United States (AC Nielsen
2005) and more than twice this figure in some European countries (e.g., 39.6% in the United
Kingdom, 46% in Switzerland; Planet Retail 2007 p.7). Accordingly, academic marketing
literature pays close attention to this issue (Ailawadi 2001; Hansen et al. 2006; Hoch 1996;
Steenkamp and Dekimpe 1997), but whereas most PL research relates to competition between
PLs and national brands (NBs) (Cotterill et al. 2000; Du et al. 2005), PLs also may represent
key elements in the context of retail competition (Ailawadi et al. 2008; Hansen and Singh
2008).
Extant research on the latter topic suggests that investments in PL can increase chain
differentiation and loyalty (e.g., Corstjens and Lal 2000) for three reasons. First, unlike NBs,
PLs are often the only chain-exclusive brands offered. Second, retailers have a direct impact
on quality positioning, such that PL investments can differentiate the retailer brand and create
brand loyalty. Third, because retailer brands are chain-specific, brand loyalty initiates chain
loyalty. Both academics (Corstjens and Lal 2000; Marketing News 1987) and leading retail
44
practitioners adopt this line of reasoning; as Ahold’s CEO Anders Moberg (2006) claims,
“With private labels, we can better differentiate ourselves and our brands. We can increase
customer loyalty.” Thus, retailers’ investments in PL quality positioning should be valuable
because they set them apart from the competition.
However, this reasoning assumes that consumers distinguish among different PL brands
and that PL investments allow the retailer to set its PL brand apart favorably. Yet several
indications imply that consumers perceive PLs as homogenous or similar across retailers
(Ailawadi 2001). In an experimental setting, Richardson (1997 p. 393-394) finds that
“consumers perceive no differentiation between the … store brands.” Research on consumer
PL proneness further indicates that both researchers and consumers consider PLs as a group of
similar brands that share common demand drivers across chains (Ailawadi 2001; Bonfrer and
Chintagunta 2004; Burger and Schott 1972), classified within a single mental “PL brand”
category (Ailawadi and Keller 2004). Thus, a retailer’s PL investment may not exclusively
enhance the appeal of its own brand and chain but also may benefit competing PLs.
In sum, literature to date leaves compelling questions unresolved: Do investments in PL
quality positioning increase retailer differentiation or benefit the reputation of all PLs? If all
PLs benefit from investments of one retailer, is this result good or bad for retailers? The core
underlying issue entails the extent to which consumers differentiate among retailers’ PLs or,
conversely, use information about one PL to learn about another, as well as how product
quality positioning may influence this belief. Our study addresses this issue through the
following research questions:
RQ1: Do consumers generalize their knowledge across PL brands, by learning from their
consumption of one PL brand about the quality of other PL brands?
RQ2: What boundary conditions affect cross-brand learning; is it equally strong for all
pairs of PL brands, regardless of their quality positioning?
RQ3: What are the implications of cross-brand learning for PL brands with different
quality positioning levels?
45
We study these questions in a context in which risk-avoiding consumers patronize
multiple chains that offer both NBs and PLs. Consumers choose brands from a product
category in a store on the basis of quality, but they are uncertain about brand quality, and must
seek information from available sources. In such a setting, cross-brand learning among PL
brands (RQ1) has important implications for retail chains, because it would reduce their
potential to differentiate on the basis of their PL offer. If consumers engage in cross-brand
learning, does their learning always occur and to the same extent , or does it exist only if
consumers have limited experience with specific PL brands? Finally, even if these effects
occur, can a PL break away (or be expelled) from the mental category (RQ2)? The answers to
these questions are important for PL quality positioning (RQ3). As quality belief spillovers
become more prevalent, a high-quality positioning should become less appealing, in the sense
that a high-quality PL would subsidize other PLs while suffering from their low-quality
reputation. Yet, for both high- and low-quality PLs, consumption of PLs should make
customers more familiar with the retailer’s own PL and hence reduce perceived purchase risks.
To investigate these issues, we develop a structural brand choice model that features
consumer learning about brands’ quality, based on their consumption experiences with the
brand and with other brands in the same mental category (i.e., PL brands). The dependent
variable is brand choice, given chain choice and category purchase incidence. Our model thus
extends models by Erdem and Keane (1996), Mehta, Rajiv, and Srinivasan (2004) and
Narayanan, Manchanda, and Chintagunta (2005) by including cross-brand learning among PLs
and making this cross-brand learning contingent on both PLs’ specific quality positioning and
the precision of consumers’ knowledge about brand quality. We calibrate the model with a
scanner panel data set of purchases in the liquid dish detergent category over 130 weeks and
across nine retail chains, five of which have their own PL brands.
The remainder of this chapter consists of three main parts. First, we develop our
conceptual framework. Second, we specify a model that captures this process and elaborate on
the empirical analysis and estimation results. Third, we present a series of simulations that
shed more light on the implications of cross-brand learning for PL brands with different
quality positions. We conclude with some limitations and suggestions for further research.
46
3.2 Conceptual Framework: Quality learning across Private Label
brands
Our framework is rooted in literature that recognizes consumers have imperfect
knowledge about product quality and base their brand choice) decisions on perceived rather
than true quality (e.g. Steenkamp 1990; Zeithaml 1988). Such quality beliefs build over time
as consumers learn about brands’ quality from, e.g., consumption, advertising, and prices
(Erdem et al. 2008). Prior consumption of the product provides information for updating
quality beliefs, but in some instances, the consumption of other products that belong to the
same mental category can also offer signals of the focal product’s quality and thus enable
consumers to update their beliefs and reduce uncertainty. We argue that PLs constitute a
mental category, within which such cross-signaling, or cross-learning, takes place; we further
investigate the degree of cross-learning within this mental category.
3.2.1 Private Label Brands as a Mental Category
According to categorization theory, people group objects that share known properties
into categories to facilitate predictions of their unknown properties on the basis of their
category membership (Anderson 1991). This categorization framework is, for instance, widely
applied in marketing to conceptualize ‘umbrella brands’ that span multiple products as mental
categories (e.g., Meyvis and Janiszewski 2004). Various studies show that consumers evaluate
new brand extensions according to their beliefs about the umbrella brand (e.g. Erdem and Sun
2002; Swaminathan et al. 2001). Moreover, people update their beliefs about category
members to maximize the category’s predictive validity (Anderson 1991). Evidence on such
feedback or reciprocal effects emerges from research into brand extensions, which finds that
consumers update their beliefs about a parent brand after experience with extensions of that
brand (e.g. Balachander and Ghose 2003; Loken and John 1993; Swaminathan et al. 2001).
In turn, we contend that consumers may view PL brands as a mental category (separate
from NBs), within which information spillovers are likely. Mental categories are formed for
predictive purposes: categorization is based on a known attribute so the person can predict
47
some other, unknown attribute (Anderson 1991). To be useful as a basis for categorization, an
attribute must meet two criteria: It must be observable by the consumer, and the consumer
must believe it is a valid predictor of unknown attribute. The PL brand attribute meets both
criteria. First, in most cases, consumers can easily identify PL brands. Retailers explicitly
promote PLs as their own, and PLs often carry the name of the retailer (e.g., Tesco, Ahold).
Moreover, PLs typically span a much wider range of product categories than do NBs (Hoch
1996), which provides an additional signal that a given brand is a PL.
Second, as Ailawadi (2001) notes, most PLs lack objective (physical) forms of
differentiation. Retailers procure PLs from manufacturers of undifferentiated goods so that
they may pay lower wholesale prices, whereas NB manufacturers hope to increase
differentiation among brands, decrease price competition, and obtain higher margins.
Therefore, PLs likely are relatively homogenous in terms of objective quality, whereas NBs
are not. More importantly, extensive literature on consumer PL proneness (Ailawadi 2001;
Bonfrer and Chintagunta 2004; Burger and Schott 1972) and consumer brand choice (Baltas et
al. 1997) also suggests that consumers perceive PLs as relatively homogeneous and different
from NBs. The consumer characteristics that suggest they will purchase PLs remain
homogenous across chains (Ailawadi, Neslin, and Gedenk 2001; Bonfrer and Chintagunta
2004). Also, PL buyers hold different beliefs about retail brands’ quality (Ailawadi et al.
2003b; Narasimhan and Wilcox 1998) and risk (Batra and Sinha 2000) compared with NBs.
On the basis of an extensive survey, Richardson, Jain, and Dick (1996) conclude that
consumers maintain separate quality associations for each brand type, and Richardson (1997)
finds in a field experiment that consumers perceive PLs of different retailers to have uniform
quality. This evidence suggests that consumers perceive PLs as a homogenous category,
different from NBs.6 Therefore, PL brands should constitute a separate mental category that is
diagnostic for brand quality evaluation and that leads to possible spillovers of consumption
6 We do not predict the sign of the perceived correlation between PL category membership and quality—
whether PLs or NBs are believed to be better—but rather consider only whether consumers view the quality of
PL brands as similar.
48
signals across category members. Therefore, we expect consumers to use their consumption
experience with a PL brand to update their quality beliefs of other PL brands.
3.2.2 Strength of Cross-Brand Learning Among Private Labels
Mental categorization theory suggests that consumers do not use categories as
unconditional predictors; rather, information spillovers between objects in a category depend
on their attribute similarity (Anderson 1991), so atypical objects may be excluded from the
category (Gurhan-Canli and Maheswaran 1998; McCloskey and Glucksberg 1978). Research
on brand extensions, for instance, shows that beliefs about parent brands are less likely to
generalize to atypical extensions (Aaker and Keller 1990; Boush et al. 1987) and, conversely,
that atypical extensions have a less predominant influence on beliefs about the parent brand
(Loken and John 1993).
Such effects also seem likely for quality learning among PL brands. We contend that the
extent to which consumers use a consumption experience with one PL brand to adjust their
quality beliefs of another PL brand depends on their (current) assessment of these brands’
similarity. Specifically, when quality differences between specific PL brands are larger or
become more apparent (e.g., because of consumers’ more precise consumption-based
knowledge), quality spillovers among brands should diminish.
Our expectations thus imply that PLs represent a homogenous group of products and that
consumers use information obtained through their consumption of any PL brand to build their
knowledge about other PLs and, hence, for the entire PL category. However, over time, as
consumers develop their knowledge about brands’ quality, they may grow convinced that
specific PLs have different quality positions and therefore decide to build their knowledge
about these brands independently, that is, with weaker cross-brand learning.
These expected processes have key implications for PL brands. In particular, cross-brand
learning would lead to reputation spillovers, in which knowledge based on one PL spills over
to others. If the strength of cross-brand learning depends on perceived similarity, as we argue
in H2, so will the magnitude of reputation spillovers. We next develop and estimate a model
49
that captures cross-brand learning, and then use simulations to gauge the magnitude of
reputation spillovers and illustrate the implications for PL brands with different quality
positions.
3.3 Model Development
The brand choice model we develop enables us to verify our expectations. The model
builds on existing structural dynamic choice models with consumer brand quality learning and
forgetting (Erdem and Keane 1996; Mehta et al. 2004; Narayanan et al. 2005) but extends
them by including cross-brand learning (i.e., consumption of one brand leads to updated
beliefs about other brand(s) among PL brands. Moreover, we allow the extent of cross-brand
learning to depend on consumers’ perceived brand-pair similarity, which itself depends on the
PL’s specific quality positioning and consumers’ uncertainty about brands’ quality. Note that
the development of the model without cross brand learning in sections 3.3.1 and 3.3.2 is
completely similar to that in the previous chapter.
3.3.1 Utility in the Presence of Brand Quality Uncertainty and Risk Aversion
We assume that when choosing from a category assortment, consumers pick the brand
that maximizes their (current) utility, which depends on brand quality. We allow the “true
brand quality”7 to be heterogeneous across consumers and assume that true brand quality is
not perfectly known, so consumers’ choices on different purchase occasions rely on their
quality beliefs of different brands at that time. Moreover, in line with prior findings (e.g.,
Erdem and Keane 1996), we assume that consumers are risk averse with respect to their
uncertainty about the true quality of brands.
7 Similar to previous studies (e.g., Erdem and Keane 1996), we assume brands have a “true quality” that
consumers could know if they had perfect knowledge about the brand. Following more recent work (e.g.,Erdem,
Sun, and Keane 2008; Narayanan, Chintagunta, and Manchanda 2005), we allow this quality evaluation with
perfect knowledge to differ across consumers.
50
Specifically, we derive the following expression for the utility of brand j on purchase
occasion t:8
( ) jtjtjtjt XQfU εβ ++= , [3.1]
where Qjt indicates the consumer’s quality beliefs about brand j on purchase occasion t, Xjt
represents a vector of utility determinants other than perceived quality observed by both the
researcher and the consumer, β are parameters capturing sensitivity to those determinants, and
jtε are i.i.d. extreme value distributed portions of utility unobserved by the researcher but
observed by the consumer (for an extensive discussion, see Mehta, Rajiv, and Srinivasan
2004).
The specification of ƒ(Qjt) reflects our specific assumptions about consumers’ risk
aversion. A linear function implies risk neutrality, whereas a nonlinear specification implies
that consumers are not risk neutral. Like previous studies (e.g. Crawford and Shum 2005;
Narayanan and Manchanda 2009), we assume constant absolute risk aversion, which implies
that the disutility of a certain level of quality uncertainty is the same for brands with different
quality levels – an appropriate assumption in the absence of dramatic quality differences
across brands. We capture this aversion by specifying f as a negative exponential function:
( ) ( )jtjt rQQf −−= exp
, [3.2]
where r is a risk aversion coefficient that is greater than 0.
Moreover, the consumers’ quality belief of brand j on purchase occasion t, Qjt, follows a
normal distribution:
( )2,~ jtjtjt NQ σµ
, [3.3]
8 We drop the subscript for consumer for clarity of exposition.
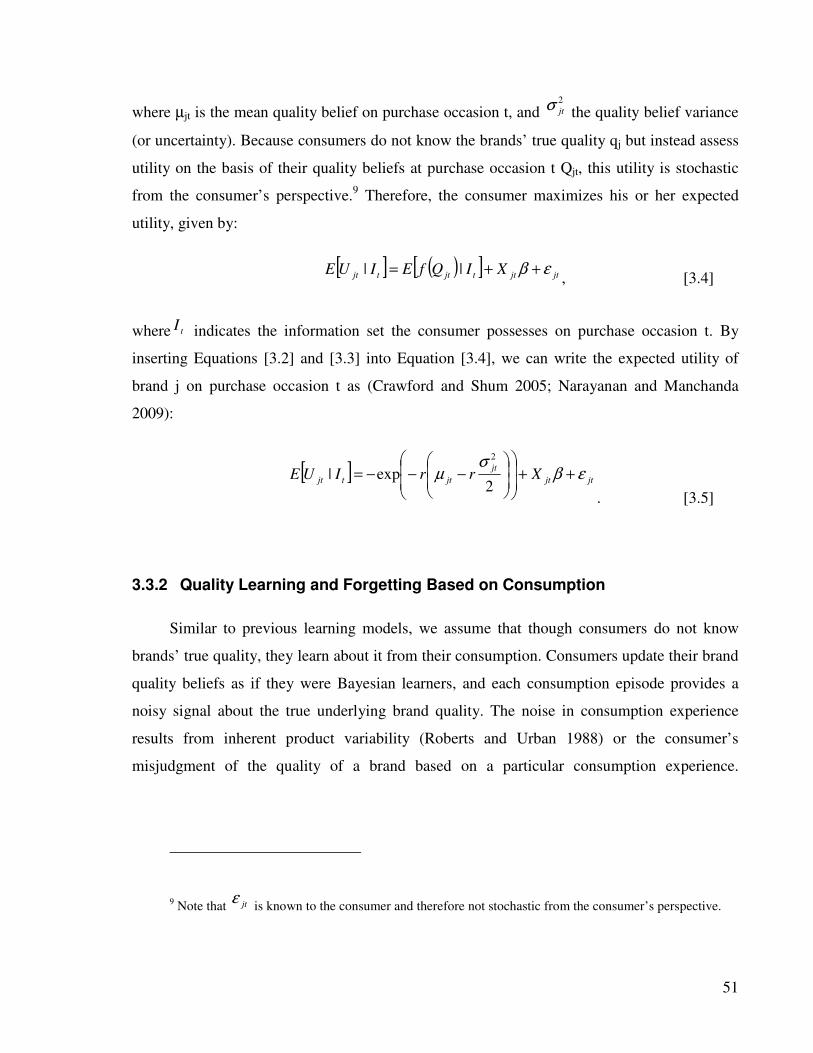
51
where µjt is the mean quality belief on purchase occasion t, and 2
jtσ the quality belief variance
(or uncertainty). Because consumers do not know the brands’ true quality qj but instead assess
utility on the basis of their quality beliefs at purchase occasion t Qjt, this utility is stochastic
from the consumer’s perspective.9 Therefore, the consumer maximizes his or her expected
utility, given by:
[ ] ( )[ ] jtjttjttjt XIQfEIUE εβ ++= ||
, [3.4]
where tI indicates the information set the consumer possesses on purchase occasion t. By
inserting Equations [3.2] and [3.3] into Equation [3.4], we can write the expected utility of
brand j on purchase occasion t as (Crawford and Shum 2005; Narayanan and Manchanda
2009):
[ ] jtjt
jt
jttjt XrrIUE εβσ
µ ++
−−−=
2exp|
2
. [3.5]
3.3.2 Quality Learning and Forgetting Based on Consumption
Similar to previous learning models, we assume that though consumers do not know
brands’ true quality, they learn about it from their consumption. Consumers update their brand
quality beliefs as if they were Bayesian learners, and each consumption episode provides a
noisy signal about the true underlying brand quality. The noise in consumption experience
results from inherent product variability (Roberts and Urban 1988) or the consumer’s
misjudgment of the quality of a brand based on a particular consumption experience.
9 Note that jtε
is known to the consumer and therefore not stochastic from the consumer’s perspective.
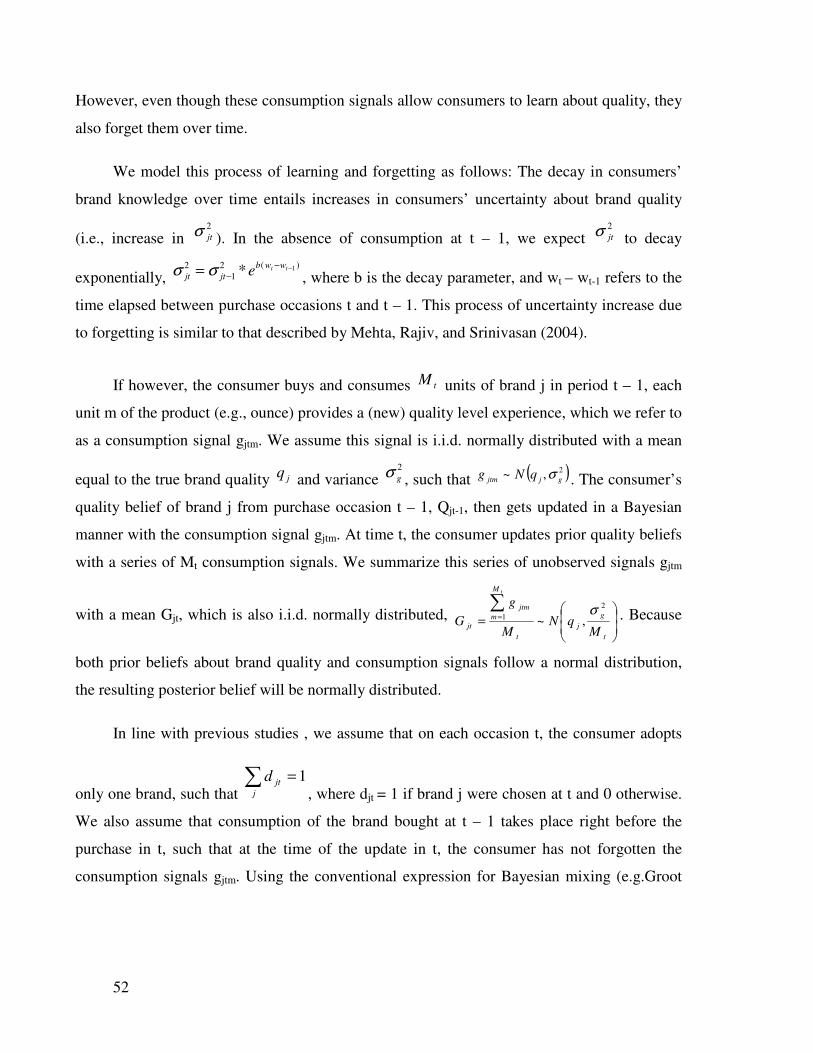
52
However, even though these consumption signals allow consumers to learn about quality, they
also forget them over time.
We model this process of learning and forgetting as follows: The decay in consumers’
brand knowledge over time entails increases in consumers’ uncertainty about brand quality
(i.e., increase in 2
jtσ ). In the absence of consumption at t – 1, we expect 2
jtσ to decay
exponentially, 1( )2 2
1 * t tb w w
jt jt eσ σ −−−= , where b is the decay parameter, and wt – wt-1 refers to the
time elapsed between purchase occasions t and t – 1. This process of uncertainty increase due
to forgetting is similar to that described by Mehta, Rajiv, and Srinivasan (2004).
If however, the consumer buys and consumes tM units of brand j in period t – 1, each
unit m of the product (e.g., ounce) provides a (new) quality level experience, which we refer to
as a consumption signal gjtm. We assume this signal is i.i.d. normally distributed with a mean
equal to the true brand quality jq and variance 2
gσ , such that ( )2,~ gjjtm qNg σ . The consumer’s
quality belief of brand j from purchase occasion t – 1, Qjt-1, then gets updated in a Bayesian
manner with the consumption signal gjtm. At time t, the consumer updates prior quality beliefs
with a series of Mt consumption signals. We summarize this series of unobserved signals gjtm
with a mean Gjt, which is also i.i.d. normally distributed,
=∑
=
t
g
j
t
M
m
jtm
jtM
qNM
g
G
t
2
1 ,~σ . Because
both prior beliefs about brand quality and consumption signals follow a normal distribution,
the resulting posterior belief will be normally distributed.
In line with previous studies , we assume that on each occasion t, the consumer adopts
only one brand, such that ∑ =
j
jtd 1, where djt = 1 if brand j were chosen at t and 0 otherwise.
We also assume that consumption of the brand bought at t – 1 takes place right before the
purchase in t, such that at the time of the update in t, the consumer has not forgotten the
consumption signals gjtm. Using the conventional expression for Bayesian mixing (e.g.Groot
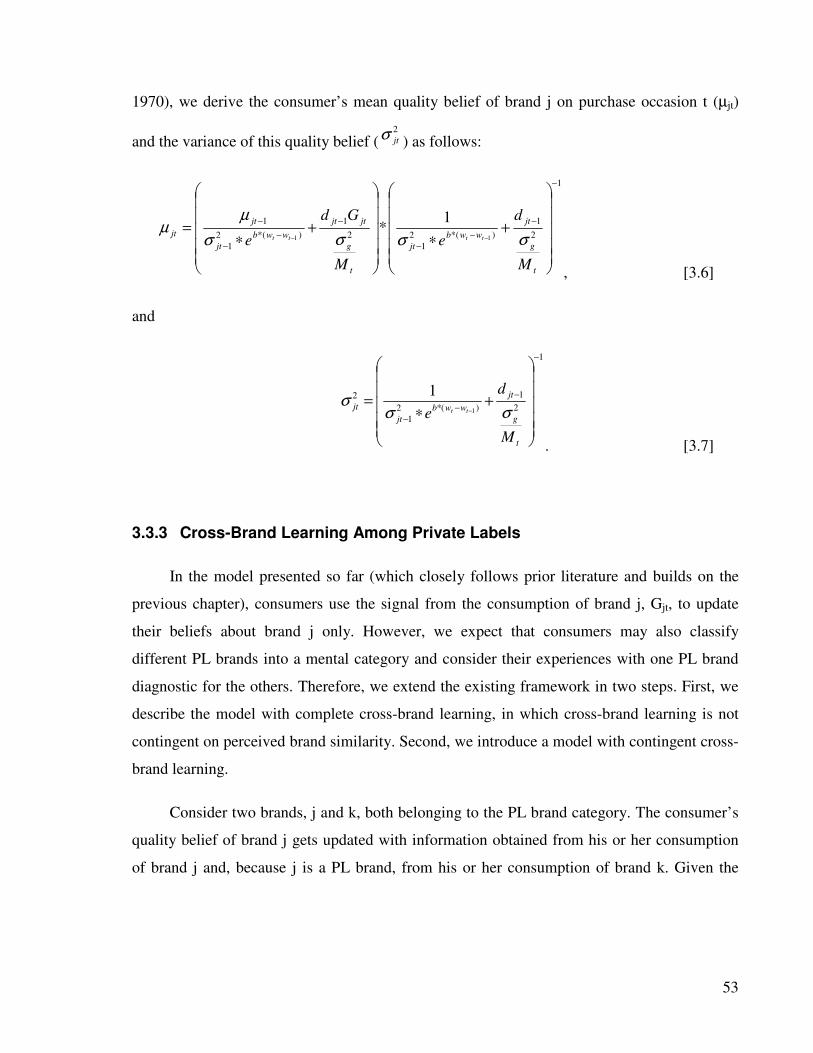
53
1970), we derive the consumer’s mean quality belief of brand j on purchase occasion t (µjt)
and the variance of this quality belief (2
jtσ ) as follows:
1
2
1
)(*2
1
2
1
)(*2
1
1
11
1*
−
−
−
−
−
−
−
−
+∗
+∗
=−−
t
g
jt
wwb
jt
t
g
jtjt
wwb
jt
jt
jt
M
d
e
M
Gd
e tttt σσσσ
µµ
, [3.6]
and
1
2
1
)*(2
1
2
1
1
−
−
−
−
+∗
=−
t
g
jt
wwb
jt
jt
M
d
e tt σσσ
. [3.7]
3.3.3 Cross-Brand Learning Among Private Labels
In the model presented so far (which closely follows prior literature and builds on the
previous chapter), consumers use the signal from the consumption of brand j, Gjt, to update
their beliefs about brand j only. However, we expect that consumers may also classify
different PL brands into a mental category and consider their experiences with one PL brand
diagnostic for the others. Therefore, we extend the existing framework in two steps. First, we
describe the model with complete cross-brand learning, in which cross-brand learning is not
contingent on perceived brand similarity. Second, we introduce a model with contingent cross-
brand learning.
Consider two brands, j and k, both belonging to the PL brand category. The consumer’s
quality belief of brand j gets updated with information obtained from his or her consumption
of brand j and, because j is a PL brand, from his or her consumption of brand k. Given the
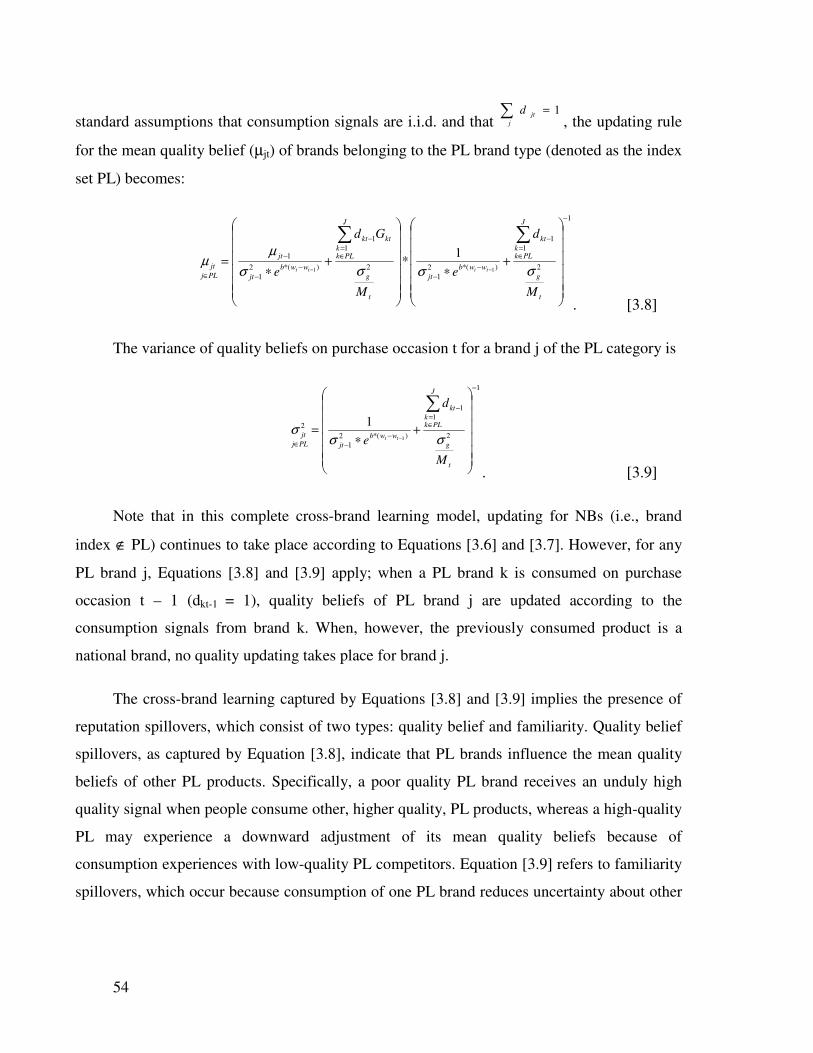
54
standard assumptions that consumption signals are i.i.d. and that ∑ =
j
jtd 1, the updating rule
for the mean quality belief (µjt) of brands belonging to the PL brand type (denoted as the index
set PL) becomes:
1
2
1
1
)(*2
1
2
1
1
)(*2
1
1
11
1*
−
∈=
−
−
−
∈=
−
−
−
−
∈
+∗
+∗
=
∑∑
−−
t
g
J
PLkk
kt
wwb
jt
t
g
J
PLkk
ktkt
wwb
jt
jt
PLj
jt
M
d
e
M
Gd
e tttt σσσσ
µµ
. [3.8]
The variance of quality beliefs on purchase occasion t for a brand j of the PL category is
1
2
1
1
)(*2
1
2
1
1
−
∈=
−
−−∈
+∗
=
∑
−
t
g
J
PLkk
kt
wwb
jtPLj
jt
M
d
e tt σσσ
. [3.9]
Note that in this complete cross-brand learning model, updating for NBs (i.e., brand
index ∉ PL) continues to take place according to Equations [3.6] and [3.7]. However, for any
PL brand j, Equations [3.8] and [3.9] apply; when a PL brand k is consumed on purchase
occasion t – 1 (dkt-1 = 1), quality beliefs of PL brand j are updated according to the
consumption signals from brand k. When, however, the previously consumed product is a
national brand, no quality updating takes place for brand j.
The cross-brand learning captured by Equations [3.8] and [3.9] implies the presence of
reputation spillovers, which consist of two types: quality belief and familiarity. Quality belief
spillovers, as captured by Equation [3.8], indicate that PL brands influence the mean quality
beliefs of other PL products. Specifically, a poor quality PL brand receives an unduly high
quality signal when people consume other, higher quality, PL products, whereas a high-quality
PL may experience a downward adjustment of its mean quality beliefs because of
consumption experiences with low-quality PL competitors. Equation [3.9] refers to familiarity
spillovers, which occur because consumption of one PL brand reduces uncertainty about other
55
brands in the PL brand category and, as a result of risk aversion, increases their expected
utility. An important difference marks the two types of reputation spillovers: Whereas quality
belief spillovers can lead to an increase or decrease in the expected utility of the receiving
brands, familiarity spillovers always lead to utility improvements. Based on our estimation
results, we will develop further simulations to illustrate the implications of these two types of
reputation spillovers for PL brands with different quality positions.
3.3.4 Strength of Cross-Brand Learning Among Private Labels
The specification outlined above represents an extreme case that implies consumers
consider their consumption of any PL equally diagnostic for the quality of all PL brands.
However, consumers may be uncertain whether cross-signals are indeed diagnostic. Moreover,
the beliefs of the degree of diagnosticity may vary across PL brand pairs and purchase
occasions.
Therefore, we further extend the model described by Equations [3.8] and [3.9] by
allowing consumers to update their beliefs of diagnosticity of the cross-signals and adjust their
learning process. Specifically, the amount of cross-brand learning now depends on the
consumer’s belief that consumption of PL brand j provides an unbiased signal about the
quality of another PL brand k. To this end, we introduce a weighting function Pjkt that reflects
consumers’ beliefs of the probability that gjtm is an unbiased signal of the quality of brand k.
The revised expression for jtµ then becomes:

56
( )
( )
∈
=
−+
+∗
+∗
∉
≠
+∗
+∗
=
∑ ∑
∑
∈= ∈
=−
−
−
−
−
−
−
−
−
∈=
−
−
−
−
−
−
−
−
−
−−
−−
J
PLkk
J
PLkk
kt
jtjkt
t
g
wwb
jt
t
g
kt
wwb
jt
jt
jkt
kt
J
PLkk
kt
t
g
jt
wwb
jt
t
g
jtjt
wwb
jt
jt
jt
PLj
d
P
M
e
M
G
eP
d
PLj
d
M
d
e
M
Gd
e
tttt
tttt
1
1
1
1
1
2)(*2
1
2)(*2
1
1
1
1
1
1
2
1
)(*2
1
2
1
)(*2
1
1
and
1both if
1
11*
ifand/or
1 if 1
*
11
11
µ
σσσσ
µ
σσσσ
µ
µ
[3.10]
Note that the top part of Equation [3.10] is valid when brand j is not a PL or if the
consumer purchases a NB on the previous purchase occasion. In these cases, updating
continues to take place as it would in a model without cross-brand learning. In all other
situations, the bottom part of Equation [3.10] applies. This expression is a weighted average of
Equations [3.6] (no cross-brand learning among PLs) and [3.8] (complete cross-brand learning
among PLs).
The updated variance of brand j’s quality belief in t therefore becomes (see Appendix 2):
( )
( )
∈=
∗−+
+∗
−
∉≠
+∗
=
∑ ∑
∑
∈=
∈=
−
−−
−
−−−
∈=
−
−
−
−−
−
−
−
J
PLkk
J
PLkk
kt
wwb
jtjkt
t
g
wwb
jt
jktjkt
kt
J
PLkk
kt
t
g
jt
wwb
jt
jt
PLjd
eP
M
ePP
d
PLjd
M
d
e
tt
tt
tt
1 1
1
)(*2
1
2
1
2)(*2
1
2
1
1
1
1
2
1
)(*2
1
2
and 1both if
*1
112
ifand/or 1 if 1
1
1
1
σ
σσ
σσ
σ
[3.11]
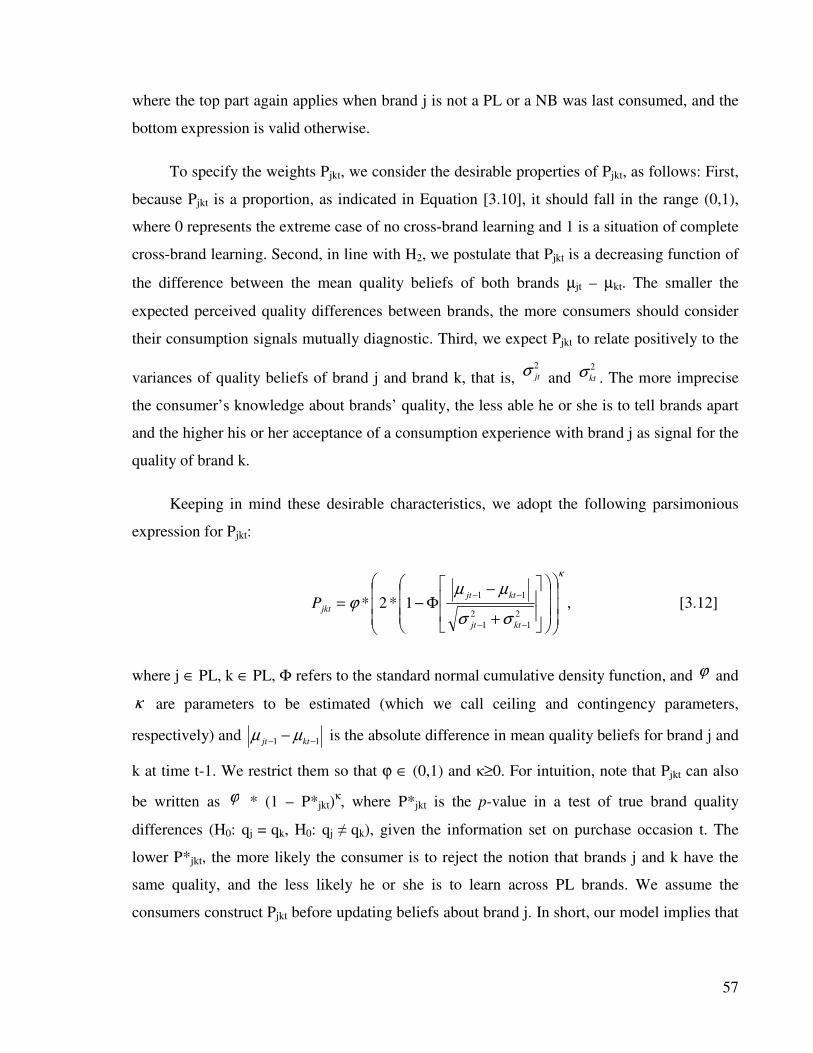
57
where the top part again applies when brand j is not a PL or a NB was last consumed, and the
bottom expression is valid otherwise.
To specify the weights Pjkt, we consider the desirable properties of Pjkt, as follows: First,
because Pjkt is a proportion, as indicated in Equation [3.10], it should fall in the range (0,1),
where 0 represents the extreme case of no cross-brand learning and 1 is a situation of complete
cross-brand learning. Second, in line with H2, we postulate that Pjkt is a decreasing function of
the difference between the mean quality beliefs of both brands µjt – µkt. The smaller the
expected perceived quality differences between brands, the more consumers should consider
their consumption signals mutually diagnostic. Third, we expect Pjkt to relate positively to the
variances of quality beliefs of brand j and brand k, that is, 2
jtσ and 2
ktσ . The more imprecise
the consumer’s knowledge about brands’ quality, the less able he or she is to tell brands apart
and the higher his or her acceptance of a consumption experience with brand j as signal for the
quality of brand k.
Keeping in mind these desirable characteristics, we adopt the following parsimonious
expression for Pjkt:
κ
σσ
µµϕ
+
−Φ−=
−−
−−
2
1
2
1
111*2*
ktjt
ktjt
jktP , [3.12]
where j ∈ PL, k ∈ PL, Φ refers to the standard normal cumulative density function, and ϕ and
κ are parameters to be estimated (which we call ceiling and contingency parameters,
respectively) and 11 −− − ktjt µµ is the absolute difference in mean quality beliefs for brand j and
k at time t-1. We restrict them so that ϕ ∈ (0,1) and κ≥0. For intuition, note that Pjkt can also
be written as ϕ * (1 – P*jkt)κ, where P*jkt is the p-value in a test of true brand quality
differences (H0: qj = qk, H0: qj ≠ qk), given the information set on purchase occasion t. The
lower P*jkt, the more likely the consumer is to reject the notion that brands j and k have the
same quality, and the less likely he or she is to learn across PL brands. We assume the
consumers construct Pjkt before updating beliefs about brand j. In short, our model implies that
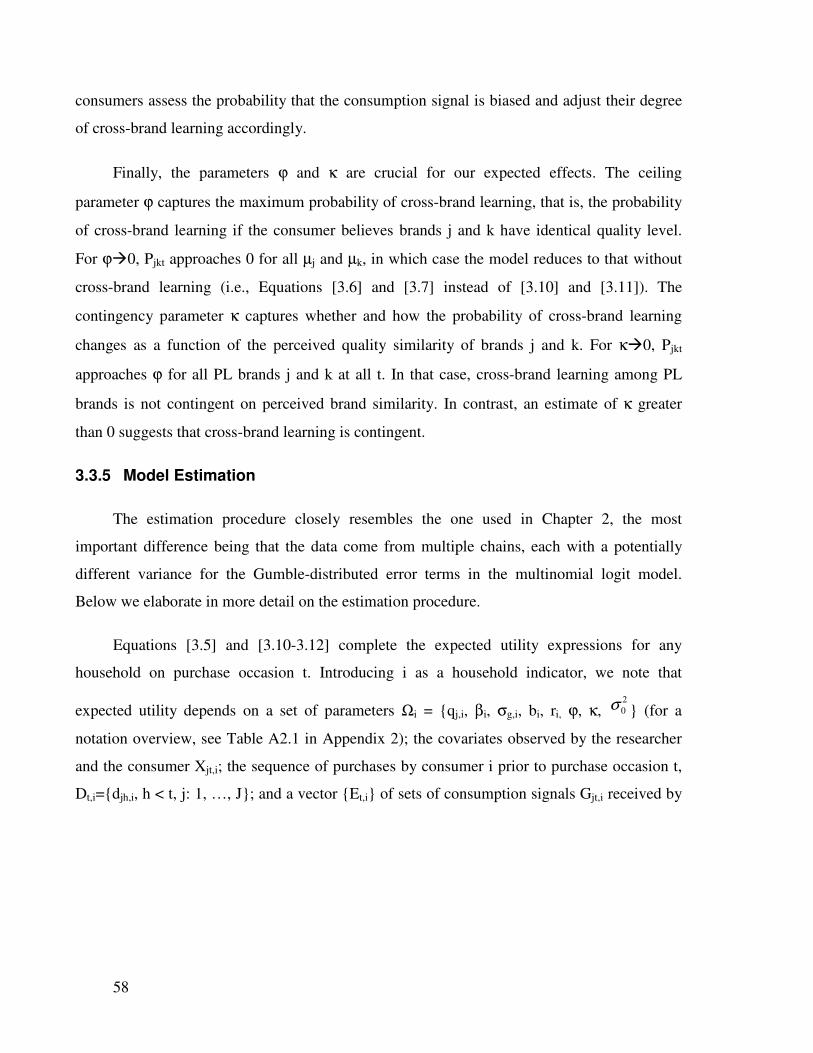
58
consumers assess the probability that the consumption signal is biased and adjust their degree
of cross-brand learning accordingly.
Finally, the parameters ϕ and κ are crucial for our expected effects. The ceiling
parameter ϕ captures the maximum probability of cross-brand learning, that is, the probability
of cross-brand learning if the consumer believes brands j and k have identical quality level.
For ϕ0, Pjkt approaches 0 for all µj and µk, in which case the model reduces to that without
cross-brand learning (i.e., Equations [3.6] and [3.7] instead of [3.10] and [3.11]). The
contingency parameter κ captures whether and how the probability of cross-brand learning
changes as a function of the perceived quality similarity of brands j and k. For κ0, Pjkt
approaches ϕ for all PL brands j and k at all t. In that case, cross-brand learning among PL
brands is not contingent on perceived brand similarity. In contrast, an estimate of κ greater
than 0 suggests that cross-brand learning is contingent.
3.3.5 Model Estimation
The estimation procedure closely resembles the one used in Chapter 2, the most
important difference being that the data come from multiple chains, each with a potentially
different variance for the Gumble-distributed error terms in the multinomial logit model.
Below we elaborate in more detail on the estimation procedure.
Equations [3.5] and [3.10-3.12] complete the expected utility expressions for any
household on purchase occasion t. Introducing i as a household indicator, we note that
expected utility depends on a set of parameters Ωi = qj,i, βi, σg,i, bi, ri, ϕ, κ, 2
0σ (for a
notation overview, see Table A2.1 in Appendix 2); the covariates observed by the researcher
and the consumer Xjt,i; the sequence of purchases by consumer i prior to purchase occasion t,
Dt,i=djh,i, h < t, j: 1, …, J; and a vector Et,i of sets of consumption signals Gjt,i received by
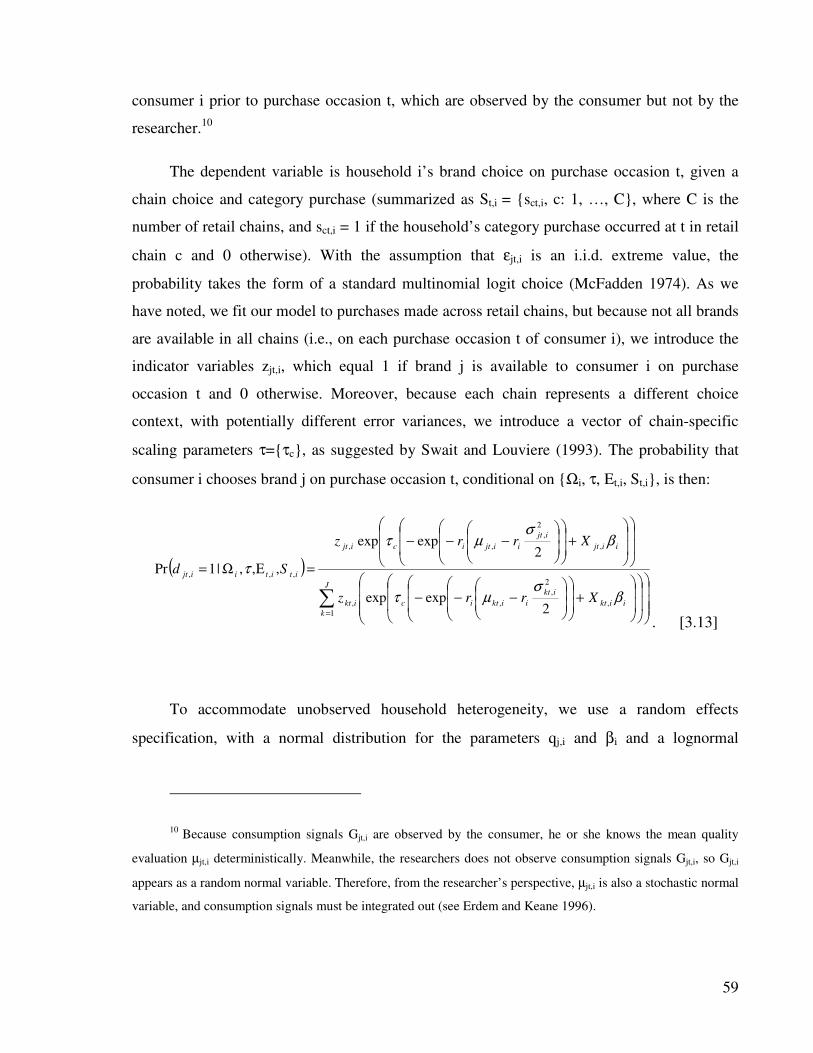
59
consumer i prior to purchase occasion t, which are observed by the consumer but not by the
researcher.10
The dependent variable is household i’s brand choice on purchase occasion t, given a
chain choice and category purchase (summarized as St,i = sct,i, c: 1, …, C, where C is the
number of retail chains, and sct,i = 1 if the household’s category purchase occurred at t in retail
chain c and 0 otherwise). With the assumption that εjt,i is an i.i.d. extreme value, the
probability takes the form of a standard multinomial logit choice (McFadden 1974). As we
have noted, we fit our model to purchases made across retail chains, but because not all brands
are available in all chains (i.e., on each purchase occasion t of consumer i), we introduce the
indicator variables zjt,i, which equal 1 if brand j is available to consumer i on purchase
occasion t and 0 otherwise. Moreover, because each chain represents a different choice
context, with potentially different error variances, we introduce a vector of chain-specific
scaling parameters τ=τc, as suggested by Swait and Louviere (1993). The probability that
consumer i chooses brand j on purchase occasion t, conditional on Ωi, τ, Et,i, St,i, is then:
( )
∑=
+
−−−
+
−−−
=ΕΩ=J
k
iikt
ikt
iikticikt
iijt
ijt
iijticijt
ititiijt
Xrrz
Xrrz
Sd
1
,
2
,
,,
,
2
,
,,
,,,
2expexp
2expexp
,,,|1Pr
βσ
µτ
βσ
µτ
τ
. [3.13]
To accommodate unobserved household heterogeneity, we use a random effects
specification, with a normal distribution for the parameters qj,i and βi and a lognormal
10 Because consumption signals Gjt,i are observed by the consumer, he or she knows the mean quality
evaluation µjt,i deterministically. Meanwhile, the researchers does not observe consumption signals Gjt,i, so Gjt,i
appears as a random normal variable. Therefore, from the researcher’s perspective, µjt,i is also a stochastic normal
variable, and consumption signals must be integrated out (see Erdem and Keane 1996).
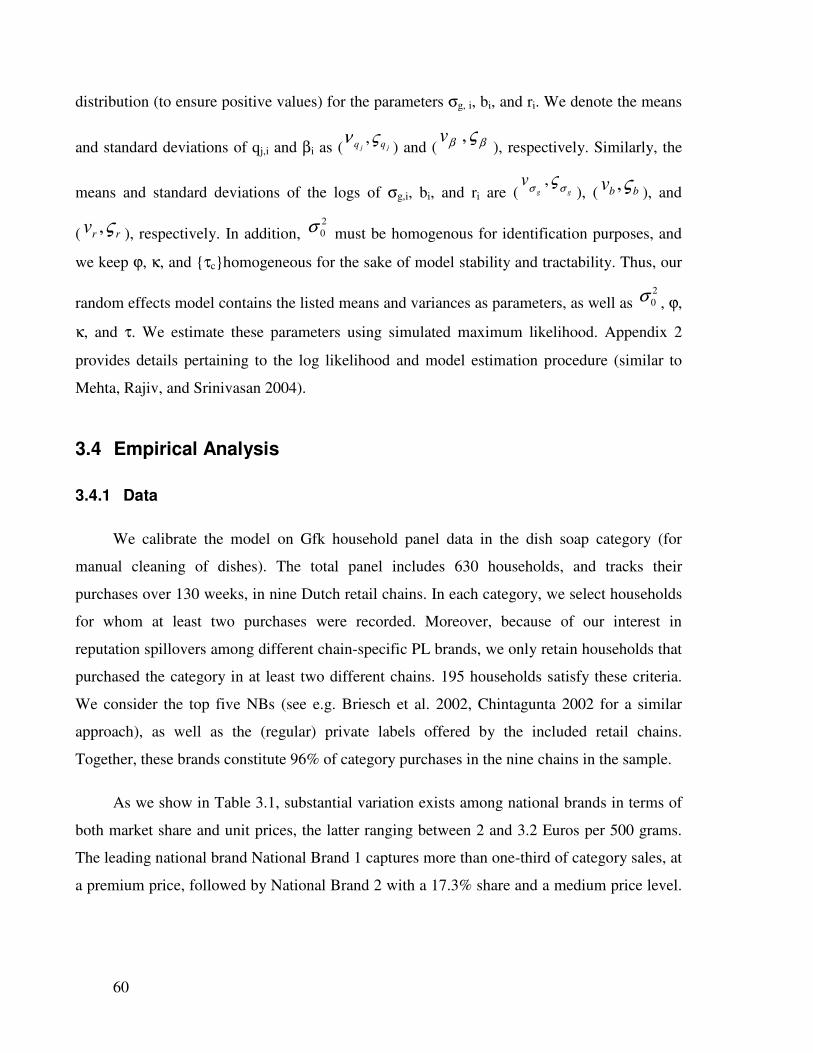
60
distribution (to ensure positive values) for the parameters σg, i, bi, and ri. We denote the means
and standard deviations of qj,i and βi as ( jj qq ςν ,) and ( ββ ς,v
), respectively. Similarly, the
means and standard deviations of the logs of σg,i, bi, and ri are ( gg
vσσ
ς,), ( bbv ς,
), and
( rrv ς, ), respectively. In addition, 2
0σ must be homogenous for identification purposes, and
we keep ϕ, κ, and τchomogeneous for the sake of model stability and tractability. Thus, our
random effects model contains the listed means and variances as parameters, as well as 2
0σ , ϕ,
κ, and τ. We estimate these parameters using simulated maximum likelihood. Appendix 2
provides details pertaining to the log likelihood and model estimation procedure (similar to
Mehta, Rajiv, and Srinivasan 2004).
3.4 Empirical Analysis
3.4.1 Data
We calibrate the model on Gfk household panel data in the dish soap category (for
manual cleaning of dishes). The total panel includes 630 households, and tracks their
purchases over 130 weeks, in nine Dutch retail chains. In each category, we select households
for whom at least two purchases were recorded. Moreover, because of our interest in
reputation spillovers among different chain-specific PL brands, we only retain households that
purchased the category in at least two different chains. 195 households satisfy these criteria.
We consider the top five NBs (see e.g. Briesch et al. 2002, Chintagunta 2002 for a similar
approach), as well as the (regular) private labels offered by the included retail chains.
Together, these brands constitute 96% of category purchases in the nine chains in the sample.
As we show in Table 3.1, substantial variation exists among national brands in terms of
both market share and unit prices, the latter ranging between 2 and 3.2 Euros per 500 grams.
The leading national brand National Brand 1 captures more than one-third of category sales, at
a premium price, followed by National Brand 2 with a 17.3% share and a medium price level.
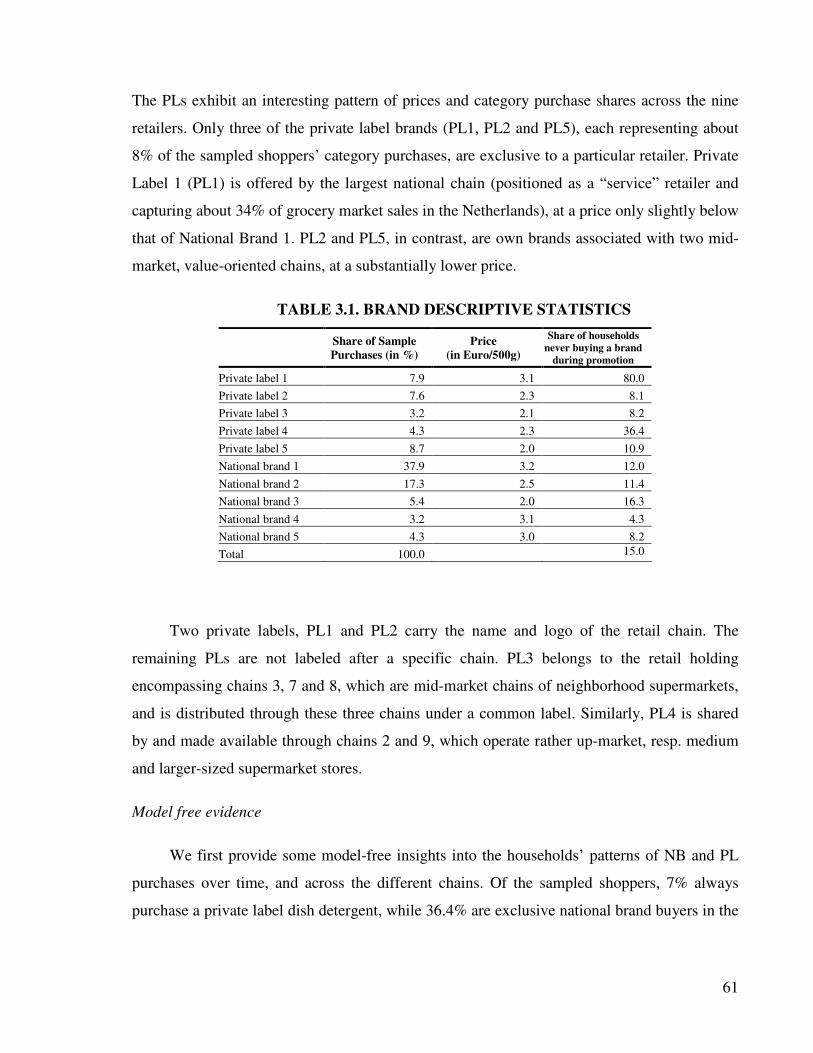
61
The PLs exhibit an interesting pattern of prices and category purchase shares across the nine
retailers. Only three of the private label brands (PL1, PL2 and PL5), each representing about
8% of the sampled shoppers’ category purchases, are exclusive to a particular retailer. Private
Label 1 (PL1) is offered by the largest national chain (positioned as a “service” retailer and
capturing about 34% of grocery market sales in the Netherlands), at a price only slightly below
that of National Brand 1. PL2 and PL5, in contrast, are own brands associated with two mid-
market, value-oriented chains, at a substantially lower price.
TABLE 3.1. BRAND DESCRIPTIVE STATISTICS
Share of Sample
Purchases (in %)
Price
(in Euro/500g)
Share of households
never buying a brand
during promotion
Private label 1 7.9 3.1 80.0
Private label 2 7.6 2.3 8.1
Private label 3 3.2 2.1 8.2
Private label 4 4.3 2.3 36.4
Private label 5 8.7 2.0 10.9
National brand 1 37.9 3.2 12.0
National brand 2 17.3 2.5 11.4
National brand 3 5.4 2.0 16.3
National brand 4 3.2 3.1 4.3
National brand 5 4.3 3.0 8.2
Total 100.0 15.0
Two private labels, PL1 and PL2 carry the name and logo of the retail chain. The
remaining PLs are not labeled after a specific chain. PL3 belongs to the retail holding
encompassing chains 3, 7 and 8, which are mid-market chains of neighborhood supermarkets,
and is distributed through these three chains under a common label. Similarly, PL4 is shared
by and made available through chains 2 and 9, which operate rather up-market, resp. medium
and larger-sized supermarket stores.
Model free evidence
We first provide some model-free insights into the households’ patterns of NB and PL
purchases over time, and across the different chains. Of the sampled shoppers, 7% always
purchase a private label dish detergent, while 36.4% are exclusive national brand buyers in the
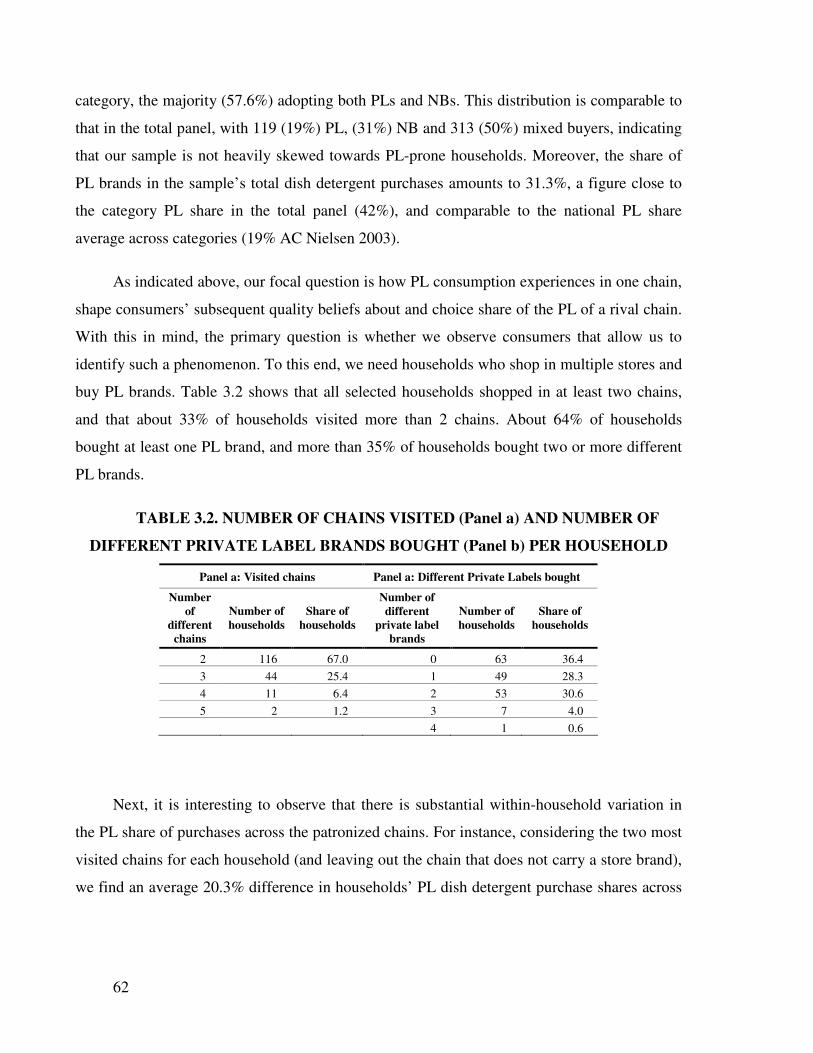
62
category, the majority (57.6%) adopting both PLs and NBs. This distribution is comparable to
that in the total panel, with 119 (19%) PL, (31%) NB and 313 (50%) mixed buyers, indicating
that our sample is not heavily skewed towards PL-prone households. Moreover, the share of
PL brands in the sample’s total dish detergent purchases amounts to 31.3%, a figure close to
the category PL share in the total panel (42%), and comparable to the national PL share
average across categories (19% AC Nielsen 2003).
As indicated above, our focal question is how PL consumption experiences in one chain,
shape consumers’ subsequent quality beliefs about and choice share of the PL of a rival chain.
With this in mind, the primary question is whether we observe consumers that allow us to
identify such a phenomenon. To this end, we need households who shop in multiple stores and
buy PL brands. Table 3.2 shows that all selected households shopped in at least two chains,
and that about 33% of households visited more than 2 chains. About 64% of households
bought at least one PL brand, and more than 35% of households bought two or more different
PL brands.
TABLE 3.2. NUMBER OF CHAINS VISITED (Panel a) AND NUMBER OF
DIFFERENT PRIVATE LABEL BRANDS BOUGHT (Panel b) PER HOUSEHOLD
Panel a: Visited chains Panel a: Different Private Labels bought
Number
of
different
chains
Number of
households
Share of
households
Number of
different
private label
brands
Number of
households
Share of
households
2 116 67.0 0 63 36.4
3 44 25.4 1 49 28.3
4 11 6.4 2 53 30.6
5 2 1.2 3 7 4.0
4 1 0.6
Next, it is interesting to observe that there is substantial within-household variation in
the PL share of purchases across the patronized chains. For instance, considering the two most
visited chains for each household (and leaving out the chain that does not carry a store brand),
we find an average 20.3% difference in households’ PL dish detergent purchase shares across
63
the two chains, which is quite substantial. Similarly, the correlation across households
between PL share in the most and second most visited chain is 75.8%, a figure significantly
different from 1 (p<.01). Hence, the probability that a PL is selected upon a dish detergent
purchase is not simply a household trait.
Second, households’ PL purchase shares within a visited chain also vary considerably
over time. To see this, we subdivide our 130 weeks of observations into four sub-periods (of
about 32 weeks each), and calculate the PL category purchase share for each household in
each chain visited in the sub-period. Next, we compute, for each household and visited chain,
the standard deviation of this PL share across the four sub-periods. Table 3.3, panel a,
provides summary statistics by chain. It indicates that households’ PL share of dish detergent
purchases in a chain vary considerably across the four sub-periods (pointing to within-
household, within-chain, over time variation), for chains with low as well as high average PL
purchase shares.
A third question, then, is what drives these dynamics. As the large portion of households
(66%) never made a PL purchase during a promotion, this over-time variation cannot be
entirely attributed to deals. Instead, we find that households who are heavy category PL buyers
in a certain sub-period (over 30% of dish detergent purchases allocated to PLs), are
significantly more likely to become heavy PL purchasers in the next 32-week period in a chain
not visited before and, hence, in which they have no own-chain PL experience (χ2=8.483, p<
.01). Of course, given that this test does not control for specific store, household, and
marketing mix variables, it is at best roughly indicative of cross-store PL effects. To cleanly
separate out cross-store PL learning from other factors, we estimate a choice model with
Bayesian cross-learning – as reported below.
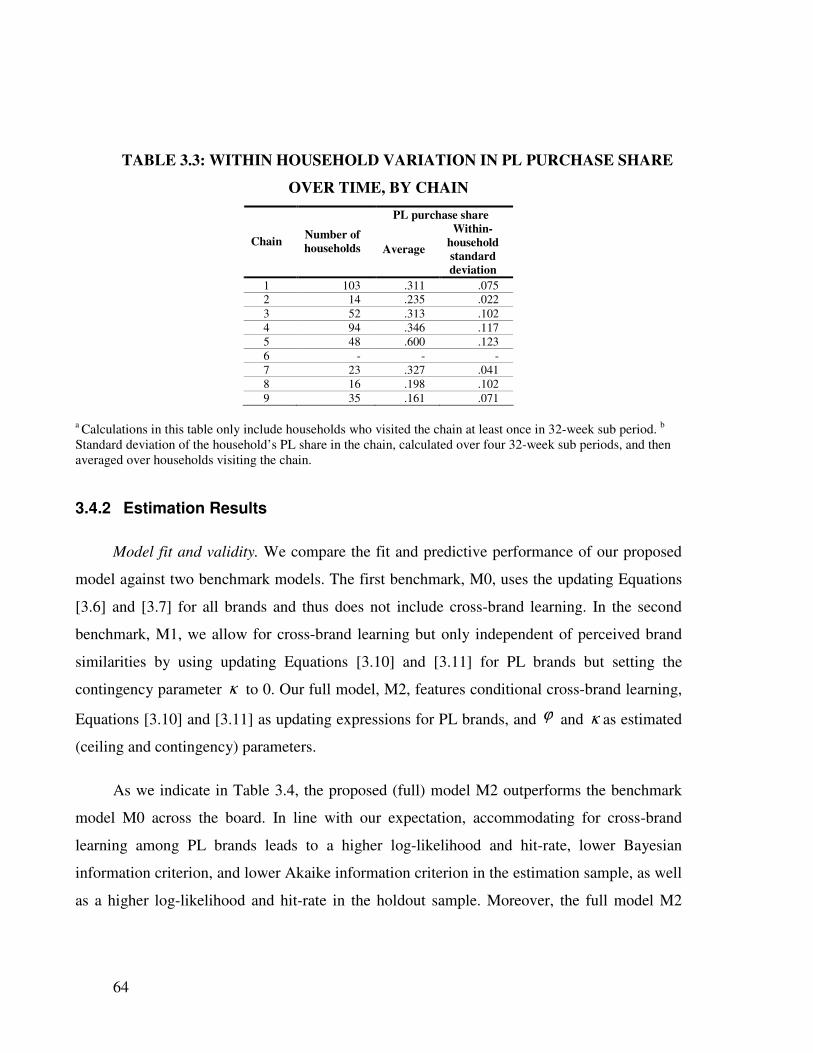
64
TABLE 3.3: WITHIN HOUSEHOLD VARIATION IN PL PURCHASE SHARE
OVER TIME, BY CHAIN
PL purchase share
Chain Number of
households Average
Within-
household
standard
deviation
1 103 .311 .075
2 14 .235 .022
3 52 .313 .102
4 94 .346 .117
5 48 .600 .123
6 - - -
7 23 .327 .041
8 16 .198 .102
9 35 .161 .071
a Calculations in this table only include households who visited the chain at least once in 32-week sub period.
b
Standard deviation of the household’s PL share in the chain, calculated over four 32-week sub periods, and then
averaged over households visiting the chain.
3.4.2 Estimation Results
Model fit and validity. We compare the fit and predictive performance of our proposed
model against two benchmark models. The first benchmark, M0, uses the updating Equations
[3.6] and [3.7] for all brands and thus does not include cross-brand learning. In the second
benchmark, M1, we allow for cross-brand learning but only independent of perceived brand
similarities by using updating Equations [3.10] and [3.11] for PL brands but setting the
contingency parameter κ to 0. Our full model, M2, features conditional cross-brand learning,
Equations [3.10] and [3.11] as updating expressions for PL brands, and ϕ and κ as estimated
(ceiling and contingency) parameters.
As we indicate in Table 3.4, the proposed (full) model M2 outperforms the benchmark
model M0 across the board. In line with our expectation, accommodating for cross-brand
learning among PL brands leads to a higher log-likelihood and hit-rate, lower Bayesian
information criterion, and lower Akaike information criterion in the estimation sample, as well
as a higher log-likelihood and hit-rate in the holdout sample. Moreover, the full model M2
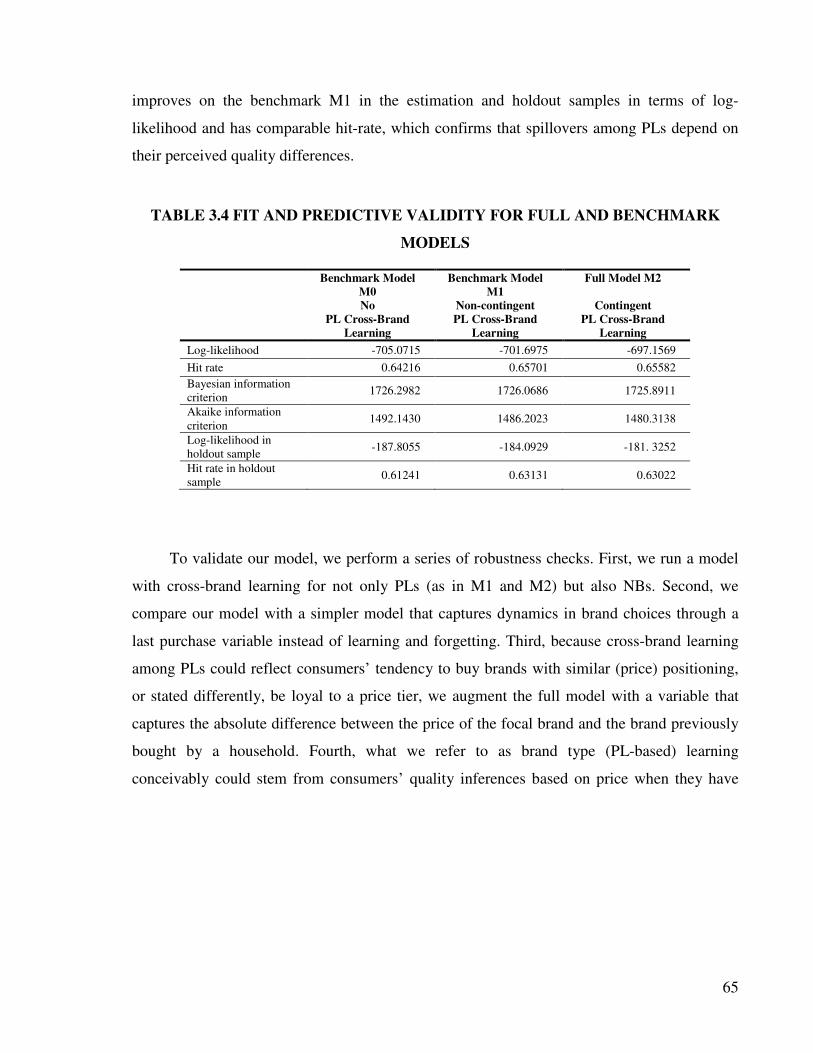
65
improves on the benchmark M1 in the estimation and holdout samples in terms of log-
likelihood and has comparable hit-rate, which confirms that spillovers among PLs depend on
their perceived quality differences.
TABLE 3.4 FIT AND PREDICTIVE VALIDITY FOR FULL AND BENCHMARK
MODELS
Benchmark Model
M0
Benchmark Model
M1
Full Model M2
No
PL Cross-Brand
Learning
Non-contingent
PL Cross-Brand
Learning
Contingent
PL Cross-Brand
Learning
Log-likelihood -705.0715 -701.6975 -697.1569
Hit rate 0.64216 0.65701 0.65582
Bayesian information
criterion 1726.2982 1726.0686 1725.8911
Akaike information
criterion 1492.1430 1486.2023 1480.3138
Log-likelihood in
holdout sample -187.8055 -184.0929 -181. 3252
Hit rate in holdout
sample 0.61241 0.63131 0.63022
To validate our model, we perform a series of robustness checks. First, we run a model
with cross-brand learning for not only PLs (as in M1 and M2) but also NBs. Second, we
compare our model with a simpler model that captures dynamics in brand choices through a
last purchase variable instead of learning and forgetting. Third, because cross-brand learning
among PLs could reflect consumers’ tendency to buy brands with similar (price) positioning,
or stated differently, be loyal to a price tier, we augment the full model with a variable that
captures the absolute difference between the price of the focal brand and the brand previously
bought by a household. Fourth, what we refer to as brand type (PL-based) learning
conceivably could stem from consumers’ quality inferences based on price when they have
66
little knowledge about a brand. To rule out this possibility, we augment our model with price-
based learning using a specification similar to Erdem and colleagues’ (2008).11
The results of these robustness checks are strongly encouraging. Cross-brand learning
among NBs is virtually absent, regardless of brand similarity. Moreover, in each of the four
cases, we find support for our expectations: our full model still offers an improvement in fit
and predictive validity over alternative specifications. Also, the magnitude of the forgetting
(νb), risk aversion (νr), and learning ( ησv, log(1/(ϕ – 1), log(κ)) coefficients do not change
substantially; therefore, our conclusions remain largely unaffected. In all, these extensions
provide strong support for contingent cross-brand learning among PL brands.
Parameter estimates. In Table 3.5, we report the parameter estimates for the full model.
The coefficients appear to have face validity. The promotion sensitivity parameters (feature
only: FOvβ = 2.85, p < .01; display only: DO
vβ = 2.38, p < .01; feature and display: FDvβ =
3.32, p < .01) are all significant and positive, and the impact of price is negative ( Pvβ = -.96,
p < .01). The brand quality parameters reflect the population mean of true brand quality
relative to brand National Brand 1. The parameters related to consumer learning are in line
with previous findings, and the standard error of the consumption signal ( gvσ = .83 )
achieves a similar order of magnitude to that reported by Erdem (1998) and Erdem, Keane,
and Sun (2008). The rate of forgetting (νb = 7.02 ) also is comparable to that found by Mehta,
Rajiv, and Srinivasan (2004): They report that it takes 19.8 weeks for the information learned
through consumption to depreciate to half of its value; we find an average value of 26.1
weeks.
11 The exact specification of this model is available from the first author upon request.
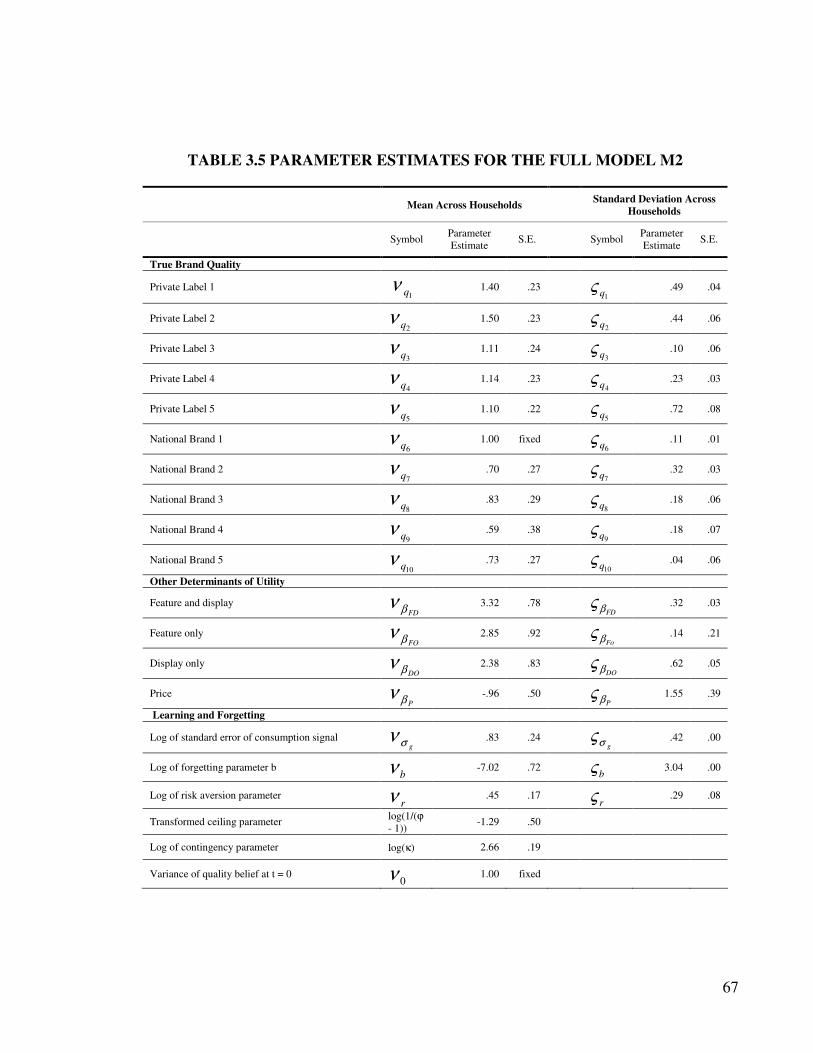
67
TABLE 3.5 PARAMETER ESTIMATES FOR THE FULL MODEL M2
Mean Across Households Standard Deviation Across
Households
Symbol Parameter
Estimate S.E. Symbol
Parameter
Estimate S.E.
True Brand Quality
Private Label 1 1qν
1.40 .23
1qς
.49 .04
Private Label 2 2qν
1.50 .23
2qς
.44 .06
Private Label 3 3qν
1.11 .24
3qς
.10 .06
Private Label 4 4qν
1.14 .23
4qς
.23 .03
Private Label 5 5qν
1.10 .22
5qς
.72 .08
National Brand 1 6qν
1.00 fixed
6qς
.11 .01
National Brand 2 7qν
.70 .27
7qς
.32 .03
National Brand 3 8qν
.83 .29
8qς
.18 .06
National Brand 4 9qν
.59 .38
9qς
.18 .07
National Brand 5 10qν
.73 .27
10qς
.04 .06
Other Determinants of Utility
Feature and display FDβν
3.32 .78
FDβς
.32 .03
Feature only FOβν
2.85 .92
Foβς
.14 .21
Display only DOβν
2.38 .83
DOβς
.62 .05
Price Pβν
-.96 .50
Pβς
1.55 .39
Learning and Forgetting
Log of standard error of consumption signal gσν
.83 .24
gσς
.42 .00
Log of forgetting parameter b bν
-7.02 .72
bς
3.04 .00
Log of risk aversion parameter rν
.45 .17
rς
.29 .08
Transformed ceiling parameter log(1/(ϕ
- 1)) -1.29 .50
Log of contingency parameter log(κ) 2.66 .19
Variance of quality belief at t = 0 0ν
1.00 fixed

68
TABLE 3.5 CONTINUED
Symbol Parameter
Estimate S.E.
Chain-Specific Scaling Parameters
Retailer 1 log(τ1) .00 fixed
Retailer 2 log(τ2) -.99 .74
Retailer 3 log(τ3) .14 .54
Retailer 4 log(τ4) -.11 .43
Retailer 5 log(τ5) -.07 .52
Retailer 6 log(τ6) .51 .58
Retailer 7 log(τ7) .20 .61
Retailer 8 log(τ8) -1.00 .55
Retailer 9 log(τ9) -.30 .53
Focusing on the PL cross-brand learning parameters (i.e., ceiling and contingency), we
find that the transformed ceiling parameter log(1/(ϕ – 1)) equals –1.29 (see Table 3.5), which
corresponds to a ϕ level of .78. Therefore, among PL brands perceived as having the same
quality, consumers incorporate 78% of the consumption signals from one PL brand to update
their beliefs about others. The estimated log of the contingency parameter, log(κ) = 2.66,
indicates that the degree of cross-brand learning clearly is contingent on perceived brand
similarity.12
To clarify the magnitude of the effects, we compare the impact of cross-brand learning
on a PL brand’s choice probability with that of within-brand learning. For the most dissimilar
PL brands in the sample, for which perceived similarity is the weakest, cross-brand spillovers
result in choice probability changes that are 5–10% of the changes that result from within-
brand learning. For the most similar PL brand pairs however, this figure rises dramatically to
60–70%, which suggests that cross-brand learning is not only a statistically significant but also
12Again, κ = 0 would point to noncontingent transfers across all private labels.
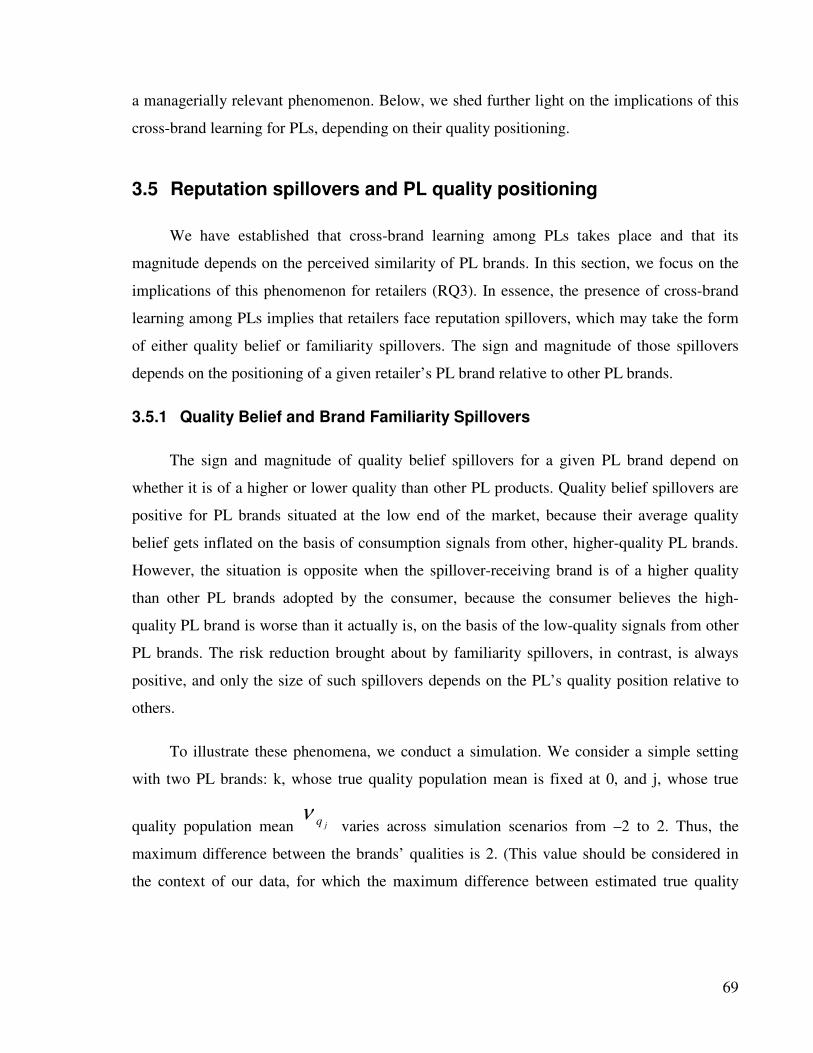
69
a managerially relevant phenomenon. Below, we shed further light on the implications of this
cross-brand learning for PLs, depending on their quality positioning.
3.5 Reputation spillovers and PL quality positioning
We have established that cross-brand learning among PLs takes place and that its
magnitude depends on the perceived similarity of PL brands. In this section, we focus on the
implications of this phenomenon for retailers (RQ3). In essence, the presence of cross-brand
learning among PLs implies that retailers face reputation spillovers, which may take the form
of either quality belief or familiarity spillovers. The sign and magnitude of those spillovers
depends on the positioning of a given retailer’s PL brand relative to other PL brands.
3.5.1 Quality Belief and Brand Familiarity Spillovers
The sign and magnitude of quality belief spillovers for a given PL brand depend on
whether it is of a higher or lower quality than other PL products. Quality belief spillovers are
positive for PL brands situated at the low end of the market, because their average quality
belief gets inflated on the basis of consumption signals from other, higher-quality PL brands.
However, the situation is opposite when the spillover-receiving brand is of a higher quality
than other PL brands adopted by the consumer, because the consumer believes the high-
quality PL brand is worse than it actually is, on the basis of the low-quality signals from other
PL brands. The risk reduction brought about by familiarity spillovers, in contrast, is always
positive, and only the size of such spillovers depends on the PL’s quality position relative to
others.
To illustrate these phenomena, we conduct a simulation. We consider a simple setting
with two PL brands: k, whose true quality population mean is fixed at 0, and j, whose true
quality population mean jqν varies across simulation scenarios from –2 to 2. Thus, the
maximum difference between the brands’ qualities is 2. (This value should be considered in
the context of our data, for which the maximum difference between estimated true quality
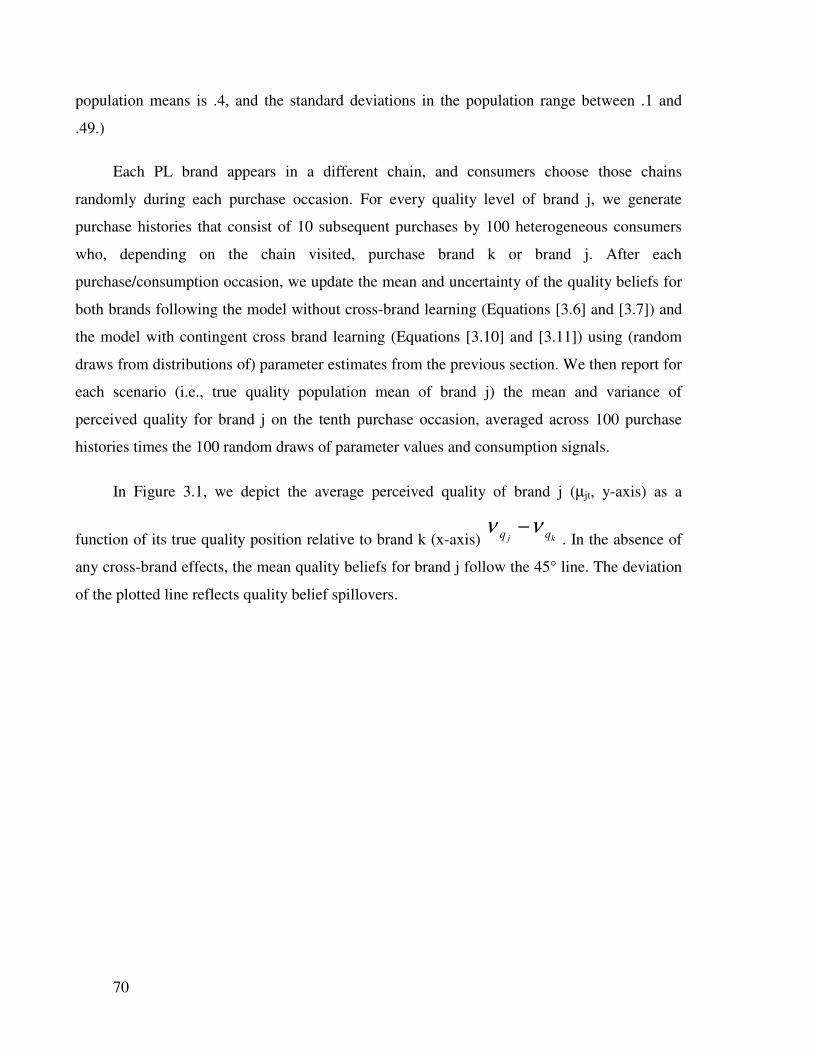
70
population means is .4, and the standard deviations in the population range between .1 and
.49.)
Each PL brand appears in a different chain, and consumers choose those chains
randomly during each purchase occasion. For every quality level of brand j, we generate
purchase histories that consist of 10 subsequent purchases by 100 heterogeneous consumers
who, depending on the chain visited, purchase brand k or brand j. After each
purchase/consumption occasion, we update the mean and uncertainty of the quality beliefs for
both brands following the model without cross-brand learning (Equations [3.6] and [3.7]) and
the model with contingent cross brand learning (Equations [3.10] and [3.11]) using (random
draws from distributions of) parameter estimates from the previous section. We then report for
each scenario (i.e., true quality population mean of brand j) the mean and variance of
perceived quality for brand j on the tenth purchase occasion, averaged across 100 purchase
histories times the 100 random draws of parameter values and consumption signals.
In Figure 3.1, we depict the average perceived quality of brand j (µjt, y-axis) as a
function of its true quality position relative to brand k (x-axis) kj qq νν −. In the absence of
any cross-brand effects, the mean quality beliefs for brand j follow the 45° line. The deviation
of the plotted line reflects quality belief spillovers.
71
FIGURE 3.1 QUALITY BELIEF SPILLOVERS AS A FUNCTION OF QUALITY
POSITIONING IN THE PRESENCE AND ABSENCE OF CROSS-BRAND
LEARNING
-2
-1.5
-1
-0.5
0
0.5
1
1.5
2
-2 -1.5 -1 -0.5 0 0.5 1 1.5 2
True quality of private label brand j
relative to rival private label brand k
Perc
eiv
ed q
ualit
y o
f private
label b
rand j
after
10 p
urc
hases (
popula
tion m
ean)
Model without cross-brand learning
Model with cross-brand learning
Note: In a setting with two private label brands j and k, the figure plots on the x-axis the true quality of brand k
relative to brand j (whose true quality is zero), on the y-axis the perceived quality of brand j after a (simulated)
10-period purchase history, without (dotted line) and with (solid line) cross-brand learning. Deviations between
the solid and the dotted line represent positive (left side) or negative (right side) quality belief spillovers from
brand k to brand j.
72
FIGURE 3.2 FAMILIARITY SPILLOVERS AS A FUNCTION OF QUALITY
POSITIONING IN THE PRESENCE AND ABSENCE OF CROSS-BRAND
LEARNING.
1
1.2
1.4
1.6
1.8
2
2.2
2.4
-2 -1.5 -1 -0.5 0 0.5 1 1.5 2
True quality of private label brand j
relative to rival private label brand k
Qualit
y p
erc
eptio
n u
ncert
ain
ty o
f private
label
bra
nd j
after
10 p
urc
hases (
popula
tion m
ean)
Model without cross-brand learning
Model with cross-brand learning
Note: In a setting with two private label brands j and k, the figure plots on the x-axis the true quality of brand k
relative to brand j (whose true quality is zero), on the y-axis the quality belief uncertainty of brand j after a
(simulated) 10-period purchase history, without (dotted line) and with (solid line) cross-brand learning.
Deviations between the solid and the dotted line represent familiarity spillovers from brand k to brand j.
When the true quality of brand j is 0 (that is, equal to the true quality of brand k,
0==kj qq νν
), the plotted curve crosses the 45° line, because cross-brand learning does not
lead to any bias in brand j’s quality beliefs. For quality levels of brand j that are less than 0,
the average quality belief spillovers are positive, and the plotted line rises above the 45° line;
73
the opposite holds if the true quality of brand j exceeds that of brand k (i.e., exceeds 0), such
that quality belief spillovers from brand k are negative (plotted line below the 45° line). The
quality belief spillovers become small in absolute value if brands are of very different quality
(extreme values on the x-axis), and the degree of cross-learning declines because of their low
perceived similarity (see Equation [3.12]).
In Figure 3.2, we present the uncertainty (variance) in quality beliefs for brand j at the
end of the simulated purchase history (σjt, y-axis) as a function of its quality positioning
relative to the rival PL brand k (x-axis); again, the true quality of brand k is 0. For comparison
purposes, we also plot the quality belief variance in a scenario without cross-brand learning,13
using simulations similar to those described previously. For any given quality level of brand j,
the distance between both curves indicates the amount of familiarity spillovers. As we expect,
these familiarity spillovers reduce consumers’ uncertainty about the quality of brand j (solid
line situated below the dotted line)—even more when both brands have equal quality (0 on x-
axis).
3.5.2 Net Spillovers and Quality Positioning
We thus show that cross-brand learning induces two types of reputation spillovers—
quality belief and familiarity—that depend on the relative quality positioning of PLs. Next, we
investigate the net impact of these spillovers on PLs’ utility as a function of their positioning
strategy.
PL quality positioning and impact of cross-brand learning on PL utility. Three
potentially interesting strategies for PL quality positioning emerge from our findings. First,
quality belief spillovers appear most beneficial when a PL brand’s quality position is slightly
below that of other PL brands. Such a positioning allows the brand to free-ride on the quality
of rival PL brands. Yet there are limits to this free-riding positioning. Because positive quality
13 In this case, uncertainty σjt does not depend on brand j’s quality but corresponds to a horizontal line in
the figure.
74
belief spillovers disappear for products located at the very bottom of the quality spectrum,
brands lagging in terms of quality appear to get recognized as negative outliers.
Second, though medium-level upscale PL brands experience harmful low quality
spillovers from rival brands, PL brands located at the top of the quality spectrum avoid such
negative externalities. That is, it appears that retailers occupying a substantially higher
position than other PL brands can clearly distinguish themselves as quality leaders by adopting
quality leader positioning.
Third, consumption of a PL brand reduces the quality uncertainty for other PL brands,
and this especially when the spillover-yielding and spillover-receiving brands are perceived as
similar. PL brands thus maximize the benefits of familiarity spillovers when positioned closely
to other PL brands, a strategy that we refer to as the herd positioning.
The benefits of these strategies depend on the relative impact of both types of reputation
spillovers. As Equation [3.10] reveals, increases in the mean quality beliefs of the PL (µjt,
caused by quality belief spillovers) and reductions in uncertainty (σjt, caused by familiarity
spillovers) both positively influence the PL’s utility and resulting choice share. When quality
belief spillovers dominate familiarity spillovers, the free-riding approach offers the most
beneficial cross-effects. Conversely, when familiarity spillovers dominate, herd positioning
results in the greatest reputation gains. The relative magnitude of both types of effects is an
empirical question that depends on the observed level of risk aversion.
To assess the net spillover effects for our setting, we again use simulations. We calculate
the mean and variance of quality beliefs for brand j at the tenth purchase occasion, as well as
the associated brand utility. The difference in brand utility implied by the two models, with
and without cross-brand learning, is the total effect of reputation spillovers. It can be
decomposed into the effect of quality belief spillovers (utility change due to a difference in µjt)
and the effect of familiarity spillovers (utility change due to a difference in σjt).
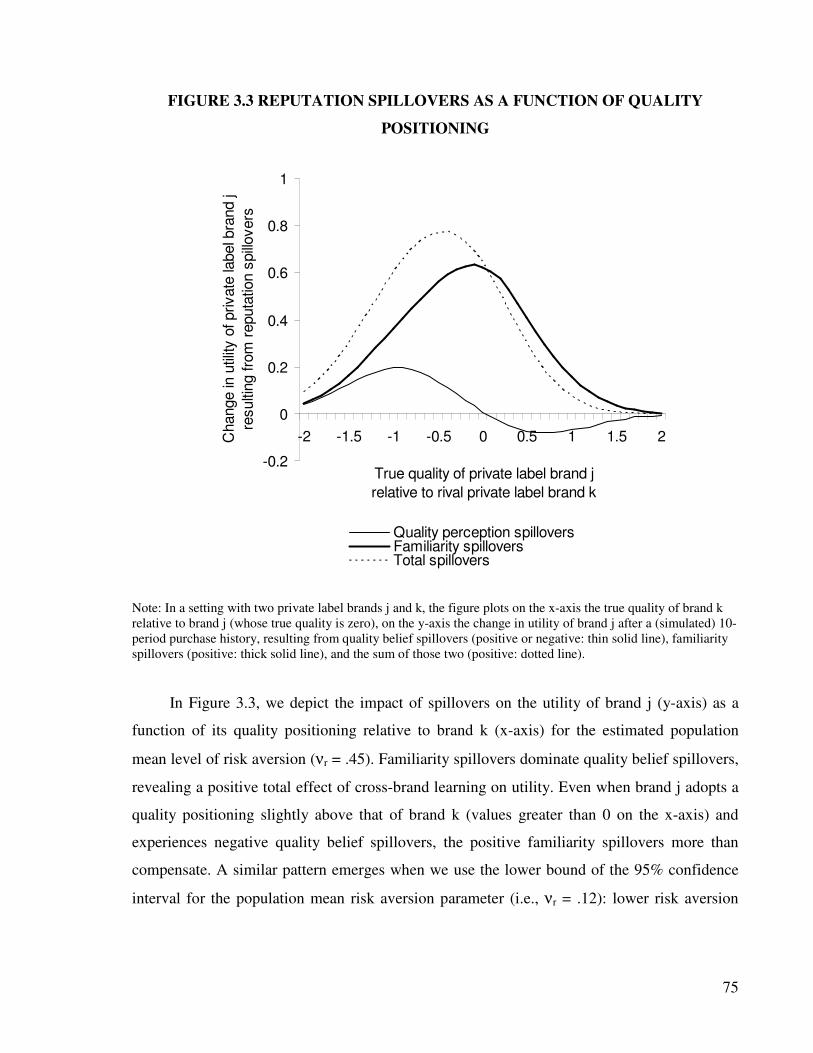
75
FIGURE 3.3 REPUTATION SPILLOVERS AS A FUNCTION OF QUALITY
POSITIONING
-0.2
0
0.2
0.4
0.6
0.8
1
-2 -1.5 -1 -0.5 0 0.5 1 1.5 2
True quality of private label brand j
relative to rival private label brand k
Change in
util
ity o
f private
label b
rand j
resulti
ng fro
m r
eputa
tion s
pill
overs
Quality perception spilloversFamiliarity spilloversTotal spillovers
Note: In a setting with two private label brands j and k, the figure plots on the x-axis the true quality of brand k
relative to brand j (whose true quality is zero), on the y-axis the change in utility of brand j after a (simulated) 10-
period purchase history, resulting from quality belief spillovers (positive or negative: thin solid line), familiarity
spillovers (positive: thick solid line), and the sum of those two (positive: dotted line).
In Figure 3.3, we depict the impact of spillovers on the utility of brand j (y-axis) as a
function of its quality positioning relative to brand k (x-axis) for the estimated population
mean level of risk aversion (νr = .45). Familiarity spillovers dominate quality belief spillovers,
revealing a positive total effect of cross-brand learning on utility. Even when brand j adopts a
quality positioning slightly above that of brand k (values greater than 0 on the x-axis) and
experiences negative quality belief spillovers, the positive familiarity spillovers more than
compensate. A similar pattern emerges when we use the lower bound of the 95% confidence
interval for the population mean risk aversion parameter (i.e., νr = .12): lower risk aversion
76
reduces the importance of familiarity spillovers relative to that of quality spillovers for brand
utility, but the general pattern remains unchanged, which underscores the benefits of the
herd—or even better, herd plus some free–riding—positioning.
PL quality positioning, cross-brand learning, and PL and NB choice shares. From the
above, it appears that PLs primarily benefit from reputation spillovers from rival PLs, because
as consumers use and learn about PL brands, they enjoy reduced uncertainty that in turn
influences their choices inside the store. National brands do not enjoy such cross-brand
benefits14
but instead must earn their own reputations individually, which may put them at a
disadvantage, especially if the PL brands are positioned close together.
To illustrate this point, we run an additional simulation that considers three brands: the
two PLs used previously and a NB n available in both chains. For illustrative purposes, the
NB’s quality is fixed at 0 ( nqν= 0). We again simulate consumer purchase histories and
consider the outcomes for different PL quality positions implied by the models with and
without cross-brand learning. However, this time, we focus on the choice shares of the three
brands (two PLs and one NB) as the variables of interest.
In Figure 3.4, we summarize our findings. Taking the no cross-PL learning scenario as
the reference setting (0 value on the y-axis), we show the change in the choice shares of the
three brands that results from cross-brand learning among the PLs (y-axis), as a function of the
quality differences between PL brands (x-axis).
14 Our robustness checks show no cross-brand learning for national brands.
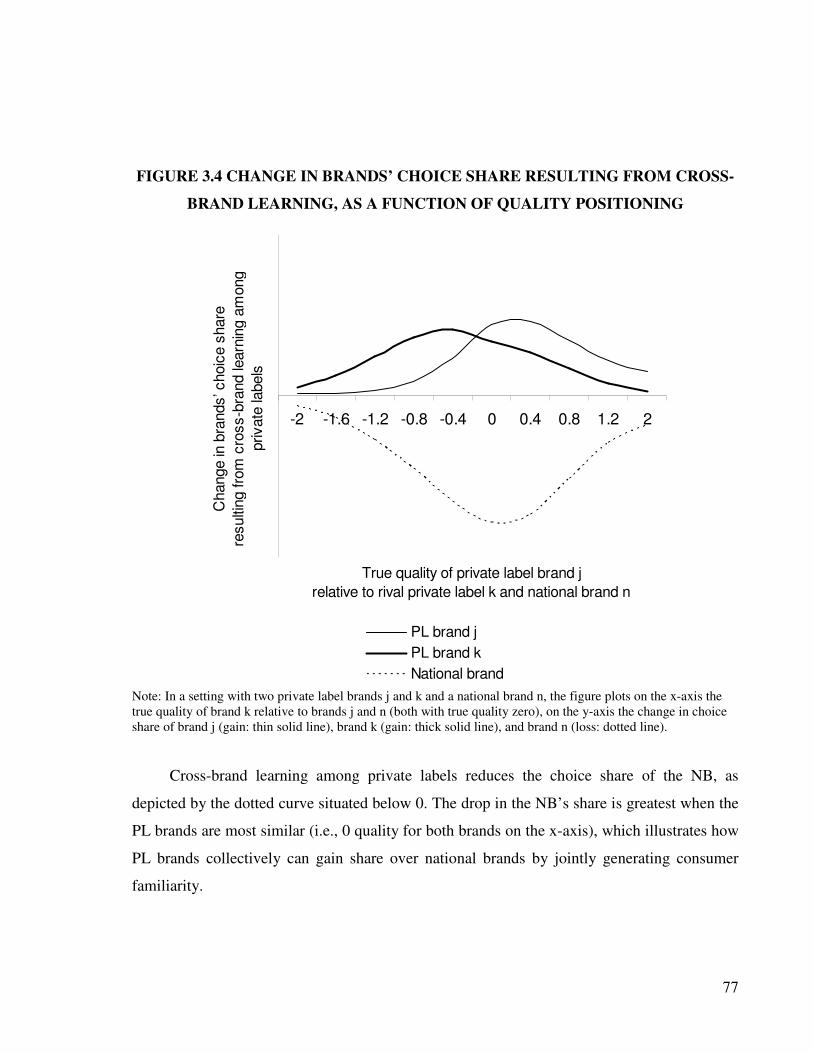
77
FIGURE 3.4 CHANGE IN BRANDS’ CHOICE SHARE RESULTING FROM CROSS-
BRAND LEARNING, AS A FUNCTION OF QUALITY POSITIONING
-2 -1.6 -1.2 -0.8 -0.4 0 0.4 0.8 1.2 2
True quality of private label brand j
relative to rival private label k and national brand n
Change in
bra
nds’ c
hoic
e s
hare
resulti
ng fro
m c
ross-b
rand le
arn
ing a
mong
private
labels
PL brand j
PL brand k
National brand
Note: In a setting with two private label brands j and k and a national brand n, the figure plots on the x-axis the
true quality of brand k relative to brands j and n (both with true quality zero), on the y-axis the change in choice
share of brand j (gain: thin solid line), brand k (gain: thick solid line), and brand n (loss: dotted line).
Cross-brand learning among private labels reduces the choice share of the NB, as
depicted by the dotted curve situated below 0. The drop in the NB’s share is greatest when the
PL brands are most similar (i.e., 0 quality for both brands on the x-axis), which illustrates how
PL brands collectively can gain share over national brands by jointly generating consumer
familiarity.
78
It is important to note that the dying out of the cross-brand learning effect occurs for
quality differences substantially larger than what we observe for most consumers and brands
in our sample. Specifically, the largest PL brand quality difference for an average consumer is
.4, and dying out occurs for quality differences that are three to four times larger. Such quality
differences are observed only for a fraction of our sampled households.
3.6 Conclusions, Limitations, and Further Research
Current literature features an ongoing debate about the extent to which PLs constitute an
instrument for retailer differentiation. Although some researchers suggest PL brands set
retailers apart (Corstjens and Lal 2000; Marketing News 1987), others contend that consumers
simply view PLs as homogeneous and interchangeable across chains (Ailawadi and Keller
2004; Richardson 1997). This debate therefore prompts intriguing questions: Are PLs private,
that is, do consumers distinguish among PLs offered by different retailers, and to what extent
are their beliefs shaped by each PL’s specific quality positioning? We expect that consumers
classify different PL into a single mental category and gauge the quality of specific PLs on the
basis of their experiences with other members of the category, that is, rival PL products.
However, the strength of such cross-brand learning may depend on the precision of
consumers’ brand knowledge and the brands’ true quality differences. To test these
propositions, we develop a dynamic brand choice model with cross-brand quality learning and
calibrate it with a panel data set pertaining to liquid dish detergent purchases in multiple
chains.
Our findings confirm that PLs are not all that private. Consumers use their experiences
with one PL brand to update their beliefs about other brands, which does not occur among
NBs. This cross-brand learning among PLs results in two types of reputation spillovers. First,
consumption experiences with one PL brand cause consumers to revise their mean quality
beliefs about other PL products, which we refer to as quality belief spillovers. These spillovers
are positive for PLs with slightly worse quality but negative for higher-end brands. Second,
consumption of one PL reduces consumers’ uncertainty about the quality of other PL products
and, because of their risk aversion, increases the appeal of these products because of
79
familiarity spillovers. We find clear evidence for both types of spillover phenomena. Our
estimates also confirm that reputation spillovers are not equally strong among all PL brand
pairs: more pronounced true quality differences among brands decrease their importance
drastically. Although low-quality PL brands can free-ride through quality belief spillovers, a
clear limit marks the possibilities for free-riding: When consumers perceive a PL’s quality as
significantly inferior to that of other PL brands, they no longer allow quality beliefs to spill
over onto it. To take advantage of familiarity spillovers, brands should embrace a herd strategy
and position themselves close to other PL brands. Thus, overall, PL products that occupy a
slightly below-average quality position compared with rival private label brands (a ‘herd with
free-riding’ approach) capitalize best on both types of reputation spillovers.
The presence and nature of cross-brand learning have important management
implications. PL quality and reputation investments by a retailer appear to benefit other
retailers, but is this benefit a positive or negative phenomenon? On the one hand, reputation
spillovers constitute a pitfall, because they limit the potential of PLs to differentiate retailers.
Retailers that hope to use a PL as a chain differentiating tool therefore must pursue a quality
leadership strategy, which diminishes the subsidy of rival brands and prevents the threat of
negative quality belief spillovers. In order to break away from such negative quality belief
spillovers, retailers should aim at a sizable quality gap, which is substantially larger than the
one we observe in the data for most consumers.
On the other hand, such a quality leader positioning entails the loss of certain benefits
associated with cross-brand learning. In our empirical application, we find that ‘not being
private’ is beneficial to all private label brands in the data set, in that it enhances the PLs ‘s
choice share among consumers who buy from the category in the store. This overall positive
effect results from the predominance of ‘familiarity spillovers’. That is, it appears consumers
use and learn about the concept of PL brands, which reduces their uncertainty about PL
products and enhances their choice propensity relative to NBs.
Middle-of-the-road retailers thus may find it optimal to provide customers with
mainstream PL offers and enjoy mutually beneficial effects that the NBs cannot share: the
80
wider establishment of PLs across chains strengthens their choice shares in comparison with
NBs. In contrast, high-end retailers may prefer a superior quality image for their PLs.
However, in selecting this option, retailers would have to not only establish a brand reputation
on their own but also distance themselves from the mainstream PL quality image.
Our study contains several limitations that set the stage for intriguing new research.
First, to shed light on the role of PLs in retailer differentiation, we focus on the differentiation
of PL brands and implications for brand choice. Yet as our results show, high-quality PLs may
be perceived as distinct from rival retailer brands, so research should gauge the effect of PL
appeal and investments on retail chain differentiation, as well as on store choice and store
margins.
Second, our empirical results pertain to only one category, and further research could
document determinants of the strength of cross-brand learning in different product categories.
For example, the rate of cross-brand learning among PLs may depend on category
characteristics, such as quality uncertainty, perceived within-category quality differences,
purchase frequency, or the degree of cross-chain shopping. We also expect that category-
related drivers could influence the relative importance of familiarity versus quality belief
spillovers, such that products with high levels of risk aversion (quality sensitivity) involve
more pronounced familiarity (quality belief) spillovers.
Third, we do not study cross-category effects in consumer learning, which are suggested
by Sayman and Raju (2004), who find cross-category promotional effects for PLs, and by
Ailawadi and Keller (2004). Incorporating cross-category and cross-retailer consumption-
based spillovers in one single model is a very challenging task. First, it would require the
analysis of data covering purchases of a broad set of categories and retailers simultaneously. A
second, more problematic, issue is that a model with simultaneous cross-PL and cross-
category spillovers would become intractable - adding another dimension to an already
complicated model structure. The important question here is whether not accounting for such
cross-category effects in the current model, biases the within-category cross-store learning
effect estimates. Since the cross-PL learning effects are based on purchase dynamics (please
81
note that cross-sectional differences between households would show up through
heterogeneity in brand appeal), a possible bias in these effects would have to stem from over-
time correlations, between (1) a given household’s purchases of rival PLs in the same category
(our current cross-effects), and (2) that household’s purchases of the same-chain PL in other
categories (which would drive the cross-category effects). Our contention is that our cross-PL
effect would be biased upward only if purchases (1) and (2) coincide (have a strong positive
over-time correlation), in which case the PL cross-learning part of the specification would pick
up some of these cross-category effects. If, however, these purchases (1) and (2) are not
aligned in time, we do not expect such an upward bias and, with negatively correlated
purchase sequences, the cross-PL effect might even be underestimated. Since consumers are
more likely to visit stores sequentially rather than simultaneously, and often group purchases
of different categories on a single store visit, we would not expect strong positive correlations
between the timing of purchases (1) and (2) for a given household. As an additional robustness
check, we could collect data on households’ other-category PL purchases for each of the
different chains. We could then augment the model with a control variable, summarizing the
household’s number (fraction) of same week-same store PL purchases in other categories, and
check whether the cross-learning PL effects remain, indeed, unaffected. Given the importance
of this data collection task, we leave this as a next research step.
Fourth, our specification allows quality differences to drive the perceived similarity
between pairs of PL brands, which, in turn, moderates the magnitude of cross-brand learning.
Further studies, however, should also investigate the role of other instruments. For example,
advertising messages could affect consumers’ beliefs of PL differences and stimulate or help
avoid reputation spillovers. PL branding strategies may also reveal important: retailers setting
out to avoid negative reputation effects from rival PL brands could choose brand names that
are not readily identifiable as private labels.
Fifth, other aspects of retail strategy may shape the degree of PL spillovers. Our study
pertains only to traditional supermarkets, but it might be interesting to investigate the extent of
cross-brand learning among retailers that differ in their price or quality positioning (e.g., Hi-
Lo supermarkets versus hard discounters) or operate different size formats (e.g., supermarkets
82
versus superstores). Moreover, an emerging retailer strategy is to offer, next to their ‘standard’
quality PL, low-end (economy) and premium store brands. While this strategy is currently
implemented by only a subset of (more innovative) retailers in a few categories, an interesting
question is how the advent of such downscale and upscale versions will influence reputation
spillovers. Will consumers abandon the notion of PLs as a mental category in response, or will
they construct a separate category for each PL quality tier, with strong cross-chain effects in
each tier? An interesting contention, based on our results, is that selling standard and premium
private labels could offer retailers a way out of the caveat: while standard store brands could
be designed so as to capitalize on familiarity spillovers, premium private labels might be used
as an instrument to break away from negative quality spillovers from rival chains. As more
data pertaining to different PL versions become available, studying these effects would be
highly worthwhile.
Sixth, the model could be extended to accommodate more types of asymmetries in
cross-brand learning. The currently used model allows for asymmetries stemming from
differences in the level of brand quality uncertainty among the involved PL brands: brands that
a consumer has more experience with being less influenced by spillovers from rival PLs. It is
conceivable that asymmetries can also stem from other brand characteristics, such as
differences in PL brand salience, or differences in the strength of association with the PL
brand type (i.e. How easily is the brand recognized as a private label?). Preliminary results
from more refined models suggest no difference in cross-learning between PL brands that are
named after the retail chain and those that are not. A tentative explanation is that while the use
of a chain name may make the brand more recognizable as a private label, it also creates
stronger differentiation from rival PL brands by building on the reputation of the chain. Future
research should shed more light on these mechanisms.
Seventh, while our cross-learning specification is quite flexible and exhibits descriptive
as well as predictive validity, it is a ‘reduced form’ model that is somewhat ad hoc. A next
step in the study of (contingent) cross-PL effects would be the use of a fully ‘structural’
specification, in which cross-effects result from a multivariate Bayesian updating mechanism,
based on correlated priors (as in Erdem et al, 1998) or on correlated signals (see, e.g., Coscelli
83
and Shum, 2004). Using these specifications for our purposes would call for a model extension
to accommodate contingencies in the cross-PL spillovers. We are currently working on such
an extension, and the preliminary results seem to confirm the findings of our reduced form
model.
Finally, as remarked in Chapter one, we do not observe retailer policy changes in terms
of quality repositioning, or new PL brands entering the category. As a result, we need to be
careful in deriving strategic policy implications from our findings. In order to make normative
claims, we would need to either analyze natural experimental settings in which major policy
shifts occur, or develop a fully structural model in which not only consumer choices, but also
retailer positioning strategies, are endogenous. As this would require far richer data sets or far
more complicated models (in which not only within-category brand choice, but also store
choice would need to be included, as a driver of retailer decisions), we leave such analyses for
future study.

84
85
4 Copycat Private Labels: Friend or Foe? Quality Belief
Spillovers and Choice Share Effects for Imitating Retailer
and Imitated National Brands
4.1 Introduction
Many private labels in consumer packaged goods are modeled on leading national
brands. Sayman, Hoch and Raju (2002) observed blatant package imitation by the private label
in over one third of 75 consumer packaged goods categories. In a survey of national US
supermarkets, Scott-Morton and Zettelmeyer (2004) found half of the store brands matching a
national brand package at least in color, size and shape. Trade dress imitation also constitutes
a deliberate strategy among multiple European retailers like Auchan in France, and Sainsbury
in the UK (Kapferer 1995).
While the overall success of copycat private labels is well documented, the extent to
which this can be ascribed to the imitation strategy is far less obvious. Apart from creating
initial confusion about brand identity, retailers hope, through the copycat practice, to benefit
from the quality image and reputation of the imitated national brands (Planet Retail 2007).
Especially in cases where the imitation is not exact and not blatant enough to trigger visual
confusion at the point of purchase (a strategy pursued by retailers to avoid instant litigation),
such dynamic spillover effects would become the key driver of losses for national brand
manufacturers. For these reasons, copycatting constitutes a major source of concern and even
86
legal action on the part of leading manufacturers (Planet Retail 2007, Kapferer 1995). At the
same time, the imitation strategy can backfire on the retailer if the quality gap between the
original and imitating brand leads to contrast effects and an increase in evaluation of the
original brand (Zaichkowsky and Simpson 1996), or makes consumers interpret the package
similarity as an attempt to mislead them (Warlop and Alba 2004). Yet, even though the
copycat phenomenon is widespread and its effects on the imitator and imitating brand are
unclear, little empirical evidence is available on these implied reputation spillovers and their
brand choice consequences, especially in actual choice settings. Based on the insights obtained
from experimental studies, Warlop and Alba (2004) conclude that “… consumer reaction to
persuasion cues [trade dress imitation] or persuasion agents is a complex phenomenon that
justifies additional research”.
Our research intends to address this gap, by focusing on the following research
questions: Do consumers shape their quality beliefs of copycat private labels based on
consumption experiences with the imitated national brand and, conversely, are quality beliefs
of the imitated brand affected by copycat consumption? If quality belief spillovers from the
original brand to the copycat are found, are these spillovers recurring, or do they dilute as
consumers build up experience with this copycat? Last but not least, is there evidence of
experience-based ‘reactance’, i.e. consumers refuting the imitating private label, or ‘rewarding
behavior’, i.e. consumers assigning extra utility to the original brand, as they become aware of
the true quality gap between the copycat and the imitated national brand?
To answer these questions, we develop a brand choice model that allows for dynamic
cross-brand learning among the imitated national brand and the private label copycat, and
accommodates possible post-consumption reactance or rewarding behavior. We study these
effects for the commonly observed setting where the copycat’s package similarity to the
leading NB is clearly noticeable and intentional (i.e. stands out among other brands or the
category trade dress code), but not exact. Taken together, our findings should help national
brand manufacturers assess to what extent such PL imitations constitute a ‘friend’ (ultimately
rewarding the original brand for being superior in quality and hard to imitate) or a ‘foe’
(stealing share by piggy backing on its quality reputation).
87
The discussion is organized as follows. In the next section, we develop a framework for
the cross-brand learning effects between the copycats and the imitated national brands,
bringing together insights from the literature. Section 3 then presents the models used to study
these effects, and the estimation procedure. In section 4, we discuss the empirical setting, and
report estimation results. Section 5 sheds light on the model implications for national brand
and private label performance, while section 6, finally, formulates conclusions, and addresses
limitations and future research areas.
4.2 Literature – Conceptual Framework
Visual characteristics or “Trade Dress” of a brand are important for its speed of
identification in a cluttered environment and the accuracy with which it can be set apart from
competitors (Richardson et al. 1994; van der Lans et al. 2008; Warlop and Alba 2004).
Building on this premise, much research on trade dress imitation has studied whether it causes
visual confusion: Do consumers inadvertently pick the copycat while believing they purchased
the imitated brand? From a legal perspective, the presence of brand confusion has been a key
criterion to judge whether imitation is harmful and therefore in violation of trademark
protection (Foxman et al. 1992; Jacoby and Morrin 1998).
However, as indicated by Warlop and Alba (2004), such visual confusion is unlikely for
copycats with a clearly distinguishable brand name from the original. Along the same lines,
Howard, Kerin and Gengler (2000) indicate that the likelihood of confusion about a brand
source association is strongly linked to similarity in the brand names. For umbrella private
label brands, which carry across many categories and often have a clear reference to the
retailer’s name, brand name similarity to the imitated national brand is typically low, and the
likelihood that consumers mistakenly buy the copycat because of the package similarity is
therefore expected to be small. Moreover, apart from brand name indications, retailers tend to
avoid packages that perfectly copy the original’s color, shape, size and illustrations, as overly
blatant imitations are bound to trigger manufacturer litigation (see, e.g., recent rulings against
Lidl for copying Steinmann jewelry cases, or against Albert Heijn for selling peanut butter and
margarine private labels too similar in design to the corresponding Unilever items (Planet
88
Retail 2007, p. 52). Instead, they stick to less pronounced trade dress similarity, which further
reduces the likelihood of visual confusion.
This does not imply, however, that copycatting cannot be a successful strategy for the
imitating private label brand, and that the leading national brand will not suffer from the
imitation – or vice versa. As Collins-Dodd and Zaichkowsky (1999) indicate: “The basis of
imitation is that consumers generalize the similarity between exterior physical features to infer
similarity of product quality or similarity[…]. This does not require confusion between the
originator and imitator, or even the belief that the manufacturer is the same”. Available studies
on the ‘initial’ effects of copycats offer some support for this contention. These studies
indicate that, consumers are unlikely to visually confuse the look-alike and the original brand,
however they can readily detect imitation attempt and the associated visual similarity between
the private label and the (leading) national brand (Warlop and Alba 2004, Sayman et al 2002),
and are influenced by them. As for the size of this influence, the viewpoints are somewhat
mixed. Whereas Kapferer (1995) concludes that similarity of packaging leads consumers to
believe that manufacturers are identical, Sayman et al. contend that “…this [visual similarity]
does not necessarily translate into consumer beliefs that the store brand offers comparable
intrinsic quality” (Sayman, Hoch and Raju, 2002, p. 394). Based on a series of experiments,
Warlop and Alba (2004) attest that the initial impact of visual similarity on the look-alike
brand is generally positive.
While these prior studies provide some interesting insights into the effects of
copycatting, they are either survey-based (Sayman et al. 2002; Simonson 1994) or
experimental in nature (Barbara Loken et al. 1986; Kapferer 1995; Warlop and Alba 2004;
Warlop et al. 2005; Zaichkowsky and Simpson 1996). This leaves us with two important
issues. First, while the experimental setup clearly offers its own strengths, it may not fully
reflect consumer responses in natural (cluttered) choice settings. Second, the difficulty of
integrating successive consumption experiences in experimental or survey settings makes it
hard to capture consumer responses based on information processing and learning over time
(Foxman et al. 1992). Yet, as indicated by Warlop and Alba (2004), consumer familiarity may
be an important mediator of copycat reactions. Consistent with Erdem’s (1998) observation
89
that brand knowledge is created over time as consumers learn new experiences, the look-alike
strategy may trigger interesting spillovers of consumption experiences between the imitating
and the imitator brand which, over time, shape their quality beliefs and brand choice behavior.
Especially for frequently purchased consumer packaged goods, this experience-based reaction
is expected to be a key performance driver, yet its implications for the imitated and imitating
brand remain to be understood.
Our study, therefore, intends to add to the available insights by modeling the dynamic
processes of own and cross-quality learning for the copycat and imitated brand, and tracking
the ensuing changes in consumer’s choices of those brands in real life settings. Before turning
to model development and estimation, we discuss the different learning mechanisms and
reactions below.
4.2.1 Quality learning from the imitated brand to the copycat.
In many cases, rather than bring about brand confusion, the copycat’s objective is to use
the look-alike strategy for quality signaling, and to instigate similarity-quality inferences. The
imitation strategy may then trigger cross-learning from the national brand to the copycat,
consumers using consumption experiences with the imitated national brand as signals of the
look-alike private label’s quality.
Evidence of consumption-based learning among competing brands in a given product
category has recently been provided by Janakiraman, Sismeiro and Dutta (2008). Based on the
diagnosticity-accessibility framework, these authors argue that spillover effects can occur
between direct competitors that do not carry a common brand name, provided that those
competitors still bear some form of similarity. In their application (prescription drugs), the
similarity stems from physical commonality, drugs functioning in the same pharmaco-
dynamic manner and sharing the same side effects. In the case of copycat private labels, the
visual or trade dress similarity is key. This visual similarity may have diagnostic value:
consumers may see the trade dress imitation as a signal on the part of the retailer to
communicate quality parity (at a lower price). Rather than being judged deceptive (Campbell
and Kirmani 2000), the PL’s unique ‘status’ in the supply chain is bound to lend credibility to
90
the signal of ‘similar quality at a lower price’ – especially for high-equity and powerful retail
chains. In such a case, consumption experiences with the original brand would carry over to
the imitator brand.
Such cross-learning would produce a dual effect for the copycat. First, it would shift its
expected quality level towards that of the imitated national brand. Second, it would remove
much of the uncertainty around the copycat’s quality beliefs. Given that prior expectations
about a PL’s quality are (slightly) below that of leading national brands (AC Nielsen 2005),
but with some uncertainty surrounding it (Batra and Sinha 2000; Erdem et al. 2004), we
expect both effects to be positive for the look-alike brand. This is harmful for the imitated
brand, to the extent that the copycat becomes more appealing by piggy-backing on it quality,
and hence steals away business.
4.2.2 Learning from copycat consumption.
Apart from the initial response to visual similarity described above, consumers’ quality
evaluations may evolve as they accumulate consumption experiences with the copycat. Three
mechanisms or processes can be distinguished here.
Memory Confusion. A first mechanism refers to the possibility of ‘reverse’ spillover
effects from the copycat to the original brand, caused by memory confusion. While the
difference in brand names may suffice for consumers to distinguish the original and copycat
products when facing the packs, the distinction may ‘fade’ if the two products are no longer
physically available. Differently stated, package similarity may cause consumers to mix up the
two brands in memory, and wrongfully assign consumption experiences. This memory
confusion may impede separate learning about the imitated brand and the copycat (Warlop et
al. 2005), and trigger two-way spillovers between the copycat and the imitated brand. In this
case, not only is the copycat’s quality belief modeled after that of the national brand, but the
national brand’s quality belief gets shaped by consumption experiences with the copycat.
Moreover, if the copycat quality is experienced as not far below that of the original, similar
‘reverse’ spillovers may come about as a result of assimilation: the copycat is seen as a good
91
substitute, and the original perceived as less unique as originally thought (Zaichkowsky and
Simpson 1996).
Contingent cross-learning. A second interesting phenomenon is that spillovers from the
original to the copycat may alter as consumers accumulate information. Based on the
diagnosticity-accessibility framework, the degree of spillovers between competing brands is
smaller if they are more dissimilar (Janakiraman et al. 2008). Through repeated consumption
of the imitator brand, the consumer learns about its true quality and about the quality gap vis-
à-vis the imitated national brand (Kapferer 1995). If the quality gap between the original and
the copycat is large and consumers become aware of this, we expect cross-learning to
dissipate: consumption experiences with the national brand are no longer used as signals of the
copycat’s quality (see Chapter 3) or vice versa (reduced assimilation, Zaichowsky and
Simpson 1996). In a similar vein, memory confusion is bound to dissolve with increased brand
experience (Foxman et al 1992).
Reactance and Rewarding Behavior. Third, if the copycat is ‘found out’ to be
substantially inferior to the national brand it imitates, this may produce an additional type of
responses on the part of consumers in the form of ‘reactance’ (towards the imitator) or
‘rewarding’ behavior (towards the original). Quick and Stevenson (2007) characterize
psychological reactance as “an aversive motivational state” that energizes individuals to
engage in restoring behavior opposite the threat. Such reactance may be triggered when
consumers feel they have been manipulated (Dillard and Shen 2005; Quick and Stephenson
2007). Specifically, in a copycat setting, the package similarity may be interpreted as an
intentional ploy to signal quality, and result in negative boomerang effects for the imitator
(Campbell and Kirmani 2000). While Warlop and Alba (2004) show that consumers are not
likely to “spontaneously penalize brands that blatantly imitate market leaders” (Warlop and
Alba, 2004, p. 21), this response may change as they experience the true quality gap: even if
the initial signal of same quality was judged believable, consumers may now evaluate it as an
attempt to mislead them and for which the retailer needs to be punished. Not only will positive
spillovers (enhancement of copycat’s quality beliefs) be halted, but the consumer may actually
become less attracted to the copycat than would be warranted by its intrinsic quality because

92
of the attempted deception. In case of such reactance behavior, the effect of copycatting will
not only be short lived, it will backfire on the imitator. Alternatively, the quality gap may
create a positive, ‘rewarding’ effect for the imitated brand. If the original brand proves to be
substantially superior to the copycat private label, this reinforces the notion that it is not easy
to imitate, and this aura of ‘uniqueness’ may further enhance its appeal. Zaichkowsky and
Simpson (1996) attribute this to a contrast effect: “Conversely, if consumers have negative
experiences with the imitator, then their evaluations of the original and the imitator should be
contrasted. Contrasting effects should cause an increase in the evaluations of the original
because negative experiences with the imitator may lead to avoidance of the imitator product”
(p.32). Note that while reactance to the copycat would benefit all competitors, rewarding
effects would only apply to the original brands.
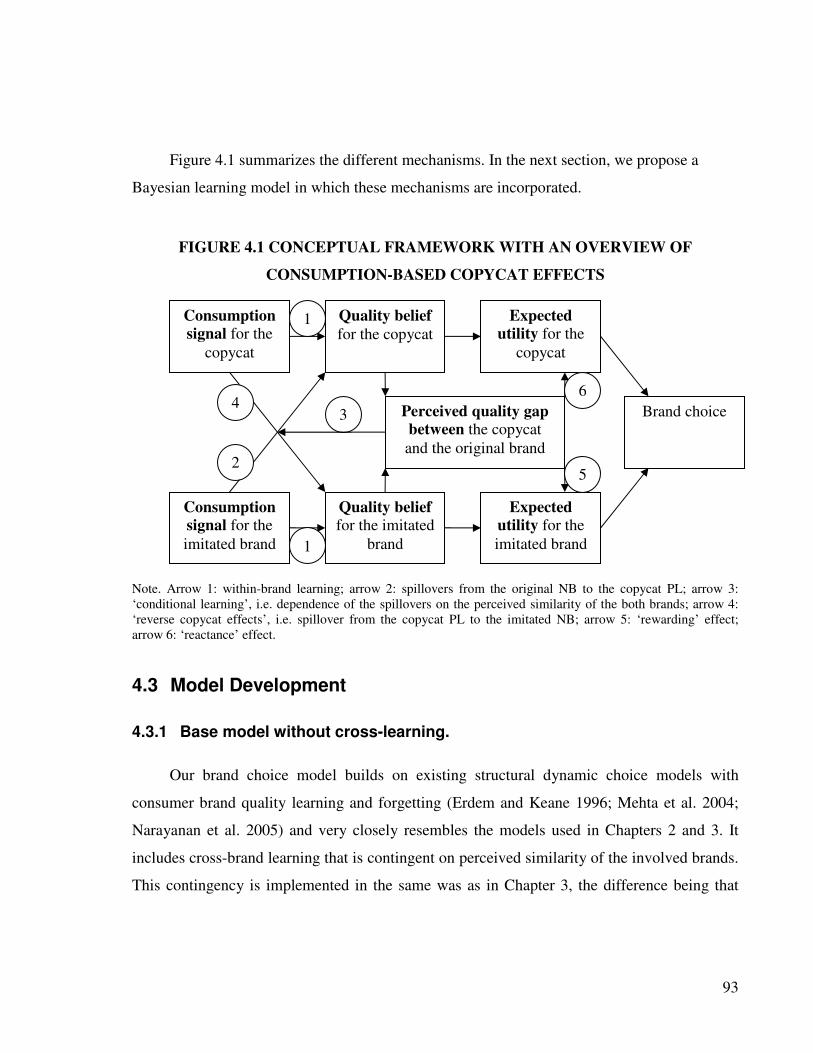
93
Figure 4.1 summarizes the different mechanisms. In the next section, we propose a
Bayesian learning model in which these mechanisms are incorporated.
FIGURE 4.1 CONCEPTUAL FRAMEWORK WITH AN OVERVIEW OF
CONSUMPTION-BASED COPYCAT EFFECTS
Note. Arrow 1: within-brand learning; arrow 2: spillovers from the original NB to the copycat PL; arrow 3:
‘conditional learning’, i.e. dependence of the spillovers on the perceived similarity of the both brands; arrow 4:
‘reverse copycat effects’, i.e. spillover from the copycat PL to the imitated NB; arrow 5: ‘rewarding’ effect;
arrow 6: ‘reactance’ effect.
4.3 Model Development
4.3.1 Base model without cross-learning.
Our brand choice model builds on existing structural dynamic choice models with
consumer brand quality learning and forgetting (Erdem and Keane 1996; Mehta et al. 2004;
Narayanan et al. 2005) and very closely resembles the models used in Chapters 2 and 3. It
includes cross-brand learning that is contingent on perceived similarity of the involved brands.
This contingency is implemented in the same was as in Chapter 3, the difference being that
Consumption
signal for the
copycat
Quality belief
for the copycat
Expected
utility for the
copycat
Brand choice Perceived quality gap
between the copycat
and the original brand
Consumption
signal for the
imitated brand
Quality belief for the imitated
brand
Expected
utility for the
imitated brand
4
2
1
1
3
6
5
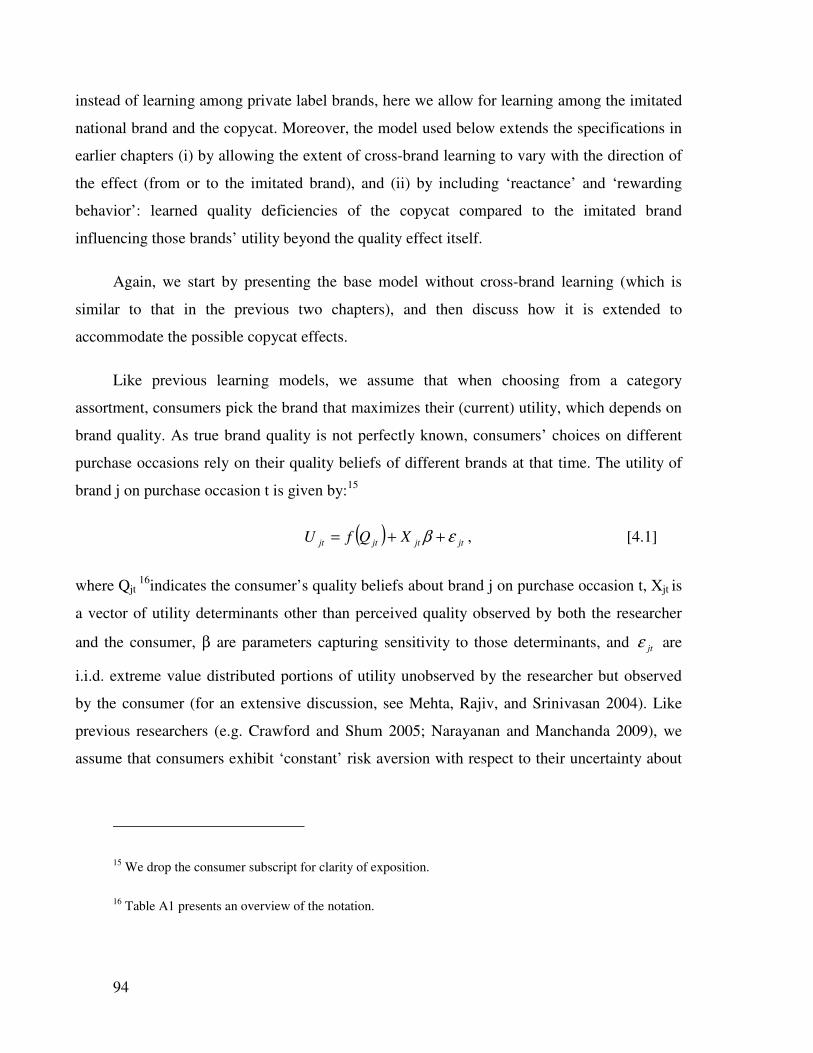
94
instead of learning among private label brands, here we allow for learning among the imitated
national brand and the copycat. Moreover, the model used below extends the specifications in
earlier chapters (i) by allowing the extent of cross-brand learning to vary with the direction of
the effect (from or to the imitated brand), and (ii) by including ‘reactance’ and ‘rewarding
behavior’: learned quality deficiencies of the copycat compared to the imitated brand
influencing those brands’ utility beyond the quality effect itself.
Again, we start by presenting the base model without cross-brand learning (which is
similar to that in the previous two chapters), and then discuss how it is extended to
accommodate the possible copycat effects.
Like previous learning models, we assume that when choosing from a category
assortment, consumers pick the brand that maximizes their (current) utility, which depends on
brand quality. As true brand quality is not perfectly known, consumers’ choices on different
purchase occasions rely on their quality beliefs of different brands at that time. The utility of
brand j on purchase occasion t is given by:15
( )jtjtjtjt XQfU εβ ++= , [4.1]
where Qjt 16
indicates the consumer’s quality beliefs about brand j on purchase occasion t, Xjt is
a vector of utility determinants other than perceived quality observed by both the researcher
and the consumer, β are parameters capturing sensitivity to those determinants, and jtε are
i.i.d. extreme value distributed portions of utility unobserved by the researcher but observed
by the consumer (for an extensive discussion, see Mehta, Rajiv, and Srinivasan 2004). Like
previous researchers (e.g. Crawford and Shum 2005; Narayanan and Manchanda 2009), we
assume that consumers exhibit ‘constant’ risk aversion with respect to their uncertainty about
15 We drop the consumer subscript for clarity of exposition.
16 Table A1 presents an overview of the notation.
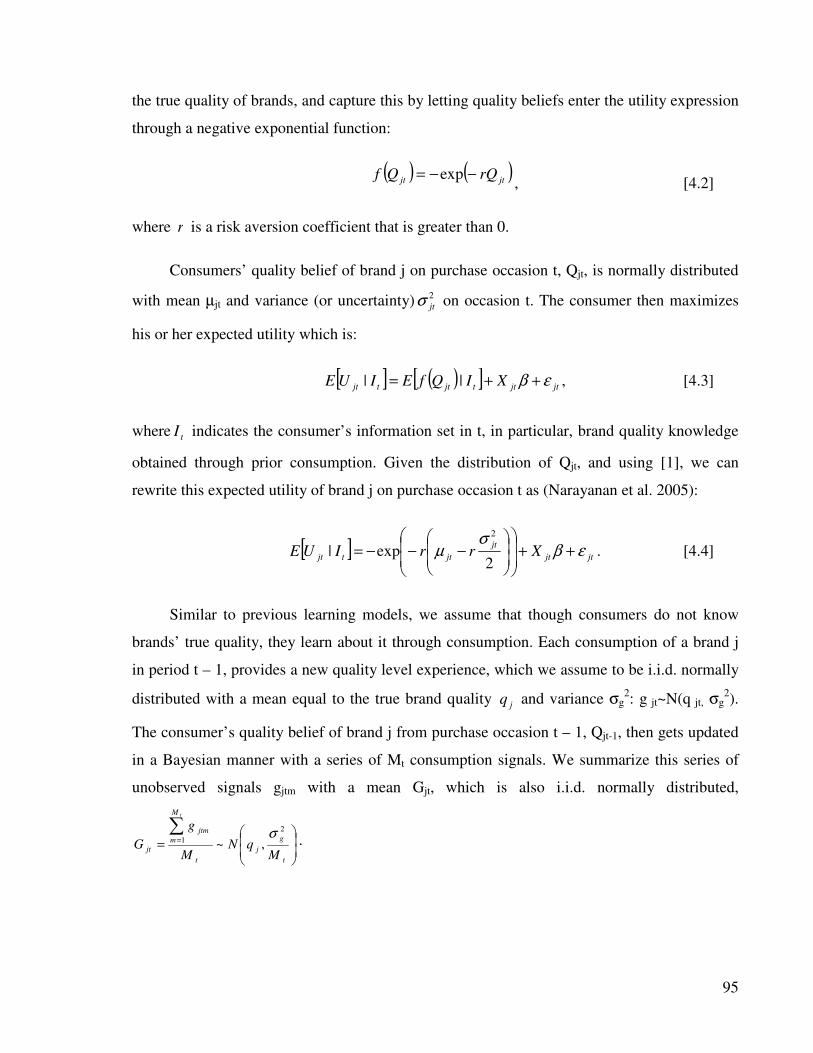
95
the true quality of brands, and capture this by letting quality beliefs enter the utility expression
through a negative exponential function:
( ) ( )
jtjt rQQf −−= exp, [4.2]
where r is a risk aversion coefficient that is greater than 0.
Consumers’ quality belief of brand j on purchase occasion t, Qjt, is normally distributed
with mean µjt and variance (or uncertainty) 2
jtσ on occasion t. The consumer then maximizes
his or her expected utility which is:
[ ] ( )[ ]jtjttjttjt XIQfEIUE εβ ++= || , [4.3]
where tI indicates the consumer’s information set in t, in particular, brand quality knowledge
obtained through prior consumption. Given the distribution of Qjt, and using [1], we can
rewrite this expected utility of brand j on purchase occasion t as (Narayanan et al. 2005):
[ ]jtjt
jt
jttjt XrrIUE εβσ
µ ++
−−−=
2exp|
2
. [4.4]
Similar to previous learning models, we assume that though consumers do not know
brands’ true quality, they learn about it through consumption. Each consumption of a brand j
in period t – 1, provides a new quality level experience, which we assume to be i.i.d. normally
distributed with a mean equal to the true brand quality jq and variance σg2: g jt~N(q jt, σg
2).
The consumer’s quality belief of brand j from purchase occasion t – 1, Qjt-1, then gets updated
in a Bayesian manner with a series of Mt consumption signals. We summarize this series of
unobserved signals gjtm with a mean Gjt, which is also i.i.d. normally distributed,
=∑
=
t
g
j
t
M
m
jtm
jtM
qNM
g
G
t
2
1 ,~σ
.
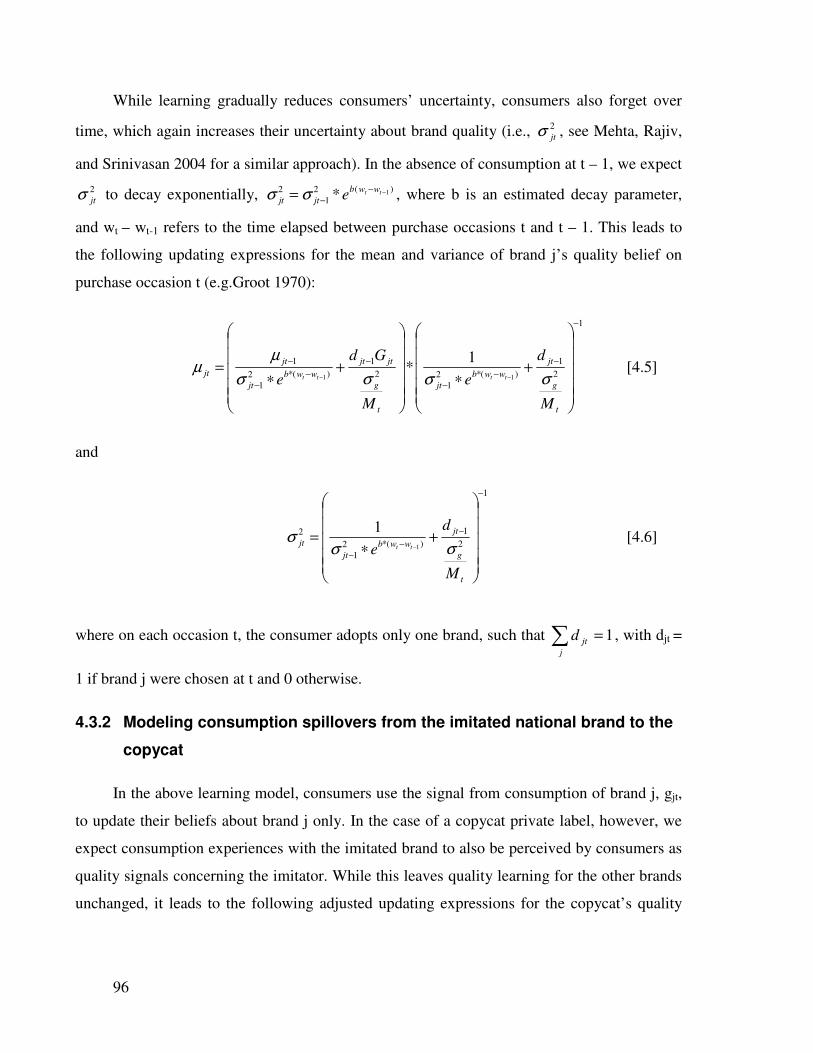
96
While learning gradually reduces consumers’ uncertainty, consumers also forget over
time, which again increases their uncertainty about brand quality (i.e., 2
jtσ , see Mehta, Rajiv,
and Srinivasan 2004 for a similar approach). In the absence of consumption at t – 1, we expect
2
jtσ to decay exponentially, 1( )2 2
1 * t tb w w
jt jt eσ σ −−
−= , where b is an estimated decay parameter,
and wt – wt-1 refers to the time elapsed between purchase occasions t and t – 1. This leads to
the following updating expressions for the mean and variance of brand j’s quality belief on
purchase occasion t (e.g.Groot 1970):
1
2
1
)(*2
1
2
1
)(*2
1
1
11
1*
−
−
−
−
−
−
−
−
+∗
+∗
=−−
t
g
jt
wwb
jt
t
g
jtjt
wwb
jt
jt
jt
M
d
e
M
Gd
e tttt σσσσ
µµ [4.5]
and
1
2
1
)(*2
1
2
1
1
−
−
−
−
+∗
=−
t
g
jt
wwb
jt
jt
M
d
e tt σσσ [4.6]
where on each occasion t, the consumer adopts only one brand, such that ∑ =j
jtd 1, with djt =
1 if brand j were chosen at t and 0 otherwise.
4.3.2 Modeling consumption spillovers from the imitated national brand to the
copycat
In the above learning model, consumers use the signal from consumption of brand j, gjt,
to update their beliefs about brand j only. In the case of a copycat private label, however, we
expect consumption experiences with the imitated brand to also be perceived by consumers as
quality signals concerning the imitator. While this leaves quality learning for the other brands
unchanged, it leads to the following adjusted updating expressions for the copycat’s quality
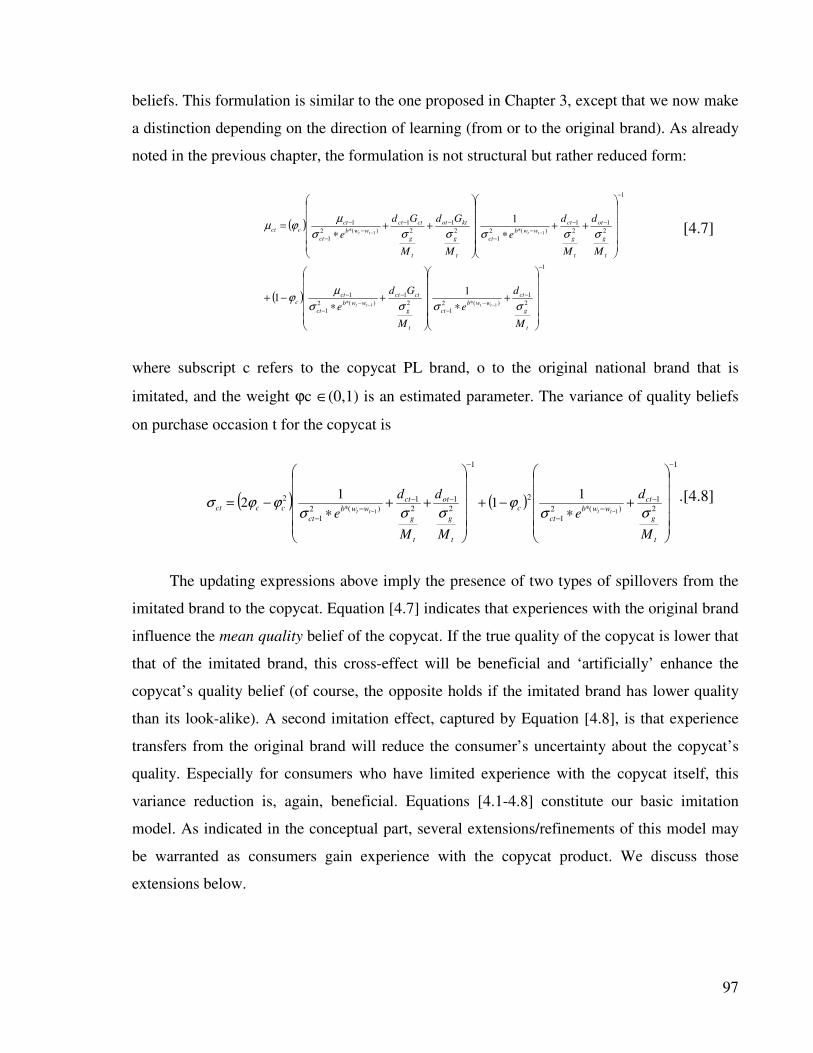
97
beliefs. This formulation is similar to the one proposed in Chapter 3, except that we now make
a distinction depending on the direction of learning (from or to the original brand). As already
noted in the previous chapter, the formulation is not structural but rather reduced form:
( )
( )
1
2
1
)(*2
1
2
1
)(*2
1
1
1
2
1
2
1
)(*2
1
2
1
2
1
)(*2
1
1
11
11
11
1
−
−
−−
−
−−
−
−
−−
−
−
−−
−
−
−
+∗
+∗
−+
++∗
++∗
=
−−
−−
t
g
ct
wwb
ct
t
g
ctct
wwb
ct
ct
c
t
g
ot
t
g
ct
wwb
ct
t
g
ktot
t
g
ctct
wwb
ct
ct
cct
M
d
e
M
Gd
e
M
d
M
d
e
M
Gd
M
Gd
e
tttt
tttt
σσσσ
µϕ
σσσσσσ
µϕµ [4.7]
where subscript c refers to the copycat PL brand, o to the original national brand that is
imitated, and the weight ϕc ∈(0,1) is an estimated parameter. The variance of quality beliefs
on purchase occasion t for the copycat is
( ) ( )
1
2
1
)(*2
1
2
1
2
1
2
1
)(*2
1
2
11
11
12
−
−−
−
−
−−−
−
+∗
−+
++∗
−=−−
t
g
ct
wwb
ct
c
t
g
ot
t
g
ct
wwb
ct
ccct
M
d
e
M
d
M
d
e tttt σσϕ
σσσϕϕσ . [4.8]
The updating expressions above imply the presence of two types of spillovers from the
imitated brand to the copycat. Equation [4.7] indicates that experiences with the original brand
influence the mean quality belief of the copycat. If the true quality of the copycat is lower that
that of the imitated brand, this cross-effect will be beneficial and ‘artificially’ enhance the
copycat’s quality belief (of course, the opposite holds if the imitated brand has lower quality
than its look-alike). A second imitation effect, captured by Equation [4.8], is that experience
transfers from the original brand will reduce the consumer’s uncertainty about the copycat’s
quality. Especially for consumers who have limited experience with the copycat itself, this
variance reduction is, again, beneficial. Equations [4.1-4.8] constitute our basic imitation
model. As indicated in the conceptual part, several extensions/refinements of this model may
be warranted as consumers gain experience with the copycat product. We discuss those
extensions below.
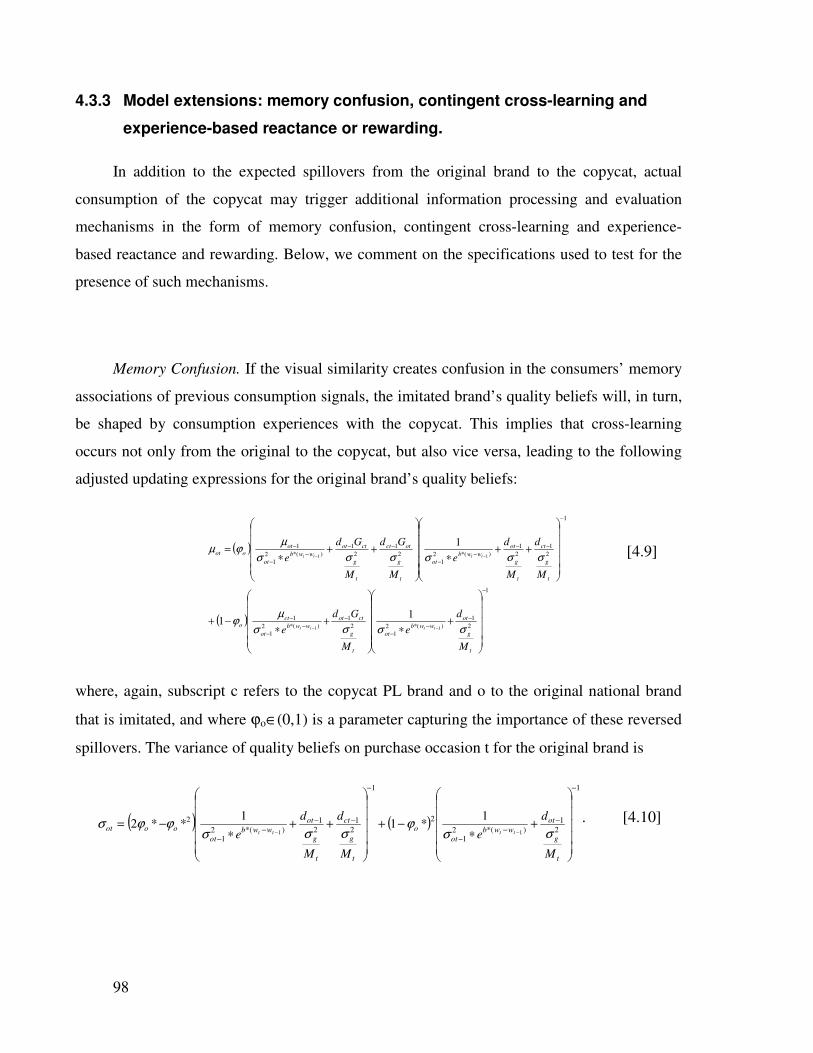
98
4.3.3 Model extensions: memory confusion, contingent cross-learning and
experience-based reactance or rewarding.
In addition to the expected spillovers from the original brand to the copycat, actual
consumption of the copycat may trigger additional information processing and evaluation
mechanisms in the form of memory confusion, contingent cross-learning and experience-
based reactance and rewarding. Below, we comment on the specifications used to test for the
presence of such mechanisms.
Memory Confusion. If the visual similarity creates confusion in the consumers’ memory
associations of previous consumption signals, the imitated brand’s quality beliefs will, in turn,
be shaped by consumption experiences with the copycat. This implies that cross-learning
occurs not only from the original to the copycat, but also vice versa, leading to the following
adjusted updating expressions for the original brand’s quality beliefs:
( )
( )
1
2
1
)(*2
1
2
1
)(*2
1
1
1
2
1
2
1
)(*2
1
2
1
2
1
)(*2
1
1
11
11
11
1
−
−
−−
−
−−
−
−
−−
−−
−−
−−
−
+∗
+∗
−+
++∗
++∗
=
−−
−−
t
g
ot
wwb
ot
t
g
ctot
wwb
ot
cto
t
g
ct
t
g
ot
wwb
ot
t
g
otct
t
g
ctot
wwb
ot
otoot
M
d
e
M
Gd
e
M
d
M
d
e
M
Gd
M
Gd
e
tttt
tttt
σσσσ
µϕ
σσσσσσ
µϕµ [4.9]
where, again, subscript c refers to the copycat PL brand and o to the original national brand
that is imitated, and where ϕo∈(0,1) is a parameter capturing the importance of these reversed
spillovers. The variance of quality beliefs on purchase occasion t for the original brand is
( ) ( )
1
2
1
)(*21
2
1
2
1
2
1
)(*21
2
11
1*1
1**2
−
−−
−
−
−−−
−
+∗
−+
++∗
−=−−
t
g
ot
wwb
ot
o
t
g
ct
t
g
ot
wwb
ot
ooot
M
d
e
M
d
M
d
e tttt σσϕ
σσσϕϕσ . [4.10]
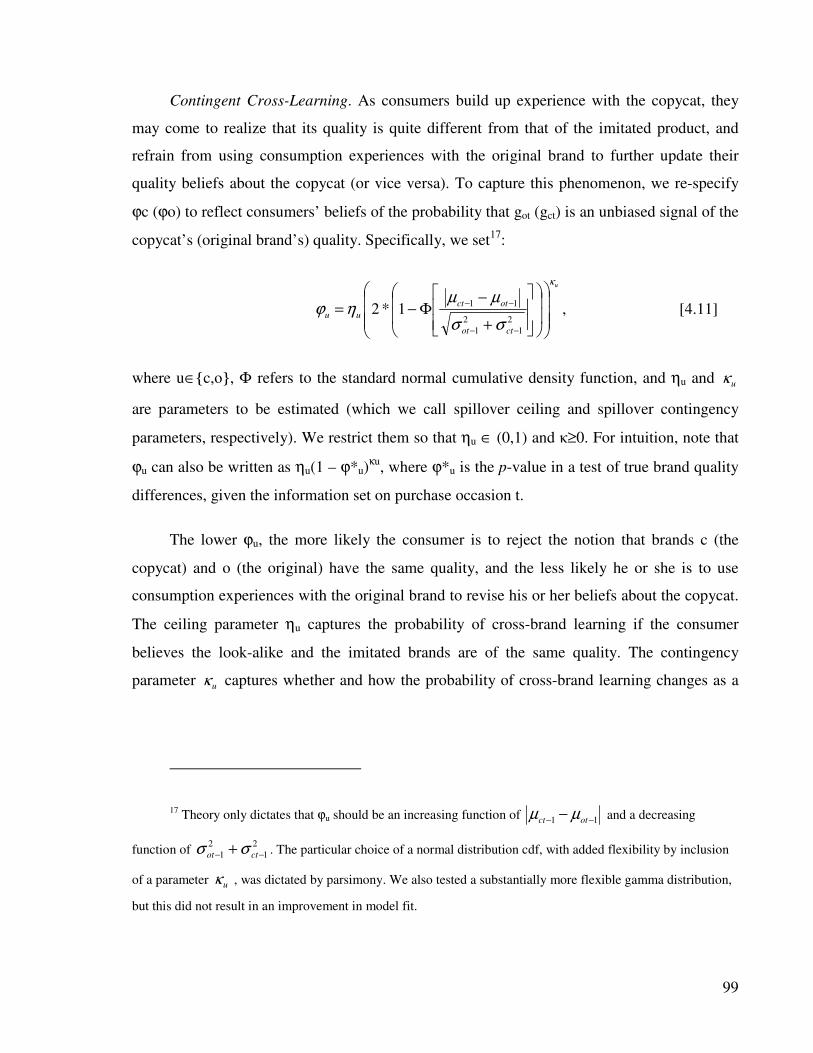
99
Contingent Cross-Learning. As consumers build up experience with the copycat, they
may come to realize that its quality is quite different from that of the imitated product, and
refrain from using consumption experiences with the original brand to further update their
quality beliefs about the copycat (or vice versa). To capture this phenomenon, we re-specify
ϕc (ϕo) to reflect consumers’ beliefs of the probability that got (gct) is an unbiased signal of the
copycat’s (original brand’s) quality. Specifically, we set17
:
u
ctot
otct
uu
κ
σσ
µµηϕ
+
−Φ−=
−−
−−
2
1
2
1
111*2 , [4.11]
where u∈c,o, Φ refers to the standard normal cumulative density function, and ηu and uκ
are parameters to be estimated (which we call spillover ceiling and spillover contingency
parameters, respectively). We restrict them so that ηu ∈ (0,1) and κ≥0. For intuition, note that
ϕu can also be written as ηu(1 – ϕ*u)κu
, where ϕ*u is the p-value in a test of true brand quality
differences, given the information set on purchase occasion t.
The lower ϕu, the more likely the consumer is to reject the notion that brands c (the
copycat) and o (the original) have the same quality, and the less likely he or she is to use
consumption experiences with the original brand to revise his or her beliefs about the copycat.
The ceiling parameter ηu captures the probability of cross-brand learning if the consumer
believes the look-alike and the imitated brands are of the same quality. The contingency
parameter uκ captures whether and how the probability of cross-brand learning changes as a
17 Theory only dictates that ϕu should be an increasing function of 11 −− − otct µµ and a decreasing
function of 2
1
2
1 −− + ctot σσ . The particular choice of a normal distribution cdf, with added flexibility by inclusion
of a parameter uκ , was dictated by parsimony. We also tested a substantially more flexible gamma distribution,
but this did not result in an improvement in model fit.
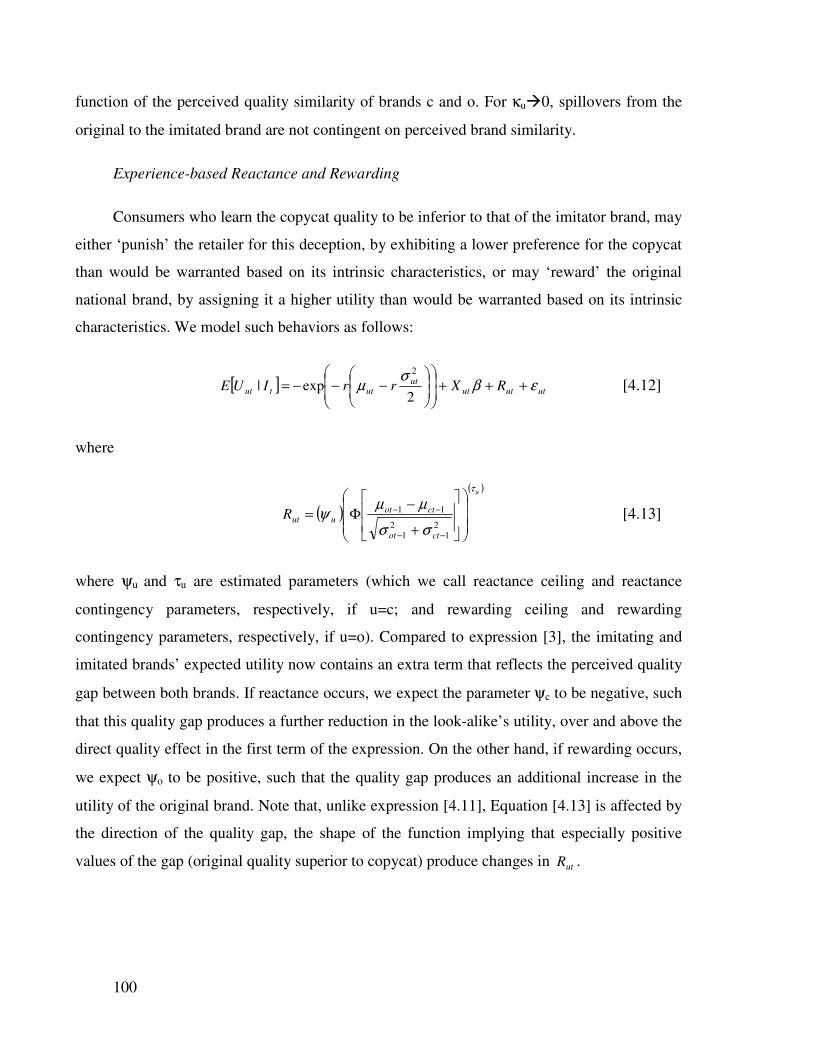
100
function of the perceived quality similarity of brands c and o. For κu0, spillovers from the
original to the imitated brand are not contingent on perceived brand similarity.
Experience-based Reactance and Rewarding
Consumers who learn the copycat quality to be inferior to that of the imitator brand, may
either ‘punish’ the retailer for this deception, by exhibiting a lower preference for the copycat
than would be warranted based on its intrinsic characteristics, or may ‘reward’ the original
national brand, by assigning it a higher utility than would be warranted based on its intrinsic
characteristics. We model such behaviors as follows:
[ ] utututut
uttut RXrrIUE εβσ
µ +++
−−−=
2exp|
2
[4.12]
where
( )
( )u
ctot
ctotuutR
τ
σσ
µµψ
+
−Φ=
−−
−−
21
21
11 [4.13]
where ψu and τu are estimated parameters (which we call reactance ceiling and reactance
contingency parameters, respectively, if u=c; and rewarding ceiling and rewarding
contingency parameters, respectively, if u=o). Compared to expression [3], the imitating and
imitated brands’ expected utility now contains an extra term that reflects the perceived quality
gap between both brands. If reactance occurs, we expect the parameter ψc to be negative, such
that this quality gap produces a further reduction in the look-alike’s utility, over and above the
direct quality effect in the first term of the expression. On the other hand, if rewarding occurs,
we expect ψo to be positive, such that the quality gap produces an additional increase in the
utility of the original brand. Note that, unlike expression [4.11], Equation [4.13] is affected by
the direction of the quality gap, the shape of the function implying that especially positive
values of the gap (original quality superior to copycat) produce changes in utR .
101
4.3.4 Estimation
Estimation Procedure. The estimation procedure closely resembles the one used in
Chapter 2. To accommodate unobserved household heterogeneity, we use a random effects
specification, with a normal distribution for the parameters qj,i and βi and a lognormal
distribution (to ensure positive values) for the parameters σg, i, bi, and ri. We denote the means
and standard deviations of qj,i and βi as (jj qq ςν , ) and ( ββ ς,v ), respectively. Similarly, the
means and standard deviations of the logs of σg,i, bi, and ri are (gg
vσσ
ς, ), ( bbv ς, ), and
( rrv ς, ), respectively. In addition, 2
0σ must be homogenous for identification purposes, and
we keep ϕu, ηu, uκ , ψu and τu homogeneous for the sake of model stability and tractability.
Thus, our random effects model contains the listed means and variances as parameters, as well
as2
0σ , ϕu, ηu, uκ , ψu and τu.
To obtain identification, we fix one of the true quality population mean parameters
across households (i.e., 0=jqv for j = Private Label 1), the uncertainty regarding brand
quality at purchase occasion t = 0 (i.e., 2
0σ = 1).
We estimate these parameters using simulated maximum likelihood. The Technical
Appendix provides details pertaining to the log likelihood and model estimation procedure
(similar to Mehta, Rajiv, and Srinivasan 2004).
4.4 Empirical Analysis
4.4.1 Data and setting
We estimate our models on scanner panel data for two cases. The first case uses data
from the powdered laundry detergent category at the leading retail chain in the Netherlands.
The second case refers to the liquid dish detergent category, in a major competitive Dutch
chain. In both settings, the retailer’s (own-name) private label imitates the leading national
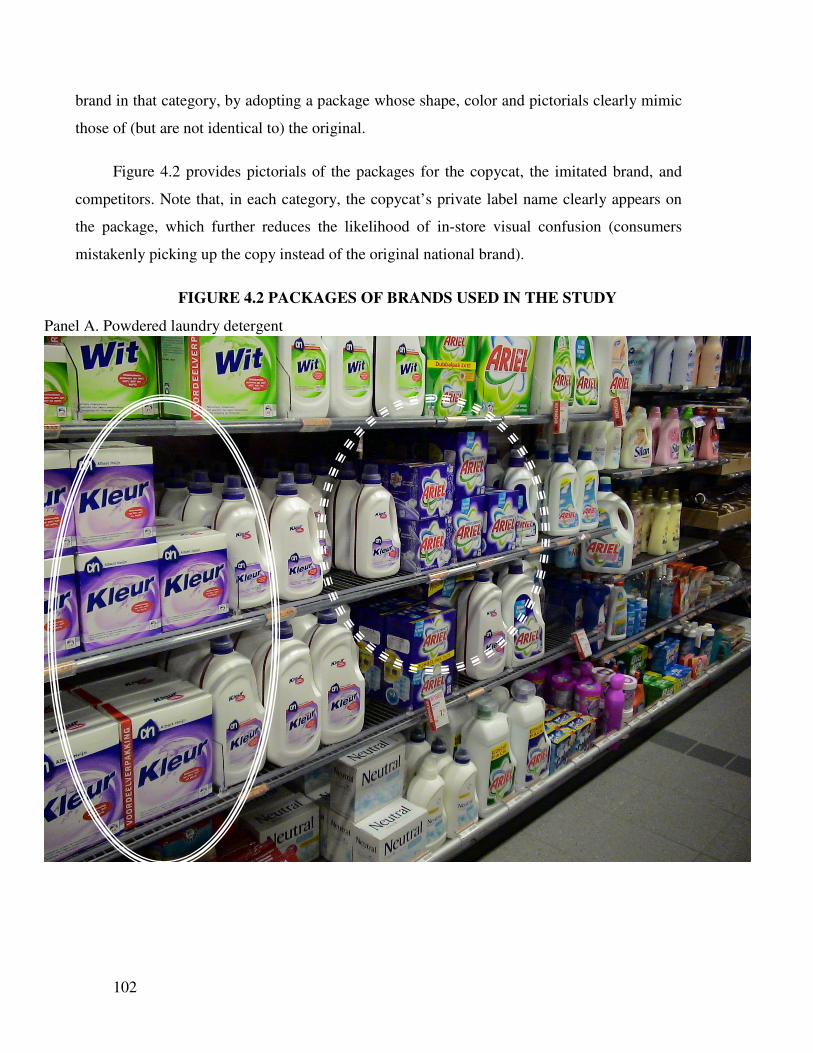
102
brand in that category, by adopting a package whose shape, color and pictorials clearly mimic
those of (but are not identical to) the original.
Figure 4.2 provides pictorials of the packages for the copycat, the imitated brand, and
competitors. Note that, in each category, the copycat’s private label name clearly appears on
the package, which further reduces the likelihood of in-store visual confusion (consumers
mistakenly picking up the copy instead of the original national brand).
FIGURE 4.2 PACKAGES OF BRANDS USED IN THE STUDY
Panel A. Powdered laundry detergent
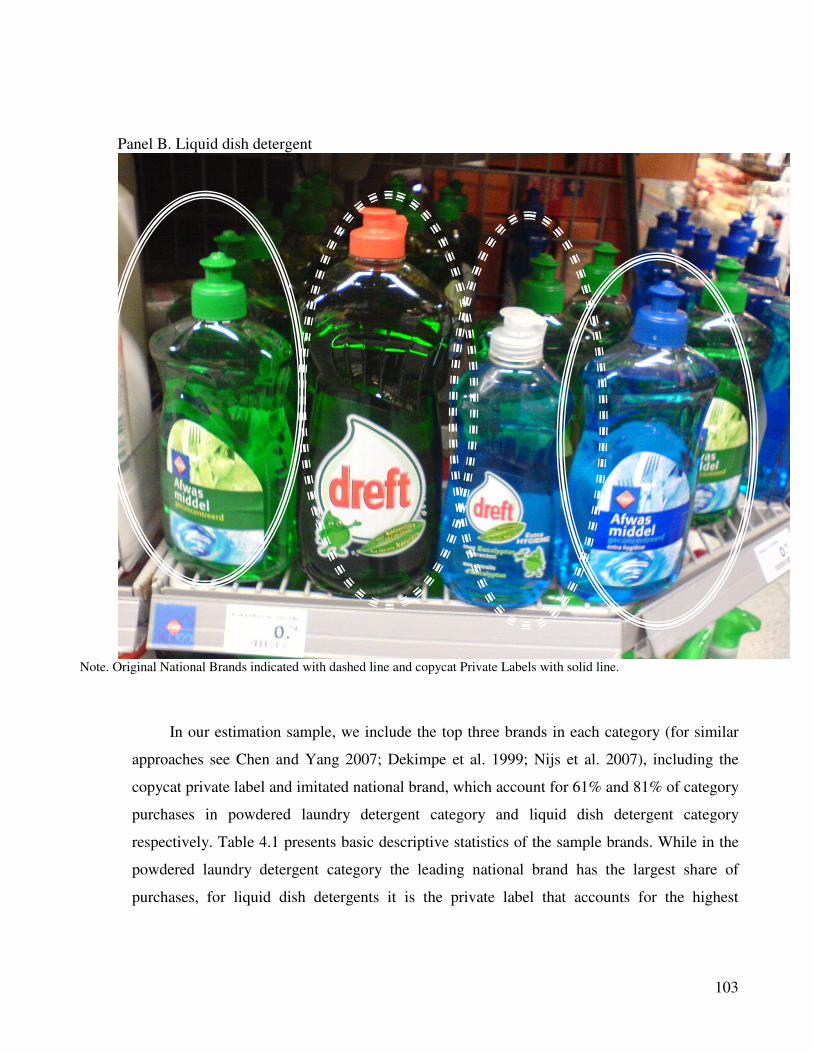
103
Panel B. Liquid dish detergent
Note. Original National Brands indicated with dashed line and copycat Private Labels with solid line.
In our estimation sample, we include the top three brands in each category (for similar
approaches see Chen and Yang 2007; Dekimpe et al. 1999; Nijs et al. 2007), including the
copycat private label and imitated national brand, which account for 61% and 81% of category
purchases in powdered laundry detergent category and liquid dish detergent category
respectively. Table 4.1 presents basic descriptive statistics of the sample brands. While in the
powdered laundry detergent category the leading national brand has the largest share of
purchases, for liquid dish detergents it is the private label that accounts for the highest
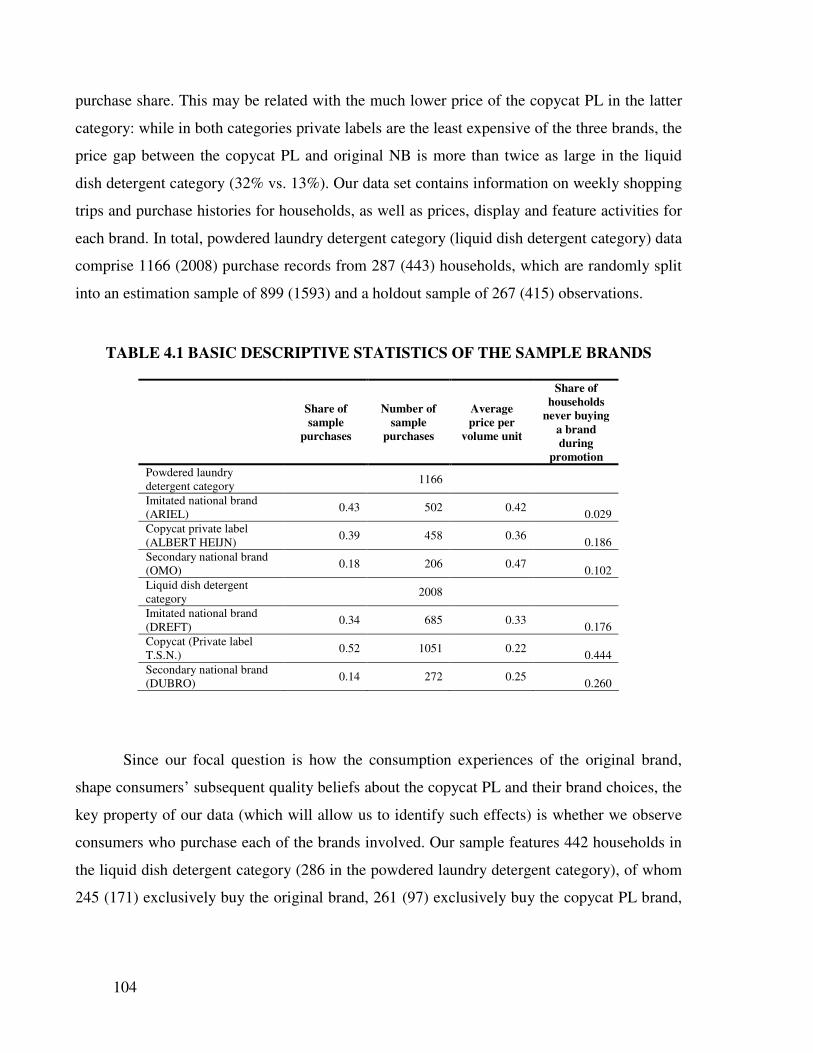
104
purchase share. This may be related with the much lower price of the copycat PL in the latter
category: while in both categories private labels are the least expensive of the three brands, the
price gap between the copycat PL and original NB is more than twice as large in the liquid
dish detergent category (32% vs. 13%). Our data set contains information on weekly shopping
trips and purchase histories for households, as well as prices, display and feature activities for
each brand. In total, powdered laundry detergent category (liquid dish detergent category) data
comprise 1166 (2008) purchase records from 287 (443) households, which are randomly split
into an estimation sample of 899 (1593) and a holdout sample of 267 (415) observations.
TABLE 4.1 BASIC DESCRIPTIVE STATISTICS OF THE SAMPLE BRANDS
Share of
sample
purchases
Number of
sample
purchases
Average
price per
volume unit
Share of
households
never buying
a brand
during
promotion
Powdered laundry
detergent category 1166
Imitated national brand
(ARIEL) 0.43 502 0.42
0.029
Copycat private label
(ALBERT HEIJN) 0.39 458 0.36
0.186
Secondary national brand
(OMO) 0.18 206 0.47
0.102
Liquid dish detergent
category 2008
Imitated national brand
(DREFT) 0.34 685 0.33
0.176
Copycat (Private label
T.S.N.) 0.52 1051 0.22
0.444
Secondary national brand
(DUBRO) 0.14 272 0.25
0.260
Since our focal question is how the consumption experiences of the original brand,
shape consumers’ subsequent quality beliefs about the copycat PL and their brand choices, the
key property of our data (which will allow us to identify such effects) is whether we observe
consumers who purchase each of the brands involved. Our sample features 442 households in
the liquid dish detergent category (286 in the powdered laundry detergent category), of whom
245 (171) exclusively buy the original brand, 261 (97) exclusively buy the copycat PL brand,
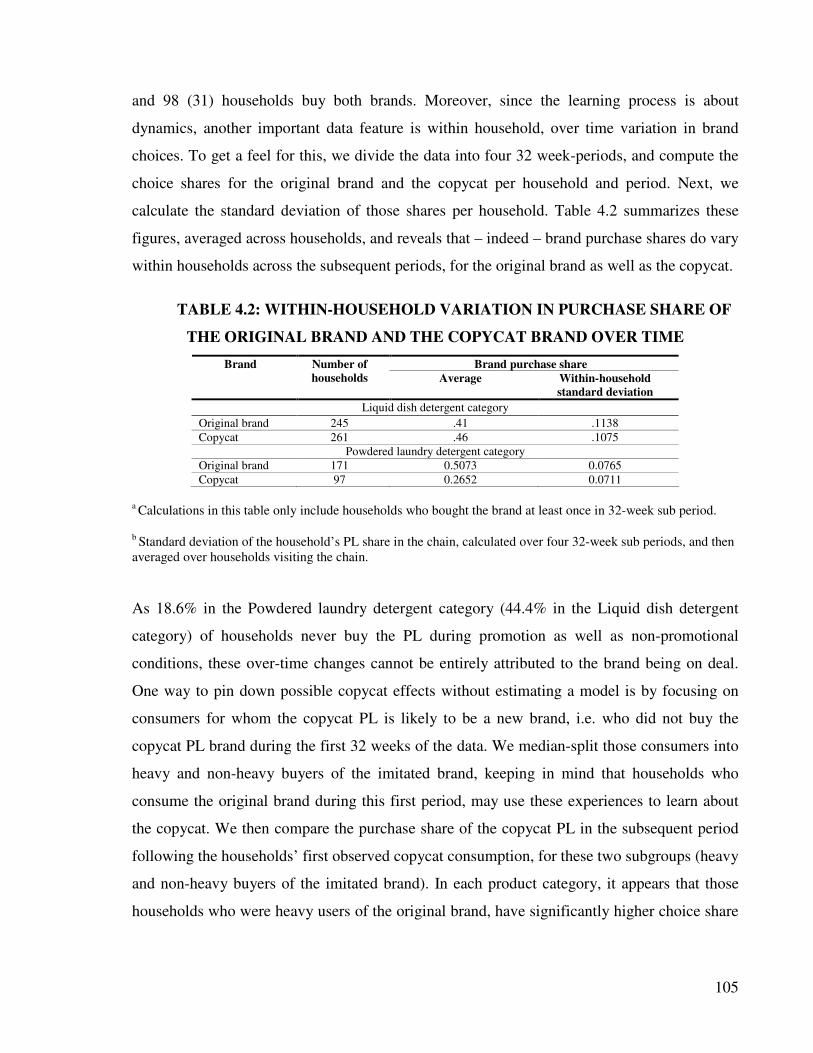
105
and 98 (31) households buy both brands. Moreover, since the learning process is about
dynamics, another important data feature is within household, over time variation in brand
choices. To get a feel for this, we divide the data into four 32 week-periods, and compute the
choice shares for the original brand and the copycat per household and period. Next, we
calculate the standard deviation of those shares per household. Table 4.2 summarizes these
figures, averaged across households, and reveals that – indeed – brand purchase shares do vary
within households across the subsequent periods, for the original brand as well as the copycat.
TABLE 4.2: WITHIN-HOUSEHOLD VARIATION IN PURCHASE SHARE OF
THE ORIGINAL BRAND AND THE COPYCAT BRAND OVER TIME
Brand purchase share Brand Number of
households Average Within-household
standard deviation
Liquid dish detergent category
Original brand 245 .41 .1138
Copycat 261 .46 .1075
Powdered laundry detergent category
Original brand 171 0.5073 0.0765
Copycat 97 0.2652 0.0711
a Calculations in this table only include households who bought the brand at least once in 32-week sub period.
b Standard deviation of the household’s PL share in the chain, calculated over four 32-week sub periods, and then
averaged over households visiting the chain.
As 18.6% in the Powdered laundry detergent category (44.4% in the Liquid dish detergent
category) of households never buy the PL during promotion as well as non-promotional
conditions, these over-time changes cannot be entirely attributed to the brand being on deal.
One way to pin down possible copycat effects without estimating a model is by focusing on
consumers for whom the copycat PL is likely to be a new brand, i.e. who did not buy the
copycat PL brand during the first 32 weeks of the data. We median-split those consumers into
heavy and non-heavy buyers of the imitated brand, keeping in mind that households who
consume the original brand during this first period, may use these experiences to learn about
the copycat. We then compare the purchase share of the copycat PL in the subsequent period
following the households’ first observed copycat consumption, for these two subgroups (heavy
and non-heavy buyers of the imitated brand). In each product category, it appears that those
households who were heavy users of the original brand, have significantly higher choice share
106
of the copycat PL in the subsequent period (p<.05) for Liquid dish detergent category, p<.01
for Powdered laundry detergent category), which is at least consistent with our expected cross-
brand spillovers.
4.4.2 Estimation Results
Fit and predictive validity compared with benchmark models.
Table 4.3 provides an overview of the estimated models’ descriptive and predictive
validity. In both categories, the model with contingent cross-brand learning (Mo
c|ConL)
outperforms the models with no learning (M1), within brand learning (M2), and cross-brand
learning from the original to the copycat (Mo
c), yielding improved in-sample log-likelihood
and AIC measures, and higher out-of-sample log-likelihood levels. Further model extensions,
e.g. including - next to contingent cross-brand learning - either reverse effects (Mo
c), or
reactance (Mo
c|Reac ), do not result in improvements in model fit or predictive validity.
Evidence for rewarding effects is somewhat ambiguous. While the incorporation of rewarding
behavior (model Mo
c|Rew) does not improve holdout sample performance for dish detergents,
it does lead to a slightly improved in-sample log-likelihood and superior predictions in the
powdered laundry detergent category – attesting that positive feedback towards the imitated
brand cannot be excluded in that category.
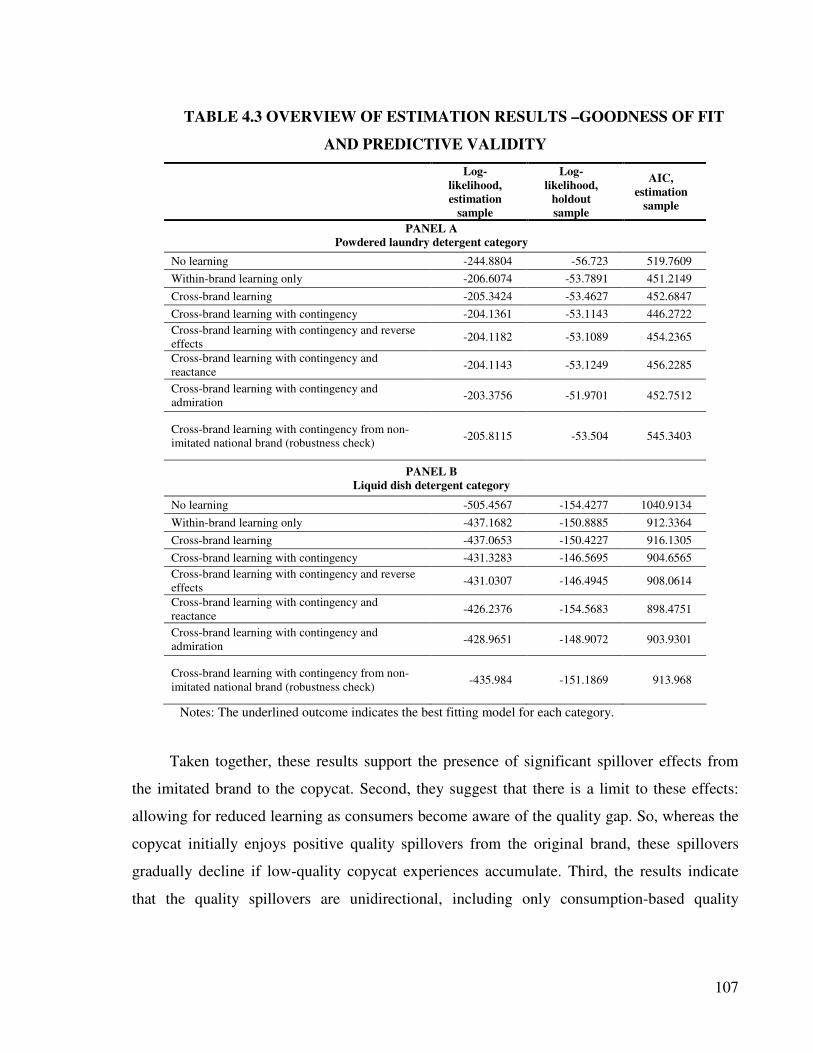
107
TABLE 4.3 OVERVIEW OF ESTIMATION RESULTS –GOODNESS OF FIT
AND PREDICTIVE VALIDITY
Log-
likelihood,
estimation
sample
Log-
likelihood,
holdout
sample
AIC,
estimation
sample
PANEL A
Powdered laundry detergent category
No learning -244.8804 -56.723 519.7609
Within-brand learning only -206.6074 -53.7891 451.2149
Cross-brand learning -205.3424 -53.4627 452.6847
Cross-brand learning with contingency -204.1361 -53.1143 446.2722
Cross-brand learning with contingency and reverse
effects -204.1182 -53.1089 454.2365
Cross-brand learning with contingency and
reactance -204.1143 -53.1249 456.2285
Cross-brand learning with contingency and
admiration -203.3756 -51.9701 452.7512
Cross-brand learning with contingency from non-
imitated national brand (robustness check) -205.8115 -53.504 545.3403
PANEL B
Liquid dish detergent category
No learning -505.4567 -154.4277 1040.9134
Within-brand learning only -437.1682 -150.8885 912.3364
Cross-brand learning -437.0653 -150.4227 916.1305
Cross-brand learning with contingency -431.3283 -146.5695 904.6565
Cross-brand learning with contingency and reverse
effects -431.0307 -146.4945 908.0614
Cross-brand learning with contingency and
reactance -426.2376 -154.5683 898.4751
Cross-brand learning with contingency and
admiration -428.9651 -148.9072 903.9301
Cross-brand learning with contingency from non-
imitated national brand (robustness check) -435.984 -151.1869 913.968
Notes: The underlined outcome indicates the best fitting model for each category.
Taken together, these results support the presence of significant spillover effects from
the imitated brand to the copycat. Second, they suggest that there is a limit to these effects:
allowing for reduced learning as consumers become aware of the quality gap. So, whereas the
copycat initially enjoys positive quality spillovers from the original brand, these spillovers
gradually decline if low-quality copycat experiences accumulate. Third, the results indicate
that the quality spillovers are unidirectional, including only consumption-based quality
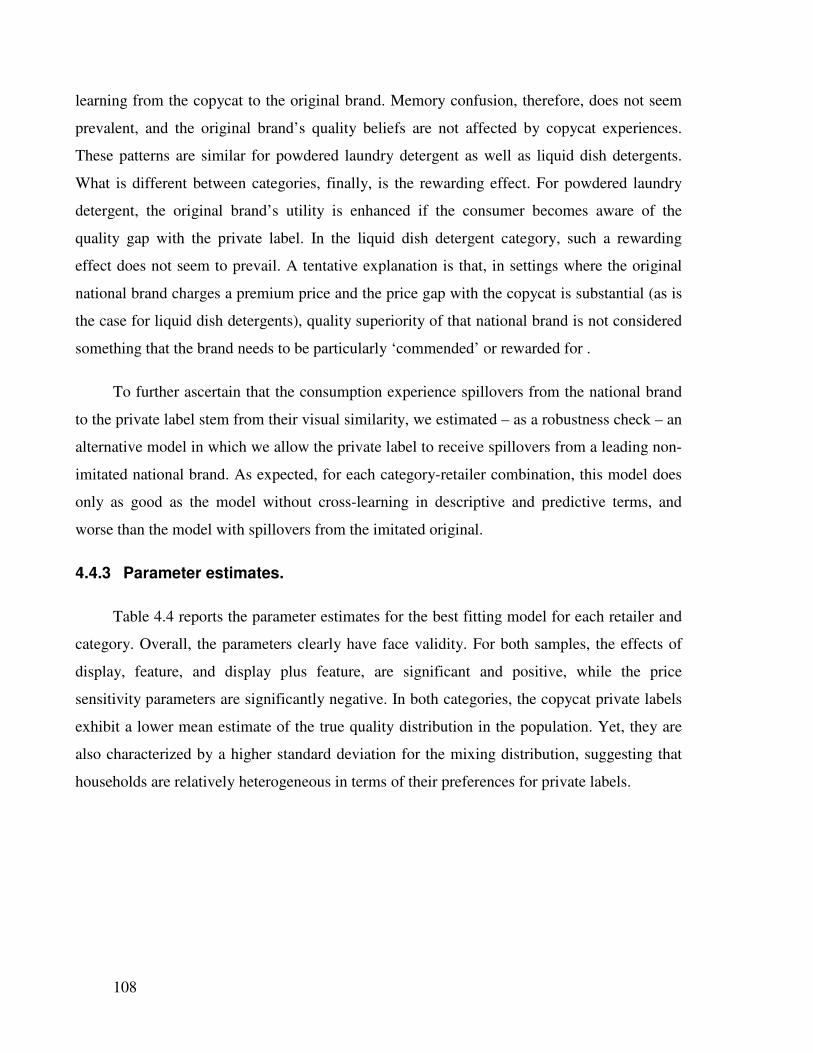
108
learning from the copycat to the original brand. Memory confusion, therefore, does not seem
prevalent, and the original brand’s quality beliefs are not affected by copycat experiences.
These patterns are similar for powdered laundry detergent as well as liquid dish detergents.
What is different between categories, finally, is the rewarding effect. For powdered laundry
detergent, the original brand’s utility is enhanced if the consumer becomes aware of the
quality gap with the private label. In the liquid dish detergent category, such a rewarding
effect does not seem to prevail. A tentative explanation is that, in settings where the original
national brand charges a premium price and the price gap with the copycat is substantial (as is
the case for liquid dish detergents), quality superiority of that national brand is not considered
something that the brand needs to be particularly ‘commended’ or rewarded for .
To further ascertain that the consumption experience spillovers from the national brand
to the private label stem from their visual similarity, we estimated – as a robustness check – an
alternative model in which we allow the private label to receive spillovers from a leading non-
imitated national brand. As expected, for each category-retailer combination, this model does
only as good as the model without cross-learning in descriptive and predictive terms, and
worse than the model with spillovers from the imitated original.
4.4.3 Parameter estimates.
Table 4.4 reports the parameter estimates for the best fitting model for each retailer and
category. Overall, the parameters clearly have face validity. For both samples, the effects of
display, feature, and display plus feature, are significant and positive, while the price
sensitivity parameters are significantly negative. In both categories, the copycat private labels
exhibit a lower mean estimate of the true quality distribution in the population. Yet, they are
also characterized by a higher standard deviation for the mixing distribution, suggesting that
households are relatively heterogeneous in terms of their preferences for private labels.
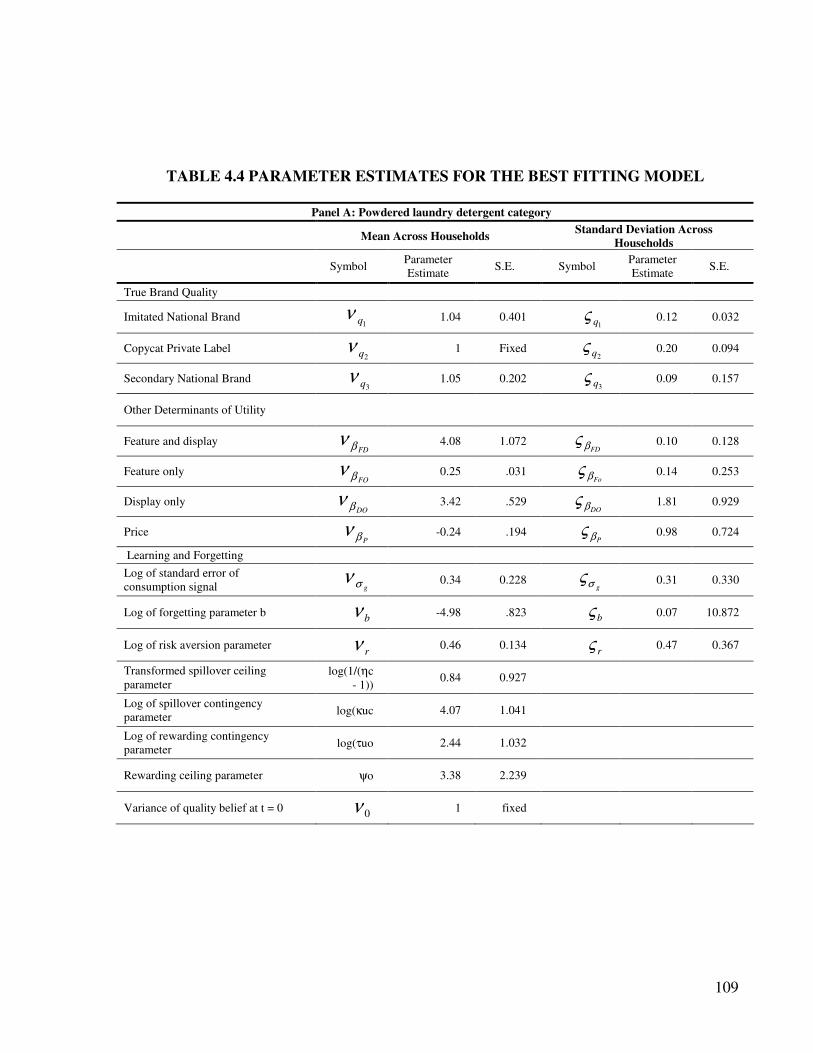
109
TABLE 4.4 PARAMETER ESTIMATES FOR THE BEST FITTING MODEL
Panel A: Powdered laundry detergent category
Mean Across Households Standard Deviation Across
Households
Symbol Parameter
Estimate S.E. Symbol
Parameter
Estimate S.E.
True Brand Quality
Imitated National Brand 1qν
1.04 0.401
1qς
0.12 0.032
Copycat Private Label 2qν
1 Fixed
2qς
0.20 0.094
Secondary National Brand 3qν
1.05 0.202
3qς
0.09 0.157
Other Determinants of Utility
Feature and display FDβν
4.08 1.072
FDβς
0.10 0.128
Feature only FOβν
0.25 .031
Foβς
0.14 0.253
Display only DOβν
3.42 .529
DOβς
1.81 0.929
Price Pβν
-0.24 .194
Pβς
0.98 0.724
Learning and Forgetting
Log of standard error of
consumption signal gσν
0.34 0.228 gσς
0.31 0.330
Log of forgetting parameter b bν
-4.98 .823
bς
0.07 10.872
Log of risk aversion parameter rν
0.46 0.134
rς
0.47 0.367
Transformed spillover ceiling
parameter
log(1/(ηc
- 1)) 0.84 0.927
Log of spillover contingency
parameter log(κuc 4.07 1.041
Log of rewarding contingency
parameter log(τuo 2.44 1.032
Rewarding ceiling parameter ψo 3.38 2.239
Variance of quality belief at t = 0 0ν
1 fixed
110
Panel B: Liquid dish detergent category
Mean Across Households Standard Deviation Across Households
Symbol Parameter
Estimate S.E. Symbol
Parameter
Estimate S.E.
True Brand Quality
Imitated National Brand 1qν
1 fixed
1qς
.68 .034
Copycat Private Label 2qν
.96 .185
2qς
.35 .087
Secondary National Brand 3qν
.76 .252
3qς
.09 .564
Other Determinants of Utility
Feature and display FDβν
11.58 2.835
FDβς
2.73 .554
Feature only FOβν
2.52 .971
Foβς
.68 .830
Display only DOβν
1.63 .819
DOβς
.52 3.276
Price Pβν
-1.21 .549
Pβς
.84 .932
Learning and Forgetting
Log of standard error of
consumption signal gσν
.78 .279 gσς
.12 1.317
Log of forgetting parameter b bν
-5.05 1.492
bς
.81 .474
Log of risk aversion
parameter rν
.08 .182 rς
.48 .816
Transformed spillover ceiling
parameter log(1/(ηc
- 1)) .83 .578
Log of spillover contingency
parameter log(κc) 4.09 1.297
Variance of quality belief at t
= 0 0ν
1 fixed
The risk aversion, consumption-based learning, and forgetting parameters are also in line
with earlier findings from the literature (e.g. Crawford and Shum 2005; Erdem and Keane
1996). As expected, risk aversion is higher for powdered laundry detergent than for liquid dish
detergents, implying stronger uncertainty avoidance in this category. It is interesting to
observe that the standard deviation of the consumption signal is lower for powdered laundry
detergent than for liquid dish detergents, suggesting that individual consumption signals are
more informative in the former category. At the same time, the standard deviation of this
parameter across the population is higher, indicating that consumers are more heterogeneous
111
in terms of how much they learn from a consumption experience as compared with the liquid
dish detergent category. Next, our findings imply that, on average, consumers forget half of
the knowledge gained through a single consumption within 16.15 weeks (powdered laundry
detergent) and 16.34 weeks (liquid dish detergents), figures comparable to those reported by
Mehta, Rajiv, and Srinivasan (2004) (19.8 weeks) and in Chapters 2 and 3.
Of key interest to us are the parameters related to cross-effects between the original
brand and the copycat. Based on the findings in Table 4.3, we retain two sets of estimates
here. First, we have the parameters ηc and κc, capturing the consumption experience spillovers
from the national brand to the copycat (see Equation [4.11], with u=c). The transformed
estimates of the ceiling parameter, ln(1/ηc -1), amount to . 83 and .85 for powdered laundry
detergent and liquid dish detergent category respectively, implying that when the imitating PL
and imitated NB are of the same quality, about 70% of the consumption signal from the
imitated NB is used to update the belief of the imitating PL. Transformed estimates for the
parameter κc, which reflects how strongly quality differences between the original and the
copycat reduce cross-learning, are also similar in both categories (ln(κc )= 4.06 and 4.09 for
powdered laundry detergent and liquid dish detergents, respectively). These parameter values
imply that in the absence of prior brand experience, cross effects would still occur up to a
quality difference of .25. However, this figure rapidly drops as the consumer’s knowledge
about the quality gap becomes more precise: after 10 consecutive brand purchases, spillovers
virtually disappear with a quality gap of .12 between the original and the copycat. These
figures should be considered relative to the difference between the (population mean) true
quality of the copycat and the original brands in our sample (which is about .05), and the
standard deviation of true brand quality in the sample (which ranges between .05 and .21).
A second set of estimates relates to the ‘rewarding’ effect (parameters ( )oψ and ( )oτ in
Equation [4.13]), which only improves predictions in the powdered laundry detergent
category. The parameter ( )oψ has the expected positive sign, suggesting that a large quality
advantage of the original over the copycat entails an extra utility ‘reward’ for the former. The

112
parameter ( )oτ is such that the effect is strongly contingent on consumers’ experience, as will
be illustrated in the next section.
4.4.4 Implications for choice shares
The results so far indicate that, while some copycatting effects seem absent (i.e. memory
confusion and reactance), others are at work (i.e. contingent cross-learning from the original to
the copycat in both categories, and rewarding behavior in the powdered laundry detergent
group). The key question remains, however, how the identified effects influence the choice
shares of the imitated brand and the copycat over time, and, in case ‘rewarding’ behavior takes
place, whether the retailer’s imitation strategy is ultimately beneficial (‘friend’) or harmful
(‘foe’) to the original national brand. Moreover, from a managerial perspective, it is interesting
to gauge how this impact depends on the brands’ relative positioning among consumers.
Given the complex, non-linear structure of the model, we need to conduct simulations to
illustrate the strategic implications and the economic significance of the findings. Below, we
use such a simulation approach. The results are plotted in Figures 4.3, 4.4 and 4.5. We
investigate how brands’ choice shares are impacted by (i) consumption based learning from
the original to the copycat on brand choice shares (Figure 4.3) and, (ii) for the powdered
laundry detergent category, rewarding behavior (Figure 4.4), as well as (iii) the total (net)
effect of cross-learning from consumption and rewarding (Figure 4.5). We consider how this
effect evolves over time (z-axis) and depending on relative positioning of the copycat PL and
original NB (x-axis). To obtain these results, we simulate 1000 purchase histories, composed
of 200 choices among the copycat PL, the imitated brand, and the non-imitated national brand.
The relative quality of the copycat PL vs. the original varies from -.5: copycat inferior, to +.5:
copycat superior. For each purchase history, we draw a parameter set from the estimated
parameter distributions in Table 4.4, panels A and B. We do this for a number of settings.
First, we ‘turn off’ both the spillover effects to the copycat (by using updating equations [4.5]
and [4.6] for all brands) and the rewarding effects (by using utility expression 3 for all brands).
Then, we ‘turn on’ the spillover effects to the copycat (by using learning Equations [4.7], [4.8]
and [4.11] for the original NB and copycat PL). Finally, we ‘turn on’ the rewarding effects
113
(using utility expression 13 for the original NB and the copycat PL). For each of these settings,
we compute the corresponding choice shares of the three brands, and then look at the share
differences.
Figure 4.3, Panel A, pictures the effect of cross-brand spillovers on the copycat private
label, Powdered laundry detergent18
. The figure shows that the copycat PL share gain from
cross-learning can become quite sizable, that is, up to 10 percentage points of choice share can
be transferred from the imitated NB to the copycat. As expected, the effect exists almost
exclusively when PLs are worse than NBs. Interestingly, provided that the PL is of lower
quality than the NB, the effect is very weakly sensitive to the size of the quality gap. About
50% of the effect is still present when the gap between the PL and the NB is 10 times larger
than the gap we observe in our sample. This casts doubt on whether the imitated national
brands can prevent spillovers by increasing their quality.
When the imitated NB has lower quality than the copycat, the impact of cross-brand
learning on the PL remains close to zero. Apparently, the negative impact of spillovers on the
copycat’s mean quality belief (experience with a lower quality original NB would lead to an
underestimation of the true copycat quality), is compensated by the positive effect of reduced
uncertainty. This finding suggests that top-quality PLs do not benefit from a copycat strategy.
18 Results for liquid dish detergents are qualitatively similar.
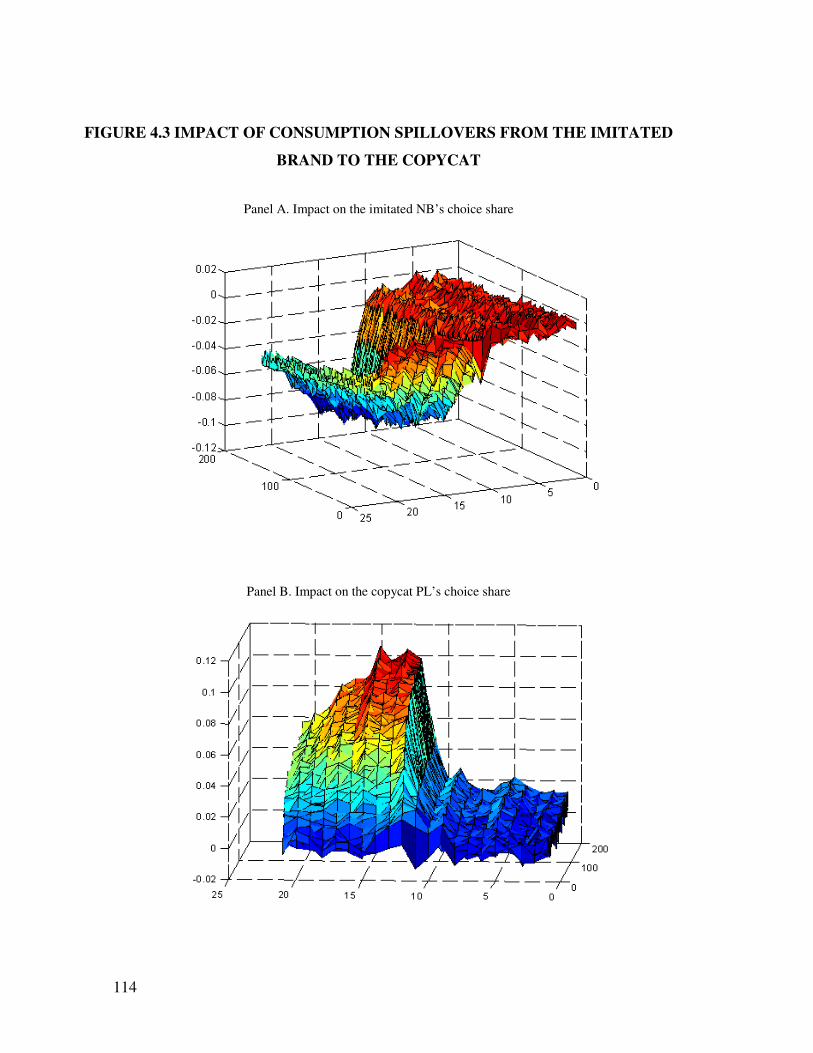
114
FIGURE 4.3 IMPACT OF CONSUMPTION SPILLOVERS FROM THE IMITATED
BRAND TO THE COPYCAT
Panel A. Impact on the imitated NB’s choice share
Panel B. Impact on the copycat PL’s choice share
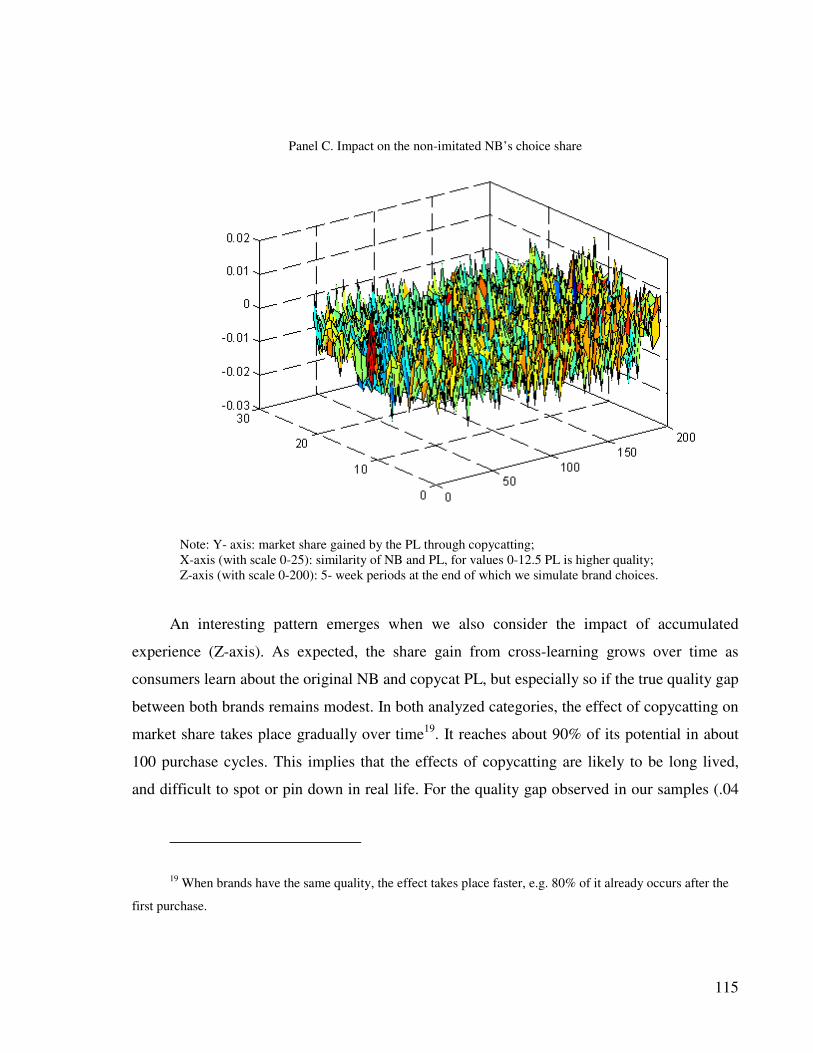
115
Panel C. Impact on the non-imitated NB’s choice share
Note: Y- axis: market share gained by the PL through copycatting;
X-axis (with scale 0-25): similarity of NB and PL, for values 0-12.5 PL is higher quality;
Z-axis (with scale 0-200): 5- week periods at the end of which we simulate brand choices.
An interesting pattern emerges when we also consider the impact of accumulated
experience (Z-axis). As expected, the share gain from cross-learning grows over time as
consumers learn about the original NB and copycat PL, but especially so if the true quality gap
between both brands remains modest. In both analyzed categories, the effect of copycatting on
market share takes place gradually over time19
. It reaches about 90% of its potential in about
100 purchase cycles. This implies that the effects of copycatting are likely to be long lived,
and difficult to spot or pin down in real life. For the quality gap observed in our samples (.04
19 When brands have the same quality, the effect takes place faster, e.g. 80% of it already occurs after the
first purchase.
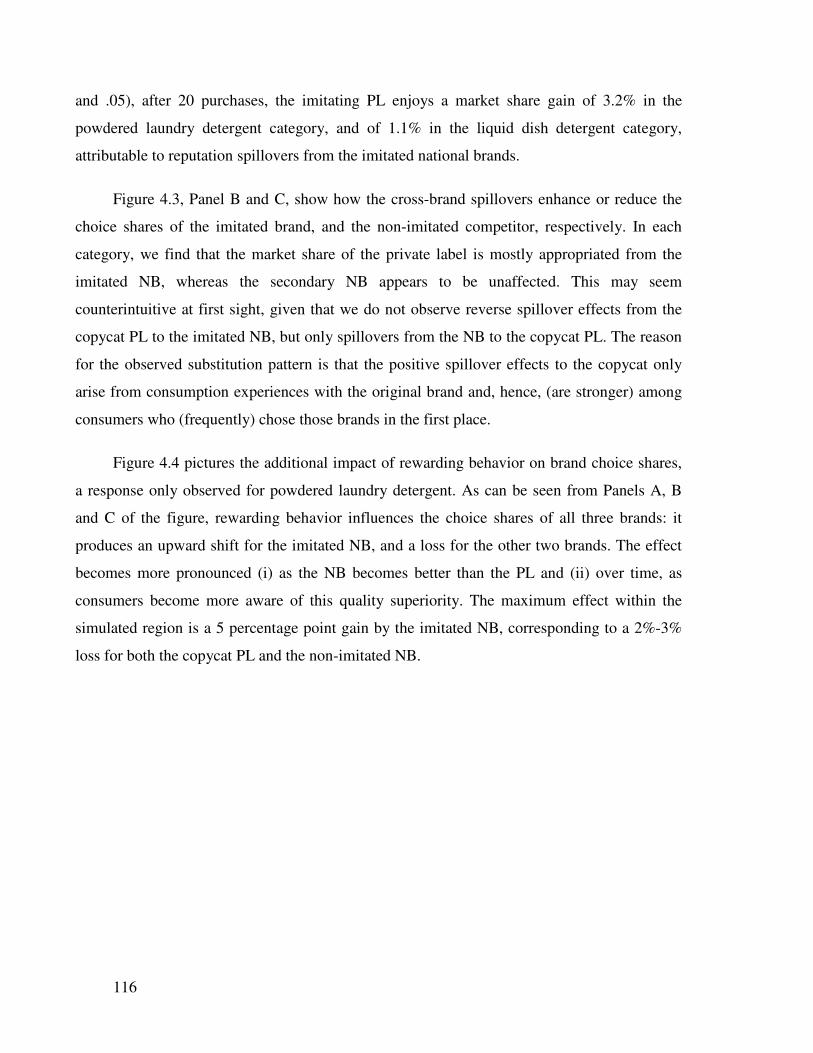
116
and .05), after 20 purchases, the imitating PL enjoys a market share gain of 3.2% in the
powdered laundry detergent category, and of 1.1% in the liquid dish detergent category,
attributable to reputation spillovers from the imitated national brands.
Figure 4.3, Panel B and C, show how the cross-brand spillovers enhance or reduce the
choice shares of the imitated brand, and the non-imitated competitor, respectively. In each
category, we find that the market share of the private label is mostly appropriated from the
imitated NB, whereas the secondary NB appears to be unaffected. This may seem
counterintuitive at first sight, given that we do not observe reverse spillover effects from the
copycat PL to the imitated NB, but only spillovers from the NB to the copycat PL. The reason
for the observed substitution pattern is that the positive spillover effects to the copycat only
arise from consumption experiences with the original brand and, hence, (are stronger) among
consumers who (frequently) chose those brands in the first place.
Figure 4.4 pictures the additional impact of rewarding behavior on brand choice shares,
a response only observed for powdered laundry detergent. As can be seen from Panels A, B
and C of the figure, rewarding behavior influences the choice shares of all three brands: it
produces an upward shift for the imitated NB, and a loss for the other two brands. The effect
becomes more pronounced (i) as the NB becomes better than the PL and (ii) over time, as
consumers become more aware of this quality superiority. The maximum effect within the
simulated region is a 5 percentage point gain by the imitated NB, corresponding to a 2%-3%
loss for both the copycat PL and the non-imitated NB.

117
FIGURE 4.4 IMPACT OF REWARDING BEHAVIOR
Panel A. Impact on the imitated NB’s choice share
Panel B. Impact on the copycat PL’s choice share
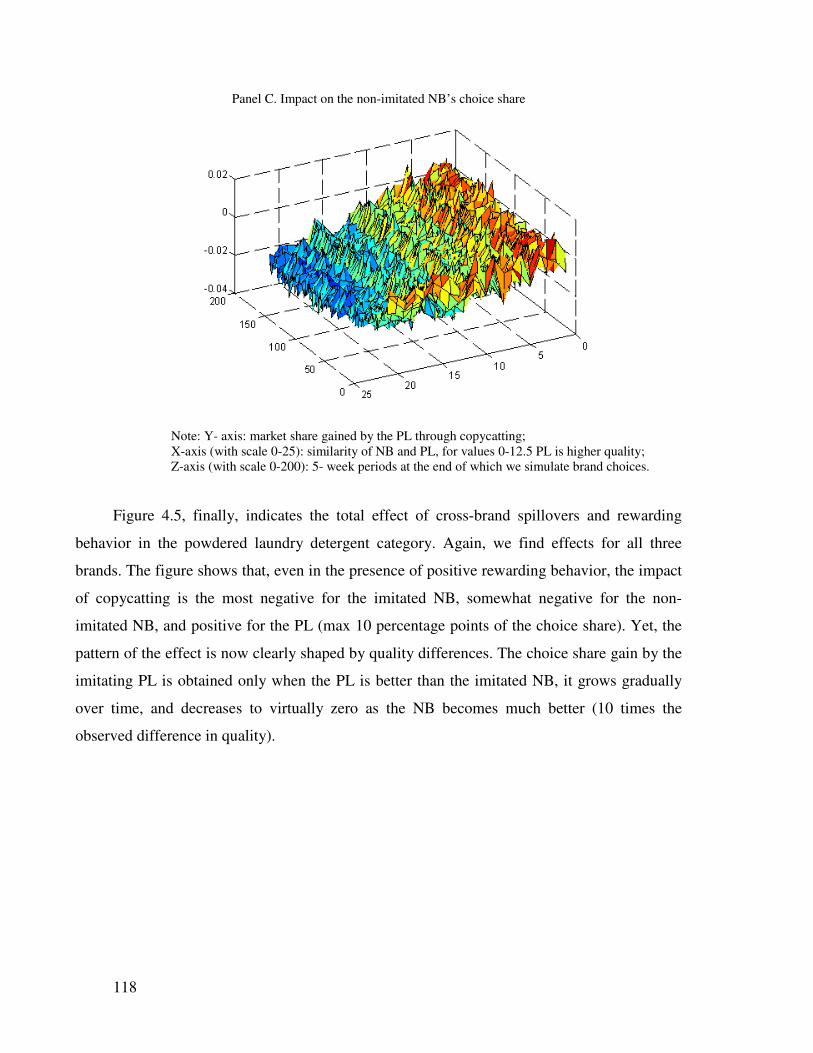
118
Panel C. Impact on the non-imitated NB’s choice share
Note: Y- axis: market share gained by the PL through copycatting;
X-axis (with scale 0-25): similarity of NB and PL, for values 0-12.5 PL is higher quality;
Z-axis (with scale 0-200): 5- week periods at the end of which we simulate brand choices.
Figure 4.5, finally, indicates the total effect of cross-brand spillovers and rewarding
behavior in the powdered laundry detergent category. Again, we find effects for all three
brands. The figure shows that, even in the presence of positive rewarding behavior, the impact
of copycatting is the most negative for the imitated NB, somewhat negative for the non-
imitated NB, and positive for the PL (max 10 percentage points of the choice share). Yet, the
pattern of the effect is now clearly shaped by quality differences. The choice share gain by the
imitating PL is obtained only when the PL is better than the imitated NB, it grows gradually
over time, and decreases to virtually zero as the NB becomes much better (10 times the
observed difference in quality).

119
FIGURE 4.5 COMBINED CROSS-BRAND SPILLOVERS AND REWARDING
EFFECT (POWDERED LAUNDRY DETERGENT)
Panel A. Impact on the imitated NB’s choice share
Panel B. Impact on the copycat PL’s choice share
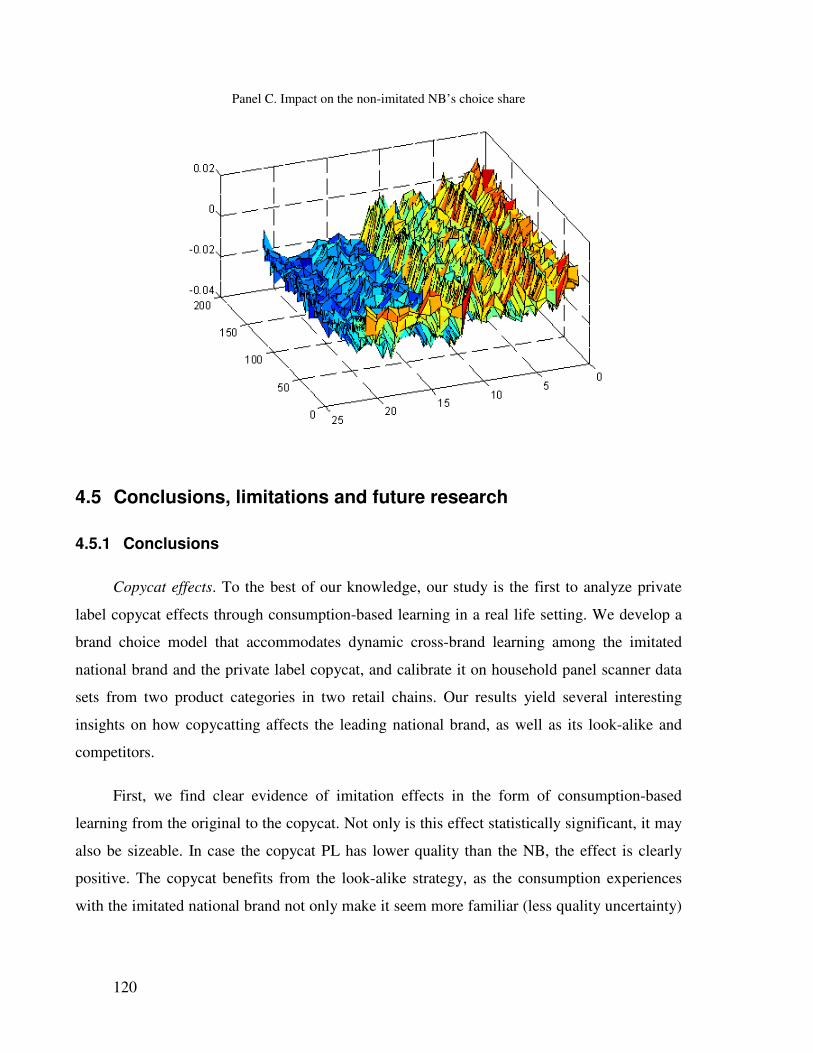
120
Panel C. Impact on the non-imitated NB’s choice share
4.5 Conclusions, limitations and future research
4.5.1 Conclusions
Copycat effects. To the best of our knowledge, our study is the first to analyze private
label copycat effects through consumption-based learning in a real life setting. We develop a
brand choice model that accommodates dynamic cross-brand learning among the imitated
national brand and the private label copycat, and calibrate it on household panel scanner data
sets from two product categories in two retail chains. Our results yield several interesting
insights on how copycatting affects the leading national brand, as well as its look-alike and
competitors.
First, we find clear evidence of imitation effects in the form of consumption-based
learning from the original to the copycat. Not only is this effect statistically significant, it may
also be sizeable. In case the copycat PL has lower quality than the NB, the effect is clearly
positive. The copycat benefits from the look-alike strategy, as the consumption experiences
with the imitated national brand not only make it seem more familiar (less quality uncertainty)
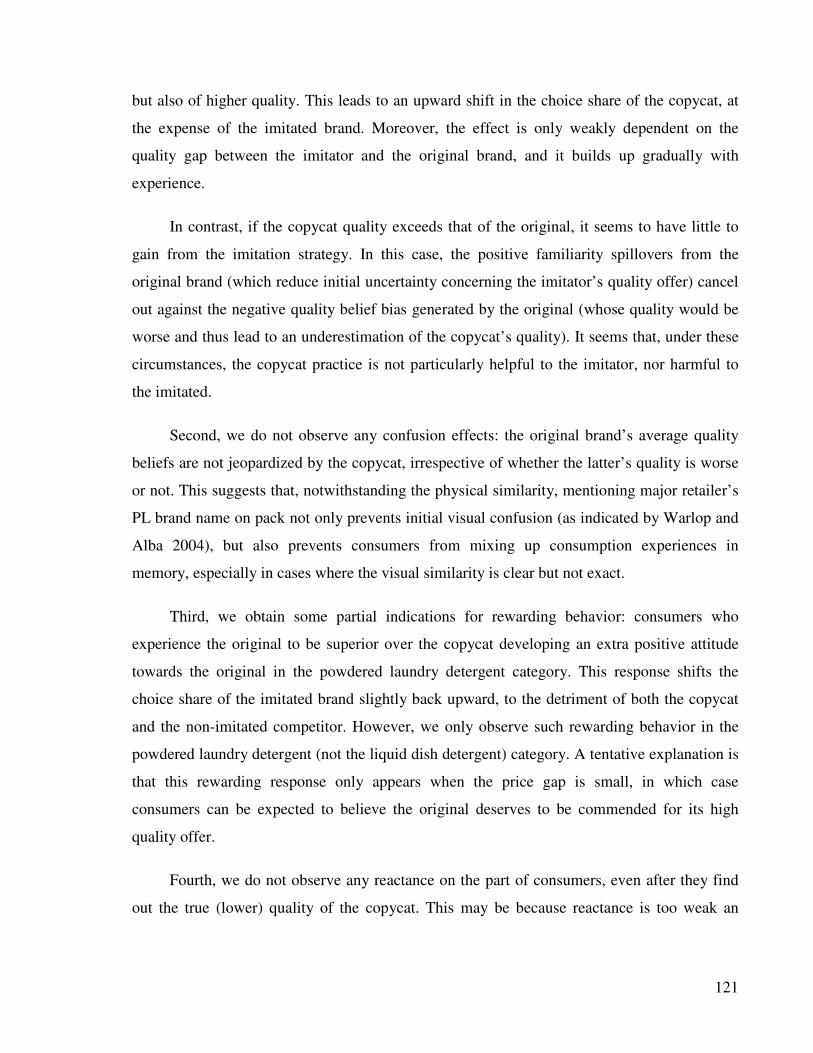
121
but also of higher quality. This leads to an upward shift in the choice share of the copycat, at
the expense of the imitated brand. Moreover, the effect is only weakly dependent on the
quality gap between the imitator and the original brand, and it builds up gradually with
experience.
In contrast, if the copycat quality exceeds that of the original, it seems to have little to
gain from the imitation strategy. In this case, the positive familiarity spillovers from the
original brand (which reduce initial uncertainty concerning the imitator’s quality offer) cancel
out against the negative quality belief bias generated by the original (whose quality would be
worse and thus lead to an underestimation of the copycat’s quality). It seems that, under these
circumstances, the copycat practice is not particularly helpful to the imitator, nor harmful to
the imitated.
Second, we do not observe any confusion effects: the original brand’s average quality
beliefs are not jeopardized by the copycat, irrespective of whether the latter’s quality is worse
or not. This suggests that, notwithstanding the physical similarity, mentioning major retailer’s
PL brand name on pack not only prevents initial visual confusion (as indicated by Warlop and
Alba 2004), but also prevents consumers from mixing up consumption experiences in
memory, especially in cases where the visual similarity is clear but not exact.
Third, we obtain some partial indications for rewarding behavior: consumers who
experience the original to be superior over the copycat developing an extra positive attitude
towards the original in the powdered laundry detergent category. This response shifts the
choice share of the imitated brand slightly back upward, to the detriment of both the copycat
and the non-imitated competitor. However, we only observe such rewarding behavior in the
powdered laundry detergent (not the liquid dish detergent) category. A tentative explanation is
that this rewarding response only appears when the price gap is small, in which case
consumers can be expected to believe the original deserves to be commended for its high
quality offer.
Fourth, we do not observe any reactance on the part of consumers, even after they find
out the true (lower) quality of the copycat. This may be because reactance is too weak an

122
effect to show up in a real life setting, or because it does not exist in our particular data set.
Regarding the latter point, in our sample, the PL name is clearly indicated on the package such
that retailers cannot really be accused of trying to lure consumers into picking up the wrong
pack. Also, our copycat PLs are cheaper and, in the eyes of the ‘average’ consumer, not much
worse than the imitated NBs. Therefore, the quality gaps relative to the price gaps may have
been insufficient to trigger reactance among panel members. We note, however, that our two
settings fall within the typical copycat price and quality description given by Kumar and
Steenkamp (2007), suggesting that our observed effects may apply for many commonly
observed copycat situations.
Apart from shedding light on the separate mechanisms, our results also document the
combined effect of copycatting over time. We find that, even though the lower quality copycat
does have some ‘friendly’ features for the original brand in the form of rewarding behavior,
the typical net effect is that of a ‘foe’: the imitation strategy generating extra choice share for
the PL imitator, mostly at the expense of the original brand. Only if the leading brand offers
by far superior quality at a price not too high compared to the imitator, do we find the
imitation effect to die down.
Managerial implications. Our findings have several implications for managers. From the
retailer’s perspective, we provide real-life evidence for the overarching message that
copycatting pays off. Interestingly, our results suggest that, when pursuing a look-alike
strategy, there is not much to gain from offering improved quality over the original. Instead, it
seems that such an approach would actually cause the potential benefits of copycatting to
dilute. Clearly, this is a tentative and challenging finding that needs further verification. It
does, however, corroborate Kumar and Steenkamp (2007)’s observation that retailers aiming
to establish a premium quality position should not combine this with an imitation strategy. The
advantages of copycatting become most visible if the imitating PL’s quality is below that of
the leading national brand. It also appears that even larger gaps are fine, it may be that this
holds only as long as there is a sufficient price differential with the leading brand to justify this
difference and avoid rewarding behavior towards the original NB.
123
For leading manufacturers, the ‘mirror’ message is twofold. First, private labels with
quality clearly superior to that of the national brand, do not seem to become more of a ‘foe’ by
adopting a copycat approach. A tentative conclusion is that, for those private labels, there
seems to be little point in ‘forcing’ them to abandon the imitation strategy. Second, the
findings are quite different for the more common lower quality copycats. Even though these
copycats may exhibit some ‘friendly’ features in the form of rewarding effects, the overall
impact of their imitation strategy seems particularly detrimental to the imitated brand. Even in
the absence of visual confusion, such copycats may hurt the original’s market share more than
that of non-imitated competitors, and especially steal away its regular brand buyers with
higher than average quality beliefs. However, given that the effect is observed with non-exact
trade dress imitation (and, hence, low likelihood of visual brand confusion), litigation is
unlikely to be a successful defense strategy. Striving for superior quality does not seem to be a
‘sure cure’ either: while our model suggests that spillovers diminish as the NB-copycat PL
quality gap increases, the feasibility of this strategy is doubtful given how large the quality gap
would need to be for spillovers to disappear, or rewarding behavior to take over. Our findings,
therefore, are in line with the claim that the NB’s window of opportunity lies in continued
innovation in product features and packaging (Kumar and Steenkamp 2007), reaping the
benefits of innovation successes before established retailers’ copycats have truly ‘settled in’.
Last but not least, our study may have relevance for policy makers. The typical focus in
litigation, and criterion to rule against copycats, was the presence of immediate visual
confusion. Our study empirically confirms earlier statements by, e.g., Collins-Dodd and
Zaichowsky (1999) and Warlop and Alba (2004) that copycats’ harmful effect for the original
brand may well extend beyond such visual confusion. Our results also suggest that the effect
gradually evolves - so that the full copycat impact may only become apparent over time.
While this makes the copycat implications difficult to pin down without longitudinal data, we
also indicate conditions under which these effects are more likely to pertain and that may
serve as guidelines for policy refinements.
124
4.5.2 Limitations and Directions for Future research.
While our study provides real life evidence on the prevalence of cross-learning effects
towards copycats, it also raises several interesting issues that need further study. For one, our
findings suggest that the amount of spillovers and the effect of rewarding behavior depends on
the quality of the copycat vis-à-vis the imitated brand. Even though this observed pattern
makes intuitive sense and is in line with prior expectations, it would be interesting to confirm
the effect of the quality gap in other settings, where quality differences not only arise among
heterogeneous consumers, but also across a range of imitator-imitated brand pairs. Also, we
found evidence of rewarding behavior only in settings where superior quality evaluations of
the original brand went along with only a modest price premium. Yet, this effect of price
positioning in interaction with copycat spillovers and rewarding behavior certainly needs
further investigation.
Second, even though we already observe the imitation strategy to be predominantly
harmful to the original brand, we do not claim to have captured its full effect, and expect our
estimates to be only conservative. For instance, the look-alike strategy may increase the
likelihood of PL inclusion in the consideration set when it first enters the market. Proper
assessment of that effect would call for the analysis of a broad set of private label
introductions, some with and some without a copycat strategy – an approach calling for
different data and models than ours. Also, our analysis is confined to quality belief and brand
choice effects. Yet, as indicated by Kumar and Steenkamp (2007), retailers adopting a copycat
strategy may primarily aim to (i) improve their negotiation power and margins and (ii) forego
the product development risks and costs linked to an ‘original product’ strategy. Even though
these effects may be hard to quantify, they seem to add to the conclusion that, even in the
absence of immediate visual confusion, the PL copycat practice may be quite harmful to the
leading national brands.
Third, in a somewhat similar vein, it can be expected that the imitation strategy becomes
more detrimental to the original brand, as the visual similarity gets more striking than was the
case in our empirical study. Even if increased package similarity does not bring about

125
immediate visual confusion, it may cause the product experiences to become confused in
memory and, unless the copycat’s quality exceeds that of the original, produce detrimental
reversed spillovers on the average quality belief of the imitated brand as well. This would
further add to the negative consequences for the imitated brand. At the same time, too blatant
imitations may make retailers ‘walk a thin line’, as reactance towards the copycat may be
luring if its quality turns out to be too low (Van Horen et al. 2008; Warlop and Alba 2004).
Fourth, it would be relevant to drill down other types of copycatting-related spillovers,
such as spillovers from advertising. These could appear directly, i.e. ads of the original NB
benefiting the copycat PL, but also indirectly, i.e. ads driving choice of the original NB and
resulting in consumption benefits for the copycat PL. Our model includes only the latter, and
only implicitly so since we do not have advertising data, thereby leaving out another potential
source of free-riding for the imitating brand. Interestingly, the degree of spillovers from ad
messages might be driven by the specific advertising content: ad executions emphasizing the
NB brand’s genuine character and uniqueness possibly diminishing the copycat’s potential to
free-ride on its reputation. Intriguing, also, is the role of in-store display. In case of
copycatting, it is not uncommon for the retailer to assign the imitating and imitated brand a
prominent and adjacent position on the shelf – a practice also observed for our two data sets.
Such joint and central placement may foster spillovers from the original to the copycat, but
may also enhance attention to the imitated NB at the expense of NB competitors. Our model
results implicitly reflect the impact of shelf placement, which we cannot separate out from
brand utilities as it does not change over time in our data. Future research considering
alternative displays may separate out this net placement effect. If it is positive, being copied
by a superior quality PL could actually be beneficial to the leading national brand, and such
superior-quality copycats could turn out to be ‘friends’. Especially from a managerial
perspective, these are important issues for future study, as they could help managers fine tune
their look-alike strategies, or defensive reactions to them.
Fifth, an interesting issue is to what extent retailer characteristics affect the success of
the imitation strategy. One possibility is that the effects are purely driven by actual quality
differences between the original brand and the copycat in the specific product category. In that
126
case, if their copycat is superior to the leading brand in one category but not in other, retailers
should assess appropriateness of copycatting for each category separately. Conversely, the
believability of the ‘same-quality’ signal through package similarity, and hence the spillover
effects, may be strongly shaped by overall retailer equity, which could make the look-alike
approach equally beneficial for high-equity retailers across the board. Insights into these
phenomena would be relevant not just for retailers, but also for leading manufacturers in
setting up their defenses vis-à-vis specific retailer accounts. Finally, our results were obtained
for two traditional, Hi-Lo retailers adopting an umbrella-brand private label strategy. Whether
our observed effects also pertain to hard discounters, or other retailers whose private label
name is less clearly identifiable as a retailer brand, is a fascinating area for future study.
Sixth, like in previous chapters, our data do not cover major changes in retailer copycat
policies. Our results are, therefore, based on two sources of inferences. First, we draw
inferences from changes in consumer behavior as a result of changes in their experience with
the brands. Second, we compare the dynamics in consumer behavior (i.e. consumer learning)
for brand pairs involved in copycatting (i.e. a copycat PL and an original brand) vs. other
brand pairs (i.e. a copycat PL and a non-imitated NB). Both sources of variation point in the
direction consistent with our expectations. Even so, we should be cautious in deriving policy
implications from our findings. Stronger claims could be made if we observed, for instance,
the emergence of an imitation situation (i.e. a PL starting to imitate the trade-dress of an
original brand) or the disappearance of copycatting (e.g. one of the involved brands revises its
trade-dress), settings that we look forward to studying in the future.
Finally, as remarked earlier, our model extension is not structural in the sense that our
cross-effects do not result from correlated belief priors (Erdem, 1998) or correlated
consumption signals (Coscelli and Shum, 2004). Extending these structural models to
incorporate the asymmetric spillover effects associated with copycatting is a worthwhile
endeavor, and high on our research agenda.
127
5 General conclusions and directions for future research
Consumers seek to develop their beliefs, and minimize their uncertainty, about the
quality of brands. While they can do so using multiple sources of information, brand beliefs
are strongly shaped over time (“learned”) through consumption experiences with these brands.
Such learning is an important process from the point of view of consumers, firms, and the
economy. Through consumption-based learning, consumers can identify brands that best fit
their personal tastes. For firms, it offers the possibility to capitalize on their quality
investments. From a societal perspective, learning may help ensure the benefits of
competition, as brands need to measure up to their rivals in terms of quality.
Consumption-based learning is not only an important process, but also an intricate and
multi-faceted one. While consumer learning is strongest for new and complex products, it is
also present in mature contexts albeit with vast differences in the rate of learning across
product categories and across individuals. As to the nature of the effect, there are two sides to
learning: consumption experiences shape the average level of brand quality beliefs, but also a
consumer’s uncertainty or the ‘precision’ of these beliefs. Furthermore, consumption not only
reveals information about the brand itself, but may also spill over to other, similar brands – a
process that we refer to as cross-brand learning. Such cross-brand learning may affect brand
performance in several ways. On the one hand, the reputation earned by a brand can spill over
to its rivals and effectively subsidize them, increasing their share at the expense of the
originally consumed brand. On the other hand, these spillovers can be reciprocal, and possibly
128
even beneficial for all brands involved. Perceived brand-quality in terms of quality level and
quality uncertainty are key determinants of private label usage, and different forms of cross-
brand learning have a significant influence on the perceived quality of private labels.
The essays in this thesis zoom in on these aspects of consumption-based learning.
Below, we start by summarizing the setup and findings of the separate chapters. Next, we
place these results in a broader perspective – highlighting take-away insights across the
different essays. We end with a discussion of limitations and future research areas to be
addressed.
5.1 Summary of Findings
Prior research mainly associates learning with infrequently-purchased, high involvement
or strongly evolving categories, such as pharmaceuticals. However, recent empirical findings
suggest that consumption-based quality learning does take place in more established
categories. In chapter two of this thesis we expand the literature, which examines only a few
mature-category products and does not systematically look into the drivers of learning for
mature packaged goods categories. In particular, we are interested in (1) the prevalence and
magnitude of learning about frequently-purchased consumer goods, (2) the variation in
learning across packaged goods categories and across households, and (3) the underlying
learning drivers. Our household-level brand choice models apply Bayesian learning in 20
product categories, yielding category- and household-specific posterior estimates of the
parameters showing the extent to which consumer knowledge is updated with new
consumption-based information. We find that learning is present in almost all categories,
albeit very weak in some of those categories, and that cross-category and cross-household
variation are both vast and of a comparable magnitude. Notably, we observe very low
correlations in cross-category household learning, suggesting that consumption-based
knowledge updating is not a household trait. Our study reveals that learning is negatively
associated with variety seeking, positively linked to perceived category risk and category
expensiveness, and more prevalent among consumers with high category purchase frequency.
129
Building on this evidence of own-brand learning for packaged consumer goods, chapter
three of this thesis zooms in on two novel features in the learning literature, by studying cross-
brand learning effects, and focusing on retailer-owned or private label brands. In doing so,
this chapter attempts to bridge two views of private labels: one, that private labels are a key
tool for store differentiation, and two, that consumers do not distinguish between PLs of
different chains. To investigate this issue, we raise the questions of when investments in PL
quality set retailers apart from competitors, and when they subsidize rival PLs. We expect that
consumers generalize knowledge from product experience across PLs, and that such cross-
brand learning depends on perceived quality similarity, which decreases with actual brand
differences and as consumers learn. Building on earlier work in Bayesian learning models, we
propose a brand choice model that captures conditional cross-brand learning through quality
belief spillovers (consumers adjust beliefs about PL quality on the basis of consumption
experience) and familiarity spillovers (uncertainty about a PL diminishes with rival PL
consumption).
We calibrate this model on a household scanner panel dataset in the liquid dish
detergents category, focusing on households that shop at multiple stores. The results yield
evidence of cross-retailer PL learning, and reveal that familiarity spillovers dominate quality
belief spillovers. From a private label brand management perspective, these results seem to
favor herd (average quality) and free-riding (below average quality) positioning strategies,
especially for retailers whose clientele primarily consists of multiple-store shoppers. Retailers
pursuing quality leadership can break away from the mainstream PL image by establishing a
sufficiently large quality gap, but, by doing so, forego the benefits of familiarity spillovers.
The fourth chapter of the thesis further pursues the implications of cross-brand learning,
but from an entirely different perspective. Specifically, this chapter seeks to assess whether
copycat private labels are a ‘friend’ or a ‘foe’ of the leading national brands that they imitate.
On the one hand, copycatting can lead to quality spillovers from the imitated national brand to
the copycat private label, or even to two-way spillovers between the brands. This would make
the copycat a ‘foe,’ free-riding on the reputation of the original national brand. On the other
hand, if consumers experience disappointing quality with the imitator brand, this may incite
130
‘reactance’ against the copycat and ‘rewarding’ behavior towards the original brand, thus
turning the copycat into a ‘friend’. To investigate these phenomena, we extend existing
models by accommodating dynamic cross-brand learning among the original national brand
and the private label copycat. We calibrate it on household panel scanner datasets from two
product categories in two retail chains. Our results indicate that, even if the trade-dress
imitation is not exact and not blatant enough to cause visual confusion, there are non-
negligible spillover effects from the original brand to the imitator brand. We find that
consumers do shape their quality beliefs of copycat private labels based on consumption
experiences with the original national brand. These spillovers trigger choice shifts, especially
from the imitated to the imitator brand, which only gradually dilute brand’s choice share when
true quality differences can be perceived, or as consumers become knowledgeable about
brands. While we do find partial evidence of ‘rewarding’ behavior, this positive effect for the
national brand is overwhelmed by the negative quality spillover implications. We find no
evidence of memory confusion or assimilation (i.e., quality beliefs about the original being
affected by copycat usage), or of experience-based ‘reactance’ (i.e. consumers refuting the
imitating private label if its quality appears too low compared with the imitated national
brand). In all, our findings document that private labels with a quality level exceeding that of
the leading national brand do not become more threatening if they adopt a copycat approach.
For lower quality copycats, even though they may exhibit some ‘friendly’ features in the form
of rewarding effects for the original, the overall impact of their imitation strategy is
detrimental to the national brand. Even non-blatant imitations, for which the traditional
litigation argument of ‘visual’ confusion is hard to uphold, may cause a sizeable reduction in
the original’s choice share, and warrant manufacturer attention.
5.2 Implications
The findings presented in this thesis generate a number of substantive and managerial
insights. As we already discussed specific implications in the previous chapters, we do not
repeat them here. Instead, we discuss some of the broader implications of our findings below.
131
Consumer brand quality learning is important but easily overlooked
Recent study documents that early entry may endow leading national brands with a
sustained advantage in terms of share and quality beliefs, even years after the introduction
(Bronnenberg et al. 2009). At the same time, the presence of consumer learning through
consumption in mature categories suggests that these established brands do need to actively
‘safeguard’ their quality beliefs vis-à-vis new manufacturer brand entrants or, in many
instances, private labels. Otherwise, these new challengers will gradually gain ground as
consumers become less uncertain about them. We find that the changes in brand market share
resulting from quality learning may be substantial and therefore managerially relevant.
However, these changes come about gradually, and take place at different rates for different
consumers. This makes it rather difficult for managers to appreciate or even detect quality
learning induced changes in brand market share, particularly when their focus is on short term
brand returns. Established brands commanding large market shares may, as a result, be
tempted to “rest on their laurels.” To avoid this, managers should monitor their brands using
models capturing long term evolution of the market place, such as the structural learning
models used here (for broader discussion on structural models see Bronnenberg et al. 2008;
Chintagunta et al. 2006) or reduced form models with time varying parameters (e.g. Ataman et
al. 2010).
Brand quality improvements impact brand performance in multiple ways
Continuous investments in quality improvement may help incumbents to ‘stand their
ground.’ Our results corroborate previous insights that quality improvements, once
communicated to consumers, may enhance a brand’s market share directly. Moreover, quality
improvements can bolster brand performance indirectly by leveraging the effectiveness of
other marketing efforts – particularly those fostering product trial, e.g. price promotions and
advertising. These efforts can help the brand communicate its new, improved quality and
thereby increase the propensity of repeat purchases following trial. A decline in product
132
quality acts in a similar way but has the opposite effect: it leads to a drop in sales and
effectiveness of marketing efforts. For instance, van Heerde et al. (2007) show a drop in
baseline sales and in the elasticities of marketing efforts following a product harm crisis. In
addition to these effects, we empirically demonstrate that quality investments can set the brand
apart from competition and thereby prevent its reputation from spilling over to other, similar
brands. Our results suggest, however, that to prevent such spillovers, the quality investments
need to be substantial to clearly distinguish and “shield” the investing brand.
Cross-brand learning hampers differentiation, but this can be beneficial
Cross-brand learning can have a substantial impact on a brand’s market share. In the
copycat private label context, which we study in chapter four, the effect is negative for the
national brand. This finding is related to other research showing that brands are harmed by
being too similar to their competitors (Pullig et al. 2006; Warlop et al. 2005). Interestingly, we
also find that cross-learning is not always “bad” for the source brand. In cross-brand learning
among private labels, which we document in chapter three, the effect is positive for all
involved brands. In all, our findings suggest that, for cross-brand learning to have a positive
impact on the involved players, it needs to be reciprocal (which means that all brands receive
spillovers from one another) and the brands’ quality positioning must be similar. Conversely,
cross-brand learning can have a negative impact on a brand (i) when that brand is a source but
not a receiver of familiarity spillovers, or (ii) when it receives spillovers from a lower quality
brand, and the quality belief spillovers outweigh the uncertainty reduction effects. These
findings present managers with interesting trade-offs. Brands wishing to differentiate
themselves from competitors need to choose a radically different quality positioning and/or
packaging. In doing so, they occupy a unique place in the mind of the consumer, and escape
from the negative consequences of cross-brand effects. However, managers need to weigh this
against the potential benefits of cross-brand spillovers (i.e. risk reduction), which they forego
by setting their brand apart.
133
Private labels’ success is partly due to efficiencies in reputation building
Prior research (Dekimpe and Hanssens 1995; Hoch et al. 2006) and industry reports (AC
Nielsen 2005) indicate that while the market share of most national brands in the long run
remains stationary, private label brands gain market share over time. Our findings suggest that
the category sales share captured by private labels, especially those that imitate leading
national brands’ packages, is influenced by their efficiency in reputation building. Whereas
each national brand builds its reputation on its own, private labels, to some extent, develop
their reputations collectively. Moreover, copycat private labels free-ride on the reputation of
the imitated national brands. Had these processes not taken place then, ceteris paribus (that is,
brand qualities and marketing efforts remaining as they are), private labels’ market share
would be lower.
5.3 Future research
In addition to generating a number of insights, the essays in this thesis also raise
additional questions, and set the stage for several new research avenues. To complement the
specific research suggestions already discussed in the respective chapters, we cover some
general future research directions below.
Distinguishing between learning and other dynamics
A limitation of choice models with Bayesian learning is that they typically do not
accommodate other forms of dynamics that may give rise to somewhat similar data patterns.
Such overlooked dynamics include drivers of positive state dependence, like inertia
(consumers sticking with the previously bought brands out of “habit” or laziness) or
endowment effects (consumers becoming emotionally attached to a brand as a result of
consuming it), drivers of negative state dependence, like variety seeking (consumers deriving
utility from change) (Erdem 1996; Inman et al. 2008), or other factors that trigger brand
switching, such as taste evolution (Biehl 2001; Dhar and Simonson 2003) or brand quality
evolution (Lovett 2008). The outcomes of these dynamic processes may be quite important
134
(Bronnenberg et al. 2009) and quite different from those of learning. For instance, brand
purchase and consumption will always have a positive impact on the brand’s future purchase
propensity in cases of inertia, while it may – if the experienced consumption quality is
disappointing (i.e., substantially below the prior quality belief) – reduce the likelihood of
repurchase in cases of learning. Even so, in a number of instances, these other forms of
dynamics may be hard to separate from “true” quality learning effects. Future research should
determine how these additional forms of dynamics can be controlled for, by extending the
model and possibly using richer data than the commonly adopted household scanner datasets.
Assessing the magnitude of these effects relative to learning may shed additional light on the
consequences of not controlling for them, and on whether the policy implications derived from
learning models should be modified.
Retail branding
Cross-learning models, similar to the ones presented in this thesis, can be applied to
study retail branding strategies. An important question in this sparsely researched field is
whether “a strategy of multiple private label brand names is more effective […] than having a
single private label under the store name” (Ailawadi and Keller 2004 p. 339). To answer this
question we must also ask (i) what is the effect of a private label sharing the brand name with
the chain (spillovers between service and product brands)?, and (ii) what is the effect of using
a single brand name encompassing all product categories in which a retailer has its own
products, vs. multiple brand names encompassing narrower sets of categories (cross-category
spillovers)?
Spillovers between product and service brands
Using the chain name for the private label products can have an effect on private label
choice share. The retailer name is expected to reduce consumer uncertainty about the private
label, and our results suggest that familiarity spillovers may constitute an important utility
enhancer. However, the chain name may also have strong associations that would not benefit
product sales (Bhat and Reddy 2001). The net effect of using the retail chain name to brand
135
the private label products, on the choice shares of these private label products (or, for that
matter, of the chain itself), is therefore an interesting area for further study.
Cross-category spillovers
The effect of using one brand name for private label products in all categories rather
than multiple names in subsets of categories is also uncertain. Both approaches can lead to
umbrella effects among categories using the same brand name (Erdem 1998; Erdem and Sun
2002; Sayman and Raju 2004). The potential advantage of the “one brand approach” is that the
spillovers would span a broader range of categories. On the other hand, what can benefit the
“multiple, narrow brands approach” is that each brand can include related categories and
consequently enjoy stronger spillovers (Aaker and Keller 1990; Broniarczyk and Alba 1994;
Park et al. 1991). The empirical question is, then, in which of these two cases are umbrella
effects more beneficial to the retailer?
Tackling these questions about the effect of retail branding strategies – same or different
name for chain and private label products?, single or multiple private label brand names across
categories? – is a challenging task. A cross-sectional approach in which one might compare
the performance of branding strategies across retail chains would likely be hindered by the
researcher’s limited ability to control for numerous chain-specific confounding variables. A
time-series approach is hampered by the fact that brand strategy changes are very rare, i.e.,
few chains switch between a “one broad brand” strategy and a “multiple, narrower brands”
strategy. Yet, a promising research opportunity is to focus on a rare ‘natural experiment’
where a retail chain actually changes its branding strategy, and follow up on the consequences
of such events for household-level dynamics, such as cross-category learning, and learning
among chain brands and private label brands. The retailer Clout recently moved from using
multiple brand names to labeling its products with the common name “Everyday Selection,”
presenting an interesting research possibility.
In a related vein, future research should aim to compare the relative influence on a
private label exerted by spillovers from rival private label brands (Chapter 2) or imitated
136
national brands (Chapter 3) in the same product category, the store’s own private label brand
in other categories, and same-store or competing-store private labels from different tiers (e.g.
budget or premium, as opposed to standard, private labels).
Within category brand scope
This last research idea considers strategic implications of the cross-category and cross-
domain (retailing service vs. products) scope of the retailer’s brand. Future research could
tackle other issues related to brand scope, for instance within a product category. Firms
offering many SKUs in a category face a choice between branding all SKUs with a common
name or using multiple brand names within that category. As in the case of cross-category
brand scope, the “one brand strategy” is expected to stimulate cross-SKU learning and
consequently economize on costs of reputation building and on other marketing efforts
(Balachander and Ghose 2003). The novel aspect of brand scope considered in the context of
one category is that a “one brand strategy” may be unattractive to consumers who are variety
seeking with regard to brand name (Inman et al. 2008). Prior research documents both effects,
but little is known about their relative magnitude and, consequently, the net advantage of using
one versus multiple brand names. Extending SKU choice models (Fader and Hardie 1996)
with cross-learning might shed more light on this issue.
When to comply and when to deviate from the category trade dress code?
Chapter four of this thesis underscores the importance of package similarity in driving
consumer brand evaluations. Future research should explore this issue further. Brands from the
same category commonly share a set of package design features, a phenomenon referred to as
the “trade dress code”. This alignment in the package design choices of brands is an
interesting, yet little studied phenomenon (Warlop and Alba 2004; Warlop et al. 2005).
Deviation from the category code can allow the brand to gain more differentiation from
competition and, therefore, be more easily located on the shelf (van der Lans et al. 2008) or
develop stronger quality associations (Warlop et al. 2005). However, chapter three in this
thesis suggests that compliance with the trade dress could allow the brand to benefit from the

137
familiarity that consumers have developed with the category. Future research could build a
conceptual framework predicting which type of brands, and under what conditions, stands to
benefit more from compliance versus deviation from the category code. Such a framework
could be tested using Bayesian learning models pertaining to brands with a more or less
‘deviant’ trade dress, and linking the impact of the brand’s deviation from the category code to
other characteristics of the brand and competitive context.


139
Appendix 1
TABLE A1.1 NOTATION OVERVIEW
Symbol Description
Indices and (vectors of) indicators
c Index for product category
C Number of sample categories
djct Indicator equal to 1 if brand j in category c was consumed at purchase occasion t and 0 otherwise*
Dct,i Vector of purchase indicators djct of household i up to purchase occasion t
Ect,i Vector of consumption signal Gjct received by household i up to purchase occasion t
Jc, Nc Number of sample brands, and number of households, respectively, in category c
j, k Indices for brand
M Index for unit of a product
Mct Number of product units purchased by the consumer in category c on the purchase occasion t*
t, h Indices for purchase occasion
Tci Number of purchases in category c made by household i during the sample period
wct Week index for purchase occasion t in category c
zjct,i Indicator equal to 1 if brand j in category c was available to household i at purchase occasion t
and 0 otherwise.
Utility and its determinants
r Risk aversion parameter*
Ujct Utility of brand j in category c at purchase occasion t*
Xjct Utility determinants for brand j in category c at purchase occasion t other than quality belief*
β Consumer’s sensitivity parameters to utility determinants in Xjt*
εjct i.i.d. extreme value component of utility observed by the consumer, unobserved by the
researcher*
Quality and quality belief
qjc True quality of brand j in category c*
Qjct Quality belief of brand j in category c on purchase occasion t*
µjct Mean quality belief of brand j in category c on purchase occasion t*
2
jctσ Uncertainty or variance in quality belief for brand j in category c at purchase occasion t*
Learning and forgetting
bc Parameter capturing the rate of forgetting*
Itc Consumer’s information set in category c at purchase occasion t*
gjctm Consumption signal of one unit of brand j in category c on purchase occasion t*
Gjct Average over a series of mct consumption signals gjct for brand j in category c on purchase
occasion t
σgc Standard deviation of the consumption signal in category c*
Household heterogeneity
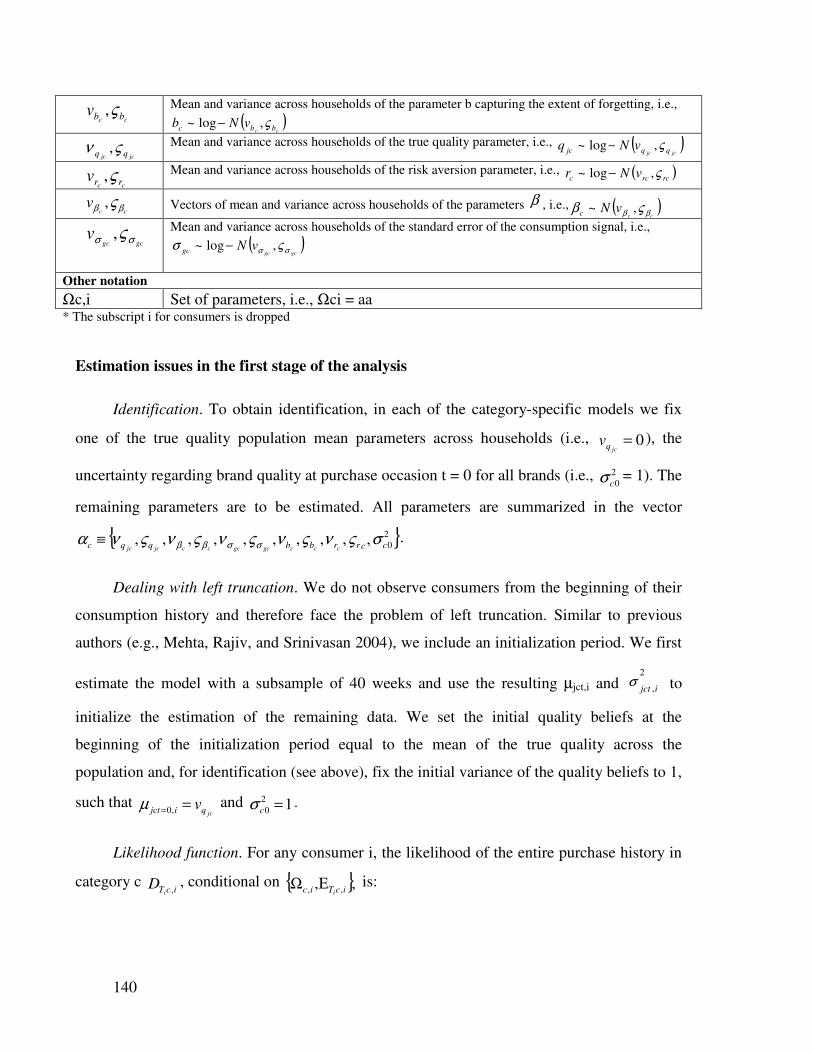
140
cc bbv ς, Mean and variance across households of the parameter b capturing the extent of forgetting, i.e.,
( )cc bbc vNb ς,log~ −
jcjc qq ςν , Mean and variance across households of the true quality parameter, i.e., ( )jcjc qqjc vNq ς,log~ −
cc rrv ς, Mean and variance across households of the risk aversion parameter, i.e., ( )rcrcc vNr ς,log~ −
ccv ββ ς, Vectors of mean and variance across households of the parameters β , i.e., ( )
ccvNc ββ ςβ ,~
gcgcv σσ ς, Mean and variance across households of the standard error of the consumption signal, i.e.,
( )gcgc
vNgc σσ ςσ ,log~ −
Other notation
Ωc,i Set of parameters, i.e., Ωci = aa * The subscript i for consumers is dropped
Estimation issues in the first stage of the analysis
Identification. To obtain identification, in each of the category-specific models we fix
one of the true quality population mean parameters across households (i.e., 0=jcqv ), the
uncertainty regarding brand quality at purchase occasion t = 0 for all brands (i.e., 2
0cσ = 1). The
remaining parameters are to be estimated. All parameters are summarized in the vector
2
0,,,,,,,,,, ccrrbbqqc cccgcgcccjcjcσςνςνςνςνςνα σσββ≡ .
Dealing with left truncation. We do not observe consumers from the beginning of their
consumption history and therefore face the problem of left truncation. Similar to previous
authors (e.g., Mehta, Rajiv, and Srinivasan 2004), we include an initialization period. We first
estimate the model with a subsample of 40 weeks and use the resulting µjct,i and 2
,ijctσ to
initialize the estimation of the remaining data. We set the initial quality beliefs at the
beginning of the initialization period equal to the mean of the true quality across the
population and, for identification (see above), fix the initial variance of the quality beliefs to 1,
such that jcqijct v== ,0µ and 12
0 =cσ .
Likelihood function. For any consumer i, the likelihood of the entire purchase history in
category c icTi
D ,, conditional on ,, ,, icTic i
ΕΩ is:

141
( ) ( )∏∏= =
ΕΩ==ΕΩi
ijt
ii
T
t
J
j
d
itiijtiTiiTi dDL1 1
,,,,,,|1Pr,| .
We denote the p.d.f. of parameters in Ωi as uΩ(Ωi) and the p.d.f. of iTi ,Ε as uE( iTi ,Ε ). The
unconditional likelihood of household i purchase history iTiD , is:
( ) ( ) ( ) ( ) iiiTiTEiTiiTiciTi duduDLDLi it
iiiiiΩΩ
ΕΕΕΩ= Ω
Ω Ε∫ ∫,
,,,,, ,|| α .
Because this likelihood involves multidimensional integrals, numerical computation is
prohibitively expensive. Therefore, in line with previous studies, we resort to simulated
likelihood. Using F sets of scrambled Halton draws (Train 2003) for the coefficients in Ωi and
the consumption signals in iTi ,Ε , we obtain an estimate of Li:
( ) ( )( )∑ ΕΩ=F
f
ff
iTiciTi iiDLDL ,||ˆ
,, α .
We set F = 100, because larger values are not feasible given the computational demands
of the model. As a robustness check, we run the model with different sets of draws, and the
results do not change.
The log-likelihood for N households is:
( ) ( )∑=
==
N
i
ciTic
N
iiT iiDLDLL
1
,1, |ˆln| αα .
We estimate the parameters in cα by maximizing this likelihood:
( )c
N
iiTMLEc iDLL αα
α|maxarg
1,, == .
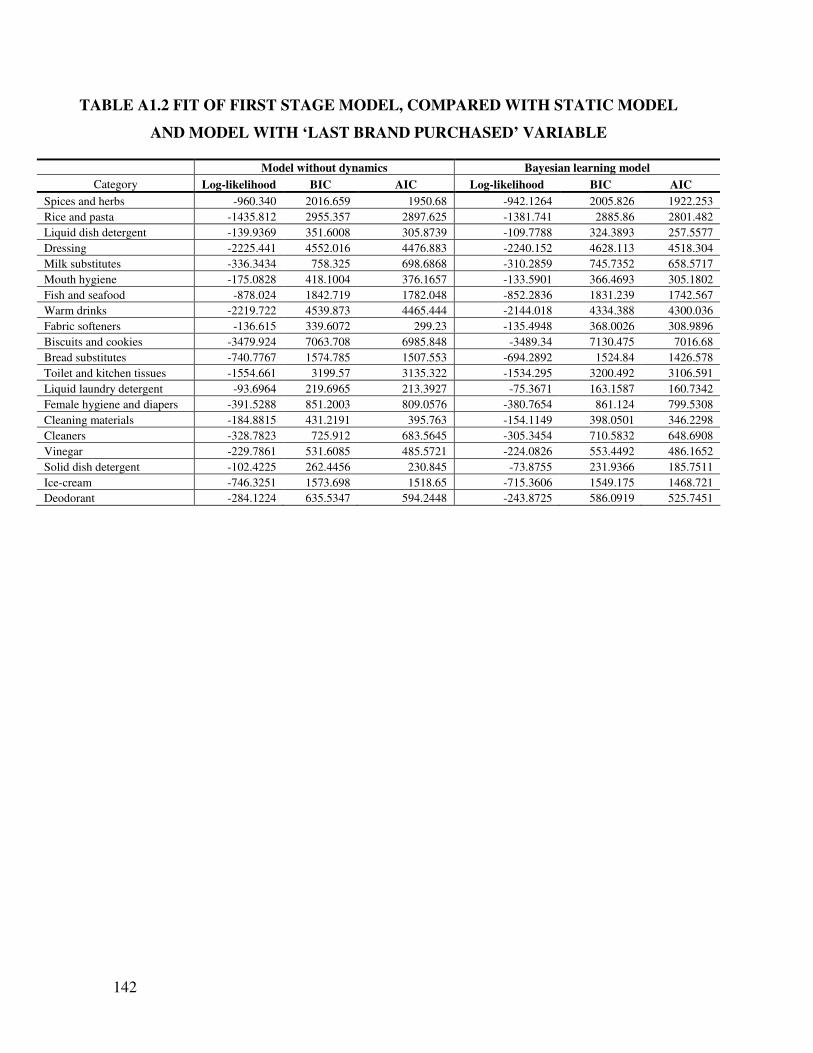
142
TABLE A1.2 FIT OF FIRST STAGE MODEL, COMPARED WITH STATIC MODEL
AND MODEL WITH ‘LAST BRAND PURCHASED’ VARIABLE
Model without dynamics Bayesian learning model
Category Log-likelihood BIC AIC Log-likelihood BIC AIC
Spices and herbs -960.340 2016.659 1950.68 -942.1264 2005.826 1922.253
Rice and pasta -1435.812 2955.357 2897.625 -1381.741 2885.86 2801.482
Liquid dish detergent -139.9369 351.6008 305.8739 -109.7788 324.3893 257.5577
Dressing -2225.441 4552.016 4476.883 -2240.152 4628.113 4518.304
Milk substitutes -336.3434 758.325 698.6868 -310.2859 745.7352 658.5717
Mouth hygiene -175.0828 418.1004 376.1657 -133.5901 366.4693 305.1802
Fish and seafood -878.024 1842.719 1782.048 -852.2836 1831.239 1742.567
Warm drinks -2219.722 4539.873 4465.444 -2144.018 4334.388 4300.036
Fabric softeners -136.615 339.6072 299.23 -135.4948 368.0026 308.9896
Biscuits and cookies -3479.924 7063.708 6985.848 -3489.34 7130.475 7016.68
Bread substitutes -740.7767 1574.785 1507.553 -694.2892 1524.84 1426.578
Toilet and kitchen tissues -1554.661 3199.57 3135.322 -1534.295 3200.492 3106.591
Liquid laundry detergent -93.6964 219.6965 213.3927 -75.3671 163.1587 160.7342
Female hygiene and diapers -391.5288 851.2003 809.0576 -380.7654 861.124 799.5308
Cleaning materials -184.8815 431.2191 395.763 -154.1149 398.0501 346.2298
Cleaners -328.7823 725.912 683.5645 -305.3454 710.5832 648.6908
Vinegar -229.7861 531.6085 485.5721 -224.0826 553.4492 486.1652
Solid dish detergent -102.4225 262.4456 230.845 -73.8755 231.9366 185.7511
Ice-cream -746.3251 1573.698 1518.65 -715.3606 1549.175 1468.721
Deodorant -284.1224 635.5347 594.2448 -243.8725 586.0919 525.7451
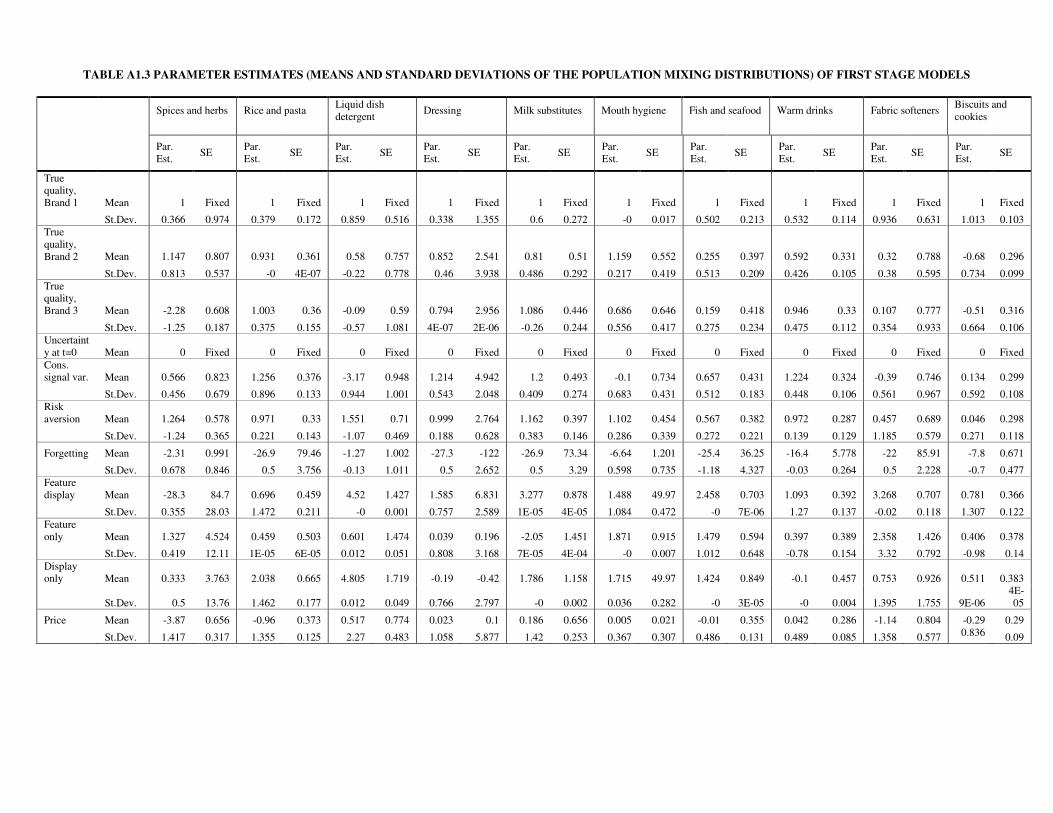
TABLE A1.3 PARAMETER ESTIMATES (MEANS AND STANDARD DEVIATIONS OF THE POPULATION MIXING DISTRIBUTIONS) OF FIRST STAGE MODELS
Spices and herbs
Rice and pasta
Liquid dish
detergent
Dressing
Milk substitutes
Mouth hygiene
Fish and seafood
Warm drinks
Fabric softeners
Biscuits and
cookies
Par.
Est. SE
Par.
Est. SE
Par.
Est. SE
Par.
Est. SE
Par.
Est. SE
Par.
Est. SE
Par.
Est. SE
Par.
Est. SE
Par.
Est. SE
Par.
Est. SE
True quality,
Brand 1 Mean 1 Fixed 1 Fixed 1 Fixed 1 Fixed 1 Fixed 1 Fixed 1 Fixed 1 Fixed 1 Fixed 1 Fixed
St.Dev. 0.366 0.974 0.379 0.172 0.859 0.516 0.338 1.355 0.6 0.272 -0 0.017 0.502 0.213 0.532 0.114 0.936 0.631 1.013 0.103
True
quality,
Brand 2 Mean 1.147 0.807 0.931 0.361 0.58 0.757 0.852 2.541 0.81 0.51 1.159 0.552 0.255 0.397 0.592 0.331 0.32 0.788 -0.68 0.296
St.Dev. 0.813 0.537 -0 4E-07 -0.22 0.778 0.46 3.938 0.486 0.292 0.217 0.419 0.513 0.209 0.426 0.105 0.38 0.595 0.734 0.099
True quality,
Brand 3 Mean -2.28 0.608 1.003 0.36 -0.09 0.59 0.794 2.956 1.086 0.446 0.686 0.646 0.159 0.418 0.946 0.33 0.107 0.777 -0.51 0.316
St.Dev. -1.25 0.187 0.375 0.155 -0.57 1.081 4E-07 2E-06 -0.26 0.244 0.556 0.417 0.275 0.234 0.475 0.112 0.354 0.933 0.664 0.106
Uncertaint
y at t=0 Mean 0 Fixed 0 Fixed 0 Fixed 0 Fixed 0 Fixed 0 Fixed 0 Fixed 0 Fixed 0 Fixed 0 Fixed
Cons. signal var. Mean 0.566 0.823 1.256 0.376 -3.17 0.948 1.214 4.942 1.2 0.493 -0.1 0.734 0.657 0.431 1.224 0.324 -0.39 0.746 0.134 0.299
St.Dev. 0.456 0.679 0.896 0.133 0.944 1.001 0.543 2.048 0.409 0.274 0.683 0.431 0.512 0.183 0.448 0.106 0.561 0.967 0.592 0.108
Risk
aversion Mean 1.264 0.578 0.971 0.33 1.551 0.71 0.999 2.764 1.162 0.397 1.102 0.454 0.567 0.382 0.972 0.287 0.457 0.689 0.046 0.298
St.Dev. -1.24 0.365 0.221 0.143 -1.07 0.469 0.188 0.628 0.383 0.146 0.286 0.339 0.272 0.221 0.139 0.129 1.185 0.579 0.271 0.118
Forgetting Mean -2.31 0.991 -26.9 79.46 -1.27 1.002 -27.3 -122 -26.9 73.34 -6.64 1.201 -25.4 36.25 -16.4 5.778 -22 85.91 -7.8 0.671
St.Dev. 0.678 0.846 0.5 3.756 -0.13 1.011 0.5 2.652 0.5 3.29 0.598 0.735 -1.18 4.327 -0.03 0.264 0.5 2.228 -0.7 0.477
Feature
display Mean -28.3 84.7 0.696 0.459 4.52 1.427 1.585 6.831 3.277 0.878 1.488 49.97 2.458 0.703 1.093 0.392 3.268 0.707 0.781 0.366
St.Dev. 0.355 28.03 1.472 0.211 -0 0.001 0.757 2.589 1E-05 4E-05 1.084 0.472 -0 7E-06 1.27 0.137 -0.02 0.118 1.307 0.122
Feature
only Mean 1.327 4.524 0.459 0.503 0.601 1.474 0.039 0.196 -2.05 1.451 1.871 0.915 1.479 0.594 0.397 0.389 2.358 1.426 0.406 0.378
St.Dev. 0.419 12.11 1E-05 6E-05 0.012 0.051 0.808 3.168 7E-05 4E-04 -0 0.007 1.012 0.648 -0.78 0.154 3.32 0.792 -0.98 0.14
Display only Mean 0.333 3.763 2.038 0.665 4.805 1.719 -0.19 -0.42 1.786 1.158 1.715 49.97 1.424 0.849 -0.1 0.457 0.753 0.926 0.511 0.383
St.Dev. 0.5 13.76 1.462 0.177 0.012 0.049 0.766 2.797 -0 0.002 0.036 0.282 -0 3E-05 -0 0.004 1.395 1.755 9E-06
4E-
05
Price Mean -3.87 0.656 -0.96 0.373 0.517 0.774 0.023 0.1 0.186 0.656 0.005 0.021 -0.01 0.355 0.042 0.286 -1.14 0.804 -0.29 0.29
St.Dev. 1.417 0.317 1.355 0.125 2.27 0.483 1.058 5.877 1.42 0.253 0.367 0.307 0.486 0.131 0.489 0.085 1.358 0.577 0.836 0.09
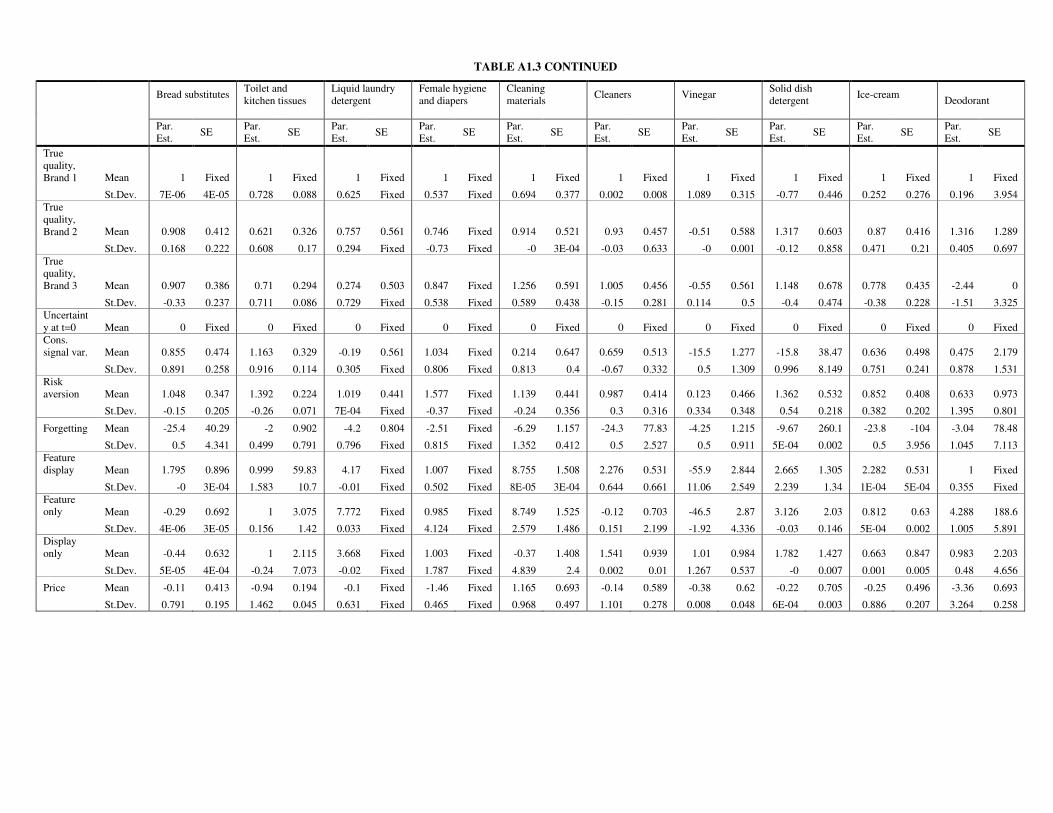
TABLE A1.3 CONTINUED
Bread substitutes
Toilet and
kitchen tissues
Liquid laundry
detergent
Female hygiene
and diapers
Cleaning
materials
Cleaners
Vinegar
Solid dish
detergent
Ice-cream
Deodorant
Par.
Est. SE
Par.
Est. SE
Par.
Est. SE
Par.
Est. SE
Par.
Est. SE
Par.
Est. SE
Par.
Est. SE
Par.
Est. SE
Par.
Est. SE
Par.
Est. SE
True
quality,
Brand 1 Mean 1 Fixed 1 Fixed 1 Fixed 1 Fixed 1 Fixed 1 Fixed 1 Fixed 1 Fixed 1 Fixed 1 Fixed
St.Dev. 7E-06 4E-05 0.728 0.088 0.625 Fixed 0.537 Fixed 0.694 0.377 0.002 0.008 1.089 0.315 -0.77 0.446 0.252 0.276 0.196 3.954
True
quality,
Brand 2 Mean 0.908 0.412 0.621 0.326 0.757 0.561 0.746 Fixed 0.914 0.521 0.93 0.457 -0.51 0.588 1.317 0.603 0.87 0.416 1.316 1.289
St.Dev. 0.168 0.222 0.608 0.17 0.294 Fixed -0.73 Fixed -0 3E-04 -0.03 0.633 -0 0.001 -0.12 0.858 0.471 0.21 0.405 0.697
True quality,
Brand 3 Mean 0.907 0.386 0.71 0.294 0.274 0.503 0.847 Fixed 1.256 0.591 1.005 0.456 -0.55 0.561 1.148 0.678 0.778 0.435 -2.44 0
St.Dev. -0.33 0.237 0.711 0.086 0.729 Fixed 0.538 Fixed 0.589 0.438 -0.15 0.281 0.114 0.5 -0.4 0.474 -0.38 0.228 -1.51 3.325
Uncertaint
y at t=0 Mean 0 Fixed 0 Fixed 0 Fixed 0 Fixed 0 Fixed 0 Fixed 0 Fixed 0 Fixed 0 Fixed 0 Fixed
Cons.
signal var. Mean 0.855 0.474 1.163 0.329 -0.19 0.561 1.034 Fixed 0.214 0.647 0.659 0.513 -15.5 1.277 -15.8 38.47 0.636 0.498 0.475 2.179
St.Dev. 0.891 0.258 0.916 0.114 0.305 Fixed 0.806 Fixed 0.813 0.4 -0.67 0.332 0.5 1.309 0.996 8.149 0.751 0.241 0.878 1.531
Risk
aversion Mean 1.048 0.347 1.392 0.224 1.019 0.441 1.577 Fixed 1.139 0.441 0.987 0.414 0.123 0.466 1.362 0.532 0.852 0.408 0.633 0.973
St.Dev. -0.15 0.205 -0.26 0.071 7E-04 Fixed -0.37 Fixed -0.24 0.356 0.3 0.316 0.334 0.348 0.54 0.218 0.382 0.202 1.395 0.801
Forgetting Mean -25.4 40.29 -2 0.902 -4.2 0.804 -2.51 Fixed -6.29 1.157 -24.3 77.83 -4.25 1.215 -9.67 260.1 -23.8 -104 -3.04 78.48
St.Dev. 0.5 4.341 0.499 0.791 0.796 Fixed 0.815 Fixed 1.352 0.412 0.5 2.527 0.5 0.911 5E-04 0.002 0.5 3.956 1.045 7.113
Feature
display Mean 1.795 0.896 0.999 59.83 4.17 Fixed 1.007 Fixed 8.755 1.508 2.276 0.531 -55.9 2.844 2.665 1.305 2.282 0.531 1 Fixed
St.Dev. -0 3E-04 1.583 10.7 -0.01 Fixed 0.502 Fixed 8E-05 3E-04 0.644 0.661 11.06 2.549 2.239 1.34 1E-04 5E-04 0.355 Fixed
Feature only Mean -0.29 0.692 1 3.075 7.772 Fixed 0.985 Fixed 8.749 1.525 -0.12 0.703 -46.5 2.87 3.126 2.03 0.812 0.63 4.288 188.6
St.Dev. 4E-06 3E-05 0.156 1.42 0.033 Fixed 4.124 Fixed 2.579 1.486 0.151 2.199 -1.92 4.336 -0.03 0.146 5E-04 0.002 1.005 5.891
Display
only Mean -0.44 0.632 1 2.115 3.668 Fixed 1.003 Fixed -0.37 1.408 1.541 0.939 1.01 0.984 1.782 1.427 0.663 0.847 0.983 2.203
St.Dev. 5E-05 4E-04 -0.24 7.073 -0.02 Fixed 1.787 Fixed 4.839 2.4 0.002 0.01 1.267 0.537 -0 0.007 0.001 0.005 0.48 4.656
Price Mean -0.11 0.413 -0.94 0.194 -0.1 Fixed -1.46 Fixed 1.165 0.693 -0.14 0.589 -0.38 0.62 -0.22 0.705 -0.25 0.496 -3.36 0.693
St.Dev. 0.791 0.195 1.462 0.045 0.631 Fixed 0.465 Fixed 0.968 0.497 1.101 0.278 0.008 0.048 6E-04 0.003 0.886 0.207 3.264 0.258
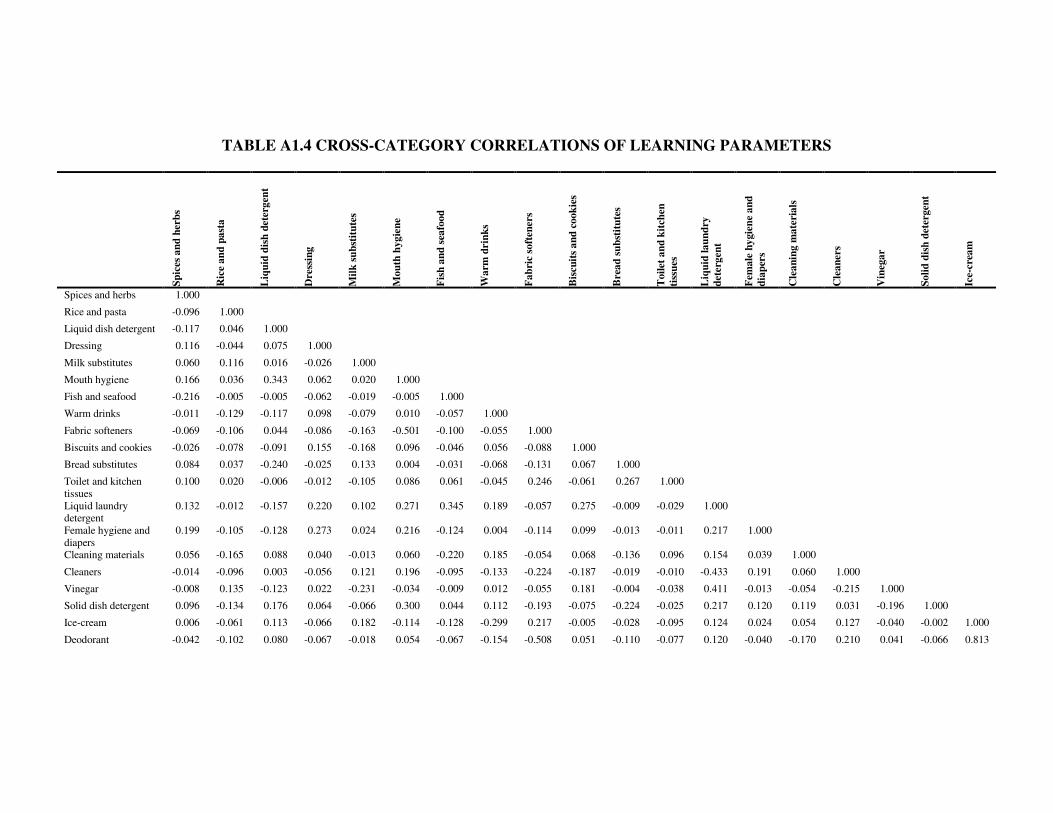
TABLE A1.4 CROSS-CATEGORY CORRELATIONS OF LEARNING PARAMETERS
Sp
ices
an
d h
erb
s
Ric
e a
nd
pa
sta
Liq
uid
dis
h d
eter
gen
t
Dre
ssin
g
Mil
k s
ub
stit
ute
s
Mo
uth
hyg
ien
e
Fis
h a
nd
sea
foo
d
Wa
rm d
rin
ks
Fa
bri
c so
ften
ers
Bis
cuit
s a
nd
coo
kie
s
Bre
ad
su
bst
itu
tes
Toil
et a
nd
kit
chen
tiss
ues
Liq
uid
la
un
dry
det
erg
ent
Fem
ale
hy
gie
ne
an
d
dia
per
s
Cle
an
ing m
ate
ria
ls
Cle
an
ers
Vin
ega
r
So
lid
dis
h d
eter
gen
t
Ice-
crea
m
Spices and herbs 1.000
Rice and pasta -0.096 1.000
Liquid dish detergent -0.117 0.046 1.000
Dressing 0.116 -0.044 0.075 1.000
Milk substitutes 0.060 0.116 0.016 -0.026 1.000
Mouth hygiene 0.166 0.036 0.343 0.062 0.020 1.000
Fish and seafood -0.216 -0.005 -0.005 -0.062 -0.019 -0.005 1.000
Warm drinks -0.011 -0.129 -0.117 0.098 -0.079 0.010 -0.057 1.000
Fabric softeners -0.069 -0.106 0.044 -0.086 -0.163 -0.501 -0.100 -0.055 1.000
Biscuits and cookies -0.026 -0.078 -0.091 0.155 -0.168 0.096 -0.046 0.056 -0.088 1.000
Bread substitutes 0.084 0.037 -0.240 -0.025 0.133 0.004 -0.031 -0.068 -0.131 0.067 1.000
Toilet and kitchen
tissues
0.100 0.020 -0.006 -0.012 -0.105 0.086 0.061 -0.045 0.246 -0.061 0.267 1.000
Liquid laundry detergent
0.132 -0.012 -0.157 0.220 0.102 0.271 0.345 0.189 -0.057 0.275 -0.009 -0.029 1.000
Female hygiene and
diapers
0.199 -0.105 -0.128 0.273 0.024 0.216 -0.124 0.004 -0.114 0.099 -0.013 -0.011 0.217 1.000
Cleaning materials 0.056 -0.165 0.088 0.040 -0.013 0.060 -0.220 0.185 -0.054 0.068 -0.136 0.096 0.154 0.039 1.000
Cleaners -0.014 -0.096 0.003 -0.056 0.121 0.196 -0.095 -0.133 -0.224 -0.187 -0.019 -0.010 -0.433 0.191 0.060 1.000
Vinegar -0.008 0.135 -0.123 0.022 -0.231 -0.034 -0.009 0.012 -0.055 0.181 -0.004 -0.038 0.411 -0.013 -0.054 -0.215 1.000
Solid dish detergent 0.096 -0.134 0.176 0.064 -0.066 0.300 0.044 0.112 -0.193 -0.075 -0.224 -0.025 0.217 0.120 0.119 0.031 -0.196 1.000
Ice-cream 0.006 -0.061 0.113 -0.066 0.182 -0.114 -0.128 -0.299 0.217 -0.005 -0.028 -0.095 0.124 0.024 0.054 0.127 -0.040 -0.002 1.000
Deodorant -0.042 -0.102 0.080 -0.067 -0.018 0.054 -0.067 -0.154 -0.508 0.051 -0.110 -0.077 0.120 -0.040 -0.170 0.210 0.041 -0.066 0.813


147
Appendix 2
TABLE A2.1 NOTATION OVERVIEW
Symbol Description
Indices and (Vectors of) Indicators
c Index for retail chain.
djt Indicator equal to 1 if brand j was consumed at purchase occasion t and 0 otherwise*.
Dt,i Vector of purchase indicators djt of household i up to purchase occasion t.
Et,i Vector of consumption signal Gjt,i received by household i up to purchase occasion t.
J, C, N Number of sample brands, retail chains, and households respectively.
j, k Indices for brand.
m Index for unit of a product.
Mt Number of product units purchased by the consumer on the purchase occasion t*.
PL Set of indicators for private label brands.
sct,i Indicator equal 1 if retail chain c was chosen by household i at purchase occasion t and 0
otherwise.
St,i Vector of chain choice indicators sct,i of household i up to purchase occasion t.
t, h Indices for purchase occasion.
Ti Number of purchases of household i during the sample period.
wt Week index for purchase occasion t.
zjt,i Indicator equal to 1 if brand j was available to household i at purchase occasion t and 0 otherwise.
Utility and its Determinants
r Risk aversion parameter*.
Ujt Utility of brand j at purchase occasion t*.
Xjt Utility determinants for brand j at purchase occasion t other than quality belief*.
β Consumer’s sensitivity parameters to utility determinants in Xjt*.
εjt i.i.d. extreme value component of utility observed by the consumer, unobserved by the
researcher*.
Quality and Quality Belief
qj True quality of brand j*.
Qjt Quality belief of brand j on purchase occasion t*.
µjt Mean quality belief of brand j on purchase occasion t*.
2
jtσ Uncertainty or variance in quality belief for brand j at purchase occasion t*.
Learning and Forgetting
b Parameter capturing the rate of forgetting*.
It Consumer’s information set at purchase occasion t*.
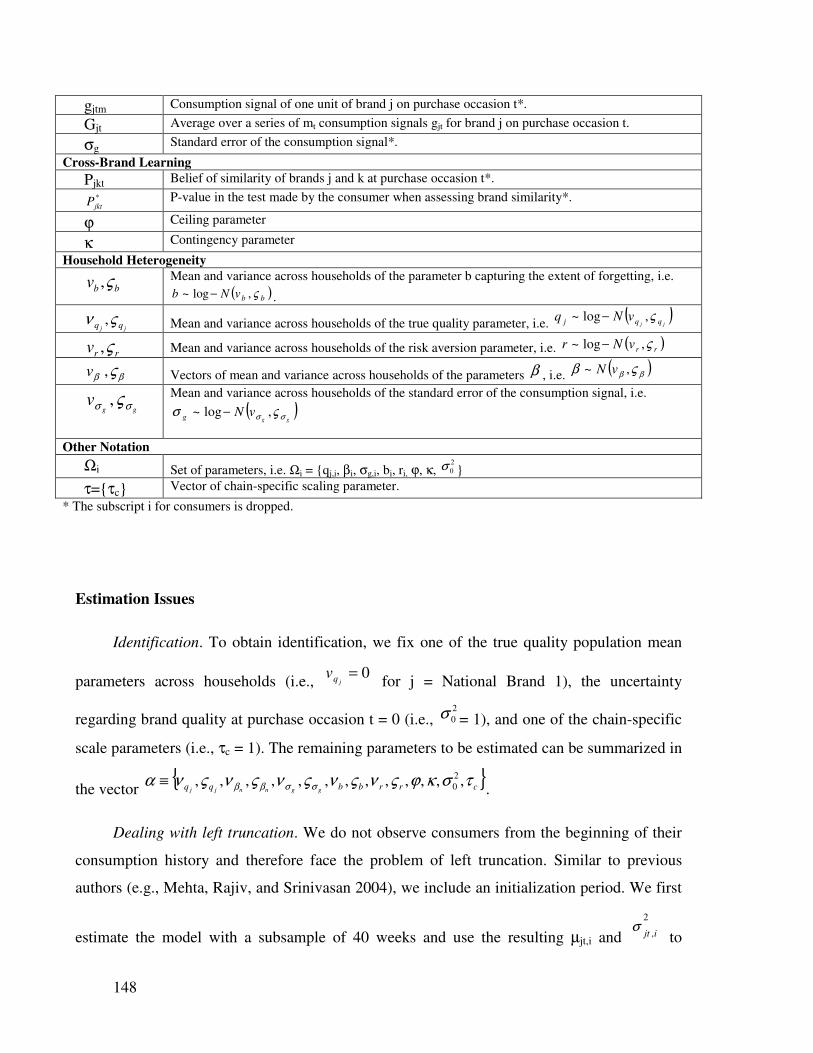
148
gjtm Consumption signal of one unit of brand j on purchase occasion t*.
Gjt Average over a series of mt consumption signals gjt for brand j on purchase occasion t.
σg Standard error of the consumption signal*.
Cross-Brand Learning
Pjkt Belief of similarity of brands j and k at purchase occasion t*.
*
jktP P-value in the test made by the consumer when assessing brand similarity*.
ϕ Ceiling parameter
κ Contingency parameter
Household Heterogeneity
bbv ς, Mean and variance across households of the parameter b capturing the extent of forgetting, i.e.
( )bbvNb ς,log~ − .
jj qq ςν , Mean and variance across households of the true quality parameter, i.e.
( )jj qqj vNq ς,log~ −
rrv ς, Mean and variance across households of the risk aversion parameter, i.e. ( )rrvNr ς,log~ −
ββ ς,v Vectors of mean and variance across households of the parameters β , i.e. ( )ββ ςβ ,~ vN
ggv σσ ς,
Mean and variance across households of the standard error of the consumption signal, i.e.
( )gg
vNg σσ ςσ ,log~ −
Other Notation
Ωi Set of parameters, i.e. Ωi = qj,i, βi, σg,i, bi, ri, ϕ, κ, 2
0σ
τ=τc Vector of chain-specific scaling parameter.
* The subscript i for consumers is dropped.
Estimation Issues
Identification. To obtain identification, we fix one of the true quality population mean
parameters across households (i.e., 0=
jqv for j = National Brand 1), the uncertainty
regarding brand quality at purchase occasion t = 0 (i.e., 2
0σ = 1), and one of the chain-specific
scale parameters (i.e., τc = 1). The remaining parameters to be estimated can be summarized in
the vector
crrbbqq ggnnjjτσκϕςνςνςνςνςνα σσββ ,,,,,,,,,,,,, 2
0≡.
Dealing with left truncation. We do not observe consumers from the beginning of their
consumption history and therefore face the problem of left truncation. Similar to previous
authors (e.g., Mehta, Rajiv, and Srinivasan 2004), we include an initialization period. We first
estimate the model with a subsample of 40 weeks and use the resulting µjt,i and
2
,ijtσ
to

149
initialize the estimation of the remaining data. We set the initial quality beliefs at the
beginning of the initialization period equal to the mean of the true quality across the
population and, for identification (see above), fix the initial variance of the quality beliefs to 1,
such that jqijt v== ,0µ and 12
0 =σ .
Likelihood function. For any consumer i, the likelihood of the entire purchase history
iTiD , , conditional on
,,,, ,, iTiTi iiSΕΩ τ is:
( ) ( )∏∏= =
ΕΩ==ΕΩi
ijt
iiii
T
t
J
j
d
iTitiijtiTiTiiTi SdSDL1 1
,,,,,,,,,,|1Pr,,,| ττ
.
We denote the p.d.f. of parameters in Ωi as uΩ(Ωi) and the p.d.f. of iTi ,Ε as uE( iTi ,Ε ). The
unconditional likelihood of household’s i purchase history iTiD , is:
( ) ( ) ( ) ( ) iiiTiTEiTiTiiTiiTiTi duduSDLSDLi it
iiiiiiiΩΩ
ΕΕΕΩ= Ω
Ω Ε∫ ∫,
,,,,,,, ,,,|,| τα.
Because this likelihood involves multidimensional integrals, numerical computation is
prohibitively expensive. Therefore, in line with previous studies, we resort to simulated
likelihood. Using F sets of scrambled Halton draws (Train 2003) for the coefficients in Ωi and
the consumption signals in iTi ,Ε , we obtain an estimate of Li:
( ) ( )( )∑ ΕΩ=F
f
iT
ff
iTiiTiTi iiiiSDLSDL ,,,, ,,,|,,|ˆ ττα
.
We set F = 100, because larger values are not feasible given the computational demands
of the model. As a robustness check, we run the model with different sets of draws, and the
results do not change.
The log-likelihood for N households is:
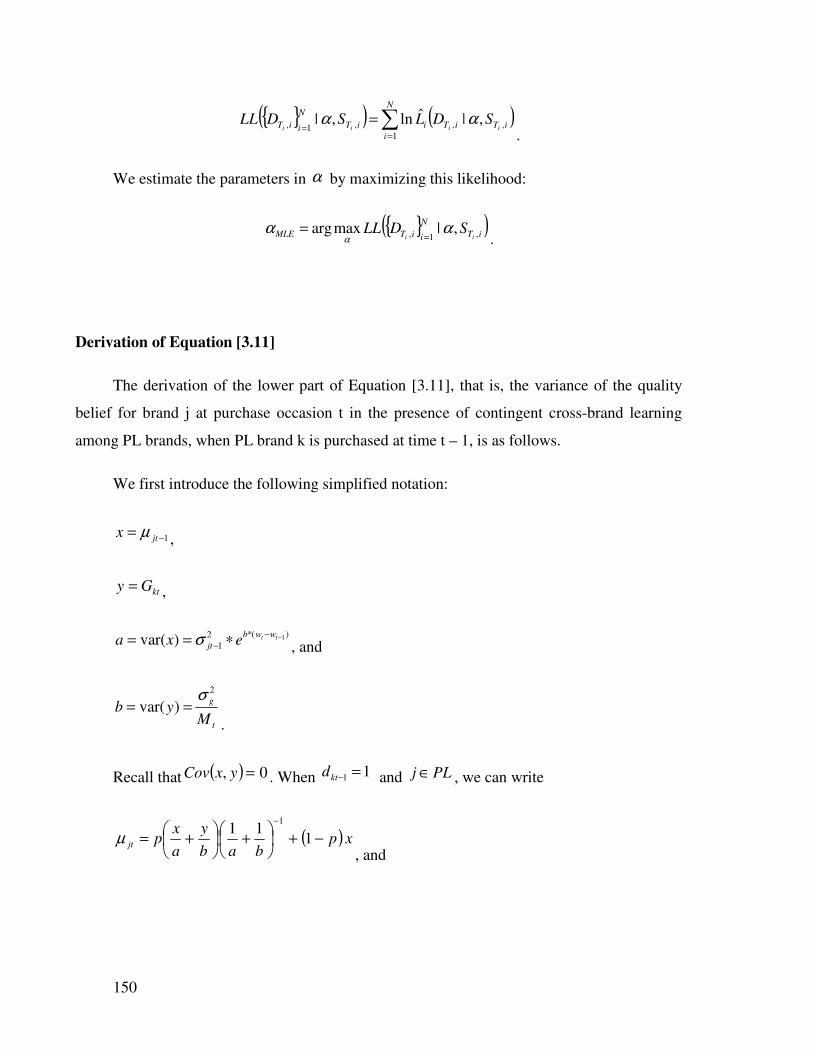
150
( ) ( )∑=
==
N
i
iTiTiiT
N
iiT iiiiSDLSDLL
1
,,,1, ,|ˆln,| αα.
We estimate the parameters in α by maximizing this likelihood:
( )iT
N
iiTMLE iiSDLL ,1, ,|maxarg αα
α ==
.
Derivation of Equation [3.11]
The derivation of the lower part of Equation [3.11], that is, the variance of the quality
belief for brand j at purchase occasion t in the presence of contingent cross-brand learning
among PL brands, when PL brand k is purchased at time t – 1, is as follows.
We first introduce the following simplified notation:
1−= jtx µ ,
ktGy = ,
)(*2
11)var( −−
− ∗== tt wwb
jt exa σ , and
t
g
Myb
2
)var(σ
==.
Recall that ( ) 0, =yxCov . When 1 1 =−ktd and PLj ∈ , we can write
( ) xpbab
y
a
xpjt −+
+
+=
−
111
1
µ, and

151
( )
( )( )
( )
( ) ( ) ( )
( ) ( )
( ) ( ) ( )
( ) ( ) ( ) ( )
( ) ( )
( ) ( )
( ) ( )( )
( ) ( ).211
1
1211
1
11121
11
0111
12101111
,1111
121
1,
12
1111
,,11
121
,211
1,11
21
1111
1,11
2
111
111
)(
2
1
2
2
1
2
1
2
1
2
1
2
22
2
2
1
2
22
2
2
1
2
2
2
1
2
11
2
1
1
1
2
ppba
ap
pppba
ap
bappap
bap
aaba
ppapbb
aaba
p
xyCovb
xVaraba
ppap
byxCov
ayVar
bxVar
abap
xb
yCovx
a
xCov
bappap
b
y
a
xCov
b
yVar
a
xVar
bap
pxb
y
a
xCov
bapxVarp
bab
y
a
xVar
bap
xpbab
y
a
xpCov
xpVarbab
y
a
xpVar
xpbab
y
a
xpVarVar jtjt
−
++−=
−+
++−=
+−+−+
+=
+
+−+−+
++
+=
+
+−+−+
+
++
+=
+
+−+−+
+
+
+
+=
−
+
++−+
+
+
+
+=
−
+
++
+−+
+
+=
−+
+
+==
−
−
−−
−−
−
−
−
−
−
−−
−
−
−
µσ
Hence, using the full notation:
PLjdJ
PLkk
kt ∈=∑∈=
− and 1both if 1
1
( ) ( )∑∈=
−
−
−
−−−
−
+∗
+∗−=−
−
J
PLkk
jktjkt
t
g
wwb
jt
wwb
jtjktktjt PP
M
eePd
tt
tt
1
2
1
2)(*2
1
)(*2
1
2
1
2 211
*11
1
σσσσ


153
Appendix 3
TABLE A3.1 NOTATION OVERVIEW
Symbol Description
Indices and (Vectors of) Indicators
c, o Index for copycat PL and original NB respectively
C, O Indicator equal one for copycat PL and original NB respectively, 0 otherwise
djt Indicator equal to 1 if brand j was consumed at purchase occasion t and 0 otherwise*.
Dt,i Vector of purchase indicators djt of household i up to purchase occasion t.
Et,i Vector of consumption signal Gjt,i received by household i up to purchase occasion t.
j, k Indices for brand.
m Index for unit of a product.
Mt Number of product units purchased by the consumer on the purchase occasion t*.
t, h Indices for purchase occasion.
Ti Number of purchases of household i during the sample period.
u Brand index, u=c for copycat PL and u=o for original NB
wt Week index for purchase occasion t.
zjt,i Indicator equal to 1 if brand j was available to household i at purchase occasion t and 0 otherwise.
Utility and its Determinants
r Risk aversion parameter*.
Ujt Utility of brand j at purchase occasion t*.
Xjt Utility determinants for brand j at purchase occasion t other than quality belief*.
β Consumer’s sensitivity parameters to utility determinants in Xjt*.
Rt Reactance effect
ψu Parameter capturing maximum potential magnitude of the reactance
τu Parameter capturing rate of decrease of reactance related with the difference in brand quality
beliefs
εjt i.i.d. extreme value component of utility observed by the consumer, unobserved by the
researcher*.
Quality and Quality Belief
qj True quality of brand j*.
Qjt Quality belief of brand j on purchase occasion t*.
µjt Mean quality belief of brand j on purchase occasion t*.
2
jtσ Uncertainty or variance in quality belief for brand j at purchase occasion t*.
Learning and Forgetting
b Parameter capturing the rate of forgetting*.
It Consumer’s information set at purchase occasion t*.
gjtm Consumption signal of one unit of brand j on purchase occasion t*.
Gjt Average over a series of mt consumption signals gjt for brand j on purchase occasion t.
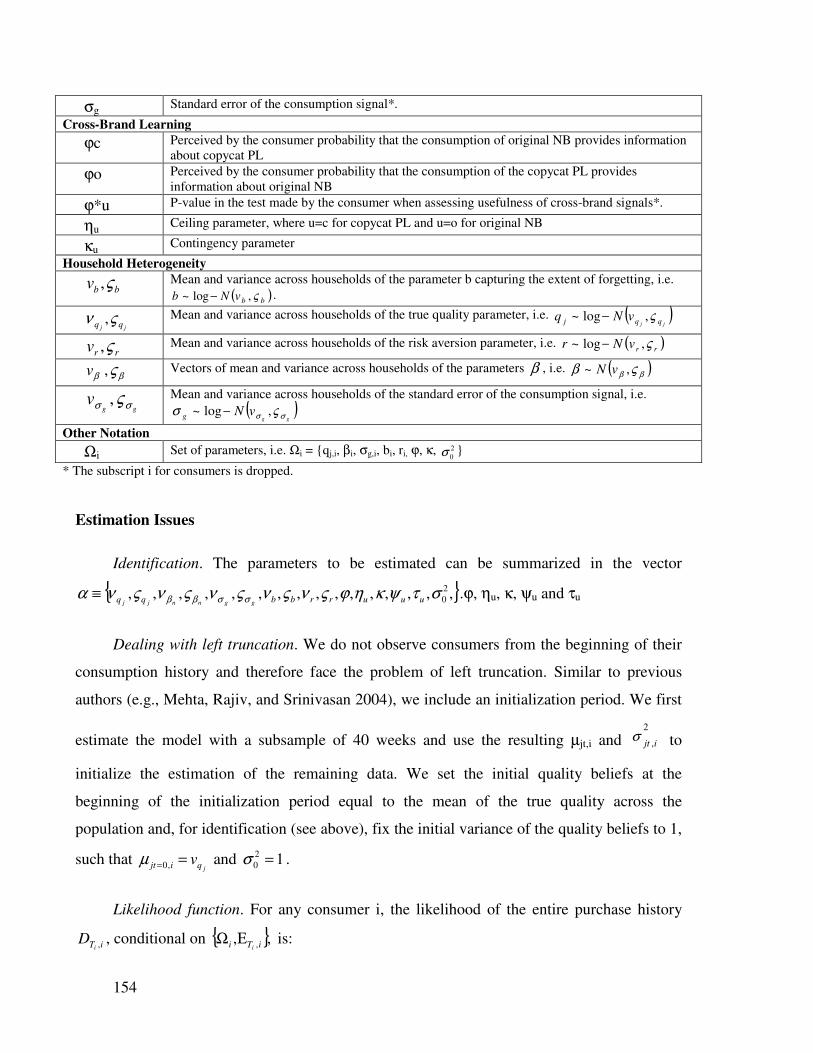
154
σg Standard error of the consumption signal*.
Cross-Brand Learning
ϕc Perceived by the consumer probability that the consumption of original NB provides information
about copycat PL
ϕo Perceived by the consumer probability that the consumption of the copycat PL provides
information about original NB
ϕ*u P-value in the test made by the consumer when assessing usefulness of cross-brand signals*.
ηu Ceiling parameter, where u=c for copycat PL and u=o for original NB
κu Contingency parameter
Household Heterogeneity
bbv ς, Mean and variance across households of the parameter b capturing the extent of forgetting, i.e.
( )bbvNb ς,log~ − .
jj qq ςν , Mean and variance across households of the true quality parameter, i.e. ( )jj qqj vNq ς,log~ −
rrv ς, Mean and variance across households of the risk aversion parameter, i.e. ( )rrvNr ς,log~ −
ββ ς,v Vectors of mean and variance across households of the parameters β , i.e. ( )ββ ςβ ,~ vN
ggv σσ ς, Mean and variance across households of the standard error of the consumption signal, i.e.
( )gg
vNg σσ ςσ ,log~ −
Other Notation
Ωi Set of parameters, i.e. Ωi = qj,i, βi, σg,i, bi, ri, ϕ, κ, 2
0σ
* The subscript i for consumers is dropped.
Estimation Issues
Identification. The parameters to be estimated can be summarized in the vector
,,,,,,,,,,,,,,,, 2
0στψκηϕςνςνςνςνςνα σσββ uuurrbbqq ggnnjj≡ .ϕ, ηu, κ, ψu and τu
Dealing with left truncation. We do not observe consumers from the beginning of their
consumption history and therefore face the problem of left truncation. Similar to previous
authors (e.g., Mehta, Rajiv, and Srinivasan 2004), we include an initialization period. We first
estimate the model with a subsample of 40 weeks and use the resulting µjt,i and 2
,ijtσ to
initialize the estimation of the remaining data. We set the initial quality beliefs at the
beginning of the initialization period equal to the mean of the true quality across the
population and, for identification (see above), fix the initial variance of the quality beliefs to 1,
such that jqijt v== ,0µ and 12
0 =σ .
Likelihood function. For any consumer i, the likelihood of the entire purchase history
iTiD , , conditional on ,, ,iTi i
ΕΩ is:

155
( ) ( )∏∏= =
ΕΩ==ΕΩi
ijt
ii
T
t
J
j
d
itiijtiTiiTi dDL1 1
,,,,,,|1Pr,| .
We denote the p.d.f. of parameters in Ωi as uΩ(Ωi) and the p.d.f. of iTi ,Ε as uE( iTi ,Ε ). The
unconditional likelihood of household’s i purchase history iTiD , is:
( ) ( ) ( ) ( ) iiiTiTEiTiiTiiTi duduDLDLi it
iiiiiΩΩ
ΕΕΕΩ= Ω
Ω Ε∫ ∫,
,,,,, ,|| α .
Because this likelihood involves multidimensional integrals, numerical computation is
prohibitively expensive. Therefore, in line with previous studies, we resort to simulated
likelihood. Using F sets of scrambled Halton draws (Train 2003) for the coefficients in Ωi and
the consumption signals in iTi ,Ε , we obtain an estimate of Li:
( ) ( )( )∑ ΕΩ=F
f
ff
iTiiTi iiDLDL ,||ˆ
,, α .
We set F = 100, because larger values are not feasible given the computational demands
of the model. As a robustness check, we run the model with different sets of draws, and the
results do not change.
The log-likelihood for N households is:
( ) ( )∑=
==
N
i
iTi
N
iiT iiDLDLL
1
,1, |ˆln| αα .
We estimate the parameters in α by maximizing this likelihood:
( )ααα
|maxarg1,
N
iiTMLE iDLL
== .

156
157
References
Aaker, David A. and Kevin Lane Keller (1990), "Consumer Evaluations of Brand
Extensions," Journal of Marketing, 54 (1), 27-41.
AC Nielsen (2005), "Growth of Private Label Continues Worldwide, Says Acnielsen," AC
Nielsen Global Systems.
AC Nielsen (2003), "The Power of Private Label: A Review of Growth Trends around the
World."
Ackerberg, D. A. (2003), "Advertising, Learning, and Consumer Choice in Experience Good
Markets: An Empirical Examination," International Economic Review, 44 (3), 1007-40.
---- (2001), "Empirically Distinguishing Informative and Prestige Effects of Advertising,"
Rand Journal of Economics, 32 (2), 316-33.
Ailawadi, K. L., K. Pauwels, and J. B. E. M. Steenkamp (2008), "Private-Label Use and Store
Loyalty," Journal of Marketing, 72 (6), 19-30.
Ailawadi, Kusum L. (2001), "The Retail Power-Performance Conundrum: What Have We
Learned?," Journal of Retailing, 77 (3), 299-318.
Ailawadi, Kusum L., Karen Gedenk, and Scott Neslin (2003a), "Title," Tuck Business School,
Working Paper No. 03-16
Ailawadi, Kusum L. and B. Harlam (2004), "An Empirical Analysis of the Determinants of
Retail Margins: The Role of Store-Brand Share," Journal of Marketing, 68 (1), 147-65.
Ailawadi, Kusum L. and Kevin Lane Keller (2004), "Understanding Retail Branding:
Conceptual Insights and Research Priorities," Journal of Retailing, 80 (4), 331-42.
158
Ailawadi, Kusum L., Donald R. Lehmann, and Scott A. Neslin (2003b), "Revenue Premium
as an Outcome Measure of Brand Equity," Journal of Marketing, 67 (4), 1-17.
Ainslie, A. and P. E. Rossi (1998), "Similarities in Choice Behavior across Product
Categories," Marketing Science, 17 (2), 91-106.
Akcura, M. T., F. F. Gonul, and E. Petrova (2004), "Consumer Learning and Brand Valuation:
An Application on over-the-Counter Drugs," Marketing Science, 23 (1), 156-69.
Anderson, John R. (1991), "The Adaptive Nature of Human Categorization," Psychological
Review, 98 (3), 409-29.
Ataman, Berk, Harald van Heerde, and Carl Mela (2010), "The Long-Term Effect of
Marketing Strategy on Brand Sales," Journal of Research in Marketing, forthcoming.
Balachander, Subramanian and Sanjoy Ghose (2003), "Reciprocal Spillover Effects: A
Strategic Benefit of Brand Extensions," Journal of Marketing, 67 (1), 4-13.
Baltas, George, Peter Doyle, and Paul Dyson (1997), "A Model of Consumer Choice for
National Vs. Private Label Brands," Journal of the Operational Research, 48 (10), 988-95.
Barbara Loken, Ivan Ross, and Ronald L. Hinkle (1986), "Consumer 'Confusion' of Origin and
Brand Similarity Perceptions," Journal of Public Policy and Marketing5, 195-211.
Batra, Rajeev and Indrajit Sinha (2000), "Consumer-Level Factors Moderating the Success of
Private Label Brands," Journal of Retailing, 76 (2), 175-91.
Bhat, S. and S. K. Reddy (2001), "The Impact of Parent Brand Attribute Associations and
Affect on Brand Extension Evaluation," Journal of Business Research, 53 (3), 111-22.
Biehl, A. R. (2001), "Durable-Goods Monopoly with Stochastic Values," Rand Journal of
Economics, 32 (3), 565-77.
Bonfrer, André and Pradeep K. Chintagunta (2004), "Store Brands: Who Buys Them and
What Happens to Retail Prices When They Are Introduced?," Review of Industrial
Organization, 24 (2), 195-218.
Boston Consulting Group (2004), "Private Label: Threat to Manufacturers, Opportunity for
Retailers," The Boston Consulting Group.
Boush, David M., Shannon Shipp, Barbara Loken, Ezra Gencturk, Susan Crockett, Ellen
Kennedy, Betty Minshall, Dennis Misurell, Linda Rochford, and Jon Strobel (1987), "Affect
Generalization to Similar and Dissimilar Brand Extensions," Psychology and Marketing, 4
(Fall), 225-37.
159
Bradlow, E. T., Y. Hu, and T. H. Ho (2004), "A Learning-Based Model for Imputing Missing
Levels in Partial Conjoint Profiles," Journal of Marketing Research, 41 (4), 369-81.
Brenner, Thomas (1999), Modelling Learning in Economics. Cheltenham: Edward Elgar.
Briesch, R. A., P. K. Chintagunta, and R. L. Matzkin (2002), "Semiparametric Estimation of
Brand Choice Behavior," Journal of the American Statistical Association, 97 (460), 973-82.
Broniarczyk, S. M. and J. W. Alba (1994), "The Importance of the Brand in Brand Extension,"
Journal of Marketing Research, 31 (2), 214-28.
Bronnenberg, B. J., S. K. Dhar, and J. P. H. Dube (2009), "Brand History, Geography, and the
Persistence of Brand Shares," Journal of Political Economy, 117 (1), 87-115.
Bronnenberg, B. J., J. P. Dube, C. F. Mela, P. Albuquerque, T. Erdem, B. Gordon, D.
Hanssens, G. Hitsch, H. Hong, and B. H. Sun (2008), "Measuring Long-Run Marketing
Effects and Their Implications for Long-Run Marketing Decisions," Marketing Letters, 19 (3-
4), 367-82.
Burger, Philip.C. and Barbara Schott (1972), "Can Private Brand Buyers Be Identified?,"
Journal of Marketing Research, 9, 219-22.
Camacho, Nuno, Bas Donkers, and Stefan Stremersch (2008), "Predictably Non-Bayesian:
Quantifying Salience Effects in Physician Learning," Working Paper.
Campbell, M. C. and A. Kirmani (2000), "Consumers' Use of Persuasion Knowledge: The
Effects of Accessibility and Cognitive Capacity on Perceptions of an Influence Agent,"
Journal of Consumer Research, 27 (1), 69-83.
Campo, K. (1997), "Variety Seeking and the Sensitivity to in-Store Promotions," University of
Antwerp-UFSIA.
Chen, Y. X. and S. Yang (2007), "Estimating Disaggregate Models Using Aggregate Data
through Augmentation of Individual Choice," Journal of Marketing Research, 44 (4), 613-21.
Chintagunta, P., T. Erdem, P. E. Rossi, and M. Wedel (2006), "Structural Modeling in
Marketing: Review and Assessment," Marketing Science, 25 (6), 604-16.
Chintagunta, Pradeep K. (2002), "Investigating Category Pricing Behavior at a Retail Chain,"
Journal of Marketing Research, 39 (2), 141-54.
160
Collins-Dodd, C. and J. L. Zaichkowsky (1999), "National Brand Responses to Brand
Imitation: Retailers Versus Other Manufacturers," The Journal of Product and Brand
Management, 8, 96-105.
Corstjens, Marcel and Rajiv Lal (2000), "Building Store Loyalty through Store Brands,"
Journal of Marketing Research, 37 (3), 281-91.
Cotterill, Ronald W., William P. Putsis, and Ravi Dhar (2000), "Assessing the Competitive
Interaction between Private Labels and National Brands," Journal of Business, 73 (1), 109-37.
Crawford, G. S. and M. Shum (2005), "Uncertainty and Learning in Pharmaceutical Demand,"
Econometrica, 73 (4), 1137-73.
Darby, Michael and Edi Karni (1973), "Free Competition and the Optimal Amount of Fraud,"
Journal of Law & Economics, 16 (1), 67-88.
Dekimpe, M. G., D. M. Hanssen, and J. M. Silva-Risso (1999), "Long-Run Effects of Price
Promotions in Scanner Markets," Journal of Econometrics, 89 (1-2), 269-91.
Dekimpe, Marnik G. and D. M. Hanssens (1995), "Empirical Generalizations About Market
Evolution and Stationarity," Marketing Science, 14 (3), G109-G21.
Dhar, R. and I. Simonson (2003), "The Effect of Forced Choice on Choice," Journal of
Marketing Research, 40 (2), 146-60.
Dhar, S. K. and Stephen J. Hoch (1997), "Why Store Brand Penetration Varies by Retailer,"
Marketing Science, 16 (3), 208-27.
Dillard, J. P. and L. J. Shen (2005), "On the Nature of Reactance and Its Role in Persuasive
Health Communication," Communication Monographs, 72 (2), 144-68.
Du , Rex, Eunkyu Lee, and Richard Staelin (2005), "Bridge, Focus, Attack, or Stimulate:
Retail Category Management Strategies with a Store Brand," Quantitative Marketing and
Economics, 3 (4), 393.
Du, Rex Y. and W. A. Kamakura (2006), "Household Life Cycles and Lifestyles in the United
States," Journal of Marketing Research, 43 (1), 121-32.
Eckstein, Z. and K. I. Wolpin (1989), "The Specification and Estimation of Dynamic
Stochastic Discrete Choice Models - a Survey," Journal of Human Resources, 24 (4), 562-98.
Erdem, T., M. P. Keane, and B. Sun (2008), "A Dynamic Model of Brand Choice When Price
and Advertising Signal Product Quality," Marketing Science, 27 (6), 1111-25.
161
Erdem, Tülin (1996), "A Dynamic Analysis of Market Structure Based on Panel Data,"
Marketing Science, 15 (4), 359-78.
---- (1998), "An Empirical Analysis of Umbrella Branding," Journal of Marketing Research,
35 (3), 339-51.
Erdem, Tülin and M. P. Keane (1996), "Decision-Making under Uncertainty: Capturing
Dynamic Brand Choice Processes in Turbulent Consumer Goods Markets," Marketing
Science, 15 (1), 1-20.
Erdem, Tülin and Baohong H. Sun (2002), "An Empirical Investigation of the Spillover
Effects of Advertising and Sales Promotions in Umbrella Branding," Journal of Marketing
Research, 39 (4), 408-20.
Erdem, Tülin, Y. Zhao, and A. Valenzuela (2004), "Performance of Store Brands: A Cross-
Country Analysis of Consumer Store-Brand Preferences, Perceptions, and Risk," Journal of
Marketing Research, 41 (1), 86-100.
Fader, P. S. and B. G. S. Hardie (1996), "Modeling Consumer Choice among Skus," Journal
of Marketing Research, 33 (4), 442-52.
Foxman, E.R., P.W. Berger, and J.A. ( Cole (1992), "Consumer Brand Confusion: A
Conceptual Framework," Psychology and Marketing, 9, 123-41.
Gijsbrechts, E., K. Campo, and P. Nisol (2000), "Towards a Theory-Based Measure of
Purchase Variation," Academy of Marketing Science Review, Volume 2000 (06), 1-29.
Goettler, Ronald and Karen Clay (2009), "Tariff Choice with Consumer Learning and
Switching Costs," Working Paper.
Groot, de Morris H. (1970), Optimal Statistical Decisions. New York: McGraw-Hill and
Company.
Gurhan-Canli, Zeynep and Durairaj J. Maheswaran (1998), "The Effects of Extensions on
Brand Name Dilution and Enhancement," Journal of Marketing Research, 35 (4), 464-73.
Hansen, K. and V. Singh (2008), "Are Store-Brand Buyers Store Loyal? An Empirical
Investigation," Management Science, 54 (10), 1828-34.
Hansen, K., V. Singh, and P. Chintagunta (2006), "Understanding Store-Brand Purchase
Behavior across Categories," Marketing Science, 25 (1), 75-90.
Hawkins, S. A. and Stephen J. Hoch (1992), "Low-Involvement Learning - Memory without
Evaluation," Journal of Consumer Research, 19 (2), 212-25.
162
Heilman, C. M., D. Bowman, and G. P. Wright (2000), "The Evolution of Brand Preferences
and Choice Behaviors of Consumers New to a Market," Journal of Marketing Research, 37
(2), 139-55.
Hoch, S. J. and Y. W. Ha (1986), "Consumer Learning from Advertising and the Ambiguity
of Processing Experience," Journal of Consumer Research, 13 (2), 221– 33.
Hoch, Stephen J. (1996), "How Should National Brands Think About Private Labels?," Sloan
Management Review, 37 (2), 89-102.
Hoch, Stephen J. and S. Banerji (1993), "When Do Private Labels Succeed," Sloan
Management Review, 34 (4), 57-67.
Hoch, Stephen J. and J. Deighton (1989), "Managing What Consumers Learn from
Experience," Journal of Marketing, 53 (2), 1-20.
Hoch, Stephen J., Alan L. Montgomery, and Young-Hoon Park (2006), "Title," Wharton
School, University of Pennsylvania,
Howard, D. J., R. A. Kerin, and C. Gengler (2000), "The Effects of Brand Name Similarity on
Brand Source Confusion: Implications for Trademark Infringement," Journal of Public Policy
& Marketing, 19 (2), 250-64.
Inman, J. J., J. Park, and A. Sinha (2008), "A Dynamic Choice Map Approach to Modeling
Attribute-Level Varied Behavior among Stockkeeping Units," Journal of Marketing Research,
45 (1), 94-103.
Israel, M. (2005), "Services as Experience Goods: An Empirical Examination of Consumer
Learning in Automobile Insurance," American Economic Review, 95 (5), 1444-63.
Iyengar, R., A. Ansari, and S. Gupta (2007), "A Model of Consumer Learning for Service
Quality and Usage," Journal of Marketing Research, 44 (4), 529-44.
Jacoby, J. and M. Morrin (1998), ""Not Manufactured or Authorized By...": Recent Federal
Cases Involving Trademark Disclaimers," Journal of Public Policy & Marketing, 17 (1), 97-
107.
Janakiraman, R., S. Dutta, C. Sismeiro, and P. Stern (2008), "Physicians' Persistence and Its
Implications for Their Response to Promotion of Prescription Drugs," Management Science,
54 (6), 1080-93.
Johnson, J. P. and D. P. Myatt (2006), "On the Simple Economics of Advertising, Marketing,
and Product Design," American Economic Review, 96 (3), 756-84.
163
Kahn, B. E. and J. S. Raju (1991), "Effects of Price Promotions on Variety-Seeking and
Reinforcement Behavior," Marketing Science, 10 (4), 316-37.
Kapferer, J. N. (1995), "Brand Confusion - Empirical-Study of a Legal Concept," Psychology
& Marketing, 12 (6), 551-68.
Kumar, Nirmalya and Jan-benedict E. M. Steenkamp (2007), Private Label Strategy: How to
Meet the Store Brand Challenge. Boston: Harvard Business School Press.
Loken, Barbara and Deborah Roedder John (1993), "Diluting Brand Beliefs - When Do Brand
Extensions Have a Negative Impact," Journal of Marketing, 57 (3), 71-84.
Lovett, Mitchell James (2008), "Unstable Consumer Learning Models: Structural Models and
Experimental Investigation," Duke University.
Marketing News (1987), "Quality Creates Consumer Loyalty for Private Labels," in Marketing
News Vol. 10.
McAlister, L. and E.A. Pessemier (1982), "Variety Seeking Behavior: An Interdisciplinary
Review," Journal of Consumer Research, 9 (December), 311-22.
McCloskey, Michael E. and Sam Glucksberg (1978), "Natural Categories: Well Defined or
Fuzzy Sets?," Memory and Cognition, 6 (4), 462-72.
McFadden, Daniel (1974), Conditional Logit Analysis of Qualitative Choice Behavior. New-
York, London: Academic Press.
Mehta, Nitin, Surendra Rajiv, and Kannan Srinivasan (2004), "Role of Forgetting in Memory-
Based Choice Decisions: A Structural Model," Quantitative Marketing and Economics, 2 (2),
107.
Meyvis, Tom and Cris Janiszewski (2004), "When Are Broader Brands Stronger Brands? An
Accessibility Perspective on the Success of Brand Extensions," Journal of Consumer
Research, 31 (2), 346-57.
Miller, Robert A. (1984), "Job Matching and Occupational Choice," Journal of Political
Economy, 92 (6), 1086-120.
Mitra, D. and P. N. Golder (2006), "How Does Objective Quality Affect Perceived Quality?
Short-Term Effects, Long-Term Effects, and Asymmetries," Marketing Science, 25 (3), 230-
47.
Moberg, Anders (2006), "Speech by President and Ceo Anders Moberg," in 2006 Ahold
Annual General Meeting. Amsterdam, the Netherlands.
164
Moeltner, K. and J. Englin (2004), "Choice Behavior under Time-Variant Quality: State
Dependence Versus "Play-It-by-Ear" In Selecting Ski Resorts," Journal of Business &
Economic Statistics, 22 (2), 214-24.
Narasimhan, Chakravarthi and Ronald T. Wilcox (1998), "Private Labels and the Channel
Relationship: A Cross-Category Analysis," Journal of Business, 71 (4), 573-600.
Narayanan, S., P. K. Chintagunta, and E. J. Miravete (2007), "The Role of Self Selection,
Usage Uncertainty and Learning in the Demand for Local Telephone Service," Qme-
Quantitative Marketing and Economics, 5 (1), 1-34.
Narayanan, S. and P. Manchanda (2009), "Heterogeneous Learning and the Targeting of
Marketing Communication for New Products," Marketing Science, Articles in Advance, pp.
1–18.
Narayanan, S., P. Manchanda, and Pradeep K. Chintagunta (2005), "Temporal Differences in
the Role of Marketing Communication in New Product Categories," Journal of Marketing
Research, 42 (3), 278-90.
Nelson, Phillip (1970), "Information and Consumer Behavior," Journal of Political Economy,
78 (1970), 311-29.
Nijs, V. R., Marnik G. Dekimpe, Jan-Benedict E. M. Steenkamp, and D. M. Hanssens (2001),
"The Category-Demand Effects of Price Promotions," Marketing Science, 20 (1), 1-22.
Nijs, V. R., S. Srinivasan, and K. Pauwels (2007), "Retail-Price Drivers and Retailer Profits,"
Marketing Science, 26 (4), 473-87.
Park, C. W., S. Milberg, and R. Lawson (1991), "Evaluation of Brand Extensions - the Role of
Product Feature Similarity and Brand Concept Consistency," Journal of Consumer Research,
18 (2), 185-93.
Pechmann, C. and S. Ratneshwar (1992), "Consumer Covariation Judgments - Theory or Data
Driven," Journal of Consumer Research, 19 (3), 373-86.
Planet Retail (2007), "Private Label Trends Worldwide " e-intelligence on global retailing,
www.planetretail.net (July).
PlanetRetail (2007), "Private Label Trends Worldwide " e-intelligence on global retailing,
www.planetretail.net (July).
Pullig, C., C. J. Simmons, and R. G. Netemeyer (2006), "Brand Dilution: When Do New
Brands Hurt Existing Brands?," Journal of Marketing, 70 (2), 52-66.
165
Quick, Brain, L. and Michael T. Stephenson (2007), "Further Evidence That Psychological
Reactance Can Be Modeled as a Combination of Anger and Negative Cognitions,"
Communication Research, 34x, 255-76.
Richardson, Paul S. (1997), "Are Store Brands Perceived to Be Just Another Brand?," Journal
of Product and Brand Management, 6 (5), 388-404.
Richardson, Paul S., A. S. Dick, and A. K. Jain (1994), "Extrinsic and Intrinsic Cue Effects on
Perceptions of Store Brand Quality," Journal of Marketing, 58 (4), 28-36.
Roberts, John and Glenn Urban (1988), "Modeling Multiattribute Utility, Risk and Belief
Dynamics for New Consumer Durable Brand Choice," Management Science, 34 (February),
167–85.
Sayman, S. and J. S. Raju (2004), "Investigating the Cross-Category Effects of Store Brands,"
Review of Industrial Organization, 24 (2), 129-41.
Sayman, Serdar, Stephen J. Hoch, and Jagmohan S. Raju (2002), "Positioning of Store
Brands," Marketing Science, 21 (4), 378-97.
Scott-Morton, Fiona S. and Florian Zettelmeyer (2004), "The Strategic Positioning of Store
Brands in Retailer-Manufacturer Negotiations," Review of Industrial Organization, 24 (2),
161-94.
Shin, Sangwoo, Sanjog Misra, and Dan Horsky (2007), "Disentangling Preferences, Inertia
and Learning in Brand Choice Models," Working Paper.
Simonson, Itamar (1994), "Trademark Infringement from the Buyer Perspective: Conceptual
Analysis and Measurement Implications," Journal of Public Policy & Marketing, 13 (2), 181-
200.
Steenkamp, Jan-Benedict E. M. and Marnik G. Dekimpe (1997), "The Increasing Power of
Store Brands: Building Loyalty and Market Share," Long Range Planning, 30 (6), 917-30.
Steenkamp, Jan-Benedict, E.M. (1990), "Conceptual Model of the Quality Perception
Process," Journal of Business Research, 21, 309-33.
Stigler, George J. (1961), "The Economics of Information," Journal of Political Economy, 69,
213.
Swait, Joffre and Jordan Louviere (1993), "The Role of the Scale Parameter in the Estimation
and Comparison of Multinomial Logit-Models," Journal of Marketing Research, 30 (3), 305-
14.
166
Swaminathan, Vanitha, R. J. Fox, and S. K. Reddy (2001), "The Impact of Brand Extension
Introduction on Choice," Journal of Marketing, 65 (4), 1-15.
Train, Kenneth (2003), Discrete Choice Methods with Simulation. Cambridge: Cambridge
University Press.
Trivedi, Minakshi and Michael Morgan (2003), "Promotional Evaluation and Response among
Variety Seeking Segments," Journal of Product and Brand Management, 12 (6), 408-23.
van der Lans, R., R. Pieters, and M. Wedel (2008), "Competitive Brand Salience," Marketing
Science, 27 (5), 922-31.
Van Heerde, H., K. Helsen, and M. G. Dekimpe (2007), "The Impact of a Product-Harm Crisis
on Marketing Effectiveness," Marketing Science, 26 (2), 230-45.
Van Horen, Femke, Rik Pieters, and Didrik. A. Stapel (2008), "Unexpected Benefits of Being
Less Rather Than More Similar: How Mindset and Brand Presentation Influence Copycat
Evaluation," in Association for Consumer Research Annual Conference. San Francisco, USA.
Warlop, L. and J. W. Alba (2004), "Sincere Flattery: Trade-Dress Imitation and Consumer
Choice," Journal of Consumer Psychology, 14 (1-2), 21-27.
Warlop, L., S. Ratneshwar, and S. M. J. van Osselaer (2005), "Distinctive Brand Cues and
Memory for Product Consumption Experiences," International Journal of Research in
Marketing, 22 (1), 27-44.
Wright, A. A. and J. G. Lynch (1995), "Communication Effects of Advertising Versus Direct
Experience When Both Search and Experience Attributes Are Present," Journal of Consumer
Research, 21 (4), 708-18.
Zaichkowsky, Judith Lynne and Richard Neil Simpson (1996), "The Effect of Experience with
a Brand Imitator on the Original Brand,",Marketing Letters, 7 (1), 31-39.
Zeithaml, Valarie A. (1988), "Consumer Perceptions of Price, Quality, and Value - a Means-
End Model and Synthesis of Evidence," Journal of Marketing, 52 (3), 2-22.
167
Samenvatting (Summary in Dutch)
De groei van de informatie economie (Nelson 1970; Stigler 1961) heeft ervoor gezorgd
dat onderzoekers in economie (e.g. Johnson and Myatt 2006; Miller 1984) en bedrijfskunde
(e.g. Eckstein and Wolpin 1989; Narayanan and Manchanda 2009) de aandacht focussen op
onzekerheid en leerprocessen tijdens beslissingen. Veel onderzoekers bestuderen met name
hoe personen eigenschappen van het beslissingsobject leren, bijvoorbeeld hoe consumenten
het niveau van productattributen leren. Een groeiend aantal onderzoeken laat zien dat keuzes
niet gebaseerd zijn op de werkelijke situatie, maar meer op de perceptie hiervan. Bovendien
bestaat er onzekerheid over deze percepties, hetgeen voor risicomijdende beslissers leidt tot
lager nut van objecten. Deze onzekerheid kan gereduceerd worden wanneer beslissers leren (of
verhoogd worden wanneer beslissers vergeten). Dit leerproces en met name hoe dit proces de
perceptie over objecten vormt en de daaropvolgende beslissingen staan centraal in dit
proefschrift.
De Bayesiaanse formulering voor leren is een gebruikelijke aanpak om leerprocessen te
modelleren in bedrijfskundig en economisch onderzoek (Erdem and Keane 1996; Miller 1984;
Roberts and Urban 1988). Deze formulering beschrijft hoe consumenten hun a priori
percepties over objecten integreren met nieuwe informatiesignalen, gebruikmakende van de
regel van Bayes, en wordt vaak geïntegreerd in keuzemodellen voor deze objecten. In de
kwantitatieve marketing, Bayesiaanse leermodellen zijn toegepast op verschillende
interessante problemen die variëren in welke individuen leren, welke dimensies van objecten
zij leren, en de informatiebronnen die zij gebruiken. Het leerobject is doorgaans de kwaliteit
van een merk en de informatiebron is consumptie. Dit proefschrift past in deze
onderzoeksstroom: het focust op hoe de consumptie van merken consumenten in staat stelt te
leren over de kwaliteit van merken en vervolgens de keuze voor merken beïnvloedt.

168
Het is belangrijk om vast te stellen dat de meerderheid van het voorgaande onderzoek
zich bezighoudt met leerprocessen binnen een merk – oftewel, hoe informatie behorende bij
een specifiek merk de perceptie over ditzelfde merk verandert. Echter, er zijn situaties waarbij
de kwaliteit van een merk ook informatie bevat over de kwaliteit van andere merken. Dit kan
gebeuren wanneer consumenten merken categoriseren in dezelfde “mental category”, of
wanneer merken attributen delen die door consumenten als diagnostisch gezien worden
(Janakiraman et al. 2008). In deze situaties kunnen consumenten nieuwe informatie over een
merk, bijvoorbeeld door consumptie ervaringen over dit merk, gebruiken om de
kwaliteitspercepties van een ander merk aan te passen. Deze leerprocessen tussen merken is
conceptueel vergelijkbaar met spillover effecten tussen attributen binnen hetzelfde merk
(Bradlow et al. 2004), tussen producten van hetzelfde merk in dezelfde categorie (Balachander
and Ghose 2003), en tussen producten van hetzelfde merk in verschillende categorieën (Erdem
1998; Erdem and Sun 2002). Hoewel deze laatste leerprocessen redelijk goed gedocumenteerd
zijn, hebben leerprocessen tussen verschillende merken nauwelijks aandacht gekregen in de
literatuur, met uitzondering van een recent onderzoek door Janakiraman et al. (2008) dat
leerprocessen tussen originele medicijnen en hun generieke versies bestudeert. Dit is een
belangrijke tekortkoming in de literatuur, omdat spillover effecten tussen merken door
consumptie ervaringen aanzienlijke gevolgen hebben voor het managen van merken die
substantieel verschillen van principes gebaseerd op leerprocessen binnen merken.
De belangrijkste bijdragen van dit proefschrift liggen op het gebied van leerprocessen
tussen verschillende merken. In het bijzonder, we onderzoeken leereffecten tussen merken en
huismerken van consumer packaged goods (zoals supermarkt producten). Huismerken,
oftewel het eigen merk van een winkelier, zijn ten opzichte van A-merken van fabrikanten
geleidelijk in populariteit toegenomen in de laatste decennia en hebben op dit moment een
substantieel marktaandeel: 16% in de VS (AC Nielsen 2005), 39.6% in Groot Brittannië en
46% in Zwitserland (Planet Retail 2007 p.7). Verkoop van huismerken levert winkeliers
hogere marges op (Ailawadi and Harlam 2004), verbetert de machtsverhoudingen met
fabrikanten (Ailawadi 2001), en verbetert de concurrentiepositie ten opzichte van prijsvechters
(Boston Consulting Group 2004). Het succes van huismerken vormt een uitdaging voor A-
merken, die vroeger de packaged goods markt domineerde (Steenkamp and Dekimpe 1997).

169
Onderzoek naar huismerken benadrukt het belang van de gepercipieerde kwaliteit om de
vraag naar huismerken te bepalen (Ailawadi et al. 2003a; Dhar and Hoch 1997; Hoch and
Banerji 1993; Steenkamp and Dekimpe 1997). Niet alleen het niveau van de gepercipieerde
kwaliteit van het huismerk speelt een rol, maar ook de mate van onzekerheid hierover (Batra
and Sinha 2000; Erdem et al. 2004). Hoewel het belang van consumenten percepties over de
kwaliteit van huismerken bekend is, is minder bekend hoe consumenten deze vormen, met
name wanneer het gaat om leerprocessen, hetgeen huismerken onderscheidt van A-merken.
In dit proefschrift onderzoeken wij twee situaties van leerprocessen tussen merken
waarbij huismerken een rol spelen. Ten eerste onderzoeken we consumptie spillovers tussen
huismerken van verschillende (concurrende) winkeliers, die op een zelfde manier
gepercipieerd kunnen worden door consumenten (Ailawadi 2001; Richardson 1997). Ten
tweede, bestuderen we de aard en de impact van op consumptie gebaseerde leerprocessen
tussen een leidend A-merk en een copycat huismerk dat de verpakking imiteert (Kapferer
1995; Sayman et al. 2002; Scott-Morton and Zettelmeyer 2004).
Dit proefschrift bestaat uit vijf hoofdstukken. Hoofdstuk 2 bestudeert de factoren en de
mate van leereffecten binnen merken in verschillende product categorieën. Dit hoofdstuk
introduceert het Bayesiaanse leermodel als onderdeel van de merkkeuze formulering. We
kalibreren dit huishouden specifieke model op de aankoopdata uit 20 verschillende
productcategorieën. We verkrijgen categorie- en huishoudenspecifieke schattingen van
parameters die de mate aangeven waarmee consumenten percepties aanpassen op basis van
nieuwe op consumptie gebaseerde informatie. Dit hoofdstuk geeft inzichten in de
algemeenheid en grootte van leereffecten voor fastmoving consumer goods, de variatie in
leerprocessen tussen categorieën en huishoudens en de onderliggende factoren. We laten zien
dat leereffecten optreden en significant zijn in bijna alle categorieën, en tegelijkertijd in sterkte
variëren tussen categorieën en huishoudens. Het is interessant om te zien dat correlaties tussen
leereffecten van huishoudens in verschillende categorieën erg laag zijn, hetgeen aangeeft dat
kennis vergaard door consumptie niet een eigenschap van een huishouden is. Tegelijkertijd
vinden we dat leereffecten negatief gerelateerd zijn aan de mate waarin consumenten op zoek
zijn naar variatie, positief aan de gepercipieerde risico in de categorie en de mate waarin de
categorie als duur wordt ervaren, en sterker optreden bij consumenten die regelmatig

170
aankopen doen in de categorie – waarnemingen die op basis van de bestaande literatuur valide
zijn.
Terwijl hoofdstuk 2 een bekend proces beschrijft (leerprocessen binnen een merk),
gebruikmakende van een bestaande methodologie (Bayesiaans aanpassen van
kwaliteitspercepties op basis van herhaaldelijk consumeren van hetzelfde merk) met als doel
empirisch bewijs te vergroten en onderliggende factoren te onderzoeken, is de belangrijkste
bijdrage van dit proefschrift te vinden in hoofdstukken drie en vier. In deze hoofdstukken
bestuderen we leerprocessen tussen verschillende merken, hetgeen nog niet onderzocht is. In
deze hoofdstukken ontwikkelen we nieuwe hypothesen en geven empirisch bewijs
gebruikmakende van verbeterde leermodellen. De gemeenschappelijke aanpak in deze
hoofdstukken is dat consumenten ervaringen van een bepaald merk gebruiken om de
kwaliteitspercepties van andere merken aan te passen, en minstens een van deze merken is
altijd een huismerk. Naast deze overeenkomsten, behandelen deze hoofdstukken hele andere
situaties met verschillende uitdagingen en bevindingen voor winkeliers en fabrikanten.
In hoofdstuk drie bestuderen we leerprocessen tussen huismerken van verschillende
winkeliers. Het doel van dit onderzoek is om twee verschillende inzichten van wetenschappers
en managers over huismerken te integreren. Het eerste inzicht is dat winkeliers huismerken
gebruiken om zich te onderscheiden van concurrerende winkeliers. Het tweede, tegengestelde
inzicht gaat ervan uit dat huismerken “geen merken” (generieke merken) zijn en dat
consumenten geen verschil zien tussen huismerken van verschillende winkelketens. Onze
aanname is dat consumenten tot op zekere hoogte leren tussen huismerken van verschillende
winkelketens. We verwachten dat leerprocessen tussen huismerken gemodereerd wordt door
de gepercipieerde kwaliteitsovereenkomsten tussen huismerken, waarbij kleinere (grotere)
overeenkomsten leiden tot zwakkere (sterkere) leereffecten tussen huismerken van
concurrerende winkelketens. Bovendien verwachten we dat deze leereffecten tussen
huismerken veranderen over de tijd, wanneer consumenten preciezere percepties over de
kwaliteit van ieder huismerk ontwikkelen. Om deze verwachtingen te toetsen, breiden we het
traditionele Bayesiaanse leermodel uit om leereffecten tussen huismerken te beschrijven
afhankelijk van de gepercipieerde overeenkomsten tussen huismerken. We maken gebruik van
scannerdata van afwasmiddelen waarin we de keuzes van huishoudens voor verschillende

171
wasmiddelen observeren en de gebruikte marketingactiviteiten in de tijd. Aangezien wij
geïnteresseerd zijn in leerprocessen tussen huismerken van verschillende winkelketens, richten
we ons alleen op huishoudens die afwasmiddelen kopen in minstens twee verschillende
winkelketens. We gebruiken ons model om te bepalen hoe consumenten de kwaliteit van een
merk leren door consumptie, in welke mate consumenten leren tussen huismerken, en hoe dit
beïnvloedt wordt door gepercipieerde overeenkomsten tussen huismerken.
Onze resultaten laten substantiële leereffecten zien tussen verschillende huismerken.
Gepercipieerde overeenkomsten tussen huismerken beïnvloeden deze effecten significant,
maar leerprocessen tussen merken worden pas irrelevant wanneer huismerken substantieel van
elkaar verschillen. In simulaties illustreren we de implicaties van deze leerprocessen tussen
huismerken. We laten zien dat gepercipieerde overeenkomsten tussen huismerken de
mogelijkheden van winkeliers om zich te differentiëren vermindert in de ogen van
consumenten die boodschappen doen in meerdere winkels. Tegelijkertijd vinden we dat
leereffecten tussen huismerken kan leiden tot een toename in het marktaandeel ten opzichte
van A-merken. Dit komt doordat leereffecten tussen huismerken ervoor zorgen dat de
onzekerheid in een huismerk gereduceerd kan worden door consumptie van een ander
huismerk, hetgeen leidt tot een toename van het nut. Deze bevindingen zijn interessant voor
winkeliers. Wanneer winkeliers huismerken gebruiken om zich de differentiëren van andere
ketens, dan worden zij geadviseerd een zeer hoge kwaliteit van huismerken te ontwikkelen ten
opzichte van de concurrentie. Echter, hierdoor verliezen zij de voordelen van de leereffecten
tussen verschillende huismerken hetgeen helpt marktaandeel te winnen van A-merken.
Hoofdstuk 4 bestudeert leereffecten tussen een A-merk en een huismerk die het A-merk
probeert te imiteren door de verpakking na te maken (oftewel een “copycat” huiswerk). Dit
hoofdstuk bestudeert of het succes van een “copycat” huismerk toe te schrijven is aan de
imitatie strategie. Hoewel copycats veelvuldig voorkomen, zijn de effecten over de tijd op het
geïmiteerde merk onduidelijk aangezien er weinig empirisch bewijs beschikbaar is over de
gevolgen op merkkeuze. Bovendien is de generaliseerbaarheid van onderzoek naar copycats
beperkt omdat de meeste onderzoeken zich richten op bijna letterlijke kopieën waarbij ook de
merknaam geïmiteerd wordt. Het effect van zulke imiteerstrategieën wordt voornamelijk
bepaald door verwarring over het merk bij consumenten (Warlop and Alba 2004). Echter,
172
‘copycat’ huismerken zijn zelden letterlijke kopieën: zij hebben andere merkennamen, en
hoewel de verpakkingen vergelijkbaar zijn, is het verschil met het geïmiteerde merk duidelijk
zichtbaar. Zo’n imitatie strategie leidt zelden tot verwarring bij consumenten (Warlop and
Alba 2004). Tegelijkertijd kan het wel leerprocessen tussen het A-merk en het ‘copycat’
huismerk veroorzaken. Aan de ene kant kunnen positieve consumptie ervaringen met het
geïmiteerde A-merk leiden tot hogere kwaliteitspercepties van het ‘copycat’ huismerk,
hetgeen leidt tot een verhoging van het marktaandeel van het ‘copycat’ huismerk ten opzichte
van het A-merk. Aan de andere kant kan de copycat strategie ook negatieve effecten hebben
voor de winkelier. Het verschil in kwaliteit tussen het A-merk en het ‘copycat’ huismerk kan
leiden tot contrast effecten, hetgeen de evaluatie van het A-merk verhoogt – het zogenoemde
“beloningseffect” (Zaichkowsky and Simpson 1996). Of, consumenten zien de copycat
strategie van het huismerk als een manier van de winkelier om hen te misleiden, hetgeen kan
leiden tot een “weerstand effect”
Om de potentie van deze copycat strategieën te achterhalen, specificeren wij een
Bayesiaans leermodel dat leerprocessen van een merk en tussen een A-merk en een ‘copycat’
merk beschrijft. Dit model kwantificeert mogelijke weerstand- en beloningseffecten. We
kalibreren heb model op data van twee productcategorieën, wasmiddelen en afwasmiddelen in
twee verschillende winkelketens. Onze resultaten laten zien of een ‘copycat’ huismerk een
‘vriend’ van het geïmiteerde A-merk is (oftewel, het beloningseffect of weerstand effect treedt
op), of een ‘vijand’ (wanneer het ‘copycat’ merk marktaandeel steelt van het A-merk). Onze
resultaten laten zien dat het effect van de copycat strategie op merkkeuze gedomineerd wordt
door leereffecten van het originele A-merk naar het ‘copycat’ huismerk. Dit resulteert in een
reductie van de onzekerheid over de kwaliteitsperceptie van het ‘copycat’ huismerk en
verhoogt de kans om gekozen te worden door risicomijdende consumenten. Deze toename in
marktaandeel voor het ‘copycat’ huismerk gaat met name ten koste van het originele A-merk,
en houdt zelfs stand nadat consumenten zich realiseren wat de werkelijke kwaliteit van het
‘copycat’ huismerk is – hetgeen impliceert dat ‘copycat’ huismerken met name een ‘vijand’
van originele A-merken zijn.
Hoofdstukken twee, drie en vier presenteren gedetailleerde onderbouwingen van
bovengenoemde resultaten. Ieder hoofdstuk presenteert een conceptueel model van het te

173
bestuderen probleem, en beschrijft de data en het model. Ieder hoofdstuk bevat ook een
paragraaf met praktische implicaties. In hoofdstuk vijf, het concluderende hoofdstuk van dit
proefschrift, integreren we de verschillende resultaten en plaatsen we deze in een breder
perspectief. We identificeren ook de beperkingen van het onderzoek die leiden tot nieuwe
onderzoeksideeën die interessant zijn voor toekomstig onderzoek.


175
Streszczenie (Summary in Polish)
Wraz z rozwojem ekonomi informacji (Nelson 1970; Stigler 1961) uwaga badaczy z
dziedziny ekonomii (np. Johnson i Myatt 2006; Miller 1984) i biznesu (np. Eckstein i Wolpin
1989; Narayanan i Manchanda 2009) skupiła się na roli jaką odgrywają niepewność i uczenie
się w decyzjach podejmowanych przez podmioty gospodarcze, np. konsumentów lub firmy.
Badania skupiły się głownie na uczeniu się przez podejmujących decyzje o właściwościach
przedmiotu decyzji, na przykład cechach wybieranych przez konsumenta produktów. Mniej
uwagi poświecono innym formom uczenia się, takim jak na przykład zdobywanie
umiejętności. Bogaty i wciąż rosnący zbiór badan wskazuje, że istotne przy tłumaczeniu i
przewidywaniu decyzji ekonomicznych jest wzięcie pod uwagę, że nie są one podejmowane
na podstawie faktycznego stanu rzeczy ale raczej na podstawie wyobrażeń podejmujących
decyzje o stanie rzeczywistości. Te wyobrażenia o wybieranych przedmiotach może
charakteryzować niepewność, co w przypadku unikających ryzyka podmiotów prowadzi do
spadku oczekiwanej użyteczności tych przedmiotów. Niepewność zmniejsza się w miarę
uczenia i rośnie w miarę zapominania. Te procesy, i ich wpływ na wyobrażenia i wybory
konsumentów są głównym tematem niniejszej pracy doktorskiej.
Popularnym w literaturze ekonomicznej podejściem do modelowania procesu uczenia
jest model bayesowski (Erdem i Keane 1996; Miller 1984; Roberts i Urban 1988). Model ten
jest matematyczną reprezentacją przedstawiającą uczenie się jako proces integrowania nowych
informacji z wcześniej posiadana wiedzą. Model bayesowski jest często używany jako część
większego modelu wyboru spośród alternatyw lub modelu incydencji. W badaniach
marketingowych, model beyesowski został zastosowany w wielu różnych kontekstach,
dotyczących różnych podmiotów gospodarczych, obiektów uczenia, charakterystyk
opisujących te obiekty które są przedmiotem uczenia, i źródeł informacji. Najszerzej badane
jest uczenie się konsumentów o jakości marek w którym źródłem informacji jest bezpośrednia
konsumpcja. Niniejsza praca, wpisuje się w ten nurt badań.

176
Większość badań w tej dziecinie skupia się na uczeniu „wewnątrz marki”, to jest wiedza
o marce jest aktualizowana na podstawie wiadomości pochodzących od tej jednej marki.
Jednak jest możliwe, że konsumenci wierzą, że informacja o jednej marce zawiera informacje
o innych markach. Taka sytuacja może mieć miejsce np. gdy konsumenci grupują marki w
kategorie semantyczne, lub gdy zespół marek ma wspólne cechy które są widoczne dla
konsumentów i postrzegane jako przydatne w przewidywaniu jakości marki (Janakiraman et
al. 2008). W takim kontekście konsumenci mogą używać nowych informacji pochodzących od
jednej marki do aktualizowania wyobrażenia o innej marce. Takie między-markowe uczenie
wydaje się podobne pod względem teoretycznym do uczenia pomiędzy charakterystykami
pojedynczego produktu (Bradlow et al. 2004), pomiędzy różnymi produktami tej samej branży
i marki (Balachander i Ghose 2003), i pomiędzy produktami tej samej marki w rożnych
branżach (Erdem 1998; Erdem i Sun 2002). Podczas gdy powyższe rodzaje uczenia są
udokumentowane, wciąż wiemy niewiele o uczeniu między-markowym. Jednym z niewielu
badan na ten temat jest raport Janakiraman et al. (2008) który studiuje uczenie pomiędzy
oryginalnym lekiem i jego generyczną kopią. Temat uczenia między-markowego zasługuje na
uwagę ze względu na jego znaczący wpływ na sukces marek.
Głównym zamierzeniem tej pracy jest poszerzyć nasze zrozumienie uczenia między-
markowego. Proces ten jest studiowany w kontekście marek sprzedawców w branży dóbr
codziennego użytku. Marki sprzedawców, które często odróżnia się w literaturze od marek
producentów, stopniowo, na przestrzeni ostatnich kilkudziesięciu lat, zyskują na popularności
i obecnie stanowią znaczącą cześć wartości sprzedanych dóbr codziennego użytku, na
przykład 16% w USA (AC Nielsen 2005), 39.6% w Wielkiej Brytanii i 46% w Szwajcarii
(Planet Retail 2007 p.7). Sprzedaż własnych marek umożliwia sprzedawcom uzyskanie
większej marży (Ailawadi i Harlam 2004), wzmocnić pozycję negocjacyjną względem
producentów (Ailawadi 2001), i być bardziej konkurencyjnym względem sprzedawców
dyskontowych (Boston Consulting Group 2004). Wzrost marek sprzedawców stanowi
wyzwanie dla marek producentów (Steenkamp i Dekimpe 1997).
Badania wskazują, że kluczowym czynnikiem akceptacji marek sprzedawców przez
konsumentów jest ich postrzegana jakość (Ailawadi et al. 2003a; Dhar i Hoch 1997; Hoch i
Banerji 1993; Steenkamp i Dekimpe 1997). Ważną role odgrywa nie tylko poziom jakości ale

177
również stopień niepewności w opiniach konsumentów (Batra i Sinha 2000; Erdem et al.
2004). Podczas gdy rola postrzeganej jakości jest dobrze udokumentowana, mniej badań
ukazuje jak konsumenci budują swoje wyobrażenia. Głównie jeżeli chodzi o procesy uczenie
się które są bardziej prominentne w przypadku marek sprzedawców niż marek producentów.
Niniejsza praca bada dwa różne rodzaje uczenia między-markowego mającego miejsce
w przypadku marek sprzedawców. Pierwszy to uczenie pomiędzy różnymi markami
należącymi do różnych, konkurujących ze sobą sprzedawców, a które to marki mogą być
postrzegane przez konsumentów jako jedna kategoria semantyczna (Ailawadi 2001;
Richardson 1997). Drugi typ studiowanego uczenia między-markowego, to uczenie pomiędzy
kopiowana marką producenta a kopiującą jej wygląd marką sprzedawcy (Kapferer 1995;
Sayman et al. 2002; Scott-Morton i Zettelmeyer 2004).
Niniejsza praca zawiera pięć rozdziałów. Rozdział pierwszy to wstęp. Rozdział drugi
mierzy prędkość i determinanty uczenia się konsumentów w szerokiej gamie branż produktów
codziennego użytku. Rozdział ten stanowi punkt wyjścia dla kolejnych rozdziałów jako, że
model w nim użyty jest standardowym modelem uczenia się bayesowskiego „wewnątrz
marki” który jest następnie rozwinięty w kolejnych rozdziałach. Model uczenia jest
zagnieżdżony w modelu wyboru alternatywy i skalibrowany na danych o wyborach marek
dokonywanych przez indywidualne gospodarstwa domowe w 20 branżach. Model estymuje
między innymi parametry wyrażające szybkość uczenia, to jest relatywna wagę
przywiązywaną do nowych informacji względem wcześniej posiadanej wiedzy. Miara ta jest
pozyskana dla każdego gospodarstwa domowego i w każdej branży z osobna. Wyniki
wskazują, że dla większości gospodarstw domowych uczenie się jest istotne statystycznie i ma
ekonomicznie istotny wpływ na wybory konsumentów, występuje duża różnorodność w
tempie uczenia pomiędzy gospodarstwami i branżami. Co ciekawe, korelacja w prędkości
uczenia się pomiędzy różnymi branżami dla poszczególnych gospodarstw jest bardzo mała co
sugeruje, że uczenie się o jakości marek nie jest stabilną cechą konsumentów. Dalsza analiza
wyników wskazuje, że uczenie jest wolniejsze w kontekstach gdzie dla konsumentów ważna
jest różnorodność marek, a szybsza droższych branżach i w tych w których dane gospodarstwo
dokonuje wielu zakupów, oraz w przypadku gdy konsumenci bardziej unikają ryzyka.

178
Najistotniejsze rozdziały tej pracy to rozdział trzeci i czwarty. Prezentują one nowe w
literaturze hipotezy, rozwijają metodologie konieczna aby je przetestować, a także dokonują
takiego testu. Wspólnym elementem tych rozdziałów jest to, że studiują one między-markowe
uczenie na podstawie konsumpcji.
Rozdział trzeci bada czy proces między-markowego uczenia zachodzi dla marek
różnych sprzedawców. Celem badania jest powiązanie dwóch sposobów postrzegania marek
sprzedawców jaki jest obecny w literaturze akademickiej i wśród menadżerów. Pierwszy
sposób uczenia się utrzymuje, że marki są narzędziem które sprzedawcy mogą wykorzystać do
odróżnienia się od konkurencyjnych sprzedawców. Drugi sposób uczenia widzi marki
sprzedawców jako „nie-marki”, generyczne produkty nie rozróżniane przez konsumentów.
Rozdział prezentuje hipotezę, że konsumenci generalizują wiedze z jednej marki sprzedawców
do innych marek sprzedawców, że ten proces jest silniejszy w przypadku marek
postrzeganych jako podobne. Aby przetestować te hipotezy tradycyjny model bayesowski jest
rozszerzony o uczenie między-markowe którego szybkość, zależy od postrzeganego
podobieństwa pomiędzy markami. Model jest estymowany przy użyciu danych o zakupach
gospodarstw domowych w branży płynnych detergentów do mycia naczyń. Dane, oprócz
wyborów marek dokonanych przez konsumentów zawierają dane o czynnościach
marketingowych marek, takich jak cena i promocje.
Rezultaty potwierdzają hipotezy i wskazują na wysoki poziom uczenia między-
markowego. Prędkość uczenia zależy od postrzeganego podobieństwa ale różnica w prędkości
uczenia pomiędzy najbardziej podobnymi i najmniej podobnymi markami w naszych danych
jest dla większości gospodarstw domowych znikoma.
Przeprowadzone symulacje obrazują znaczenie uzyskanych wyników. Pokazujemy, że
między-markowe uczenie powoduje, że marki sprzedawców w niewielkim stopniu
przyczyniają się do zróżnicowania konkurujących sprzedawców w opinii konsumentów .
Jednocześnie symulacje pokazują, że dzięki między-markowemu uczeniu marki sprzedawców
moja zwiększyć swój udział w rynku względem marek producentów. Dzieje się tak dlatego, że
uczenie między-markowe redukuje niepewność co do jakości marek sklepowych i przez to
zwiększa ich oczekiwaną użyteczność. Te wyniki sugerują, że sprzedawcy chcący użyć

179
swoich marek do odróżnienia się od konkurencyjnych sprzedawców powinni upozycjonować
swoją markę jako produkt zdecydowanie wyższej jakości niż inni sprzedawcy, tak aby różnica
w jakości była postrzegana jako większa niż ma to miejsce obecnie. Jednak taka strategia ma
wadę jako, że nie czerpie ona korzyści płynących z uczenia między-markowego w postaci
zmniejszonej niepewności konsumentów .
Rozdział czwarty przenosi uwagę z uczenia między markami sprzedawców, na uczenie
pomiędzy imitowaną marką producenta a imitującą wygląd jej opakowania marką
sprzedawcy. Mimo, że imitowanie wyglądu opakowania lub produktu jest powszechnym
zjawiskiem, niewiele badan rozpatruje jaki jest efekt takiej praktyki na wybory konsumentów ,
szczególnie w rzeczywistym kontekście, nie w laboratorium. Ponadto nie jest jasne czy
dotychczasowe wyniki dotyczące kopiowania wyglądu aplikują się do marek sprzedawców
gdyż większość uwagi była poświecona imitacjom, to jest bardzo podobnym kopia
oryginalnych produktów, często imitującym oprócz wyglądu również nazwę marki. Wpływ na
konsumentów w takich przypadkach jest spowodowany tym, ze mylą oni markę kopiowaną i
kopiującą (Warlop i Alba 2004). Inaczej jest w przypadku marek sprzedawców które rzadko
są dosłownymi kopiami oryginalnych marek. Przeważnie maja one nazwę która nie nawiązuje
do oryginału, a podobieństwo opakowania, choć jest bezdyskusyjne również jest łatwo
dostrzegalne. Taki sposób imitowania rzadko prowadzi do pomylenia marek (Warlop i Alba
2004). Możliwe jest natomiast, że prowadzi on do między-markowego uczenia. Gdyby tak
było to z jednej strony pozytywne doświadczenia z oryginalną marką mogą przynieść korzyści
kopiującej marce sprzedawcy i spowodować przejecie przez markę kopiującą udziału w rynku
marki oryginalnej. Jednak z drugiej strony strategia kopiowania może okazać się obosiecznym
mieczem dla sprzedawcy. Jeżeli różnica w jakości pomiędzy oryginałem i kopia doprowadzi
do efektu kontrastu ocena oryginalnej marki może wzrosnąć – tak zwany „efekt nagrody”
(Zaichkowsky i Simpson 1996). Jest także możliwe, że konsumenci zinterpretują
podobieństwo opakowania jako próbę zwiedzenia ich, prowadziłoby to do „efektu buntu”
przeciw kopiującej marce (Warlop i Alba 2004).
Aby ocenić efekt kopiowania niniejsza praca rozszerza przedstawiony w rozdziale
trzecim model bayesowskiego uczenia w taki sposób, że oprócz uczenia wewnątrz marki,
pomiędzy markami, oryginalną i kopiującą, model uwzględnia efekty nagrody i buntu. Model

180
jest estymowany używając dwóch zestawów danych, każdy dotyczy innej branży, detergentów
do odzieży i naczyń, i innych sprzedawców. Wyniki wskazują czy kopie oryginalnych marek
są „przyjaciółmi” tych ostatnich (wywołując pozytywne dla nich efekty nagrody lub buntu)
czy „wrogami” (przejmując ich reputacje i udział w rynku).
Uzyskane rezultaty sugerują, że kopiowanie wyglądu przez marki sprzedawców
prowadzi do jednostronnego uczenia się konsumentów – jedynie w kierunku od oryginału do
kopii, to jest informacje o oryginalnej marce wpływają na opinie o jej kopii. Taki proces
prowadzi do redukcji niepewności dotyczącej jakości marki kopiującej i w konsekwencji do
zwiększenia jej udziału w rynku, głownie kosztem oryginalnej marki. Efekt ten utrzymuje się
nawet wtedy gdy konsumenci orientują się, jaka jest rzeczywista jakość marki kopiującej.
Oznacza to, że kopiujące marki sprzedawców są „wrogami” ich oryginalnych odpowiedników.
Rozdziały drugi, trzeci i czwarty opisują szczegółowo powyższe wyniki. Ponadto każdy
z tych rozdziałów przedstawia teoretyczny model studiowanego zagadnienia, prezentuje użyte
dane i opisuje model empiryczny oraz wnioski dla menedżerów. Rozdział piaty, zamykający
niniejszą pracę, dokonuje przeglądu wszystkich wyników i dyskutuje w jaki sposób poszerzają
one naszą wiedzę. Rozdział omawia również ograniczenia niemniejszej pracy oraz problemy i
pytania które powinny być tematem badan w przyszłości.