Embed Size (px)
Citation preview
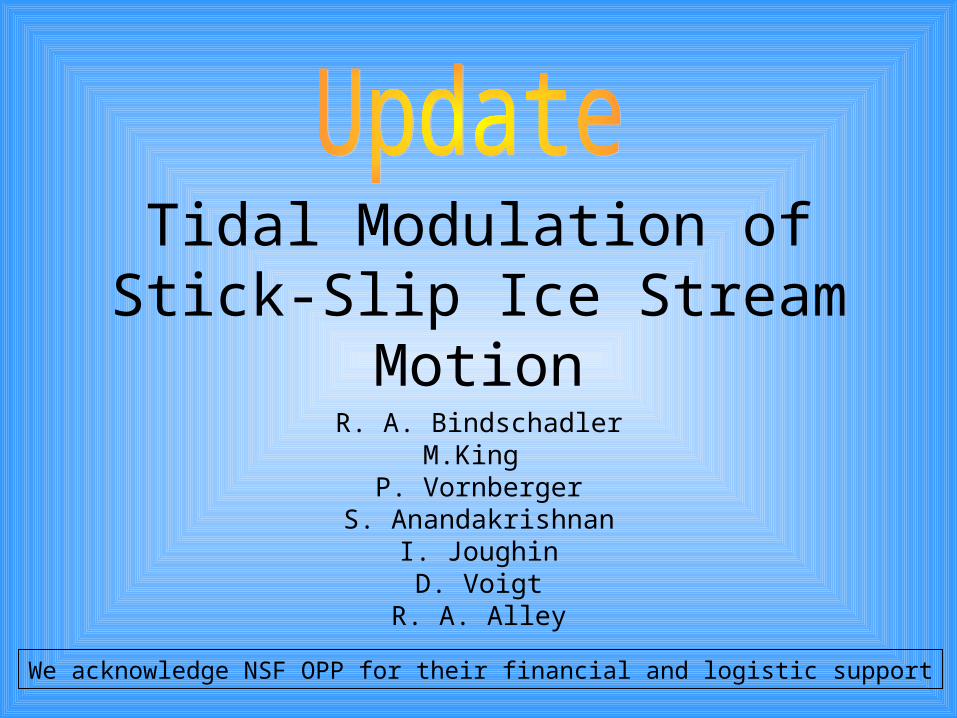
Tidal Modulation of Stick-Slip Ice Stream Motion
R. A. BindschadlerM.King
P. VornbergerS. Anandakrishnan
I. JoughinD. Voigt
R. A. Alley
We acknowledge NSF OPP for their financial and logistic support

2003-2004 Field Season
• 21 GPS stations – 5 reference (for
differential sol’n)– 4 floating (for tides)– 15 sec. sampling
• 7 seismic networks (triggered)
+ 1 tiltmeter+ 1 winterover station
70+ DAYS OF DATA

Whillans Ice Stream Stick-slip
Only Ross ice stream that exhibits stick slip
5 min positions
B010
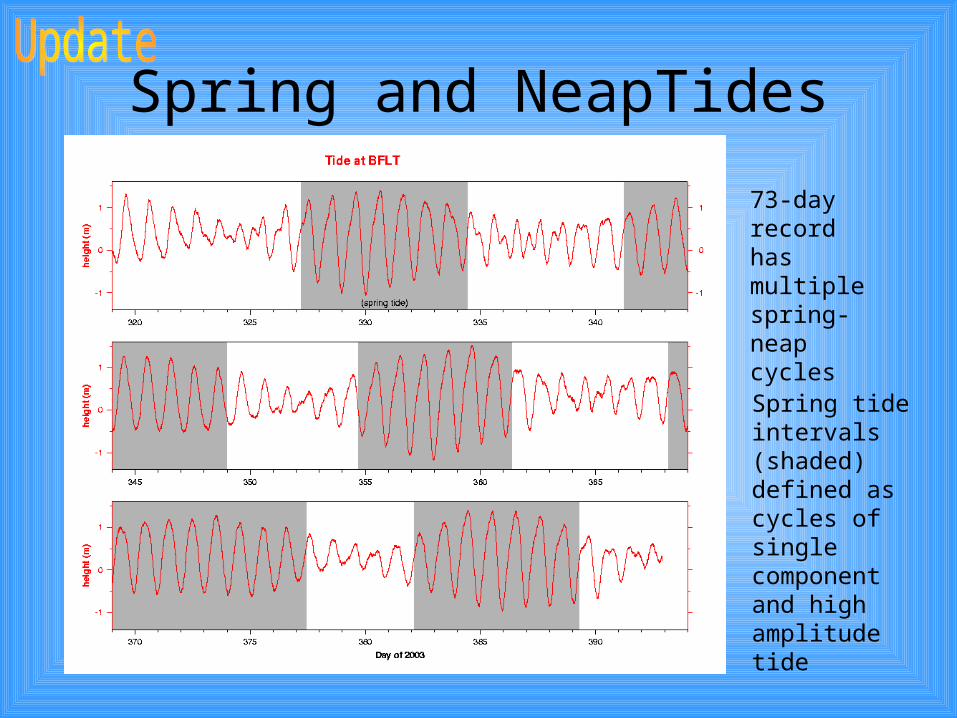
Spring and NeapTides
Spring tide intervals (shaded) defined as cycles of single component and high amplitude tide
73-day record has multiple spring-neap cycles
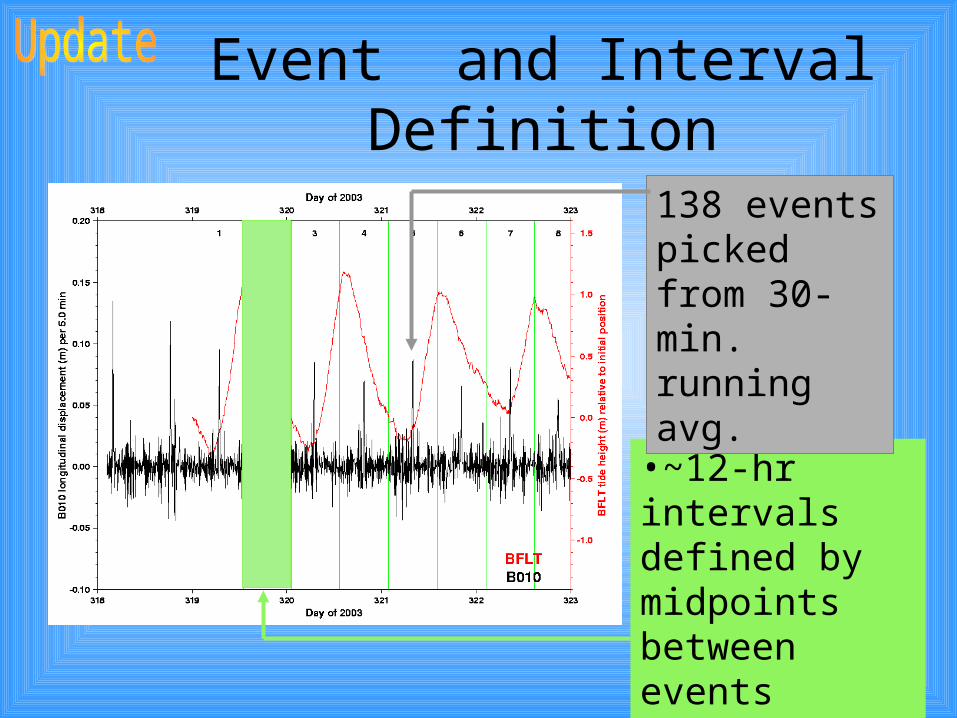
Event and Interval Definition
•~12-hr intervals defined by midpoints between events
138 events picked from 30-min. running avg.

Slip vs. Total Motion
~90% of motion occurs
during slip events
80
82
84
86
88
90
92
94
96
Sli
p M
oti
on
(%
)
Neap
Spring
High position errors
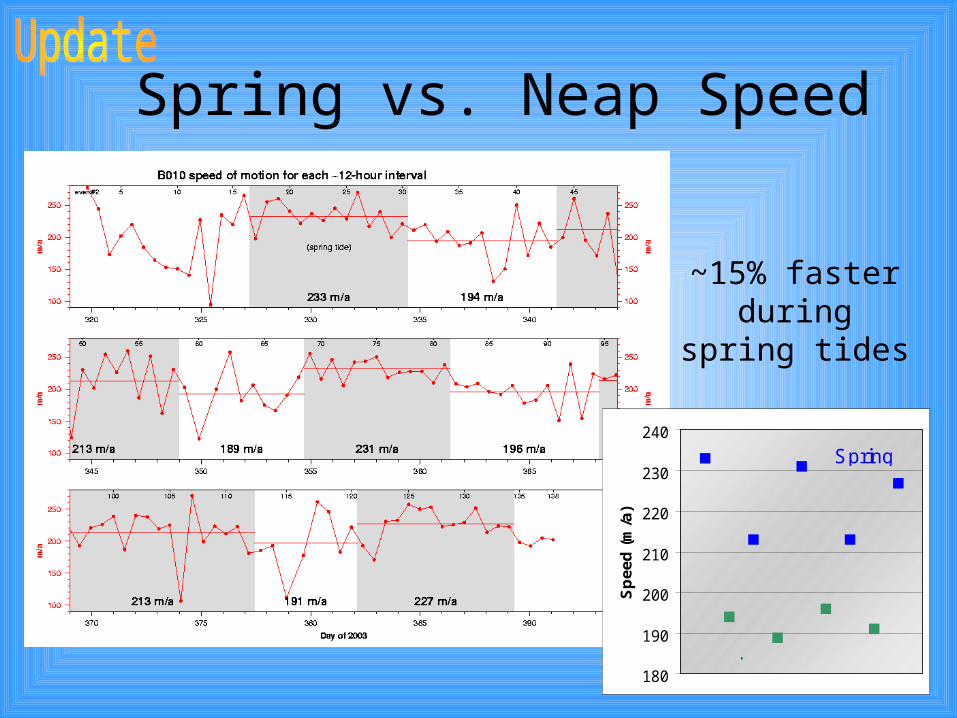
Spring vs. Neap Speed
~15% faster during spring
tides
180
190
200
210
220
230
240
Sp
eed
(m
/a)
Spring
Neap
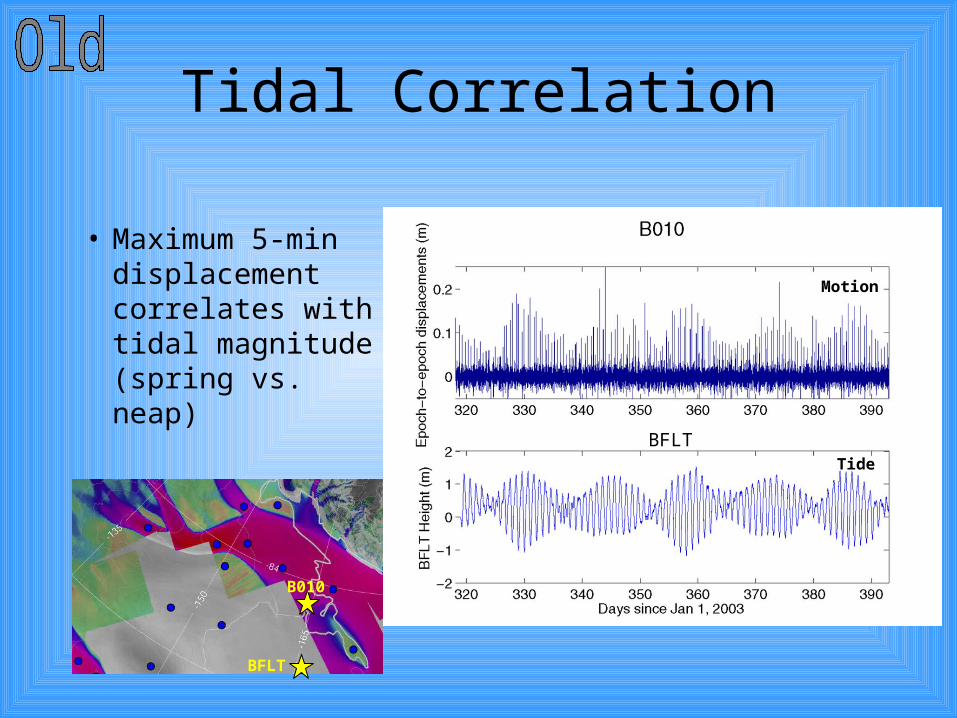
Tidal Correlation
• Maximum 5-min displacement correlates with tidal magnitude (spring vs. neap)
B010
BFLT
BFLT
Motion
Tide

Slip Characteristics
Time
Position
12 hourtotal
30 minuteslip
slope=max. speed
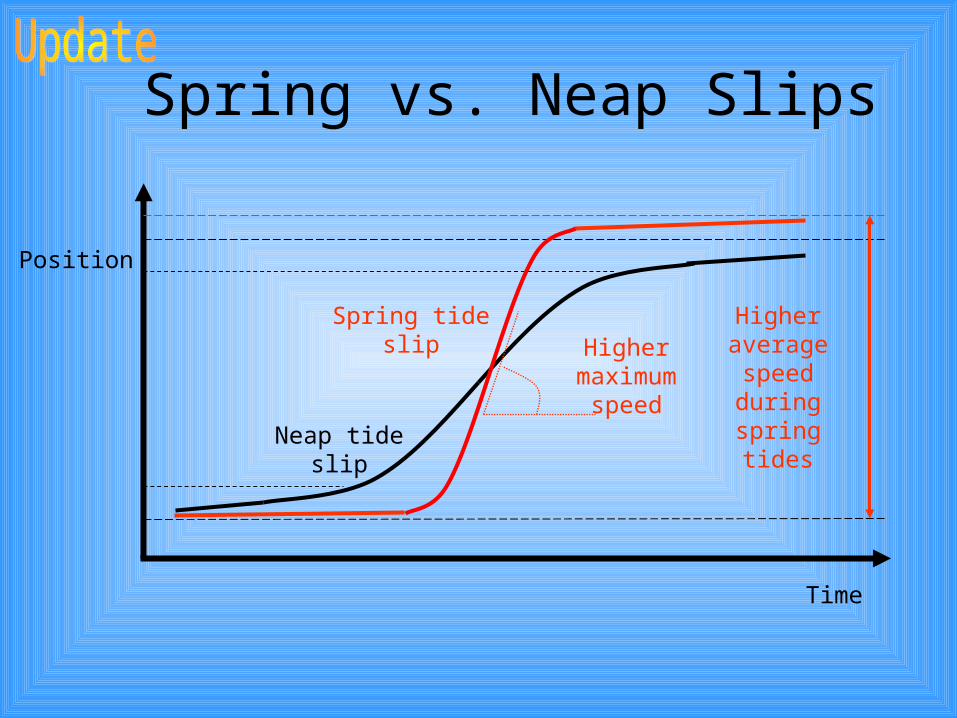
Spring vs. Neap Slips
Time
Position
Higher maximum
speed
Higher average speed during spring tides
Spring tide slip
Neap tide slip

Actual example
Springslip
Neapslip
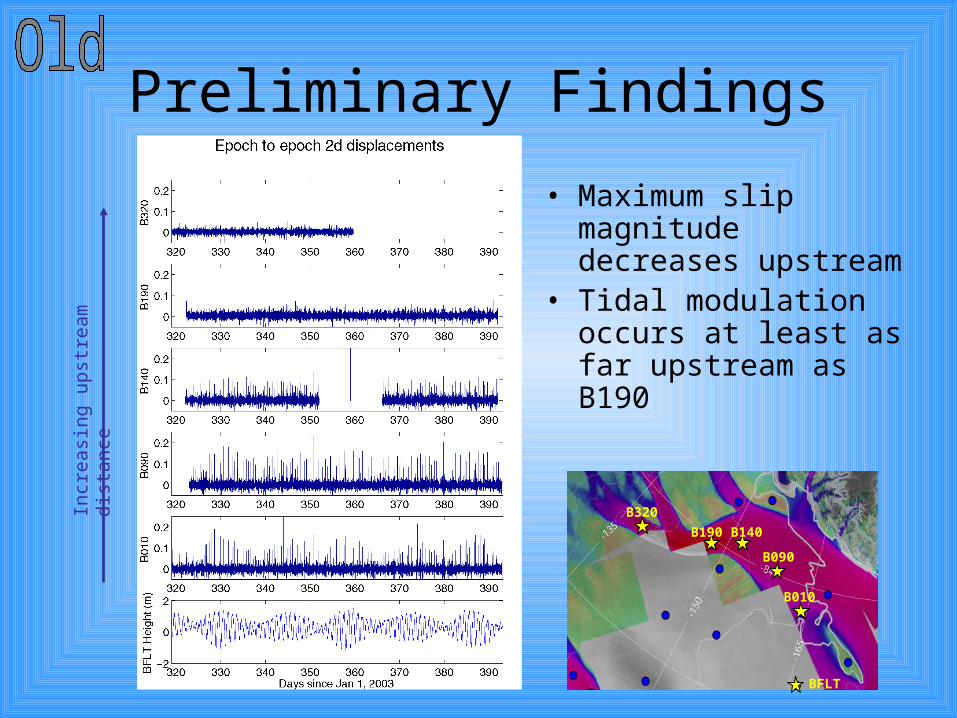
Preliminary FindingsIn
crea
sing
ups
trea
m d
ista
nce
BFLT
B010
B090
B140B190
B320
• Maximum slip magnitude decreases upstream
• Tidal modulation occurs at least as far upstream as B190

How does B090 compare with B010?
BFLT
B010
B090
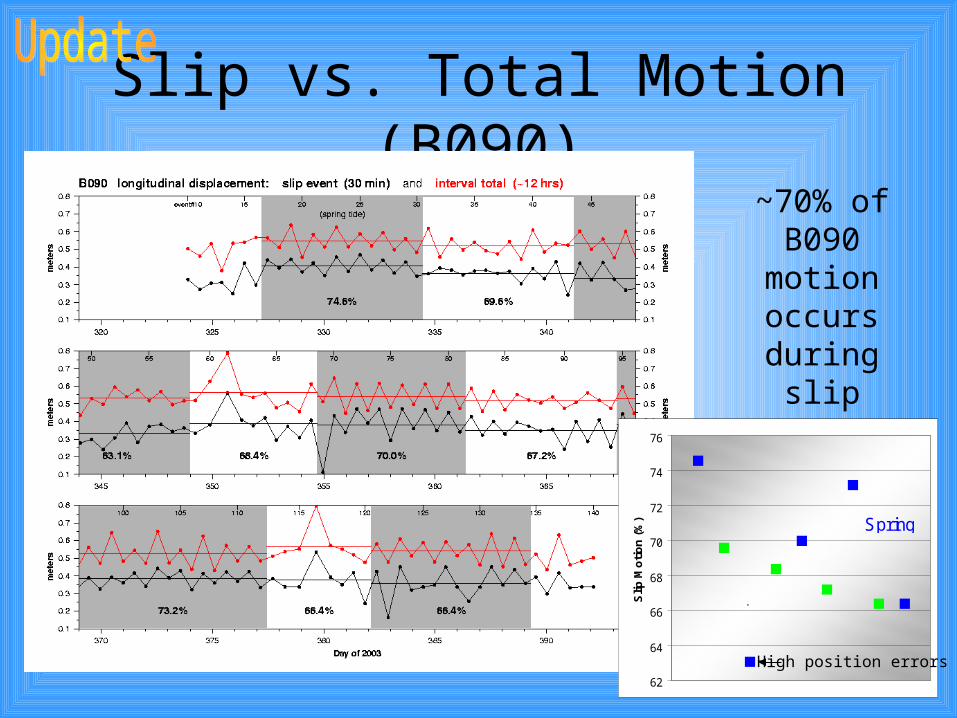
Slip vs. Total Motion (B090)~70% of B090 motion occurs
during slip events
(90% for B010)
62
64
66
68
70
72
74
76
Slip
Mo
tio
n (
%) Spring
Neap
High position errors
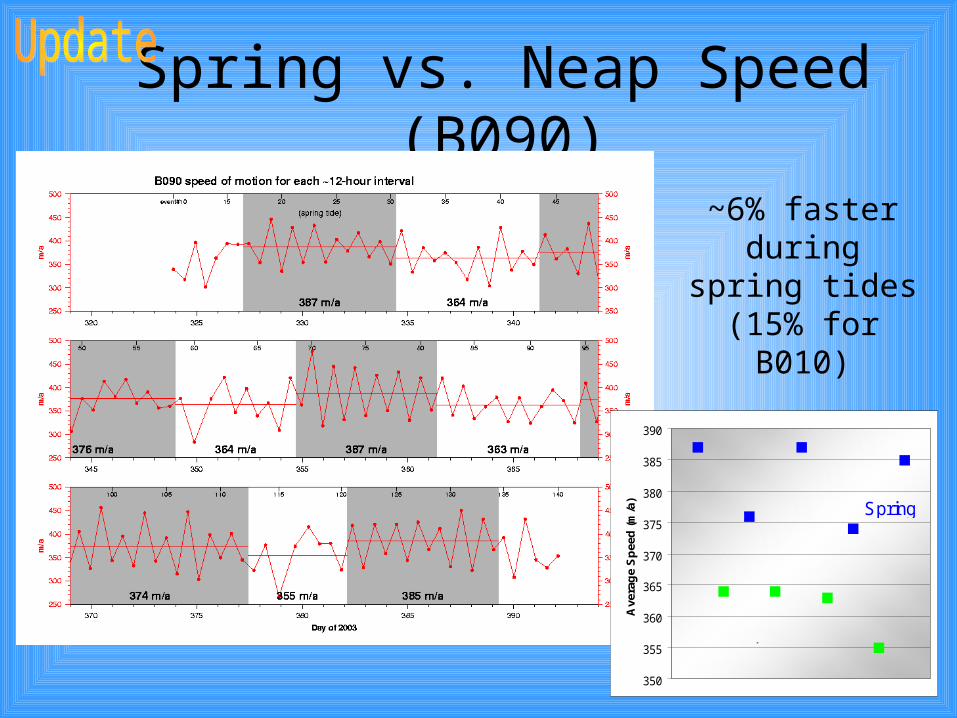
Spring vs. Neap Speed (B090)
~6% faster during spring
tides(15% for B010)
350
355
360
365
370
375
380
385
390
Ave
rag
e S
pee
d (
m/a
) Spring
Neap

Event propagation
0
2
4
6
8
10
12
14
Ave
rag
e E
ven
t D
elay
(m
in)
Spring
Neap
Longer delays during neap
tide
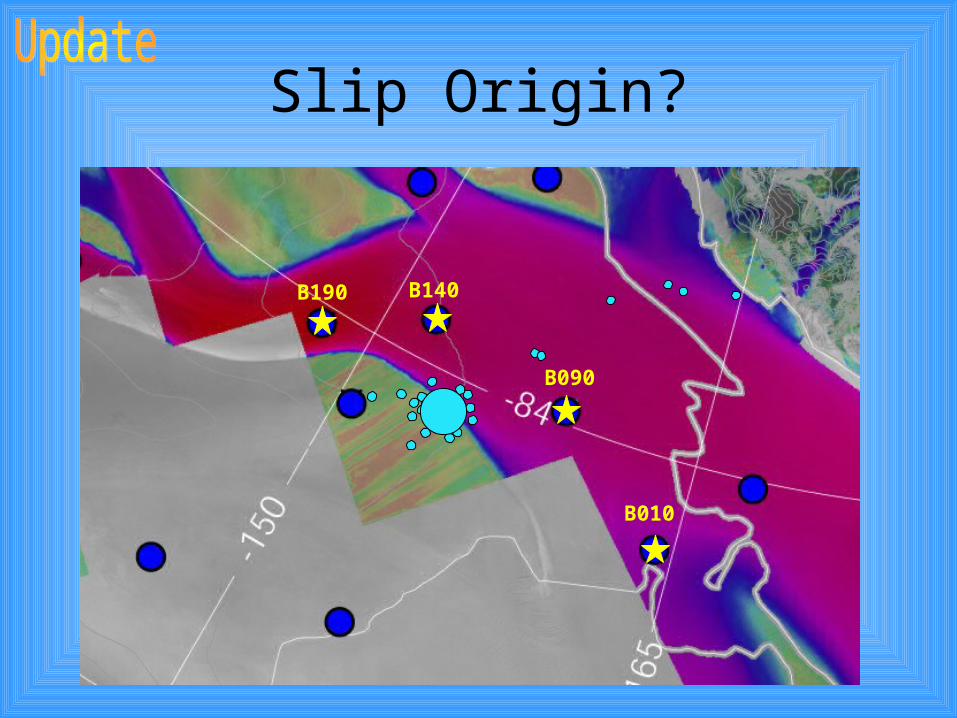
Slip Origin?
B090
B140B190
B010
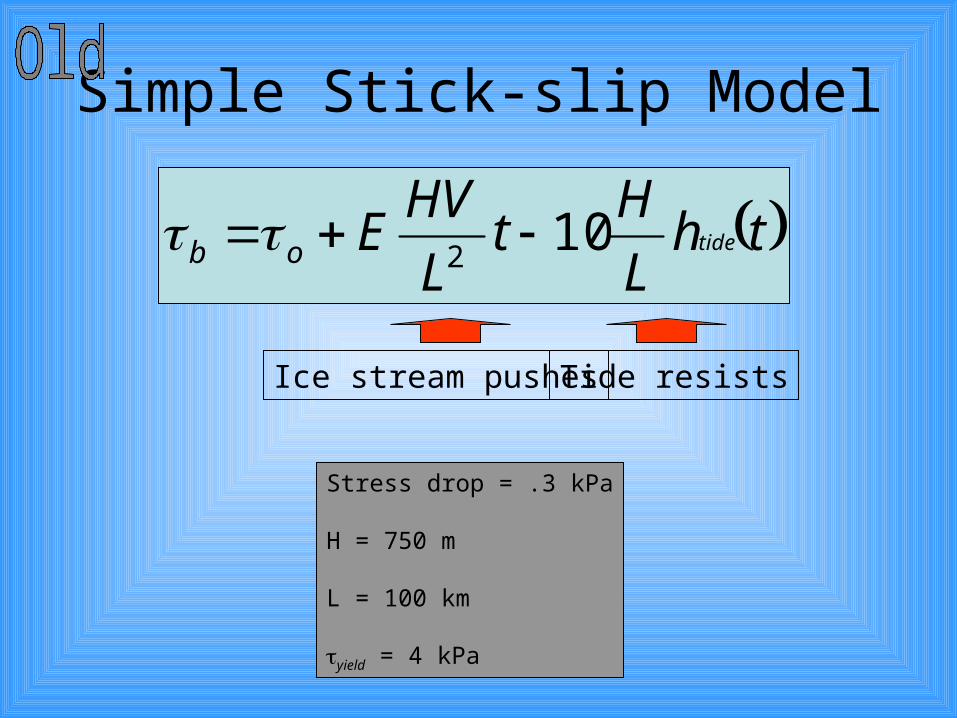
Simple Stick-slip Model
thL
Ht
L
HVE tideob 10
2
Stress drop = .3 kPa
H = 750 m
L = 100 km
yield = 4 kPa
Ice stream pushes Tide resists
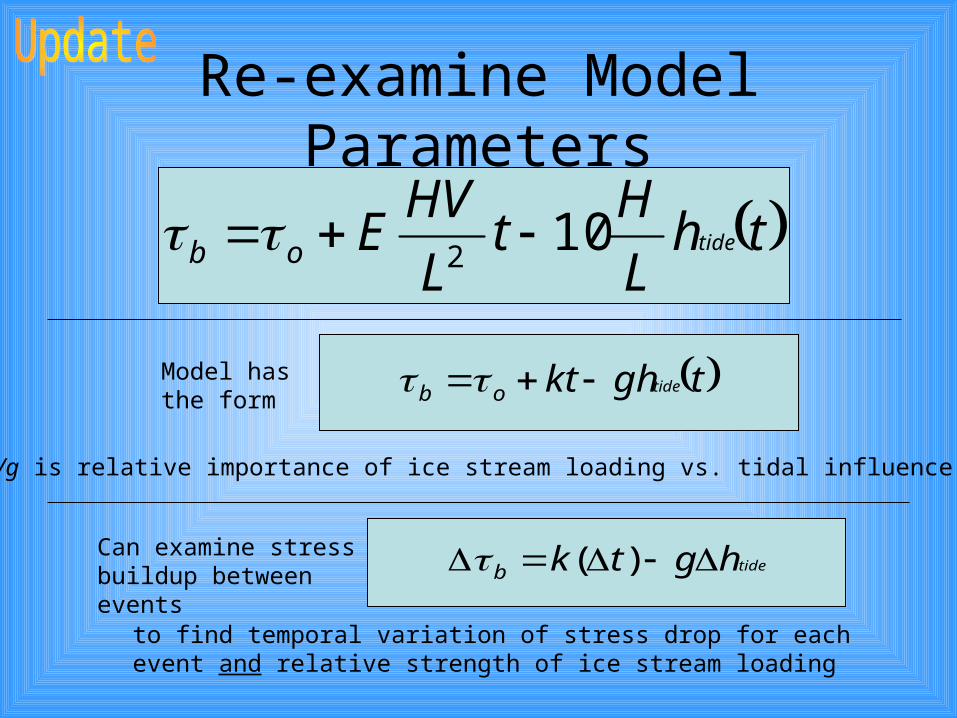
Re-examine Model Parameters
thL
Ht
L
HVE tideob 10
2
tghkt tideob
k/g is relative importance of ice stream loading vs. tidal influence
Model has the form
tidehgtkb )(Can examine stress buildup between events
to find temporal variation of stress drop for each event and relative strength of ice stream loading

Previously:Stress drop = 0.3
F = .51
Revised:Stress drop = 0.25
F = .49
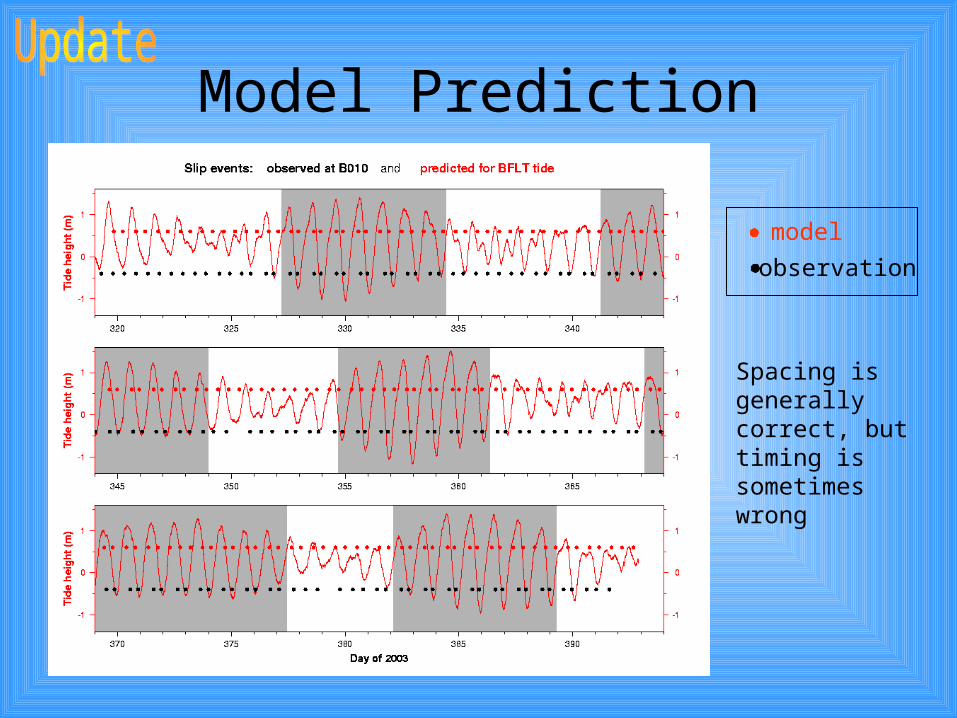
Model Prediction
model
observation
Spacing is generally correct, but timing is sometimes wrong
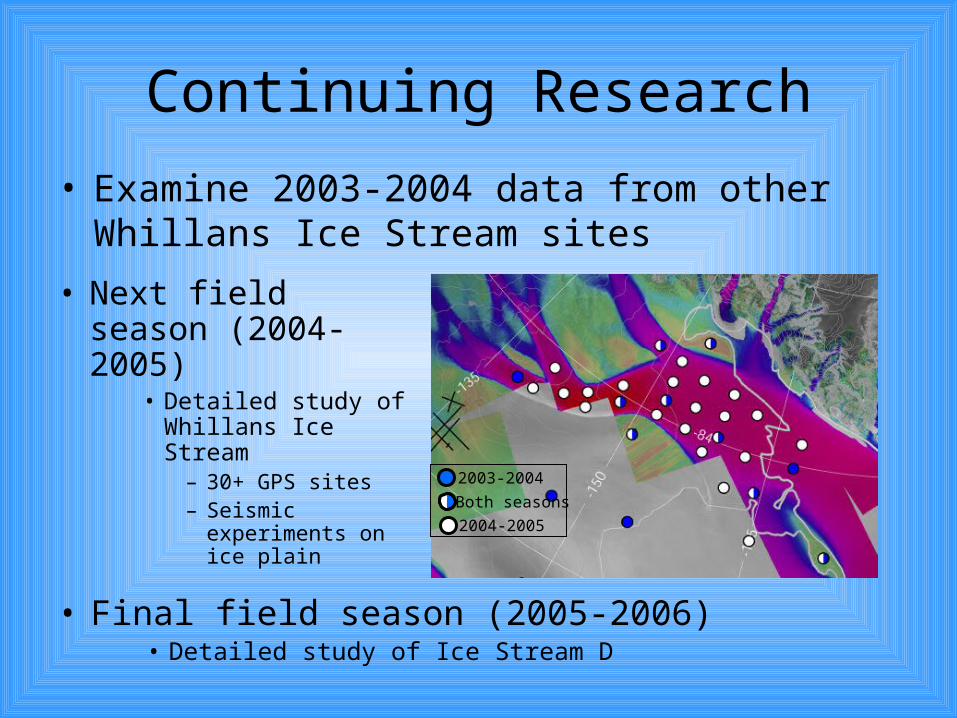
Continuing Research
• Next field season (2004-2005)
• Detailed study of Whillans Ice Stream
– 30+ GPS sites– Seismic
experiments on ice plain
• Final field season (2005-2006)• Detailed study of Ice Stream D
2003-2004
Both seasons
2004-2005
• Examine 2003-2004 data from other Whillans Ice Stream sites

Conclusions• Whillans Ice Stream is the only Ross ice stream
that exhibits stick-slip motion• Slip origins appear to have a persistent location
at or near north margin • Slip accounts for majority of motion
– ~90% at B010; ~70% at B090
• Spring-tide speed faster than neap-tide speed– ~15% faster at B010; ~6% faster at B090
• Spring-tide slips more impulsive than neap-tide slips

Thank you
Outline
• Only Whillans Ice Stream
• Further characteristics of stick-slip motion
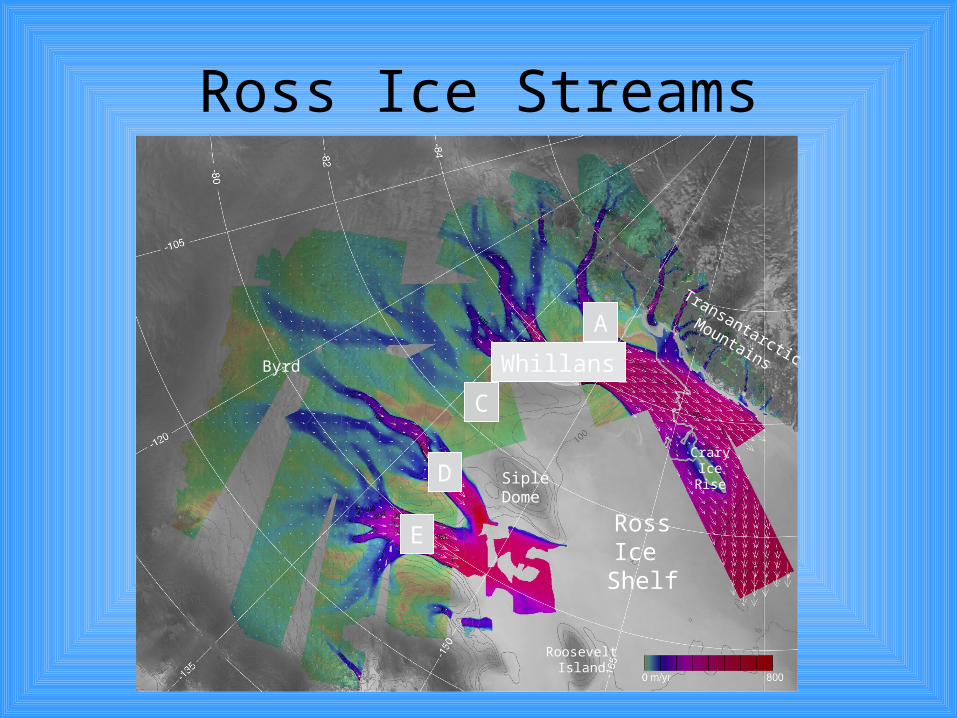
Ross Ice Streams
A
Whillans
C
D
E
SipleDome
Transantarctic
Mountains
RooseveltIsland
CraryIce
Rise
Byrd
RossIce
Shelf

Preliminary Findings
Slip Initiation
Incr
easi
ng u
pstr
eam
dis
tan
ceF
loat
ing
site
BFLT
B010
B090
B140B190
B320
• Timing– Slips not evident at
B320– Events occur at very
similar times– Events take <15
minutes to propagate to all stations
– Slips last 5-20 minutes
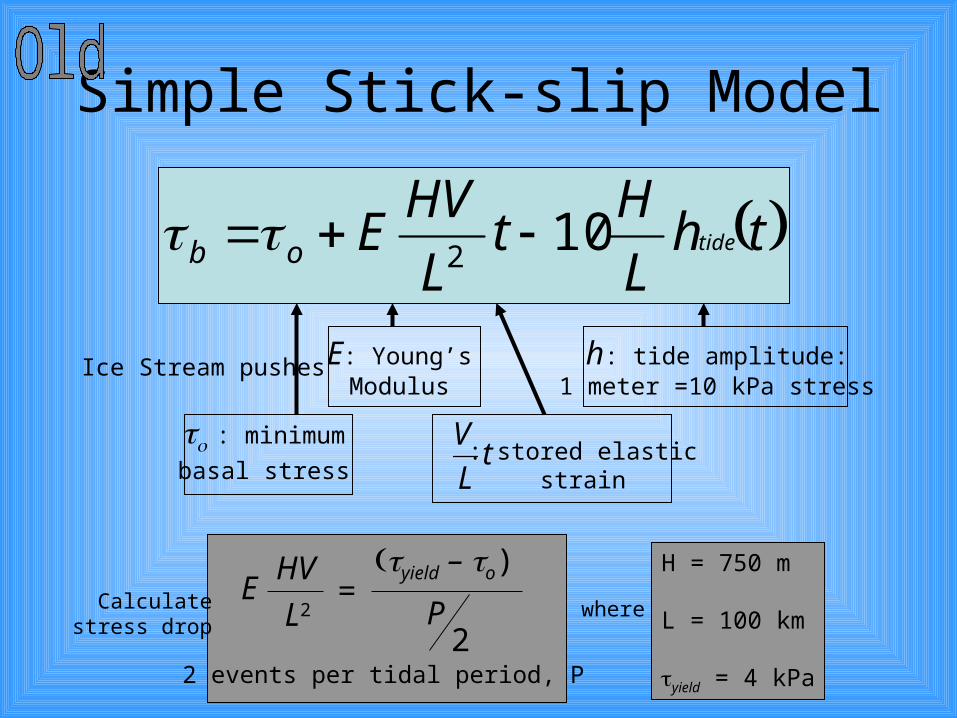
Simple Stick-slip Model
thL
Ht
L
HVE tideob 10
2
tL
V: stored elastic
strain
: minimum
basal stress
h: tide amplitude:1 meter =10 kPa stress
E: Young’sModulus
EHV
L2
yield – o)
P2
=
2 events per tidal period, P
H = 750 m
L = 100 km
yield = 4 kPa
Calculatestress drop
where
Ice Stream pushes