Embed Size (px)
Citation preview
573
Journal of Oceanography, Vol. 59, pp. 573 to 584, 2003
Keywords:⋅ Tidal flows,⋅ East China Seacontinental shelf,
⋅ Kuroshio conver-gence.
* Corresponding author. E-mail: [email protected]
Copyright © The Oceanographic Society of Japan.
Tidal and Subtidal Flow along a Cross-Shelf Transecton the East China Sea
ARNOLDO VALLE-LEVINSON1* and TAKESHI MATSUNO2
1Center for Coastal Physical Oceanography, Department of Ocean, Earth and Atmospheric Sciences, Old Dominion University, Norfolk, VA 23529, U.S.A.2Research Institute for Applied Mechanics, Kyushu University, Kasuga, Fukuoka 816-8580, Japan
(Received 21 June 2002; in revised form 16 November 2002; accepted 16 January 2003)
Fourteen repetitions of a cross-shelf transect in the Kuroshio current edge in the EastChina Sea allowed the description of a) the semidiurnal tidal properties of the transectand b) the subduction of low salinity water at the edge of a Kuroshio meander intru-sion onto the shelf. Water velocity and density profiles were obtained along the transectthroughout a seven-day period of May 2000 in which warm Kuroshio waters movedonto the shelf at typical speeds of 0.1 to 0.2 m/s. Irregular lengths of the transect(maximum of ~75 km) and the non-uniform frequency of sampling permitted eluci-dation only of the semidiurnal contributions to the tidal currents. The semidiurnaltidal currents in the transect exhibited typical amplitudes of 0.5 m/s, decreasing off-shore. Locally, the tidal current amplitudes decreased and for the most part rotatedclockwise with depth. Orientation of the tidal currents was essentially in the NW-SEdirection throughout the transect and the tidal phase progressed onshore. This infor-mation contributes to the scarce observational evidence on the tidal properties of theEast China Sea’s continental shelf. A Kuroshio meander was identified by the gradualincrease of Sea Surface Temperatures on the outer shelf of the East China Sea duringthe period of observation. The meander exhibited strong vertical shears and flowconvergences that allowed subduction of low salinity waters at its edge. Ageostrophictraits in the meander were denoted by the development of a) cross-shelf flows andb) marked discrepancies between geostrophically derived along-shelf flow estimatesand detided along-shelf flows. Similarities between geostrophic estimates and detidedalong-shelf flows during the first two days of observations provide confidence in theeffective separation of tidal and non-tidal signals with the method employed.
Yanagi, 1998). In this paper we seek to contribute to theunderstanding of the high spatial resolution of the tidalcurrents in a region of the East China Sea. This effort isaddressed with shipborne measurements obtained with atowed acoustic Doppler current profiler (ADCP) along across-shelf transect and provides information required forthe validation of numerical exercises in the area.
Tidal currents in the northern part of the continentalshelf of the East China Sea have been described byCandela et al. (1992) on the basis of ship-mounted ADCPdata. In their description, they assumed that tidal vari-ability could be described in terms of polynomial func-tions. However, the pertinence of a polynomial distribu-tion of the tidal current field in the area around the shelfbreak is debatable because of abrupt changes in bottomtopography. Katoh et al. (1996) proposed that the forma-tion area of the Tsushima Current lies within the East
1. IntroductionMore than 70% of the surface area of the East China
Sea is covered by continental shelf (Ning et al., 1998)where tidal currents may produce substantial flow vari-ability. Tidal currents of the East China Sea have beenstudied with isolated observations (Nishida, 1980; Larsenet al., 1985; Fang, 1986) and different types of numericalmodel results (Choi, 1990; Yanagi and Inoue, 1994; Zhaoet al., 1994; Ye and Mei, 1995; Guo and Yanagi, 1998).Even though some of the numerical results include three-dimensional distributions of tidal properties, there are verylimited observations on tidal currents with the spatial reso-lution required to validate the above models (Guo and
574 A. Valle-Levinson and T. Matsuno
China Sea through repeated measurements with a ship-mounted ADCP over the shelf. They performed eighttransect repetitions during a diurnal tidal period to sepa-rate diurnal and semi-diurnal tidal motions from the recordobtained. They offered a schematic view of the origin ofthe Tsushima Current as a north-eastward current on theshelf, which was identified as the Kuroshio. However,they did not present an explicit depiction of the tidalmotions. Their approach might yield an acceptable meancurrent field where tidal motions are basically eliminated.However, their procedure is limited by the length of theobservation transect as it should allow at least eight rep-etitions per day.
Another aspect that highlights the uniqueness of thisarea is that the continental shelf of the East China Sea isaffected by different buoyancy sources: from the west thedischarge from the Changjiang River and the influenceof buoyant waters from the Taiwan Strait (in the warmseason), and from the east the warm waters of theKuroshio that occasionally meander onto the continentalshelf. Meandering of the Kuroshio in the East China Seahas been illustrated by Sugimoto et al. (1988), Ichikawaand Beardsley (1993), James et al. (1999). James et al.(1999) summarized the properties of the Kuroshio mean-der in the East China Sea and analyzed time series of anInverted Echo Sounder (IES). The IES time series shows
stable occurrences of meanders with periods of 11 days.These meanders of the Kuroshio can easily interact withshelf waters. Such an interaction leads to interleavingprocesses between these waters, as the riverine waters aretypically fresh and cool and the Kuroshio waters are warmand salty. Interleaving may lead to mixing processes, hori-zontal intrusions and high-frequency phenomena near theshelf break (e.g. Matsuno et al., 2000; Han et al., 2001).This may be the only area of the world where this inter-action is so evident. The discharge of the Changjiang is10,000 to 50,000 m3/s (Fairbridge, 1980), compared tothe ~3000 m3/s from the rivers that empty to theChesapeake and Delaware Bays or to the South AtlanticBight of the eastern United States, which are other buoy-ant waters that may interact with a western boundary cur-rent, i.e. the Gulf Stream. The Kuroshio current area ofthe East China Sea is then unique in the world in terms ofits salient oceanographic features: a major western bound-ary current interacting with land-derived runoff.
Our second objective, after describing the tidal cur-rents on the shelf, is to document the subtidal variabilityof the flow associated with a meander of the Kuroshioonto the continental shelf of the East China Sea. We docu-ment this meander with detided flow measured with the
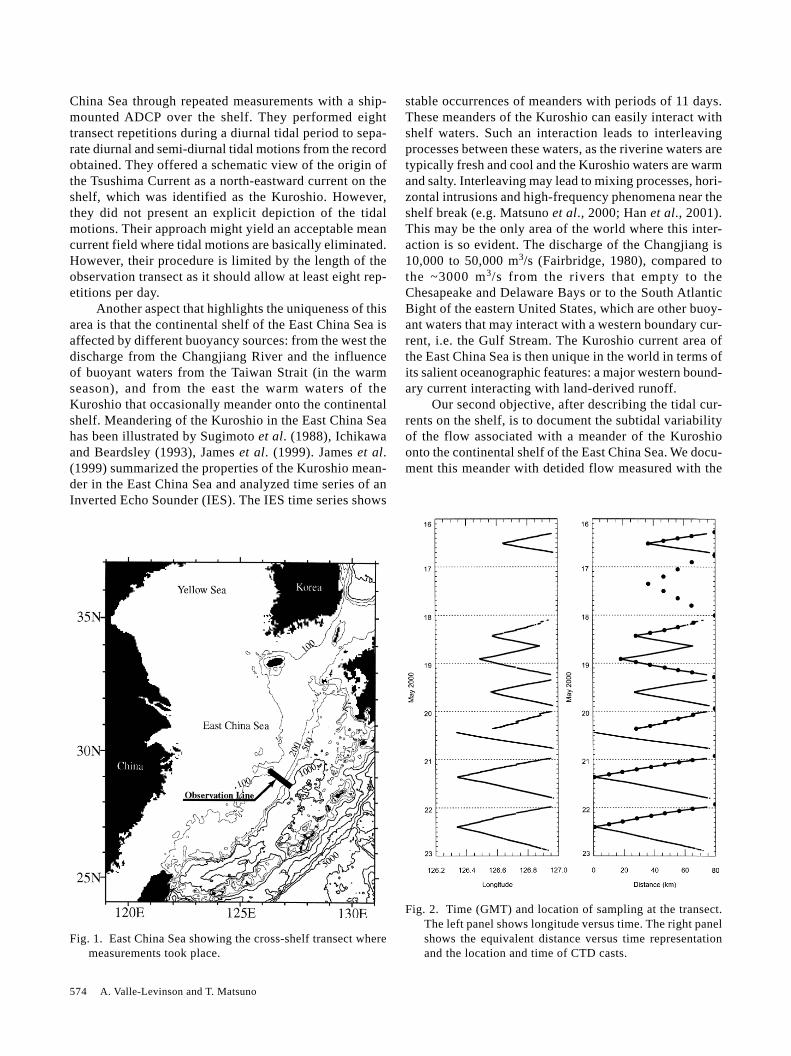
Fig. 1. East China Sea showing the cross-shelf transect wheremeasurements took place.
Fig. 2. Time (GMT) and location of sampling at the transect.The left panel shows longitude versus time. The right panelshows the equivalent distance versus time representationand the location and time of CTD casts.
Tidal and Subtidal Flow along a Cross-Shelf Transect on the East China Sea 575
towed Doppler current profiler. Our pursuit of these twoobjectives is presented in the following sections.
2. Data CollectionFourteen repetitions of a cross-shelf transect in the
Kuroshio current edge in the East China Sea (Fig. 1) con-centrated on characterizing the physical forcing, the bio-optical properties and the primary productivity levels inthe region. This paper focuses on measurements of cur-rent velocity profiles. Transect repetitions were carriedout over a seven-day period, between 16 May and 22 Mayof 2000, but no current velocity measurements were ob-tained on 17 May owing to the adverse sea conditions.The sampling transect had maximum lengths of 75 km(Fig. 2) and was oriented in the northwest-southeast di-rection. It extended offshore from approximately the 100m isobath in the mid-shelf of the East China Sea to roughlythe 250 m isobath on the shelf break. The length of thetransect was adjusted as the cruise progressed in reactionto a meander of the Kuroshio that passed through the sam-pling transect. The northwestern-most end of the transectwas several tens of kilometers from the large dischargeof the Chiangjiang River as denoted by the low salinityvalues observed. The relatively lower temperature and sa-
linity of the river water affected the transect, in additionto tidal currents and the warm, salty waters of theKuroshio. Thus, this study area represents one of the veryfew examples in the world where a western boundarycurrent interacts with freshwater influences. This inter-action may lead, as observed in the cruise, to interleav-ing processes where the cool, relatively fresh riverinewaters are found underneath the warm, relatively saltyKuroshio waters. Although these processes are the focusof other studies, in the Discussion section we present abrief description of the low salinity water subduction andits relation with a Kuroshio meander.
Current velocity measurements were obtained witha towed, downward pointing RD Instruments 307.2 kHzacoustic Doppler current profiler (ADCP) mounted on a~1.2 m catamaran. The catamaran was towed at the sur-face on the starboard side of the Kakuyo maru of Naga-saki University. Towing speed was between 2 and 2.5m/s to minimize bubble production on the ADCP trans-ducers and ensure good data quality. The bin size of thewater velocity data was 2 m and the velocity profiles rep-resented 120-second averages of pings that had intervalsof 4 seconds. The data analyzed were restricted to theportions of the transect where bottom tracking was main-
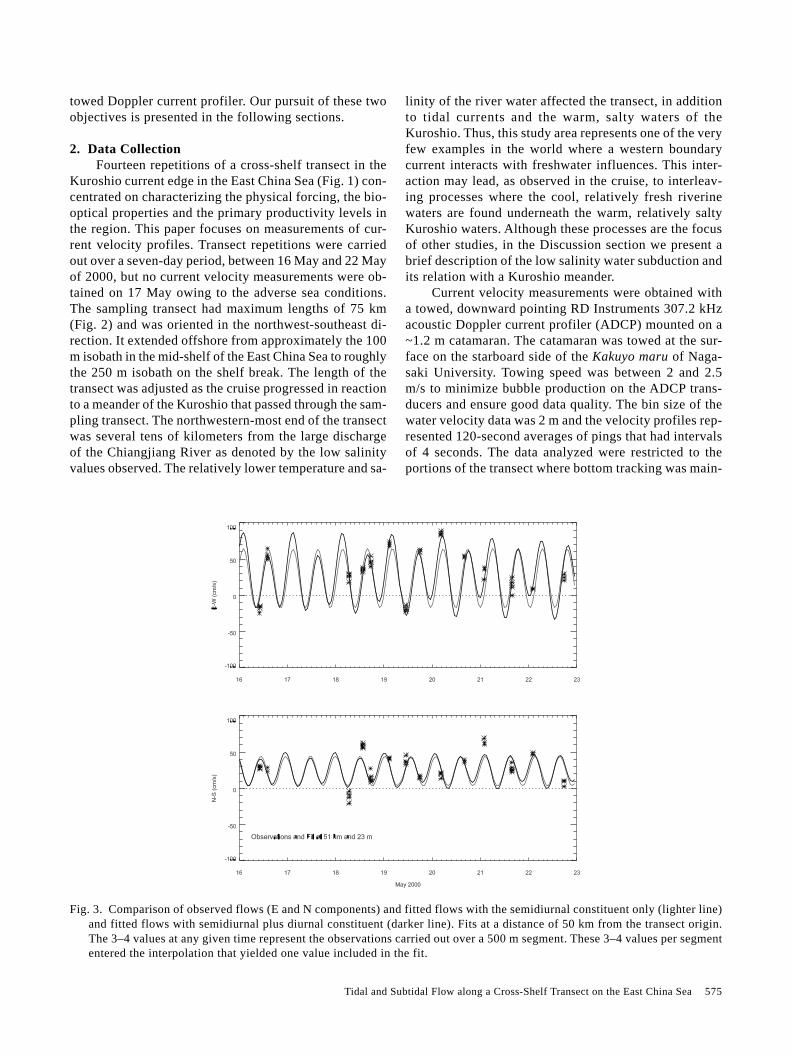
Fig. 3. Comparison of observed flows (E and N components) and fitted flows with the semidiurnal constituent only (lighter line)and fitted flows with semidiurnal plus diurnal constituent (darker line). Fits at a distance of 50 km from the transect origin.The 3–4 values at any given time represent the observations carried out over a 500 m segment. These 3–4 values per segmententered the interpolation that yielded one value included in the fit.
576 A. Valle-Levinson and T. Matsuno
tained, i.e., depths shallower than 250 m. These depthsrepresented the entirety of the transect in most cases. Dataprofiles reached a typical depth of 80 m even though thebottom tracking depth was much greater. This was attrib-uted to the scarcity of scatterers in this part of the ocean,which are required to measure currents with the ADCP.Navigation was carried out with a Trimble 2000D differ-ential global positioning system that was also used tocalibrate the ADCP compass following the procedure de-scribed by Joyce (1989).
Profiles of conductivity-temperature-depth were ob-tained with a SeaBird SBE-911 Plus CTD. Water sam-ples were gathered from bottles mounted on the CTD ro-sette. Hydrographic casts were carried out only on theoffshore traverse of the transect repetitions. This was doneto avoid compromising the quality of the velocity datathroughout the cruise as is the case when the ship stopsand the ADCP changes orientation intermittently. Thenear-surface temperature recorded by the ADCP was com-bined with the first bin of the velocity profiles to docu-ment the interaction between the Kuroshio and the shelfwaters.
3. Data ProcessingEastward and northward velocity components (u, v)
of each transect repetition were interpolated to a regulargrid of cross-shore distance against depth. The grid had a
resolution of 500 m in the horizontal and 2 m in the ver-tical, yielding matrices with 40 rows and 150 columns.Interpolation was carried out through Delaunay triangu-lations with the Interactive Data Language (IDL) soft-ware (Fang and Piegl, 1992, 1993; Research Systems, Inc.,1995). Each grid point of the 14 (equal to the number oftransect repetitions) interpolated grids of 40 by 150 val-ues, represented a time series of observations for u and v.The sampling interval in the middle of the transect wasapproximately 12 hours.
The time series at each grid point was then fitted todifferent numbers of harmonics by the least-squaresmethod in order to extract the tidal signal from the obser-vations. In other words, the observations (u, v) were ap-proximated as:
u v u v u v tA A i u vi
N
i i i i, , , sin ,( ) = ( ) + ( ) + ( )[ ] ( )
=∑0 0
1
1σ Φ Φ
where (u0, v0) are the residuals (or averages) of (u, v)throughout the 7 days of observations; σi is the frequencyof harmonic i for N harmonics; ( uAi
, vAi) are the ampli-
tudes of the two flow components for the specific har-monic; ( Φui
, Φvi) are their phases; and t is time in the
inverse units of σi. The task at hand then was to obtain(u0, v0), ( uAi
, vAi), and ( Φui
, Φvi).
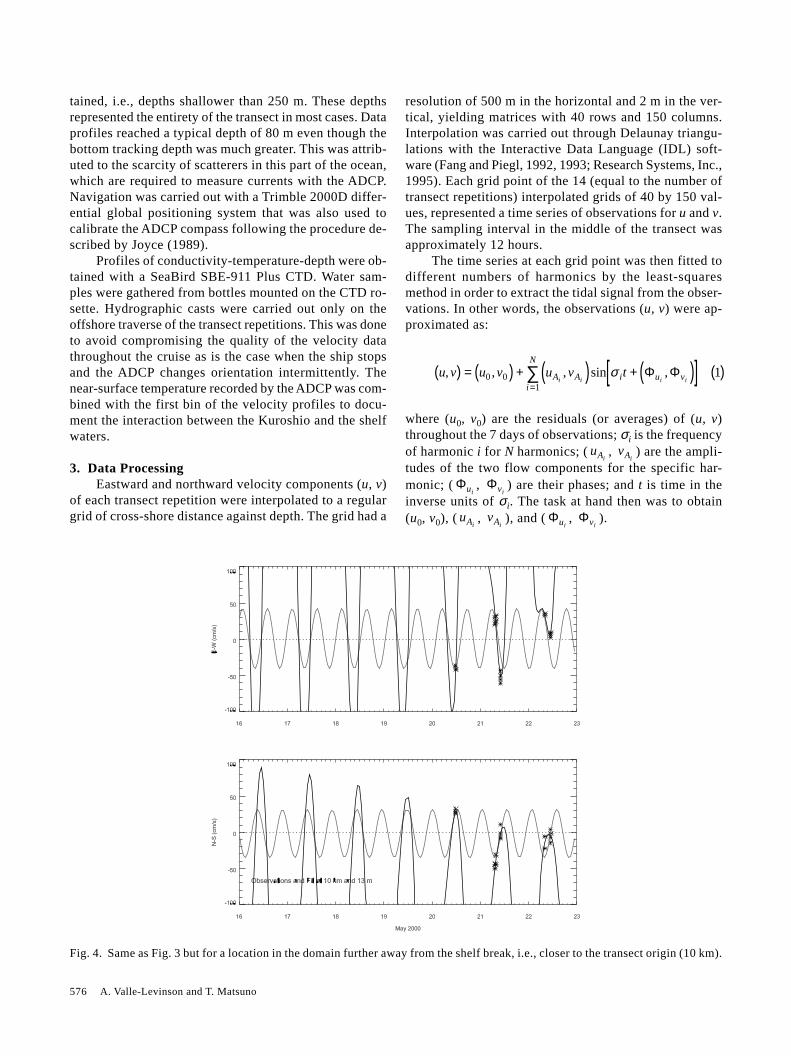
Fig. 4. Same as Fig. 3 but for a location in the domain further away from the shelf break, i.e., closer to the transect origin (10 km).
Tidal and Subtidal Flow along a Cross-Shelf Transect on the East China Sea 577
The quality of the fit (1) was explored with i = 1(M2), 2 (M2 and S2, M2 and K1), and 3 (M2, S2, and K1)tidal constituents. For this particular application, the over-all quality of the fit improved as the number of constitu-ents increased. However, the improvement was physicallyunsustainable because the tidal amplitudes obtained withmore than one constituent added to more than 1 m/s overthe continental shelf (Fig. 3), due to the large time inter-val between observations and the length of the time se-ries. The long time interval hindered elucidation of thediurnal tidal signal, most markedly in the first 20 km ofthe transect where the observations that constrained thefit began on May 20, thus rendering times series of onlyfive values (Figs. 3 and 4). Overall, the inclusion of K1 tothe fits reduced the extent over which the tidal signal wasresolved. On the other hand, the length of the time series
(7 days) impeded the reliable separation of any twosemidiurnal signals. For this purpose, a time series of atleast 15 days is required according to Rayleigh’s crite-rion of the difference between frequencies (1/12.42 hrs–1/12 hrs). Therefore, the results reported here forsemidiurnal currents actually imply the interaction of thethree major constituents: M2, S2 and N2.
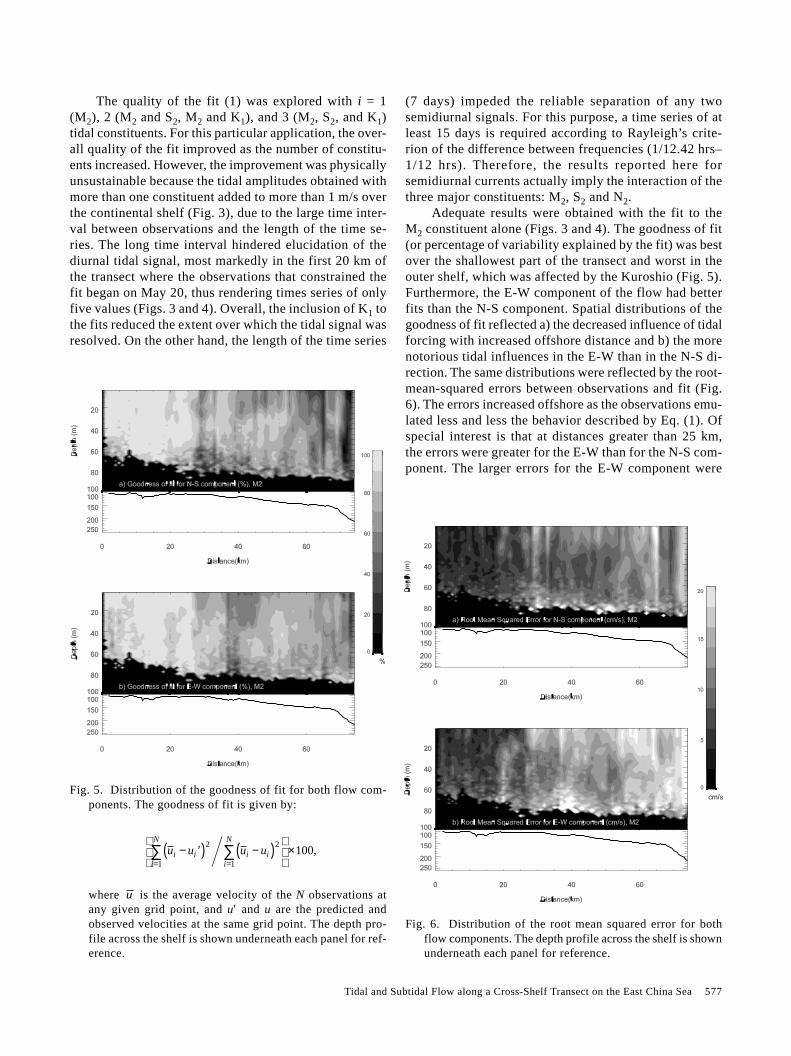
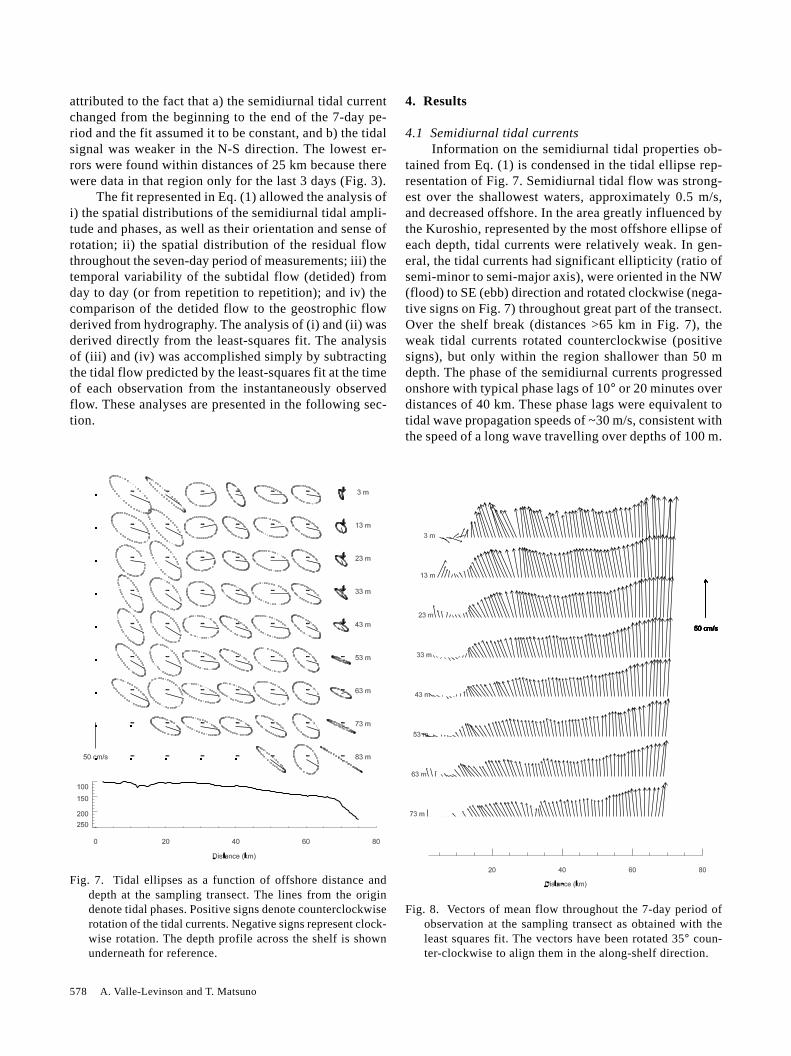
Adequate results were obtained with the fit to theM2 constituent alone (Figs. 3 and 4). The goodness of fit(or percentage of variability explained by the fit) was bestover the shallowest part of the transect and worst in theouter shelf, which was affected by the Kuroshio (Fig. 5).Furthermore, the E-W component of the flow had betterfits than the N-S component. Spatial distributions of thegoodness of fit reflected a) the decreased influence of tidalforcing with increased offshore distance and b) the morenotorious tidal influences in the E-W than in the N-S di-rection. The same distributions were reflected by the root-mean-squared errors between observations and fit (Fig.6). The errors increased offshore as the observations emu-lated less and less the behavior described by Eq. (1). Ofspecial interest is that at distances greater than 25 km,the errors were greater for the E-W than for the N-S com-ponent. The larger errors for the E-W component were
Fig. 5. Distribution of the goodness of fit for both flow com-ponents. The goodness of fit is given by:
u u u ui ii
N
i ii
N
−( ) −( )
×
= =∑ ∑′ 2
1
2
1
100,
where u is the average velocity of the N observations atany given grid point, and u′ and u are the predicted andobserved velocities at the same grid point. The depth pro-file across the shelf is shown underneath each panel for ref-erence.
Fig. 6. Distribution of the root mean squared error for bothflow components. The depth profile across the shelf is shownunderneath each panel for reference.
578 A. Valle-Levinson and T. Matsuno
attributed to the fact that a) the semidiurnal tidal currentchanged from the beginning to the end of the 7-day pe-riod and the fit assumed it to be constant, and b) the tidalsignal was weaker in the N-S direction. The lowest er-rors were found within distances of 25 km because therewere data in that region only for the last 3 days (Fig. 3).
The fit represented in Eq. (1) allowed the analysis ofi) the spatial distributions of the semidiurnal tidal ampli-tude and phases, as well as their orientation and sense ofrotation; ii) the spatial distribution of the residual flowthroughout the seven-day period of measurements; iii) thetemporal variability of the subtidal flow (detided) fromday to day (or from repetition to repetition); and iv) thecomparison of the detided flow to the geostrophic flowderived from hydrography. The analysis of (i) and (ii) wasderived directly from the least-squares fit. The analysisof (iii) and (iv) was accomplished simply by subtractingthe tidal flow predicted by the least-squares fit at the timeof each observation from the instantaneously observedflow. These analyses are presented in the following sec-tion.
4. Results
4.1 Semidiurnal tidal currentsInformation on the semidiurnal tidal properties ob-
tained from Eq. (1) is condensed in the tidal ellipse rep-resentation of Fig. 7. Semidiurnal tidal flow was strong-est over the shallowest waters, approximately 0.5 m/s,and decreased offshore. In the area greatly influenced bythe Kuroshio, represented by the most offshore ellipse ofeach depth, tidal currents were relatively weak. In gen-eral, the tidal currents had significant ellipticity (ratio ofsemi-minor to semi-major axis), were oriented in the NW(flood) to SE (ebb) direction and rotated clockwise (nega-tive signs on Fig. 7) throughout great part of the transect.Over the shelf break (distances >65 km in Fig. 7), theweak tidal currents rotated counterclockwise (positivesigns), but only within the region shallower than 50 mdepth. The phase of the semidiurnal currents progressedonshore with typical phase lags of 10° or 20 minutes overdistances of 40 km. These phase lags were equivalent totidal wave propagation speeds of ~30 m/s, consistent withthe speed of a long wave travelling over depths of 100 m.
Fig. 7. Tidal ellipses as a function of offshore distance anddepth at the sampling transect. The lines from the origindenote tidal phases. Positive signs denote counterclockwiserotation of the tidal currents. Negative signs represent clock-wise rotation. The depth profile across the shelf is shownunderneath for reference.
Fig. 8. Vectors of mean flow throughout the 7-day period ofobservation at the sampling transect as obtained with theleast squares fit. The vectors have been rotated 35° coun-ter-clockwise to align them in the along-shelf direction.
Tidal and Subtidal Flow along a Cross-Shelf Transect on the East China Sea 579
The apparent increase with depth of the tidal currents at70 km (Fig. 7), or at the shelf break, may be related tointernal tides suggested at that location by Yamashiro etal. (1988). However, such an increase may not be realbecause the goodness of fit in that region was low andthe errors were large. In general, these observations wereconsistent with the numerical results of Guo and Yanagi(1998) and show information that will help in the furthervalidation of numerical models that have been developedfor the continental shelf of the East China Sea.
4.2 Residual flowThe residual flow obtained throughout the period of
observation showed a well-defined western edge of theKuroshio current that appeared in the southeastern twothirds of the transect (distances >25 km, Fig. 8). The re-sidual currents reached up to 0.5 m/s and were directedapproximately in the 35°T direction, which points upwardin Fig. 8. Outside the influence of the Kuroshio, in thefirst ~20 km, the residual flow had a marked cross-shelfcomponent. This cross-shelf component reflected a con-
vergence zone associated with the average position of theedge of the western boundary current. Within this region(<20 km), the vertical shear of the residual flow wasgreater than inside the Kuroshio. These enhanced verti-cal shears defined the area of active exchange betweenshelf and Kuroshio waters at the Kuroshio’s western edge.The distribution of the residual flow of Fig. 8 exhibitedappreciable variability related to the intrusion of Kuroshiowaters onto the shelf. The intrusion appeared to be asso-ciated with a meandering portion of the Kuroshio, as de-scribed below.
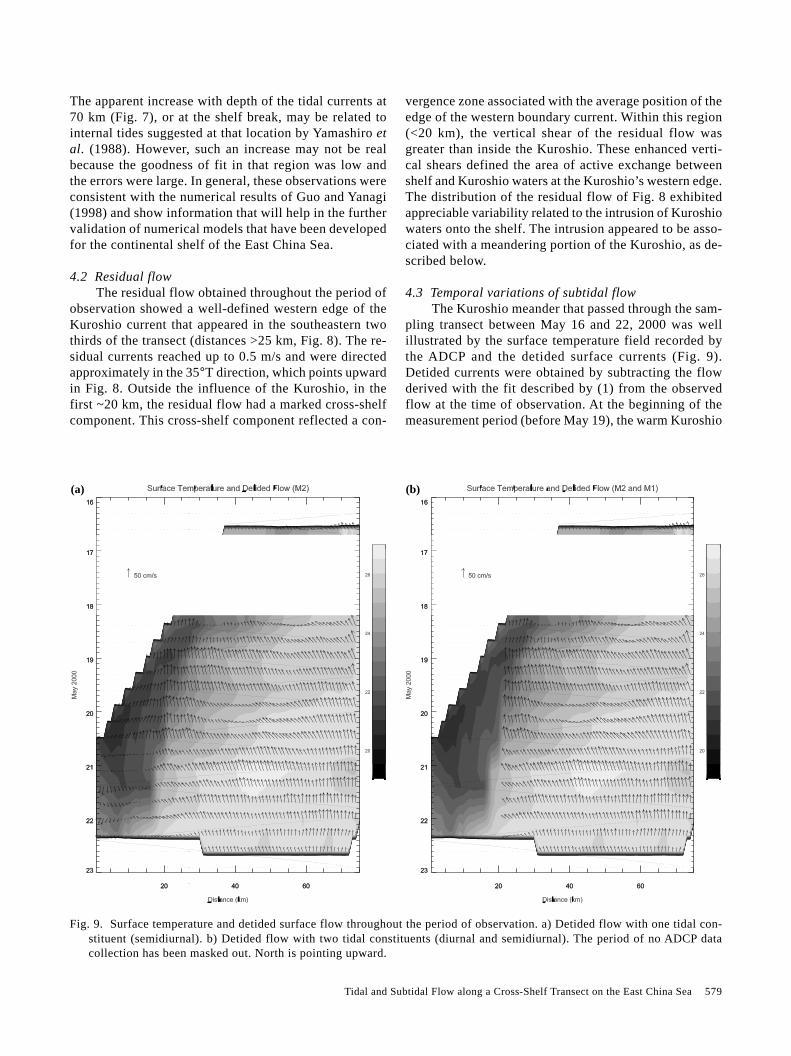
4.3 Temporal variations of subtidal flowThe Kuroshio meander that passed through the sam-
pling transect between May 16 and 22, 2000 was wellillustrated by the surface temperature field recorded bythe ADCP and the detided surface currents (Fig. 9).Detided currents were obtained by subtracting the flowderived with the fit described by (1) from the observedflow at the time of observation. At the beginning of themeasurement period (before May 19), the warm Kuroshio
Fig. 9. Surface temperature and detided surface flow throughout the period of observation. a) Detided flow with one tidal con-stituent (semidiurnal). b) Detided flow with two tidal constituents (diurnal and semidiurnal). The period of no ADCP datacollection has been masked out. North is pointing upward.
(a) (b)
580 A. Valle-Levinson and T. Matsuno
waters were restricted to the easternmost end of thetransect (>~65 km) and the surface flow was to the NW(~325°T). The temperature and surface flow fields showedthat a greater portion of the transect was influenced byKuroshio waters as time progressed after May 19. Thiswas likely the response to a meander of the Kuroshio thatmoved onshore between May 18 and 22 at speeds of 0.1–0.2 m/s (10 to 17 km in one day). However, the cross-shore dynamics associated with the meander should havebeen ageostrophic as the Kuroshio waters, in general,moved across the shelf. The representation of the surfaceflow and temperature fields also showed that the detidingprocedure with only a semidiurnal constituent producedbetter results for this particular application than thedetiding procedure using semidiurnal and diurnal constitu-ents combined. This assessment is based on the restrictedspatial coverage allowed by the use of two constituents(Fig. 9(b)) and on the fact that the detided currents wereessentially the same between 20 and 75 km for bothdetiding procedures.
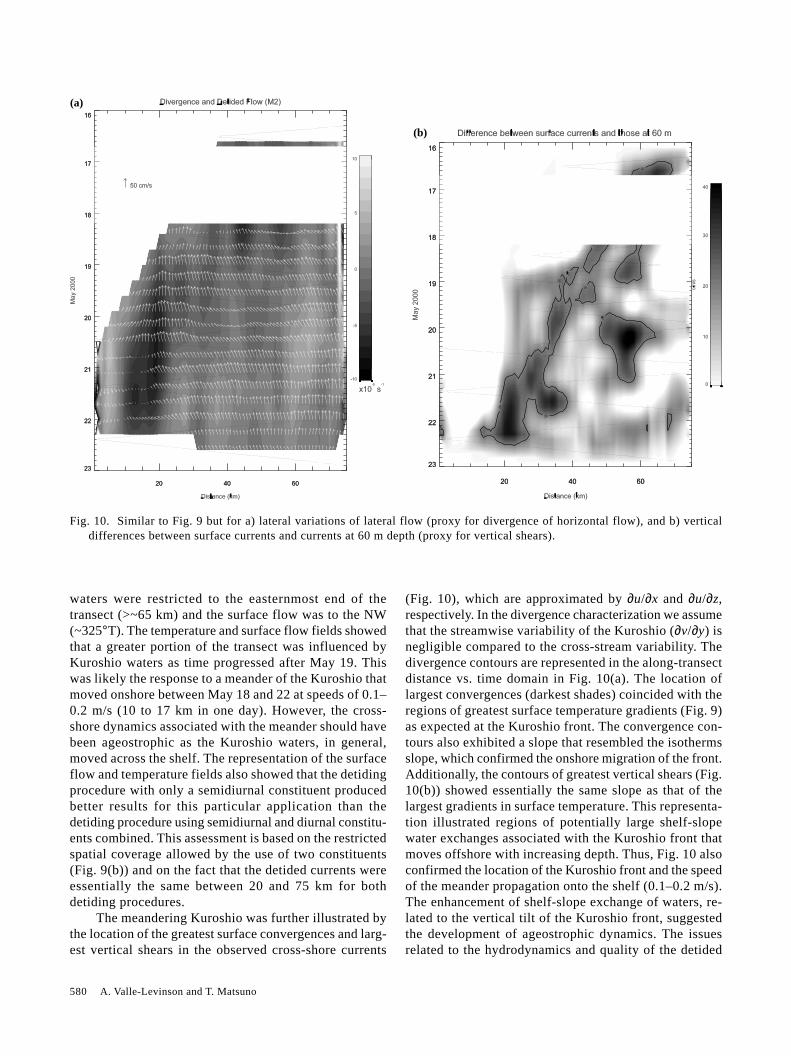
The meandering Kuroshio was further illustrated bythe location of the greatest surface convergences and larg-est vertical shears in the observed cross-shore currents
(Fig. 10), which are approximated by ∂u/∂x and ∂u/∂z,respectively. In the divergence characterization we assumethat the streamwise variability of the Kuroshio (∂v/∂y) isnegligible compared to the cross-stream variability. Thedivergence contours are represented in the along-transectdistance vs. time domain in Fig. 10(a). The location oflargest convergences (darkest shades) coincided with theregions of greatest surface temperature gradients (Fig. 9)as expected at the Kuroshio front. The convergence con-tours also exhibited a slope that resembled the isothermsslope, which confirmed the onshore migration of the front.Additionally, the contours of greatest vertical shears (Fig.10(b)) showed essentially the same slope as that of thelargest gradients in surface temperature. This representa-tion illustrated regions of potentially large shelf-slopewater exchanges associated with the Kuroshio front thatmoves offshore with increasing depth. Thus, Fig. 10 alsoconfirmed the location of the Kuroshio front and the speedof the meander propagation onto the shelf (0.1–0.2 m/s).The enhancement of shelf-slope exchange of waters, re-lated to the vertical tilt of the Kuroshio front, suggestedthe development of ageostrophic dynamics. The issuesrelated to the hydrodynamics and quality of the detided
Fig. 10. Similar to Fig. 9 but for a) lateral variations of lateral flow (proxy for divergence of horizontal flow), and b) verticaldifferences between surface currents and currents at 60 m depth (proxy for vertical shears).
(a)
(b)
Tidal and Subtidal Flow along a Cross-Shelf Transect on the East China Sea 581
flow are explored further with comparison of geostrophicestimates derived from hydrographic data and the corre-sponding detided ADCP data.
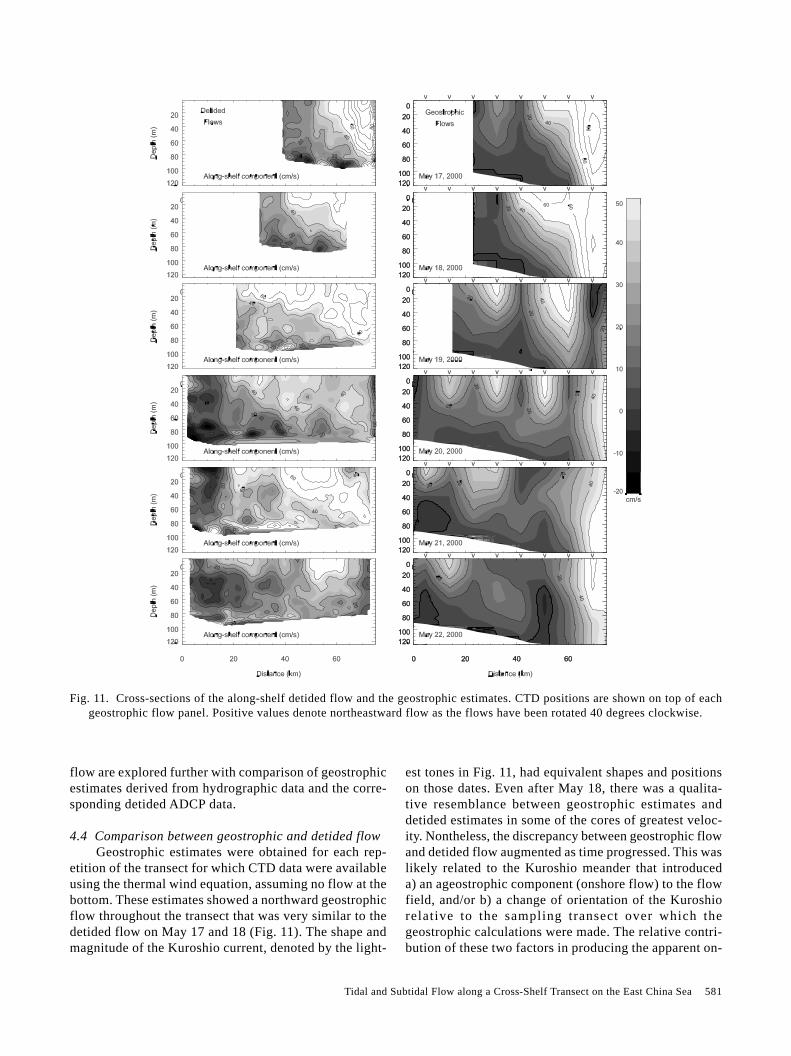
4.4 Comparison between geostrophic and detided flowGeostrophic estimates were obtained for each rep-
etition of the transect for which CTD data were availableusing the thermal wind equation, assuming no flow at thebottom. These estimates showed a northward geostrophicflow throughout the transect that was very similar to thedetided flow on May 17 and 18 (Fig. 11). The shape andmagnitude of the Kuroshio current, denoted by the light-
est tones in Fig. 11, had equivalent shapes and positionson those dates. Even after May 18, there was a qualita-tive resemblance between geostrophic estimates anddetided estimates in some of the cores of greatest veloc-ity. Nontheless, the discrepancy between geostrophic flowand detided flow augmented as time progressed. This waslikely related to the Kuroshio meander that introduceda) an ageostrophic component (onshore flow) to the flowfield, and/or b) a change of orientation of the Kuroshiorelative to the sampling transect over which thegeostrophic calculations were made. The relative contri-bution of these two factors in producing the apparent on-
Fig. 11. Cross-sections of the along-shelf detided flow and the geostrophic estimates. CTD positions are shown on top of eachgeostrophic flow panel. Positive values denote northeastward flow as the flows have been rotated 40 degrees clockwise.
582 A. Valle-Levinson and T. Matsuno
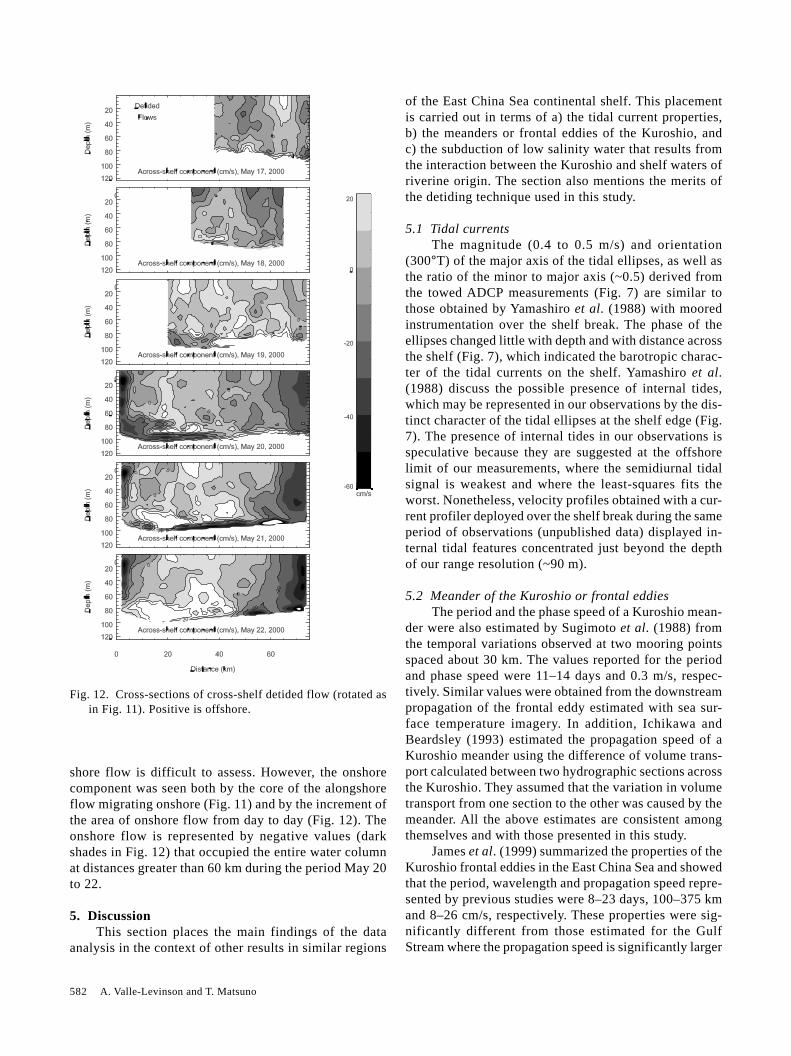
shore flow is difficult to assess. However, the onshorecomponent was seen both by the core of the alongshoreflow migrating onshore (Fig. 11) and by the increment ofthe area of onshore flow from day to day (Fig. 12). Theonshore flow is represented by negative values (darkshades in Fig. 12) that occupied the entire water columnat distances greater than 60 km during the period May 20to 22.
5. DiscussionThis section places the main findings of the data
analysis in the context of other results in similar regions
Fig. 12. Cross-sections of cross-shelf detided flow (rotated asin Fig. 11). Positive is offshore.
of the East China Sea continental shelf. This placementis carried out in terms of a) the tidal current properties,b) the meanders or frontal eddies of the Kuroshio, andc) the subduction of low salinity water that results fromthe interaction between the Kuroshio and shelf waters ofriverine origin. The section also mentions the merits ofthe detiding technique used in this study.
5.1 Tidal currentsThe magnitude (0.4 to 0.5 m/s) and orientation
(300°T) of the major axis of the tidal ellipses, as well asthe ratio of the minor to major axis (~0.5) derived fromthe towed ADCP measurements (Fig. 7) are similar tothose obtained by Yamashiro et al. (1988) with mooredinstrumentation over the shelf break. The phase of theellipses changed little with depth and with distance acrossthe shelf (Fig. 7), which indicated the barotropic charac-ter of the tidal currents on the shelf. Yamashiro et al.(1988) discuss the possible presence of internal tides,which may be represented in our observations by the dis-tinct character of the tidal ellipses at the shelf edge (Fig.7). The presence of internal tides in our observations isspeculative because they are suggested at the offshorelimit of our measurements, where the semidiurnal tidalsignal is weakest and where the least-squares fits theworst. Nonetheless, velocity profiles obtained with a cur-rent profiler deployed over the shelf break during the sameperiod of observations (unpublished data) displayed in-ternal tidal features concentrated just beyond the depthof our range resolution (~90 m).
5.2 Meander of the Kuroshio or frontal eddiesThe period and the phase speed of a Kuroshio mean-
der were also estimated by Sugimoto et al. (1988) fromthe temporal variations observed at two mooring pointsspaced about 30 km. The values reported for the periodand phase speed were 11–14 days and 0.3 m/s, respec-tively. Similar values were obtained from the downstreampropagation of the frontal eddy estimated with sea sur-face temperature imagery. In addition, Ichikawa andBeardsley (1993) estimated the propagation speed of aKuroshio meander using the difference of volume trans-port calculated between two hydrographic sections acrossthe Kuroshio. They assumed that the variation in volumetransport from one section to the other was caused by themeander. All the above estimates are consistent amongthemselves and with those presented in this study.
James et al. (1999) summarized the properties of theKuroshio frontal eddies in the East China Sea and showedthat the period, wavelength and propagation speed repre-sented by previous studies were 8–23 days, 100–375 kmand 8–26 cm/s, respectively. These properties were sig-nificantly different from those estimated for the GulfStream where the propagation speed is significantly larger
Tidal and Subtidal Flow along a Cross-Shelf Transect on the East China Sea 583
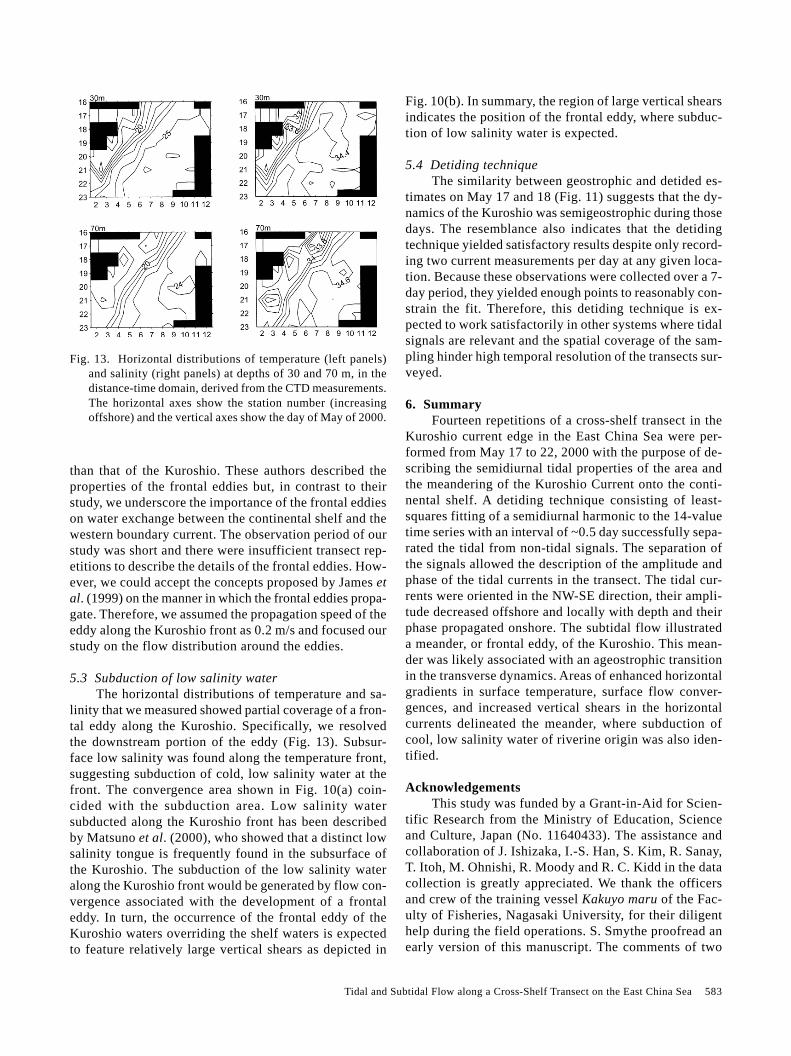
Fig. 13. Horizontal distributions of temperature (left panels)and salinity (right panels) at depths of 30 and 70 m, in thedistance-time domain, derived from the CTD measurements.The horizontal axes show the station number (increasingoffshore) and the vertical axes show the day of May of 2000.
than that of the Kuroshio. These authors described theproperties of the frontal eddies but, in contrast to theirstudy, we underscore the importance of the frontal eddieson water exchange between the continental shelf and thewestern boundary current. The observation period of ourstudy was short and there were insufficient transect rep-etitions to describe the details of the frontal eddies. How-ever, we could accept the concepts proposed by James etal. (1999) on the manner in which the frontal eddies propa-gate. Therefore, we assumed the propagation speed of theeddy along the Kuroshio front as 0.2 m/s and focused ourstudy on the flow distribution around the eddies.
5.3 Subduction of low salinity waterThe horizontal distributions of temperature and sa-
linity that we measured showed partial coverage of a fron-tal eddy along the Kuroshio. Specifically, we resolvedthe downstream portion of the eddy (Fig. 13). Subsur-face low salinity was found along the temperature front,suggesting subduction of cold, low salinity water at thefront. The convergence area shown in Fig. 10(a) coin-cided with the subduction area. Low salinity watersubducted along the Kuroshio front has been describedby Matsuno et al. (2000), who showed that a distinct lowsalinity tongue is frequently found in the subsurface ofthe Kuroshio. The subduction of the low salinity wateralong the Kuroshio front would be generated by flow con-vergence associated with the development of a frontaleddy. In turn, the occurrence of the frontal eddy of theKuroshio waters overriding the shelf waters is expectedto feature relatively large vertical shears as depicted in
Fig. 10(b). In summary, the region of large vertical shearsindicates the position of the frontal eddy, where subduc-tion of low salinity water is expected.
5.4 Detiding techniqueThe similarity between geostrophic and detided es-
timates on May 17 and 18 (Fig. 11) suggests that the dy-namics of the Kuroshio was semigeostrophic during thosedays. The resemblance also indicates that the detidingtechnique yielded satisfactory results despite only record-ing two current measurements per day at any given loca-tion. Because these observations were collected over a 7-day period, they yielded enough points to reasonably con-strain the fit. Therefore, this detiding technique is ex-pected to work satisfactorily in other systems where tidalsignals are relevant and the spatial coverage of the sam-pling hinder high temporal resolution of the transects sur-veyed.
6. SummaryFourteen repetitions of a cross-shelf transect in the
Kuroshio current edge in the East China Sea were per-formed from May 17 to 22, 2000 with the purpose of de-scribing the semidiurnal tidal properties of the area andthe meandering of the Kuroshio Current onto the conti-nental shelf. A detiding technique consisting of least-squares fitting of a semidiurnal harmonic to the 14-valuetime series with an interval of ~0.5 day successfully sepa-rated the tidal from non-tidal signals. The separation ofthe signals allowed the description of the amplitude andphase of the tidal currents in the transect. The tidal cur-rents were oriented in the NW-SE direction, their ampli-tude decreased offshore and locally with depth and theirphase propagated onshore. The subtidal flow illustrateda meander, or frontal eddy, of the Kuroshio. This mean-der was likely associated with an ageostrophic transitionin the transverse dynamics. Areas of enhanced horizontalgradients in surface temperature, surface flow conver-gences, and increased vertical shears in the horizontalcurrents delineated the meander, where subduction ofcool, low salinity water of riverine origin was also iden-tified.
AcknowledgementsThis study was funded by a Grant-in-Aid for Scien-
tific Research from the Ministry of Education, Scienceand Culture, Japan (No. 11640433). The assistance andcollaboration of J. Ishizaka, I.-S. Han, S. Kim, R. Sanay,T. Itoh, M. Ohnishi, R. Moody and R. C. Kidd in the datacollection is greatly appreciated. We thank the officersand crew of the training vessel Kakuyo maru of the Fac-ulty of Fisheries, Nagasaki University, for their diligenthelp during the field operations. S. Smythe proofread anearly version of this manuscript. The comments of two
584 A. Valle-Levinson and T. Matsuno
anonymous reviewers are greatly appreciated as theyhelped clarify certain aspects of our presentation.
ReferencesCandela, J., R. C. Beardsley and R. Limeburner (1992): Sepa-
ration of tidal and subtidal currents in ship-mounted acous-tic Doppler current profiler observations. J. Geophys. Res.,97, 769–788.
Choi, B. H. (1990): A fine-grid three dimensional M2 tidal modelof the East China Sea. p. 167–185. In Modeling MarineSystems, ed. by A. M. Davies, CRC Press Inc., Boca Raton,Florida.
Fairbridge, R. W. (1980): The estuary: Its definition andgeodynamic cycle. p. 1–35. In Chemistry and Biochemistryof Estuaries, ed. by E. Olausson and I. Cato, John Wiley,New York.
Fang, G. (1986): Tide and tidal current charts for the marginalseas adjacent to China. C. J. of Oceanology and Limnology,4, 1–16.
Fang, T. and L. Piegl (1992): Algorithm for Delaunay triangu-lation and convex hull computation using a sparse matrix.Computer Aided Design, 24, 425–436.
Fang, T. and L. Piegl (1993): Delaunay triangulation using auniform grid. IEEE Computer Graphics and Applications,36–47.
Guo, X. and T. Yanagi (1998): Three-dimensional structure oftidal current in the East China Sea and the Yellow Sea. J.Oceanogr., 54, 651–668.
Han, I. S., K. Kamio, T. Matsuno, A. Manda and A. Isobe (2001):High frequency current fluctuations and cross-shelf flowsaround the pycnocline near the shelf break in the East ChinaSea. J. Oceanogr., 57, 235–249.
Ichikawa, H. and R. C. Beardsley (1993): Temporal and spatialvariability of volume transport of the Kuroshio in the EastChina Sea. Deep-Sea Res., 40, 583–605.
James, C., M. Winbush and H. Ichikawa (1999): Kuroshio me-anders in the East China Sea. J. Phys. Oceanogr., 29, 259–272.
Joyce, T. M. (1989): On in situ “calibration” of shipboardADCPs. J. Atmos. Ocean. Tech., 6, 169–172.
Katoh, O., K. Teshima, O. Abe, H. Fujita, K. Miyaji, K.Morinaga and N. Nakagawa (1996): Process of the TsushimaCurrent formation revealed by ADCP measurements in sum-mer. J. Oceanogr., 52, 491–508.
Larsen, L. H., G. A. Cannon and B. H. Choi (1985): East ChinaSea tide currents. Cont. Shelf Res., 4, 77–103.
Matsuno, T., S. Ohsaki, S. Kanari, Y. Takaki and T. Kuno (2000):Mixing processes and horizontal intrusion around the shelfbreak in the East China Sea. p. 177–195. In Interactionsbetween Estuaries, Coastal Seas and Shelf Seas, ed. by T.Yanagi, Terra Scientific Pub., Tokyo, Japan.
Ning, X., Z. Liu, Y. Cai, M. Fang and F. Chai (1998):Physicobiological oceanographic remote sensing of the EastChina Sea: Satellite and in situ observations. J. Geophys.Res., 103, 21,623–21,635.
Nishida, H. (1980): Improved tidal charts for the western partof the North Pacific Ocean. Report of Hydrographic Re-searches, 15, 55–70.
Research Systems, Inc. (1995): Interactive Data Language Us-er’s Guide. Boulder CO.
Sugimoto, Y., S. Kimura and K. Miyaji (1988): Meander of theKuroshio front and current variability in the East China Sea.J. Oceanogr. Soc. Japan, 44, 125–135.
Yamashiro, T., A. Maeda and H. Ichikawa (1988): M2 tidal cur-rents near the continental shelf margin in the East ChinaSea. Prog. Oceanogr., 21, 431–440.
Yanagi, T. and K. Inoue (1994): Tide and tidal current in theYellow/East China Seas. La mer, 32, 153–165.
Ye, A. and L. Mei (1995): Numerical modeling of tidal wavesin the Bohai Sea, the Huanghai Sea and the East China Sea.Oceanol. Limnol. Sinica, 26, 63–70.
Zhao, B., G. Fang and D. Chao (1994): Numerical simulationsof the tide and tidal currents in the Bohai Sea, the YellowSea and the East China Sea. Acta Oceanologica Sinica, 16,1–10.