Embed Size (px)
Citation preview

at SciVerse ScienceDirect
Estuarine, Coastal and Shelf Science 112 (2012) 265e279
Contents lists available
Estuarine, Coastal and Shelf Science
journal homepage: www.elsevier .com/locate/ecss
Are tidal lagoons ecologically relevant to larval recruitment of small pelagic fish?An approach using nutritional condition and growth rate
M.A. Chícharo a,*, A. Amaral a, A. Faria b, P. Morais d, C. Mendes c, D. Piló a, R. Ben-Hamadou a, L. Chícharo c
aCentro de Ciências do Mar (CCMAR), Universidade do Algarve, Campus de Gambelas, 8005-139 Faro, Portugalb Eco-Ethology Research Unit, Instituto Superior de Psicologia Aplicada, R. Jardim do Tabaco 34, 1149-041 Lisbon, PortugalcUniversidade do Algarve, FCT, Campus de Gambelas, 8005-139 Faro, PortugaldCIMAR/CIIMARdCentro Interdisciplinar de Investigação Marinha e Ambiental, Universidade do Porto, Rua dos Bragas 289, 4050-123 Porto, Portugal
a r t i c l e i n f o
Article history:Received 7 February 2012Accepted 31 July 2012Available online 11 August 2012
Keywords:Sardina pilchardusEngraulis encrasicolusAtherina presbyterpostflexion larvaeRia FormosaRNA:DNA ratio
* Corresponding author.E-mail address: [email protected] (M.A. Chícharo)
0272-7714/$ e see front matter � 2012 Elsevier Ltd.http://dx.doi.org/10.1016/j.ecss.2012.07.033
a b s t r a c t
There are numerous studies dealing with larvae of Small Pelagic Fish (SPF), but only a few have actuallyaddressed advanced larval phases. Temperate coastal lagoons are particularly understudied, due to theabsence of standard method to capture advanced larval fish in these near shore shallow habitats.Accordingly, this study aims to describe abundances, nutritional condition and in situ growth of post-flexion (SPF) from the Ria Formosa, a tidal coastal lagoon in southern Portugal. The nutritional condi-tion and in situ growth were determined through cohort analysis and standardized RNA:DNA ratio (sRD),complemented with feeding incidence (gut content) and fatty acids (FAs, trophic biomarkers) of post-flexion larvae sampled sequentially with light traps, from spring 2005 to summer 2006. Simultaneously,environmental parameters such as water temperature, salinity, dissolved oxygen and chlorophyll a weremeasured. Post-larvae of SPF were captured through the year in important numbers. The dominantspecies were Sardina pilchardus (50.7%), Engraulis encrasicolus and Atherina presbyter (11.4%). Theseresults are distinct from those based on adult/juvenile surveys or early planktonic phases in the RiaFormosa where clupeiformes were occasionally reported. Sardines were captured mainly in winter,spring and early summer and anchovies mainly during summer and autumn. Sand smelt, a residentspecies, was present throughout the year. In the early summer, the three species were present and duringthis period some diet overlapping occurred, the feeding incidence of the clupeiformes was very low, butatherinids always exhibited full guts reflecting the different gut morphology or indicating different life-cycle strategies. The bulk of the diet was mollusks, crustaceans and appendicularians, for sand smelts,sardines and anchovies, respectively. The results of FA analyses showed some contribution of phyto-plankton to SPF in the area. All SPF exhibited higher condition (sRD) and growth rates in summer, whichare explained by the adequate temperature and higher planktonic productivity. This is especially relevantbecause the successful development of postflexion larvae in these nursery areas largely determines thesuccessful recruitment to adult fish populations.
� 2012 Elsevier Ltd. All rights reserved.
1. Introduction
Small Pelagic Fishes (SPF) include a diverse group of mainlyplanktivorous organisms that share surface waters, usually abovethe continental shelf. The SPF can be defined as the clupeiformes(Engraulidae, Clupeidae), scads (Carangidae), mackerels (Scom-bridae), and sand smelt (Atherinidae).
Off the Iberian Peninsula, high concentrations of SPF species(mainly Sardina pilchardus (Walbaum, 1792), Engraulis encrasicolus
.
All rights reserved.
(Linnaeus, 1758)) are found. Despite the large interannual landingvariation of these fisheries on the Iberian Peninsula, there are fewstudies about late larval phases and juveniles (Garcia et al., 2005;Drake et al., 2007; Costalago et al., 2011), and production andrecruitment dynamics are usually studied indirectly, e.g., usingacoustic surveys (Tugores et al., 2010).
Nevertheless, routine acoustic fisheries or ichyoplanktoniccruises did not include near shore ecosystems, but early stages of SPFmay dominate very productive shallower areas, in some cases clas-sified as protected areas. In fact, coastal lagoons worldwide arerecognized as important nursery habitats for early stages of inver-tebrates (Chícharo and Chícharo, 2000, 2001a,b) and fishes (Elliottand Hemingway, 2002). Nevertheless, some SPF species, in larval

M.A. Chícharo et al. / Estuarine, Coastal and Shelf Science 112 (2012) 265e279266
phases, are not described as users of these areas, and few studiesdescribe late larval condition and growth of SPF in such variablehabitats. Indices of feeding conditions, such as diet (Garrido et al.,2008; Morote et al., 2010), and FA content (Rossi et al., 2006) andindices of growth, such as nucleic acids (Buckley et al., 2008), areespecially useful in these areas because of their ability to integrateinterspecific, temporal andspatial patterns of life and feedinghistory.
The ratio of tissue RNA to DNA is a widely used index of recentgrowth and nutritional condition in larval and juvenile fish(Buckley et al., 2004). The amount of RNA in a cell varies inproportion to protein synthesis, whereas DNA concentrationsremain fairly constant in a somatic cell, even during starvation.Thus, the RNA:DNA ratio is an indicator of the protein-synthesizingpotential of a cell. Fast-growing individuals tend to be moreprepared to face adverse conditions, such as predation, and takeadvantage of good environmental conditions, such as temperatureand food availability usually characteristic of nursery areas. Moreresearch is needed to fully understand the use of interim nurseryareas critical to coastal fish survival worldwide, especially becausethese transitional habitats are being altered or lost due to anthro-pogenic impacts (Wasserman and Strydom, 2011).
Moreover, to understand recruitment variability, it is necessaryto study the underlying physical processes and the complex foodweb processes that sustain fish in nursery areas during their wholeplanktonic period, not only the early phases (López-Sanz et al.,2011) or juveniles phases (Woodland et al., 2012).
In fact, it has been shown that the magnitude of recruitmentmight be linked to the abundance of advanced larval phases and notto that of the early larvae (Leggett and DeBlois, 1994). Besidesdeterministic recruitment, it seems most recruitment is indeter-minate, because of the large number of factors that can interact andcause variability during the early phases. Chaos theory has animportant concept to offer to ecology; an apparently irrelevantfactor or an apparently irrelevant change in a relevant factor canhave an important impact on the history of a complex system, i.e.,a system regulated by many factors (Boero et al., 2004). Because ofthe observed variability of the egg and early phases of SPF and thedifficulty of sampling late larvae because of their increased abilityto evade plankton nets, abundance, production and recruitmentdynamics are usually studied indirectly by projecting the results ofoceanographic studies (mainly linking early larval phase distribu-tion and probability of survival) to local circulation and environ-mental conditions. Therefore, to reduce the number of factors thatcan interact and cause imprecise recruitment estimates, a key taskmust be to focus on late larvae ecology. In fact, notochord flexionappears as a milestone in fish ontogeny involving rapid develop-ment of specific morphological and physiological characteristics(e.g., caudal fin, Somarakis and Nikolioudakis, 2010).
We hypothesized that the presence of postflexion larvae of SPFin tidal coastal lagoonswould not be accidental and that individualswould exhibit a high condition and growth rate. The present studyaimed to determine the relative abundance of postflexion SPFspecies in a temperate tidal coastal lagoon (the Ria Formosa) and toidentify relevant environmental and biological processes at post-flexion phase. This was done by analyzing larval fitness throughRNA:DNA ratio (sRD) and their weight-specific growth rate (basedon cohort analysis and derived from nucleic acids), complementedwith diet analysis (gut content and FAs as biomarkers).
2. Methods
2.1. Study site
This study was carried out in the western part of the Ria For-mosa .The Ria, located in the northwest of the Bay of Cadiz, is a large
(170 km2) tidal coastal lagoon extending along the eastern part ofthe south coast of Algarve (Fig. 1). The Ria is protected from theAtlantic Ocean by multi-inlet barrier islands forming a sand dunecordon of w80 km between Ancão to the west, and Guadianaestuary near the border with Spain. The average depth is less than3 m, with 14% of the lagoon surface permanently submersed(subtidal channels). The Ria Formosa is under the influence ofa Mediterranean climate with humid moderate winters (rainfallconcentrated between November and February), and hot, drysummers. There are few freshwater sources flowing into thelagoon, most of which are dry during summer. This shallow lagoonis well mixed vertically (Barbosa, 2010).
2.2. Sampling strategy and laboratory processing
Between May 2005 and September 2006, on a weekly basis inspring/summer and autumn and twice a month during winter, SPFlarvae were collected with a light trap composed of an acrylic pipe25 cm in diameter and 50 cm high on a base consisting of a PVC boxcontaining a light. The trap was used at different zones in AncãoInlet (for details see Chícharo et al., 2009). Before the use of thelight trap, water temperature, salinity and dissolved oxygen weremeasured with a multiparametric probe (YSI Professional). In situchlorophyll a was determined with a fluorometer (10 AU Turner).When a high abundance (<20 larvae) was captured, severalsamples were taken over the following days to estimate growth.After 40e60 min of sampling, the captured larvae were frozen inliquid nitrogen.
In the laboratory, larvae were thawed, identified according to Ré(1999) and measured to the nearest 0.1 mm under a dissectingmicroscope equipped with an ocular micrometer. Only post-flexionlarvae were selected for the study, taking into consideration theobservation of the flexion of notochord, which occurs at standardlengths of 11e12.5 mm for Sardina pilchardus and 9e10 mm forEngraulis encrasicolus and Atherina presbyter (Ré, 1999; Santos et al.,2007). The larvae were freeze-dried, then individually dryhomogenized in microtubes, with two QIAGEN 3 mm TungstenCarbide Beads, in a shaking mill (Retsch MM 300). Next, the totalweight was determined and 1e5mg of samplewas stored at�80 �Cfor later nucleic acid and FA determinations.
2.3. Gut analysis and fatty acids
Fish larvae of the three studied species, co-occurring duringJune, all postflexion and larger than 20 mm, were analyzed for gutcontent and FAs. These analyses were carried out on 45 intactanchovy larvae (Engraulis encrasicolus), 36 intact sardine larvae(Sardina pilchardus) and 12 sand smelt (Atherina presbyter) selectedfrom the light-trap samples inwhich they weremost abundant andhence deemed the most representative. The entire gut from eachspecimen was removed using a fine needle and placed in a drop of50% glycerinedistilled water on a glass slide. Prey organisms wereteased out for identification, enumeration, and measurement. Foodparticles in the gut were identified to the lowest taxon possible.After gut removal, larval bodies were processed for FA as describedin previous section.
The determination of FA profiles was based on the experimentalprocedure of Lepage and Roy (1986) modified by Cohen et al.(1988). FA methyl esters were analyzed in a CP 3800 Varian gaschromatograph equipped with an autosampler and fitted witha flame ionization detector. The separation was carried out withhelium as the carrier gas in a DB-Wax Polyethylene Glycol column(30 m � 0.25 mm id) programmed to start at 180 �C for 5 min, thenheat at a rate of 4 �C min�1 for 10 min and maintained at 220 �C for25 min, with detection conducted at 250 �C using a split injector

Fig. 1. The sampling area (Ria Formosa coastal lagoon) (A) upperdmap of the Ria Formosa coastal lagoon and barrier island system (I., islands; P., peninsulas). (B) Lowerdaerialview of the western subembayment of the Ria Formosa coastal lagoon with sampling location (Ancão Inlet).
M.A. Chícharo et al. / Estuarine, Coastal and Shelf Science 112 (2012) 265e279 267
(100:1). FA methyl esters were identified by comparison of theirretention times with those of Sigma chromatographic standards,peak areas were determined using Varian software, and FA 23:0was used as an internal standard.
The diet of post-flexion larvae was evaluated according to theindices based on fatty acid relations 16:1(u � 7)/16:0, 18:1(u � 9)/18:1(u � 7) and EPA/DHA, and on PUFA/SFA relation. The highindices 18:1(u � 9)/18:1(u � 7) and PUFA/SFA indicate a highdegree of carnivory. The indices 16:1(u � 7)/16:0 and EPA/DHAestimated the importance of diatoms versus dinoflagellates in thediet of larvae (St. John and Lund, 1996; Auel et al., 2002; Rossi et al.,2006).
2.4. Nucleic acid analysis
Nucleic acid analysis was carried out on: 282 sardines, 184anchovies and 84 sand smelts. The procedures used to quantifynucleic acids in individual fish larvae are outlined in Esteves et al.(2000) and Caldarone et al. (2001). Due to tissue effects on RNAand DNA concentration the whole larvae were analyzed (Olivaret al., 2009). Concentrations were determined by running
standard curves of DNAeEB (ethidium bromide) and RNAeEB everyday with known concentrations of l-phages DNA (0.25 mg/mL�1)and 16e23 s Escherichia coli RNA (4 mg/mL�1) (Roche), in theappropriate range of values. The average ratio of DNA and RNAslopes was 2.85 � 0.45. The RNA:DNA ratios were then standard-ized (sRD) using this information and the reference slope ratio of2.4, according to Caldarone et al. (2006).
2.5. Data analysis
The quantitative importance of the different prey items in thediets was expressed using the following indices: (1) index offrequency of occurrence (% F), the frequency of occurrence of a preyin guts in percentage and (2) the index of relative importance (%IRI), obtained by multiplying the total number of ingested preyitems examined (N) by the frequency of occurrence (F) of a preyitem in larvae with food in their guts, taking in consideration theirweight, based on size/dry weight conversion factors for plankton(Peters and Downing, 1984). The summary in Table 2 displays thetotal count, frequency of occurrence, as percentages of the total, foreach type of prey and IRI (the index of relative importance) (Pinkas

Table 1Mean and standard deviation of the environmental parameters measured between sampling periods in the Ria Formosa (location see Fig. 1).
Temp �C Salinity O2 mg L�1 pH Seston mg L�1 Chlorophyll a mg L�1
Spring 05 20.5 � 1.66 36.73 � 1.1 12.53 � 0.4 8.21 � 0.3 5 � 1.41 1.51 � 0.83Summer 05 25.34 � 2.8 36.67 � 1.2 8.1 � 0.45 8.45 � 0.63 4 � 3 2.79 � 1.99Autumn 05 16.91 � 2.1 35.95 � 0.5 7.9 � 0.45 8.1 � 1.45 4 � 3 1.3 � 0.23Winter 06 14 � 1.41 36 � 0.35 11.53 � 1.3 8.13 � 0.3 15 � 15.55 1 � 0.45Spring 06 16.25 � 6.1 36.65 � 1.2 8.13 � 0.25 7.89 � 0.34 4 � 3 1.87 � 0.47Summer 06 26.17 � 1.8 36.87 � 1.2 8 � 0.5 8.3 � 0.6 4 � 3 3.11 � 2.39
M.A. Chícharo et al. / Estuarine, Coastal and Shelf Science 112 (2012) 265e279268
et al., 1971). We calculated percentage of diet composition for eachfood item (i) in each gut, averaged those values for each sample, andused the Schoener Index of Proportional Overlap (Schoener, 1970)to statistically quantify the diet overlap between species x and y;values ranged from 0 (no overlap) to 1 (perfect overlap) with anaccepted significance value of 0.60.
Cxy ¼ 1� 0:5�X��Pxi � Pyi
���
All percentages, P, are calculated in relation to the total numberof guts that were not empty.
The growth rate was analyzed in the two most representedspecies using two methods: (1) based on a cohort modal lengthprogression of anchovy and sardine from consecutive samplingwith a light trap; and (2) based on a multispecies larval fish growthmodel temperature, fluorometrically derived (Buckley et al., 2008).
(i1) Length-frequency distributions were analyzed by theBhattacharya (1967) method, and calculations were per-formed with the Complete Elefan package (Gayanilo et al.,1988). This method assumes that the components are nor-mally distributed. Two criteria were used to identify themodes: (a) the separation index, a ratio based on the differ-ence between the means of the components and their stan-dard deviationsdcomponents showing a separation indexgreater or equal to two were considered meaningfully sepa-rated; and (b) the confidence interval of the correlationcoefficients of the regression lines referred to above. The
Table 2Diet of the three species of small pelagic fish caught with a light trap in the Ria Formosa inand % IRI is the index of relative importance, obtained bymultiplying the total number of ilarvae with food in their guts.
Prey maingroup
Prey taxon 22e29 mm SL 23e
Sardina pilchardus Eng
N ¼ 45 Larvae w/prey 29% N ¼N prey % F % IRI N p
Phytoplankton Green remains Notquantified
15.6% Noqua
Diatoms 2 6.3% 1.3%Dinoflagellates 5 6.3% 7.4% 6
Phagotrophicprotists
Tintinids 8 18.8% 5.0%Cysts 1 3.1% 0.1%
Crustacea Copepoda 0.0%Nauplii 6 18.8% 3.8% 6Postnuptial 1 3.1% 2.6% 5Euterpina 1 3.1% 2.6% 1Cladocera 0.0%Podon 5 15.6% 65.7% 10Ostracoda 1 3.1% 6.3%
Mollusca Gastropodalarvae
0.0% 0.0%
Bivalve larvae 1 3.1% 1.1%Urochordata Apendicularia 1 3.1% 4.2% 5Others Remains
unidentified1.0%
Total 32 33Diet overlapping Schoener Index Engraulis 64% Atherina 53% Sar
observed and expected distributions were compared usingthe chi-squared method. The modal length of different larvalcohorts was plotted separately to follow their progressionover the sampling period. A lengtheweight relationship foreach species was used to transform mm of length (x) into mgof weight (y) for sardine (y ¼ 0.0021x2721, r2 ¼ 0.68) and foranchovy (y ¼ 0.0003x3412, r2 ¼ 0.89). A series of estimatedmean weight-at-age, considered to represent growth in time,was used to estimate the daily growth rate.
The weight-specific growth rate (SGR, d�1) between day n andday n þ 1 was:
SGR ¼ ðln DWn� ln DW1Þ=n� 1
where DWn and DW1 are average estimated dry weights for thefirst sampling day and n days afterward, respectively.
(ii2) The growth rate calculations, based on the multispecies larvalfish growth model at temperature (T) and fluorometricallyderived (Buckley et al., 2008), were made with the sRD valuesand calculated according to the following formula:
SGR�d�1
�¼ �0:078þ 0:0145 sRDþ 0:0044 sRD$T
Growth performance (Gpf), the quotient of the observed growthrate (SGR, d�1) and the growth rate achieved by larva of a given size
summer (June 2006). % F is the frequency of occurrence of a prey in guts in percentagengested prey items examined (N) by the frequency of occurrence (F) of a prey item in
28 mm 20e30 mm
raulis encrasicolus Atherina presbyter
36 Larvae w/prey 36% N ¼ 12 Larvae w/prey 100%
rey % F % IRI N prey % F % IRI
tntified
14% Notquantified
12.5%
19 12.5% 0.8%14% 3.2%
17.9% 0.6% 4 12.5% 0.1%10.7% 7.2% 24 12.5% 8.2%3.6% 0.5% 16 12.5% 5.4%
0.0%25.0% 33.8%
0.0% 12 5.2% 4.1%230 12.5% 31.3%
46 12.5% 6.3%14.3% 57.9%3.0% 37 7.3% 44.0%
388dina 64% Atherina 37% Sardina 53% Engraulis 37%
M.A. Chícharo et al. / Estuarine, Coastal and Shelf Science 112 (2012) 265e279 269
at a given temperature and photoperiod, under optimal feeding andenvironmental conditions, provides an objective measure of larvalcondition. However, given the difficulty in determining this value,Buckley et al. (2008) proposed the use of Houde and Zastrow (1993)multispecies model based on a compilation of published data from80 marine and estuarine species. The relationship between themidpoint of G and the midpoint of T was fitted to the equation:Gref ¼ 0.0106 � T � 0203.
To determine starvation percentage, we used sRD critical (sRDcrit), below what we classified the larvae to be in a low condition(starved). It was considered that starvation was achieved when thegrowth rate was nil, G(d�1) ¼ 0, and then, according to the Buckleyet al. (2008) model: sRD crit ¼ 0.078/(0.0145 þ 0.0044 T). Takinginto consideration the range of water temperatures registered(13 �Ce26 �C), the critical values of sRD were between 0.3 and 0.39.Accordingly, the larvae with sRD values higher than 0.4 wereconsidered in good condition and larvae with sRD values lowerthan 0.3 were considered in bad condition.
The percentile approach to starvation determination proposedby Meyer et al. (2012) was not applied, because although it isrelatively straightforward in laboratory research, it is more difficultto apply in the sea. Nevertheless, we derived the sRDmetrics (10th,50th, and 90th percentiles), and related them to life stages andseasonal variation. Quantile regression was used to infer trends ofsRD as a function of the standard larval length. The regression slopewas tested to be significantly different from zero using t-test.
sRD ratios were tested for differences among the seasons usingsingle-factor analyses of variance with standard length as covariate(ANCOVA). Differences between means have been consideredstatistically significant for p < 0.05. The relationship between sRDand water parameters was analyzed by Pearson’s correlation. Toavoid assuming a significant correlation due to random processes,Bonferroni inequalities (Snedecor and Cochran, 1989) were used inthedata analysis. The value t0.05 usedwas corrected to t0.05/n0 (n0 is thenumberof pairs of correlations in thematrix) and, onlyafter applyingthis correction, did we verify if a correlation was significant. Statis-tical analyses were done with Statistica software (version 10).
3. Results
3.1. Environmental parameters and fish larvae abundance
Water temperature in the Ria Formosa varied between 28.6 �C(July 2006) and 13 �C (February 2006). The salinity ranged between
Fig. 2. Temporal variation of weekly/monthly fish larvae collecte
37.1 (July 2006) and 35.25 (November 2005). The pH values oscil-lated between amaximum in July 2005 of 8.5 and aminimum of 7.9in April 2006. The dissolved oxygen exhibited values higher than 8during the whole period, with lowest values in summer/autumn,due to high temperatures. The chlorophyll ranged betweena maximum of 3.14 mg L�1 in June 2006 and a minimum of0.9 mg L�1 in February 2006 (Table 1).
A total of 1651 larvae were collected with the light trap duringthe year. The standard length ranged between 10 mm and 44 mmand the dry weight from 0.1 mg to 232.3 mg. Of the collected larvaeof SPF, 50.7% were Sardina pilchardus, 37.9% were Engraulis encra-sicolus and 11.4% Atherina presbyter. Atherina larvae were presentthroughout the year, except winter, but with moderate densities(averaging per light trap 6 � 8.98). Sardine and anchovy exhibitedsome segregated period of appearance. E. encrasicolus larvaeconcentrated in July/August and November (late summer andautumn), averaging 15 � 21 per light trap during this period.S. pilchardus larvae were present mainly during March/April andJune (late winter/late spring and early summer) averaging20 � 25.06 during this period (Fig. 2).
3.2. Diet composition
The number of prey items ingested per larva during the studyperiod (summer only) was higher in Atherina presbyter (32.3, range5e150) compared with anchovy larvae (0.92, range 0e5) and tosardine larvae (0.71, range 0e4) (Table 2, Fig. 3).
When the percentage prey items, by number, and thefrequency of occurrence (IRI%) were taken into account, differ-ences related to species between the two clupeid species and lateAtherina presbyter larvae, were again evident (Table 2). The latterfed mainly on mollusc larvae (Gastropoda, 31.3%; Bivalvia, 6.3%)and on crustacea (Copepoda phases, 14.6%), but unidentifiedremains represented an important percentage (44%). In summer,late anchovy larvae fed mainly on Appendicularia (57.9%) andcrustacea (Cladocera, 38%; Copepoda phases, 8.3%), but phyto-plankton represented 3.2% (Dinoflagellata). Late sardine larvae fedon a wider variety of prey, including protistoplankton (Tintinnida,5%), phytoplankton (Diatomacea, 1.3%; Dinoflagellata, 7.4%),Copepoda phases (9%), Ostracoda (6.3%) but the Cladocera, Podonspp. (65.7%) dominated.
The Schoener Index for the three co-occurring species washigher (64%) between anchovy and sardine than between thesespecies and Atherina (37% and 53%) (Table 2).
d with a light trap in the Ria Formosa (see location, Fig. 1).

Fig. 3. Photographs of fish larvae gut content: upper row Atherina presbyterdphytoplankton 1�, 2� and 3� , 4� , aggregate of mollusk species, and lower row Sardina pilchar-dusdcrustacean, 1� cladoceran Podon, 2� copepod nauplius, 3� ostracod 7 and 4� calanoid copepod (____) 100 m.
M.A. Chícharo et al. / Estuarine, Coastal and Shelf Science 112 (2012) 265e279270
3.3. Fatty acid analysis
Of the 23 FAs identified, 16:0, eicosapentaenoic acid or EPA(20:5(u � 3)) and docosahexaenoic acid or DHA (22:6(u� 3)) made
Table 3Mean and standard deviation of the standard length, dry weight and nucleic acid concentrpostflexion larvae, captured in Ria Formosa, a tidal lagoon.
Fatty acids concentrations (mg mg DW�1) Sardina pilchardus
22e29 mm n ¼ 45
14:00 2.04 � 0.0316:00 13.29 � 0.0818:00 4.13 � 0.0724:00 0.25 � 0.0516:1(n � 5) 0.32 � 0.1216:1(n � 7) 2.09 � 0.2916:2(n � 4) 0.5 � 0.0118:1(n � 9) 2.54 � 0.1918:1(n � 7) 1.39 � 0.1820:1(n � 9) 0.1 � 0.0220:1(n � 7) 0.07 � 0.0416:4(n � 3) 0.15 � 0.0322:1(n � 9) 0.09 � 0.0318:3(n � 6) 0.11 � 0.0118:3(n � 3) 0.54 � 0.218:4(n � 3) 0.71 � 0.3818:2(n � 6) 0.53 � 0.1520:2(n � 6) 0.12 � 0.0420:4(n � 6) 0.49 � 0.2720:4(n � 3) 0.15 � 0.0920:5(n � 3) 3.47 � 1.3422:2(n � 6) 0.09 � 0.0622:4(n � 6) 0.17 � 0.122:6(n � 3) 7.43 � 3.35P
Sata 20.65 � 0.33PMonob 6.58 � 0.69PPUFAc 14.7 � 6.1P ðn� 3Þ 15.65 � 2.67P ðn� 6Þ 1.87 � 0.21P14: 0 18: 1ðn� 9Þ 18: 4ðn� 3Þ 5.29 � 0.13PTotal FA 41.94 � 6.8
(n � 3)/(n � 6) 8.35 � 0.47EPA/DHA or (20:5(n � 3)/22:6(n � 3) 0.46 � 0.02P
PUFA=P
Sat 0.71 � 0.01C16/C18 3.21 � 0.2P
14: 0 18: 1ðn� 9Þ 18: 4ðn� 3Þ=P Total FA 0.12 � 0.0116:1(n � 7)/16 0.22 � 0.0118:1(n � 9)/18:1(n � 7) 1.83 � 0.2
a Saturated: 12:0, 14:0, 15:0, 16:0, 17:0, 18:0, 19:0, 20:0 and 22:0.b Monounsaturated: 16:1(n � 7), 17:1(n � 8), 18:1(n � 9), 18:1(n � 7), 20:1(n � 9), 2c Polyunsaturated: 16:4(n � 3), 18:2(n � 6), 18:3(n � 6), 18:3(n � 3), 18:4(n � 3), 20:2
22:5(n � 3) and 22:6(n � 3).
up more than 50% of total FAs found in all species (Table 3), with57.6% for sardines, 60% for anchovies and 51.1% for sand smelt. Theother abundant FAs found were 14:0, 18:0, 16:1(u � 7), 18:1(u � 9)and 18:1(u � 7). The proportion of polyunsaturated fatty acids or
ations determined in Sardina pilchardus, Engraulis encrasicolus and Atherina presbyter
Engraulis encrasicolus Atherina presbyter
23e28 mm n ¼ 36 20e30 mm n ¼ 12
2.03 � 0.02 8.96 � 3.8012.19 � 0.03 34.52 � 10.433.83 � 0.04 7.91 � 2.480.36 � 0.03 0.971 � 0.480.29 � 0.02 0.71 � 0.4292.19 � 0.06 9.57 � 4.540.44 � 0.01 0.57 � 0.152.59 � 0.05 1.58 � 7.811.52 � 0.04 5.91 � 6.950.11 � 0.01 0.14 � 0.280.08 � 0.04 4.12 � 1.950.12 � 0.01 1.06 � 0.910.14 � 0.01 0.74 � 0.940.12 � 0.01 0.14 � 0.950.54 � 0.08 0.48 � 0.960.79 � 0.12 0.74 � 0.970.63 � 0.04 0.17 � 0.690.15 � 0.02 2.17 � 0.700.71 � 0.1 0.91 � 0.770.24 � 0.02 1.80 � 0.785.09 � 0.72 18.06 � 9.480.17 � 0.03 0.47 � 0.040.24 � 0.04 0.76 � 0.05
10.15 � 1.78 28.59 � 4.8819.12 � 0.12 54.18 � 16.72
6.8 � 0.2 37.75 � 15.8519.79 � 2.98 62.24 � 18.9618.93 � 0.06 56.27 � 17.042.15 � 0.05 5.96 � 2.015.41 � 0.22 15.55 � 0.8945.8 � 3.28 155 � 50.978.83 � 0.2 9.57 � 1.120.5 � 0.2 0.63 � 0.01
1.04 � 0.2 1.15 � 0.33.18 � 0.2 3.47 � 0.20.12 � 0.2 0.17 � 0.010.17 � 0.03 0.28 � 0.011.7 � 0.2 2.68 � 1.01
0:1(n � 7), 22:1(n � 11) and 22:1(n � 9).(n � 6), 20:4(n � 6), 20:3(n � 3). 20:4(n � 3), 20:5(n � 3), 22:4(n � 6), 22:5(n � 6),

M.A. Chícharo et al. / Estuarine, Coastal and Shelf Science 112 (2012) 265e279 271
PUFA was higher than any other type of FA among larvae of allspecies. Several ratios were calculated to determine the contribu-tion of different types of prey (Table 4). High indices 18:1(u � 9)/18:1(u � 7) were detected especially in Atherina presbyter(2.68 � 1.01) compared to clupeiformes (Sardina pilchardus,1.83 � 0.2; Engraulis encrasicolus, 1.7 � 0.2), while low indices ofP
14: 0 18: 1ðn� 9Þ 18: 4ðn� 3Þ=P total FA were detected in allspecies (0.12e0.17) (Table 3). Medium/high values of EPA/DHA(0.46e0.63) were registered in all species.
3.4. Nucleic acid content and RNA:DNA ratios (sRD)
For Sardina pilchardus, the nucleic acid content was 309.08(mean) � 18.78 (standard deviation) mg RNA/larvae and160 � 96 mg DNA/larvae, for Engraulis encrasicolus the values were323 � 646 mg RNA/larvae and 165.66 � 161 mg DNA/larvae. Nucleicacids content for Atherina presbyter were 171 � 27.2 mg RNA/larvaeand 126� 190.4 mg DNA/larvae. For all species the significant highervalues of sRD were obtained, in both years, during summer (Fig. 4,Tables 4 and 5). The individual values of sRD for S. pilchardus rangedbetween a maximum of 7.45 in June 2006 and a minimum of 0.43,also in June, with a starvation percentage of 0%. The sRD forA. presbyter ranged between 5.66 in July 2005 and 0.42 inNovember 2005, with a starvation percentage of 0%. E. encrasicolusregistered the highest values among the species at 9.37 anda minimum of 0.133 in July 2006; the starvation percentage rangedbetween 8% (4/53) in autumn 2005 and 2% (2/106) in summer
Table 4Mean and standard deviation of fatty acid composition (mg mg�1 dry weight) and FA troph(June).
Species Season Standard length(mm)
Dry weight(mg)
mg RNA/larv
Sardinapilchardus
Summer 2005(September)
15.3 � 0.29 1.6 � 0.34 311.26 � 18
Autumn 2005(November)Winter 2006(February andMarch)
26.33 � 1.38 12.18 � 1.38 463.03 � 66
Spring 2006(April and June)
21.59 � 3.97 11.67 � 1.71 214.73 � 59
Summer 2006(July, August andSeptember)
18.02 � 0.13 8.46 � 1.6 240.52 � 22
Engraulisencrasicolus
Summer 2005(September)
27.71 � 0.87 8.19 � 1456 323.65 � 21
Autumn 2005(November)
34.34 � 3.234 64.89 � 23.4 303.6 � 38
Winter 2006(February andMarch)Spring 2006(April and June)
14.81 � 0.28 2.96 � 0.48 401.27 � 17
Summer 2006(July, August andSeptember)
24.38 � 1.4 19.82 � 2.95 293.84 � 34
Atherinapresbyter
Summer 2005(July, August andSeptember)
12.07 � 2.54 4.17 � 1.82 298.06 � 25
Autumn 2005(November)
31.14 � 6.78 89.73 � 34.5 128.91 � 10
Winter 2006(February andMarch)Spring 2006(April and June)
17.01 � 5.67 10.65 � 11.8 179.72 � 35
Summer 2006(July, August andSeptember)
18.9 � 3.12 20.42 � 13.86 221.54 � 16
2006. The 50th percentile of sRD increased for all species undersummer conditions, but the 10th percentile also increased duringthis period, especially for E. encrasicolus. The observed nucleic acidratio (sRD) showed a significant decrease in relation to the standardlarval length with the estimated 50th percentile for all species, butwith 10th and 90th percentiles only for sardines and anchovies(Fig. 5). S. pilchardus 10th percentile p ¼ 0.005, 50th percentilep ¼ 0.0001, 90th percentile p ¼ 0.0001; E. encrasicolus 10thpercentile p ¼ 0.005, 50th percentile p ¼ 0.0001, 90th percentilep ¼ 0.0098; A. presbyter 10th percentile p ¼ 0.786, 50th percentilep ¼ 0.0780, 90th percentile p ¼ 0.115. Nevertheless, the covarianceanalysis showed a significant effect of size on condition betweenseasons only for S. pilchardus (Table 5).
The condition of Engraulis encrasicolus, measured by sRD, waspositively and significantly related to chlorophyll a, pH andtemperature (r ¼ 0.47, p < 0.001), but negatively and significantlycorrelated to dissolved oxygen (r¼�0.47, p< 0.001). The conditionof Sardina pilchardus, measured by sRD, was significantly andpositively related to temperature (r ¼ 0.49, p < 0.001), chlorophylla (r¼ 0.42, p< 0.001). The sRD of Atherina presbyter larvaewas onlycorrelated significantly with water temperature (r¼ 0.5, p< 0.036).
3.5. Growth rate
Because of some period of poor larval availability, determiningthe growth rate from sequential sampling was only possible forSardina pilchardus in spring 2006 and summer 2006 and for
ic indices in postflexion larvae of SPF in the Ria Formosa at the beginning of summer
a RNA/mg mg DNA/larva mg DNA/mg sRD N
.95 194.59 � 9.1 146.17 � 2.11 91.36 � 2.69 2.47 � 1.03 3
0
.6 38.58 � 9.85 221.06 � 1.98 18.26 � 1.91 1.36 � 0.25 135
.4 18.98 � 7.88 115.48 � 18.86 9.88 � 0.16 1.46 � 0.82 120
.91 25.97 � 2 89.54 � 17.82 9.58 � 0.266 2.09 � 0.07 24
.32 165.66 � 11 369 � 0.45 56.67 � 7.2 1.4 � 0.15 1
.58 4.68 � 2.34 250.44 � 45.67 3.86 � 2.35 0.7 � 1.23 51
0
3.77 142.34 � 81.98 53.93 � 33.42 19.41 � 14.47 4.31 � 0.31 26
.33 15.12 � 3.98 167.02 � 98.52 8.15 � 3.76 2.14 � 1.96 106
.05 81.54 � 34.5 83.87 � 24.89 24.21 � 14.14 2.45 � 0.62 15
5.78 1.44 � 58.201 162.07 � 36.9 1.81 � 18.03 0.78 � 0.92 34
0
.94 38.94 � 39.80 157.37 � 52.47 45.44 � 53.31 0.87 � 0.42 10
1.64 10.6 � 0.71 107.07 � 9.45 7.02 � 5.23 2.1 � 1.5 25

Engraulis encrasicolus post-flexion
16-N
ov-0
5
17-N
ov-0
5
1-D
ec-0
5
19-J
un-0
6
5-Ju
l-06
18-J
ul-0
6
26-J
ul-0
6
31-J
ul-0
6
sampling date
0
2
4
6
8
10
sRD
Engraulis encrasicolus post-flexion
16-N
ov-0
5
17-N
ov-0
5
1-D
ec-0
5
19-J
un-0
6
5-Ju
l-06
18-J
ul-0
6
26-J
ul-0
6
31-J
ul-0
6
sampling date
5
10
15
20
25
30
35
40
45
SL (m
m)
Sardina pilchardus post-flexion
22-S
ep-0
5
9-Fe
b-06
7-M
ar-0
6
8-M
ar-0
6
14-M
ar-0
6
4-Ap
r-06
14-A
pr-0
6
19-J
un-0
6
20-J
un-0
6
21-J
un-0
6
5-Ju
l-06
21-J
ul-0
6
26-J
ul-0
6
31-J
ul-0
6
21-A
ug-0
6
sampling date
5
10
15
20
25
30
35
40
SL(m
m)
Sardina pilchardus post-flexion22
-Sep
-05
9-Fe
b-06
7-M
ar-0
6
8-M
ar-0
6
14-M
ar-0
6
4-Ap
r-06
14-A
pr-0
6
19-J
un-0
6
20-J
un-0
6
21-J
un-0
6
5-Ju
l-06
21-J
ul-0
6
26-J
ul-0
6
31-J
ul-0
6
21-A
ug-0
6sampling date
0
1
2
3
4
5
6
7
8
9
sRD
Atherina presbyter post-flexion
1-Ju
l-05
18-J
ul-0
5
19-A
ug-0
5
22-S
ep-0
5
1-N
ov-0
5
7-N
ov-0
5
9-N
ov-0
5
6-Ap
r-06
7-Ap
r-06
7-Ju
n-06
19-J
un-0
6
21-J
un-0
6
7-Ju
l-06
26-J
ul-0
6
7-Au
g-06
21-A
ug-0
6
sampling date
0
1
2
3
4
5
6
7
8
sRD
Atherina presbyter post-flexion
18-J
ul-0
5
1-Ju
l-05
19-A
ug-0
5
22-S
ep-0
5
7-N
ov-0
5
9-N
ov-0
5
1-N
ov-0
5
6-Ap
r-06
7-Ap
r-06
21-J
un-0
6
19-J
un-0
6
7-Ju
n-06
26-J
ul-0
6
7-Ju
l-06
21-A
ug-0
6
7-Au
g-06
data recolha
5
10
15
20
25
30
35
40SL
(mm
)
Median 10%-90% Raw Data
Median 10%-90% Raw Data
Median 10%-90% Raw Data
Median 10-90% Raw Data
Median 10%-90% Raw Data
Median 10%-90% Raw Data
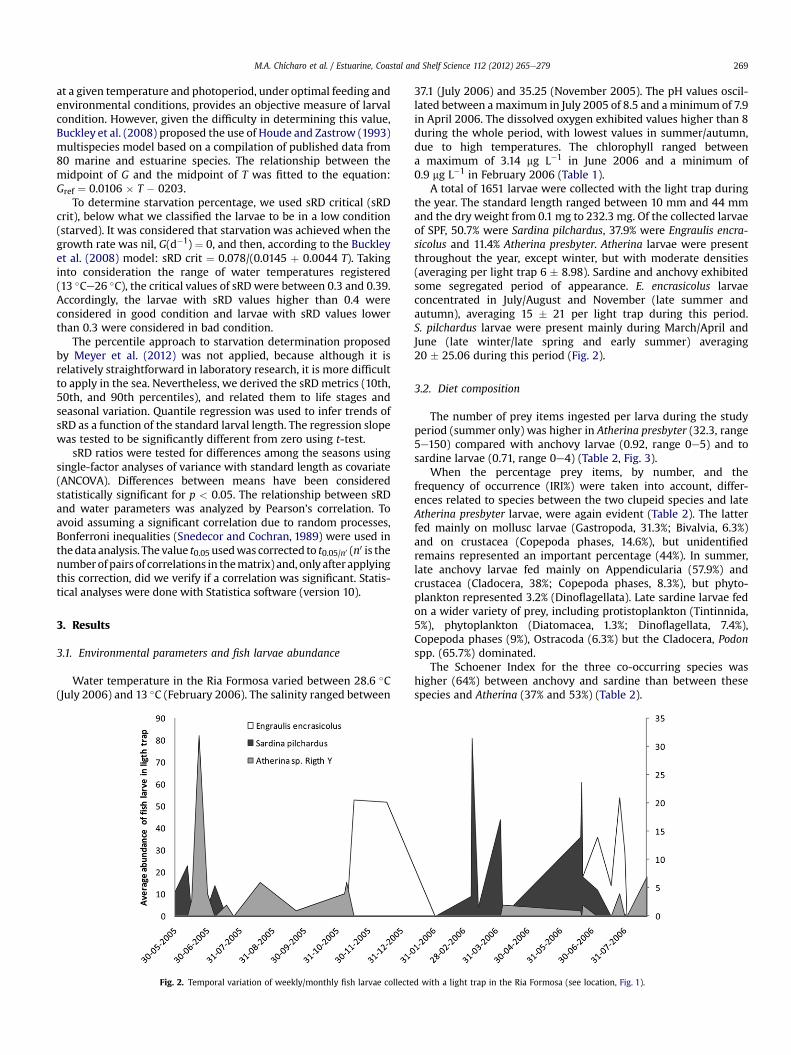
Fig. 4. Percentile plots (10th, 50th and 90th) of standardized RNA:DNA ratio (sRD) and standard length (SLmm) of postlarval small pelagic fish from the Ria Formosa during the samplingperiod. The line in bold in the sRD plots (____) indicates the average critical sRD separating the larvae with good condition, upper area, from the larvae with low condition, lower area.
M.A. Chícharo et al. / Estuarine, Coastal and Shelf Science 112 (2012) 265e279272

M.A. Chícharo et al. / Estuarine, Coastal and Shelf Science 112 (2012) 265e279 273
Engraulis encrasicolus in autumn 2005 and summer 2006. Bothspecies showed higher growth rates and growth performance (Gpf)in late spring/early summer (Tables 6 and 7, Fig.6).
For Sardina pilchardus, higher growth rates were registered inlate spring (0.25 day�1) compared with early spring (0.03e0.04 day�1). Higher growth rate for Engraulis encrasicolus wasregistered in summer (July) compared with autumn (November).Growth performance was lower in March cohorts for S. pilchardus,ranging between 23% and 31%, but in early June, the highest valueswere obtained (100%). A small decrease in growth rates and growthperformance (37e73%) was found with increasing temperatures.The growth performance of E. encrasicolus was lower thanS. pilchardus. E. encrasicolus achieved higher values in summer(July) (46e63%), but low values in autumn (November) rangingfrom 21% to 32%.
The measured growth rate from the cohort analyzed fitted wellwith the estimated growth from the Buckley et al. (2008) model forSardina pilchardus larvae (curve close to x ¼ y), but for Engraulisencrasicolus larvae, some deviation was registered (Fig. 7).
4. Discussion
4.1. Abundance
The present study showed that SPF late larvae are abundant inthe studied system. The fact that they were not been previouslydescribed as users of coastal tidal lagoons was probably due to theinefficiency of the traditional gears used for sampling advancedlarval stages (Chícharo et al., 2009). Postflexion Atherina presbyterlarvae were present almost all year, which agrees with its status asa resident species in this kind of coastal system (Ribeiro et al.,2008). In fact, A. presbyter larvae spawn over an extended periodin Mediterranean climates (Maci and Basset, 2010). The other twoSPF species caught, Engraulis encrasicolus and Sardina pilchardus,are marine migrant species described as using coastal systemsduring juvenile phases. These clupeiformes spawn offshore or nearestuaries, but the initial developmental stages of S. pilchardus in thenortheastern Atlantic (Portuguese coast) seem to avoid the highturbidity and low salinity typical of estuaries and remain in coastalareas during their larval phase (Ré et al., 1990).
According to Nakata et al. (2000), anchovies and sardines havedistinct behavior, while anchovy selected turbid areas, sardinesseem to avoid them. Until recently, the presence of the early lifestages of European sardines was thought to be limited to coastalareas (Ré et al., 1990; Olivar et al., 2003). Their presence wasgenerally considered to be accidental and largely restricted to themouths of coastal systems and estuaries as a result of tidal trans-port of coastal water from adjacent coastal areas (Ré et al., 1990).However, there is now some evidence that changed this perspec-tive because sardine larvae were recently found inside estuaries(Morais et al., 2009, Guadiana estuary; and Ramos et al., 2009, Limaestuary), and coastal lagoons (this study). In fact, this was thespecies most represented during the sampling period and we
Table 5Analyses of covariance for the sRD ratio among seasons for the studied species, conside*p < 0.05, **p < 0.01, ***p < 0.001.
Source of variation S. pilchardus E. encr
df MS F df
Intercept 1 39.96 25.43*** 1SL (mm) 1 10.67 3.03 1Season 3 7.64 8.05*** 3Error 206 0.85 130
hypothesized that the swimming abilities of postflexion larvae andcurrent transport may explain how sardines can enter this systembefore the juvenile phase. Data of Sardina pilchardus swimmingabilities showed that post-flexion larvae between 20 and 25 mmcan achieved a velocity of 10 cm s�1 (M.A. Chícharo, unpublisheddata). Considering swimming abilities of Sparus aurata, also presentin the postflexion phase in the Ria Formosa, which allow them toendure between 20 and 40 h swimming at 12 cm s�1 (Faria et al.,2011a,b). This will allow potentially sardine postflexion larvae toovercome the typical coastal current off the Gulf of Cadiz (Pelizet al., 2007, 2009, 10e20 cm s�1). The temporal variations inabundance of late larvae in the Ria Formosa were the result ofS. pilchardus spawning activity in the coastal area during winter andearly spring, mainly when surface water temperatures range from14 �C to 16 �C (Ré et al., 1990). In the Ria Formosa, the periods ofmaximum postflexion sardine larvae abundance was foundapproximately one month after, namely March/April and June (latewinter/late spring and early summer).
Engraulis encrasicolus spawning occurs mainly in April/May(spring) and a second period may occur in September/October(autumn) (Ré, 1996). This matches the period when late larvae ofanchovy were found in the Ria Formosa, namely one month later,mainly in July, but extending from summer to autumn. This is inaccordance with Drake et al. (2007) who showed anchovy post-larvae in the Guadalquivir estuary (Gulf of Cadiz) had a consistentseasonal pattern of abundance and a high anchovy recruitmentperiod from late May to November, with a main peak in July.E. encrasicolus is described as using estuarine areas with animportant salinity gradient for initial development (Ré, 1996).Nevertheless, in this study, a large number of postlarvae of thisspecies was caught in the Ria Formosa coastal lagoon, where thesalinity gradient is not obvious. Moreover, early larval phases,juveniles and adults of this species were mentioned as rare in thissystem (Chícharo and Teodósio, 1991; Ribeiro et al., 2008). Regu-larization in flow regimes in adjacent estuarine systems, theGuadiana River (Morais et al., 2010) and the Guadalquivir River(Drake et al., 2007), linked to intense damming in the last decade,could have affected the cue for spawning/nursery for this species inthese near estuarine areas.
4.2. Nutritional condition (sRD, diet and FA)
An adequate nutritional environment of the coastal tidal lagoonwas reflected in the three approaches used to access feedingcondition in different time scales: RNA/DNA ratio and gut analysismedium to short-term responses and FA long term effect. Thegenerally good condition measured through the 50th percentile ofsRD with nil or very low starvation percentage of late fish larvaecaught was related to the year-round presence of important foodsources. The rarity of starved larvae, as also shown in other studiesoff the Iberian Peninsula (with Sardina pilchardus, Chícharo et al.,1998a,b, 2003; Díaz et al., 2011; and with Engraulis encrasicolus,Díaz et al., 2008). Higher condition values during late spring and
ring standard length (SL, mm) as covariate, asterisks denote significant differences,
asicolus A. presbyter
MS F df MS F
77.04 20.95*** 1 30.5 25.43***6.11 1.66 1 3.6 3.03
44.92 12.21*** 3 9.66 8.05***3.68 76 1.2

Fig. 5. Observed nucleic acid ratio (RNA:DNA, log transformed) in relation to standard larval length (circles) with the estimated 10th (lower dash line), 50th (middle solid line) and90th (upper dash line) percentiles for all species.
M.A. Chícharo et al. / Estuarine, Coastal and Shelf Science 112 (2012) 265e279274
early summer coincided with major planktonic availability in thissystem. Plankton in the inner lagoon locations exhibited unimodalannual cycles with summer peaks, coupled to temperature andlight availability (Barbosa, 2010). The correlation results of larvalcondition (sDR) also reflect this close link with planktonic
production, due to the significant and positive coefficients obtainedwith water temperature for all species and chlorophyll, especiallyfor clupeids.
In many areas, the diets of several larval fish species have beendescribed as being copepod-based, shifting from copepod eggs and

Table 6Sardina pilchardus weight-specific growth coefficients (SGR) based on cohort analysis (cohorts sampled during 1e6 weeks with a light trap) and growth performance(Gpf ¼ SGR/Gref) and reference growth rate (Gref ¼ 0.0106 � T � 0.0203), T e water temperature, Houde and Zastrow (1993).
Cohort Appearancedate
Average temperatureduring cohort sampling
Average SL mmof cohort
Growth ratemm day�1
SGR(day�1)
Gref (Houde andZastrow, 1993)
Gpf ¼ SGR/Gref
(Buckley et al., 2008)
C1 07-03-2006 14.00 24.22 0.30 0.04 0.129 31%C2 08-03-2006 14.00 26.13 0.29 0.03 0.128 23%C3 10-03-2006 14.41 24.15 0.42 0.04 0.132 28%C4 11-03-2006 14.00 29.11 0.30 0.03 0.128 24%C1 19-06-2006 23.60 13.84 0.91 0.23 0.23 100%C2 19-06-2006 26.20 15.33 0.75 0.25 0.26 97%C3 02-07-2006 26.59 18.52 0.74 0.19 0.26 73%C4 03-07-2006 27.45 23.61 0.60 0.10 0.27 37%
M.A. Chícharo et al. / Estuarine, Coastal and Shelf Science 112 (2012) 265e279 275
nauplii to copepodites and adults as the larvae grow (Govoni et al.,1983). Few studies have dealt with the diet of SPF larvae off IberianPeninsula (Conway et al., 1999; Morote et al., 2010), but thosestudies were mainly focused on preflexion and flexion larvae.Information about postflexion gut contents for SPF is limited toa peri-estuarine region of the Gulf of Fos (near the Rhone Riverdelta), where these larvae were described as being exclusivelyphytoplanktophagous (Rasoanarivo et al., 1991) and to the Canta-brian Sea, where the major prey items were the early develop-mental stages of copepods (Munuera and Gonzaléz Quiros, 2006).Our results, based on early summer sampling, show a more diversediet, with phytoplankton items present in all SPF species. Crusta-cean preywas also common to all species, but Atherina presbyter fedmainly on molluscan larvae. This latter observation could also berelated to the shells being more difficult to digest, compared withother types of prey, but Sprung (1994) and Chícharo and Chícharo(2000) showed that maximum densities of gastropod and bivalvelarvae are registered in this coastal lagoon between May and June,with up to 10,000 larvae per cubic meter. Oikopleura spp. (Appen-dicularia) dominated the diet of Engraulis encrasicolus, and Podonspp. dominated the guts of Sardina pilchardus postflexion larvae.According to Marques (2006), higher abundance of these taxa areregistered in June, with densities of 754 m�3 for Oikopleura and318 m�3 for Podon. Protozoa, like tintinnids, were also present inthe guts of post-flexion sardine larvae and, based on the previousstudy, the densities of Tintinnopsis can reach 100,021 m�3, also inJune. Important diet overlapping occurred only between the clu-peiformes species and, according to the result of the SchoenerIndices, was mainly due to crustacean items, like nauplii. Never-theless, as the co-occurrence of clupeiformes is limited to a shortperiod in early summer, this probably is not an important factoraffecting survival in this area. Moreover according to Sprung (1994)crustacean nauplii dominate the zooplankton in this systems, with60e90% of the total biomass. The results of FA also confirm a cleartendency toward a mixed diet of phytoplankton and zooplankton.Similar higher proportions of PUFAs compared with other FAs ob-tained in this study were also found by Costalago et al. (2011) foranchovies in the Catalan Sea. The higher importance of phyto-plankton and the accumulation of these FA with age in anchovylarvae can explain this result (Rossi et al., 2006). Although the valueof the C16/C18 index corroborates the use of diatoms as food items,
Table 7Engraulis encrasicolusweight-specific growth rates (SGR) based on cohort analysis (cohortGref) and reference growth rate (Gref ¼ 0.0106 � T � 0.0203), T e water temperature, Ho
Cohort Appearancedate
Average temperatureduring cohort sampling
Average SL mmof cohort
C1 30-10-2005 22.3 24.3C2 01-11-2005 21 34.7C3 01-11-2005 21 36C1 19-06-2006 24.43 17C2 19-06-2006 24.43 16.5C3 05-07-2006 26.59 24.4
the indices 18:1(u � 9)/18:1(u � 7) and PUFA/SFA indicated animportant degree of carnivory in studied larvae (Auel et al., 2002).
The reduced variability in Atherina presbyter size, the full gutsand good condition, measured through sRD, compared with theclupeiformes, may be related with different life traits, such as thedifferent gut morphologies. In fact, fish larvae with long andstraight guts (such as the clupeiformes) regurgitate and defecateduring sampling, which does not occur with the folded gut ofAtherina. This aspect could have influenced the results, despite oursampling method being less invasive than the standard tow net forichthyoplankton (Chícharo et al., 2009). Another aspect that maycontribute to explain our results is the resident status of A. presbyterin this type of system (Palmer and Culley, 1984; Moreno et al.,2005), particularly the bentonic eggs and highly developed larvae(l6.5e7.2 mm SL, eyes pigmented and mouth formed) it produces,relative to the larvae of migrating species, like the clupeiformes.The sRD results show that they may grow more slowly than clu-peiformes, but they are more resistant to starvation. In this situa-tion and according to Houde and Zastrow (1993), clupeiformes canbe expected to be more vulnerable to predation and starvation thanatherinids because they hatch from pelagic eggs and with poordeveloped larvae (3e4 mm SL, eyes not pigmented and mouthclose, Ré, 1999). This higher predation risk may select for highergrowth rates at the expense of acquiring fat reserves that wouldsustain larvae during periods of food shortages (Folkvord et al.,2009).
4.3. Growth rate
The decrease in variability and a stabilization toward a certainvalue of sRD 90th and 50th percentiles with size agree with Pepinet al. (1999); the smallest individuals have condition distributionsrelatively close to maximum values. A pattern of decreasing sRDwith fish length was observed by Garcia et al. (2005) and Fonsecaet al. (2006) for Sardina post-larvae and soles juveniles, respec-tively. The authors explained this pattern by the natural reductionof growth rate toward the adult phase. The decrease in nucleic acidconcentration during development was also indicated by Buckleyand Bulow (1987). According to Mathers et al. (1994), this isrelated to a switch from a higher proportion of hyperplasia in smallfish to a higher fraction of hypertrophy in larger fish.
s sampled during 1e6 weeks with a light trap) and growth performance (Gpf ¼ SGR/ude and Zastrow (1993).
Growth ratemm day�1
SGR(day�1)
Gref (Houde andZastrow, 1993)
Gpf ¼ SGR/Gref
(Buckley et al., 2008)
0.65 0.07 0.216 32%0.7 0.064 0.202 32%0.7 0.043 0.202 21%0.66 0.14 0.239 59%0.66 0.15 0.239 63%0.46 0.127 0.262 49%

Fig. 6. Changes in modal length (derived from length frequency histogram) of larval cohorts from summer 2006. Typical example showing data and cohorts structure for a) Sardinapilchardus and b) Engraulis encrasicolus.
M.A. Chícharo et al. / Estuarine, Coastal and Shelf Science 112 (2012) 265e279276
Higher cohort growth rates for sardines larvae were obtainedinside the studied coastal lagoon (0.3e0.9 mm day�1 14e27 �C)compared to individual growth rate of post larvae obtained inopen sea, namely in Alborán Sea (Garcia et al., 2005, 14e19.7 �C0.49e0.59 mm day�1) or in North Coast of Portugal (Ré, 1984,0.41e0.59 mm day�1). The higher average temperatures andplanktonic availability of the Ria Formosa may contribute toexplain this result. This effect was not so obvious for anchovies
because the growth rate measured in the Alborán Sea was 0.4e0.6 mm day�1, with water temperatures between 18.4 and18.7 �C, while in our study the cohort growth ranged between 0.4and 0.7 mm day�1, but in much higher water temperatures (23e27 �C). In fact higher daily growth rates have been found byother authors (e.g., Palomera et al., 1988, 0.9e1 mm day�1, Dul�ci�c,1997, 0.9 mm day�1) in the North Mediterranean sea with similarwater temperatures.

Fig. 7. The measured growth rate from cohorts analyzed in relation to the estimated growth from the Buckley et al. (2008) model for Sardina pilchardus and for Engraulis encrasicoluslarvae. The equations expressed the fit to the linear model and to a non linear model.
M.A. Chícharo et al. / Estuarine, Coastal and Shelf Science 112 (2012) 265e279 277
If, for a certain life stage, the relationship between sRD,temperature and growth is fixed, then if growth decreases with sizeand age, it follows that the sRD ratio would also have to decreasewith size/age. It is very important not to directly compare values ofindividuals with very different ages because the late larvae studieddecrease their sRD and growth rates with age.
The growth performance and SGRs were higher in late springand summer, which can be explained by higher temperature andfood availability during this period in the coastal lagoon. Costalagoet al. (2011) also found higher growth rates for summer Engraulisencrasicolus larvae, compared with autumn/winter, and explainedthis by the temperature differences in the two seasons.E. encrasicolus postlarvae in the Ria Formosa exhibited extremevariations in sRD values, growth rate and growth performance,indicating that at least some individuals were not in good condi-tion. In addition, the starvation percentage was the highest (2e8%)compared with 0% for Atherina presbyter, a resident species, orSardina pilchardus, a migrant species in the system.
The lower correlation between sRD measured and estimatedby the Buckley et al. (2008) model for the Engraulis encrasicolus
late larvae can be related to the unavoidable errors associatedwith measuring field growth rates. Nevertheless, the closeness ofresults obtained from in situ growth rates and growth ratesderived from the same model for Sardina pilchardus cannotsupport this argument. The fact that E. encrasicolus was devel-oping in higher (between 22 �C and 28 �C) included the upperlimit of the model used, could explained this result. Somaticgrowth rate results, mainly from the balance between proteinsynthesis and degradation and hyperoptimal temperatures,would accelerate both components, especially degradation,resulting in no somatic growth (Mathers et al., 1994). In fact,a small decrease in growth rates and growth performance (37e73%) was found toward increasing temperatures because thegrowth efficiencies declined (Houde, 1989; Houde and Zastrow,1993). The effects of temperature on larval fish growth haveoften been studied in controlled environments, but field experi-ments also reported a dome-shaped relationship betweengrowth and temperature (Buckley et al., 2004) and the potentialimpact of reduced growth at suboptimal temperatures may besignificant.

M.A. Chícharo et al. / Estuarine, Coastal and Shelf Science 112 (2012) 265e279278
4.4. Conclusions
The results showed that the presence of SPF larvae in tidaltemperate coastal lagoons is not accidental, with consistently highabundances during certain seasons and with individuals exhibitinggood nutritional condition and growth rate. Our findings alsoshowed that the non resident species of clupeids migrate into thesystems during the postflexion larval stage and not only during thejuvenile phase. The sub-optimal growth rate of Engraulis encrasi-colus larvae reinforce the need of monitoring condition of theadvanced larval phases of this species, which are very close torecruitment and, therefore, with important consequences for theadult stock. Our results are especially relevant in an ecologicalcontext, where the increasing mean water temperatures andanthropogenic pressures, such as changes in freshwater inflows,could change habitat quality with consequences to larval devel-opment of SPF. These findings should be taken into considerationby environmental managers of these tidal coastal ecotones, becauseuntil now they were not described as important nursery areas forthe clupeid species analyzed.
Acknowledgment
Funding was provided by FCT (Fundação para a Ciência e a Tec-nologia) under the framework of the program Pest/CIMAR, to theproject ‘Nutritional condition of fish larvae in major marineprotected areas in the south of Portugal (Guadiana estuary andRia Formosa)’ GUADIRIA (POCI/BIA-BDE/59200/2004) and to theproject MODELA (PTDC/MAR/098643/2008). The authors wouldlike to acknowledge two anonymous reviewers that provided veryvaluable suggestions on an earlier version of this manuscript.
References
Auel, H., Harjes, M., Rocha, R., da Stübing, D., Hagen, W., 2002. Lipid biomarkersindicate different ecological niches and trophic relationships of the Arctichyperiid amphipods Themisto abyssorum and T. libellula. Polar Biology 25, 374e383.
Barbosa, A.B., 2010. Seasonal and interannual variability of planktonic microbes ina mesotidal coastal lagoon (Ria Formosa, SE Portugal): impact of climaticchanges and local-human influences. In: Paerl, H., Kennish, M. (Eds.), CoastalLagoons: Critical Habitats of Environmental Change. CRC Press, Boca Raton, FL,ISBN 978-1-4200-8830-4, pp. 335e366.
Bhattacharya, G.K., 1967. A simple method of resolution of a distribution intoGaussian components. Biometrics 23 (1), 115e135.
Boero, F., Belmonte, G., Bussotti, S., Fanelli, G., Fraschetti, S., Giangrande, A.,Gravili, C., Guidetti, P., Stefano, P., Fernando, P., Orestina, R., Saracino, D.,Schmich, J., Terlizzi, A., Geraci, S., 2004. From biodiversity and ecosystemfunctioning to the roots of ecological complexity. Ecological Complexity 1, 101e109.
Buckley, L.J., Bulow, F.J., 1987. Techniques for estimation of RNA, DNA, and protein infish. In: Summerfelt, R.C., Hall, G.E. (Eds.), Age and Growth of Fish. Iowa StateUniversity Press, Ames, IA, pp. 345e354.
Buckley, L.J., Caldarone, E.M., Lough, R.G., 2004. Optimum temperature and food-limited growth of larval Atlantic cod (Gadus morhua) and haddock (Melanog-rammus aeglefinus) on Georges Bank. Fisheries Oceanography 13, 134e140.
Buckley, L.J., Caldarone, E.M., Clemmesen, C., 2008. Multi-species larval fish growthmodel based on temperature and fluorometrically derived RNA/DNA ratios:results from a meta-analysis. Marine Ecology Progress Series 371, 221e232.
Caldarone, E.M., Wagner, M., St. Onge-Burns, J., Buckley, L.J., 2001. Protocol andguide for estimating nucleic acids in larval fish using a fluorescence microplatereader. Northeast Fisheries Science Center, Ref. Doc. 01-11; 22 pp. Availablefrom: National Marine Fisheries Service, 166 Water Street, Woods Hole, MA02543e1026.
Caldarone, E.M., Clemmesen, C.M., Berdalet, E., Miller, T., Folkvord, A., Holt, G.J.,Olivar, M.P., Suthers, I.M., 2006. Inter-calibration of four spectro-fluorometricprotocols for measuring RNA/DNA ratios in larval and juvenile fish.Limnology Oceanography Methods 4, 153e163.
Chícharo, L., Teodósio, M.A., 1991. Caracterização Geral do Ictioplâncton da RiaFormosa. Revista Biologia Universidae de Aveiro 4, 287e300.
Chícharo, M.A., Chícharo, L., Valdes, L., López-Jamar, E., Ré, P., 1998a. Estimation ofstarvation and diel variation of the RNA/DNA ratios in field-caught Sardinapilchardus larvae off the north of Spain. Marine Ecology Progress Series 164,273e283.
Chícharo, M.A., Chícharo, L., Valdes, L., López-Jamar, E., Ré, P., 1998b. Does thenutritional condition limit survival potential of sardine Sardina pilchardus(Walbaum, 1792) larvae off the north coast of Spain? RNA/DNA ratios and theirvariability. Fisheries Research 39, 43e54.
Chícharo, L., Chícharo, M.A., 2000. Estimation of life history parameters of Mytilusgalloprovincialis (Lamarck) larvae in a coastal lagoon (Ria Formosa e SouthPortugal). Journal of Experimental Marine Biology and Ecology 243, 81e94.
Chícharo, L., Chícharo, M.A., 2001a. Effects of environmental conditions on plank-tonic abundances, benthic recruitment and growth rates of Ruditapes decussatusin a coastal lagoon. Fisheries Research 53, 235e250.
Chícharo, L., Chícharo, M.A., Alves, F., Amaral, A., Pereira, A., Regala, J., 2001b. Dielvariation of the RNA/DNA ratios in Crassostrea angulata (Lamarck) and Rudi-tapes decussatus (Linnaeus 1758) (Mollusca, Bivalvia). Journal of ExperimentalMarine Biology and Ecology 259, 121e129.
Chícharo, M.A., Esteves, E., Santos, A.M.P., Dos Santos, A., Peliz, A., Ré, P., 2003. Aresardine larvae caught off northern Portugal in winter starving? An approachexamining nutritional conditions. Marine Ecology Progress Series 257, 303e309.
Chícharo, M.A., Faria, A., Morais, P., Amaral, A., Chícharo, L., 2009. How to samplelarval fish for taxonomical and ecophysiological studies in shallower temperatecoastal ecosystems? Cahiers de Biologie Marine 50, 79e89.
Cohen, Z., Vonshak, A., Richmond, A., 1988. Effect of environmental conditions onfatty acid composition of the red alga Porphyridium cruentum: correlation togrowth rate. Journal of Phycology 24, 328e332.
Conway, D., Coombs, S., Smith, C., 1999. Feeding of anchovy Engraulis encrasicoluslarvae in the northwestern Adriatic Sea in response to changing hydrobiologicalconditions. Marine Ecology Progress Series 175, 35e49.
Costalago, D., Tecchio, S., Palomera, I., Alvarez-Calleja, I., Ospina-Alvarez, A.,Raicevich, S., 2011. Ecological understanding for fishery management: conditionand growth of anchovy late larvae during different seasons in the NorthwesternMediterranean. Estuarine, Coastal and Shelf Science 93, 350e358.
Díaz, E., Txurruka, J.M., Villate, F., 2008. Modeling the biochemical composition anddetermining the condition in anchovy larvae (Engraulis encrasicolus) duringgrowth. Marine Ecology Progress Series 361, 227e238.
Díaz, E., Txurruka, J.M., Villate, F., 2011. Growth maximization in early sardinelarvae: a metabolic approach. Marine Biology 158, 1135e1148.
Drake, P., Borla, A., González-Ortegoón, E., Baldó, F., Vilas, C., Fernández-Delgado, C.,2007. Spatio-temporal distribution of early life stages of the European anchovyEngraulis encrasicolus L. within a European temperate estuary with regulatedfreshwater inflow: effects of environmental variables. Journal of Fish Biology 70,1689e1709.
Dul�ci�c, J., 1997. Growth of anchovy, Engraulis encrasicolus (L.), larvae in theNorthern Adriatic Sea. Fisheries Research 31 (3), 189e195.
Elliott, M., Hemingway, K.L. (Eds.), 2002. Fishes in Estuaries. Blackwell Science,Oxford, p. 636.
Esteves, E., Chícharo, M.A., Pina, T., Coelho, M.L., Andrade, J.P., 2000. Comparison ofRNA/DNA ratios obtained with two methods for nucleic acid quantification ingobiid larvae. Journal of Experimental Marine Biology and Ecology 243, 81e94.
Faria, A.M., Chícharo, M.A., Gonçalves, E., 2011a. Effect of starvation on swimmingperformance and body condition of pre-settlement Sparus aurata larvae.Aquatic Biology 12, 281e289.
Faria, A.M., Muha, T., Morote, E., Chícharo, M.A., 2011b. Influence of starvation onthe critical swimming behaviour of the Senegalese sole (Solea senegalensis) andits relationship with RNA/DNA ratios during ontogeny. Scientia Marina 75, 87e94.
Folkvord, A., Fiksen, Ø., Høie, H., Johannessen, A., Otterlei, E., Vollset, W.K., 2009.What can size distributions within cohorts tell us about ecological processes infish larvae? Scientia Marina 73 (S1), 119e130.
Fonseca, V., Vinagre, F.C., Cabral, H.N., 2006. Growth variability of juvenile solesSolea solea and Solea senegalensis, and comparison with RNA: DNA ratios in theTagus estuary, Portugal. Journal of Fish Biology 68, 1551e1562.
Garcia, A., Cortez, D., Ramirez, T., 2005. Records of environmental variationobserved on otolith microstructure and nutritional condition of mediterraneanlarval sardine and anchovy. Thalassas 21 (2), 39e53.
Garrido, S., Ben-Hamadou, R., Oliveira, P.B., Cunha, M.E., Chícharo, M.A., van derLingen, C.D., 2008. Diet and feeding intensity of sardine Sardina pilchardus:correlation with satellite-derived chlorophyll data. Marine Ecology ProgressSeries 354, 245e256.
Gayanilo, F.C., Sohriano, M., Pauly, D., 1988. A Draft Guide to the Complete Elefan(ICLARM Software, 2). International Center for Living Aquatic ResourcesManagement, Manila, Philippines.
Govoni, J.J., Hoss, D.E., Chester, A.J., 1983. Comparative feeding of three species oflarval fishes in the northern Gulf of Mexico: Brevoortia patronus, Leiostomusxanthurus, and Micropogonias undulates. Marine Ecology Progress Series 13,189e199.
Houde, E.D., 1989. Comparative growth, mortality, and energetics of marine fishlarvae: temperature and implied latitudinal effects. Fisheries Bulletin 87, 471e495.
Houde, E.D., Zastrow, C.E., 1993. Ecosystem and taxon-specific dynamic and ener-getics properties of larval fish assemblages. Bulletin Marine Science 53, 290e335.
Leggett, W.C., DeBlois, E., 1994. Recruitment in marine fishes is regulated by star-vation and predation in the egg and larval stages? Netherlands Journal of SeaResearch 32, 1e19.
Lepage, G., Roy, C.C., 1986. Direct transesterification of all classes of lipids in one-step reaction. The Journal of Lipid Research 27, 114e119.

M.A. Chícharo et al. / Estuarine, Coastal and Shelf Science 112 (2012) 265e279 279
López-Sanz, A., Stelzenmüller, V., Maynou, F., Sabatés, A., 2011. The influence ofenvironmental characteristics on fish larvae spatial patterns related to a marineprotected area: the Medes islands (NW Mediterranean). Estuarine, Coastal andShelf Science 92, 521e533.
Maci, S., Basset, A., 2010. Spatio-temporal patterns of abundance, size structure andbody condition of Atherina boyeri (Pisces: Atherinidae) in a small non-tidalMediterranean lagoon. Estuarine Coastal and Shelf Science 87, 125e134.
Marques, A., 2006. Mesozooplankton communities in the Ria Formosa lagoon. PhDthesis, University of Bangor, Bangor, United Kingdom.
Mathers, E.M., Houlihan, D.F., Burren, L.J., 1994. RNA, DNA and protein concentra-tions in fed and starved herring Clupea harengus larvae. Marine EcologyProgress Series 107, 223e231.
Meyer, S., Caldarone, E., Chícharo, M.A., Clemmesen, C., Faria, A., Folkvord, A.,Holt, G., Høie, H., Malzahn, A., Moran, D., Petereit, C., Støttrup, J., Peck, M., 2012.On the edge of death: rates of decline and lower thresholds of biochemicalcondition food-deprived marine fish larvae and juveniles. Journal of MarineSystems 93, 11e24.
Morais, P., Faria, A., Chícharo, M.A., Chícharo, L., 2009. The unexpected occurrence oflate Sardina pilchardus (Walbaum, 1792) (Osteichthyes: Clupeidae) larvae ina temperate estuary. Cahiers de Biologie Marine 50, 79e89.
Morais, P., Babaluk, J., Correia, A.T., Chícharo, M.A., Campbell, J.L., Chícharo, L., 2010.Diversity of anchovy migration patterns in a European temperate estuary and inits adjacent coastal area: implications for fishery management. Journal of SeaResearch 64, 295e303.
Moreno, T., Castro, J., Socorro, J., 2005. Reproductive biology of the sand smeltAtherina presbyter Cuvier, 1829 (Pisces: Atherinidae) in the central-east Atlantic.Fisheries Research 72, 121e131.
Morote, E., Olivar, M.P., Villate, F., Uriarte, I., 2010. A comparison of anchovy(Engraulis encrasicolus) and sardine (Sardina pilchardus) larvae feeding in theNorthwest Mediterranean: influence of prey availability and ontogeny. ICESJournal of Marine Science 67, 897e908.
Munera Fernández, I., González-Quirós, R., 2006. Analysis of feeding sardina pil-chardus (Walbaum, 1792) larval stages in the central Cantabrian Sea. ScientiaMarina 70S1, 131e139.
Nakata, H., Funakoshi, S., Nakamura, M., 2000. Alternating dominance of postlarvalsardine and anchovy caught by coastal fishery in relation to the Kuroshiomeander in the Enshu-nada Sea. Fisheries Oceanography 9 (3), 248e258.
Olivar, M.P., Catalán, I., Emelianov, M., Fernández de Puelles, M.L., 2003. Early stagesof Sardina pilchardus and environmental anomalies in the NorthwesternMediterranean. Estuarine, Coastal and Shelf Science 56, 609e619.
Olivar, P., Diáz, E., Chícharo, M.A., 2009. Tissue effect on RNA: DNA ratios of marinefish larvae. Scientia Marina 73, 171e182.
Palmer, C.J., Culley, M.B., 1984. The egg and early life stages of the sandsmelt,Atherina presbyter Cuvier. Journal of Fish Biology 24, 537e544.
Palomera, I., Morales-Nin, B.M., Lleonart, J., 1988. Larval growth of anchovy,Engraulis encrasicolus, in the Western Mediterranean Sea. Marine Biology 94,283e291.
Peliz, A., Dubert, J., Marchesiello, P., Teles-Machado, A., 2007. Surface circulation inthe Gulf of Cadiz: model and mean flow structure. Journal of GeophysicalResearch 112, C11015.
Peliz, A., Marchesiello, P., Santos, A.M.P., Dubert, J., Teles-Machado, A., Marta-Almeida, M., Le Cann, B., 2009. Surface circulation in the Gulf of Cadiz: 2.Infloweoutflow coupling and the Gulf of Cadiz slope current. Journal ofGeophysical Research 114, C03011.
Pepin,P., Evans,G.T., Shears, T.H.,1999.PatternsofRNA/DNAratios in larvalfishand theirrelationship to survival in the field. ICES Journal of Marine Science 56, 697e706.
Peters, R.H., Downing, J.A., 1984. Empirical analysis of zooplankton filtering andfeeding rates. Limnology and Oceanography 29, 763e784.
Pinkas, L., Oliphant, M.S., Iverson, L.K., 1971. Foods habits of albacore, blue fin tuna,and bonito in California waters. Fishery Bulletin 152, 1e105.
Ramos, S., Ré, P., Bordalo, A.A., 2009. New insights into the early life ecology ofSardina pilchardus (Walbaum, 1792) in the northern Iberian Atlantic. ScientiaMarina 73, 449e459.
Ré, P., 1984. Evidence of daily and hourly growth in pilchard larvae based on otolithgrowth increments, Sardina pilchardus (Walbaum, 1792). Cybium 8 (1), 33e38.
Ré, P., 1996. Anchovy spawning in the Mira estuary (southwestern Portugal). Sci-entia Marina 60, 141e153.
Ré, P., 1999. Ictioplâncton estuarino da Península Ibérica. Guia de identificação dosovos e estados larvares planctónicos. Câmara Municipal de Cascais, Cascais,Portugal.
Ré, P., Cabral e Silva, R., Cunha, E., Farinha, A., Meneses, I., Moita, T., 1990. Sardinespawning off Portugal. Boletim do Instituto Nacional de Investigação das Pescas15, 31e34.
Ribeiro, J., Monteiro, C.C., Monteiro, P., Bentes, L., Coelho, R., Gonçalves, J.M.S.,Lino, P.G., Erzini, K., 2008. Long-term changes in fish communities of the RiaFormosa coastal lagoon (southern Portugal) based on two studies made 20years apart. Estuarine, Coastal and Shelf Science 76, 57e68.
Rasoanarivo, R., Folack, J., Champalbert, G., Becker, B., 1991. Relations entre lescommunautes phytoplanctoniques et l’alimentation des larves de Sardina pil-chardus Walb. dans le golfe de Fos (Mediterranèe occidentale): influence de lalumiére sur l’activité alimentaire des larves. Journal of Experimental MarineBiology and Ecology 151, 83e92.
Rossi, S., Sabates, A., Latasa, M., Reyes, E., 2006. Lipid biomarkers and trophiclinkages between phytoplankton, zooplankton and anchovy (Engraulis encrasi-colus) larvae in the NW Mediterranean. Journal of Plankton Research 28, 1e12.
Santos, A.M.P., Chícharo, M.A., Dos Santos, A., Moita, T., Oliveira, P.B., Peliz, Á., Ré, P.,2007. Physicalebiological interactions in the life history of small pelagic fish inthe Western Iberia Upwelling Ecosystem. Progress in Oceanography 74 (2e3),192e209.
Schoener, T.W., 1970. Nonsynchronous spatial overlap of lizards in patchy habitats.Ecology 51, 408e418.
Snedecor, G., Cochran, W., 1989. Statistical Methods. Iowa State University Press,Ames, IA.
Somarakis, S., Nikolioudakis, N., 2010. What makes a late anchovy larva? Thedevelopment of the caudal fin seen as a milestone in fish ontogeny. Journal ofPlankton Research 32, 317e326.
Sprung, 1994. High larval abundances in the Ria Formosa (Southern Portugal)-methodological or local effect? Journal of Plankton Research 16 (2), 151e160.
St. John, M., Lund, T., 1996. Lipid biomarkers: linking the utilization of frontalplankton biomass to enhanced condition of juvenile North Sea cod. MarineEcology Progress Series 131, 75e85.
Tugores, M.P., Iglesias, M., Dıaz, N., Oãate, D., Miquel, J., Giráldez, A., 2010. Lat-itudinal and interannual distribution of the European anchovy (Engraulisencrasicolus) and sardine (Sardina pilchardus) in the Western Mediterranean,and sampling uncertainty in abundance estimates. ICES Journal of MarineScience 67, 1574e1586.
Wasserman, R.J., Strydom, N.A., 2011. The importance of estuary head waters asnursery areas for young estuary- and marine-spawned fishes in temperateSouth Africa. Estuarine, Coastal and Shelf Science 94, 56e67.
Woodland, R.J., Secor, D.H., Fabrizio, M.C., Wilberg, M.J., 2012. Comparing thenursery role of inner continental shelf and estuarine habitats for temperatemarine fishes. Estuarine, Coastal and Shelf Science 99 (1), 61e73.