Embed Size (px)
Citation preview


1
Contents
2 Company Information
2 Branch Network
3 Directors’ Review Report
5 Financial Statements
6 Balance Sheet
7 Profi t and Loss Account
8 Statement of Comprehensive Income
9 Cash Flow Statement
11 Statement of Changes in Equity
12 Notes to the Financial Statements
19 Consolidated Financial Statements
20 Consolidated Balance Sheet
21 Consolidated Profi t and Loss Account
22 Consolidated Statement of Comprehensive Income
23 Consolidated Cash Flow Statement
25 Consolidated Statement of Changes in Equity
26 Notes to the Consolidated Financial Statements

2
Trust Investment Bank Limited
Company Information
Board of DirectorsMr. Asif Kamal ChairmanMr. Humayun Nabi Jan DirectorSyed Sajjad Hussain Rizvi DirectorMr. Mamoon-ur-Rashid Qureshi DirectorMr. Ahsan Rafique Chief Executive Officer
Financial Controller & Company Secretary RegistrarsMakhdoom Faisal Javed Vision Consulting Limited 1st Floor, 3-C, LDA Flats, Lawrence Road, Lahore. Tel: 042-36375531 & 36375339 Fax: 042-36374839
Auditors Registered Office & Head OfficeZahid Jamil & Company 6th Floor, M.M. Tower, 28-A/K, Gulberg-II, Lahore. Chartered Accountants Tel: 042-35817601-05 Fax: 042-35817600 Email: [email protected] Website: www.trustbank.com.pk
Legal advisorChaudhry Mahmood Ur Rehman
Branch Network
1. Faisalabad Branch 1st Floor, 16-Chenab Market Near UBL, Main Susan Road, Faisalabad. Tel: 041-8503306, Fax: 041-8737431
2. Multan Branch Office No. 6, Ist Floor, Muhammad Arcade, LMQ Road, Chungi-9, Multan Tel: 061-6210063, Fax: 061-6210063
3. Islamabad Branch Suit No.306, 3rd Floor, ISE Tower, Jinnah Avenue, Blue Area, Islamabad Tel: 051-2894562, Fax: 051-2894561
4. Karachi Branch KASB Fund Section, 5th Floor, Trade Center, Opp. Saima Trade Tower, I.I. Chundigar Road,Karachi. Tel: 021-111-222-000, Fax: 021-32624635

3
DIRECTORS’ REPORT
On behalf of the Board of Directors, I am pleased to present consolidated interim financial statement for the three month period ended September 30, 2013.
Economic Review In macro scenario, Pakistan in fiscal year 2012-13 started with continuous problems of power and gas shortages along with other internal and external challenges. The energy crisis deepened presenting paradoxical situation. While generating capacity is reported 20,000 MW, actual generation remains far below the demand resulting in nationwide long hours load shedding. The circular debt kept on increasing despite injections of the government, which built pressure on the fiscal side. Similarly, the working of Public Sector Enterprises also deteriorated resulting in further supplementing the burden on the budget. The adverse impact of these economic difficulties was further compounded by the ongoing war against extremism which continued unabated and not only on one hand caused irreparable loss to the economy but wiped out mental peace and harmony among the masses of the country. Karachi is the main hub of the economic activities, faced the series of attacks as well as similar incidence occurred in Punjab, Khyber Pakhtoon Khawa and Balochistan. In retaliation to these attacks and terrorist activities long and big sit down stage protests took place which sent a bad signal to the outside world about the insecurity prevailing in the country. An investment which is the mirror image of the economy nosedived to 14.2% if to compare with 2008 when it was hovering around 19.21 % (based on year 2005-06). The resilience of the economy was tested several times by one crisis than others. The financial global meltdown in 2008 which shocked the developed and developing economies of the world and its effects are still being felt, Pakistan in no exception to feel the heat. The GDP growth which was at 5.0 % in 2007-08 dropped to 0.4% in 2008-09 (base 2005-06). The inflation reached to highest level of 25 percent in October 2008. There was unprecedented surge in oil and commodity prices. In addition the behavior of natural climate during 2010 and 2011 further added to the overall economic suffering. The economy on average grew since
In micro scenario, the NBFC sector remained ignored by the associated financial institution for last five years. The credit lending to NBFC sector was in “virtual halt mode” during the period under review and Trust Bank faced severe liquidity squeeze due to the overall economic situation as well further deterioration of its credit rating. The NBFC sector remained under tremendous pressure, suffering from lack of resource through credit lines as well as generation of deposits and negative perception of the NBFC sector. Due to non availability of credit lines, freezing of treasury loans from commercial banks, Trust Bank has been focusing on reducing its balance sheet by making recovery of assets & settling liabilities and doing non fund base activities to remain afloat. Due to challenging economic environment, the profit margins of the business enterprises have been squeezed and thus severely compromised the ability of borrowers to meet the repayments.
Financial ResultsThe financial results for the year ended September 30, 2013 in comparison with September 30, 2012 are as follows:
September 30, 2013 September 30, 2012 (Rupees in millions)
Revenue 13.089 39.380Operating Expenses (20.412) (35.497)Financial Expenses (1.245) (110.779)Other net operating income 6.437 2.232Profit/ (loss) before provision & taxation (2.130) (104.664)Provision (Reversal of Provision) - -Profit/ (loss) after provision & taxation (2.130) (104.664)Earnings/ (loss) per Share (Rs.) (0.04) (1.98)
As stated earlier the business conditions in the country are not conducive for overall business and especially for the NBFC sector.
During the period under review due to liquidity constraints, the Bank has not been able to generate new business in accordance with the projections, resultantly balance sheet and spreads have been squeezed. The revenue of the Bank is decreased substantially as compared to the corresponding period which represents the impact of decrease in lease portfolio. Another reason for lower income is the fact that almost the entire lease portfolio has completed its term and amount of recovery being made against stuck up portfolio to the larger extent more of principal repayment and very small interest

4
Trust Investment Bank Limited
income. The slackened business conditions hampered the recovery of the Bank which resulted in a squeeze of liquidity; hence, the Bank was not able to do business.
The Finance Cost has been reduced substantially in the light of the Management decision that no interest payment on its liabilities till the operations of the Bank strengthened to sustain its operations cost and meets all the agreed amount of principal of liabilities. Non-performing loans continue to be the major challenge for the Banking industry and Trust Bank have no exception to this. Due to NPLs the Bank faced liquidity crises, hence, the Bank could not generate new business and secondly Bank could not meet its liabilities, so, NPLs are also accounted for high financial cost. During the period the management tried to control the administrative and operating expenses of the Bank.
Future OutlookThe economy of the country will remain under stress till proposed election in the year 2013. Lack of foreign inflows and continued utilization of available funds under poor governance tend to dissolve the confidence of investors. In order to control the catastrophic economic situation, the government must take coercive measures in order to provide a concrete solution to the anticipated energy crises on priority. The government should also involve all stakeholders to take decisive action for the restructuring of public sector institutions, transparency and good governance in the public sector and broadening of its revenue collection, regaining investor confidence and balanced fiscal & monetary policies.
The future outlook and earning of the NBFCs sector is mainly dependent on availability of credit facilities on soft terms from financial institutions and economic development in the country. Due to non availability/freezing of treasury loans from commercial banks, the Trust Bank will continue to focus on investment in security and quality assets. The Bank also intends to focus on Investment Finance Services receivable financing, advisory services and non-fund based income. The management anticipates a continuation of a competitive and challenging work environment in the wake of subdued economic condition and will try its level best to take all necessary measures to improve the earning capacity of the Bank. In a demonstration of strong commitment to the institution, sponsoring shareholders of the Bank have developed support plan, also duly endorsed by the Board, which will help the Bank to consolidate and grow during this difficult period.
AcknowledgementThe Board would like to express their gratitude to valued customers and shareholders for entrusting their confidence in the Bank which give strength to face the challenging times. We assure that we shall remain committed to maintain high standards of the service and strong culture of corporate governance in all endeavors. We would also thank to SECP for their continued support and patronage extended during the challenging period. The Board also acknowledges the valuable teamwork and significant contributions by the senior executives and employees of the Bank. The Board is confident that with the persistent cooperation by the SECP and committed efforts of the employees, the Bank shall be able to pursue its corporate objectives with renewed vigor.
For and on behalf of the Board of Directors
Lahore Ahsan Rafique December 19, 2013 President & Chief Executive Officer

Financial Statement Trust Investment Bank Limited
Quarterly report (un-audited)September 30, 2013
5

6
Trust Investment Bank Limited
BALANCE SHEETAS AT 30 SEPTEMBER 2013
Un-audited Audited30 September 30 June
2013 2013ASSETS Note Rupees Rupees
Non-current assetsFixed assets 5 964,552,121 964,298,694 Long term investments 6 60,203,513 66,297,263 Long term loans and advances 7 7,641,947 8,395,333 Net investment in lease finance 8 - - Long term deposits 1,331,550 1,331,550 Deferred tax asset 9 515,931,678 515,931,678 Total non-current assets 1,549,660,809 1,556,254,518
Current assets Current maturities of non - current assets 10 1,263,091,310 1,277,848,272 Short term loans and advances 11 117,697,105 109,038,553 Short term placements 12 140,000,000 4,858,663 Short term investments 13 1,129,005,480 1,093,005,480 Short term prepayments 854,914 1,600,004 Markup accrued 14 199,145,782 203,091,749 Taxation - net 3,010,689 2,984,337 Other receivables 15 30,526,673 199,205,522 Cash and bank balances 16 1,794,202 5,642,474
2,885,126,155 2,897,275,054 Assets classified as held for sale - - Total current assets 2,885,126,155 2,897,275,054 TOTAL ASSETS 4,434,786,964 4,453,529,572
EQUITY AND LIABILITIES
Share capital and reservesShare capital 892,028,729 892,028,729 Reserves 17 (1,979,756,145) (1,977,625,630)
(1,087,727,416) (1,085,596,901) Surplus on revaluation of fixed assets-net 18 18,511,500 18,511,500
Non-current liabilitiesLong term financing-subordinated loan 19 1,696,282,851 1,696,282,851 Long term financing-others 20 26,555,333 26,555,333 Long term morabaha - - Long term certificates of investment 21 18,051,712 24,970,202 Deferred liabilities 4,699,342 5,041,342 Long term deposits 22 18,653,808 61,424,576 Total non-current liabilities 1,764,243,046 1,814,274,304
Current liabilities Short term borrowings 23 39,413,532 39,413,532 Short term certificates of investment 24 1,427,381,973 1,399,355,968 Current maturities of non current liabilities 25 1,841,213,448 1,841,213,448 Mark-up accrued 26 247,380,493 247,170,291 Trade and other payables 27 184,370,388 179,187,430 Total current liabilities 3,739,759,834 3,706,340,669
5,504,002,880 5,520,614,973 CONTINGENCIES AND COMMITMENTS - -
4,434,786,964 4,453,529,572
The annexed notes from 1 to 2 form an integral part of these financial statements.
CHIEF EXECUTIVE DIRECTOR

7
PROFIT AND LOSS ACCOUNTFOR THE YEAR ENDED SEPTEMBER 30, 2013
Un-audited Un-audited
Note 30 September 30 September
Income 2013 2012
Income from lease operations 882,863 10,698,239 Income from investments 500,317 2,358,213 Income from term loans 11,706,657 26,323,883
13,089,837 39,380,335
Finance cost 1,245,240 110,779,412
11,844,597 (71,399,077)
Administrative and operating expenses 20,412,475 35,497,593
(8,567,878) (106,896,670)
Other operating income 3,244,060 3,013,730
(5,323,818) (103,882,940)
Other operating expenses (3,193,303) 781,619
Operating loss before provisions and taxation (2,130,515) (104,664,559)
Provision against lease and term loan - -
Reversal of impairment in the value of investment -
- - Loss before taxation (2,130,515) (104,664,559)
Provision for taxation - -
Loss after taxation (2,130,515) (104,664,559)
Loss per share - basic/ diluted 37 (0.04) (1.98)
The annexed notes from 1 to 2 form an integral part of these financial statements.
CHIEF EXECUTIVE DIRECTOR

8
Trust Investment Bank Limited
STATEMENT OF COMPREHENSIVE INCOME FOR THE YEAR ENDED SEPTEMBER 30, 2013
Un-audited Un-audited30 September 30 September
2013 2012
Loss after taxation for the year (2,130,515) (104,664,559)
Will not be reclassified subsequently to profit or loss:
Other comprehensive income/loss - -
Transferred from surplus on revaluation of fixed assets to accumulated loss-net of tax - 8,302,361
Total comprehensive loss for the year (2,130,515) (96,362,198)
The annexed notes from 1 to 2 form an integral part of these financial statements.
CHIEF EXECUTIVE DIRECTOR

9
CASH FLOW STATEMENTFOR THE YEAR ENDED SEPTEMBER 30, 2013 Un-audited Un-audited
30 September 30 September2013 2012CASH FLOWS FROM OPERATING ACTIVITIES
Loss before taxation (2,130,515) (104,664,559)
Adjustments for non cash / non operating items:Depreciation and amortization 1,608,873 2,362,689 Amortization of initial transaction cost over term finance certificates - 470,232Provision for staff service cost - - Provision for potential lease and term loan losses - - Lease receivables written off (3,193,303) - Finance cost 1,245,240 781,619 Loss/(Gain) on disposal of fixed assets - 110,309,180 Un-realized loss on revaluation of held for trading investment - (200,000) Profit on settlement of preference shares - - Reversal of impairment in the value of investment - - Gain on disposal of available for sale investments - -
(339,190) 113,723,720 Operating profit before working capital changes (2,469,705) 9,059,161 Changes in operating assets and liabilities:(Increase) / decrease in:
Long term loans and advances 103,386 2,809,725 Net investment in lease finance (24,351,753) 50,695,399 Short term loans and advances (8,008,552) 102,446,004 Short term placements (135,141,337) (35,000,000)Short term investments (36,000,000) (10,000,000) Short term prepayments 745,090 8,400,779Markup accrued 3,945,967 3,329,759Other receivables 168,678,849 6,758,464
(30,028,350) 129,440,130 Increase / (decrease) in liabilities:
Certificates of investment 21,107,515 (171,184,426)Trade and other payables 5,878,547 15,926,038
(3,042,288) (25,818,258) Cash (used in) / generated from operations (5,511,993) (16,759,097)
Finance cost paid (1,035,038) (32,198,908)Taxes paid (26,352) (81,187) Staff service cost paid (342,000) (273,750)
(1,403,390) (32,553,845) Net cash (used in) / generated from operating activities (6,915,383) (49,312,942)
CASH FLOWS FROM INVESTING ACTIVITIESPurchase of fixed assets (1,862,300) 12,378,380 Long term investments 5,625,000 2,343,750 Long term deposits 0 (515,000)Proceeds from disposal of:
Fixed assets 0 200,000Non current assets held for sale 0 0
Net cash used in investing activities 3,762,700 14,407,130

10
Trust Investment Bank Limited
CASH FLOWS FROM FINANCING ACTIVITIESLong term financing - - Subordinated loan obtained - - Long term morabaha - - Redemption of term finance certificates - (5,673,980) Dividend (695,589) (1,536,493)
Net cash generated from / (used in) financing activities (695,589) (7,210,473) Net decrease in cash and cash equivalents (3,848,272) (42,116,285) Cash and cash equivalents at the beginning of the year (33,771,058) (29,595,760) Cash and cash equivalents at the end of the year (37,619,330) (71,712,045)
The annexed notes from 1 to 2 form an integral part of these financial statements.
CHIEF EXECUTIVE DIRECTOR
Un-audited Un-audited30 September 30 September
2013 2012

11
STA
TE
ME
NT
OF
CH
AN
GE
S IN
EQ
UIT
Y F
OR
TH
E Y
EA
R E
ND
ED
SE
PTE
MB
ER
30,
201
3
CA
PIT
AL
R
ESE
RV
ES
Bal
ance
as a
t 01
July
201
258
5,52
8,72
9
30
6,50
0,00
0
24
0,03
0,90
7
61
,000
,000
(2,1
34,6
55,3
67)
(1,8
33,6
24,4
60)
(941
,595
,731
)
Tota
l com
preh
ensi
ve lo
ss fo
r the
yea
r-
- -
- (1
38,6
19,3
10)
(1
38,6
19,3
10)
(1
38,6
19,3
10)
Div
iden
d on
pre
fere
nce
shar
es @
1 y
ear K
ibor
+100
BPS
- -
- -
(5,3
81,8
60)
(5
,381
,860
)
(5,3
81,8
60)
for t
he y
ear e
nded
30
June
201
3
Bal
ance
as a
t 30
June
201
358
5,52
8,72
9
30
6,50
0,00
0
24
0,03
0,90
7
61
,000
,000
(2,2
78,6
56,5
37)
(1,9
77,6
25,6
30)
(1,0
85,5
96,9
01)
Tota
l com
preh
ensi
ve lo
ss fo
r the
yea
r-
- -
- (2
,130
,515
)
(2,1
30,5
15)
(2
,130
,515
)
Div
iden
d on
pre
fere
nce
shar
es @
1 y
ear K
ibor
+100
BPS
- -
- -
- -
-
for t
he p
erio
d en
ded
30 S
epte
mbe
r 201
3
Bal
ance
as a
t 30
Sept
embe
r 20
1358
5,52
8,72
9
30
6,50
0,00
0
24
0,03
0,90
7
61
,000
,000
(2,2
80,7
87,0
52)
(1,9
79,7
56,1
45)
(1,0
87,7
27,4
16)
The
anne
xed
note
s fro
m 1
to 2
form
an
inte
gral
par
t of t
hese
fina
ncia
l sta
tem
ents
.
CH
IEF
EX
EC
UT
IVE
DIR
EC
TO
R
----
----
----
----
----
----
----
----
----
----
----
----
----
--R
upee
s---
----
----
----
----
----
----
----
----
----
----
----
----
----
--
Sub
Tot
al
Ord
inar
y Sh
ares
T
otal
Gen
eral
re
serv
eA
ccum
ulat
ed
loss
es
Pref
eren
ce
shar
esSt
atut
ory
rese
rve
RE
VE
NU
E R
ESE
RV
ES

12
Trust Investment Bank Limited
NOTES TO THE FINANCIAL STATEMENTSFOR THE YEAR ENDED SEPTEMBER 30, 2013
1. LEGAL STATUS AND NATURE OF BUSINESS
2. STATEMENT OF COMPLIANCE
3. BASIS OF MEASUREMENT
4. SIGNIFICANT ACCOUNTING POLICIES
The accounting policies applied for the preparation of this interim financial information are same as those applied in preparation of financial statements as on 30 2013
Un-audited Audited30 September 30 June5. FIXED ASSETS
Note 2013 2013
Rupees RupeesTangible
Property, plant and equipment 86,042,960 85,763,067
Capital work in progress 878,121,000 878,121,000
Trust Investment Bank Limited and its subsidiary company ("the Group") comprises of holding company TrustInvestment Bank Limited ("TIBL") and a wholly owned subsidiary company Trust Capital (Private) Limited("TCPL).
Trust Investment Bank Limited ("the Company") was incorporated in 1992 as a public limited Company underthe Companies Ordinance, 1984 and is listed on Lahore, Karachi and Islamabad Stock Exchanges. The registeredoffice of the Company is situated at 6th Floor, M M Tower, 28 - A / K, Gulberg II, Lahore. The Company ismainly engaged in the business of investment finance services. It is classified as a Non-Banking FinanceCompany (NBFC) and is regulated by the Securities and Exchange Commission of Pakistan (SECP).
These financial statements have been prepared in accordance with approved accounting standards as applicable inPakistan. Approved accounting standards comprise of such International Financial Reporting Standards (IFRS)issued by the International Accounting Standards Board as are notified under the Companies Ordinance, 1984,the Non-Banking Finance Companies (Establishment and Regulation) Rules, 2003 (the NBFC Rules), the Non-Banking Finance Companies and Notified Entities Regulation, 2008 (the NBFC Regulation) and the directivesissued by the Securities and Exchange Commission of Pakistan (SECP). Wherever the requirements of theCompanies Ordinance 1984, the NBFC Rules, the NBFC Regulations or the directives issued by the SECP differwith the requirements of IFRS, the requirements of the Companies Ordinance 1984, the NBFC Rules, the NBFCRegulation or the directives issued by the SECP shall prevail.
These financial statements have been prepared under the historical cost convention except for revaluation ofcertain financial instruments and property at fair value and recognition of certain employee retirement benefits atpresent value.
Intangible assets 388,161 414,627
964,552,121 964,298,694

13
Un-audited Audited30 September 30 June
Note 2013 20136. LONG TERM INVESTMENTS Rupees Rupees
Investment in subsidiary-at cost 60,000,000 60,000,000 Investment in Term Finance Certificates and Sukuks 69,047,300 74,672,300
129,047,300 134,672,300 Less: Impairment in the value of investments 37,039,287 37,039,287
92,008,013 97,633,013
Less: Current portion of long term investments 10 31,804,500 31,335,750 60,203,513 66,297,263
Un-audited Audited
Note 30 September 30 June
7. LONG TERM LOANS AND ADVANCES 2013 2013
R RSecured:
Employees - considered good 2,276,938 2,371,991
Companies, organizations and individuals
Considered good 39,784,598 39,792,931
Considered doubtful 7,047,805 7,047,805
46,832,403 46,840,736
49,109,341 49,212,727
Un-secured:
Companies, organizations and individuals - Considered doubtful 397,838,899 397,838,899
446,948,240 447,051,626
Less: provision against doubtful loans 401,726,412 401,076,412
45,221,828 45,975,214
Less : current maturity 10 37,579,881 37,579,881
7,641,947 8,395,333 8. NET INVESTMENT IN LEASE FINANCE
1,301,386,585 1,325,705,951 364,856,964 408,586,891
Lease payments receivableAdd: Residual valueGross investment in leases 1,666,243,549 1,734,292,842
Less: Unearned finance income 4,182,110 5,311,508 183,950,668 183,984,668 Income suspended
Provision for lease losses 284,403,842 336,064,025 472,536,620 525,360,201
Net investment in lease finance 1,193,706,929 1,208,932,641
Less: Current portion of net investment
in lease finance 10 1,193,706,929 1,208,932,641 - -

14
Trust Investment Bank Limited
Un-audited Audited30 September 30 June
2013 20139. DEFERRED TAX ASSET Rupees Rupees
Taxable temporary differences Accelerated depreciation for tax purposes (9,105,030) (9,105,030) Leasing Finance (345,554,360) (345,554,360)
Deductible temporary differencesProvision against investments 787,500 787,500 Taxable losses 869,803,568 869,803,568
515,931,678 515,931,678
10. CURRENT MATURITIES OF NON-CURRENT ASSETS
Long term investments 6 31,804,500 31,335,750 Long term loans and advances 7 37,579,881 37,579,881 Net investment in lease finance 8 1,193,706,929 1,208,932,641
1,263,091,310 1,277,848,272
11. SHORT TERM LOANS AND ADVANCES
Short term loans-Secured 95,473,678 94,687,143 Short term advances 22,223,427 14,351,410
117,697,105 109,038,553
12. SHORT TERM PLACEMENTS
Repurchase agreement lendings (Reverse Repo) 7,022,877 7,022,877 TDR 9,000,000 3,000,000 Placement with KASB 130,000,000 - Placement with First Fidelity Leasing Modarba 1,000,000 1,858,663
147,022,877 11,881,540 Less: Provision against doubtful lending 7,022,877 7,022,877
140,000,000 4,858,663
13. SHORT TERM INVESTMENTS
Associated company Un-quoted
TRICON Developers Limited109,300,548 (2012: Nil) fully paid ordinary sharesof Rs. 10 each. Equity held 48.51% (2012: Nil) 1,129,005,480 1,093,005,480

15
Un-audited Audited30 September 30 June
Note 2013 201314. MARKUP ACCRUED Rupees Rupees
Mark-up accrued on:Term finance certificates and Sukuks 470,382 1,202,748Short term and long term loans 16,204,721 18,626,486Investments in lease 182,414,178 183,206,014Short term placements 56,501 56,501.00
199,145,782 203,091,74915. OTHER RECEIVABLES
Receivable from broker - considered good 21,143,275 21,143,275 Miscellaneous receivables from lessees:
Considered good 22,803,954 22,803,954 Considered doubtful 305,818,194 345,202,043
328,622,148 368,005,997 Other receivables
Considered good 49,338,549 178,633,549 Considered doubtful 4,625,524 4,625,524
53,964,073 183,259,073 403,729,496 572,408,345
Less: Provision for doubtful receivables 373,202,823 373,202,823 30,526,673 199,205,522
16. CASH AND BANK BALANCES
Cash in hand 259,613 92,067 With banks in:
Current accounts 244,194 244,194 Deposit accounts 1,290,395 5,306,213
1,534,589 5,550,407 1,794,202 5,642,474
Un-audited AuditedNote 30 September 30 June
17. RESERVES 2013 2013R RCapital reserves
Statutory reserve 240,030,907 240,030,907 240,030,907 240,030,907
Revenue reserves 61,000,000 61,000,000General reserve
Accumulated loss (2,280,787,052) (2,278,656,537) (2,219,787,052) (2,217,656,537) (1,979,756,145) (1,977,625,630)
18. SURPLUS ON REVALUATION OF FIXED ASSETS
- 0BuildingCapital work in progress 18,511,500 18,511,500
18,511,500 18,511,500
19. LONG TERM FINANCING - SUBORDINATED LOAN
Long term financing-subordinated loan 1,696,282,851 1,696,282,851

16
Trust Investment Bank Limited
Un-audited Audited30 September 30 June
2013 2013
Note Rupees Rupees20. LONG TERM FINANCING - OTHERS
Banking companies and other financial institutions-Secured 26,555,333 26,555,333Banking companies and other financial institutions-Unsecured - - Term finance certificates (TFC)-Secured - -
26,555,333 26,555,333
21. LONG TERM CERTIFICATES OF INVESTMENT
- CorporateSecured 32,345,202 32,345,202Unsecured 207,195,179 212,913,669
- Individuals 7,500,000 8,700,000247,040,381 253,958,871
Less: Current portion shown under current liabilities 228,988,669 228,988,66918,051,712 24,970,202
Un-audited Audited30 September 30 June
2013 2013Note Rupees Rupees
LONG TEM DEPOSITS22. 151,848,275 150,997,616Margin against letters of guarantee
Less: Current portion shown under current liabilities 139,396,555 139,396,555 12,451,720 11,601,061
363,889,933 407,511,360Deposits against lease arrangements Less: Current portion shown under current liabilities 357,687,845 357,687,845
6,202,088 49,823,51518,653,808 61,424,576
SHORT TERM BORROWINGS23.Banking companies and other financial institutions:
Running finances - secured 39,413,532 39,413,532

17
24. SHORT TERM CERTIFICATES OF INVESTMENT
12,850,006 12,850,006 1,361,333,685 1,358,107,680
- Financial institutions- Corporate - Individuals 53,198,282 28,398,282
1,427,381,973 1,399,355,968
25. CURRENT MATURITIES OF NON CURRENT LIABILITIESLong term financing from banking companies & financial institutions
Secured 851,804,440 851,804,440 17,251,959 17,251,959
230,583,980 230,583,980 15,500,000 15,500,000
228,988,669 228,988,669
UnsecuredTerm finance certificates-SecuredLong term morabaha Certificates of investment Long term deposits 497,084,400 497,084,400
1,841,213,448 1,841,213,448
26. MARK-UP ACCRUED
89,475,472 89,375,472 17,609,499 16,913,910
Secured - Short and long term financing - Term finance certificates - Certificates of investment 196,278 196,278
107,281,249 106,485,660 Unsecured - Certificates of investment 140,099,244 140,684,631
247,380,493 247,170,291
28. TRADE AND OTHER PAYABLES
8,064,822 8,064,822 3,096,984 3,096,984 57,327,689 58,023,278 15,092,298 11,575,105
Advance receipt against finance facilitiesUnclaimed dividend Preference dividend payableAccrued liabilitiesOther liabilities 100,788,595 98,427,241
184,370,388 179,187,430
. LOSS PER SHARE
Rupees (2,130,515) (144,863,440)Numbers 58,552,872 58,552,872
Loss for the year after taxationWeighted average number of ordinary sharesLoss per share - basic Rupees (0.04) (2.47)
There is no dilutive effect on the basic earning / (loss) per share of the company.
Un-audited Audited30 September 30 June
2013 2013
Note Rupees Rupees


19
ConsolidatedFinancial Statement
Trust Investment Bank Limited Quarterly report (un-audited)
September 30, 2013
20
Trust Investment Bank Limited
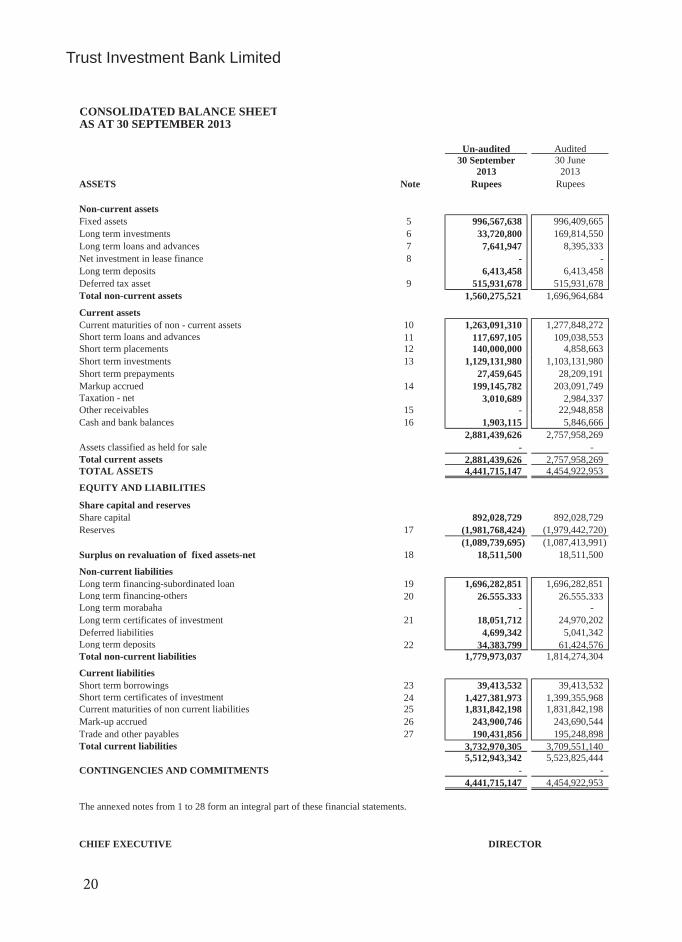
CONSOLIDATED BALANCE SHEETAS AT 30 SEPTEMBER 2013
Un-audited Audited30 September 30 June
2013 2013ASSETS Note Rupees Rupees
Non-current assetsFixed assets 5 996,567,638 996,409,665 Long term investments 6 33,720,800 169,814,550 Long term loans and advances 7 7,641,947 8,395,333 Net investment in lease finance 8 - - Long term deposits 6,413,458 6,413,458 Deferred tax asset 9 515,931,678 515,931,678 Total non-current assets 1,560,275,521 1,696,964,684
Current assets Current maturities of non - current assets 10 1,263,091,310 1,277,848,272 Short term loans and advances 11 117,697,105 109,038,553 Short term placements 12 140,000,000 4,858,663 Short term investments 13 1,129,131,980 1,103,131,980 Short term prepayments 27,459,645 28,209,191 Markup accrued 14 199,145,782 203,091,749 Taxation - net 3,010,689 2,984,337 Other receivables 15 - 22,948,858 Cash and bank balances 16 1,903,115 5,846,666
2,881,439,626 2,757,958,269 Assets classified as held for sale - - Total current assets 2,881,439,626 2,757,958,269 TOTAL ASSETS 4,441,715,147 4,454,922,953
EQUITY AND LIABILITIES
Share capital and reservesShare capital 892,028,729 892,028,729 Reserves 17 (1,981,768,424) (1,979,442,720)
(1,089,739,695) (1,087,413,991) Surplus on revaluation of fixed assets-net 18 18,511,500 18,511,500
Non-current liabilitiesLong term financing-subordinated loan 19 1,696,282,851 1,696,282,851 Long term financing-others 20 26,555,333 26,555,333 Long term morabaha - - Long term certificates of investment 21 18,051,712 24,970,202 Deferred liabilities 4,699,342 5,041,342 Long term deposits 22 34,383,799 61,424,576 Total non-current liabilities 1,779,973,037 1,814,274,304
Current liabilities Short term borrowings 23 39,413,532 39,413,532 Short term certificates of investment 24 1,427,381,973 1,399,355,968 Current maturities of non current liabilities 25 1,831,842,198 1,831,842,198 Mark-up accrued 26 243,900,746 243,690,544 Trade and other payables 27 190,431,856 195,248,898 Total current liabilities 3,732,970,305 3,709,551,140
5,512,943,342 5,523,825,444 CONTINGENCIES AND COMMITMENTS - -
4,441,715,147 4,454,922,953
The annexed notes from 1 to 28 form an integral part of these financial statements.
CHIEF EXECUTIVE DIRECTOR

21
CONSOLIDATED PROFIT AND LOSS ACCOUNTFOR THE YEAR ENDED SEPTEMBER 30, 2013
Un-audited Un-audited
Note 30 September 30 September
Income 2013 2013
Income from lease operations 882,863 10,698,239 Income from investments 500,317 2,358,213 Income from term loans 11,706,657 26,323,883
Income from brokerage 50,274 -
13,140,111 39,380,335
Finance cost 1,247,484 110,779,412
11,892,627 (71,399,077)
Administrative and operating expenses 20,655,694 35,497,593
(8,763,067) (106,896,670)
Other operating income 3,244,060 3,013,730
(5,519,007) (103,882,940)
Other operating expenses (3,193,303) 781,619
Operating loss before provisions and taxation (2,325,704) (104,664,559)
Provision against lease and term loan - -
Reversal of impairment in the value of investment -
- - Loss before taxation (2,325,704) (104,664,559)
Provision for taxation - -
Loss after taxation 28 (2,325,704) (104,664,559)
Loss per share - basic/ diluted (0.04) (1.98)
The annexed notes from 1 to 28 form an integral part of these financial statements.
CHIEF EXECUTIVE DIRECTOR
22
Trust Investment Bank Limited
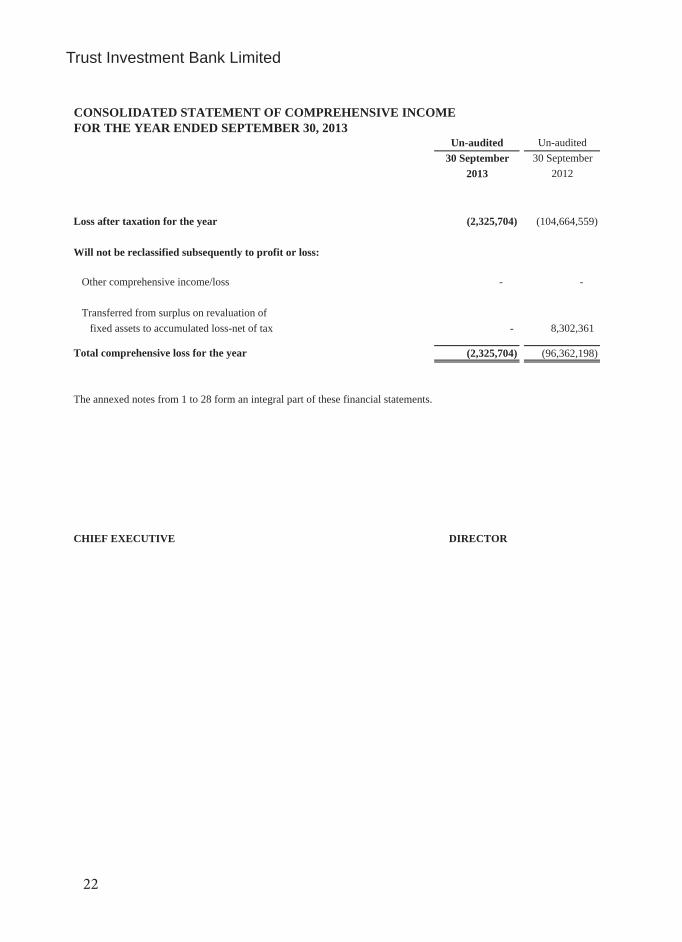
CONSOLIDATED STATEMENT OF COMPREHENSIVE INCOME FOR THE YEAR ENDED SEPTEMBER 30, 2013
Un-audited Un-audited30 September 30 September
2013 2012
Loss after taxation for the year (2,325,704) (104,664,559)
Will not be reclassified subsequently to profit or loss:
Other comprehensive income/loss - -
Transferred from surplus on revaluation of fixed assets to accumulated loss-net of tax - 8,302,361
Total comprehensive loss for the year (2,325,704) (96,362,198)
The annexed notes from 1 to 28 form an integral part of these financial statements.
CHIEF EXECUTIVE DIRECTOR

23
CONSOLIDATED CASH FLOW STATEMENTFOR THE YEAR ENDED SEPTEMBER 30, 2013
Un-audited Un-audited30 September 30 September
2013 2012CASH FLOWS FROM OPERATING ACTIVITIES
Loss before taxation (2,325,704) (104,664,559)
Adjustments for non cash / non operating items:Depreciation and amortization 1,704,327 2,362,689 Amortization of initial transaction cost over term finance certificates - 470,232Provision for staff service cost - - Provision for potential lease and term loan losses - - Lease receivables written off (3,193,303) - Finance cost 1,245,240 781,619 Loss/(Gain) on disposal of fixed assets - 110,309,180 Un-realized loss on revaluation of held for trading investment - (200,000) Profit on settlement of preference shares - - Reversal of impairment in the value of investment - - Gain on disposal of available for sale investments - -
(243,736) 113,723,720 Operating profit before working capital changes(2,569,440) 9,059,161 Changes in operating assets and liabilities:
(Increase) / decrease in:Long term loans and advances 103,386 2,809,725 Net investment in lease finance (24,351,753) 50,695,399 Short term loans and advances (8,008,552) 102,446,004 Short term placements (135,141,337) (35,000,000)Short term investments (26,000,000) (10,000,000) Short term prepayments 745,090 8,400,779Markup accrued 3,945,967 3,329,759Other receivables 158,683,305 6,758,464
(30,023,894) 129,440,130 Increase / (decrease) in liabilities:
Certificates of investment 21,107,515 (171,184,426)Trade and other payables 5,878,547 15,926,038
(3,037,832) (25,818,258) Cash (used in) / generated from operations (5,607,272) (16,759,097)
Finance cost paid (1,035,038) (32,198,908)Taxes paid (26,352) (81,187) Staff service cost paid (342,000) (273,750)
(1,403,390) (32,553,845) Net cash (used in) / generated from operating activities (7,010,662) (49,312,942) CASH FLOWS FROM INVESTING ACTIVITIES
Purchase of fixed assets (1,862,300) 12,378,380 Long term investments 5,625,000 2,343,750 Long term deposits 0 (515,000)Proceeds from disposal of:
Fixed assets 0 200,000Non current assets held for sale 0 0
Net cash used in investing activities 3,762,700 14,407,130

24
Trust Investment Bank Limited
Un-audited Un-audited30 September 30 September
2013 2012CASH FLOWS FROM FINANCING ACTIVITIES
Long term financing - - Subordinated loan obtained - - Long term morabaha - - Redemption of term finance certificates - (5,673,980) Dividend (695,589) (1,536,493)
Net cash generated from / (used in) financing activities (695,589) (7,210,473) Net decrease in cash and cash equivalents (3,943,551) (42,116,285) Cash and cash equivalents at the beginning of the year (33,566,866) (29,595,760) Cash and cash equivalents at the end of the year (37,510,417) (71,712,045)
The annexed notes from 1 to 28 form an integral part of these financial statements.
CHIEF EXECUTIVE DIRECTOR

25
CO
NSO
LID
AT
ED
ST
AT
EM
EN
T O
F C
HA
NG
ES
IN E
QU
ITY
FO
R T
HE
YE
AR
EN
DE
D S
EPT
EM
BE
R 3
0, 2
013
CA
PIT
AL
R
ESE
RV
ES
Bal
ance
as a
t 01
July
201
258
5,52
8,72
9
30
6,50
0,00
0
24
0,03
0,90
7
61
,000
,000
(2,1
54,6
02,2
53)
(1,8
53,5
71,3
46)
(961
,542
,617
)
Tota
l com
preh
ensi
ve lo
ss fo
r the
yea
r-
- -
- (1
20,4
89,5
14)
(1
20,4
89,5
14)
(1
20,4
89,5
14)
Div
iden
d on
pre
fere
nce
shar
es @
1 y
ear K
ibor
+100
BPS
- -
- -
(5,3
81,8
60)
(5
,381
,860
)
(5,3
81,8
60)
for t
he y
ear e
nded
30
June
201
3
Bal
ance
as a
t 30
June
201
358
5,52
8,72
9
30
6,50
0,00
0
24
0,03
0,90
7
61
,000
,000
(2,2
80,4
73,6
27)
(1,9
79,4
42,7
20)
(1,0
87,4
13,9
91)
Tota
l com
preh
ensi
ve lo
ss fo
r the
yea
r-
- -
- (2
,325
,704
)
(2,3
25,7
04)
(2
,325
,704
)
Div
iden
d on
pre
fere
nce
shar
es @
1 y
ear K
ibor
+100
BPS
- -
- -
- -
-
for t
he y
ear e
nded
30
Sept
embe
r 201
3
Bal
ance
as a
t 30
June
201
358
5,52
8,72
9
30
6,50
0,00
0
24
0,03
0,90
7
61
,000
,000
(2,2
82,7
99,3
31)
(1,9
81,7
68,4
24)
(1,0
89,7
39,6
95)
The
anne
xed
note
s fro
m 1
to 2
8 fo
rm a
n in
tegr
al p
art o
f the
se fi
nanc
ial s
tate
men
ts.
CH
IEF
EX
EC
UT
IVE
DIR
EC
TO
R
----
----
----
----
----
----
----
----
----
----
----
----
----
--R
upee
s---
----
----
----
----
----
----
----
----
----
----
----
----
----
--
Sub
Tot
al
Ord
inar
y Sh
ares
T
otal
Gen
eral
re
serv
eA
ccum
ulat
ed
loss
es
Pref
eren
ce
shar
esSt
atut
ory
rese
rve
RE
VE
NU
E R
ESE
RV
ES

26
Trust Investment Bank Limited
NOTES TO THE CONSOLIDATED FINANCIAL STATEMENTSFOR THE YEAR ENDED SEPTEMBER 30, 20131. LEGAL STATUS AND NATURE OF BUSINESS
2. STATEMENT OF COMPLIANCE
3. BASIS OF MEASUREMENT
4. SIGNIFICANT ACCOUNTING POLICIES
The accounting policies applied for the preparation of this interim financial information are same as those applied in preparation of financial statements as on 30 September 2013.
Un-audited Audited30 September 30 June
5. FIXED ASSETS Note 2013 2013
Rupees Rupees
Tangible
Property, plant and equipment 86,971,527 86,729,880
Capital work in progress 878,121,000 878,121,000
Intangible assets 31,475,111 31,558,785
Trust Investment Bank Limited and its subsidiary company ("the Group") comprises of holding company TrustInvestment Bank Limited ("TIBL") and a wholly owned subsidiary company Trust Capital (Private) Limited("TCPL).
Trust Investment Bank Limited ("the Company") was incorporated in 1992 as a public limited Company under theCompanies Ordinance, 1984 and is listed on Lahore, Karachi and Islamabad Stock Exchanges. The registeredoffice of the Company is situated at 6th Floor, M M Tower, 28 - A / K, Gulberg II, Lahore. The Company ismainly engaged in the business of investment finance services. It is classified as a Non-Banking Finance Company(NBFC) and is regulated by the Securities and Exchange Commission of Pakistan (SECP).
These financial statements have been prepared in accordance with approved accounting standards as applicable inPakistan. Approved accounting standards comprise of such International Financial Reporting Standards (IFRS)issued by the International Accounting Standards Board as are notified under the Companies Ordinance, 1984, theNon-Banking Finance Companies (Establishment and Regulation) Rules, 2003 (the NBFC Rules), the Non-Banking Finance Companies and Notified Entities Regulation, 2008 (the NBFC Regulation) and the directivesissued by the Securities and Exchange Commission of Pakistan (SECP). Wherever the requirements of theCompanies Ordinance 1984, the NBFC Rules, the NBFC Regulations or the directives issued by the SECP differwith the requirements of IFRS, the requirements of the Companies Ordinance 1984, the NBFC Rules, the NBFCRegulation or the directives issued by the SECP shall prevail.
These financial statements have been prepared under the historical cost convention except for revaluation of certainfinancial instruments and property at fair value and recognition of certain employee retirement benefits at presentvalue.
g , , , ,
996,567,638 996,409,665

27

28
Trust Investment Bank Limited
Un-audited Audited30 September 30 June
2013 20139. DEFERRED TAX ASSET Rupees Rupees
Taxable temporary differences Accelerated depreciation for tax purposes (9,105,030) (9,105,030) Leasing Finance (345,554,360) (345,554,360)
Deductible temporary differencesProvision against investments 787,500 787,500 Taxable losses 869,803,568 869,803,568
515,931,678 515,931,678
10. CURRENT MATURITIES OF NON-CURRENT ASSETS
Long term investments 6 31,804,500 31,335,750 Long term loans and advances 7 37,579,881 37,579,881 Net investment in lease finance 8 1,193,706,929 1,208,932,641
1,263,091,310 1,277,848,272
11. SHORT TERM LOANS AND ADVANCES
Short term loans-Secured 95,473,678 94,687,143 Short term advances 22,223,427 14,351,410
117,697,105 109,038,553
12. SHORT TERM PLACEMENTS
Repurchase agreement lendings (Reverse Repo) 7,022,877 7,022,877 TDR 9,000,000 3,000,000 Placement with KASB 130,000,000 - Placement with First Fidelity Leasing Modarba 1,000,000 1,858,663
147,022,877 11,881,540 Less: Provision against doubtful lending 7,022,877 7,022,877
140,000,000 4,858,663
13. SHORT TERM INVESTMENTS
Associated company Un-quoted
TRICON Developers Limited109,300,548 (2012: Nil) fully paid ordinary shares
of Rs. 10 each. Equity held 48.51% (2012: Nil) 1,129,005,480 1,093,005,480 TCPL 126,500 10,126,500
1,129,131,980 1,103,131,980

29
Un-audited Audited30 September 30 June
Note 2013 201314. MARKUP ACCRUED Rupees Rupees
Mark-up accrued on:Term finance certificates and Sukuks 470,382 1,202,748Short term and long term loans 16,204,721 18,626,486Investments in lease 182,414,178 183,206,014Short term placements 56,501 56,501.00
199,145,782 203,091,749
Un-audited Audited30 September 30 June
Note 2013 2013Rupees Rupees
15. OTHER RECEIVABLES
Receivable from broker - considered good 21,143,275 21,143,275 Miscellaneous receivables from lessees:
Considered good 22,803,954 22,803,954 Considered doubtful 305,818,194 345,202,043
328,622,148 368,005,997 Other receivables
Considered good 3,081,885 2,376,885 Considered doubtful 4,625,524 4,625,524
7,707,409 7,002,409 357,472,832 396,151,681
Less: Provision for doubtful receivables 357,472,832 373,202,823 - 22,948,858
16. CASH AND BANK BALANCES
Cash in hand 259,613 92,067 With banks in:
Current accounts 353,107 448,386 Deposit accounts 1,290,395 5,306,213
1,643,502 5,754,599 1,903,115 5,846,666

30
Trust Investment Bank Limited
Un-audited AuditedNote 30 September 30 June
17. RESERVES 2013 2013R RCapital reserves
Statutory reserve 240,030,907 240,030,907240,030,907 240,030,907
Revenue reservesGeneral reserve 61,000,000 61,000,000Accumulated loss (2,282,799,331) (2,280,473,627)
(2,221,799,331) (2,219,473,627)(1,981,768,424) (1,979,442,720)
18. SURPLUS ON REVALUATION OF FIXED ASSETS
Building - -Capital work in progress 18,511,500 18,511,500
18,511,500 18,511,500
19. LONG TERM FINANCING - SUBORDINATED LOAN
Long term financing-subordinated loan 1,696,282,851 1,696,282,851
20. LONG TERM FINANCING - OTHERSBanking companies and other financial institutions-Secured 26,555,333 26,555,333Banking companies and other financial institutions-Unsecured - - Term finance certificates (TFC)-Secured - -
26,555,333 26,555,333
21. LONG TERM CERTIFICATES OF INVESTMENT
- CorporateSecured 32,345,202 32,345,202Unsecured 207,195,179 212,913,669
- Individuals 7,500,000 8,700,000247,040,381 253,958,871
Less: Current portion shown under current liabilities 228,988,669 228,988,66918,051,712 24,970,202
LONG TEM DEPOSITS22.
151,848,275 150,997,616Margin against letters of guaranteeLess: Current portion shown under current liabilities 139,396,555 139,396,555
12,451,720 11,601,061
379,619,924 407,511,360Deposits against lease arrangements Less: Current portion shown under current liabilities 357,687,845 357,687,845
21,932,079 49,823,515 34,383,799 61,424,576 SHORT TERM BORROWINGS23.
Banking companies and other financial institutions:
Running finances - secured 39,413,532 39,413,532
SHORT TERM CERTIFICATES OF INVESTMENT 24.
12,850,006 12,850,006 1,361,333,685 1,358,107,680
- Financial institutions - Corporate - Individuals 53,198,282 28,398,282
1,427,381,973 1,399,355,968

31
Un-audited Audited30 September 30 June
2013 2013Note Rupees Rupees
25. CURRENT MATURITIES OF NON CURRENT LIABILITIES
Long term financing from banking companies & financial institutions
Secured 851,804,440 851,804,440 Unsecured 17,251,959 17,251,959
Term finance certificates-Secured 230,583,980 230,583,980 Long term morabaha 15,500,000 15,500,000 Certificates of investment 228,988,669 228,988,669 Long term deposits 487,713,150 487,713,150
1,831,842,198 1,831,842,198
26. MARK-UP ACCRUED
Secured - Short and long term financing 85,995,725 85,895,725 - Term finance certificates 17,609,499 16,913,910 - Certificates of investment 196,278 196,278
103,801,502 103,005,913 Unsecured - Certificates of investment 140,099,244 140,684,631
243,900,746 243,690,544 27. TRADE AND OTHER PAYABLES
Advance receipt against finance facilities 8,064,822 8,064,822 Unclaimed dividend 3,096,984 3,096,984 Preference dividend payable 57,327,689 58,023,278 Accrued liabilities 15,092,298 11,575,105 Other liabilities 106,850,063 114,488,709
190,431,856 195,248,898 28. LOSS PER SHARE
Loss for the year after taxation Rupees (2,325,704) (144,863,440) Weighted average number of ordinary shares Numbers 58,552,872 58,552,872 Loss per share - basic Rupees (0.04) (2.47)
There is no dilutive effect on the basic earning / (loss) per share of the company.