Embed Size (px)
Citation preview

00385243
The Honourable Judges Marcel Lemoode and You Bunleng Co-Investigating Judges Extraordinary Chambers in the Courts of Cambodia Phnom Penh Cambodia
Demographic Expert Reoort
M fJ/i 0
ti) ! 1't3J~l '13/2413 , . (/ -
KHMER ROUGE VICTIMS IN CAMBODIA, APRIL 1975 - JANUARY 1979 A CRITICAL ASSESSMENT OF MAJOR ESTIMATES
30 September 2009
We, Dr. Ewa Tabeau, the chief demographer in the Office of the Prosecutor at the United Nations International Criminal Tribunal for the former Yugoslavia in The Hague, the Netherlands, and Mr. They Kheam. the director of the Department for Demographic Statistics, Census and Surveys in the National Institute for Statistics of Cambodia in Phnom Penh, swear to lend our full support and assist the CoInvestigative Judges of the Extraordinary Chambers in the Courts of Cambodia. Marcel Lemonde and You Bunleng, faithfully, confidentially and to the best ofour knowledge.
Herewith we submit our demographic expert report entitled '"Khmer Rouge Victims in Cambodia, April 1975 - January 1979. A Critical Assessment of Major Estimates", pursuant to the mission we were entrusted with as defined in the Expertise Order No. 0140, from 10 March 2009, Office of the Co-Investigative Judges, Extraordinary Chambers in the Courts of Cambodia. The details of the report were prepared personally by Dr. Ewa Tabeau, whereas Mr. They Kheam assisted Dr. Tabeau at all stages of the project by monitoring the progress and providing his support.
Respectfully,
f~r°'-. ,J;u~c Dr. Ewa Tabeau They Kheam

00385244
30 September 2009
KHMER ROUGE VICTIMS IN CAMBODIA, APRIL 1975 - JANUARY 1979
A CRITICAL ASSESSMENT OF MAJOR ESTIMATES
EXECUTIVE SUMMARY
This report was written in response to the Expertise Order No. D 140, from I 0 March 2009, Office of the Co-Investigative Judges, Extraordinary Chambers in the Courts of Cambodia - ECCC. The report had three major objectives:
to determine the population of Cambodia on 17 April 1975 and on 7 January 1979, and the number of deaths in the intervening period to specify, where possible, the national, religious and/or ethnic origin of the deceased to identify the causes of these deaths, and determine which of these deaths were due, directly or indirectly, to policy implemented by the CPK, and which due to external factors
In order to deal with these objectives, we took into account the historical, political, economic and other factors occurring around the 1970s. In our assessment we included two historical episodes: the civil war in Cambodia of March 1970 to April 1975 and the Khmer Rouge regime of April 1975 to January 1979. Our main focus was, however, on demographics of Cambodia in the period before, during and after April 1975 to January 1979, with the Khmer Rouge period being the main time interval of interest. In this report we studied statistical sources on the population of Cambodia; its size, sex- and age- structure, its fertility, mortality and migration; and sources on the death toll during the tragic decade of the 1970s. Our primary goal and the first research area was to identify excess deaths that occurred from April 1975 to January 1979, their causes, and their ethnic and religious distribution. We use the terms "excess deaths" and "death toll" as synonyms.
Excess deaths relate to all those deaths that would not have occurred under normal circumstances; thus all deaths beyond mortality from "natural cause~1 Excess deaths include, first of all, direct (or violent) excess deaths, i.e. deaths of all those executed or murdered, killed in another way (e.g. in combat), missing persons, deaths from torture during interrogation, violent deaths in detention, human shields, and other direct victims. This category is called "violent" or "direct" deaths as these deaths resulted from direct violence of the Khmer Rouge regime. Secondly, excess deaths cover indirect excess deaths, i.e. those who died of starvation, overwork, lack of basic health care, poor living and sanitary conditions, forced migration, victims of mines, deaths of late effects of injuries or wounds, victims of emotional hardship etc.
Our next research area was related to the identification of the population size in Cambodia in April 1975 and January 1979. The significant absolute decline in the population size between these two moments is an important indication of the enormous humanitarian crisis in the country ruled by the Khmer Rouge movement. Secondly, the size of the Cambodia population at these two moments had important practical implications for the determination of the death toll of the Khmer Rouge regime. As we showed in our report, much disagreement exits among various authors in relation to these two population sizes; so it was imperative to us to investigate and clarify this disagreement and to suggest the most likely population sizes for April 1975 and January 1979.
The first half of the 1970s was by no means a peaceful period for Cambodia. The civil war broke out in the country in March 1970 and lasted until April 1975, when the Khmer Rouge took the power by
1 In demography '·natural causes" are meant for deaths from diseases and old age. External causes. such as accidents, suicide etc. are a separate category. Here, however, by "natural mortality" we understand deaths that would occur in nonconflict circumstances.

00385245
30 September 2009
force from the Lon Nol government. During the years from March 1970 to April 1975, many Cambodians lost their lives in combat situations, from American bombings, or persecution by the Khmer Rouge, Lon Nol or Vietnamese forces. Many more lost their houses and were years long on move running away from the war, persecutions and the bombings. Thus, we also had to study the victims of the civil war and the internal and external migration in this period. This was our third important research area.
The method we employed in this report was an assessment of a number of sources reporting on the above mentioned research subjects (i.e. the population and general demographic trends around the 1970s, death toll in the civil war and under the Khmer Rouge regime, and finally migration trends in the 1970s). We selected our sources on the basis of an extensive literature review on the first place; secondly we also used the materials that were provided to us by the OCIJ. With regard to the death toll, the term "source" covers in this report mainly internationally published research on the demographics and history of the Khmer Rouge regime. In addition to this, we also included among our sources projects, such as the Renakse nation-wide survey from the early 1980s into the victims of Khmer Rouge in Cambodia, and the results of the mass grave mapping project conducted by the Documentation Centre of Cambodia in Phnom Penh (DC-Cam). In total, 12 sources have been assessed in this report. The 12 sources on the death toll include estimates made in the period from January 1980 up to the most recent estimate of September 2008. The 12 sources are by no means all available in the field; several other estimates exist and could have been included as well. We believe, however, that the estimates taken for the assessment in this repo11 are the major ones and well represent other existing estimates. Taking more estimates for this review would not fundamentally change the outcome of this report. The internationally published research assessed in this report includes:2
CIA, 1980 EA MENG-TRY, 1981 KIMMO KILJUNEN (ed.), 1984 MICHAEL VICKERY, 1984 JUDITH BANISTER and PAIGE JOHNSON, 1993 MAREK SLIWINSKI, 1995 BEN KIERNAN, 1996 and 2003 PATRICK HEUVELINE, 1998; PATRICK HEUVELINE and POCH BUNNAK, 2007 CRAIG ETCHESON, 2000 and 2005 RICARDO NEUPERT and VIRAK PRUM, 2005
The national Cambodian sources assessed here are the following:
DC-Cam mass grave mapping project Renakse nation-wide survey of the early 1980s
The method we employed in our assessment was largely (but not exclusively) qualitative. We studied statistical and other sources used by various authors; their relevance, reliability and possible biases. We investigated the methods applied in producing the various estimates; how complex or simple they were, how subjective versus objective, whether formal or informal, whether scientifically founded and satisfying modem analytical requirements or unfounded and out-dated. Finally, we looked at the transparency of the presentation of final outcomes; most importantly we assessed here the formulation of the assumptions, models, and authors' individual inputs (based on their expertise in the subject) and the relative importance of these elements in producing the outcomes, and whether or not one's analysis can be reproduced by others.
2 Full references can be found at the end of the report in the ··List ofinternationally Published Research Assessed in This Report"
2

00385246 ,s,c;,.7J7) v . @ J~J?f 13
30 September 2009
We tried to express qualitative concepts that we were comparing in quantitative terms. That was not always easy. For this, we developed a simple scale with scores from 1 to 10 and employed this scale to all 12 sources. The result of this allowed us to assign an overall score to each source; through the overall score the sources can be compared. The scale and its results are discussed further towards the end of this summary.
In our comparisons, we also had to adapt some of the original estimates, especially those produced as intervals instead of point estimates, or if more than one estimate was produced by the same author in the course of time, or estimates expressed in relative instead of absolute terms (as percentages). The approximations were necessary in order to address our findings in a clear and transparent way. Any possible discrepancies with the original estimates are ours, but we sincerely hope we did not violate authors' original intentions.
In the remainder of the "Executive Summary" we present the reader with our major findings. We concentrate on two major issues, i.e. the population size of Cambodia in the 1970s and the death toll during Khmer Rouge regime. The remaining subjects are summarized very briefly in the final section of this Executive Summary which contains the numbers recommended for use.
Population of Cambodia in the 1970s
Statistical sources on the population of Cambodia during or around the period from April 1975 to January 1979 are non-existent. The last population census before April 1975 was taken in 1962 (Siampos, 1970; Migozzi 1973) and the next following after January 1979 in 1998 (NIS - National Institute of Statistics, 2002). This gives a data gap of 36 years; a gap that must be seen as a dramatic obstacle of reliably studying demographic developments in Cambodia in this period. Another barrier was related to the fact that a statistical evidence system of vital events, such as births, deaths, marriages etc., did not exist in Cambodia in the post-World War II period; it largely does not yet exist at the present time. A rough form of the administrative registration of vital events and socioeconomic aspects of the population was (and likely still is) in hands of village chiefs, and further commune leaders, and district and provincial authorities. Occasionally, these locally generated approximate basic figures were sent to the central statistical office in Phnom Penh for producing indicative country-level statistics about the Cambodia population. The 1980 administrative count of the Cambodia population is the most widely known example of these figures.
The bad data situation from the 1960s, 1970s and 1980s has improved in recent years. After the general population census of 1998 (GPC-1998; NIS, 2002), another one was completed in 2008 (NIS, 2008; preliminary figures are available at this stage for GPC-2008; not final). Both these censuses were conducted with subject-matter and financial assistance of the United Nations Population Fund (UNFPA), active in Cambodia since the 1993 UN sponsored first democratic elections in the country, and were also supported by several individual developed countries. Both these censuses satisfied professional requirements of the up-to-date world standard for the population census. Both provided reliable data on the population of Cambodia in recent years.
In addition to the 1998 and 2008 GPCs, several country-wide representative population surveys were as well recently conducted in Cambodia:3 Based on the 1998 census and some post-1998 surveys, three sets of population projections became available for Cambodia, of which the 2nd revised projections 1998-2020, based on the 1998 Census and the 2004 Cambodia Intercensal Population Survey (CIPS-2004; comp. NIS, 2005) are the latest ones. Notably, the 1st and 2nd revised projections
3 Compare the ·'List of Selected Recent Publications on Statistical Sources on the Population of Cambodia'·. attached at the end of the report.
3

00385247
30 September 2009
included as well a backward projection for a short period preceding the 1998 census, i.e. up until 1993, for which year the UNT AC data on registered voters are available and could serve as a reference standard for the 1993 projection. This part of the 1st and 2nd revisions (1993-1998) remains the same; the revised part relates to the years after the GPC-1998. All in all, the existing recent censuses and population projections reliably cover the period from 1993 to 2020. This is not the case with the period around the 1970s.
Table 1. Population of Cambodia According to Different NIS sources4
Source Population Population Population
Remarks Both Sexes Males Females
1962 Census 5,728,771 2,862,939 2,865,832 Reference rime ofcensus was the night on April 17-18, 1962
1980 General Demographic 6,589,954 3,049,450 3,540,504 With reference to the end of 19 80 Survey 1993-94 Socio-Economic 9,870,000 4,714,000 5, 156,000 Extrapolated population with reference to Survey of Cambodia April 1994 based on a sample of5,579
households 1996 Demographic Survey of 10,702,329 5,119,587 5,582,742 Extrapolated population with reference to Cambodia March 20, 1996 based on a sample of
20,000 households 1998 Census 11,437,656 5,511,408 5,926,248 With reference to March 3, 1998. Did
not include a few areas where conflict took place at the time of the census. Population in these omitted areas was estimated at 45,000.
2004 Cambodia lnter-Censal 12,824,000 6,197,000 6,627,000 Estimate of population in regular Survey households as ofMarch 3, 2004, as the
survey did not cover institutioml population, homeless population etc.
2008 Census 13,388,910 6,495,512 6,893,398 With reference to March 3, 2008. locludes estimate for non-response in resEect of some households.
Source: General Populatwn Census of Cambodia 2008. Provisional Population To1a/s_ National Institute o.fStatistics, Ministry of Planning .. Phnom Penh, Cambodia August 2008
Figure 5. Projected Population Size in Cambodia m (or around) Mid-1970, April-1975 and January-1979 by Various Authors
11,000 '
10,000 . .;..
9,000 ·~
8,000
7,00tl
6,1100 ,,
;,,;.·•· -+- Siampos
,..M -e- M.IGOZZI 197J
-.- UN2008
········~ .. ~ ~
... ;:~ -~· .. - - ·-- - -..
January· 1979
_.,_ NIS2000
CIA 1980
EAtviENG-TRY 1981
-VICKERY 1984
- KILTUNEN tEDl 1984
BANISTER -JOHNSC>N 1993
-SLIWINSKI 1995
-KIERNAN 1996
A HEUVELINE 1998
• NEUPERT • VIRAK 2005
Nole: NJ.\' 1975 appro:nmaled by UN 2008 esflma1efor 1975
4 All tables and charts included in the Executive Summary have the same numbers as in the report.
4

00385248
30 September 2009
E3/2413 l''Q Ow to 0
' ~ 'W~ If t. ~ v ;; . v /-/_
In the absence of population data generated by professional statisticians, alternative sources must be considered for the period around April 1995 and January 1979. Two such sources exist: the administrative population count for 1980 (end-year population) and the voters register from the 1993 elections. Both of them were assessed in our report as fairly acceptable, and the voters register for the 1993 elections exceptionally reliable. Both these sources, as well as other important sources on the Cambodia population (all mentioned above) are discussed in detail in Section 2.1 of the report. Basic population figures from these sources are attached in Table 1 (reproduced from Section 2.1 ).
Table 1 gives a general framework on population figures available for Cambodia since 1962. In addition to the statistical authority of Cambodia (i.e. the National Institute of Statistics (NIS), Ministry of Planning, Phnom Penh), several individual authors including those whose work is reviewed in the report, made their own highly diverged projections of the Cambodia population, or produced their own guesses on this population for the period between 1970 and 1979; these figures are summarized in Figure 5 of this report (reproduced below from Section 3.1 ). Note that Siampos (1970) and Migozzi (9873) were pre-war analysts; their projections for 1975 and 1979 resemble the "no-war/no-turmoil" scenario.
The CIA report of 1980 was the first one after the fall of Khmer Rouge to come up with what it then seemed highly reliable and detailed figures on the population of Cambodia between 1970 and 1979. CIA produced a clearly low estimate of the population in 1970 (7.06 mln), far lower than what the pre- l 970s leading analysts thought was the 1970 figure (Siampos (1970): 7 .143 min; and Migozzi (1973): 7.363 min). Consequently, CIA also produced a low April 1975 estimate (7.384 min) and a low January 1979 estimate (5.845 min). Notably, CIA assumed an unrealistically high level of excess deaths in the civil war of 1970-75, i.e. about 600,000 to 700,000 deaths. Interestingly, CIA did not explicitly report the excess deaths during the Khmer Rouge period of April 1975 to January 1979, other than by mentioning about 50,000 to 100,000 executions by the Khmer Rouge regime. The extremely transparent presentation of the CIA inputs and outputs, makes it possible, however, to calculate the overall level of all deaths in April 1975 to January l 979, and by distributing it fifty-fifty into natural and indirect excess deaths, one obtains the overall number of excess deaths under Khmer Rouge equal to about 1 million (comp. Section 3.3 and Annex 3).
The CIA report, although coming from an intelligence agency of one of the greatest political powers of the world that was intensively engaged in the 1960s and 1970s politics and wars in Southeast Asia, not signed with any names and not referring to explicit sources other than the CIA own expertise in the subject, and not subjected to a peer-review process (as it remained unpublished), had become extremely popular among international and national authorities and individual researchers in the 1980s and early 1990s. The CIA report had an extraordinary yet unjustified impact on the public opinion regarding the population size of Cambodia in the 1970s and about the death tolls in the civil war and in the Khmer Rouge regime. We see this report as a source for the magic number of 1 million death toll during Khmer Rouge regime and some serious misunderstanding about the population size in Cambodia in the 1970s. In our report we show that the authors such as: Ea MengTry, Vickery, Kiljunen (ed.), and Banister and Johnsons are those whose work closely resembles the CIA study; all of them produced the 1970s population figures and the death tolls under Khmer Rouge which are in line with what the CIA proposed.
Unlike the CIA analysts, we believe that the 1970s population size in Cambodia was in agreement with the estimates of Kiernan (1996, 2008), Heuveline (1998), and Neupert and Virak (2005). Of these three authors, Kiernan is a renowned historian with a remarkable experience in Cambodian matters working mainly with the qualitative approach; Heuveline and NeupertNirak are quantitative demographers, with outstanding academic and high-level international references. They published on
5

00385249 E3n413 :J 1' Lt.l!lo fJ I ' ·f'l.v 07; v· (!:' 40/ ~ y _
30 September 2009
the Cambodia's tragic decade in the 1990s (Kiernan earlier) and still continue working and publishing on these issues at present. It is remarkable that they came to similar conclusions on the population size and on the death tolls working from two very different methodological angles which eventually corroborated each other's results.
Kiernan proposed the mid-1970 population of Cambodia to be 7.363 million (fully consistent with Migozzi, 1973), April 1975 population 7.890 million, and January 1979 population 6.360 million. His reasoning when justifying these figures is purely qualitative. The strength of his approach is that he always uses multiple sources which he cross-references with each other. He combines results from research reports (such as Migozzi (I 973) or Sampson (I 977)) with those produce by official authorities (e.g. UN, 1974), any other relevant open sources, sample surveys, and his own interviews with knowledgeable persons.
Using the present-day standard population projection approach, i.e. the cohort component model, Heuveline predicted 7.662 million as the January-1970 population, 7.952 million as of around April 1975,5 and 6.437 million for January 1980 population.6 Neupert and Virak with the same method produced 7.412 million for mid-1970 and 6.803 million for mid-1980 (their number for January 1979 is unavailable).
The above mentioned projections are in line with the most likely April 1975 population of Cambodia defined in the report as an interval from 7.844 to 8.102 min, with the central value of 7.894 million; and with the interval of 6 to 6.418 min, with the central value of 6.209 million for January 1979 population. We accepted the two intervals after having completed a thorough review of major population sizes estimated by individual authors since the CIA report of 1980, and by statistical authorities, such as NIS (2000) and UN Population Division (2008), and after studying the intervals from the recent review article by Sharp (2008). 7 We consider these intervals as the most likely population figures for April 1975 and January I 979. Any death toll estimate for the Khmer Rouge period produced based on population figures falling outside these two intervals must raise serious doubts and eventually be rejected as unrealistic.
Table 15. Estimated Excess Deaths and Projected April 1975 Population
Category PopAprl975 Death Toll Average Direct
Reported Direct Excess .Excess
CIA 1980 7.384 0.976 75,000 50,000 to I 00,000 EA MENG-TRY 1981 7.460 1.000 120,000 120,000
RENAKSE 1983 7.098 3.314 569,000* Min 569,000*
VICKERY 1984 7.100 0.740 300,000 300,000 KILJUNEN (ED) 1984 7.300 1.000 112,500 75,000 to 150,000
BANISTER & JOHNSON 7.300 1.050 235,000 I 0% men 3% women ymmg- to mid-age SLIWINSKI 1995 7.566 1.879 986,000 Min 39.3 to 52.5% of all deaths KIERNAN, 1996, 2003 7.890 1.763 881,500 NA: estimated as 50% of the deatl1 toll HEUVELINE 1998 7.952 2.200 1,100,000 I.I min NEUPERT AND VIRAK 7.890 1.400 700,000 NA: estimated as 50% of the death toll ETCHESON 2005 7.952 2.200 1,100,000 I.I min HEUVELINE AND POCH 7.952 1.750 875,000 50% (0.75-1 min)
Notes: * Renakse reported about 569,000 deaths in the JOrest and bodies in prts; this was as.rnemd here as their minimum of drect excess deaths
Notes - continued: The April 1975 population is approximated in this table for: Renakve (as in UN (2008)), Etcheson (as in Heuve/ine (1998)), Neupert and Virak (as in Kiernan (1996)). For Heuveline (1998) and Heuvelme and Poch (2007), we used the April 1975 esnmate as given by Sharp (2008) based on his personal communication with Heuveline . All these approx1matiom were made as to resemble the authors' mast likely figures.
5 We quote this number after Sharp (2008) who refers to his personal communication with Heuveline regarding the April 1975 population. 6 According to Sharp (2008), Heuveline mentioned it would be about 6 million in January I 979. 7 Both intervals are as proposed by Sharp (2008). We cross-referenced his and our findings and concluded these intervals are the most likely ones.
6

00385250 E3/2413
PRPt'/1 ~ .· &> ¢~/ !_ /i_ 30 September 2009
Table 15 (reproduced from Section 5.3) summarizes which authors' estimates do fall within the required intervals for April 1975, and which do not. Noteworthy, the Renakse study and Etcheson (2005) do not rely on any population estimate. In Table 15, values have been assigned to them merely for repairing this gap. Sliwinski (1995) did not use the estimated 7.566 million population in the extrapolation of his survey results; he then applied a different size of the April 1975 population being 7. 768 million (his HI hypothesis), which we believe is close enough to the lower end of the most likely values interval for April 1975 population.
In the view of the above explanations, Table 15 indicates that CIA (1980), Ea Meng-Try (1981 ), Vickery (1984), Kiljunen (ed., 1984), and Banister and Johnson (1993) do not satisfy the required April 1975 population size and therefore must be treated as not reliable enough. With regard to the January 1979 population, out of the five identified unreliable studies, only Banister and Johnson's estimate does fall within the required interval; the remaining four do not.
Excess Deaths April 1975-January 1979: Sources
Parallel to our review of population estimates for Cambodia for the 1970s, we studied the estimates of excess deaths under the Khmer Rouge regime, including the sources and methods under which they were obtained.
Generally, no victim counts were produced for the Khmer Rouge victims by any author; however, two attempts tried to address this issue. One is the Renakse nation-wide popular survey of the early 1980s and the second one is the mass grave mapping project of DC-Cam. Despite of its good intentions, Renakse effort was not successful in producing a reliable count due to the lack of a reliable statistical framework. The DC-Cam mapping project has been largely successful; so far it identified an estimated 1.3 min human remains in the mapped mass graves, but the work is not yet finished and not validated other than by survivors statements.8 The proper exhumations of all these remains will never be done due to the large scale of the problem and gradual disappearance of the remains. A sample of exhumations could be certainly most useful but the sample would not offer a complete count of victims either.
All in all, victim counts do not exist for the Khmer Rouge regime. What exists and was used, were a number of small scale retrospective surveys conducted after 1979 and several popular sources based on monitoring of the situation in the 1970s and early 1980s by individuals and international organizations, such as for example the writings of Father Ponchaud ( 1978), reports and statements of international organizations such as Amnesty International or UNICEF, numerous press reports and research articles and books. All these sources are aggregate; no lists with victim names were usually compiled (except for S-21 and a few other occasional incidents). Unfortunately, popular sources are not a good replacement of professional statistical sources. They most certainly can provide some useful insights and contextual information but when it comes to victim numbers, these sources should be dealt with caution.
Sample surveys, although usually small or very small, were most certainly valuable as they increased the understanding of the Khmer Rouge victimization mechanisms and the victim numbers. However, none of these surveys could be seen as nationally representative and thus none could be used to produce the overall estimate of Khmer Rouge victims for the entire Cambodia.
8 There exists of course an extensive documentation of the location of the mass graves. For every site mapped so far, a DC-Cam mapping report is available and a related mission report. For a number of selected sites (about 20), OCIJ produced site identification reports that are basically consistent with the DC-Cam findings.
7

00385251
30 September 2009
E3/2413 dk'iQ/~ ta A <J) '~ I I ,, ;r. "' j; -
With respect to the population size in Cambodia in 1970s, data sources include population estimates by the authors themselves or by others. Note that official NIS projections did not exist for the 1970s; the UN projections even though did exist for the 1970s, remained basically unrevised prior to 1980 (i.e. for 197 5-79); thus were showing population development under "no-turmoil" scenario. In this situation, some authors based their estimates of the 1970-79 population on the pre-Khmer Rouge main studies of the 1962 census by Migozzi (1973) and Siampos (1970). Many authors relied on the estimates by CIA (1980). Additional estimates included by the authors are those by the Cambodia governments in the 1970s and early 1980s, including by Khmer Rouge themselves, and the (unrevised) UN Population Prospects. Occasionally, the 1980 or 1981 administrative population counts of Cambodia and the 1993 voters' registration were referred to as well.
Diversity and high uncertainty of the 1970s population estimates is a result of the lack of reliable statistical sources which could provide assumptions in relation to 1970s trends in births and deaths. Only one demographic and health survey is mentioned (Banister and Johnson, 1993) which could give some indications for the post-Khmer Rouge period (1982; Cambodia Ministry of Planning; methodology of which is not entirely clear and most certainly does not compare with the modem demographic and health surveys supervised by the World Health Organization - WHO). No other professional surveys were used by any author for the years 1970-79 as such surveys do not exist. Migration is hazily documented too, but at least some UNHCR, UNDP and local statistics exist (e.g. Cambodian Displaced Persons Working Group; in Huguet (1991)); good migration reviews are available too (e.g. Banister and Johnson (1993)) and could be referred to. That does not mean that the existing migration statistics are all consistent.
More recent studies, starting from around 1995, were more fortunate with sources for the post Khmer Rouge period. In 1995 Sliwinski published his Cambodia survey and provided new evidence about mortality and fertility changes during the 1970s and under Khmer Rouge regime in particular. Much could be learned from this new source about excess deaths and their causes, and about fertility and natural mortality trends. From the 1993 elections in Cambodia, an excellent individual level database became available of the registered 1993 voters. Heuveline (1998) used this data in his backwards projections of the Cambodia population until 1980. In 1997 Huguet used the 1996 Cambodia Demographic and Health Survey to estimate backwards the 1980 population which confirmed that the 1980 administrative count can be trusted. In 1998, the first modem census took place in Cambodia, whose data was used by Neupert and Virak (2005) for a reliable modern backwards projection until 1993. This projection gave a link between the 1998 census and the electoral rolls of 1993. All in all, the more recent studies (1995 and later) had a better statistical basis for the period after the fall of Khmer Rouge. The basis for the years after the 1962 census and during the 1970s remained the same in any estimate, i.e. poor.
Excess Deaths April 1975-January 1979: Methods
The papers reviewed in our report are not homogenous in character. Some are articles or book chapters focused exclusively on Khmer Rouge victims and other demographic consequences of this regime,9 some others concentrate on the population change in Cambodia in the 1970s and analyze this change as a subject in itself; 10 the remaining ones discuss it as part of a broader historical context. 11 Finally, some authors used unique Cambodian sources, such as DC-Cam mass grave records and Renakse petitions. 12 The question of victims remains central in all papers; the character
9 E.g. Heuveline (1998), Heuveline and Poch (2007), Sliwinski (1995), Kiernan (2003). 10 E.g. CIA (1980), Ea Meng-Try (1981 ), Banister and Johnson (1993 ), Neupert and Virak (2005). 11 Vickery (1984 ), Kiljunen (ed., 1984 ), and Kiernan (1996). 12 Etcheson (2000 and 2005) for mass grave statistics and '·Renakse Summary" of 1983.
8

00385252
ll&V)J<J.) J_
•30 September 2009
of a given study might have had some impact on the type of research approach applied. It seems, however, that the research discipline the authors belong to had a fundamental impact on the approach chosen for the estimation. Demographers and statisticians relied on (quantitative) population projections and (mixed quantitative and qualitative) scenarios, political and other behavioural social scientists on sample surveys, and historians on multiple sources including interviewing survivors and other relevant persons (e.g. state and international officials), generalizing sample surveys, studying documents, such as research information, letters, press reports etc., post-conflict visits to the country and direct inspection of the situation etc. Each of these approaches is valuable in some way and complementary to others; all of them depend heavily on the inputs used by the authors (i.e. data and assumptions). Whenever poor inputs were used the results cannot be seen as reliable and meaningful.
The following groups of methods can be distinguished in the studies assessed in this report: Demographic balancing equation: Excess deaths as part of the demographic balancing equation for the "Population Decline" or "Population Loss" between April 1975 and January 1979 Population Scenarios: two variants were applied, unrestricted and restricted; the restriction involved using the 1980 population size and age- and sex-structure as a limit for the population development between 1975 and 1980 Extrapolation of Sample Surveys Results over the Entire Population Excess Deaths as a Residual Category between Two Projections Excess Deaths as Linked to Mass Grave Statistics Excess Deaths as a Nai"ve Estimate from Nation-Wide Investigation
Table 6 (reproduced from Section 2.4) gives a quantitative summary of our expert assessment of the sources, methodology, and transparency used in the international and local research on Khmer Rouge victims in Cambodia. For this summary we developed a scale (attached under Table 6) which allows for verbal expression of our scores. The maximum possible score is 40 per one estimation approach. None of the approaches used for Khmer Rouge victims obtained the maximum.
Table 6. Quantitative Assessment of Estimates of Khmer Rouge Victims Studied in This Report Approach Sources Methods Transpa~ncy Convincing Power Total Seo~ Demogi-aphic balancing equation 4 4 4 2 14 Population Scenarios 4 6 6 6 22 Extrapolation of Sample Surveys Results 5 7 8 8 28 Excess Deaths as a Residual Category 5 8 8 8 29
Excess Deaths as Linked to Mass Grave 5 7 8 8 28
Excess Deaths as a N aiVe Estimate (Renakse) 4 4 4 2 14
Scale: 1-10
J. mis/eadmg 2. worthle.r.os 3 \'erybad ./-.failed 5. average
6 .. wl1.\faclory 7. good 8. l'ery good 9. excellent 10. exceptional
According to Table 6 the most valuable studies are those that obtained excess deaths as a residual category of two separate projections. The authors of these studies include Heuveline (1998) and Neupert and Virak (2005). The second best are extrapolations based on sample surveys (Kiernan (1996), Sliwinski (1995), Heuveline and Poch (2007)), and on mass grave data (Etcheson (2000 and 2003). The difference between the first and second scores is very small, practically insignificant. The least valuable studies are those prepared using demographic balancing equations, scenarios and the Renakse petitions. The number of Khmer Rouge excess deaths estimated in the highest rank studies ranges from about 1.4 to 2.2 millions. Violent excess deaths equal from approximately 700,000 to 1.1 million.
9

00385253
30 September 2009
Excess Deaths as a Residual Categorv
E3/2413
"A~. '@ '&'@ 't'f PJ\Jff J . I I I
In this method an estimate of Khmer Rouge excess deaths is obtained as a residual category between two projections, one forward and one backward, that meet at the end of the 1970s. Heuveline (1998) and Neupert and Virak (2005) applied this method. A formal model is applied with well justified assumptions. The model represents the most up-to-date demographic standard in population projections. The level of subjectivism is low compared with other approaches. Both authors build up on the work of others but are critical and selective of their results. Neupert and Virak stop at presenting the overall number of excess deaths in 1970-79 (and its sex and age distribution). Heuveline goes further and separates violent and non-violent excess deaths from each other, and next subtracts civil war deaths from all 1970-79 excess deaths obtaining his estimate of Khmer Rouge victims. The separation of violent deaths and their distribution into pre-Khmer Rouge and Khmer Rouge period is certainly convincing in Heuveline's work. Interpretation of his results could be more focused on the most likely variant as his range of all possible values of the number of victims in 1970s is extremely unrealistically large. Heuveline's estimates also need to be improved by including births since 1970 and their mortality and by separation of victims of starvation in 1979 from the estimated excess in 1975-79.
Extrapolation of Sample Survevs Results
Extrapolation of sample surveys results over the entire population was done by several authors, most importantly by Sliwinski (1995), Kiernan (1996) and Heuveline and Poch (2007). This approach is often applied in the estimation of conflict mortality world-wide. It has as many advantages as shortcomings, however. What matters is the quality and reliability of the survey material and, secondly, of the population estimates at the beginning of the conflict period. The major drawback of retrospective and surveillance surveys (only such surveys were conducted for Cambodia) is their lack of nation-wide representativeness:
Random sample surveys are not suited to provide representative record of victimization in the entire population of a conflict-affected country because respondents are selected from survivors, among whom the victims of the most dramatic episodes are underrepresented. Convenience samples could be a better alternative, especially if they were selected following the historical development of the conflict. But convenience samples are highly unpopular among researchers who wrongly believe that only random surveys are the appropriate tools. Sample drawing mechanism might produce a significant bias if it is in disagreement with conflict development; e.g. camp samples will correctly represent the victim populations from the areas the camp respondents moved from before arriving in the camp, but not necessarily the rest of the country population. Some groups of respondents might see the survey as a form of registration for aid distribution; this might cause another bias of over-reporting of survivors. There is a recall bias in sample surveys; more distant surveys are known to contain more gaps and misreporting than the early ones.
Surveys have huge advantages too, most importantly completed usually within a short period of time surveys can provide large quantities of extremely relevant information about the conflict and its victims, including the death rates that can be estimated without knowing the actual population size. In addition to this, surveys are easy to implement, require limited resources, and data quality can be efficiently controlled.
Several surveys were reviewed by Kiernan ( 1996, 2008) as part of his historical investigation of the victimization in the Khmer Rouge period. Kiernan as well uses additional materials when exploring victimization issues, such as his interviews with survivors and witnesses to the events under Khmer Rouge, observations from his frequent visits to Cambodia, relevant statistics from the work others,
IO

00385254
30 September 2009
E3/2413 PA'b)h. CV lftlJ~Ji_
his personal communications with persons working in this field etc. Kiernan is the only author that integrates the results produced in a number of different surveys and survivors recollections into his integrated estimate of death toll under Khmer Rouge. The strength of his approach is that he does that on the basis of respondents' social and ethnic group; thus not by applying a single percentage obtained in one survey to the entire population of Cambodia in April 1975. He breaks down the April 1975 population into sub-populations, such as the NEW and BASE people, and within these groups into a number of sub-groups, i.e. Rural Khmer, Urban Khmer, Chinese, Vietnamese, Lao, Thai etc. Each of these sub-populations is assigned a different estimated percent of excess deaths which is further used in the extrapolation over the entire population. This makes Kiernan's approach truly remarkable.
If, however, one would like to base one's views exclusively on the surveys and neglect other sources, several of the surveys would appear too small and too insignificant to be taken seriously. The sample of 158, 168 or 350 individuals as in Ebihara (1993) and Honda (1981) can be considered a special case study and no more than that. Only three surveys seem to be large enough to accept them as serious representations of large groups of the Cambodia population that survived the Pol Pot reigns, i.e. Heder (1981 ), Sliwinski ( 1995) and Heuveline and Poch (2007). Yet even these three do not pretend to be representative of the entire population exposed to the risks of death under Khmer Rouge. It is likely that the victims of the most fatal episodes of Khmer Rouge regime are underrepresented in all three surveys. All three studies are consistent in the estimated death toll of Khmer Rouge; in the three surveyed populations the death toll is estimated at about 20 to 25 percent.
As we already noted, surveys like Heder's, Sliwinski's and Heuveline and Poch's are not that small and not that questionable. Sliwinski for example had drawn his sample from three different populations of survivors and in different periods of time (see Annex 3 for details and selected results on Khmer Rouge victims); all periods are not that distant from the fall of Khmer Rouge in January 1979. With the total number of the interviewed families being 1,296 and covering the fate of 13,163 individuals this survey is exceptional. Sliwinski estimated that the survey-based proportion of excess deaths under Khmer Rouge in the 1975 population was about 25 percent.
Another important example of a reliable sample survey is the Mekong Island Population Laboratory (MIPopLab), a demographic surveillance system established recently by Heuveline and Poch (2007) in the Kanda! province near Phnom Penh. MIPopLab is an on-going demographic surveillance system launched in December 2000 in a rural district of Kanda! province. The population of this district is about 10,000 persons and is questioned systematically once per year regarding their basic demographics. A special module was designed in the MIPopLab survey to explore demographic consequences of Khmer Rouge regime, including excess mortality, disruptions in marriage formation and reproductive behaviour. The module includes births and marriage histories of all women aged 15 to 75 years (2,843 histories were obtained). Data on parental survivorship were collected from all respondents of the Kanda! district. Using this data, several important results were obtained not only on excess mortality but as well on declines in fertility and marriage formation during Khmer Rouge period. The MIPopLab proportion of excess deaths of Khmer Rouge regime in the population was about 25 percent.
Excess Deaths as Linked to Mass Grave Statistics
This method was applied by Etcheson (2000 and 2005). Excess deaths of Khmer Rouge, 1975-78, are composed in his approach of two parts:
- direct excess deaths seen as the number of human remains in the mass graves mapped so far
11

00385255 E3/2413 a ~" ~ '~ ~A~ I IV yo,. f ~ I 2
30 September 2009
- indirect excess deaths, whose number remains about the same as the number of individuals in the mass graves.
The proportion between the two components (i.e. direct and indirect excess deaths) equals 50:50 and is assumed after Heuveline (1998). Other proportions available from literature (and based mainly on small sample estimations) are seen as not reliable enough to be used; these other proportions relate to narrower groups of the population. 13
It is unquestionable that the data from the DC-Cam mass grave mapping are an essential source on victims of the Khmer Rouge regime in Cambodia. Thus, using this data for an estimate of victims not only makes a lot of sense but is important and needs to be done. It is unquestionable that a vast majority of victims in the mass graves, if not all, are Khmer Rouge victims (violent or non-violent). The assumption that all victims found in the mass graves were killed in executions might be difficult to prove, however. One reason for this is that non-violent excess deaths were most certainly frequent during Khmer Rouge regime. It is unlikely that such deaths, if occurred in detention centers, were buried in locations other than the mass graves. Also some non-violent excess deaths from hospitals might be buried in the nearby mass graves. Another reason for this is that the usual burial practices were forbidden by Khmer Rouge and thus not commonly exercised during this period. Thus, some marginal numbers of "natural" deaths might be found in the mass graves too, especially in smaller graves located in a distance from detention and security centres. Despite of the fact some non-violent excess deaths were likely buried in the mass graves together with victims of executions and interrogations, all the victims in the mass graves cannot be considered natural deaths. The category of natural deaths must be seen completely marginal under Khmer Rouge as life circumstances the Khmer Rouge regime created for their population prevented natural death and forced unnatural death instead.
Another aspect of the massive death process during the Khmer Rouge period is that many bodies were abandoned and left on the surface exposed to the devastating and quickly progressing atmospheric influences in this region of the world; thus, a large number of bodies were never buried in mass graves but decomposed on the surface. Many other bodies were dropped into rivers, wells, single pits and whatever other (often small) places which were equally strongly exposed to the hot and humid natural environment as the unburied bodies. It is therefore highly probable that the mass grave victims identified today are just a sample of all excess deaths.
The identified graves should be thus seen as a "burial-place-sample" of all people that died as war victims during that time. Some 30 years after the end of the Khmer Rouge era the sample contains about 1.3 million remains as estimated from the current DC-Cam mass grave statistics. It is fully possible that the mass graves identified so far comprise about 50-60% of all buried and unburied individuals. It is likely that the bodies in the graves represent both executed and indirect Khmer Rouge victims; the proportion between them will vary between the different graves. In any case, it is a large and important sample and must be further studied for unfolding information about how many, how and when these persons died.
For the above reasons, we consider Etcheson's estimate of 2.2 million excess deaths fully plausible and in line with the most serious attempts of estimating the excess deaths in Cambodia.
13 The fifty-fifty distribution of violent and non-violent excess deaths is likely a good compromise that is strongly supported by Heuveline 's solid analysis of excess deaths for Cambodia using model life tables.
12

00385256
30 September 2009
Demographic Balancing Equation
E3/2413 ~Q~,,. .. £() J l{r-tt " ; s;s. >4-1
At the opposite end of our assessment of the methodologies used for various estimates of death toll under Khmer Rouge are three approaches: demographic balancing equations, scenarios, and Renakse petitions.
Demographic balancing equation is the most approximate and unreliable method, disregarding whether it is applied to the population decline or population loss. There are three components of the equation: births, deaths (natural and excess), and net migration. The level of analysis is the entire population of Cambodia, not even the disaggregation by age and sex is applied. Population decline (in absolute terms) is analyzed by comparing the population size between April 1975 and January 1979. The population at the beginning and end of the analyzed period is decided first, usually on subjective grounds by brief reviews of estimates by others. In the second step, assumptions are made about the magnitude of births, deaths and net migration in 1975-79 in such a way as to satisfy the equation. In this puzzle, unlike in any real puzzle, there exist several variants of alternatively shaped "pieces" that will always add up to the overall decline. This method was applied by Ea Meng-Try (1981) and Vickery (1984)).
In the case of the population loss, instead of the 1975-79 decline, a difference is analyzed between the expected (under "no-turmoil" scenario) and actual population on January 1979. Both populations are decided first; both are very hard to predict. The components of the difference are again births (actually the births' deficit which is the difference between the expected and actual births), deaths (only excess) and net migration. The balancing equation explains that the difference between the expected and actual population on a given moment is the result of births' deficit, excess deaths and net migration. Again several alternatives exist that satisfy also this equation. The authors who used this method included Kiljunen (ed.; 1984) and Banister and Johnson (1993)); the latter in combination with several other more sophisticated analysis.
There exists a third variant of the demographic balancing equation as well. In this variant the "expected" January 1979 population expresses the population that would have been observed in the absence of excess deaths but under the actual natural growth and actual net-migration in April 1975 -January 1979. The annual growth is usually assumed much lower than before 1970 (say 1 % instead of the usual 2.8%). In this variant the difference between the expected and actual population on January 1979 are exclusively excess deaths, as births and net-migration are the same in both these populations.
In the absence of reliable data on the population size and structure, migration, and on fertility and mortality trends, the balancing equations have no value. They express no more than individual authors' subjective views on one of the many possible variants of population development during the Khmer Rouge period. The lack of more elaborate justifications in terms of methods and sources makes these methods hard to accept and subject to considerable distrust. Note however that demographic balancing equations can be also made as a final check up for the data resulting from a complex demographic estimation, i.e. population projection methodology or a scenario, for example. In this case the equation is not the source for its components, and for the excess deaths in particular. The equation is a summary of projection results and as such provides meaningful and important inputs. (Comp. Kiernan (2003 ), Banister and Johnson (1993) and Neupert and Virak (2005)).
Population Scenarios
Population scenarios, such as the one by CIA ( 1980) or Bannister and Johnson (1993), are more complex and better justified than the demographic balancing equations. Both these sets of scenarios
13

00385257
30 September 2009
are exceptional; both go very deeply into the details of the population development. The CIA presents a crystal clear method ("demographic accounting", i.e. a simple projection) which is based on numerous assumptions. Sources for the assumptions are generally called "intelligence" and "CIA analysts expertise". No list of detailed references is provided for the assumptions, which makes the CIA outcomes mysterious and questionable. Bannister and Johnson on the other hand provide numerous sources (mostly non-statistical) on every aspect discussed in their paper (except on Khmer Rouge victims). Their method used for obtaining their plausible scenario (and for their 1980-2050 scenarios) is somewhat unclear and the reader can judge about the method only from reading between the lines. Most likely it is a simple population projection restricted from above. Banister and Johnson impose the restriction onto the upper limit of the population change by taking the actual population size and age- and sex-structure from the year 1980, thus around January 1979, as the one being approached, in order to keep the plausible scenario as real as possible.
Scenarios are obviously based on a formal model describing population development, a model that has clear assumptions and uses transparently defined initial values of the population size. Once the model is run, its final outcome is the result of what has been put into it. CIA model has many additional structures, including the OLD and NEW people, six-month sub-periods etc. The additional structure makes the CIA model extremely transparent; anyone can re-run their analysis with the same or modified inputs. The transparency of Banister and Johnson's model is different: the detailed model structures are unclear but each statement has its verbal justification. All these features make scenarios attractive candidates to be considered worthwhile tools; the lack of reliable population data keeps the scenarios still questionable, although more convincing than the demographic balancing equations.
Excess Deaths as a Naive Estimate from Nation-Wide Investigation Exhumations of mass graves began in early 1979 and were continued in the 1980s within a nationwide effort at collecting evidence of Pol Pot's crimes. Several other types of evidence were collected at that time, including individual and group survivors statements called "petitions'', witness testimonies, research reports, documents, lists of victims, torture and detention facilities, intelligence centres, prisons etc. All these efforts were coordinated by the Research Committee into the Crimes of Pol Pot Regime (hereafter: "Research Committee"), again a creation of the Salvation Front Renakse, called then the Front for National Solidarity, Reconstruction and Defence of Kampuchea. The Research Committee had a whole network of its local units, including the provincial, district and other committees. The task of all these committees was to collect evidence that could be used in persuading the United Nations (UN) to remove the Khmer Rouge representatives from their sit in the UN General Assembly and offer this sit to the legible PRK government. The national Research Committee submitted their Summary Report to the PRK government on 25 July 1983; it contained the following main findings:
Death toll under Khmer Rouge regime: 3,314,768 persons, of which 568,000 were counted in exhumations and 2.75 min in other settings. Number of informants, i.e. persons who signed of finger printed the "petitions": 1,166,307
Acting upon their mandate, the Research Committee asked people to look into three aspects of Pol Pot's regime: the death toll, methods of torture and killing, and destruction of property. In order to achieve their objectives, they practically initiated and completed a nation-wide survey among several groups and hundreds of thousands of individuals and families. All these groups and individuals were instructed to look into these three areas of interest and write documents called "petitions" reporting on the consequences of Pol Pot's crimes and postulating the removal of Khmer Rouge for the UN sit. The petitions and other relevant documents were processed first at local and then national level and used to produce the final statistics on the death toll, informants and underlying documents (Annex 1).
14

00385258
30 September 2009
E3/2413 t:::'I ~.4Q • 7 # I <'e ,t:J l!
In the Renakse survey, no preparations in statistical sense were made at all. As far as we could see from any source materials, no standardized questionnaires were used, no trained interviewers were taking statements, no professional personnel was involved in the exhumations. Collecting all this evidence must be seen as spontaneous efforts based on qualitative data obtained from the respondents and actions taken based on the initiative of every Research Committee in the country. Importantly, several source materials stressed that with regard to the results, no pressure was exercised over the respondents; not over individuals and not over groups, and no instructions were given as to the outcomes of the survey. As such, the individual outcomes of the survey are likely true, valuable and meaningful. The same, however, cannot be said about the general country-level statistics presented in the Renakse Summary Report on 25 July 1983.
The main reason for this conclusion is that the degree of duplication among the death toll of 3.315 min must be enormous. DC-Cam estimated this degree to be around 50% (after Etcheson, 2000), In addition to duplicates there are other problems, namely incompleteness; the Renakse death toll is still incomplete as only 15 provinces are listed in the Renakse Summary Report out of 21 (see DC-Cam report, March 21, 1999). It is also unclear what fraction of all actual deaths is reported for each province. The above mentioned problems are related to the lacking statistical framework of the Renakse survey that implies it is impossible to assess the degree of coverage of Renakse statistics. As such, the Renakse death toll of 3.315 min must be disqualified from considering it a reliable estimate of Khmer Rouge victims.
Excess Deaths April 1975-January 1979: Estimates
Figure 7 (reproduced from Section 3.3) shows that the early estimates of excess deaths (i.e. those published between 1980 and 1993 excluding Renakse), consistently approach the magic figure of 1 million, quite popular in the media, politics and research in the 1980s and early 1990s, except of that by Vickery (1984) which is 740,000 and is the lowest among all ever made. Later estimates, made between 1995 and the present time, are evidently higher than 1 min and range from 1.4 (Neupert and Virak (2005)) to 2.2 million (Heuveline (1998) and Etcheson (2005)).
Figure 7. Excess Deaths Estimates during Khmer Rouge Regime, April 1975 to January 1979. Varous Authors 14
2.500
2JIOO
l.500
1.000
0.500
0.000
Excess Deaths, April 1975-January 1979 (millions)
2.200 l.879
1.763
"-_97
_'' --._:l.tlOO 1.000 _ _..,..,- 1.050
0.740
~ / mo
I 1.400
CIA 1980 EA MENG- VICKERY KILJUNEN BANISTER& SLIWINSKI KIERNAN. HEUVELINE NEUPERT ETCHESON HEUVELINE TRY 1981 1984 (ED) 1984 JOHNSON 1995 1996. 2003 1998 AND VIRAK 2005 AND POCH
l 993 2005 2007
I4 This and the following figures contain some approximations and averages of original estimates. All approximations
were calculated by the authors of this report.
15

00385259
30 September 2009
Clearly there was a shift in the scientific thinking about excess deaths caused by the Khmer Rouge regime sometime in the mid- l 990s. Regarding the reasons for this shift, some could argue data situation improved in Cambodia in the years after the 1993 elections and a better understanding of the tragic decade became possible. Some others would, however, insist on a better political climate that influenced the more courageous analysis of the demographic consequences of the 1970s. Both mechanisms could have been at work; in addition to them several other factors could have played a role as well, including a new generation of talented modern researchers, and in particular quantitative demographers and population statisticians that engaged in studying the Cambodian tragedy of the 1970s. They brought in fresh methodological approaches and new experience in dealing with deficient data. All in all, contrary to the frequent adjustment of conflict statistics from relatively high to relatively low in other contemporary conflicts of the world, for Cambodia the adjustment had the opposite direction.
The prevailing views of today indicate that excess deaths of Khmer Rouge time in Cambodia were between 1.4 to 2.2 millions. Notably all estimates from this range belong to those most advanced methodologically. Sample survey extrapolations, deaths as a residual between two projections and mass grave statistics are all covered in this interval.
Some would argue that uncertainty of excess deaths estimates is enormous, much higher than the interval 1.4 to 2.2 millions. And indeed Heuveline (1998) who provided the broadest assessment of uncertainty ever, produced an interval of 0.68 to 3.26 min for possible excess deaths in 1975-79 (1979 included as a whole year). 15 He explains why his uncertainty range is so large: "these were the rules of the exercise that 1 set for myself each parameter of the reconstruction included a priori all existing estimates in the range of values" (Heuveline (1998), p. 60). Thus from definition, this interval contains Vickery's extreme estimate of 740,000 excess deaths, not to mention the early estimate of 1 million. However, having produced the interval, Heuveline separates himself from it by saying: "If pressed to provide my subjective assessment, the estimation range would be much narrower; 1 would venture 2.2 to 2.8 million in 1970-79 and 1.5 to 2 million in 1975-79 alone." (Heuveline (1998), p. 60).
All in all, in order to give as realistic assessment of uncertainty as possible we follow the logic of Heuveline's statements quoted above. Compared with Heuveline's subjective assessment of uncertainty (1.5 to 2 min), the interval we identified based on our review of the recent estimates of Khmer Rouge excess deaths, is broader. The interval of 1.4 to 2.2 million is broader because of its lower end of 1.4 min derived from Neupert and Virak (2005) and upper end of2.2 min by Heuveline himself and by Etcheson (2005). 16 While in case of Heuveline's analysis it would be relatively easy to adjust down the upper end, which contains as well starvation deaths in 1979, to about 2 min, we have no good reasons to make any adjustments to the lower end. Importantly, the number of 2.2 min was proposed as well from mass grave statistics by Etcheson (2005). We therefore believe that an accurate description of uncertainty of the excess deaths estimates made so far is contained in the interval of 1.4 to 2.2 millions.
15 The range of 0.68 to 3.26 for 1975-79 can be obtained from Heuveline 's Table 3 (p. 60 of his 1998 article). The main principle of the calculation is that all indirect excess deaths shown in Table 3 for 1970-79 (0.08-1.12-1.126 min) need to be associated with 1975-79 and not with the civil war of 1970-75. Heuveline confirmed that in personal communication with Ewa Tabeau on 27 June 2009 in Phnom Penh. The sum of indirect and direct excess deaths Heuveline estimated for 1975-79 is thus: 0.68-2.22-3.26 millions. 16 The number of 1.4 million is actually our product based on Neupert and Virak's estimate of excess deaths in 1970-79. We obtained this number by subtracting an assumed 275,000 excess deaths in 1970-75 and about 300,000 famine deaths in 1979 from the 2 million excess deaths in 1970-79 produced by Neupert and Virak. If the same 300,000 famine deaths are subtracted from Heuveline's upper end of 2.2 millions. his upper number becomes 1.9 million.
16

00385260 9 Q,'19 fa f ) 8 I ,JP/1f 13
J. I I' · ' -
30 September 2009
Sharp (2008) used his best population figures to produce yet another estimate of death toll under Khmer Rouge, 2.18 million with lower and upper end being 1.747 to 2.495. 17 This estimate pushes towards higher values of the death toll. It is based on consistent population figures for 1975 and 1979. It does help to narrow down the interval we identified 1.4 to 2.2 millions. Notably, only one estimate from our interval is outside Sharp's range, i.e. 1.4 min by Neupert and Virak (2005), which is too low to fit the lasted views of death toll. Also the upper end by Sharp has little justification. Therefore, the new interval could be 1.747 to 2.2 million deaths. Within this group Sliwinski (1995), Kiernan (1996, 2003), Heuveline (1998), Heuveline and Poch (2007), and Etcheson (2005) produced their major estimates (Table 15). To be, however, conservative, we believe that it is rather Kieman's initial estimate of 1.6 min excess deaths that should be taken as the lower end for the final range of death toll under Khmer Rouge, which becomes: 1.6 to 2.2 million. The 1.6 min is the result of assuming most conservatively that the overall death toll reflects about 21 % of the lowest most likely population projected for April 1975 (7.844 min). Note that Neupert and Virak's estimate does not fall within this range.
Figure 8. Violent Excess Deaths Estimates during Khmer Rouge Regime, April 1975 to January 1979. Various Authors
1.200.0tMJ
1.1100.()()() ;
800.000 i
6110.000 :
400.000
200.000
Violent Excess Deaths, April 1975 - January 1979
"\I.I 00.000 /''·.J IOO OIM} 986.000 / \ / .. ~
/~~ . \ .·''// ~ , 875.000
, \/ I ,., 100.000
I I
~·· li35.000
7~/f20lHKI ~·
CIA 19811 EA MENG- VICKERY KILJUNEN BANISTER& SLIWINSKI KIERNAN. HEUVELINE NEUPERT ETCHESON HEUVELINE TRY 1981 1984 (ED) 1984 JOHNSON 1995 1996.2<KJ3 1998 ANDVIRAK 2005 AND POCH
1993 20115 2007
Notes: The following were the approximations used m the above chart:
Kiljunen (ed}: average of7j,OOO to 150,000
Banis/er and Johnson: 10% men at 15-6-1 years of age and 3% women at 15-6./ years m 7.3 min in Apr 1975
(Migom gives 49.5% of 15-64 years old in 1970; Siampos gives fifty-fifty of men-to-women at these ages for 1962) Sliwinski: average of 52.5% of, all excess deaths (taken as an average of his 2 variants)
Kiernan: 50% of all excess deaths; 50% - subjective choice of ET
Neupert and Virak: 50% of all excess deaths - sub1ect1ve choice of ET
Figure 8 (reproduced from Section 3.3) visualizes estimates of direct excess deaths (i.e. executions or killings). The picture is striking. All early estimates (1980 to 1993) consistently show clearly low levels of killings equal from about 75,000 to 235,000. Sliwinski (1995) was the first author who came up with a number of around I million. Heuveline (1998) confirmed this scale in his formal analysis (based on model life tables) of direct and indirect excess deaths producing 1.1 min violent
17 Sharp (2008) obtained his estimate by using the general population loss equation. In this approach the expected January 1979 population is central which he obtained by applying the expected natural growth rate during the Khmer Rouge years to his April 1975 population. Excess deaths were thus excluded from the expected population. He obtained excess deaths by subtracting the actual January 1979 population from the expected population in the same period. His estimate is thus produced from a method which is not highly valued but in this case it is based on a solid analysis of the underlying population figures and indicators of the population change between April 1975 and January 1979.
17

00385261
30 September 2009
E3/2413
-0 ·e ' ~ 'Iii~ '• > ' rrv;o.v 1 7212-
deaths in the 1975-79 period. 18 Also Etcheson (2005) strongly supports the finding that at least 1.1 million deaths during Khmer Rouge regime were violent. As we showed earlier in this report the number of human remains in mass graves is even higher than 1.1 min and equals 1.3 million according to cunent statistics. Summing up, it seems that early estimates heavily underestimated the scale of the actual killing by the Khmer Rouge. According to the latest results, the scale was about I million, and belonged to a broader interval of 0.7 to 1.3 millions. This interval, after the final correction, becomes 0.8 to 1.3 million. 19
The Numbers: Estimates of Khmer Rouge Victims Recommended for Use
The scope of this report was much broader than the above summary of the population size in Cambodia in the 1970s and excess deaths under Khmer Rouge. Several related subjects were discussed in this report too, including: excess deaths and migration during the civil war of March 1970 to April 1975, migration under Khmer Rouge, and suffering of ethnic and religious groups under Khmer Rouge. Due to the lack of space we are unable to summarize all these subjects the same way we did it for the population size and death toll under Khmer Rouge. Below we include the most essential observations and results from our study:
General Observations:
There is generally a lack of reliable statistical sources on the Cambodia population for the period from April 1975 to January 1979; sources on the population itself, and sources on deaths, births and migration (internal and external) are largely non-existent. Sources that are the closest to the Khmer Rouge era include the 1962 population census, the 1980 administrative population count, and the UNT AC voters' registration for the 1993 elections in Cambodia. These statistical sources together with a number of the existing sample surveys, research reports, individual survivors' accounts, reports of international observers, journalists, NGOs and individual researchers' opinions etc. is all that can be used in estimating the death toll under Khmer Rouge regime. Estimates of the population size in mid-1970, April 1975 and January 1979 (or end-1978) are essential for any estimate of excess deaths in this period. Yet there is a wide range of estimates produced by various authors and there is a need to narrow down this range to the most likely figures. Not all estimates of the estimated population sizes are realistic; especially the early estimates produced directly after the fall of Khmer Rouge and motivated by the CIA (1980) report seem to be incorrect. Estimation methods used to produce excess deaths under Khmer Rouge are not all equally sound, transparent and reliable; some must be rejected as not satisfying the basic standard of reliability. The more reliable methods include: sample survey extrapolations used jointly with other sources, death toll as a residual of two population projections, death toll as linked to mass grave records. The largely unreliable methods include: demographic balancing equation, demographic scenarios, and naive estimates from the Renakse nation-wide survey. Estimates of Khmer Rouge victims must be placed in a broader context of war victims and migration during the civil war period (1970 until April 1975), which we summarized in the lines below.
18 Heuveline's original number of violent deaths in 1975-79 was I. I million (medium variant); this number might cover a few famine deaths in 1979. (Comp. Heuveline (1998), p. 58). 19 The lower end is corrected by taking Kiernan's minimum of 1.6 min excess deaths as the basis for 50% of violent deaths. The upper end corrected by taking the today's estimate of 1.3 min remains in the mapped mass graves.
18

00385262 ~a {j It I ,zµ,,,a?ffl413 PP 6 )Io -
30 September 2009
As well, migration patterns during the Khmer Rouge regime need to be taken into account when assessing demographic consequences of the Khmer Rouge regime. Finally, it is clear from our review that ethnic and religious groups suffered much more than the rest of the Democratic Kampuchea population. Relevant statistics on this subject are included below.
Detailed Results: The following authors relied on estimates of April 1975 and January 1979 population that fall within the range of the most likely values: Kiernan (1996), Heuveline (1998), and Neupert and Virak (2005). Sliwinski (1995), Etcheson (2000, 2005) and Renakse did not explicitly estimate the population size for their excess deaths estimates, and can be thus considered as legible candidates for the most reliable figures on excess deaths under Khmer Rouge, except for Renakse that must fade out for other reasons. (Mainly because of the lack of statistical framework for their nation-wide survey and resulting problems, such as duplicates and incompleteness of their findings). The excess deaths of about 1 million estimated for the Khmer Rouge period in the 1980s studies and early 1990s are not reliable enough; they must be rejected as not fulfilling the population size and/or appropriate methodology criterion. The following authors produces estimates of excess deaths that fall within the range of the most likely values, are methodologically sound, and transparent: Kiernan (1996), Sliwinski (1995), Heuveline (1998), Heuveline and Poch (2007), and Etcheson (2005).
The Numbers:
Population in April 1975: 7.844 to 8.102 min, with the central value of 7.894 million Population in January 1979: 6 to 6.418 min, with the central value of6.209 million. Civil war death toll: most likely 250,000 out of 150,000 to 310,000 most likely possible. Internal and external migration during the civil war: uncertain but possibly up to 3.389 min; a majoritv- internal Population of Phnom Penh in April 1975: most likely 1.5 to 2.6 million Death toll under Khmer Rouge: most likely 1.747 to 2.2 min out of 1.6 to 2.2 min Violent deaths under Khmer Rouge: most likely 50% of the overall excess deaths, i.e. from 800,000 to 1.3 million Out-Migration under Khmer Rouge: 218,000 to 268,000; of which 150,000 to 200,000 to Vietnam, 34,000 to Thailand, and 10,400 to Laos Suffering of Ethnic and Religious groups: Chams: about 36% perished; Chinese 50%; Lao and Thais: 40%, and almost all Vietnamese perished as well; as compared with the average rate for Khmers being on estimated 18. 7 percent.
19

00385263
KHMER ROUGE VICTIMS IN CAMBODIA, APRIL 1975 - JANUARY 1979 A CRITICAL ASSESSMENT OF MAJOR ESTIMATES
EXPERT REPORT FOR THE EXTRAORDINARY CHAMBERS IN THE COURTS OF CAMBODIA
EWA TABEAU
30 September 2009
Executive Summary
1. Background Information about this Report 2. An Overview of Sources Assessed in this Report
2.1. Sources on the Population of Cambodia since 1962 2.2. "Renakse" Petitions and 1980s People's Exhumations 2.3. DC-Cam and Mass Grave Mapping 2.4. Internationally Published Research on Excess Deaths: Sources and Methods
3. Excess Deaths and Related Issues in April 1975 - January 1979: Summary of Results 3.1. Population of Cambodia, 1975-79 3 .2. Migration Patterns in Cambodia, 197 5-79 3.3. Basic Statistics on Overall Excess, Violent and Indirect Deaths 3.4. Excess Deaths among Ethnic and Religious Groups
4. Excess Deaths and Related Issues during the Civil War in Cambodia, March 1970 - April 1975: Summary of Results 4. I. Basic Statistics on Excess Deaths, I 970-75 4.2. Displaced Population and the Size of Phnom Penh, 1970-7 5
5. Final Assessment of Major Estimates on Excess Deaths and Population in the 1970s 5.1. Death Toll in the Civil War, March 1970 to April 1975 5.2. Population in April 1975 and January 1979 5.3. Death Toll under Khmer Rouge, April 1975 to January 1979 5.4. Why Vickery is Wrong? 5.5. "The Numbers": Estimates of Khmer Rouge Victims Recommended for Use
List of Cambodian Sources Assessed in this Report List of Internationally Published Research Assessed in this Report List of (Additional) References List of Statistical Sources on the Population of Cambodia in Recent Practice List of Selected Recent Publications on Statistical Sources on the Population of Cambodia List of Acronyms
Annexes Annex 1. Renakse Summary Statistics on Khmer Rouge Victims, 1975-79 Annex 2. Up-Date on DC-Cam Statistics on Mass Graves and Mass Graves Victims Annex 3. Summaries of Existing Estimates Assessed in this Report Annex 4. Selected Population Projections for Cambodia

00385264 AA l 1 g l~Jll'f.113 PF6) P 0 . r: J .!.._
1. BACKGROUND INFORMATION ABOUT THIS REPORT
This report has been made in response to the Expertise Order No. 0140, from 10 March 2009, Office of the Co-Investigative Judges, Extraordinary Chambers in the Courts of Cambodia (hereafter: "OCIJ order"). Its goals are exactly as those specified in the OCIJ order and include the following:
I) Determine, to the extent possible:
a) The population of Cambodia on 17 April 1975 and on 7 January 1979. and the number of deaths in the intervening period;
b) Specifying, where possible, the national, religious and/or ethnic origin of the deceased; and distinguishing between
c) The causes of these deaths, in order to be able to determine those which arc due, directly or indirectly, to policy implemented by the CPK and those which arc due to external factors;
2) To that end, you will take into account all historical, political, economic or other factors occurring before, <luting or after the relevant period;
3) Specify all statistical data and/or estimations of the population used for the expertise and provide an analysis of their reliability;
4) Explain the methodology/methodologies used in the conduct of this e.xpcrtise; and
5) Make any other useful observations.
The project took five months from May to September 2009. The international expert, Ewa Tabeau, visited the Extraordinary Chambers of the Courts of Cambodia in Phnom Penh between 7 and 28 June 2009 and in the remainder of this period she worked in The Hague. The national expert, They Kheam, was based in Phnom Penh during the entire duration of the project.
The project did not attempt to produce new estimates of the population size in Cambodia in April 1975 and January 1979 and no new estimates of excess deaths of the Khmer Rouge period were generated either. Our task was to give an expert assessment of the major existing estimates and recommend those estimates that satisfy scientific requirements of this research area and can thus be used in court proceedings.
Three groups of sources were studied and assessed in this project: Statistical sources on the population size in Cambodia since 1962 National Cambodian sources on excess deaths during the Khmer Rouge period and in the entire decade of the 1970s Internationally published research on excess deaths during the Khmer Rouge period and in the entire decade of the 1970s
Our assessment was based on a critical review of the following elements: Data sources used for producing the estimates Methodologies applied in obtaining the existing estimates Transparency of presentation of the results Consistency with other authors and common findings
This report comprises five sections. Section 1 contains background information about this report. Section 2 introduces the sources assessed in this report. Section 3 gives an overview of main statistics on the population size and excess deaths in Cambodia in April 1975 to January 1979 as obtained by various authors. Section 4 discusses the same issues in relation to the civil war in
2

00385265 ro ~Ms , ::y '4ft!!E~~~ 13
I 1/ I ,
Cambodia in the first half of the 1970s. Section 5 contains our final assessment of major estimates on excess deaths in March 1970 to April 1975 and in April 1975 to January 1975 and on the population in April 1975 and in January 1979. The last sub-section in Section 5 (5.5) gives recommendations on the best estimates of Khmer Rouge and civil war victims and the related population figures.
2. AN OVERVIEW OF SOURCES ASSESSED IN THIS REPORT
2.1 Sources on the Population of Cambodia since 1962
Statistical sources on the population of Cambodia during or around the period from April 1975 to January 1979 are non-existent. The last population census before April 1975 was taken in 1962 (Siampos, 1970; Migozzi, 1973) and the next following after January 1979 in 1998 (NIS - National Institute of Statistics, 2002). This gives a data gap of 36 years; a gap that must be seen as a dramatic obstacle of reliably studying demographic developments in Cambodia in this period. Another barrier was related to the fact that a statistical evidence system of vital events, such as births, deaths, marriages etc., did not exist in Cambodia in the post-World War II period; it largely does not yet exist at the present time. A rough form of the administrative registration of vital events and socioeconomic aspects of the population was (and likely still is) in hands of village chiefs, and further commune leaders, and district and provincial authorities. Occasionally, these locally generated approximate basic figures were sent to the central statistical office in Phnom Penh for producing indicative country-level statistics about the Cambodia population. The 1980 administrative count of the Cambodia population is the most widely known example of these figures. The 1980 count is discussed in following parts of this section.
The bad data situation from the 1960s, 1970s and I 980s has improved in-recent years. After the general population census of 1998 (GPC-1998; NIS, 2002), another one was completed in 2008 (NIS, 2008; preliminary figures are available at this stage for GPC-2008; not final). Both these censuses were conducted with subject-matter and financial assistance of the United Nations Population Fund (UNFPA), active in Cambodia since the I 993 UN sponsored first democratic elections in the country, and were also supported by several individual developed countries, such as Japan and Germany in case of the GPC-2008. Both these censuses satisfied professional requirements of the up-to-date world standard for the population census. Both provided reliable data on the population of Cambodia in recent years.
In addition to the 1998 and 2008 GPCs, several country-wide representative population surveys were as well recently conducted in Cambodia: 1
The 1996 Cambodia Demographic Survey (CDS-1996) The 2000 Cambodia Demographic and Health Survey (CDHS-2000) The 2005 Cambodia Demographic and Health Survey (CDHS-2005) The 2004 Cambodia Intercensal Population Survey (CIPS-2004) The 2004 Survey of the Elderly in Cambodia (SEC-2004)
Based on the 1998 census and some post- I 998 surveys, three sets of population projections have become available for Cambodia:
The Population Projections I 998-2020 (based on the I 998 Census; NIS, 2000)
1 For detailed references, see the '"List of Selected Recent Publications on Statistical Sources on the Population of Cambodia", attached at the end of this report. Socio-economic surveys ( 1993-94, 1996, 1997, 1999 and 2003-2004) are not listed here although they could serve as a basis for population estimates too. Some of these surveys were not representative, however, of the entire population of Cambodia.
3

00385266 E3/2413 ~ t~ !., 4 f1?lf't;? o. 0 > q /1/ L
The First Revision, Population Projections 1998-2020 (based on the 1998 Census and CDHS-2000; NIS, 2004) The Second Revision, Population Projections 1998-2020 (based on the 1998 Census and CIPS-2004; NIS, 2005)
The subsequent revisions of the NIS projections incorporated new survey-based findings regarding fertility and mortality decline in Cambodia in the past decade; the decline appeared to be faster than expected based on GPC-1998. At present, the 2nd revised projections are the most up-to-date projections for Cambodia. Notably, both the I st and 2nct revised projections included as well a backward projection for a short period preceding the 1998 census, i.e. up until 1993, for which year the UNT AC data on registered voters are available and could serve as a reference standard for the 1993 projection.2 This part of the 1st and 2nd revisions ( 1993-1998) remains the same; the revised part relates to the years after the GPC-1998. All in all, the existing recent censuses and population projections reliably cover the period from 1993 to 2020.
Notably, all the above-mentioned activities (both surveys and projections) were completed with the involvement of UNFPA, and using their world-wide top level expertise in demographics and financial and expert assistance. All in all, the recent statistical practice regarding population statistics is good and improving, unlike the practice from around the decade of the 1970s.
Table 1. Population of Cambodia According to Different NIS sources
Source Population Population Population
Remarks Both Sexes Males Females
1962 Census 5,728,771 2,862,939 2,865,832 Reference time ofcensus was the night on Apnl 17-18, 1962
1980 General Demographic 6,589,954 3,049,450 3,540,504 With reference to the end ofl 980 Survey 1993-94 Socio-Economic 9,870,000 4,714,000 5,156,000 Extrapolated population with reference to Survey ofCambodia April 1994 based on a sample of5,579
households l 996 Demographic Survey of 10,702,329 5, l 19,587 5,582,742 Extrapolated population with reference to Cambodia March 20, 1996 based on a sample of
20,000 households 1998 Census l 1,437,656 5,511,408 5,926,248 With reference to March 3, 1998. Did
not include a few areas where conflict took place at the time of the census. Population in these omitted areas was estimated at 45,000.
2004 Cambodia Inter-Censal 12,824,000 6,197,000 6,627,000 Estimate of population in regular Survey households as of March 3, 2004, as the
stnvey did not cover institutional population, homeless population etc.
2008 Census 13,388,910 6,495.512 6,893,398 With reference to March 3, 2008. Includes estimate !Or non-response in res~ct of some households.
Source: General Population Census ofC'amhodia 200N l,r01•isional Population T01a/s. Nalional fnslltute r~f~\'tafJS/Jcs, Ministry of !'lannin}? .. Phnom l'enh. ('amhodia August 2008
Table 1 contains an overview of the population size in Cambodia (observed and estimated) since 1962. The source for Table 1 is the 2008 NIS publication on preliminary statistics from the 2008
2 Registration of voters took place in the course of several months in I 992; still this data can be used as reference source for the 1993 population.
4

00385267 E3/2413 ~ "' ·~ I~ ft 'J) I 'C~ If '1 r•< ; re .. r 'I - I _
census in Cambodia. The purpose of Table 1 was to place the 2008 census figures within a broader context of population data since 1962. The figures for 1962, 1980, 1998 and 2008 are as counted in censuses (or administrative surveys as in 1980). 3 The figures for 1994 and 1996 are estimates; they are not the only available and not necessarily the most reliable. 4 Alternatives (that are generally higher) can be found for these years in the 2nd revised NIS projections. As a whole, Table I is, however, useful as a reference point for our further discussion of reliable population numbers in Cambodia after 1962.
In the absence of population data generated by professional statisticians, alternative sources must be considered for the period around April 1975 and January 1979. Two such sources exist and need to be mentioned. The first one is the administrative population count for 1980 (end-year population) and the second is the population of registered voters from the 1993 elections.
1980 Population A brief but comprehensive discussion of the 1980 administrative count is available from Banister and Johnson (1993) and is based on very limited data (general age and sex structure of the population and its total size in end-1980) provided by the Cambodian Department of Statistics in 1992. 5 The attached Table 2 from Banister and Johnson (1993) illustrates the available 1980 data (see below). The 1980 population count was carried out by the Phnom Penh government together with international aid organizations. Figures were compiled upward from villages to communes to districts to provinces and finally to the national administration. The count included the population living within the borders of Cambodia and excluded the refugees in Thailand, Vietnam and third countries. By a simple extrapolation of the 1980 population count using the assumption of a uniform 2.8% annual growth rate, NIS estimated the total and provincial populations of Cambodia for all years up to I 990. That was considered the best that could be done to obtain some population figures of Cambodia at that time (ibid; comp. as well Table 1 in NIS, 2000).
There was much uncertainty about the accuracy of the I 980 population count; especially in the 1980s when no additional reliable population data existed to validate it. Arguments were given for the 1980 count to have been inflated at several levels of data collection for obtaining higher aid and more extensive UN assistance (Banister and Johnson 1 993; Ea Meng-Try, 1981 ). On the other hand, a certain degree of undercounting was noted likely too as even the regular population census is known to undercount the population, sometimes by 4-5 percent. In 1980 the Phnom Penh government did not have full access to the entire territory of Cambodia; some areas were likely not fully covered and some excluded altogether (ibid).
3 The term "rough data" could be used here to express the fact that the population counts obtained directly from the collected data are incomplete in some extent. The usual problem is the undercount of the population at age 0 to 4 years. Also some special groups are usually not counted such as institutional population, population living on boats, homeless etc. There other problems as well, such as age heaping and missing dates etc. Projected population gives more complete figures as the undercount and other data problems are "repaired" by the use of demographic correction techniques. 4 For April 1994, the population size is estimated from the 1993-94 socio-economic survey of Cambodia (SESC-1993/94) which was not fully representative of the entire country. The latest estimate for mid-1994 is based on the 2nd revised projections (NIS, 2005); it equals 10,989,922 and is higher than SESC-1993/94 estimate. For 1996, there exist two alternatives 11,668,629 from the 2nd revised projections (NIS, 2005) and 10,340,000 from the SESC-1996. The CDS-1996 estimate of 10, 702,329 is somewhere in between with regard to its two alternatives. 5 The '·Cambodian Department of Statistics" is most certainly the Cambodian NJS in Phnom Penh. The exact data source given by Banister and Johnson is: Hou Taing Eng, 1992: "'Data provided to the Population Reference Bureau. Washington, D.C.". We tried to identify and collect the same data from NIS. however to no effect. Similarly, we also tried to collect the May 1981 population count referred to in Kiljunen (ed.; 1984 ). Also this data were not found. not even in the unpublished form.
5

00385268
Table 2. Cambodia Year-End Population Structure as Reported
Populallon at tl1c end of 1980 Percentage Seit dlt.1rlbudon 11l the
Age pupulatJ011 Ju uch qc arrn.ip
Total Male l'emale Total Male Fcm"1c Male Female
All Ages 6,589,954 3,049,450 3.540.504 100.00 100.00 100.00 46.3 53.7
0-15 3,092,083 1,556.526 1.535,557 46.9 51.0 13.4 50.3 197
Oto exact age 1 274,76'1 137,83.1 136,931 4.2 4.5 3.9 502 49.8
216,850 109,077 107,773 .3 . .l 3.6 :w 503 49.7
2-5 600,442 302,830 297,612 9.1 9.9 8.4 504 49.6
6-15 2,000,027 1,0o6.786 993,241 303 33.0 28.1 50.3 49.7
Males 16-60 and females 16-55 3.112,649 1,346,107 1,766,542 47.2 44.1 499 4U 56.8
16 125,893 58,569 67,32·1 l.9 1.9 19 46.5 53 5
17 121.701 52,R91 68,810 1.8 1.7 1.9 435 5(d
Males 18-60 and females 18-55 2,865.055 1,2.H,647 1,630,408 435 40.5 46.t 43.1 569
Males 61 and older and fomales 56 and older 3851222 146,817 238,405 5.8 1.8 6.'.' 38.1 61.9
Sourceo C".aml:xxlian Department of Statistics, 1992.
Unlike the 1980s studies, the recent projections of the 1980 population proved that the overall number of about 6.590 million observed by end-1980 was not at all that unlikely and impossible as some authors thought in early post Khmer Rouge years. Using recent data from the 1996 Cambodia Demographic Survey and the voters registration from the 1993 UNTAC supervised elections, Jerrold Huguet (1997), population affairs officer in the Population Division of the United Nations Economic Commission for Asia and Pacific (UNCAP), produced for the first time in the post-Khmer Rouge period population projections for Cambodia that were methodologically modern and based on reliable nation-representative data. His projections comprised two components: backward projections for 1980-1996 and forward projections for 1996-2020. Although, his forward projections (1996-2020) have been several times improved and updated in more recent statistical practice of Cambodia,6 the backward projections to 1980 have basically remained unchallenged. Professional demographers and statisticians recently compiling projections for Cambodia for the period around 1980, such as Patrick Heuveline and Ricardo Neupert, basically confirmed Huguet's results. According to Huguet's estimate from 1997, by mid-1980 Cambodia had 6.550 min people, to compare with 6.590 min by end-1980 according to the 1980 administrative count and 6.500 min by mid-1980 predicted based on this count bl Banister and Johnson (1993 ). Heuveline (1998, 2001) obtained 6.437 million for January 1980. Neupert (2005) produced 6.803 min for mid-1980 which belongs to higher values but in fact not by too much.8 All in all, it seems that the 1980 administrative count can be taken as a good approximation of the population in Cambodia around the end of 1980.
6 The improvements and updating were predominantly related to better data that subsequently became available since 1996, including the 1998 population census and several post-1998 nationally representative demographic population surveys that were used to improve the assumption for the forward projections. 7 Unlike the other authors, Heuveline included the refugees in Thailand in his number (in some sense it was de Jure population rather than de facto). On the other hand he did not include the newcomers from Vietnam as those were not eligible to vote in the 1993 elections. The newcomers were included in Huguet"s and Neupert's projections. 8 We show in Section 3.1 that the latest revised population projections by NIS (2005; authored by Neupert) and by UN (2008: closely resembling Neupert"s projections of 2005) are higher than any other projections made for Cambodia so far. This can be seen as an overestimation but in fact is not. It is just that these projections are not directly comparable with the older ones due to the improved methodology and more reliable recently developed statistical sources that were employed in the latest 2005 and 2008 projections. Neuperf s 1998 census total used for his 2005 projections is corrected upwards for the following reasons:
6

00385269 E3/2413 ffl~;h''!@ 1"1>/l/1
1993 Population The task of conducting the May 1993 elections in Cambodia was given to the United Nations Transitional Authority in Cambodia (UNTAC) through its Electoral Component.9 UNTAC became involved as a result of decisions made in the Paris Agreement of October 1991, including the following:
"The election ... will be held throughout Cambodia on a provincial basis in accordance with a system of proportional representation on the basis of lists of candidates put forward by political parties." (Annex 3, paragraph 2); "Party affiliation will be required in order to stand for election to the constituent assembly. Political parties will present lists of candidates standing for election on their behalf, who will be registered voters." (Annex 3, paragraph 6); "Voting will be by secret ballot, with provision made to assist those who are disabled or who cannot read and write." (Annex 3, paragraph 8); "Every person who has reached the age of eighteen at the time of application to register, or who turns eighteen during the registration period, and who either was born in Cambodia or is the child of a person born in Cambodia, will be eligible to vote in the election." (Annex 3, paragraph 4); "The freedoms of speech, assembly and movement will be fully respected. All registered political parties will enjoy fair access to the media, including the press, radio and television."
In addition, Section D of Annex 1 to the Paris Agreement required UNT AC to prepare verified voter registration lists, and stated that the duration of the electoral process could not exceed nine months from the commencement of voter registration.
Among the several phases the UNT AC completed to fulfill their mandate, the preparation for and conduct of voter registration were essential. This involved among other things developing procedures and manuals, designing forms (including the voter registration card); recruiting and training some 4,000 registration officers; and setting up a computer centre with several hundred staff who worked 24 hour shifts to enter voter registration data into a database from which lists of voters were produced.
There was an undercount of I. 78% in the 1998 census as shown by the post-enumeration survey; the total count of the population had to be thus increased by this percent. The population of four small areas was not accessible during the 1998 census; on estimated there were 45,000 persons in these areas; they were added to the census counts for these areas. In March 1998, there were still about 60,000 refugees living in camps in Thailand. As they were supposed to return to Cambodia a few months after the 1998 census, they were added to the counts for the areas where they intended to go. In most censuses there is an under-enumeration of children at age 0-4 years. Demographic models exist that allow estimating the scale of this phenomenon. It has been calculated for the 1998 census that the number of boys at age 0-4 should be increased by a factor of 1.2713 and the number of girls 0-4 years old by a factor of 1.2859.
9 The section about the UNT AC role in the 1993 elections and their voters register is based on materials obtained from Michael Maley, a former high official of UNT AC, who was personally involved in these activities. In particular the following sources were consulted:
l. UNT AC Registration Procedures Manual. UNT AC September 1992 2. UNT AC Computer System 1992 3. Cambodian Voter Registration Card 4. The UNT AC Elections. Research paper by Michael Maley presented at the Seminar on Electoral Systems and
Administration. Phnom Penh, 23-25 October 1995
7

00385270 f3/2413 f;'\} b)J V. 5) /~'6/ ~I 1_
As Michael Maley noted in his 1995 paper: ''The registration scheme adopted was a simple one: applicants had to attend a registration station and answer questions in such a way as to establish that they were entitled to vote. They were then issued with a photographic voter registration card which they had to produce when claiming a vote. The response from the people was enthusiastic: some 4. 76 million registered. (. .. ) The turnout at 89. 6% was far higher than had been generally expected, and the work of the 48, 000 Cambodian polling officials was much praised by international observers, and by the international polling stations officers, around 1, 000 in number, who assisted the local stqff in the running of the polling stations. "The security situation in a number of provinces, including Siem Reap, Banteay Meanchey, and Kampong Thom, deteriorated, however, in the final stage of registration preventing an even higher participation rate.
From the demographic and statistical point of view, the most impressive of all UNT AC activities was the computer system used for the registration of voters. The system was developed by a professional IT firm Sequent Computer Systems based in New York. It included hardware, printers, and software. The system supported over 100 simultaneous active application users online, all inputting and enquiring on databases. The system had the capacity to store over 5 million names and associated details and consisted of two (Sequent S2000/250) symmetric multiprocessing computer systems running in the UNIX operating system. To allow for the required number of users and the size of the database, two machines were used.
The system provided the necessary checks for duplicate entry and statistics by region including polling places. It was able to input and output in both Khmer and English. In accordance with this criterion a transliteration module was included in the system, thus transliterating the Khmer font to Roman font. This was the first time such a system had been designed and implemented.
Data entered for each individual included: registration number, family name, given name, date of (card) issue, date of birth, gender, age, place of registration, parents place of birth and a code indicating if a party agent had questioned the voter's right to be registered.
The final outcome, i.e. the 1992 lists of registered voters, became a unique statistical source about a large part of the 1992 population of Cambodia. The final number of registered voters at the end of 1992 was 4,279,450 (Huguet, 1996; after Heuveline, 1996). 10 About the same number of voters turned out to vote during the May 1993 elections ( 4,267, 192; Heuveline, 1998). This was about 90% of all eligible voters and comprised a majority of the end-1992 population of Cambodia. In the 2"ct revised NIS projections published in 2005, Neupert estimated that mid-1993 population of Cambodia was I 0,659,466 (NIS, 2005; p. 20, Table 9). 11
In addition to the already discussed sources, two more recent data sets need to be addressed: Older Persons in Cambodia, 2005 survey (RUPP12 and UNFPA, 2005) Mekong Island Population Laboratory (MIPopLab), 2000 (Heuveline and Poch, 2007)
The first one is a country-wide representative survey conducted in 2004 by a group of Western researchers in co-operation with researchers from RUPP with funding provided by UNFPA and the
10 Patrick Heuveline: "Between one and three millions: toward the demographic reconstruction of a decade of Cambodian history (1970-1979)". Research paper presented at the 1996 annual meeting of the Population Association of America. New Orleans, 9-11 May 1996. Quoted in Huguet (1997), Table A2, p. 29. Note that at that time (end-1992) the registration was not yet finished and this explains why this number is lower than the final 4.76 million. 11 This number was most certainly compensated for the expected undercount in the population of voters and for persons at ages 0-17 years not reported in voters registration; note as well that refugees abroad, especially in Thailand, who left Cambodia after January 1979 are also counted in this population as by 1998 most of them returned to Cambodia. 12 RUPP stands for the Royal University of Phnom Penh.
8

00385271
(USA) National Institutes of Aging with the aim to address the economic and health situation of the elderly in Cambodia. It is a small but important data set (1,273 persons aged 60 and over) showing exceptional problems of old age survivors of Khmer Rouge regime. This data can be used to illustrate consequences of Khmer Rouge period in the present day elderly population in Cambodia.
The second data set MIPopLab is a demographic surveillance system, most probably the first one in Cambodia, active since the year 2000 in a rural district in the Kanda! province near Phnom Penh. The basic demographics of the entire district population of I 0,000 residents are updated yearly with the idea of monitoring demographic events in this population and learning about its development. Two special modules were completed in MIPopLab; first one was designed to study mortality increases during the Khmer Rouge regime, and the second to study birth and marriage Khmer Rouge histories of women aged 15 to 74 years. Both modules are essential as a source to increase our knowledge and understanding of the demographics in the Khmer Rouge period and for formulating assumptions for population projections of the 1970s population in Cambodia. MIPopLab is funded by the USA National Institute for Child Health and Human Development and several other Western sources (e.g. Mellon foundation). Researchers involved in this project include among others Patrick Heuveline of the NORC Population Research Centre and University of Chicago, and Poch Bunnak of RUPP in Cambodia.
Summing up, the above-mentioned two data sets belong most certainly to important sources for producing a more complete picture of the demographic suffering of the population under the Khmer Rouge rule and of health and economic consequences of this rule in the present time.
2.2 "Renakse" Petitions and 1980s People's Exhumations13
The chronologically earliest efforts at estimating the scale of victimization caused by the Khmer Rouge regime began in Cambodia directly after January 1979. At that time, the Salvation Front, 14 or shortly Renakse from the Khmer word for "front", as part of the government of People's Republic of Kampuchea (PRK) encouraged people to collect evidence for the 1979 trial of Pot Pot and Ieng Sary by the People's Revolutionary Tribunal. In particular, evidence was sought in exhumations and in counting the remains found in the mass graves. These (and later) exhumations were conducted by common people and without participation of professionals specialized in this field. The people's
13 This section is based on a number of documents obtained from DC-Cam, either through their home page or directly, and a few ECCC witness statements.
"The Petition: Summary Report". March 21, 1991. DC-Cam document, contents summarized by Vanthan P. Dara, with introduction by Youk Chhang. (Available from www.dc-cam.,Qig; hereafter: "Renakse Summary Report") "Total Statistics of Genocidal Crimes of Pol Pot Regime on the People during 1975-78", Table, Dated 25 July 1983. Table signed by the members of the (national) Research Committee into the Crimes of the Pol Pot Regime: Min Khin (chairman), Tith Sunthan (vice chairman), Chea Kean (vice chairman), Kim Ly, Srun Seang Lim, and Tes Heng. Available from DC-Cam Renakse records. Hereafter: "Renakse Summary Table''. William J. Schulte, (around) 2007: The History of Renakse Petitions and Their Value for ECCC Proceedings (Research paper available from www.dc-cam.org) Amy Gordon, 2007: The Renakse Petitions: Background and Suggestions for Future Use. (Research paper available from ~'>Y.'YA.£:5<.1!!!1.,.Q[g) nm._._..., ECCC witness statements ofll;RetiJf'lltD125/9; translated from 00186326_00186335_KH) and!l91111 (D 125/16, translated from 00194417-00194426_1<.H). Including the attached tables for Svay Rieng province.
14 Salvation Front was established in December 1978 with the purpose to overthrow the Pol Pot regime. Originally it was called the National United Front for the Salvation of Kampuchea. In the early I 980s, the Salvation Front was called "Front for National Solidarity, Reconstruction and Defense". Sometimes an alternative translation uses the name 'The National Front for Defense, Restoration and Solidarity of Kampuchea''. (Gordon, 2007).
9
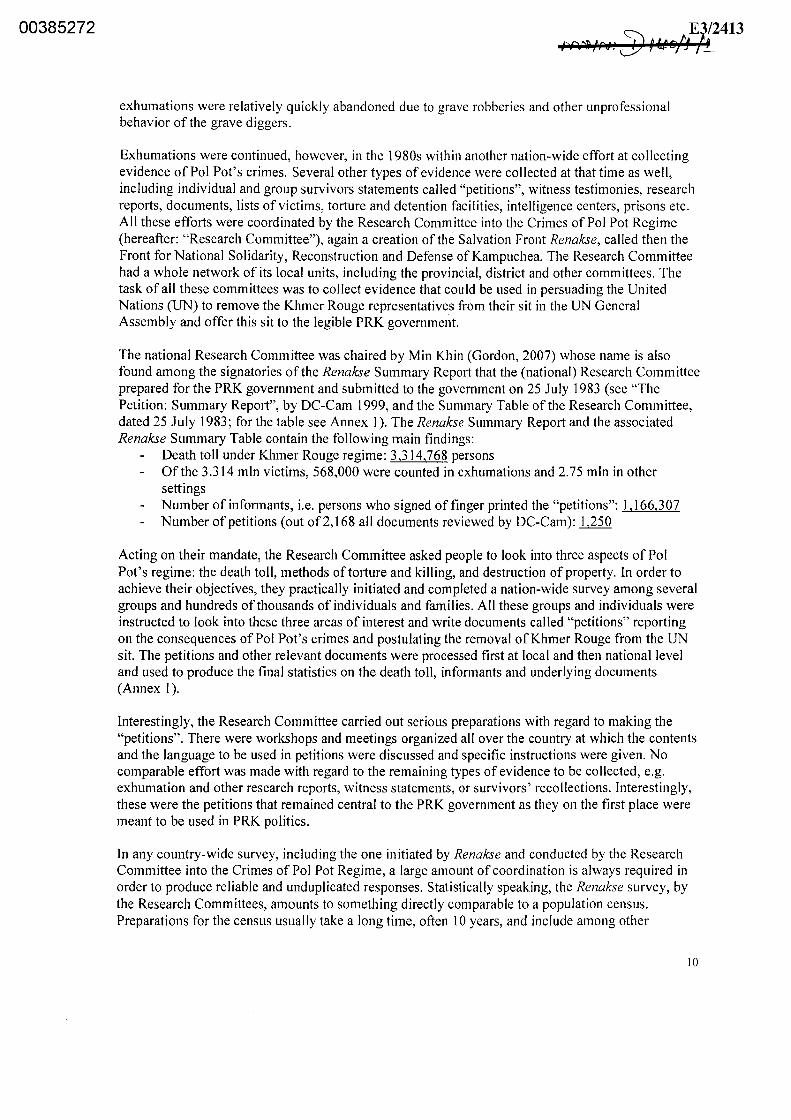
00385272
exhumations were relatively quickly abandoned due to grave robberies and other unprofessional behavior of the grave diggers.
Exhumations were continued, however, in the 1980s within another nation-wide effort at collecting evidence of Pol Pot's crimes. Several other types of evidence were collected at that time as well, including individual and group survivors statements called "petitions", witness testimonies, research reports, documents, lists of victims, torture and detention facilities, intelligence centers, prisons etc. All these efforts were coordinated by the Research Committee into the Crimes of Pol Pot Regime (hereafter: "Research Committee"), again a creation of the Salvation Front Renakse, called then the Front for National Solidarity, Reconstruction and Defense of Kampuchea. The Research Committee had a whole network of its local units, including the provincial, district and other committees. The task of all these committees was to collect evidence that could be used in persuading the United Nations (UN) to remove the Khmer Rouge representatives from their sit in the UN General Assembly and offer this sit to the legible PRK government.
The national Research Committee was chaired by Min Khin (Gordon, 2007) whose name is also found among the signatories of the Renakse Summary Report that the (national) Research Committee prepared for the PRK government and submitted to the government on 25 July 1983 (see "The Petition: Summary Report", by DC-Cam 1999, and the Summary Table of the Research Committee, dated 25 July 1983; for the table see Annex 1 ). The Renakse Summary Report and the associated Renakse Summary Table contain the following main findings:
Death toll under Khmer Rouge regime: 3,314,768 persons Of the 3.314 min victims, 568,000 were counted in exhumations and 2.75 min in other settings Number of informants, i.e. persons who signed of finger printed the "petitions": 1, 166,307 Number of petitions (out of2,168 all documents reviewed by DC-Cam): 1,250
Acting on their mandate, the Research Committee asked people to look into three aspects of Pol Pot's regime: the death toll, methods of torture and killing, and destruction of property. In order to achieve their objectives, they practically initiated and completed a nation-wide survey among several groups and hundreds of thousands of individuals and families. All these groups and individuals were instructed to look into these three areas of interest and write documents called "petitions" reporting on the consequences of Pol Pot's crimes and postulating the removal of Khmer Rouge from the UN sit. The petitions and other relevant documents were processed first at local and then national level and used to produce the final statistics on the death toll, informants and underlying documents (Annex 1).
Interestingly, the Research Committee carried out serious preparations with regard to making the "petitions". There were workshops and meetings organized all over the country at which the contents and the language to be used in petitions were discussed and specific instructions were given. No comparable effort was made with regard to the remaining types of evidence to be collected, e.g. exhumation and other research reports, witness statements, or survivors' recollections. Interestingly, these were the petitions that remained central to the PRK government as they on the first place were meant to be used in PRK politics.
In any country-wide survey, including the one initiated by Renakse and conducted by the Research Committee into the Crimes of Pol Pot Regime, a large amount of coordination is always required in order to produce reliable and unduplicated responses. Statistically speaking, the Renakse survey, by the Research Committees, amounts to something directly comparable to a population census. Preparations for the census usually take a long time, often 10 years, and include among other
JO

00385273
developing of standardized questionnaires, producing maps of census enumeration areas and lists of households living in these areas, testing the questionnaires in pre-census settings, identification and training of the instructors and interviewers, planning a post-census control survey, developing a reporting structure and planning of publication of census results etc. In case of the Renakse survey, no preparations in statistical sense were made at all. As far as we could see from any source materials, no standardized questionnaires were used, no trained interviewers were taking statements, no professional personnel was involved in the exhumations. Collecting all this evidence must be seen as spontaneous efforts based on qualitative data obtained from the respondents and actions taken based on the initiative of every Research Committee in the country. Importantly, several source materials stressed that with regard to the results, no pressure was exercised over the respondents; not over individuals and not over groups, and no instructions were given as to the outcomes of the survey. As such, the individual outcomes of the survey are most likely true, valuable and meaningful. We recommend using the informant-level materials for court purposes. The same, however, cannot be said about the general country-level statistics presented in the Renakse Summary Report on 25 July 1983.
The main reason for this conclusion is that the degree of duplication among the death toll of 3.315 min must be enormous. DC-Cam estimated this degree to be around 50% (after Etcheson, 2000), which is easily possible; the degree of duplication can be even higher than that. In a similar project in Bosnia and Herzegovina, run by the Research and Documentation Centre in Sarajevo, with Mirsad Tokaca as its president, 150,000 records out of the total of250,000 records collected are duplicates (60%); only about 100,000 unique records represent different individuals - victims of the war in Bosnia and Herzegovina in 1992-95. In addition to duplicates, there are other problems, namely incompleteness; the Renakse death toll is still incomplete as only 15 provinces are listed in the Renakse Summary Report out of21 (see DC-Cam report, March 21, 1999). It is also unclear what fraction of all actual deaths is reported for each province. The above mentioned problems are related to the lacking statistical framework of the Renakse survey that implies it is impossible to assess the degree of coverage of Renakse statistics. As such, the Renakse death toll of 3.315 min must be disqualified from considering it a reliable estimate of Khmer Rouge victims.
With regard to exhumations, many reports were collected in 1979 and the 1980s and several counts of victims are available, as those for Svay Rieng province (comp. witness statements oflHIHi8$1H and'H'll''and the attached tables provided by these witnesses). We studied the tables provided by these two witnesses and used them to obtain Svay Rieng provincial total, which we further compared with the total for the Svay Rieng province in the Renakse Summary Report and Renakse Summary Table. The two statistics are highly consistent for this province, although minor non-significant differences do exist. This is yet another confirmation of the fact that among the source materials collected in the Renakse survey much can be considered useful. Assessment of these materials should be always done on case by case basis.
2.3 DC-Cam and Mass Grave Mapping
The Documentation Center of Cambodia (DC-Cam) was funded within the Yale University's Cambodian Genocide Program (CGP) in January 1995. 15 In 1997, DC-Cam became an independent
15 In April of 1994 the U.S. Congress passed the Cambodian Genocide Justice Act, establishing the Office of Cambodian Genocide Investigation in the U.S. State Department's Bureau of East Asian and Pacific Affairs which awarded Yale University's Cambodian Genocide Program (CGP) a $499,000 grant in December of 1994. In 1995-96, next grants followed from the Australian and Netherlands governments and Henry Luce Foundation, Inc. In 1997 the US State Department's Bureau of Democracy, Human Rights and Labor awarded the CGP another grant of$ I million, and in
11
00385274
organization; however, the CGP continued to fund DC-Cam through 2001. The main focus of DCCam was the documenting of the mass killings in Cambodia during the Democratic Kampuchea (DK) regime headed by Pol Pot between April 1975 and January 1979. According to DC-Cam's mission statement, the following are the objectives of this organization:
DC-Cam has two main objectives. The first is to record and preserve the history of the Khmer Rouge regime for future generations. The second is to compile and organize information that can serve as potential evidence in a legal accounting for the crimes of the Khmer Rouge. These objectives represent our promotion of memory and justice, both of which are critical t,oundations for the rule of law and genuine national reconciliation in Cambodia. 6
As part of its mandate, DC-Cam has "located and mapped 196 prisons, 19, 733 mass graves, and 81 genocide memorials, " and has catalogued more than 6,000 photographs and roughly 155,000 pages of the 600,000 pages of primary Khmer Rouge documents in its possession. 17
All of DC-Cam's 50 staff members, (46 full-time staff and four volunteers), are Cambodians and began working at DC-Cam as volunteers. 18 The organization is advised by the 10 member Board of Directors (all of whom are Cambodian), as well as by the 15 member Board of Associate Advisors who are specialists in Cambodia. 19
The Documentation Center of Cambodia began their activities related to mass graves mapping in September 1995; the activities still continue at present although a majority of the objectives have been already achieved.20 The purpose of this project has been to provide the number, location and size (in terms of human remains) of mass graves in the country. A significant assistance to this project came from the New South Wales University (NSWU) in Australia which engaged in a cooperation with DC-Cam in relation to the measuring of geographic coordinates of the mass graves. NSWU researchers, with professor Helen Jarvis as the project leader, advised the DC-Cam staff not only on technical details of the Geographic Positioning System (GPS) computer programs and the use of equipment required for taking the measurements but also on a number of related issues, includinJ the design and standardization of the mass grave information to be collected in the project.2 NSWU partners also provided the training of the DC-Cam staff.
The DC-Cam mapping project should be seen as a country-wide survey of mass graves in Cambodia prepared and conducted by the DC-Cam staff. Note that DC-Cam has never done any exhumations and thus did not produce direct counts of the victims in the mass graves. They made estimates of the victims based on witness statements and other related materials collected in the course of the
1999, a further $150,000. These initial grants made it possible to establish the DC-Cam in January 1995. See: the CGP home page at h!!p_J/www_,).'.ale.ed\!.ftgplc,:gQintrQ.,htm.!. 16 Our Mission, Documentation Center of Cambodia, available at b!!Q://www.dccam.org/Abouts/History/Histories.htm. Statistics as of 18 August 2009. 17 Ibid 18 DC-CAM STAFF, Documentation Center of Cambodia, available at ht~p_lf..~W-~.Q.££.li.ffi,__Ql&'_AbQJJ.!?.L~tl!.f.f.Z.Stl!.f.Lb_tm. 19 Our Organization, Documentation Center of Cambodia, available at http://www.dccam.org/Abouts/History/Histories.htm. 20 The remainder of this section is based on the personal communication of Ewa Tabeau with Youk Chhang, the director of DC-Cam on 23 June 2009 in Phnom Penh. Also materials from the DC-Cam website have been used, including the web article by Craig Etcheson (2000): "Mapping Project 1999: The Analysis. The Number: Quantifying Crimes against Humanity in Cambodia". httQ://www.dccam.org/Projects/MaQs/Mass Graves Study.htm . 21 See Kenneth Vong, 1997: ''Geo Explorer Operation Manual and Pfinder Guide". Manual for the project "Mapping the Killing Fields in Cambodia". Also the so-called ''Site Form" has been designed by NSWU staff. The original form, after a few modifications made during first missions. is used to date in all next mapping activities.
12

00385275
mapping project. Their surveying approach is reliable enough to consider their estimates as very serious, although at the same time still approximate.
Figure 1. Location of Khmer Rouge Killing Sites, Security Centers and Memorials in Cambodia
•
An important preparatory step of the mass grave mapping is the screening of the Renakse documents and other materials related to the 1980s exhumations available from the Cambodia Ministry of Culture for the names and locations of the mass graves.22 Once such alleged locations are established, field missions can be planned to investigate the location, take the geographic coordinates and collect additional information about the site, such as eyewitness testimonies and survivors recollections about the site, incidents, victims, perpetrators, security centers etc., and to
22 Much of these materials are now stored at the DC-Carn as both these organizations handed over their archives to DCCam. At the present time, DC-Carn has the largest repository of documents related to both the Khmer Rouge and the post-Khmer Rouge episodes of the Cambodian history. The post-Khmer materials include for example: ;'Renakse" petitions, People's Revolutionary Tribunal documents, the report of the ;'Research Committee on Pol Pot's Genocidal Regime," interview transcripts, Cambodian Documentation Commission materials, witness statements. forensic evidence, computer databases, photographic archives, analytical materials, and microfiche collections.
13

00385276
look for additional documents from local authorities, any existing exhumation records and other relevant materials.
Once the DC-Cam researchers reach their destination and are able to confirm the existence of the site(s), they employ the GPS technology to identify and record the location of the site(s). The GPS equipment used by the DC-Cam allows for a high accuracy of the measurement of within a few meters. This information is in the next step loaded into the GIS computer program which makes it possible to generate precise maps of the killing fields (Figure I).
At the site, the so-called "Site Form" is filled in, which serves to record details of the site and victims statistics as reported by informants at the site. Notably, at each site 3-4 informants were usually questioned and provided corroborating statements. At the return from the field mission a proper field report is made which integrates the information from the field visit with that from other sources available at the DC-Cam. Statistics produced in the field report are often more conservative than those from the site form for if there are inconsistencies, always the conservative approach is taken in the field report. The details from both the site fonn and field report are later processed and included in the summary statistics of the mapping project on the DC-Cam website (see the "List of Mass Graves" available at http://www.dccam.org/Projects/Maps/Mapping.htm).
The initial objective of the DC-Cam field missions, i.e. identification and mapping of the mass graves, has evolved to include as well records of Khmer Rouge prisons (or security centers), in the proximity of which many mass graves are located, and records of the memorials erected by local populations during or around the post-Khmer Rouge investigation of crimes committed by the Pol Pot regime. All in all, three types of outcomes are available from the DC-Cam mass grave mapping project: the burials (i.e. mass graves and victims), prisons and memorials. It is striking how closely are these three types of objects associated with each other in the geographic sense (Figure I). Such coincidence is impossible to result from chance and must lead to the conclusion that the mass graves are the outcome of activities conducted in the nearby Khmer Rouge security centers.
With respect to statistics, the key question relates to the reliability of the DC-Cam estimates of the number and type of mass graves, and the number of victims in the graves. This question becomes really difficult in the absence of reliable exhumation records, i.e. knowing that exhumations of the Cambodian mass graves in the 1980s were by far incomplete, many sites were never exhumed, many were partially exhumed, and many were disturbed. Moreover, the I 980s exhumations were done by local populations without the participation of forensic and other exhumation specialists. Thus, the existing exhumation figures cannot be taken as a reliable measure of the number of victims in the sites. On the other hand, the existing exhumation records, be them individual informant statements, DK crime commission reports or Renakse petitions, can be safely taken as the initial mark of a possible site location. Using the initial records of site location in an investi~ation of the site existence (based on eyewitness, other survivor's testimonies and/or local documents) 3 is fully correct and well justified. The latter approach is the DC-Cam method applied in their grave mapping project. As such the method must be seen as fully acceptable. Problems arise, however, around the quality of information provided by the DC-Cam informants in the course of the field mission, and during crossreferencing the information obtained from the field informants with other sources available for the same sites. In many cases this information is consistent, in other cases it is not. The DC-Cam way of dealing with uncertainty around the basic statistics is putting the number of victims at "O" for the
23 Note that at the site, consistent statements of several informants are required in the DC-Cam procedure in order to declare a potential site to be the true one. Although in the course of time different DC-Cam mobiles teams might have applied slightly different standards in their assessment of reliability and consistency of informants' statements at the site. generally much effort has been invested at DC-Cam to keep these assessments at the same level.
14

00385277 .. A !:19 .. " SJ Ir re t4 ~/2413 r11 yvc · /
sites where the consistency level of cross-referenced sources is not satisfactory. These empty cells imply that DC-Cam statistics on victims are very conservative, which we demonstrate in the following parts of this section.
Detailed statistics on the sites and victims are available from the above-mentioned table "List of Mass Graves" on the DC-Cam home page. Craig Etcheson (2000) produced a summary of these statistics after five years of the mapping project and came up with figures for the entire Cambodia and for provinces. We have updated his figures using the latest information on the DC-Cam website and present new figures below. The new figures represent the status as of 18 February 2008.
It must be noted that the summary statistics initially produced by Etcheson (2000) and reproduced here are approximate which is related to the uncertainty inherent in the underlying data on mass graves, estimated victims, identified prisons and memorials. Much DC-Cam information is available in a qualitative format and needs to be coded quantitatively, which procedure will always remain subjective to some extent. The uncertainty is not such, however, that completely different pictures would emerge from alternative ways of coding the source information. Alternative coding approaches will result in slightly but not fundamentally different outcomes. Most differences would be seen in relative measures, e.g. "graves per prison" or "victims per grave", as those from Etcheson's Table 2 (see Annex 2 for Etcheson's original and our re-calculated Table 2). Only slight differences should be expected for overall totals, such as the total number of graves or victims.
Note that the source material and methodology of Etcheson's and our calculations are not identical. Etcheson analyzed data covering the period 1995-99, i.e. from the first five years of the mapping project. We analyzed the latest available data from February 2008, which cover the period 1995 -2008. Our data most certainly contain corrections and improvements of the 1995-99 data that the DC-Cam staff made in the years after 1999; Etcheson did not have these improvements. Secondly, a quantitative analysis like the one of Etcheson and ours is subject to coding of some of the originally reported source figures on mass graves and victims. Coding needs to be done for qualitative reports; i.e. brief narratives, such as "more than I 000", "over 300", "hundreds", "thousands", "a few'', "about'', "70 families" etc. Researchers might code these narratives in different ways as no strict rules exist for the coding of such data. Secondly, many records provide intervals of values and not point estimates. The interval values need to be treated accordingly to their character too. Details of our coding and specific results from our analysis are included in Annex 2. Below only main findings are discussed. 24
Table 3. Summary Statistics on the DC-Cam Mass Grave Mapping Project: December 1999 versus February 2008
Category Victims Mass Graves (Pits)
Prisons Memorials Sources:
December 1999:
Februa1y 2008:
December 1999 February 200~ 1,112,829 1,298,772
20,442 23,745
Etcheson (2000)
125
71
Tabeau and They (2009); see Annex I
196
81
Increase 185,943
3,303
71
10
24 The following maximum and minimum variants were obtained for victims: Victims
Site Fonnes Field reports
Maximum Minimum
1,408,20 I I, 189,323 1,409,141 998,743
•Medium calculated here .ft-om tJl'erall to1als and not mdii•idual record.1·
Medium• J,298,762 1,203,942
15
00385278
Generally, in our approach three variants were made: - the minimum variant was based on lower ends of all intervals and estimated lower ends of
the narratives - the maximum variant took upper ends of all intervals and estimated upper ends of the
narratives - the medium variant was obtained as an average of the minimum and maximum; this variant
is included in Table 3
We believe that our medium variant compares to that of Etcheson (2000). Further, in Table 3 we present the results based on the information from the "Site Forms", thus not from the "Field Report" (see Annex 2 for details). Field reports usually give lower statistics as pieces of information from the field informants were rejected by DC-Cam researchers as not reliable. In our opinion, however, the "Site Form" contains first-hand valuable data, which for each site was obtained parallel from several informants. DC-Cam researchers corrected this information down as much as possible to be conservative but as a matter of fact this is their subjective judgment that was used for the corrections. There is no certainty that the DC-Cam corrections were right and the field informants were wrong. Thus any of the two estimates can be taken as a source for the calculation of summary statistics. Differences between these two approaches are not fundamentally significant (Annex 2).
Table 3 shows that the progress in mass grave mapping made between 2000 until early 2008 was significant but not magnificent. About 186,000 new victims are reported over the period of about seven years and about 3,300 new mass graves. One reason for this is that the project continued in recent years at a slower pace than before due to a rather limited funding for the mapping and a more intense engagement of the DC-Cam staff in other areas of their research. Secondly, during the first five years of the project a majority of the sites had already been investigated, including those with the lowest security concerns and convenient locations. It is been estimated that at least 70% of the project objectives have been completed today, leaving the remaining 30% to be the more remote and less secure places.
At the present time, the overall number of the mapped mass graves is about 23,745 and the estimated number of victims in these graves is about 1.3 million. These numbers most certainly confirm the exceptionally large magnitude of the killings and forced death in the Khmer Rouge Cambodia.
Importantly, a part of victims will be never included in mass grave statistics; these are the surface remains; i.e. remains of the victims dropped in open paddy land, wells, lakes, ponds, eaten by animals etc. Their remains decomposed or disappeared in another way and there is no chance can be recovered. Their memory will only last in survivors recollections and in the memorials placed all over the country to acknowledge and respect their death.
The final remark must be on the type of victims in the mass graves. Etcheson discussed this issue in his 2000 article and challenged the notion that the pre-1975 victims, especially the victims of American bombings and Lon Nol soldiers, victims of the Vietnamese invasion and starvation of 1979 together with non-violent deaths of Khmer Rouge regime are allegedly buried in these mass graves as well. These issues were subject of DC-Cam interviews with informants at the sites, who exceptionally only mentioned a few such cases. Etcheson 's conclusion was the following:
"Thus, to call into question the iriformation collected in sub-districts across the whole length and breadth of Cambodia, where local witnesses testify to the existence of Khmer Rouge centers and the location of the mass graves in which victims' remains were discarded,
16

00385279
presumes a nationwide conspiracy of unlikely proportions. Although it appears possible that certain socially acceptable and collectively-shaped myths may influence the precise contours of the narratives collected by the mass grave mapping teams, it seems highly improbable that these social pressures would extend so far as to the fabrication of ruins of former prison facilities, or placing of physical evidence such as shackles in those ruins." (Etches on, 2000, p. 14)
The above statement is fully consistent with the information we obtained from Y ouk Chhang, 25 the DC-Cam director and the most determined, relentless, and persistent project leader and participant of the mass grave mapping project. Also Chang was not familiar with large scale numbers of mass graves and victims originating from historical episodes that would be different than the Khmer Rouge regime. Also Chhang stressed the striking association between the location of mass graves and security centers. He mentioned as well the few natural deaths were usually buried separately, behind the houses where people lived and where they died. He as well noted difficulties in distinguishing natural from non-natural deaths in the Khmer Rouge era. Hardship of daily life, i.e. diseases, hard work, forced movements, bad accommodation, lack of food and medications, separation from the family, forced marriages etc., caused people to die far more frequently than in normal times. These deaths, although not violent, cannot be attributed to natural causes. Instead they should be seen as imposed onto the people of Cambodia. As a matter of fact, he defined a category of war victims that can be called "forced death".
All in all, it is highly unlikely and practically impossible that the mass graves mapped so far and the remains contained in them can be linked with non-Khmer Rouge episodes of the Cambodian history. Witness statements and other DC-Cam materials documenting the mass graves prove to the contrary.
2.4 Internationally Published Research on Excess Deaths: Sources and Methods
In this section we introduce the internationally published research taken for review in this report. Despite of the fact that this section is in principle limited to international research, for comparative purposes and completeness of our review also Renakse methods and sources are again briefly discussed here. All other authors had published their results internationally in peer reviewed scientific journals or books, and a few on the Internet; all of them have a deep and continuing interest in the victimization of Khmer Rouge regime of April 1975 to January 1979 as well as in the history of Cambodia. Many authors represent the world top in their respective research areas.
In this section we proceed chronologically, i.e. first the early 1980s papers are reviewed and subsequently later papers, up to the most recently published. This logic has its justification in the fact that more and better statistical sources have become available for Cambodia population in the course oftime. The latest sources, such as for example the 1998 and 2008 population censuses, although seem to be very distant from 1975-79, are still meaningful for the assessment of demographic consequences of the tragic decade of the 1970s and backwards projections of the Cambodia population. The second reason is that the early 1980s views evolved with time and the victim numbers of today must be shown in the context of their historical development.
The following authors are reviewed in this report: 26
25 Personal communication of Ewa Tabeau with Youk Ch hang, DC-Cam Phnom Penh, 23 June 2009. 26 Full references can be found at the end of this report in the "List oflnternationally Published Research Assessed in This Report"
17

00385280 ~ E3/2413 CA~Mt' 'U@" 1 f ; I/ I -
CIA, 1980 EA MENG-TRY, 1981 KIMMO KILJUNEN (ed.), 1984 MICHAEL VICKERY, 1984 JUDITH BANISTER and PAIGE JOHNSON, 1993 MAREK SLIWINSKI, 1 995 BEN KIERNAN, 1996 and 2003 PATRICK HEUVELINE, 1998 PATRICK HEUVELINE and POCH BUNNAK, 2007 CRAIG ETCHESON, 2000 CRAIG ETCHESON, 2005 RICARDO NEUPERT and VIRAK PRUM, 2005
Sources they used in their research are closely associated with the methods they applied, which is related to the fact that sources explicitly addressing the numbers and types of Khmer Rouge victims are so extremely limited for Cambodia that (with a few exceptions) practically non-existent. The explicit sources include a few sample surveys, such as for example the one by Sliwinski (1995). None of the above authors produced empirical counts of victims, not even a minimum count. All authors took an indirect approach and derived their number of victims from a population projection or scenario, extrapolation of survey results over the entire population or another method. For these reasons, we have to discuss the sources and methods of international authors jointly. This is done in this section. In our discussion we do not yet make any references to the actual numbers of victims obtained by the authors. The numbers are the subject of the discussion in the next section. Our purpose here is to give the reader a good impression of the type and reliability of sources used in the international research as well as to critically assess the methods applied there.
In our discussion, first an overview is presented of sources and methods for each individual author (Table 4). The discussion that follows after Table 4 is general and meant as a summary of individual authors' inputs.
Table 4. Overview of Methods and Sources Used in Internationally Published Estimates of Excess Deaths in Khmer Rouge Regime, April 1975 to January 1979
CIA, 1980 Data Sources 1962 Census, 1978 UN projections for Cambodia, UNHCR refugee statistics for
Cambodia, intelligence and other sources including the expertise of CIA analysts
specialized in this region of the world; sources not referenced one by one, except for
Siampos (I 970) and Willmott ( 1968) Methods for Excess Deaths Deaths statistics are a by-product of a popualtion scenario. The standard population
accounting method was used in an exceptionally detailed approach. Red Khmer period
projections were made for each principal group of people (New and Old) and for a
number of distinguished sub-periods (each app. six months), using assumptions formulated
separately for each small set of projections.
Methods for Causes of Death No formal methods used; deaths from executions and all remaining deaths based on
subjective assessment.
Population Decline 1975-79 Not discussed
Motivation for this Paper Research report by the Central Intelligence Agency of the USA. Unpublished.
18

00385281
EA MENG-TRY, 1981 Data Sources For wpulation size: CIA (1980), Migozzi (1973), official (mainly Vietnamese) government
reports, notes I statements I reports of international organizations, press reports (mainly
France), historical materials/books etc. For excess deaths (including executions): CIA
(1980): 50,000 to 100,000 of violent deaths and several hundreds of indirect deaths, Father
Ponchaud (spring 1978): 2 millions (excess), Amnesty International ( 1979: "Rapport sur la
peine de mart"): 2 million (excess), 200,000 executions, Countries of Eastern Europe and
Hanoi: 3 to 4 millions (excess).
Methods for Excess Deaths Excess deaths obtained as a residual category from a general demographic accounting
equation. Components of the equation obtained from author's own (predominantly
qualitative) assessment of estimates by others.
Methods for Causes of Death Author's own (predominantly qualitative) assessment of estimates by others.
Population Decline 1975-79 950,000; The general accounting equation explaining this decline includes: Excess Births
(meant as the difference between births and natural deaths; +500,000); Excess Deaths (-
1,000,000); Refugees Abroad (-250,000); Repatriation Vietnam (-200,000).
Motivation for this Paper Article published in an international demographic journal (Population and Development
Review).
VICKERY, 1984 Data Sources CIA (1980); some demographic rates (births 30/1000 per year and deaths 18/1000 per
year) from the period around the 1962 Census; sources unclear. Some additional
oopulation projections by individual authors and organizations for contextual purposes.
Methods for Excess Deaths Excess deaths obtained as a residual category from a general demographic accounting
equation. Components of the equation obtained from author's own (predominantly
qualitative) assessment of estimates by others.
Methods for Causes of Death The overall total of excess deaths in 1975-78 from the general accounting equation was
distributed into direct and indirect deaths according to subjective survivors recollections.
Population Decline 1975-79 After excluding out-migration (-200,000), the decline is 400,000 to 600,000; The minimum
decline of 400,000 is further analysed according to the general accounting equation: Births
added (+852,000; CBR 30/1,000/year); Natural Deaths subtracted (-511,000; CDR
18/1,000/year); Remainder (to subtract) are Excess Deaths (-740,000).
Motivation for this Paper Book on the history of Cambodia (first published in 1984).
KILJUNEN (ED), 1984 Data Sources The Population "Census" of May 1981 by the government in Cambodia (Ministry of
Planning, Phnom Penh); UN population projections; CIA (1980) projections; all these cross
referenced with Pol Pot's statistics
Methods for Excess Deaths Method comprised a comparison of the expected and actual population size in 1981 (in
May) and subtracting excess deaths in 1979-81. Assumptions used: Expected Population
1981: 8.3-8.5 min (2.8% annual growth of 7.3 min ( 1975; CIA ( 1980)); "no war"
scenario); Actual Population 1981: 6.7 min (1981 population count); Refugees 1975-81:
650,000; Residual: "1981 expected" - ''1981 actual with refogees": about I min taken as
excess deaths; (note: births are totally neglected); Excess deaths 1979-81: Assumed as
negligible: main cause for excess deaths in 1979-1981 was famh1e estimated to cause in
reality only ''a few tens of thousands" of deaths, (contrary to earlier expectations). The
entire excess of I min can be therefore attributed to Khmer Rouge regime.
Methods for Causes of Death NA
Population Decline 1975-79 Not discussed
Motivation for this Paper Chapter in a report of the Finish Inquiry Commission h1to the Khmer Rouge regime h1
Cambodia.
19

00385282
BANISTER AND JOHNSON, 1993 Data Sources Major sources: 1962 Census; 1980 administrative population count (end-1980); 1982
demographic and health survey in Cambodia (Ministry of Health); Auxiliary Sources: A
large number of published and unpublished studies, personal communications, results of
simulations and alternative scenarios.
Methods for Excess Deaths Excess deaths obtained from a reconstruction of the Cambodia population between 1962
and 1980 by means of a ··plausible scenario". Method of reconstruction unclear: might be a
scenario based on interpolation between 1970 and 1980, or general demographic
accounting equation, or a simple projection. Thereafter, an extrapolation of the 1980 count
is performed up to 2050 using the usual demographic projection approach (in medium, low
and high variants). The 1962 census and 1980 count and educated guesses on war
related population losses were used for the "plausible scenario" of 1962-1980. War related
population losses were not estimated but formulated a priori as educated guesses; their
impact was tested by comparing the outcome of the "plausible scenario" with an
alternative scenario that would have occurred ifthere was no civil war.
Methods for Causes of Death Not discussed
Population Decline 1975-79 The decline equals 940,000; Population Loss was analyzed too: "end-1978 expected" -
"end-1978 actuaf' = 1.8 min; ( 1.8 min= 8.2 min-- 6.36 min). The components of the loss:
Net Emigration (-218,000); Births Deficit (-570,000); Excess Deaths (-1.05 min).
Motivation for this Paper Chapter in a book; Scientific interest in the reconstruction of the population change in
Cambodia since 1962 at the edge of the first free elections in Cambodia in 1993.
27
BEN KIERNAN, 1996 AND 2003
Data Sources A number of small scale surveys by others were used for drawing or supporting his
results. Additional sources on the population size in April 1975 and January 1979: Migozzi
(1973), Sampson (1977), Banister and Johnson (1993), Sliwinski (1995), Heuveline (1998),
as well as UN (mid-1974; unrevised), and DK estimates.
Methods for Excess Deaths In his main approach ( 1.671 min excess deaths), no reconstruction was made; (pre 1980
uncorrected) UN projections were used for.April 1975, i.e. 7.890 min, and his own
informed guesses for the population size of Base and New People as well as of Phnom
Penh and other cities. A typically historical qualitative approach was used. First, he
reviewed a number of small surveys, some of which were anthropological and related to
single villages. Then, the results from this review were extrapolated over the entire
population by applying estimated rates of those who perished (i.e. were killed, died of
indirect war-related causes or went missing). The rates were generally taken from the
reviewed surveys or were produced as his own informed guesses. Kiernan also came up
with separate estimates of victims among ethnic groups (Chinese, Vietnamese, Cham,
Tha~ Lao and "upland minorities").
Methods for Causes of Death Not discussed
Population Decline 1975-79 Not discussed. But in Kiernan (2003), Population Loss was calculated (general accounting
equation), based on the expected and actual population size in 1979 (January).
Components: Expected Population January 1979: 8.215 min (produced as 1 % annual
growth of 7.89 min April 1975 population (his own estimate), minus 150,000 repatriated
Vietnamese; 1% growth covers only the actual natural change and not excess deaths);
Actual Population January 1979: 6.36 min (after Bannister and Johnson, 1993);
Repatriation to Vietnam, 1975-79: 150,000 (already subtracted from "expected"); Residual:
"1979 expected" -- "1979 actual'' (no refugees): about 1.855 min of excess deaths.
Motivation for this Paper Book (and an article) on the history of Cambodia, 1975-79
27 Kiernan is usually referred to in this report by using the first 1996 edition of his book: ·The Pol Pot Regime. Race. Power and genocide in Cambodia under the Khmer Rouge 1975-79". The 3'd edition of the same book was published in 2002. Note as well that the 2003 article: "The Demography of Genocide in Southeast Asia. The Death Toll in Cambodia, 1975-79, and East Timor, 19750-80", contains a continuation of his work on the death toll and a new improved estimate.
20

00385283
MAREK SLIWINSKI, 1995 Data Sources
Methods for Excess Deaths
Methods for Causes of Death
Population Decline 1975-79
Motivation for this Paper
PATRICK HEUVELINE, 1998 Data Sources
Methods for Excess Deaths
Methods for Causes of Death
Population Decline 1975-79
Motivation for this Paper
HEUVELINE AND POCH, 2007 Data Sources
Methods for Excess Deaths
Methods for Causes of Death
Population Decline 1975-79
Motivation for this Paper
E3/2413 PAr;Jf; ; . it) A!:(&~t1 , I-' -
For excess deaths: Sliwinski's own questionnaire survey conducted in France, Thailand
and Cambodia in 1989-1991. For population size: 1962 Census, Migozzi (1973), Kimmo
Kiljinen (ed. 1984), CIA (1980)
Excess deaths estimated from Sliwinski's survey data. In order to extrapolate survey
results over the entire Cambodia population he produced population estimates based on the
1962 Census and Migozzi (1973) projections. The projections originally made by Migozzi
(until about 1970) were expanded until the end of 1989. Initial assumptions on the
population size and structure in 1970 were taken from Migozzi's projections. For the later
(post-1970) period, Sliwinski produced birth, deaths and migration rates from his own
survey. The population size and structure during the 197(}+ period was reconstructed using
those estimated rates and the assumed size and structure of the population in 1970.
Reports of survey respondents.
Not discussed
Book on demographic consequences of the Khmer Rouge regime; Scientific interest in the
kmger episode of 1970-89, but in particular 1975-79.
Key Sources: 1962 Population Census, 1992 electoral rolls of the United Nations
Transitional Authority in Cambodia (UNTAC); Auxiliary Sources: Large number of
published sources were used for reconstruction assumptions and for assessment of violent
and overall excess deaths in 1970-79, 1970-75 and 1975-79.
Excess deaths obtained as a residual category from comparing two sets of separately
made population projections: forward 1962-1979, and backward 1992-1980. A well
established demographic standard - the "intercensal cohort component method" was used.
The forward projection was based on the 1962 Census and the backward one on the 1992
UNT AC voters register. Assumptions for fertility, mortality and migration balance
resembled the actual trends in 1962-1969 and in 1980-1992. For the period 1970-1979 the
trends observed in the I 960s extrapolated according to "actual fertility, normal mortality
and actual net-migration throughout the 1970s". This approach allows for estimating the
(hypothetical) population size in Cambodia at the end of the decade 1970-1979. Parallei
the second projection, from 1992 backwards to I 980, provides the actual population size in
Cambodia on I January 1980. The difference between the population size from the
forward and backward modelling represents the excess deaths in 1970-1979.
Selected model life tables were applied to distinguish between non-violent and violent
excess deaths in I 970-79 (by age and sex). The estimated violent deaths in 1970-79 are
further split into the (pre-Khmer Rouge) 1970-75 and (Khmer Rouge) 1975-79 violent
deaths based on the work of others. 300,000 violent deaths were assumed for the civil
war, 1970-75 (300,000 are the most likely variant out of 150,000 to 500,000 possible). The
following authors were consulted: Sihanouk, 1986; Ea, 1987; Kiljunen, 1984; Hood and
Albin, 1987; Banister and Johnson, 1995; Sliwinsk~ 1995; Hirschman et al., 1995; Barbier~
1995. Some victims of the 1979-80 famine should be further subtracted from 1975-79
estimates (0. 7 to 3.2 min). The overall number ( 1979-80) might have been up to 500,000-
600 000 famine deaths. For 1979 onlv a oar! of it should be taken (e.!!..50% ). Not discussed
ScientiflC article in a renowned international demographic journal.
On-going demographic surveillance system ''Mekong Island Population Laboratory"
(M!PopLab); Heuveline (1998), Kiernan (1996), Sliwinski (1995)
Extrapolation of MJPopLab estimates over the I 975 population of Cambodia.
Not discussed
Not discussed
Scientific article in a renowned international demographic journal
21

00385284
NEUPERT AND VIRAK, 2005 Data Sources 1962 General Population Census (GPS-1962); 1998 General Population Census (GPS-
1998); 2000 Demographic and Health Survey of Cambodia (DHS-2000) Methods for Excess Deaths Excess deaths estimated as the 1980 residual change in the Cambodia population size as
projected from two different ends: Forward projection from 1962 Census up until 1970
using the actual change scenario (Siampos, 1970) and continued until 1980 under "normal
mortality. actual reduced fertility and actual net migration" scenario; Baci-'"Ward projection
from 1998 Census until 1980 using assumptions derived from the DHS-2000. Methods for Causes of Death Not available
Population Decline 1975-79 600,000 in 1970-79; The overall population loss between 1970 and 1980 adds up, however,
to about 3.3 min: Birth deficit in 1970-79: 700,000 (about 200,000 in 1970-75 and 500,000 in
1975-79); Excess deaths in 1970-79: 2 min; Out-migration in 1970-79: 570,000; The
resulting "no-war" population in 1980 would have been about I 0. 7 million. The loss in 1975-
79 is about 2.3 min (500,000 births deficit+ 1.4 mh1 excess deaths+408,000 out-migration).
Motivation for this Paper Scientific article published in a book on war demographics in 2005.
CRAIG ETCHESON, 2005 Data Sources Data collected in the DC-Cam mass grave mapping project
Methods for Excess Deaths Excess deaths of Khmer Rouge, 1975-78, (2.2 min) are composed of two parts: The first
component is the number of individuals represented by human remains in the mass graves
mapped so far in Cambodia: 1,1 min. A second component ofEtcheson's estimate are
indirect excess deaths (I. I mh1. ), whose number remains about the same as the number of
individuals in the mass graves. The proportion between the two components (i.e. direct
and indirect excess deaths) equals 50:50 and is assumed after Heuveline (1998). Other
proportions available from literature (and based mainly on small sample estimations) are
seen as not reliable enough to be used.
Methods for Causes of Death By applying the "fitly-fitly~ distribution. It is assumed, however, that all (or a majority of)
victims in the mass graves are from executions rather than from mixed direct and indirect
causes of death.
Motivation for this Paper Chapter in a book and article on victimization of the Khmer Rouge regime and in particular
on mass graves and victinls from exhumations.
RENAKSE ESTIMATE, 1983 Data Sources Renakse petitions collected by the National Front for the Defence, Restoration, and
Solidarity of Kampuchea between 1980 and 1983 (hereafter: the Front); Documents on
crinles of Pol Pot regime (the Ministry of Culture)
Methods for Excess Deaths Nation-wide action of the Front; the number of petitioners is estimated at 1,166,307
Methods for Causes of Death Narratives of the petitioners; any other informants and sources including reports of the
Research Committees, exhumations reports etc.
Motivation for this Paper Possibly political; petitioners made claims that the Khmer Rouge representatives had to be
removed from the UN General Assembly and representative of the new Vietnam·
supported government should take their place. Individual sources for this report still
meaningful but should be asssessed on case by case basis.
Sources Generally, no victim counts were produced for the Khmer Rouge victims by any author; however, two attempts tried to address this issue. One is the Renakse nation-wide popular survey of the early 1980s and the second one is the mass grave mapping project of DC-Cam. Despite of its good intentions, Renakse effort was not successful in producing a reliable count due to the lack of a reliable statistical framework. The DC-Cam mapping project has been largely successful; so far it identified an estimated 1.3 min human remains in the mapped mass graves, but the work is not yet finished and not validated other than by survivors statements. The proper exhumations of all these remains will never be done due to the large scale of the problem and gradual disappearance of the
22

00385285 E3/2413 D'Vil •· ··@)~~ 1f ¢' iiv ft&.- ' I 7:__
remains. A sample of exhumations could be certainly most useful but the sample would not offer a complete count of victims either.
All in all, victim counts do not exist for the Khmer Rouge regime and thus could not be used by the authors listed in Table 4. What exists and was used, were a number of small scale retrospective surveys conducted after 1979 and several popular sources based on monitoring of the situation in the 1970s and early 1980s by individuals and international organizations, such as for example the writings of Father Ponchaud ( 1978), early 1980s estimates of Khmer Rouge victims by socialist countries of Eastern Europe and Hanoi, reports and statements of international organizations such as Amnesty International or UNICEF, numerous press reports and research articles and books. All these sources are aggregate; no lists with victim names were usually compiled (except for S-21 and a few other occasional locations). Popular sources are not a good replacement of professional statistical sources. They most certainly can provide some useful insights and contextual information but when it comes to victim numbers, these sources should be dealt with caution.
Sample surveys,28 although usually small or very small, were most certainly valuable as they increased the understanding of the Khmer Rouge victimization mechanisms and the victim numbers. However, none of these surveys could be seen as nationally representative and thus none could be used to produce the overall estimate of Khmer Rouge victims for the entire Cambodia.
With respect to the population size in Cambodia in 1970s, data sources listed in Table 4 include population estimates by the authors themselves or by others. Note that official NIS projections did not exist for the 1970s; the UN projections, even though did exist for the 1970s, remained basically unrevised prior to 1980; thus were showing population development under "no-war/no-turmoil" scenario. In this situation, many authors listed in Table 4 based their estimates of the 1970-79 population on the 1962 population census in Cambodia, and pre-Khmer Rouge main studies of the 1962 census by Migozzi (1973) and Siampos (1970). Many authors relied on the estimates by CIA (1980), which obviously had much impact on shaping the opinions on the Cambodia population in especially the early 1980s period. Additional estimates included by the authors are those by the Cambodia governments in the 1970s and early 1980s, including by Khmer Rouge themselves, and the (unrevised) UN Population Prospects. Occasionally, the 1980 or 1981 administrative population counts of Cambodia were referred to as well.
28 Ben Kiernan is among the authors who referred to sample surveys most intensively. Examples of surveys he discussed in his 1996 book (and its later editions, i.e. 2008) in victims context are listed below. The survey of Sliwinski is exceptional among all these surveys as it is the most extensive in terms of substance and based on relatively high number of respondents. May Ebihara, 1993: Anthropological survey of a Khmer village of 158 inhabitants in Cambodia (Kanda! province, sou th
of Phnom Penh). In: M. Ebihara, A Cambodian Village under the Khmer Rouge, in Kiernan, 1993: Genocide and Democracy in Cambodia, chpt. 2 (Quoted after Kiernan, p. 459)
Stephen Heder, I 98 I: A survey of I ,500 refugees on the Thai-Cambodian border in I 980-8 I (field data on I 5,000 individuals - members of respondents' immediate families). Specific source not available. (Quoted after Kiernan, p. 456)
Katuiti Honda, 198 I: Two surveys in two Khmer villages (one of I 68 people and one of 728 people). Journey to Cambodia: Investigation into Massacre by Pol Pot Regime. Tokyo, 1981. (Quoted after Kiernan, p. 459)
Ben Kiernan, 1980: A survey of 500 respondents of whom I 00 interviewed in France in 1979 and 400 inside Cambodia in 1980. In: Ben Kiernan and Chanthou Buoa, 1982: Peasants and Politics in Kampuchea, 1942-198 l. London Zed Books.
Milton Osborn, 1980: A survey of 100 Khmers among the refugees in camps at the Thai-Cambodian border. In: M. Osborn, 1980: Pol Pot's Terrifuing Legacy. FEER, 6 June 1982, pp.20-22. (Quoted after Kiernan, p. 456).
Marek Sliwinski, 1995: ''Le genocide Khmer Rouge une analyse demographique", Editions L 'Harmattan, 1995, 175 p.
23

00385286 E3/2413 AQ at 9·~ 1' r; &;o .~fiJ L
As we will show in the next section, many discrepancies exist between all these estimates; in particular among those for January 1979. Fewer differences are seen for the projected 1970 and April 1975 population. Most importantly, no one of the above-mentioned early attempts at estimating the population of Cambodia by April 1975 and January 1979 can be conclusively seen as the most likely "only right" variant, which makes any indirect method for excess deaths estimation which is based on the estimated population size extremely uncertain.
Uncertainty of the 1970s population estimates is a result of the lack of reliable statistical sources which could provide assumptions in relation to 1970s trends in births and deaths. Only one demographic and health survey is mentioned (Banister and Johnson, 1993) which could give some indications for the post-Khmer Rouge period (1982; Cambodia Ministry of Planning; methodology of which is not entirely clear and most certainly does not compare with the modem demographic and health surveys supervised by the World Health Organization - WHO). No other professional surveys were used by any author for the years 1970-79 as such surveys do not exist. Migration is hazily documented too, but at least some UNHCR, UNDP and local statistics exist (e.g. Cambodian Displaced Persons Working Group; in Huguet (1991 )); good migration reviews are available too (e.g. Banister and Johnson (1993)) and could be referred to. That does not mean that the existing migration statistics are all consistent.
More recent studies, starting from around 1995, were more fortunate with sources for the post Khmer Rouge period. In 1995 Sliwinski published results of his Cambodia survey and provided new evidence about mortality and fertility changes during the 1970s and under Khmer Rouge regime in particular. Much could be learned from this new source about excess deaths and their causes, and about fertility and natural mortality trends. From the 1993 elections in Cambodia, an excellent individual level database became available of the registered 1993 voters. Heuveline (1998) used this data in his backwards projection of the Cambodia population until 1980. In 1997 Huguet used the 1996 Cambodia Demographic and Health Survey to estimate backwards the 1980 population which confirmed that the 1980 administrative count can be trusted. In 1998, the first modern census took place in Cambodia, whose data was used by Neupert and Virak (2005) for a reliable modem backwards projection until 1993. This projection gave a link between the 1998 census and electoral rolls of 1993. All in all, the more recent studies ( 1995 and later) had a better statistical basis for the period after the fall of Khmer Rouge. The basis for the years after the 1962 census and during the 1970s remained the same in any estimate, i.e. poor.
Methods The papers referred to in Table 4 are not homogenous in character. Some are articles or book chapters focused exclusively on Khmer Rouge victims and other demographic consequences of this regime,29 some others concentrate on the population change in Cambodia in the 1970s and analyze this chanFe as a subject in itself;30 the remaining ones discuss it as part of a broader historical context.3 Finally, some authors used unique Cambodian sources, such as DC-Cam mass grave records and Renakse petitions.32 In all papers listed in Table 4 the question of victims remains central; it might be so, however, that the character of a given study had some impact on the type of research approach applied.33 More importantly, it seems that the research discipline the authors belong to had a fundamental impact on the approach chosen for the estimation. Demographers and
29 E.g. Heuveline (1998), Heuveline and Poch (2007), Sliwinski (1995), Kiernan (2003). 30 E.g. CIA ( 1980), Ea Meng-Try ( 1981 ), Banister and Johnson ( 1993 ), Neu pert and Virak (2005). 31 Vickery (1984), Kiljunen (ed .. 1984), and Kiernan (1996). 32 Etcheson (2000 and 2005) for mass grave statistics and '·Renakse Summary" of 1983. 33 Meaning that more complex approaches were applied in studies devoted exclusively to the estimation of Khmer Rouge victims and less complex (i.e. simpler) approaches in studies that were part of bigger historical contexts.
24

00385287 E3/2413 m~e0 ,, ,;) /{Jc/:/!._
statisticians relied on (quantitative) population projections and (mixed quantitative and qualitative) scenarios, political and other behavioral social scientists on sample surveys, and historians on multiple sources including interviewing survivors and other relevant persons (e.g. state and international officials), generalizing sample surveys, studying documents, such as research information, letters, press reports etc., post-conflict visits to the country and direct inspection of the situation etc. Each of these approaches is valuable in some way and complementary to others; all of them depend heavily on the inputs used by the authors (i.e. data and assumptions). Whenever poor inputs were used the results cannot be seen as reliable and meaningful.
The following groups of methods can be distinguished in the studies assessed in this report: Demographic balancing equation: Excess deaths as part of the demographic balancing equation for the "Population Decline" or "Population Loss" between April 1975 and January 1979 Population Scenarios: two variants were app'lied, unrestricted and restricted; the restriction involved ·using the 1980 population size and age- and sex-structure as a limit for the population development between 1975 and 1980 Extrapolation of Sample Surveys Results over the Entire Population Excess Deaths as a Residual Category between Two Projections Excess Deaths as Linked to Mass Grave Statistics Excess Deaths as a Nai've Estimate from Nation-Wide Investigation
Demographic balancing equation Demographic balancing equation is the most approximate and unreliable method, disregarding whether it is applied to the population decline or population loss. There are three components of the equation: births, deaths (natural and excess), and net migration. The level of analysis is the entire population of Cambodia, not even the disaggregation by age and sex is applied. Population decline (in absolute terms) is analyzed by comparing the population size between April 1975 and January 1979. The population at the beginning and end of the analyzed period is decided first, usually on subjective grounds by brief reviews of estimates by others. In the second step, assumptions are made about the magnitude of births, deaths and net migration in 1975-79 in such a way as to satisfy the equation. In this puzzle, unlike in any real puzzle, there exist several variants of alternatively shaped "pieces" that will always add up to the overall decline. This method was applied by Ea Meng-Try (1981) and Vickery (1984)).
In the case of the population loss, instead of the 1975-79 decline, a difference is analyzed between the expected (under "no-turmoil" scenario) and actual population on January 1979. Both populations are decided first; both are very hard to predict. The components of the difference are again births (actually the births' deficit which is the difference between the expected and actual births), deaths (only excess) and net migration. The balancing equation explains that the difference between the expected and actual population on a given moment is the result of births' deficit, excess deaths and net migration. Again several alternatives exist that satisfy also this equation. The authors who used this method included Kiljunen (ed.; 1984) and Banister and Johnson ( 1993)); the latter in combination with several other more sophisticated analysis.
There exists a third variant of the demographic balancing equation as well. In this variant the "expected" January 1979 population expresses the population that would have been observed in the absence of excess deaths but under the actual natural growth and actual net-migration in April 1975 -January 1979. The annual growth is usually assumed much lower than before 1970 (say 1 % instead of the usual 2.8%). In this variant the difference between the expected and actual population on
25

00385288
January 1979 are exclusively excess deaths, as births and net-migration are the same in both these populations.
Notably, already at this stage several important difficulties arise, such as the distinction between natural and excess deaths and the magnitude of expected versus actual births. None of the authors addressed the fact that natural mortality is not a straightforward concept, as in many witness testimonies and some surveys (e.g. Sliwinski 1995) most deaths during Khmer Rouge regime were reported as a result of daily hardship, work overload, bad and largely absent health care, undernutrition, emotional problems related to broken familial and social ties etc. It is likely that natural mortality during Khmer Rouge regime was considerably lower that before this period and that most deaths should be considered indirect victims of Khmer Rouge regime. Regarding births, while technically the expected births can be just extrapolated from the 1962 census, it is unclear how large the decline in normal fertility would be in the 1970s. Actual births in 1975-79 are a mystery too. And so, it is highly uncertain what portion of the expected births can be considered "births deficit".
In the absence of reliable data on the population size and structure, migration, and on fertility and mortality trends, the balancing equations have no value. They express no more than individual authors' subjective views on one of the many possible variants of population development during the Khmer Rouge period. The lack of more elaborate justifications in terms of methods and sources makes these methods hard to accept and subject to considerable distrust. Note however that demographic balancing equations can be also made as a final check up for the data resulting from a complex demographic estimation, i.e. population projection methodology or a scenario, for example. In this case the equation is not the source for its components and for the excess deaths in particular. The equation is a summary of projection results and as such provides meaningful and important inputs. (Comp. Kiernan (2003), Banister and Johnson (1993) and Neupert and Virak (2005)).
Population Scenarios Population scenarios, such as the one by CIA (1980) or Bannister and Johnson (1993), are more complex and better justified than the demographic balancing equations. Both these sets of scenarios are exceptional; both go very deeply into the details of the population development. The CIA presents a crystal clear method ("demographic accounting", i.e. a simple projection) which is based on numerous assumptions. Sources for the assumptions are generally called "intelligence" and "CIA analysts expertise". No list of detailed references is provided for the assumptions, which makes the CIA outcomes mysterious and questionable. Bannister and Johnson on the other hand provide numerous sources on every aspect discussed in their paper (except on Khmer Rouge victims). Their method used for obtaining their plausible scenario (and for their 1980-2050 scenarios) is somewhat unclear and the reader can judge about the method only from reading between the lines. Most likely it is a simple population projection restricted from above. Banister and Johnson impose the restriction onto the upper limit of the population change by taking the actual population size and ageand sex-structure from the year 1980, thus around January 1979, as the one being approached, in order to keep the plausible scenario as real as possible.
Scenarios are obviously based on a formal model describing population development, a model that has clear assumptions and uses transparently defined initial values of the population size. Once the model is run, its final outcome is the result of what has been put into it. CIA model has many additional structures, including the OLD and NEW people, six-month sub-periods etc. The additional structure makes the CIA model extremely transparent; anyone can re-run their analysis with the same or modified inputs. The transparency of Banister and Johnson's model is different: the detailed model structures are unclear but each statement has its verbal justification. All these features make scenarios attractive candidates to be considered worthwhile tools; the lack of reliable population data
26

00385289
keeps the scenarios still questionable, although more convincing than the demographic balancing equations.
Extrapolation of Sample Surveys Results Extrapolation of sample surveys results over the entire population was done by several authors, most importantly by Sliwinski (1995), Kiernan (1996) and Heuveline and Poch (2007). This approach is often applied in the estimation of conflict mortality world-wide. It has as many advantages as shortcomings, however. What matters is the quality and reliability of the survey material and, secondly, of the population estimates at the beginning of the conflict period. Problems around the population estimates for April 1975 have already been partly discussed. At this stage we need to summarize issues around the surveys. Only retrospective and surveillance surveys will be considered here as these were the only types used for Cambodia.34
Advantages of retrospective and surveillance surveys include among others: Death rates can be estimated without knowing the actual population size; i.e. using the records of the survey population only; Death rates can be analyzed by sub-area and over different time periods; Can be performed in many settings including both urban and rural areas and camps; Data collected can be broad such that much contextual information becomes available; Data quality can be efficiently controlled; Requires limited resources for a limited duration, i.e. is easy to implement
Weaknesses ofretrospective and surveillance sample surveys are the following: Random sample surveys are not suited to provide representative record of victimization in the entire population of a conflict-affected country. This is because respondents are selected from survivors, among whom the victims of the most dramatic episodes are underrepresented; Convenience samples could be a better alternative, especially if they were selected following the historical development of the conflict. But convenience samples are highly unpopular among researchers who wrongly believe that only random surveys are the appropriate tools; Sample drawing mechanism might produce a significant bias if it is in disagreement with conflict development; e.g. camp samples will correctly represent the victim populations from the areas the camp respondents moved from before arriving in the camp, but not necessarily the rest of the country population; Some groups of respondents might see the survey as a form of registration for aid distribution; this might cause another bias of over-reporting of survivors; There is a recall bias in sample surveys; more distant surveys are known to contain more gaps and misreporting than the early ones; Death rates might be biased for short periods and small areas covered by the survey
The above must apply in several ways as well to the surveys conducted in relation to Cambodia's 1970s victimization. As we show in the discussion that follows below, the main problem for
34 Compare: Francesco Checchi and Les Roberts, 2005: "Interpreting and Using Mortality Data in Humanitarian Emergencies. A Primer for Epidemiologists." HPN Report No. 52. September 2005 (p.19). Francesco Checchi and Les Roberts, 2008: Documenting Mortality in Crisis: What Keeps us from Doing Better? PLOS Medicine, Vol. 5, No. 7. Neil F. Johnson et al., 2008: Bias in Epidemiological Studies of Conflict Mortality. Journal of Peace Research Vol. 45. No. 5., pp. 653-663. Ramesh Silva and Patrick Ball, 2005: The Demography of Conflict-Related Mortality in Timor-Leste ( 1974-1999): Reflections on Empirical Quantitative Measurement of Civilian Killings, Disappearances and Famine-Related Deaths. Conference paper presented at: ··Documenting Mortality in Conflicts". 6 November 2008, CRED Brussels.
27

00385290 E3/2413 ~Iii • ' ~ ·~ )t , . , 1'57/)0 ·~i// l
Cambodia is the lack of the national representativeness of the existing surveys, especially of small surveys covering one or two villages.
Table 5 below summarizes some surveys conducted in relation to victims of the Pol Pot regime in Cambodia. Several of them were reviewed by Kiernan (2008) as part of his historical investigation of the victimization in the Khmer Rouge period. Kiernan as well uses additional materials when exploring victimization issues, such as his interviews with survivors and witnesses to the events under Khmer Rouge, observations from his frequent visits to Cambodia, relevant statistics from the work others, his personal communications with persons working in this field etc. Kiernan's opinions with regard to victims are far broader than the numbers from the surveys he refers to and therefore sound convincing. It is clear, it is Kiernan's overall expertise in the history of Cambodia, and in the Khmer Rouge episode of it in particular which makes the reader believe the opinions he puts forward in his writings.
Table 5. Overview of Surveys Discussed in Kiernan (1996)35
Author of Survey Sample Inteiviemd in Suivey Sample Size
I. Reviewed by Kiernan (2008 )* - Ebihara (1993) Village Svay, Kanda! province 158 individuals - Heder(l981) Refugees, Thai-Cambodian border 15,000 individuals - Honda (1981) Two villages, Kanda! province 728 and 168 individuals - Honda(l981) Four rural cmrnnunities, Eastern Cambodia 3 50 individuals - Osbom(l980) Refugees, Thai-Cambodian border 100 fumilies - PKP (Aug 1979), Doc 2.4.0lc Urban community in Phnom Penh 1,075 n'Klividuals
2. Sliwinski (1995) Refugees in Thai camps, Phnom Penh & around 13, 163 individuals 3. Heuveline and Poch (2007) Rural district, Kanda! Erovince I 0,000 individuals Note: Kiernan as well rewewed a large numberc~fre:mlts he obtained.from inten1iewes and his own work in villages
These results are not included here as they were not surveys
Death Toll (Pol Pot
53% 20%
41%and 45% 36% 25% 42%
25% 25%
Kiernan is the only author that integrates the results produced in a number of different surveys and survivors recollections into his estimate of death toll under Khmer Rouge. The strength of his approach is that he does that on the basis of respondents' social and ethnic group; thus not by applying a single percentage obtained in one survey to the entire population of Cambodia in April 1975. He breaks down the April 1975 population into sub-populations, such as the NEW and BASE people, and within these groups into a number of sub-groups, i.e. Rural Khmer, Urban Khmer, Chinese, Vietnamese, Lao, Thai etc. Each of these sub-populations is assigned a different estimated
35 May Ebihara, 1993: Anthropological survey of a Khmer village of 158 inhabitants in Cambodia (Kanda! province, south of Phnom Penh). In: M. Ebihara, A Cambodian Village under the Khmer Rouge, in Kiernan, 1993: Genocide and Democracy in Cambodia, chpt. 2 (Quoted after Kiernan, p. 459)
Stephen Heder, 1981: A survey of 1,500 refugees on the Thai-Cambodian border in 1980-81 (field data on 15,000 individuals - members of respondents' immediate families). Specific source not available. (Quoted after Kiernan, p. 456)
Katuiti Honda, 1981: Two surveys in two Khmer villages (one of 168 people and one of 728 people). Journey to Cambodia: Investigation into Massacre by Pol Pot Regime. Tokyo, 1981. (Quoted after Kiernan, p. 459)
Ben Kiernan, 1980: A survey of 500 respondents of whom I 00 interviewed in France in 1979 and 400 inside Cambodia in 1980.In: Ben Kiernan and Chanthou Buoa, 1982: Peasants and Politics in Kampuchea, 1942-1981. London Zed Books.
Milton Osborn, 1980: A survey of 100 Khmers among the refugees in camps at the Thai-Cambodian border. In: M. Osborn. 1980: Pol Pot's Terrifuing Legacy. FEER. 6 June 1982, pp.20-22. (Quoted after Kiernan, p. 456).
Marek Sliwinski, 1995: ·'Le genocide Khmer Rouge une analyse demographique", Editions L 'Harmattan, 1995. 175 p. Patrick Heuveline and Poch Bunnak, 2007: "The Phoenix Population: Demographic Crises and Rebound in Cambodia".
Demography, Vol. 44, No. 2, p. 405-426.
28

00385291
percent of excess deaths which is further used in the extrapolation over the entire population. This makes Kiernan's approach truly remarkable.
If, however, one would like to base one's views exclusively on the surveys and neglect other sources, several of the surveys would appear too small and too insignificant to be taken seriously. The sample of 158, 168 or 350 individuals as in Ebihara (1993) and Honda (1981) can be considered a special case study and no more than that. Only three surveys seem to be large enough to accept them as serious representations of large groups of the Cambodia population that survived the Pol Pot reigns, i.e. Heder (1981 ), Sliwinski ( 1995) and Heuveline and Poch (2007). Yet even these three do not pretend to be representative of the entire population exposed to the risks of death under Khmer Rouge. And it is likely that the victims of the most fatal episodes of Khmer Rouge regime are underrepresented in all three surveys. Still all three studies are consistent in the estimated death toll of the Khmer Rouge regime; in the three surveyed populations of survivors the death toll is about 20 to 25 percent.
As we already noted, surveys like Heder's, Sliwinski's and Heuveline and Poch's are not that small and not that questionable. Sliwinski for example had drawn his sample from three different populations of survivors and in different periods of time (see Annex 3 for details and selected results on Khmer Rouge victims); all periods are not that distant from the fall of Khmer Rouge in January 1979. With the total number of the interviewed families being 1,296 and covering the fate of 13, 163 individuals this survey is exceptional:
- It is relatively big, carefully prepared, preceded by a pilot, and selected from three different populations of survivors, at three different moments of time.
- Its representativeness of the entire country cannot be assessed but most certainly it can be seen as a broad and solid case study.
- Its scope is extensive; not only Khmer Rouge revolution is covered but as well the civil war of 1970-75; comparisons of the two are possible.
- It explores areas of victimization that are of the utmost interest to a court of law, such as causes of death, timing of casualties, targeting of ethnic and professional groups, and of urban versus rural populations etc.
The extrapolation of survey results is careful; a majority of the results are reported as percentages and can be applied to any population size. The author provides his best estimates of the Cambodia population in April 1975 and January 1979; thus obtaining absolute numbers is possible. Uncertainty of Sliwinski's population estimates is expressed by presenting two very different variants (HI and H2) which however are quite convergent when it comes to,the overall number of excess deaths during the Khmer Rouge period.
Another important example of a reliable sample survey that can be used for estimates of Khmer Rouge victims is the Mekong Island Population Laboratory (MIPopLab), a demographic surveillance system established recently by Heuveline and Poch (2007) in the Kanda! province near Phnom Penh.
MIPopLab is an on-going demographic surveillance system launched in December 2000 in a rural district of Kanda! province. The population of this district is about I 0,000 persons and is questioned systematically once per year36 regarding their basic demographics. A special module was designed in the MIPopLab survey to explore demographic consequences of Khmer Rouge regime, including excess mortality, disruptions in marriage formation and reproductive behavior. The module includes
36 In the beginning they were questioned twice a year but at present only one time (personal communication of Ewa Tabeau with Patrick Heuveline and Poch Bunnak. 26 June 2009).
29

00385292
births and marriage histories of all women aged 15 to 75 years (2,843 histories were obtained). Data on parental survivorship were collected from all respondents of the Kanda! district. Using this data, several important results were obtained not only on excess mortality but as well on declines in fertility and marriage formation during Khmer Rouge period.
Heuveline notes that regarding demographics, Kanda! district cannot be seen as representative of the entire Cambodia population and not as extreme. He places Kanda! somewhere between the old and new people; likely closer to the Phnom Penh population than the areas populated by base people.
Major results for Khmer Rouge regime include for example: The proportion of excess deaths of Khmer Rouge regime in the population was about 25 percent Crude fertility rates (CFR) in 1976-1978 fell to about two-thirds of their pre-war levels CFRs rebound was immediate and striking in 1979-80; from 3. 7 births per woman in 1976-78 to 7.1 births per woman in 1979-8037
·
Crude marriage rates (CMR) offemales aged 15 to 34 years fell to 35% of their pre-war level during 1976-78 CMRs rebounded as early as in 1979-80 and became 86% higher than the pre-war level, mainly thanks to a significant contribution of remarriages in this period The overall decline in fertility during Khmer Rouge was caused by a clear general drop in fertility of married women in reproductive ages and as well by the decline in marriage formation and high proportion of widowed women in the population (20% widows among the female survivors of Khmer Rouge).
The micro approach of MIPopLab is a worthwhile extension of earlier studies of Heuveline on Khmer Rouge victims. It broadens and deepens his analysis. Read together with the 1998 main article of Heuveline, this paper becomes an important refinement and confirmation of his earlier results.
Summing up, several sample surveys provided results consistent with those of Sliwinski (1995) and Heuveline and Poch (2007); thus corroborating their findings (Kiernan, 1996, 2003). It seems that the main issue in the context of sample surveys is again the estimated population size in April 1975 which is to be used in the extrapolation of survey statistics over the entire population of Cambodia.
Excess Deaths as a Residual Category The next group of methods applied in international research on Khmer Rouge victims obtains excess deaths as a residual category between two projections, one forwards and backwards, that meet at the end of the 1970s. Heuveline (1998) and Neu pert and Virak (2005) applied this method.
This method is a transparent well formulated modern quantitative approach which leads to reliable figures on excess and violent deaths in the 1970s and in 1975-79 in particular. A formal model is applied with well justified assumptions. The model represents the most up-to-date demographic standard in population projections. The level of subjectivism is relatively low compared with other authors. Both authors build up on the work of others but are critical and selective of their results. Neupert and Virak stop at presenting the overall number of excess deaths in 1970-79 (and its sex and age distribution). Heuveline goes further and separates violent and non-violent excess deaths from each other, and next subtracts civil war deaths from all 1970-79 excess deaths obtaining his estimate of Khmer Rouge victims.
37 For the recent two decades Heuveline shows that TFRs for Kanda! province remain consistently lower by about 21 to 23% than the national estimates.
30

00385293 E3/2413 f'f)D~o /=J) ''tte ~ "t 0 • 1 1 I_
The separation of violent deaths and their distribution into pre-Khmer Rouge and Khmer Rouge period is certainly convincing in Heuveline's work. Interpretation of his results could be more focused on the most likely variant as his range of all possible values of the number of victims in 1970s is extremely unrealistically large.
Heuveline's estimates are not perfect, however, and need to be improved by: including births since 1970 and their mortality separation of victims of starvation in 1979 from the estimated excess in 197 5-79 narrowing down the estimated range of all possible victims in 1970s to make it more realistic.
Also Neupert and Virak's (2005) article is based on solid data sources and sound methodology. As a matter of fact, the population projection methodology is the same as that of Heuveline (1998). The resulting number of excess deaths in 1970s obtained by Neupert and Virak is, however, lower than that of Heuveline (2 min vs. 2.5 min in 1970-79, and 1.4 min versus 2.2 in 1975-79). 38 The authors explain this difference as follows:
smaller volume of net migration in Heuveline (1998) lower normal mortality for the 1970s in Heuveline (1998) the 1970 population was larger in Heuveline (1998); 7.662 min in Heuveline (1998) and 7.4 mln in Neupert and Virak (2005)
In addition to the above, the 1980 population obtained from the backwards approach (6.803 min by Neupert and Virak) is rather high compared with the 1980 population from the Cambodia administrative count ( 6.590, end-1980). Huguet (1997) had also run a backwards projection from the 1998 Census until 1980 and produced 6.550 min population for mid-1980. Heuveline's projection for January 1980 was 6.437 min. Thus, yet another factor behind the difference with Heuveline's number of excess deaths is his smaller 1980 population.
All in all, it seems Neupert and Virak produced a relatively low estimate of excess deaths (1.4 min in 1975-78; 1.4 min does not include the estimated 300,000 famine deaths in 1979 and not estimated 300,000 excess deaths in 1970-75), whereas Heuveline's estimate of2.2 min excess deaths in 1975-78 belongs to higher ones (the 2.2 becomes 1.9 min if it does not include about 300,000 famine deaths in 1979 and not 300,000 during the civil war). 39
A number of similar explanations were provided in Neupert and Virak (2005) about differences with other studies (e.g. Banister and Johnson, 1993). The main source of these differences is seen in the estimated 1970 population and assumptions used by various authors.
The overall conclusion is that even best methods do not work by themselves; assumptions used for models play an important role. It is the methods, assumptions and expertise the authors have in the study subject that underlie the final outcomes. Still, well defined fonnal methods and explicitly and
38 We obtained the number of I .4 million from the original Neupert and Virak's estimate of 2 min for I 970-79. We assumed 300,000 excess deaths for the civil war and another 300,000 for the I 979 famine deaths; in total 600,000 deaths, which we subtracted from 2 million. What remains out of2 min, is the death toll of Khmer Rouge April 1975-January 1979. 39 Calculations discussed in this paragraph are all produced by the authors of this report. Some 300,000 excess deaths were assumed in these calculations for the civil war and another 300,000 for the 1979 famine deaths. Subtracting these two components from the excess deaths estimated for I 970-79 by Neupert and Virak and Heuveline makes it possible for us to directly compare these figures for exclusively 1975-78. Note that the same assumptions were used for both authors as this was the most straightforward way of comparing these two different numbers.
31

00385294 E3/2413 ~ .....
..to ~ftV_itJ I t/B/l/'
deeply justified assumptions make it easier for the audience to understand and accept certain outcomes compared with outcomes that are simplistic and non-transparent.
Excess Deaths as Linked to Mass Grave Statistics This method was applied by Etcheson (2000 and 2005). Excess deaths of Khmer Rouge, 1975-78, are composed in his approach of two parts: - direct excess deaths seen as the number of human remains in the mass graves mapped so far - indirect excess deaths, whose number remains about the same as the number of individuals in the mass graves.
The proportion between the two components (i.e. direct and indirect excess deaths) equals 50:50 and is assumed after Heuveline (1998). Other proportions available from literature (and based mainly on small sample estimations) are seen as not reliable enough to be used; these other proportions relate to narrower groups of the population.40
It is unquestionable that the data from the DC-Cam mass grave mapping are an essential source on victims of the Khmer Rouge regime in Cambodia. Thus, using this data for an estimate of victims not only makes a lot of sense but is important and needs to be done. It is unquestionable that a vast majority of victims in the mass graves, if not all, are Khmer Rouge victims (violent or non-violent). The assumption that all victims found in the mass graves were killed in executions might be difficult to prove, however. One reason for this is that non-violent excess deaths were most certainly frequent during Khmer Rouge regime. It is unlikely that such deaths, if occurred in detention centers, were buried in locations other than the mass graves. Also some non-violent excess deaths from hospitals might be buried in the nearby mass graves. Another reason for this is that the usual burial practices were forbidden by Khmer Rouge and thus not commonly exercised during this period. Thus, some marginal numbers of "natural" deaths might be found in the mass graves too, especially in smaller graves located in a distance from detention and security centers. Despite of the fact some non-violent excess deaths were likely buried in the mass graves together with victims of executions and interrogations, all the victims in the mass graves cannot be considered natural deaths. The category of natural deaths must be seen completely marginal under Khmer Rouge as life circumstances the Khmer Rouge regime created for their population prevented natural death and forced unnatural death instead.
Another aspect of the massive death process during the Khmer Rouge period is that many bodies were abandoned and left on the surface exposed to the devastating and quickly progressing atmospheric influences in this region of the world; thus, a large number of bodies were never buried in mass graves but decomposed on the surface. Many other bodies were dropped into rivers, wells, single pits and whatever other (often small) places which were equally strongly exposed to the hot and humid natural environment as the unburied bodies. It is therefore highly probable that the mass grave victims identified today are just a sample of all excess deaths.
The identified graves should be thus seen as a "burial-place-sample" of all people that died as war victims during that time. Some 30 years after the end of the Khmer Rouge era the sample contains about 1.3 million remains as estimated from the current DC-Cam mass grave statistics. It is fully
40 The fifty-fifty distribution of violent and non-violent excess deaths is likely a good compromise that is strongly supported by Heuveline's solid analysis of excess deaths for Cambodia using model life tables. In the conflict in TimorLeste between 1974 and 1999, such distribution was 18% of the killed and missing persons to 82% of deaths from starvation and diseases (Silva and Ball, 2005). Disregarding how similar or dissimilar these two historical episodes are. it is perfectly possible that these two proportions can have extreme values. In such situations the fifty-fifty distribution ensures the lowest error.
32

00385295 E3/2413 CDNJ:,to t \;:y , , ~Q A, '; I -
possible that the mass graves identified so far comprise about 50-60% of all buried and unburied individuals. It is likely that the bodies in the graves represent both executed and indirect Khmer Rouge victims; the proportion between them will vary between the different graves. In any case, it is a large and important sample and must be further studied for unfolding information about how many, how and when these persons died.
For the above reasons, we consider Etcheson's estimate of2.2 million excess deaths fully possible and in line with the most serious attempts of estimating the excess deaths in Cambodia.
Excess Deaths as a Naive Estimate from Nation-Wide Investigation The Renakse methodology and its flaws are discussed in Section 2.2 of this report. The conclusion is that Renakse statistics cannot be trusted as they contain duplications and other shortcomings. At the same time, some areas are not covered as they were inaccessible to the Renakse committees. Therefore this estimate, although well intended, cannot be considered reliable enough to be taken into account.
Table 6 attached below gives a quantitative summary of our expert assessment of the sources, methodology, and transparency used in the international and local research on Khmer Rouge victims in Cambodia. For this summary we developed a scale (attached under Table 6) which allows for verbal expression of our scores. The maximum possible score is 40 per one estimation approach. None of the approaches used for Khmer Rouge victims obtained the maximum.
Table 6. Quantitative Assessment of Estimates of Khmer Rouge Victims Studied in This Report
Approach Sources Methods Transparency Convincing Poller Total Score Demographic balancing equation 4 4 4 2 14 Population Scenarios 4 6 6 6 22 Extrapolation of Sample Smveys Results 5 7 8 8 28 Excess Deaths as a Residual Category 5 8 8 8 29
Excess Deaths as Linked to Mass Grave 5 7 8 8 28 Excess Deaths as a N aiVe Estimate (Renakse) 4 4 4 2 14
Scale: 1-10
I. misleading 2. worthies.\' 3 very bad ./.fa1/ed 5. average
6. satisji:Jctory 7. good R. very good 9. excellent J 0. exceptional
According to Table 6 the most valuable studies are those that obtained excess deaths as a residual category of two separate projections. The authors of these studies include Heuveline (1998) and Neupert and Virak (2005). The second best are extrapolations based on sample surveys (Kiernan (1996), Sliwinski (I 995), Heuveline and Poch (2007)), and on mass grave data (Etcheson (2000 and 2003). The difference between the first and second scores is very small, practically insignificant.
The number of Khmer Rouge excess deaths estimated in these studies ranges from about I .4 to 2.2 millions. Violent excess deaths equal from approximately 700,000 to 1. I million.
3. EXCESS DEATHS AND RELATED ISSUES IN APRIL 1975-JANUARY 1979: SUMMARY OF EXISITING RESULTS
3.1 Population of Cambodia, 1975-79
Jn this section we summarize our findings related to the population of Cambodia as estimated by various authors at mid-1970, April 1975 (or around), and January 1979 (or around). Any political
33

00385296 E3/2413 fP Q~lji !)~ 1 ~; 4- t, • rs. t I ' --
estimates, i.e. estimates by the subsequent governments of Cambodia in 1970-1980, are excluded. In the lack of reliable population data, these estimates are I ikely to be biased by making them fit the political objectives of the governments. We include the estimates by the authors whose work is reviewed in this report on the first place. In addition to that, we as well discuss recent population estimates by NIS (Cambodia Statistical Yearbook of 2000; Annex 4) and UN (Population Prospects, 2008 edition; Annex 4). The choice ofNIS and UN estimates was dictated by the need to provide a context for the estimates by our authors. However, both the NIS and UN should not be taken as the ultimate correct perspective. We will show that for the particular years 1970, 1975 and 1979 both these institutions produced unrealistically low estimates. Finally, also the pre-Khmer Rouge projections by Migozzi (1973) and Siampos (1970) are shown (for 1970 these are meaningful numbers; afterwards their projections become hypothetical and represent "what if no conflict" scenario).
Before we begin our analysis, we must stress that not all estimates are directly comparable; this is because some authors produced estimates for different moments around the required January 1979; for example, for end-1980 (NIS, 2000), start-1980 (Heuveline, 1998), mid-1980 (Neupert and Virak, 2005; UN, 2008), and May-1981 (Kiljunen ed., 1984) instead of January 1979. Secondly, NIS and UN produced their estimates as mid-year figures. Finally, Heuveline ( 1998) estimated "de Jure" population (in January 1980) and not "de facto" living in Cambodia.41 For these reasons, our analysis must be seen as approximate. We made two variants of it, one for all available estimates and one by excluding the most incomparable figures. General findings remain, however, largely the same in both variants.
Figure 2. Population Estimates for Cambodia in (or around) Mid-1970 by Various Authors
Mid-1970 Population of Cambodia (millions)
7,MIO +-
"""' 7JOO
7.000
...... , ........ , ..... . ······· L .••...
.....
..... 6,100 j..
Significant differences exist between the estimates of the Cambodia population for each of the three time points analyzed here. These differences are visualized in Figures 2 through 4 and Table 7. The UN and NIS estimates belong to the lowest projections for mid-1970 and April-1975 and to the
41 "De Jure·· represents the population that was recorded in the 1962 census in Cambodia but by 1980 they did not necessarily still had their place of residence in Cambodia. The first group of those not living in Cambodia in early 1980 were the refugees in Thailand; they were registered in the 1993 electoral rolls. Another group were those who left Cambodia after 1962 and did not return to be registered as voters in 1992. Thirdly, also those non-returnee immigrants who managed to register as 1993 voters needed to be counted (or estimated) too. All these were the requirements for the proper estimation of excess deaths in the 1970s as the residual category between two projections.
34

00385297 E3/2413 00 Nl-il>Ai Q f 'l''/f /f
highest for January 1979. In the latter case this is partly because they both relate to the 1980 population (mid- and end-year respectively). UN figure for mid-1980 (6. 748 min) is almost identical with that ofNeupert and Virak for the same period (6.8 min). As we will see further in this section, in the latest 2008 edition of the UN Population Prospects, the UN estimates for the years 1980 and over became highly consistent with the latest second revised population projections of the Cambodian NIS; Ricardo Neupert made these projections for the NIS in 2005 (using the 1998 census and 2004 Cambodia Intercensal Population Survey).
Figure 3. Population Estimates for Cambodia in (or around) April-1975 by Various Authors
April 1975 Population of Cambodia (millions) 11,uoo r"·
Figure 4. Population Estimates for Cambodia in (or around) January-1979 by Various Authors
January 1979 Population of Cambodia (millions) 7,000
...
. ..... , ... .... ... ········
• •• • ~· e • • '
.... !i,.$00
!i,200
For 1970, the UN and NIS estimates (6.938 and 6.8 min, respectively) are far lower than those by Migozzi and Siampos (7.363 and 7.143 min), who were the leading analysts of the 1962 census in Cambodia for the period before the 1970s. It is likely that both the UN and NIS considerably underestimated the Cambodia population in 1970 (Figures 2 and Sa).
35

00385298 E3/2413 11&&pv .@lttsfl/L
Also the UN estimate for 1975 (7.098 min; NIS has no estimate for this period), is the lowest of all reviewed here (Figures 3 and 5a). The situation changed with the UN and NIS projections for 1979 (actually mid-1980 in case of UN and the end-1980 administrative count in case of NIS). As shown in Figures 4 and 5a, both the UN and NIS do not go together with other estimates. The UN and NIS obviously set a new trend for the years 1980 and over; the trend is far more optimistic regarding the population size in Cambodia than most analysts believed it was (Figure Sb; for NIS 2000 reference figures and their sources see Annex 4). In Figure Sb the reference baseline for the figures from the 2008 edition of the UN Population Prospects are the rough estimates published by NIS in their Cambodia Statistical Yearbook for 2000. At the present time the prevailing official opinion on the Cambodia population is that it has been growing more quickly than anticipated around the 1998 census.
Figure S. Projected Population Size in Cambodia in (or around) Mid-1970, April-1975 and January-1979 by Various Authors
(a) All Authors 11,0011·:···"""
10,00ll
9,000
8,llllO
7,000
6,0011
~.ooo
mid-year 1970 Aprll 197~
-.- Siampos
-e- MJOO/.ZI 197.1
-·-\JN 20011
_...,. NIS2000
CIA 19110
b\MJ~NCi-TRY 19111
-VICKERY 19114
-KJIJUNEN(liJ)) 19114
BANISTER -JOIINSON 1991
-SLIWINSKI 1995
-KIERNAN 1996
• HEUVELINE 19911
• NEUPl~RT-VIRAK 2005
'----------------·---------------·-·----··-· Note: NJ,\' 1975 approx1ma1edhy UN 2008e.,·11ma1ej(Jr1975
(b)~elected Authors
Population of Cambodia (millions) 14.000
12.(100 • ~ < •
' 10.000
' ... • •
8.000
•• •• • •• •• •• ,, ... 6.1100 • • .L
4.000
2.000
0.000
+ NIS 2000 (rough)
*' NIS. 2nd revised 2005
•UN 20011
•CIA 1980
,,,_Vicker;.' 1984
-Siminski 1995
Kicrnan 199(1
36

00385299 E3/2413 j:;& "io/1 o _ ij I ~/± /' 1
Nole\·: Sources for rhe NJ.\' (2000) populat1on.figure.\·
1962: general popualtum cenrns
1980: admm1.1·rra11ve cmml end-year
J 98 J ro J 989 e1·11ma1ed wuh 2.8% annual growth rate
1990-/993 esumared wuh 2.5% annual growth rate
1994: SE.\'93-9./ and provrnctai reports
1995: prov111c1al repom·
1996· SE.\'C96 (DSC96 Mar<.:h 1996: 10, 702)
I 99 7.· CSE\'9 7
1998: xeneral populatum censu.1· March 1998
All in all, in the recent practice the UN and NIS were clearly conservative with regard to the population in 1970 and 1975 and projected too low sizes, and for the years 1980 and onwards they became "optimists" and estimated relatively high numbers of the population size. The change has much to do with the improved data sources available at present and more refined methodology that could be used for the latest NIS and UN projections. The result of this change is the incompatibility of these projections in long term, i.e. for the period from 1970 to 1998 and above.
Table 7. Estimated Population Size in Cambodia According to Various Sources, Mid-1970, April 1975 and January 191? (or around)
VEAR Population Jl'ppulatioo Population ABS Deviation ABS Deviation ABS Deviation Population• ABS Deviation•
CATEGORY PUBLISHED mid-1970 (oraround)';'1 ·Apn1197~ (or January 1979 (or
mid-1970 (or around) April 1975 January 1979 (or January 1979 January 1979
aroun around) (or around) arotmd) (or around) (or around)
SIAMPOS 1970 7.143 R.165 9.355 0.049 NA NA NA NA MIGOZZI 1973 7.363 8.581 I0.007 0.171 NA NA NA NA UN 2008 6.938 7.098 6.748 0.254 0.289 0.327 6.748 o.327 NIS 2000 6.800 NA 6.590 0.392 NA 0, 169 i;,590· }):J('9 CIA 1980 7.060 7.384 5.845 0.132 0.003 0.576 5.845 0.57(1
EA MENG-TRY 1981 7.300 7.460 6.510 0.108 0.073 0.089 6.5!0 0.089
VICKERY 1984 7.000 7.100 6.700 0.192 0.287 0.279 6.700 0.279
KIWUNEN (ED) 1984 7.100 7.300 6.700 O.O'J2 0.087 0.279 6.700. {)~19.:,i} BANISTER- 1993 7.000 7.300 6.360 ll.192 0 087 0.061 6.360 0.061
SLIWINSKI 1995 7.363 7 566 5.586 0.171 0 179 0.835 5.586 0.835
KIERNAN 19%,2003 7.363 7.890 6 360 0.171 0.503 0.061 6.360 0.061
HEUVELINE 1998 7.662 NA 6437 0.470 NA 0.016 6.437 tU!l6 ~ NEUPERT-VIRAK 2005 7400 NA 6.800 0.208 NA 0.379 6.100 Qc3{9
AVERAGE 7.192 7.387 6.421 0.200 0.189 0.279 6.227 0.317
MAXIMUM 7.662 8.581 I0.007 0.470 0.503 0.835 6.700 0.835
MININMUM 6.800 7.098 5.586 0.049 0.003 0.016 5.586 0.061
DIFF (MAX-MIN) 0.862 1.483 4.421 0.422 0.500 0.820 1.114 0.774
Nolc.t 71ic .ftar r•J 111d1c111es re.m/1.v hi·exd11di11g l 'N (2008). NIS (2000), Kilj1111e11 ed ( /984), He11wl111e ( J 998! mid f\.'er1per1 a11d I 'irak (2005J
Re: Pop.ltm 1979 (or aro1111d) · /<.:Xc11lded A111/wr.v·
C!f\.1{20()8) ,,,,J./980
NIS tWOO! end-1980
Kif;m1e11(ed) Afoy/981
"''ll~t•fi11e ( / 99H) .vlarl·l 980, ~de Jllre ~ pop1wfllm1
Ne11perl & /'1ruk (1005) nud-1980. ~de./iiclo~ pop11folio11
Regarding the population size in the 1970s, Kiernan (1996) and Sliwinski (1995) proposed the most dramatic changes, and CIA (1980) estimated the second dramatic trends (Figure 5 and Table 7). Note that Sliwinski never used this projected population (April 1975 and January 1979) to produce his estimates of the death toll; nevertheless he presented these figures as the population framework for his survey, and as such we included them here as well. Kiernan's and Sliwinski's 1970 population was 7.363 min (after Migozzi, 1973), that of CIA was 7.060 million. Their 1975 population was 7.890 and 7.566 min; CIA had 7.384 min for April 1975. Finally for January 1979 they anticipated 6.360 (Kiernan), 5.586 (Sliwinski), and 5.845 min (CIA). It is interesting Kiernan estimated 1.671-1.855 min excess deaths, Sliwinski about 1.869-1.888 min and CIA about I min (authors' estimate from CIA data; see Annex 3) as associated with these changes.
Vickery was at the other extreme; his predictions were the closest to the UN and NIS figures, i.e. Vickery predicted the least dramatic change between 1970 and 1979; from 7 to 7.1 42 to 6. 7 min in
42 Vickery's figure for 1975 (7.1 min) compares with that of CIA (7.3 min) as Vickery excluded from his April 1975 population some 200,000 of Vietnamese repatriation to Vietnam in 1975.
37
" ~-
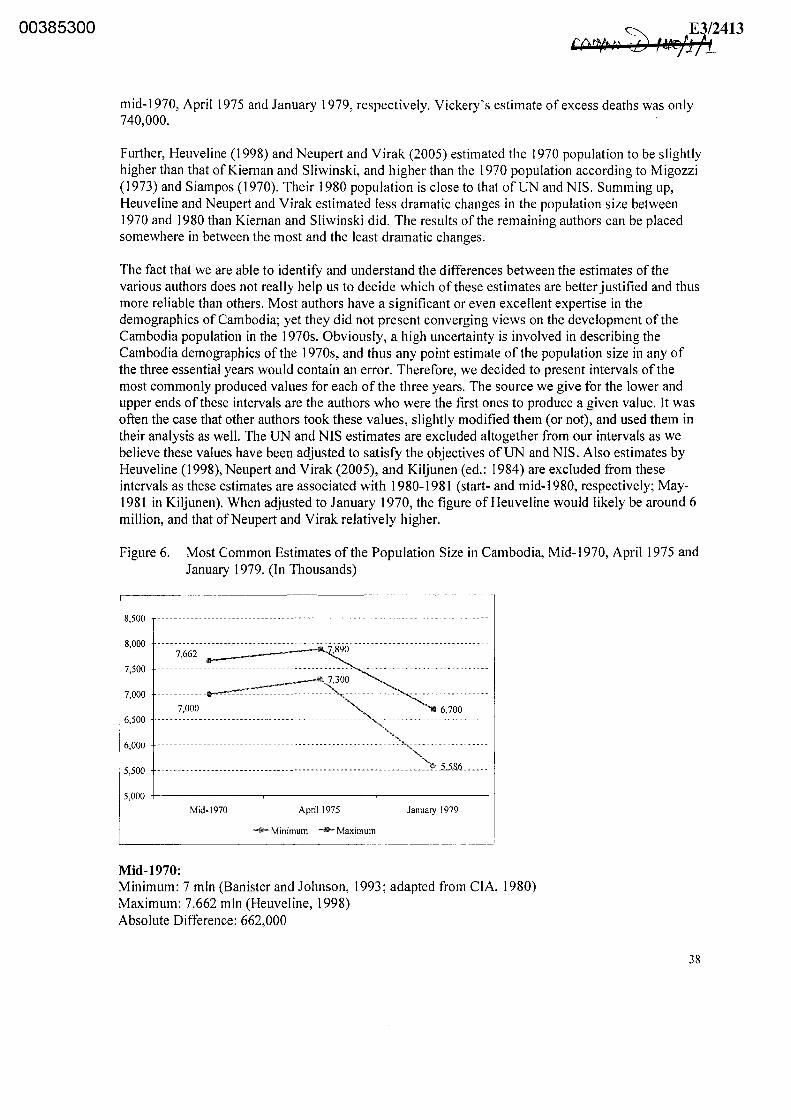
00385300
mid-1970, April 1975 and January 1979, respectively. Vickery's estimate of excess deaths was only 740,000.
Further, Heuveline (1998) and Neupert and Virak (2005) estimated the 1970 population to be slightly higher than that of Kiernan and Sliwinski, and higher than the 1970 population according to Migozzi (1973) and Siampos (1970). Their 1980 population is close to that of UN and NIS. Summing up, Heuveline and Neupert and Virak estimated less dramatic changes in the population size between 1970 and I 980 than Kiernan and Sliwinski did. The results of the remaining authors can be placed somewhere in between the most and the least dramatic changes.
The fact that we are able to identify and understand the differences between the estimates of the various authors does not really help us to decide which of these estimates are better justified and thus more reliable than others. Most authors have a significant or even excellent expertise in the demographics of Cambodia; yet they did not present converging views on the development of the Cambodia population in the 1970s. Obviously, a high uncertainty is involved in describing the Cambodia demographics of the 1970s, and thus any point estimate of the population size in any of the three essential years would contain an error. Therefore, we decided to present intervals of the most commonly produced values for each of the three years. The source we give for the lower and upper ends of these intervals are the authors who were the first ones to produce a given value. It was often the case that other authors took these values, slightly modified them (or not), and used them in their analysis as well. The UN and NIS estimates are excluded altogether from our intervals as we believe these values have been adjusted to satisfy the objectives of UN and NIS. Also estimates by Heuveline (1998), Neupert and Virak (2005), and Kiljunen (ed.: 1984) are excluded from these intervals as these estimates are associated with 1980-1981 (start- and mid-1980, respectively; May-1981 in Kiljunen). When adjusted to January 1970, the figure of Heuveline would likely be around 6 million, and that ofNeupert and Virak relatively higher.
Figure 6. Most Common Estimates of the Population Size in Cambodia, Mid-1970, April 1975 and January 1979. (In Thousands)
8,500
8,000 7,662
7,500
7,000
7,000 6,500 ., 6,000 - - - - - --- - - - -- - - --- -- - - -- - - - - - - - - - -- - - - - - - - - - - - - - - - -- - - - - - -~--, -- - - - - - - - - - -- - - - - -,, 5,500 -- - ------ -- - ----- -- -- - -------- - - -- -- -- - - -- -- -- - --- --- - - - - - - - - -- - -~-5_,.5_8.6 _ - - ---
5,000 -+--------,.--------.-------------,
Mid-1970 April 1975 January 1979
-+-Minimum -If!>- Maximum
Mid-1970: Minimum: 7 min (Banister and Johnson, I 993; adapted from CIA, I 980) Maximum: 7.662 min (Heuveline, 1998) Absolute Difference: 662,000
38
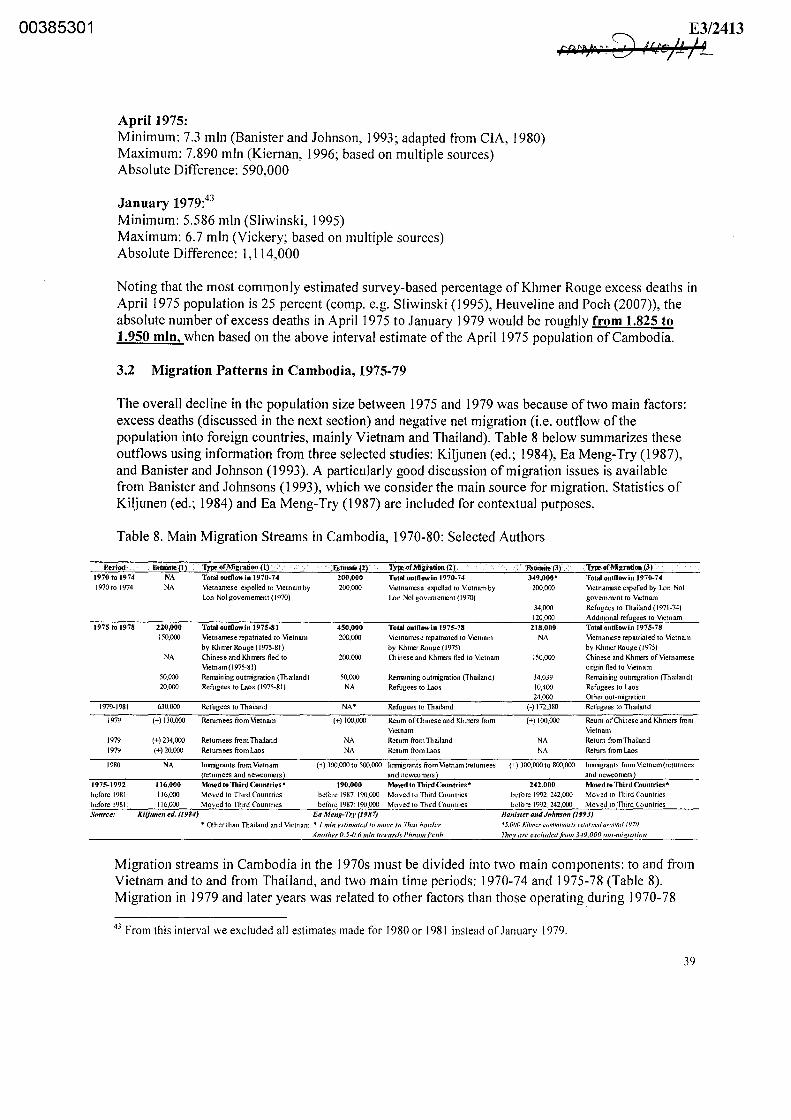
00385301
April 1975: Minimum: 7.3 min (Banister and Johnson, 1993; adapted from CIA, 1980) Maximum: 7.890 min (Kiernan, 1996; based on multiple sources) Absolute Difference: 590,000
January 1979:43
Minimum: 5.586 min (Sliwinski, 1995) Maximum: 6.7 min (Vickery; based on multiple sources) Absolute Difference: 1,114,000
E3/2413 ~~ta" 8 '"'1)~ 19 ~I . ' I
Noting that the most commonly estimated survey-based percentage of Khmer Rouge excess deaths in April 1975 population is 25 percent (comp. e.g. Sliwinski (1995), Heuveline and Poch (2007)), the absolute number of excess deaths in April 1975 to January 1979 would be roughly from 1.825 to 1.950 min, when based on the above interval estimate of the April 1975 population of Cambodia.
3.2 Migration Patterns in Cambodia, 1975-79
The overall decline in the population size between 1975 and 1979 was because of two main factors: excess deaths (discussed in the next section) and negative net migration (i.e. outflow of the population into foreign countries, mainly Vietnam and Thailand). Table 8 below summarizes these outflows using information from three selected studies: Kiljunen (ed.; 1984), Ea Meng-Try (1987), and Banister and Johnson (1993). A particularly good discussion of migration issues is available from Banister and Johnsons (1993), which we consider the main source for migration. Statistics of Kiljunen (ed.; 1984) and Ea Meng-Try (1987) are included for contextual purposes.
Table 8. Main Migration Streams in Cambodia, 1970-80: Selected Authors
Period E.tma1e(l) Type of Migration (1) E.tmate(2) Type of Migration (2) Estmate{J! Type of Migration (3) 1970 to 1974 NA Total outflow in 1970-74 200,000 Total outflowin 1970-74 349,000* Total oulflowin 1970-74 1970to 1974 NA Vietnamese eJIPelled to Vietnam by 200,000 VietnaID.;"!se expelled to Vietnam by 200,000 Vietnamese expelled by Lon Nol
Lon Nol govemement ( 1970) Lon Nol govemement (1970) government to Vietnam
34,000 Refugees to Thailand (1971-74) 120,000 Addnional refu ees to Vietnam
1975 to 1978 220,000 Total oulflowin 1975-81 450,000 Total outflow in 1975-78 218,000 Total outflowin 1975-78 150,000 Vietnamese repatriated to Vietnam 200,000 Vietnamese repatriated to Vietnam NA Vietnamese repatriated to Vietnam
by Khmer Rouge (1975-81) by Khmer Rouge (1975) by Khmer Rouge (1975) NA Cliinese and Khmers fled to 200,000 Chinese and Khmers fled to Vietnam 150,000 Chinese and Khmers of Vietnamese
Vietnam(l975-81) origin fled to Vietnam 50,000 Remaining outmigration (Thailand) 50,000 Remaining outnlgrat1on (Thailand) 34,039 Rema.ming outmigration (Thailand) 20,000 Refugees to Laos (1975-81) NA Refugees to Laos 10,400 Refugees to Laos
24,000 Other out-m •ration 1979-1981 630,000 Refugees to Thailand NA' Refugees to Thailand (-) 172,380 Refugees to Thailand
1979 (+) 130,000 Returnees from Vietnam (+) 100,000 Reum of Chinese and Khmers from (+) 100,000 Reum of Chinese and Khnl!rs from Vietnam Vietnam
1979 (+) 234,000 Returnees from Thailand NA Return from Thailand NA Return from Thailand 1979 (+) 20,000 Returnees from Laos NA Return from Laos NA Return trom Laos
1980 NA Jmnigrants from Vietnam (+)300,000 to 500,000 lirmigrants ffom Vietnam (returnees (+) 300,000to 800,000 Jmmigrants from Vietnam (returnees {returnees and newcomers l and newcomers~ and newcomers l
1975-1992 116,000 Mowd to Third Countries* 190,000 Mowd to Third Countries* 242,000 Mowd to Third Countries* before 1981· 116,000 Moved to Third Countries before 1987 190,000 Moved to Third Countries before 1992: 242,000 Moved to Third Countries before 1981: 116,000 Moved to Third C-0untries before 1987·.190,000 Moved to Third Countnes before 1992: 242,000 Moved to Third C.ountries .\'011rce: Kilj1111e11 ed. (1984) Ea Meng-Try (1987) /Ja11ister and Jfllmstm (1993)
•Other than Thailand and Vietnam •I min e.1"/lmarcd to mo1•e fo 711a1 hon/er *5.000 Khmer comm11111.,·1.,· re!urnecl arouml /970
Another 0.5-0 fi min towarJ~· /'hnom Penh 111eJ' are excluded fi·m11 3./9.000 0111-migra1ion
Migration streams in Cambodia in the 1970s must be divided into two main components: to and from Vietnam and to and from Thailand, and two main time periods: 1970-74 and 1975-78 (Table 8). Migration in 1979 and later years was related to other factors than those operating during 1970-78
43 From this interval we excluded all estimates made for 1980 or 1981 instead of January 1979.
39
00385302 ~c 'e 1· .,Q 'b4~ ff,2413 Pfc 710. , I- -
and resulting first from the civil war and later from the Khmer Rouge regime. Importantly, in 1970-78 it was the outflow of the Cambodia population into the main neighboring countries, i.e. Vietnam and Thailand, which took place. The out-migration contributed to the decline of the population size in this period.
For the entire period 1970-78, Banister and Johnson estimated a total of 567,000 individuals that left the country; Ea Meng-Tty's estimate is higher and equals 650,000. Banister and Johnson saw the largest part of the outflow occurring during the civil war (349,000 out of 567,000) whereas Ea MengTry during the Khmer Rouge regime ( 450,000 out of 650,000). Both authors agree that the out-migration to Vietnam was the main component in the period of 1970-78, including 200,000 Vietnamese expelled to Vietnam by the Lon Nol government and another group of about 150,000-200,000 Chinese and Khmers of Vietnamese origin who left Cambodia to Vietnam after April 1975. The two studies disagree about another group of 200,000 Vietnamese that according to Ea Meng-Try were expelled by the Khmer Rouge forces after April 1975. In turn, Banister and Johnson argue that already during the Lon Nol rule most Vietnamese were expelled or left themselves; the rest of Vietnamese were persecuted by both governments and only a few of them survived until the end of 1978. Banister and Johnson assume therefore another 120,000 mostly Vietnamese residents of Cambodia who left to Vietnam in 1971-74. This disagreement is the main cause of difference in these two sets of statistics. Banister and Johnsons compiled exceptionally detailed and well documented study of migration in 1970 to 1993, and have been conservative and careful in their conclusions; we tend to accept their statistics rather than the statistics by others.
Banister and Johnson anticipated a total of218,000 out-migration from Cambodia for the Khmer Rouge period. This total includes the above mentioned outflow of Chinese and Khmers of Vietnamese origin to Vietnam (150,000), outmigration to Thailand (34,039), and a small outflow of Cambodians to Laos (10,400). The latter returned to Cambodia by 1987.
The overall total of 218,000 is not dramatically high as Cambodia remained a closed country during the Khmer Rouge years 1975-78. There were not many successful migrants due to a strict system of internal check points of the Khmer Rouge army and all kinds of security concerns (e.g. mine fields) that made it impossible for the Cambodians to travel freely.
Many Cambodians wanted to leave their country to move to developed countries in Europe (mainly France) and North America (USA). It is hard to say how many achieved this goal already during the years 1975-78. Statistics available so far show that there were about 72,000 such persons until 1979 and another 44,000 in 1980-81 (a total of 116,000 in 1975-81; Table 8); their number increased to 190,000 by 1987 and to 242,000 by 1993. Note that all persons leaving to Western countries usually took Thailand as their initial destination. The statistics on those that moved to third countries (i.e. countries different than Thailand and Vietnam), should not be taken as new and additional to those presented in Table 8 as refugees to Thailand in 1975-78.
From Table 8 we also see that the actual migratory "boom" started after the fall of Khmer Rouge regime in the years 1979-81; and continued throughout the 1980s (which is not discussed in Table 8). 44 The years 1979-1981 were characterized by several types of movements. Most importantly a large internal movement took place towards the border with Thailand; Ea Meng-Try estimated this movement to be about 1 million, of which according to Banister and Johnsons at least 172,380 left Cambodia and became actual refugees in camps at the Thai border. Kiljunen (ed.) estimated this
44 More about 1980s refugees from Cambodia can be found in Vickery ( 1987): '"Refugee Politics: The Khmer Camp System in Thailand". Chapter in: D. A. Albin and M. Hood (1987): "'The Cambodian Agony". M. E. Sharp, INC .. Armoul, New York. etc .. or Kiljunen (ed. 1984): "Refugees and Opposition Movements". Chapter 4.
40

00385303 ~Q '11 h ,;;;;) '~~ Q3&;413 ' I z ,. ,,. I I
group to be far larger (630,000). Another large group of the rural population moved towards Phnom Penh (500,000-600,000 according to Ea Meng-Try). Finally, and most strikingly a very high inmigration took place from Vietnam. Banister and Johnson gave an interval of 300,000 to 800,000 persons as an estimate of this group (their most likely number is 500,000). It included Vietnamese soldiers and advisors and their families, Cambodian returnees (Vietnamese citizens of Cambodia, Chinese and Khmers) expelled or left in another way in 1970-78, and newcomers seeking economic, political or other opportunities in Cambodia.
3.3 Basic Statistics on Overall Excess, Violent and Indirect Deaths
This section summarizes the estimates of Khmer Rouge excess deaths obtained by the authors whose research is assessed in this report. Table 9 below is an excerpt from the more extensive summaries we made for each author separately. Individual summaries of all estimates are attached in Annex 3.
In order to present a clear pattern in the above estimates Figures 7 and 8 show their numerical values graphically. Note that presenting these pictures would not be possible without taking averages of certain interval estimates originally produced by several authors and without approximating those estimates that were not explicitly presented by the authors (such as the CIA (1980)). All these averages and approximations are ours. Our approximation of the CIA estimates is discussed in detail in Annex 3 together with the individual summary of the CIA report. In brief, we did it by first calculating the overall number of deaths in April 1975-January 1979 directly from the population data and death rates produced by CIA for the OLD and NEW people. There were about 1.753 min such deaths. We assumed these were both natural deaths and indirect Khmer Rouge victims. We distributed these deaths fifty-fifty, applying thus the uniform distribution into natural deaths and indirect victims (0.876-0.876 min). CIA estimated in their medium variant that there were 100,000 executions during Khmer Rouge regime. We added the executions on the top of indirect deaths (0.876 min) and obtained the total of excess deaths being 0.976 million.45
In our comparisons, we also had to adapt n "the CIA but some other of the original estimates, especially those produced as .intervals ins oint estimates, or if more than one estimate was produced by the same author in the course e, or estimates expressed in relative instead of absolute terms (as percentages). The approximations were necessary in order to address our findings in a clear and transparent way. We always took the simplest and most straightforward way of approximating, i.e. for intervals and multiple estimates by the same author, arithmetic averages were taken. For estimates expressed as percentages, we just applied them to the appropriate April 1975 population estimated by a given author. We also applied the fifty-fifty distribution to obtain the number of violent excess deaths if this number was not explicitly reported and the only number available was on the overall death toll.
45 We assumed that each sub-period population estimated by CIA was given as start-period population. Alternatively this could have been the mid-period population. In this case, the estimate of all excess deaths obtained in our procedure would be 1,007, 752 and of violent deaths 503,876 deaths (50% of the overall total of excess deaths).
41
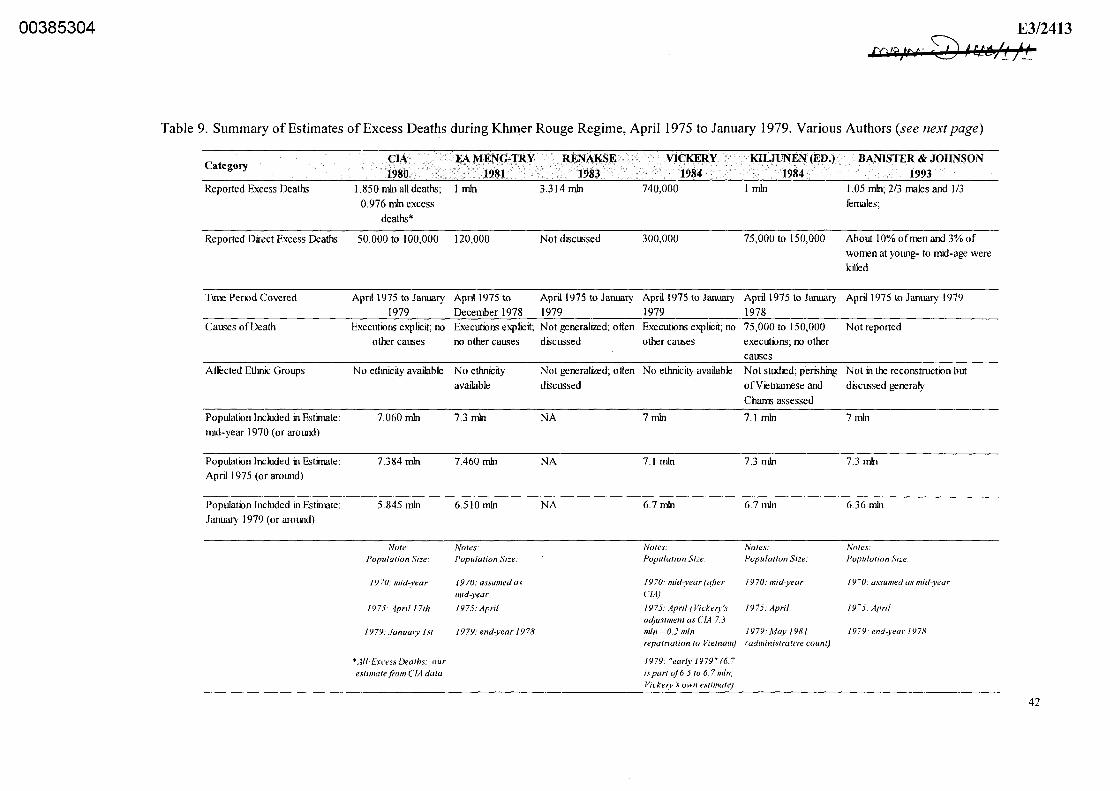
00385304 E3/2413 r, ~IV.Al' 4, .. o&i,~" <b' ,. ~e;7 I •
Table 9. Summary of Estimates of Excess Deaths during Khmer Rouge Regime, April 1975 to January 1979. Various Authors (see next page)
Category CIA EA MENG-TRY RENAKSE VICKERY KILJUNEN (ED.) BANISTER & JOHNSON
1980 1981 1983 1984 1984 1993 Reported Excess Deaths !. 850 min all deatll5; I min 3.314mln 740,000 I min I. 05 min; 2/3 males and I /3
0.976 min excess females; deaths*
Reported Direct Excess Deaths 50,000 to 100,000 120,000 Not discussed 300,000 75,000 to 150,000 About 10% of men and 3% of women at young- to mid-age were killed
Time Period Covered April 1975 to January April 1975 to April 1975 to January April 1975 to January April 1975 to January April 1975 to January 1979
1979 December 1978 1979 1979 1978 Causes ofDeath Executions explicit; no Executions explicit; Not generalized; often Executions explicit; no 75,000 to 150,000 Not reported
other causes no other causes discussed other causes executions; no other causes
Atrected Ethnic Groups No ethnicity available No ethnicity Not generalized; often No ethnicity available Not studied; perishing Not in the reconstruction but available discussed ofVietnamese and discussed generafy
Chmns assessed
Population Included in Estimate: 7 060 min 7.3 min NA 7 min 7.1 min 7 min mid-year 1970 (or around)
Population Included in Estimate: 7.384 mln 7.460 mln NA 7.1 mln 7.3 mln 7.3 mln
April 1975 (or around)
Population Included in Estimate: 5.845 min 6.510 min NA 6.7 min 6.7 min 6.36 min
January 1979 (or arom1d)
Note: Notes: Notes: Notes: Notes:
Population Size: Population Srze: Population Size· Population Size« Populalwn Size:
JY70: mid-year 1970: assumed as 1970: mid-year (afier 1970: mid-yeur I c,r:o: u.Ysumed us mid-year
mid-year CIA)
1975: Apnl /7th 1975: April 1975: April (Vickery'.1· 1975: April 19-5.· April
ad1ustment as CIA 7.3
1979: Januwy /st 1979: end-year 1978 mln-0.2 min 1979. May 1981 1979: end-year 1978
reparnation ra V1ernam) (administrar1ve co1<11f)
•All Excess Deaths: our 1979: "early 1979" (6.7
eslimarefrom CIA data is part oj 6.5 to 6. 7 min;
Vic:ke1y '.\·own est11nate)
42
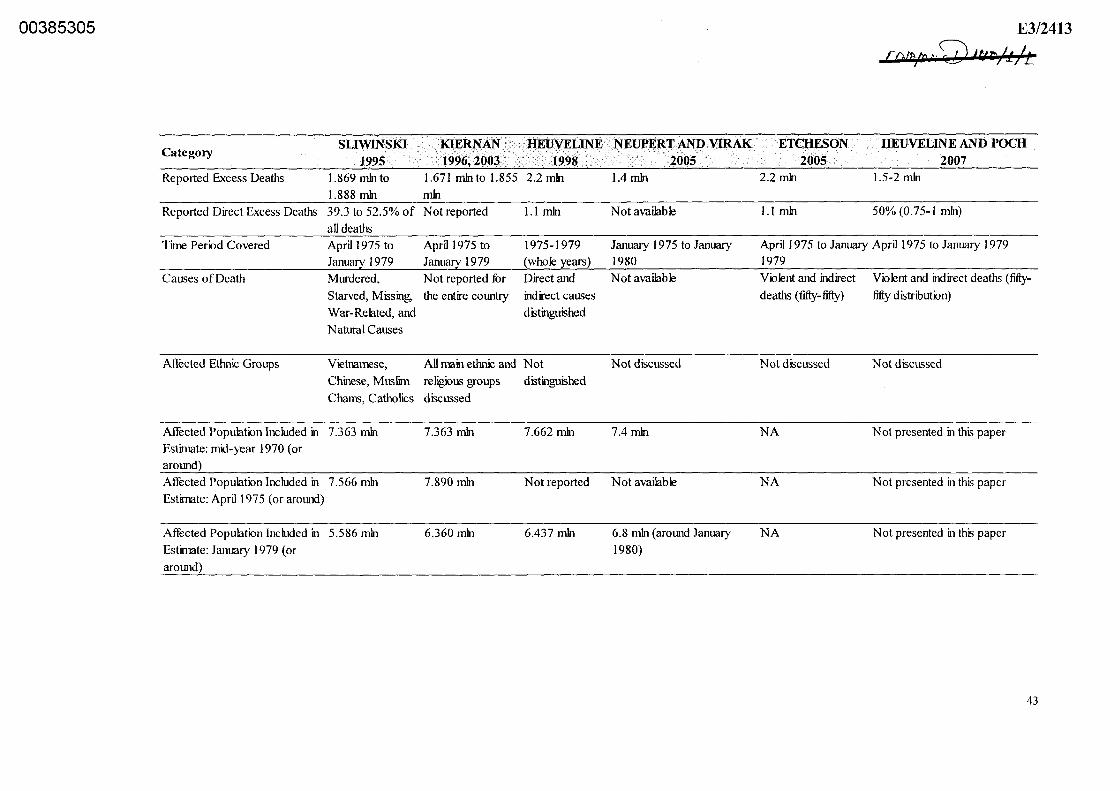
00385305
Category SLIWINSKI KIERNAN HEUVELINE
1995 1996,2003 1998 Reported Excess Deaths 1.869 mln to 1.671 mln to 1.855 2.2 min
1.888 mln mln Reported Direct Excess Deaths 39.3 to 52.5% of Not reported 1.1 min
all deaths Time Period Covered April 1975 to April 1975 to 1975-1979
January 1979 Janua~ 1979 {whole }'.ears)
Causes of Death Murdered, Not reported fur Direct and
Starved, Missing, the entire country indirect causes
War-Related, and distinguished
Natural Causes
Affected Ethnic Groups Vietnamese, All main ethnic and Not
Chinese, Muslim religious groups distinguished
Chams, Catholics discussed
Aftected Population Included in 7.363 mln 7.363 mln 7.662 mln Estimate: mid-year 1970 (or around)
Affected Population Included in 7.566 min 7.890 mln Not reported
Estimate: April 1975 (or around)
Affucted Population Included in 5.586 min 6.360 mln 6.437 min
Estimate: January 1979 (or
around)
NEUPERT AND VIRAK 2005
1.4 mln
Not available
January 1975 to January
1980
Not available
Not discussed
7.4 min
Not available
6.8 min (around January
1980)
ETCHESON 2005
2.2 mln
I.I mln
E3/2413
mra,w .. Q 1crr~/t/L
HEUVELINE AND POCH 2007
1.5-2 min
50% (0.75-1 min)
April I 975 to January April 1975 to January I 979
1979
Violent and indirect Violent and ind ire ct deaths (fifty-
deaths (fifty-fifty) fifty distribution)
Not discussed Not discussed
NA Not presented in this paper
NA Not presented in this paper
NA Not presented in this paper
43
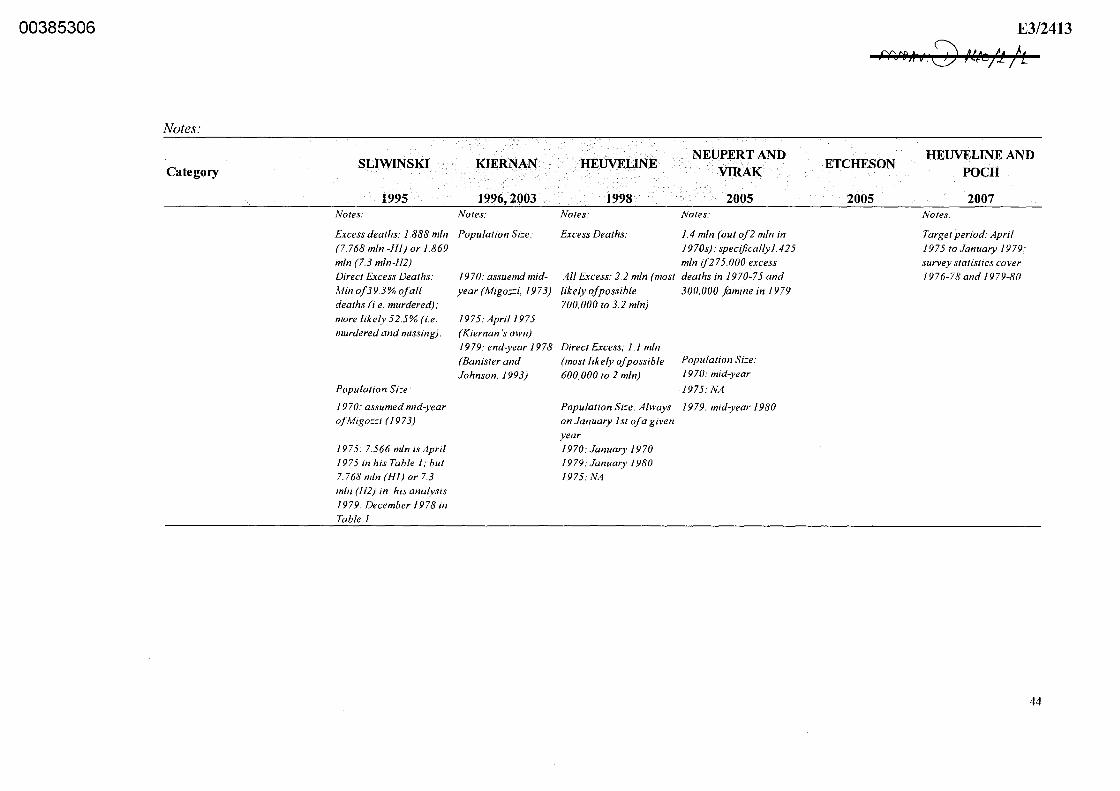
00385306
Notes:
Category SLIWINSKI
1995 Notes:
Excess deaths: J.888 min (7. 768 min -HI) or 1.869 min (7.3 mln-H2) Direct Excess Deaths: Min of 39.3% of all deaths (i.e. murdered): more likely 52.5% (i.e. murdered and missing).
Population Si=e:
1970: assumed mid-year ofMigo==i (1973)
197 5: 7.566 min is April I 975 in his Table I; but 7.768 min (HI) or 7.3 min (H2) in his analysis 1979: December 1978 in Table I
KIERNAN
1996,2003 Notes:
Population Si=e:
1970: assuemd mid-
year (Migo==i, 1973)
1975: April 1975 (Kiernan 'sown) 1979: end-year 1978 (Banister and Johnson, 1993)
HEUVELINE
1998 Notes:
Excess Deaths:
All Excess: 2.2 min (most
likely of possible 700,000 to 3.2 min)
Direct Excess; I.I min (most likely of possible 600,000 to 2 min)
NEUPERTAND VIRAK
2005 Notes:
1.4 min (out of2 min in 1970s); specifica!lyl.425 min if275,000 excess deaths in 1970-75 and
300,000 famine in I 979
Population Si=e: 1970: mid-year
1975: NA
Population Si=e: Always I 979: mid-year I 980 on January /st ofa given year 1970:January 1970 1979:January 1980 1975: NA
E3/2413
~~1 ·~ «~¥ l:t • ;e.•7 7
ETCHES ON HEUVELINE AND
POCH
2005 2007 Notes.
Target period: April 1975 to January 1979; survey statistics cover 1976-78 and 1979-80
44

00385307 so·~ ' ·9 !~~ '1 ¥~12413 r r u ; o . ~ fj _; _::
Figure 7.
2.500
2.000
1.500
0,97(, 1,000
0,500
0,000
Excess Deaths Estimates during Khmer Rouge Regime, April 1975 to January 1979. Varous Authors46
Excess Deaths, April 1975-January 1979 (millions)
l.87'J ~ ~
/~ v ""'·"" I 1.400
J.(JOO ___ ..... ../ 1,050
0.740
CIA 1980 EA MENG- VICKERY KILJUNEN BANISTER& SLIWINSKI KIERNAN. HEUYELINE NEUPERT ETCHESON HEUVELINE TRY 1981 1984 (ED) 1984 JOHNSON 1995 1996. 2003 1998 AND VIRAK 2005 AND POCH
1993 2005 2007
Figure 8. Violent Excess Deaths Estimates during Khmer Rouge Regime, April 1975 to January 1979. Various Authors
Violent Excess Deaths, April 1975-January 1979 1200 (JOO
'°'\llO!UXKI /'-.(.100 .. !XIO
986.000 J \\ ',..._"" 881.500 \ . I 875.000
1000()()()
800.000
VioO.O!XI
600.000
400.000
2000!KI
CIA 1980 EA MENG· VICKERY KILJUNEN BANISTER& SLIWINSKI KIERNAN. HEUVELINE NEUPERT ETCHESON HEUVELINE TRY 1981 1984 (ED) 1984 JOHNSON 1995 1996. 2003 1998 AND VIRAK 2005 AND POCH
1993 2005 2007
Note.\·: Thef(Jl/owing were the approximations used in the ahove chart:
Kiljunen (ed.): average of 75,000 to 150,000 Banister andJohn.wm: 10% men al 15-6-1 years of age and 3% women at 15-6-1 years m 7.3 min in Apr 1975 (Migozzi gives 49.5% of 15-64 years old in 1970; Siampos gives fifty-fifty of men-to-women at these ages fur 1962) Sliwinski: average of'52.5% <!f\ all excess deaths (taken as an average olhts 2 variants)
Kiernan: 50% t!('all exce.t\' deaths; 50% - subjective choice of t"T Neupert and Virak: 50% <4.a// excess deaths - subjec/fve chmce <?lHT
Figure 7 shows that the early estimates of excess deaths (i.e. those published between 1980 and 1993 excluding Renakse), consistently approach the magic figure of 1 million, quite popular in the media and politics in the 1980s and early 1990s, except of that by Vickery (1984) which is 740,000 and is the lowest among all ever made. Later estimates, made between 1995 and the present time, are evidently higher than 1 min and range from 1.4 (Neupe11 and Virak (2005)) to 2.2 million (Heuveline (1998) and Etcheson (2005)). Clearly there was a shift in the scientific thinking about excess deaths caused by the
46 This and the following figures contain some approximations and averages of original estimates. All approximations were calculated by the authors of this report.
JO August 2009 45

00385308
Khmer Rouge regime sometime in the mid-1990s. Regarding the reasons for this shift, some could argue data situation improved in Cambodia in the years after the 1993 elections and a better understanding of the tragic decade became possible. Some others would, however, insist on a better political climate that influenced the more courageous analysis of the demographic consequences of the 1970s. Both mechanisms could have been at work; in addition to them several other factors could have played a role as well, including a new generation of talented modern researchers, and in particular quantitative demographers and population statisticians that engaged in studying the Cambodian tragedy of the 1970s. They brought in fresh methodological approaches and new experience in dealing with deficient data. All in all, contrary to the frequent adjustment of conflict statistics from relatively high to relatively low in other contemporary conflicts of the world, for Cambodia the adjustment had the opposite direction.
The prevailing views of today indicate that excess deaths of Khmer Rouge time in Cambodia were between 1.4 to 2.2 millions. Notably all estimates from this range belong to those most advanced methodologically. Sample survey extrapolations, deaths as a residual between two projections and mass grave statistics are all covered in this interval.
Some would argue that uncertainty of excess deaths estimates is enormous, much higher than the interval 1.4 to 2.2 millions. And indeed Heuveline (1998) who provided the broadest assessment of uncertainty ever, produced an interval of 0.68 to 3.26 min for possible excess deaths in 1975-79 (1979 included as a whole year).47 This interval contains Vickery's extreme estimate of 740,000 excess deaths, not to mention the early estimate of 1 million. However, having produced this interval, Heuveline separates himself from it by saying:
"If pressed to provide my subjective assessment, the estimation range would be much narrower; I would venture 2.2 to 2.8 million in 1970-79and1.5 to 2 million in 1975-79 alone." (Heuveline (1998), p. 60)
Further he explains the reasons of the uncertainty being so high:
"But these were the rules of the exercise that I set for myself: each parameter of the reconstruction included a priori all existing estimates in the range of values; the range was refined through a few basic internal consistency checks only; and my subjective evaluation was limited to assigning a central parameter value within the range. The estimation range for the residual number of excess deaths is therefore large (1.2 to 3.4 million (for 1970-79/8),
although it does suggest that some previous figures are less plausible that others. " (Heuveline (1998), p. 60)
All in all, in order to give as realistic assessment of uncertainty as possible we follow the logic of Heuveline's statements quoted above. Compared with Heuveline's subjective assessment of uncertainty (1.5 to 2 min), the interval we identified based on our review of the recent estimates of Khmer Rouge excess deaths, is a bit broader. The interval of 1.4 to 2.2 million is broader because of its lower end of 1.4 min derived from Neupert and Virak (2005) and upper end of 2.2 min by Heuveline
47 The range of0.68 to 3.26 for 1975-79 can be obtained from Heuveline's Table 3 (p. 60 of his 1998 article). The main principle of the calculation is that all indirect excess deaths shown in Table 3 for 1970-79 (0.08-1.12-1.126 min) need to be associated with 1975-79 and not with the civil war of 1970-75. Heuveline confirmed that in personal communication with Ewa Tabeau on 27 June 2009 in Phnom Penh. The sum of indirect and direct excess deaths Heuveline estimated for 1975-79 is thus: 0.68-2.22-3.26 millions. 48 The period of 1970-79 is added by the authors of this report.
10 August 2009 46
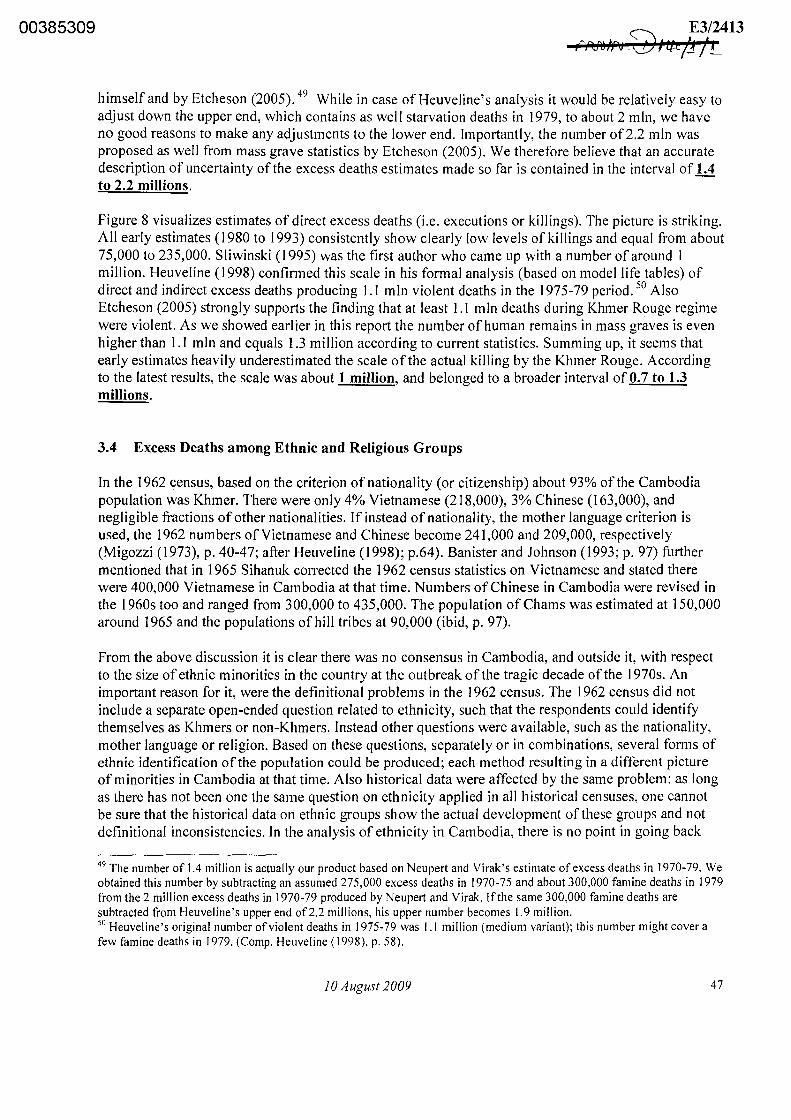
00385309 E3/2413 A%'ll>fo Zd ¥ f:A:/J /L
himself and by Etcheson (2005). 49 While in case of Heuveline' s analysis it would be relatively easy to adjust down the upper end, which contains as wel I starvation deaths in 1979, to about 2 min, we have no good reasons to make any adjustments to the lower end. Importantly, the number of 2.2 min was proposed as well from mass grave statistics by Etcheson (2005). We therefore believe that an accurate description of uncertainty of the excess deaths estimates made so far is contained in the interval of 1.4 to 2.2 millions.
Figure 8 visualizes estimates of direct excess deaths (i.e. executions or killings). The picture is striking. All early estimates (I 980 to 1993) consistently show clearly low levels of killings and equal from about 75,000 to 235,000. Sliwinski (I 995) was the first author who came up with a number of around 1 million. Heuveline (I 998) confirmed this scale in his formal analysis (based on model life tables) of direct and indirect excess deaths producing 1.1 min violent deaths in the 1975-79 period. 50 Also Etcheson (2005) strongly supports the finding that at least I .I min deaths during Khmer Rouge regime were violent. As we showed earlier in this report the number of human remains in mass graves is even higher than 1.1 min and equals 1.3 million according to current statistics. Summing up, it seems that early estimates heavily underestimated the scale of the actual killing by the Khmer Rouge. According to the latest results, the scale was about 1 million, and belonged to a broader interval of 0. 7 to 1.3 millions.
3.4 Excess Deaths among Ethnic and Religious Groups
In the I 962 census, based on the criterion of nationality (or citizenship) about 93% of the Cambodia population was Khmer. There were only 4% Vietnamese (218,000), 3% Chinese (163,000), and negligible fractions of other nationalities. If instead of nationality, the mother language criterion is used, the 1962 numbers of Vietnamese and Chinese become 241,000 and 209,000, respectively (Migozzi (1973), p. 40-47; after Heuveline (1998); p.64). Banister and Johnson (1993; p. 97) further mentioned that in 1965 Sihanuk corrected the 1962 census statistics on Vietnamese and stated there were 400,000 Vietnamese in Cambodia at that time. Numbers of Chinese in Cambodia were revised in the 1960s too and ranged from 300,000 to 435,000. The population of Chams was estimated at 150,000 around I 965 and the populations of hill tribes at 90,000 (ibid, p. 97).
From the above discussion it is clear there was no consensus in Cambodia, and outside it, with respect to the size of ethnic minorities in the country at the outbreak of the tragic decade of the 1970s. An important reason for it, were the definitional problems in the 1962 census. The 1962 census did not include a separate open-ended question related to ethnicity, such that the respondents could identify themselves as Khmers or non-Khmers. Instead other questions were available, such as the nationality, mother language or religion. Based on these questions, separately or in combinations, several forms of ethnic identification of the population could be produced; each method resulting in a different picture of minorities in Cambodia at that time. Also historical data were affected by the same problem: as long as there has not been one the same question on ethnicity applied in all historical censuses, one cannot be sure that the historical data on ethnic groups show the actual development of these groups and not definitional inconsistencies. In the analysis of ethnicity in Cambodia, there is no point in going back
49 The number of 1.4 million is actually our product based on Neupert and Virak's estimate of excess deaths in 1970-79. We obtained this number by subtracting an assumed 275,000 excess deaths in 1970-75 and about 300,000 famine deaths in 1979 from the 2 million excess deaths in 1970-79 produced by Neupert and Virak. lfthe same 300,000 famine deaths are subtracted from Heuveline's upper end of2.2 millions, his upper number becomes 1.9 million. 50 Heuveline's original number of violent deaths in 1975-79 was I. I million (medium variant); this number might cover a few famine deaths in 1979. (Comp. Heuveline (1998), p. 58).
JO August 2009 47

00385310
hundreds of years and strictly stick to rather biased census figures; it is quite enough to start as Kiernan did with the mid-l 950s data obtained in a military tally from 1955, which obviously was based on the self-identification of those counted. Thus, the common sense definition is all we can apply to quantity the death toll of ethnic groups under Khmer Rouge. There will be again large differences in the ethnic composition of Cambodia in April 1975 as provided by different authors; once again we will search for the best justifications of the available figures and for the best estimates of excess deaths within these justifications.
Table 10. Ethnic Groups in Cambodia and Their Death Tolls in April 1975 to January 1979
Ethnic Group Census 1962 Census 1962 - I.ate 1960s - I.ate 1960s - Kiernan- Perished hy Percent
Percent Revised Percent A~ril 1975 Janua!l 1979 Perished
Vietnamese 218,000 3.8 400,000 5.7 20,000 20,000 100.0
Chinese 163,000 2.9 435,000 6.2 430,000 215,000 50.0
Cham non-significant na 150,000 2.1 250,000 90,000 36.0
Lao non-significant na non-significant na 10,000 4,000 40.0
Thai non-significant na non-significant na 20,000 8,000 40.0
Upland minorrties non-significant na 90,000 1.3 60,000 9,000 15.0
Total Minorities 381,000 6.7 1,075,000 15.4 790,000 346,000 43.8
Khmers 5,301,000 93.0 5,920,000 84.6 7,100,000 1,325,000 18.7
Total Cambodia 5,700,000 99.7 6,995,000 100.0 7,890,000 1,671,000 21.2
Noles:
1962 Cemus: Elhnicity reported ha.~ed on the nationality criterion; not molher/anguage
Lale 1960s: Chinese e.1·1ima1ed al 300,01111 fO 435,0110
Tola/ Camhodia 1962: as reported m the 1962 cen,\·us
Tola/ Cambodia /ale /960.1·: as projecled hy Migom.for I 968
Kie man: Three /asl columns are based on Kiernan ( /996, 2008)
Note that the source for Kiernan's figures in Table I 0 is his Table 4 (p. 458 in Kiernan, 2008).51
Vietnamese The number of Vietnamese in Cambodia was consistently reported to be 400,000 or more around 1970 by several authors; judging from their figures on out-migration of the Vietnamese (comp. Table 10; and Section 3.2 in this report). Of those 400,000, some 200,000 were expelled by Lon Nol in 1970 and another 150,000-200,000 left Cambodia after the Khmer Rouge took power in April 1975. Many
51 Table 4, p. 458 (Kiernan, 2008):
NEW PEOPLE urban Khmer 2,000,000 500,000 25 rural K hiner 600,000 150,000 25
Chinese (all urban) 430,000 215,000 50
Vietnamese (urban) 10,000 10,000 100
Lao (rural) 10,000 4,000 40
Total New People 3,050,000 879,000 29
BASE PEOPLE rural Khmer 4,500,000 675,000 15
[Khiner Kron]' 5,000 2,000 40
Cham (all rural) 250,000 90,000 36
V 1enamese (rural) 10,000 10,000 100
Thai (rural) 20,000 8,000 40
upland minorities 60,000 9,000 15
Total Base People 4,840,000 792,000 16
Total Cambodia 7,890,000 1,671.000 21
Note •not ind11ded in Camhodia Iola/
JO August 2009 48

00385311 E3/2413 fDtpll\t' CY (ICC /.I b : I >
Vietnamese were killed according to Kiernan by Lon Nol and Khmer Rouge forces, such that hardly any of them survived until January 1979. Kiernan's figures of20,000 Vietnamese still living in Cambodia around April 1975 are likely a good estimate; and so is his estimate that all 20,000 of them died from the hands of Khmer Rouge during the years from April 1975 to January 1979.
Also Banister and Johnson agree that most Vietnamese were expelled by Lon Nol forces in the early 1970s and the rest were killed or drove out from Cambodia during the Khmer Rouge regime (Banister and Johnson, 1993; p. 97). Sliwinski (I 995; Figure 17, p. 77) claims that the percentage of Khmer Rouge excess deaths among the Vietnamese in his survey was 37.5 percent; at the same time he explains that this is an underestimate as Vietnamese community was largely outside of his survey, and thus underrepresented.
Chinese CIA (1980) states that the Chinese community in Cambodia had 444,000 people in April 1975 and of those some 200,000 to 500,000 were repatriated to Vietnam. Later another 30,000 Chinese left to Vietnam as well. CIA report does not specify the number of Khmer Rouge excess deaths among the Chinese. Banister and Johnson (1993; p. 98) claim that many Chinese were killed by Khmer Rouge; they do not give any detailed figures either. Instead they support Kiernan's views that Chinese were "badly abused" under Khmer Rouge; they were targeted due to their urban entrepreneur background and suffered disproportionally more than other groups from the rigors of forced labor in the countryside due to the lack of any experience in agriculture. The Chinese language was banned exactly as the languages of all other ethnic groups; the cultural and ethnical identity of the Chinese community was meant to be destroyed as well. As Kiernan puts it: "the tragedy of the Cambodia's Chinese was not that they were singled out for special persecution by an anti-Chinese regime, but rather that a pro-Chinese regime subjected them to the same brutal treatment as the rest of the country's population" (Kiernan, 2008; p. 295). This treatment took a higher death toll among the Chinese than among other groups.
Sliwinski estimates that Chinese died unnatural deaths more frequently than the average of the entire Cambodia population (31.2% under HJ); they died at 38.4 percent. According to Kiernan (2008), the respective fraction was 50 percent (comp. Table 10).52
Chams Kiernan estimates the Cambodia's population of Chams in April 1975 was 249,450 and that in January 1979 was 174,900 (including I I, 700 Chams who fled abroad before January I 979). 53 The difference between these two, adjusting for the I% natural growth between April 1995 and January I 979 (260,000 in January 1979), is about 85,000 victims. On the top of these 85,000 deaths Kiernan adds another 5,000 of Chams who in his calculation were assumed to die naturally but in fact most likely died prematurely due to harsh DK policies. That gives an overall total of about 90,000 Cham excess deaths during the DK rule. These victims comprise about 36% of the entire 1975 Cham population; a percentage that is considerably higher than for other groups.
52 Kiernan takes the size of Chinese population in Cambodia in April 1975 from W. Wilmott ( 1967): The Chinese in Cambodia. Vancouver: University of British Colombia Publication Centre (p. 16). The death toll of 50% Chinese comes from the work of S. Heder ( 1983) who conducted a survey among 1,500 respondents on the Cambodian-Thai border in 1980 and 1981, and collected data on the fate of 15,000 individuals. 53 Comp. Kiernan, 2003: "The Demography of Genocide in Southeast Asia. The Death Tolls in Cambodia, 1975-79, and East Timor, 1975-80". Critical Asian Studies 35:4 (2003), p. 585-597.
JO August 2009 49

00385312 E3/2413 "'A~ti· 1~ '~A)~~ r.' 5 I 1
· '7 '~
Kiernan's views are fully supported by Banister and Johnson (1993; p. 99). Also Sliwinski's results confirm that the Chams' excess deaths amounted to 40.6 percent of their population in April 1975 (Sliwinski, 1995; Figure 17, p. 77).
Kiernan's reasoning is based on the historical development of the Cham population in Cambodia. In his opinion, the 1995 tally of Cambodian males which counted 29,786 Cham men age 21 or older in this year is the first reliable number to be used. Based on the tally, the overall number of Chams in Cambodia in 1995 can be calculated as 152, 126 persons. Using the annual growth rates of the entire Cambodia as estimated by Migozzi, Kiernan further obtains the 1970 Cham population to be 230,531 and the April 1975 Cham population as 249,450. He might be right if the 1955 tally was correct and indeed all Cham males were then counted.
Kiernan as well challenges both the lower and higher existing estimates of the Khmer Rouge death toll among the Chams, especially that of Vickery (1990) and that ofYsa (2003). In both cases, Kiernan proves the authors are wrong with respect to the initial population of Chams in Cambodia in April 1975; Vickery predicting too low a population and Ysa too high. Kiernan also proves they were wrong as well with regard to the January 1979 population; both authors anticipated too low a population in this case. 54
Kiernan's discussion of Ysa's figures is particularly interesting. Ysa claims there were 700,000 Chams in Cambodia in 1974 of which number only some 138,607 to 200,000 survived, resulting in a death toll of about 500,000 to 560,000 under Khmer Rouge. According to Kiernan Y sa' s views are unsubstantiated, however, for these views are "based entirely on retro!.pective claims advanced in 1999-2000 by interviewees asserting that in the early 1970s they had "seen statistics", or "heard announcements", or on the undocumented "memories of Cham leaders" . " (Kiernan, p. 589). The death toll of this size would indeed exceed the entire population of Chams in April 1975.
We might accept Kiernan's opinions as the most convincing. However, these views are uncertain too. As Banister and Johnson put it in their 1993 article, in order to learn about the size of the 1970 and 1975 Cham population in Cambodia and their losses, a census would be required.
Summing up, Kiernan's research into the Khmer Rouge death toll of ethnic groups seems to be well founded and best justified, although obviously is uncertain too due to lack ofreliable statistical sources on ethnic groups in Cambodia in the 1970s.
4. EXCESS DEATHS AND RELATED ISSUES DURING THE CIVIL WAR IN CAMBODIA, 1970-75: SUMMARY OF RESULTS
4.1 Basic Statistics on Excess Deaths 1970-75
Several authors of studies assessed in this reports discussed the issue of casualties during the civil war in Cambodia, July 1970 - April 1975.
The CIA research report of 1980 was one of the first ones to deal with this subject. They assumed about 600,000 to 700,000 war victims in addition to natural deaths from 1970 to April 75. (600,000 in the High and Medium scenarios and 700,000 in Low). They justified this decision as follows:
54 Ibid, p. 588-589.
10 August 2009 50

00385313 E3/2413 71)'·.@• t A
'' 8
'' 0
'1*5; 1 It
"The assumed number of war related deaths (600, 000 to 700, 000) is debatable; US government sources put the figure unofficially at 600, 000 to 700, 000; authorities of Democratic Kampuchea say 600,000 to 800,000; Prince Sihanouk is quoted as saying 600,000. None of these estimates is well founded. However, by accepting 600, 000 to 700, 000 additional deaths, the death rate is about double the UN-estimated 18-per-1000 rate. From the rural Bangladesh study, it is seen that death rates rose by 40% in the civilian population after a war of only a few months; therefore, a doubling of the rates for a war of five years duration does not seem unreasonable. " (CIA (1980), p. 8)
Kiljunen (ed.; I 984) too opted for 600,000 war victims (based on sources such as Democratic Kampuchea: 600,000-800,000; United States: 600,000-700,000; and Sihanuk: 600,000). Ea Meng-Try (I 987) suggested 700,000 excess deaths and Hood and Albin (I 987) an even wider range from 500,000 to 1,000,000. Unfortunately none of the above-mentioned authors performed any in-depth analysis of any concrete statistical source; they limited their discussion to reviewing opinions of others, mainly political agents involved in the I 970s internal and external affairs of Cambodia.
Banister and Johnson (I 993) analyzed the demographic situation in Cambodia in 1970s using a high number of available statistical and other existing sources on this subject (censuses, published and unpublished research results, press reports, personal communications etc.). Their assessment of warrelated deaths during the civil war is different and equals 275,000 victims. They concluded that:
" ... the usual estimates of 600, 000 to 800, 000 excess deaths in the early 1970s are greatly exaggerated. These figures seem to refer to the total population shortfall from all causes -excess mortality, fewer births, and net emigration" (Banister and Johnson (1993), p 90)
Banister and Johnson estimated the following components of the overall population loss55 during the Lon Nol regime:
275,000 excess deaths 70,000 fewer births 200,000 expelled to Vietnam I 20,000 fled to Vietnam 34,000 fled to Thailand Total loss: 700,000 persons
Another author expressing similar views is Sliwinski (1995). In his opinion, it is hard to estimate the exact number of the civil war victims due to lack of reliable sources. He is aware of the political estimates ranging from 600,000 to 700,000 deaths, (7.7% to 9.6% of the Cambodian population in 1970). He believes, however, that these numbers are overestimated; in some cases in order to hide the magnitude of victimization during the Khmer Rouge regime.56 Sliwinski used his questionnaire survey to estimate the birth and death rates during the civil war. Then, he decomposed them with respect to cause of death and time, in order to produce his own estimated number of war victims and show the basic distribution of this number. His starting point was the analysis of the population growth in
55 Population loss was defined as a difference between two populations: "start-1975 expected" minus "start-1975 actual", that equaled 8.0 mln-7.3 min= 700,000. (Banister and Johnson ( 1993), p. 87). 56 Kiljunen Kimmo, Decade of the Genocide, London, Zed Books, 1984, p.5
10 August 2009 51

00385314 E3/2413
Cambodia between 1960 and 1974 as shown in Tables 11 and 12; the rates for 1970-74 are calculated based on Sliwinski's own questionnaire survey.57
Table 11. Rates of Population Growth in Cambodia
Annees Taux d'accroissement t source
1960-65 2.9 empirique (75) 1965-68 2.8 I hypothetique [76) 1970-74 2.7 " " I
1970 1.47 } empirique [ 77) 1971 1.93 } n " 1972 1.14 } M = 1.16 " n
1973 0.19 } " " 1974 1.09 } " "
Sources: 1960-1965 - population census; 1965-1968 and 1970-1974 - Migozzi (1973); 1970, 1971, 1972, 1973, 1974 -Sliwinski 's survey
Table 12. Evolution ofBirth Rates in Cambodia, 1960-1974
-- --Jmn~es Taux des naissanc:es t Source
1960-65 4.68 tauic cmpirique • 1965-69 4.59 .. hypotti6tique • 1970-74 4.JO " ..
~
I 1970 3. l8 } .. c.mpirique • 1971 3.24 } .. .. 1972 2.88 } K "' 2.69 " .. 197:1 2. 411 ) .. .. l 9./4 2.65 ) .. "
Sources as in the above Table XX
Table 13. Decomposition of Death Rates before and during the Civil War, 1970-75 (mortalite de guerre - war mortality)
Mortalit6 naturalle Mortalitt infantile Hortalit6 de gucr~e
Total
The total death rate during the civil war was higher by 7.5% compared with the pre-war rate (1.86 versus 1.73 percent; Table 13). Based on this observation Sliwinski estimated that the war had increased the overall number of all deaths by about 50,000 individuals during the period 1970-1974.58
However, taking into account the more detailed death rates obtained from the survey data, i.e. the increased infant death rate (0.58% versus 0.46%) and the explicitly reported death rate for war victims
57 Tables 11 through 14 and Figure 9 are taken from Sliwinski ( 1995) where they are numbered Table 3 through 6 (p. 46-4 7) and Figure 6 (p. 43). 58 This result can be reproduced by applying the deaths rates of 1. 73 and 1.86 percent to the 1970 population of about 7,060 million, as assumed by the (unrevised) UN Population Prospects, and extrapolating this number over the five years 1970-74.
10 August 2009 52

00385315 E3/2413
?O ~· ~ ~ ff I JP IV JIG:::? tfc7..-_7 v_
(0.52%), Sliwinski estimated that altogether the civil war was a cause of death of about 0.64% of the population per year; i.e. of about 240,000 persons over the five-year civil war period.
It is worth noting, that at the outbreak of the civil war, there was a Vietnamese minority living in Cambodia, comprising of about 450,000 people in 1970. They did not participate in Sliwinski's questionnaire survey. In Sliwinski's opinion, this minority suffered most during the civil war as they were persecuted by Lon Nol government. According to Sliwinski, 310,000 of these people escaped to South Vietnam (forcibly and voluntarily). Assuming that a half of the rest were massacred (70,000) Sliwinski increased the estimate of civil war victims to 310 000 individuals.
Figure 9. Causes of Death of War Victims during the Civil War, 1970-1975. (Arme a fou =by fire weapon; Assassinat =murdered manually)
'1.9
Arme il feu Att$iit.RSirta1 Bombardurnent Accident
According to Figure 9, the largest group of war victims died because of combat activates ( 46.3%; about 111, 120 out of 240,000). The second largest group were people killed (31.7%; 76,080). Victims of American bombings were the third largest group (17 .1 %; in absolute terms about 41,040). Finally, the last group comprised victims of accidents ( 4.9%; 11, 760 persons).
Table 14.
Annl!e
1970 1971 1972 197.:l 1974
70-74
Mortality Rates and Causes of Death in Cambodia during the Civil War, 1970-75 (guerre - related to war; famine- starvation)
Taux Causes de mortalit~ \ de
mort. Naturelle lnfanti le Guerre Fnmine •rota1 t [78) (79]
1. 67 53.3 33.5 6.6 6.6 100 1.24 38.J 4 5 •• , 12.8 J.2 100 1.72 J7.J J0.2 20.9 ll.6 100 2.26 41.0 21.S 25.0 12.2 100 1. 52 34.S 30.2 26.9 8.4 100 --1.68 41.0 31.l 19.0 + 8. 'J 100
"' 27.'J
Table 14 shows the timing of deaths during the civil war (Vietnamese excluded also from this table). Death rates of war victims were the highest in 1972 through 1974 and of famine in 1972 and 1973.
Our final remark comes from the work of Heuveline (1998) who, in order to get sense of magnitude of the Cambodian civil war victimization, referred to estimates of war casualties in the 1965-74 war in Vietnam:
10 August 2009 53

00385316 E3/2413
{?P::;~4Q f fte:/j /±
"Reviewing available estimates of these war casualties, Hirschman et al. (1995) found them to be in the range of one to three million for the 1965- 7 4 period. Their own evaluation o.f these estimates leads them to opt for one of about one million. Barbieri et al. (1995, p. 635) select an estimate of 1.8 million deaths. Since the population of Vietnam was 31.6 million in 1960 compared with 5. 7 million for Cambodia in 1962 (i.e. about six times larger), and the war lasted twice as long in Vietnam, if the war in Cambodia had the same intensity as the one in Vietnam, it would have accounted for about 150,000 deaths in Cambodia in the period 1970-75. To be sure, the conflicts on each side of the border were not directly comparable, but the order of magnitude in Vietnam is more consistent with estimates of the order of a few hundred thousand than of half a million or more. " (Heuveline (1998), p. 59/9
Also Sharp (2008) discussed this issue in his review of four major estimates of Khmer Rouge victims. Using the war in Vietnam as an example, (and the ratio of civilian to military deaths from the war in Vietnam 1.45:1), he proposed 122,488 military and 177,512 civilian deaths for Cambodia 1970 - April 1975 as an example.60 He further worked backwards from the military casualties and processed them (together with wounded soldiers that he assumed were in the 1: 1 ratio with the dead soldiers) into the army sizes of both warring factions. According to some sources, 61 the Khmer Rouge troops were estimated in 1973 to be about 200,000 men and Lon Nol army was around 290,000 soldiers (total of 490,000 men). Together with the military casualties estimated to be about 240,000 (dead and wounded jointly; both armies), the overall size of all fighters, including the new recruits that replaced the killed and wounded, would be 730,000 men and nearly one out of every three of them would be a victim. Sharp calls this "an incredibly high rate in comparison with other conflicts" (p. 20). Noteworthy, according to Sharp military attaches estimated the size of each army to be much smaller than the sizes he used in his calculations; only as 100,000 and 150,000 men.62 Thus, his numbers of approximately 122,500 killed soldiers and related 177,500 civilian deaths are unlikely and seem to be (too) high. Generally however he considers the interval of 150,000 to 300,000 as possible and 250,000 as the most likely number of war victims of the civil war (i.e. killed only).
For the above reasons, we accept the lower estimates of Banister and Johnson (1993), Sliwinski (1995), Heuveline (1998) and Sharp (2008), being 150,000 to 310,000 victims, above the likely politically motivated high estimates ranging from 600,000 to 800,000 excess deaths. Note as well the high estimates might cover both the killed and the wounded persons which had not been acknowledged in public discussion (comp. estimates of war victims discussed in the next section). The lower estimates are justified scientifically and secondly they are consistent with war victim numbers for the war in Vietnam.
59 Hirschman, C., S. Preston, and M. L. Vu, 1995: Vietnamese Casualties during the American War: A New Estimate". Population and Development Review 21 (4): 783-812. Barbieri, M., J. Allman, B. S. Pham and M. T. Nguyen, 1995: La Situation Demographique du Viet Nam. Population 50 (3): 621-652. 60 Bruce Sharp (2008): Counting Hell. (p. 20-21) http://www.mekong.net/cambodia/deaths.htm 61 /bid, endnote 79: "Kiernan, in Peasants and Politics in Kampuchea 1942-1981 suggests that the Khmer Rouge may have numbered 200,000 by 1973. He cites as his source 1973 hearings in the House of Representatives. (p. 219) Clodfelter's Vietnam in Military Statistics indicates that the Lon Nol army expanded.from 40,000 to 100,000 in 1970. (p. 273) By late 1972, the on-paper strength of the Republic'sforces was 223,000, but as many as 100,000 may have been non-existent "phantom" soldiers, and of the remainder, only about 80,000 were truly combat-ready. (p. 274) Late 1974 figures indicated 200,000 in the army, 11,000 in the Navy, an Air Force of9,500, and another 150,000 paramilitary forces. Again, however, of these numbers, 80,000 or more were believed to be phantoms. (p. 277.) C/odfelter's.figures also suggest that the Khmer Rouge forces were smaller than Kiernan indicates; he puts their 1972 strength at 35,000 (p. 274), and indicates 60,000 .fighters in 175 battalions in 1975. (p. 277)." 62 ibid, endnote 81: "Sampson, letter to The Economist, March 26. 1977 ".
10 August 2009 54

00385317 E3/2413
• (\ I l I , ,c:>;,'f),, o .tJJ , tt"~J .! r ~
4.2 Displaced Population and the Size of Phnom Penh during the Civil War, 1970-75
"Accurate statistics on the movement of refugees63 in Cambodia during the civil war period are impossible to gather". This statement is often seen in any document about numbers of refugees in Cambodia in the period of March 1970 to April 1975. The uncertainty around these numbers was particularly strongly addressed in the materials related to the April 16 1973 Hearing, lead by Senator Edward M. Kennedy, before the Subcommittee to Investigate Problems with Refugees and Escapees of the Committee on the Judiciary of the Unites States Senate, Ninety-third Congress, First Session, April 16 1973 (hereafter: "Subcommittee").64 These materials comprise three testimonies: 65
Wells Klein (Subcommittee Study Mission to Cambodia - SSMC), Father Robert Charlebois (US Catholic Relief Services - CRS) and Robert H. Nooter (US Agency for International Development - USAID)
Attached with these testimonies are Appendixes, of which Appendix II contains two USA ID "Official reports on the Cambodia refugee crisis", one by Jeffrey Millington (February 10, 1972) and one by Donald Goodwin and D. Merril, (September 2, 1972).66
An early 1975 report on Cambodian refugees also exists and was requested by the same Subcommittee of the US Congress for the hearing at the Congress on 27 January 1975.67 This report summarizes the issues around refugees in Cambodia in the period relatively close to the fall of Lon Nol government in early 1975. Also this report stresses the uncertainty around the numbers of refugees in Cambodia in this period. 68
63 The term "refugee" is used here as defined in the GAO report of May 3, 1972 (GAO stands for the US Government Accountability Office; know as well under the name of the General Accounting Office): "Refugees and war victims" are all "those Cambodians who have fled their homes in Communist-controlled territory or who have been displaced or are war victims as a result of combat activity in that country". Comp. p.64 in: Donald Goodwin and D. Merril (USAID/Washington), 2 September 1972: U.S. Assistance to Refugees and Civilian War Victims in Cambodia. Report attached in Appendix II (II) to the April 16, 1973 testimony of Hon. Robert H. Nooter, Assistant Administrator for Supporting Assistance in the Agency for International Development, USA (USAID), before the Subcommittee to Investigate Problems with Refugees and Escapees of the Committee on the Judiciary of the Unites States Senate. Ninetythird Congress, First Session, April 16 1973. Available from the Internet: h!!J2://virtual.clemson.edu/caah/history/FacultyPages/EdMoise/congref.html 64 h!!J2://virtual.clemson.edu/caah/history/FacultyPages/EdMoise/congref.html 65 Wells Klein, member of the Subcommittee Study Mission to Cambodia (SSMC) and executive director, American Council for Nationalities Service (ACNS), New York. Father Robert Charlebois, regional director for Southeast Asia and the Pacific, Catholic Relief Services (CRS), New York. Hon. Robert H. Nooter, Assistant Administrator for Supporting Assistance in the Agency for International Development, USA (USAID). 66 Jeffrey Millington, (USAID Mission, Phnom Penh), February I 0, 1972: Refugees in the Khmer Republic. Donald Goodwin and D. Merril, (USAID/Washington), September 2, 1972: U.S. Assistance to Refugees and Civilian War Victims in Cambodia. 67 January 27, 1975: "Humanitarian problems in South Vietnam and Cambodia: Two Years after the Cease-Fire". A Study Mission Report prepared for the use of the Subcommittee to Investigate Problems with Refugees and Escapees of the Committee on the Judiciary of the Unites States Senate. Ninety-Fourth Congress, First Session, January 27, 1975. h_ttp ://virt]Jal .<;l@ .. ~.Qn&d u/ <;.~l:lhlh isto1yl.Ei:!£<!!HY.Pltges/EdMQl;>e/ congrs:1bLml 68 The Subcommittee Study Mission report of January 27 1975 assessed civilian war victims as well, being both wounded and killed persons (p. 35):
JO August 2009 55

00385318 E3/2413
Statistics presented in these reports/testimonies were obtained by USA ID officials at the request of the US Congress using all available sources that were limited to predominantly observations made during USAID missions to Cambodia in 1972-73, interviews with refugees in and outside camps, rough statistics provided by American personnel stationed in Cambodia (mainly US Embassy), even more approximate and incomplete statistics provided by the government of Khmer Republic, internal USAID sources etc. None of the reports/testimonies presented to the US Congress had a scientific foundation, a survey, or was based on reliable statistical counts of refugees, for such sources do not exist. Thus, that USAID reports from 1972, 1973 and 1975 are the best we have with regard to the population displacement in Cambodia during the Lon Nol reign, yet all this is far from perfect or reliable.
The above-mentioned reports are among the few available altogether, which provide some numbers at all. The numbers, highly questionable and approximate, were nevertheless presented in a political debate in the US Congress about the humanitarian crisis in Cambodia. As such these numbers must be suspect of political biases. In the absence of anything better, we have to discuss the statistics produced for the US Congress; obviously, we will do that with the necessary caution.
To begin with, it is useful to summarize a few basic observations about refugees in Cambodia at that time. These observations have a relatively good foundation as they come from interviews from the actual refugees. 69
A majority of refugees were farmers before the war; they used to plant rice. After two years of war, around late 1972-early 1973, most of them wanted to return to their pre-war places of residence; the fraction of those willing to return was lower among the refugees in Phnom Penh (60 to 65%) and higher among the refugees in other towns (80-90%). Reasons they gave for their displacement included:
to escape the intensifying war, fighting and bombings fleeing in advance of Vietnamese troops (South or North) to escape territories controlled by the communists, i.e. to escape communist oppression, indoctrination and incarceration in hope to secure food
The refugees originally moved from rural areas to the nearest district or provincial capital, where they were able to move in with relatives and at the same to stay close to their own land; they hoped after all for a speedy return. As the war continued, the security, food, health, and employment situation
Thus, the iwailnble statistiC'.s on civiiian war casualties are grossly incomple~, particularly prior to 1973. The only statistics the Khmer government has available are those on survivors who have applied for government assistance. On this basis, as of mid-1973, government rep-0rts indicate that at least 29,000 civilians had been wounded and 12,661 killed be_cayse of the fi~hting. I·Iow<;ver, US.AID reports that last year the l\fm1stry of Pubhc Health estimated that the number of civilian war casualties average,d at about the rate of 7,000 per month, or 84,000 dead and wounded over the year. Unofficial C>.stimat.t-s, however, place the toll close t.o 100,000, imd the cumulative number of civilian war casualties since the war began is \veil over 450,000-an inexact but probably more re.alistic fi~ure.
Striking is the discrepancy between the Khmer Republic registered ( 41,661) and USA ID "estimated" figures ( 450,000). The USAID statistics clearly support the high victimization rates and thus are as required for the lobbying to help the Cambodian society; at the same time the USAID rates remain completely unjustified. Note that in his April 16 1973 testimony in the US Congress, Klein gave the overall GKH number ofregistered war victims (killed and wounded) to be 41,750 since 1970. He as well referred to the unofficial estimates ofkilled and wounded to be "on the order of 300,000" on both sides. (p.10) 69 See Millington (1972)
JO August 2009 56

00385319 E3/2413
/:;A ct;,trAt' ::;;. 1 ~~ '1 4 'I / _
deteriorated, which was a push factor to many refugees to proceed their journey from provinces to the capital city of Phnom Penh. Already in December 1972, over half of refugees in Khmer Republic were in Phnom Penh. Most refugees in Khmer Republic lived with relatives, and thus not in camps. It was common for two to even five families to live in one house, in obviously extremely crowded environment and poor sanitary conditions. Besides the refugees who stayed with relative, another group built their own "houses" and lived in shanty-towns, surrounding at kilometers long the cities like Phnom Penh. The last group of refugees lived in camps, at the end of 1972 at estimated about 10,000 people lived in camps, mainly women, children and the elderly who were unable to support themselves. In late-1972-early 1973 many refugees still worked, mostly as day-laborers or cyclo-drivers, or another unskilled labor; after all they were famers and had little or no schooling or other training. Still the fathers and older sons were able to make their daily living which was just enough to cover the daily expenses of the family. It was not very common that women worked as much as men.
In the course of time, the war grew even more intense and more widespread; American bombings intensified as well until they ceased by mid-1973. The flow of refugees into Phnom Penh continued therefore "undisturbed" until the final breakdown of the Lon Nol regime in April 1975.
The latest available pre-April 1975 figures on refugees of the Lon Nol Khmer Republic are from around December 1974; these figures are summarized in the January 27 1975 report of the Subcommittee Study Mission to Cambodia as follows (p.31 ):
.l\.ccurate statistics on the movement of refugees in Cambodia are impossible to gather. The American r~mbassr conservati\>·ely reports that there are currently some L240,000 officially registered refugees in the less than 15 percent to 20 percent land area now eont,rolled by the Khmer Government. According to the Embass.}', the refugees represent well over 25 percent of the total population under go•·ermnent control.
Other estimates, including those of the Subcommittee Study :\fission, indicate that the cumulative total of refugees is considerably higher. Table 121 indicate$ the cumulative total of refugees in Cambodia since 1970.
TABLt: 12.-0umulative total of refugee11 in Cambodia (M of December 1!i74)
1. Officially registered refugees : PhnoDl Penh----------------------------------------------- 502,(}(7 Provinces ------------------------------------------------- 678, 413 l.aos, VietnaDl, Thailand----------------------------------- 58, 590
Subtotal------------------------------------------------ 1,239,050 2. EstlDlated nonregistered refugceR------------------------·------ r>OO, 000 3. Ethnic Vletnani!'lle forced to ftee to South Vietnam in 1970-71______ 250, 000 4. !\fil!tary dependentJ!l dlsplael'd ________________ .,__________________ 400, 000
Subtotal ----------------------------------------------2,389,050 6. E!:<Umated 35 percent of total population of Cambodia ls outside
government areas. half heing dlsplace<L----------------------- l, 000, 000
Total------------------------------------------------- 8.3Sll,050
The above statistics are generally consistent with the earlier ones of the same source, i.e. statistics given in the April 16 1973 testimony of Wells Klein, a member of the Subcommittee Study Mission to Cambodia (p. 4; see the next overview of statistics below). The main difference between the December 1974 and April 1973 statistics is in the number of registered refugees that more than doubled by end-1974. The early 1973 USAID figures were the following:
10 August 2009 57

00385320
1'able J. Refug~es/J)i~p~(!. Pmon8 in Cambodia Officially registered ·refugeeil ____ --- --- _______ ---- --- ________ --- • Eetl,n\atect nonr.e~ed. _. ________ ~- - -·- --·-- _____ ~ ____________ ~ 1l!~.1:PnJe V~E1tn$.Ul®G .iorneq .to flee t1> South Yiet,µa1,11 _________ ._ ____ ~ MWt~ dep.~ndente dls~ced •• ----~------ ---T~--------------·~
507, 500 .500,.000 250, 000 590,000
· T-0tal in gev~nment a.relll!--------------------------~---- l, 9\')7, 500 Tblttyrll.~.e p6.11ee.Q.t Qf tPJ;l\l,; wpu\atloti i1;1 l'>titalde 0.f GOVel'Jlmen.\ 1,1.r~~ . , .~d ,fl.n $S;tir,nQ.te~ ,AeJt pf ;tpe,s~ l;lp.v,e heen Alsplaced •• -•••• -•• - • • • 1, OPO, Q00
. . . . . -----· TotaL. ----------·- __ ----- --- __ ----- ---------· --- ----- -- 2, 957, 500
Obviously, the numbers produced for the US Senate are no more than guesses; calling these numbers educated guesses would be perhaps too much. The above-mentioned USAID 1973 statistics are in contrast with the (early) 1973 statistics produced by the government of Khmer Republic (GKR): 70
a. Phnom Penh, registered refugees: In the camps, 858 families, 3,702 people. Outside of the camps, 47,815 families, 286,060 people. b. In the ProvinceB, registered refugees: :Ka.ndal ____________________________________________ _
Cudong M. Chey. __ ---- _____ ----------------_-----_ VihearSuor ________________________________________ _
:Kompong Charn .. -----------------------------------Prey Veng·-----------------------------------------ta~p~l~~~===: :: : : :: : : : : : ::: :: ::: : :: : :: :: : : : : : : :: : : Takeo.--------------------------------------------Prey :Ka.bass.---------------------------------------.. Tram :Khnor __ -------- ____________ ---------- ___ • ___ _
~~~:O~~gsi>~~::::: ::: : : : :: :::: :: : : :::·:: :: :: : : : : : : : : :KompongSorn _____________________________________ _ Battarnbang _______________________________________ _
Pursat---------------------------------------------Kornpong Chh11ang __________________ -- - _ -- _____ . ___ -:Kompong Tralach _________________ .... _____________ _ Sangkum M. Chey ________ -- ____ ---- --- • -- __________ _ Sie111reaP-------------------------------------------Kompong Thom ______ . ___ . _________ --- .... _________ .
Prcah Vihcar ... -------------·-----------------------Odnr M. Chey_._ - -- ____ -- ..• -- . - __ --- -- -- __ -- . _ -- --
~'otal in the Provinces-44,252 families; 205,671 people.
Families 2,544 5, 172
49.7 5, 557 1,041 5, 532
786 4, 475
448 l, 427
230 2, 821 1, 189 3, 605 1, 635
901 65
163 3, 101 2, 904
6 153
People 15, 706 17, 939
2, 307 29, 373
5, 715 24, 186 4,710
18, 610 2, 322 6, 751 1, 39,5
13, 532 6, 706
16,972 8, 308 5, 287
284 822
14, 088 9,801
36 821
c. There are also an estimated 200,000 refugees who have not yet registered.
70 Jeffrey Millington, (USAID Mission, Phnom Penh), February I 0, 1972: Refugees in the Khmer Republic (p. 58).
JO August 2009 58

00385321 E3/2413
fiAs'''kJ'n 5) ! et C5/1 /L
The early 1973 GKR total of both registered and unregistered refugees is 695,433 persons versus the total of 2,957,500 in the USA ID estimates for the same period. (GKR is about 24% of the US AID estimate). On the other hand at the end of 1974, the USAID was convinced there were about 3.4 million refugees in Cambodia (including the Cambodians that fled to South Vietnam) as opposed to the (estimatedO tiny 800,000 refugees possibly reported by the GKR. (800,000 is our guess obtained as 24% of the USAID number for December 1974).
The government of Khmer Republic did rush to register and monitor their refugees; they did openly admit for the first time that they had a refugee problem in Cambodia only on August 10, 1972, when they submitted a formal appeal to the US and other governments for assistance to refugees and war victims. 71 Refugee statistics as of August 20, 1972 show 699,875 refugees (registered and unregistered; see below); a number not very different from the early 1973 total (695,433) and not from the estimated 800,000 we guessed for December 1974. Despite that several government agencies were tasked by the government of Khmer Republic with programs meant to provide assistance to refugees and their families (i.e. Directorate for War Victims, Ministry of Labor and Social Action, Ministry of Community Development, Ministry of Health, Ministry of Public Works), even the simple task of registering the refugees could not be accurately completed.
li'igure 1; Number8 of Refugees 1
(Source: Directorate.of Refugees and War Victims.)
· 1. In camps in Phnom Penh------------·-----·------------------- t 2, 137 .2. Registered, out of camps, in Phnom Penh----------------------- 269,.642 3. Refugees, registered, in provill'Ces ______________________________ 228, 09.6
Total re~stered ____________ ~ _ -- _______ - --- -- ---- - - -~ - - - 499, 875 F,,stimate of unregistered refugees in Phnom Penh---------~----.·---- 8 200, 000
Estimate of refugees in Camb.od!a as of August 20, 1972-~------ ----- 699, 875 1 For detail, seo appendix. · - ·
. • Most'regtstered refugees are believed to be living with relatives and friends rather than being.squatters. •Most of the squatters are believed to be ln\)!Uded In this llflure,
Obviously these statistics are llot fully adequate.· We recommend that. high !)l'forlty be 'given to filling the vacant posltl9n of demography· an<!. statistics .expert on the UNDP staff, as :part of the program reconunended. In this report. If the position cannot bt filled soon, short-term assistance for the UNI)P 11hnnlcl he obtained either from UNDP or AID staft., · , ·
Summing up, there are many uncertainties around the refugee statistics during the civil war period in Cambodia. These uncertainties prevent us from drawing any conclusions or recommendations. What we hoped for was that refugee statistics would shed some light on the size of the population of Phnom Penh. This issue was not really explicitly discussed in the US Congress, except for one time: 72
wit;~;I~beiits-th'is--deftnition, it is possible to use the approach of the April UNDP Report to gain an estimate of refugees in Phnom Penh. The population of Phnom· Penh was about 800,000 before the war .. The 250,000 Vietnamese nationals left during 1970. The population as of April 1972 is estimated con· 'servatively at 1.1 mlllion to 1.2 million, although other estimates have ranged as high as 1.() to 2.o·mmion. Therefore, not allowing for normal urbanization,
1 but accepting a _1.1 to 1.2 million population,. a .J:Qnserv~.~.ve esthnate would be :that 550,000 to 6506000 people had come to Pliii~m i't!t!'lr ecause of the war.1>.Y itmtt of 1912. - · _ _ ..
71 April 16, 1973 testimony of Robert Nooter, p.32; and Donald Goodwin and D. Merril, (USAID/Washington), September 2, 1972: U.S. Assistance to Refugees and Civilian War Victims in Cambodia, p. 63.
72Donald Goodwin and D. Merril, (USAID/Washington), September 2, 1972: U.S. Assistance to Refugees and Civilian War Victims in Cambodia (p. 64).
JO August 2009 59

00385322 E3/2413
fr~"" J f Ff:~'±~ . «s ;r . I I-
After April 1972, the movement of the rural pupation towards Phnom Penh continued and perhaps even accelerated. It is possible that the size of Phnom Penh increased even up to 3 millions. No scientific prove can be presented for this possibility other than some voices of experienced researchers investigating the tragic decade of the 1970s and the population of Phnom Penh in April 1975 as part of it:
Ea Meng-Try (1981): 3 min Kiljunen (ed.; 1984): 3 min Banister and Johnson (1993): 1.5 to 2.6 min Sliwinski (1995): 2.5 to 3 min Kiernan (1996): 1.8 min (in February 1975)
Banister and Johnson ( 1993; p.107) discussed the size of Phnom Penh in a broader context of urbanization of Cambodia since the 1962 census. Around 1967 the urban population of Cambodia was about 880,000 (13% of the overall population), compared to 590,000 (10%) in 1962. The warfare and bombings caused a large movement of Cambodia rural population towards the cities, and in particular Phnom Penh. In the first half of the 1970s:
" ... an additional two million urban in-migrants were added to the one million former urban residents, totaling three million or over forty percent of Cambodia population of April 1975. Phnom Penh population alone reportedly reached 1.5-2.6 million by then". (Banister and Johnson (1993), p. 107/3
All in all, the April 1975 Phnom Penh population was likely somewhere between I .5 and 2.6 million, and possibly even up to 3 millions.
5. FINAL ASSESSMENT OF MAJOR ESTIMATES ON EXCESS DEATHS AND POPULATION IN THE 1970S
The main purpose of this report is to give clear guidelines with regard to the most reliable estimates of excess deaths under the Khmer Rouge regime from April 1975 to January 1979. The studies reviewed in this report were not limited to those recently made. We have reviewed here all the most significant estimates available in the literature since January 1979, i.e. since the fall of Khmer Rouge regime.
The intervals we identified so far for the population sizes and the death toll give relatively broad ranges of values. In this section we narrow them down. Moreover, until now we have studied the population size and victim estimates separately. In this section we integrate them and study them jointly. We also give some additional justification in relation to why certain estimates are plausible and certain other must be rejected as implausible. We concentrate on victims of Khmer Rouge as we believe we have discussed the victims of civil war thoroughly and there is little that could be added to the previous discussion.
In this section we frequently make reference to another independent review of estimates of Khmer Rouge excess deaths available from a recent article by Sharp (2008). Sharp only assessed five sources of the estimates of Khmer Rouge victims; Vickery (1984), Kiernan (1996), Heuveline (1998), Etcheson (2000), and Renakse (1983). These sources he believes are representative of the existing opinions on
73 The following were the references used for the population of Phnom Penh: Phnom Penh Domestic Service, 1990: "Project to Expand Phnom Penh Housing Reported." (In Cambodian). Foreign Broadcast Information Service Daily Report, No. FBIS-EAS-90-158, Aug 15, 1990: 50-51; Ponchaud, 1977: 40; UNICEF, 1990: 9-11.
JO August 2009 60

00385323 E3/2413 ~IL.I> LA '~ rr YO/Iv : W ' t:i&ji I !_
the subject. Our review is broader than that; we included all major estimates produced since the fall of Khmer Rouge (i.e. 12 sources, of which five overlap between our and Sharp's reviews). By referring to his work, we cross-reference ours and his findings in an attempt to obtain the most up-to-date and reliable victim statistics.
5.1 Death Toll, Civil War 1970 to April 1975
Sharp (2008) made several useful observations with regard to the scale of victimization of the Khmer Rouge regime as compared with that of the civil war. He noted that:
Substantial anecdotal evidence suggests the civil war death toll is lower than what is commonly believed (i.e. than 500,000-600,000 deaths). In particular, in the many memoirs written by Cambodians in the aftermath of the Khmer Rouge regime it is hard to find firsthand accounts of civil war deaths, as opposed to countless examples of excess deaths during the Pol Pot reign.74
Authors of these memoirs are most certainly a selected group; they are well-educated urban elite ("new people"), so one may claim their stories are not representative of the situation in the entire country. However, in addition to their stories, similar evidence also exists from sample surveys that confirms that the scale of victimization in the first and second half of the 1970s were incomparable; the victimization during the Khmer Rouge period being several times higher than that during the civil war. 75
A significant bulk of this additional evidence comprises sample surveys, such as those of Ebihara (1993), Heder (1981) and Sliwinski (1995). All these surveys confim1 that mortality rates were several times higher during Khmer Rouge regime than during the civil war. Based on these surveys Sharp claims (after Heder) the death toll of Khmer Rouge might be roughly seven times higher than that of civil war. 76
Further, some deaths are not immediately recognized by respondents as war-related, especially the indirect war deaths; so these deaths are likely underreported. Some deaths could have been clustered (such as deaths from bombing or during Khmer Rouge purges in the East and South zones). Whole families were then killed and no one left to report these deaths during post-war surveys and other interviews with survivors. The residents of the areas close to the border with Vietnam suffered most during both historical episodes; in these areas the clustering was likely. This affected estimates of victims in both periods, and therefore should not bias the comparison of scale in each period. Finally, according to Sharp, the 1970s press failed to report victims of bombings. Looking for reasons of this fact, Sharp mentioned that the front lines during the civil war in Cambodia were more predictable than in Vietnam which made it possible for the population to evacuate before the battles took place.77
The latter observation is confirmed by the extraordinary scale of internal migration from villages to towns and cities during the Lon Nol period which too suggests that people tried to escape affected territories and find safety.
The above reasoning is convincing and supports our findings on civil war victims discussed in Section 4. With regard to the victims of the civil war in 1970-1975, we accepted the lower estimates of Banister and Johnson (I 993), Sliwinski (1995), Heuveline (1998) and Sharp (2008), 150,000 to 310,000
74 Bruce Sharp (2008), p. 18 and endnotes 64 through 69. 75 Ibid, p. 18 76 Ibid, p. 18-19 77 Ibid, p. 20
I 0 August 2009 61
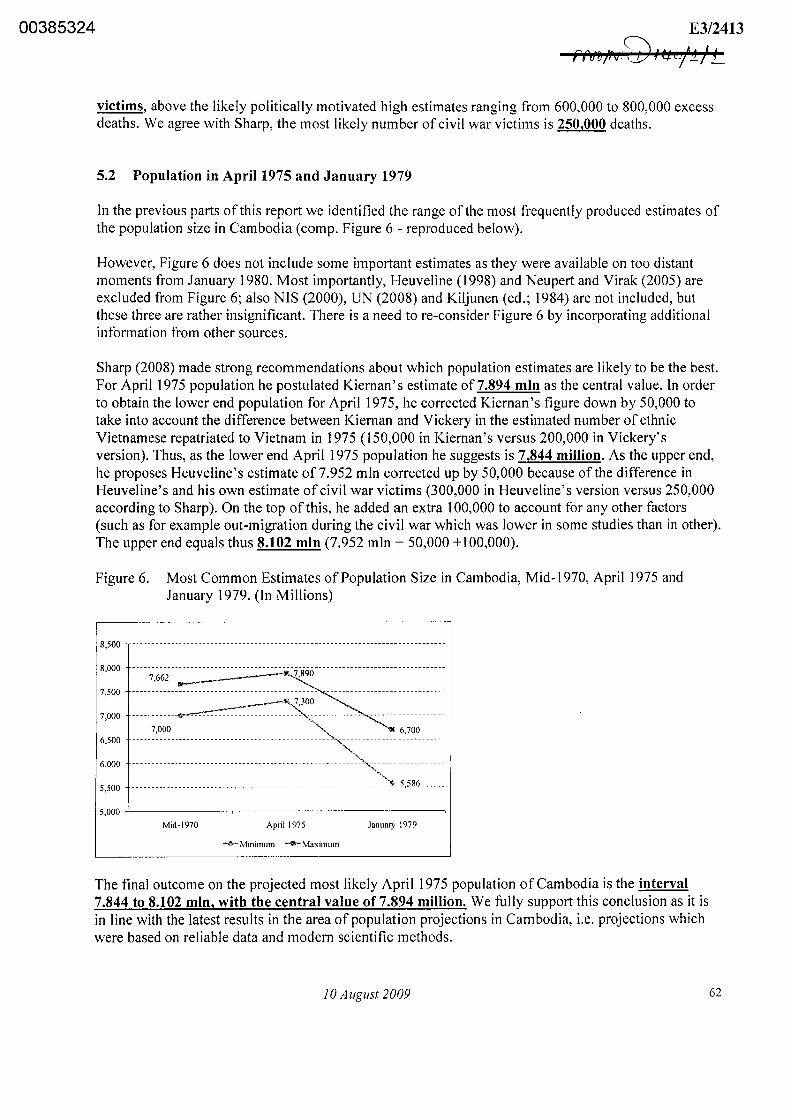
00385324 E3/2413
?°'' Q·~ 4~ ,, J 6 V~f V- 1 Lj .2/ 2_
victims, above the likely politically motivated high estimates ranging from 600,000 to 800,000 excess deaths. We agree with Sharp, the most likely number of civil war victims is 250,000 deaths.
5.2 Population in April 1975 and January 1979
In the previous parts of this report we identified the range of the most frequently produced estimates of the population size in Cambodia (comp. Figure 6 - reproduced below).
However, Figure 6 does not include some important estimates as they were available on too distant moments from January 1980. Most importantly, Heuveline (1998) and Neupert and Virak (2005) are excluded from Figure 6; also NIS (2000), UN (2008) and Kiljunen (ed.; 1984) are not included, but these three are rather insignificant. There is a need to re-consider Figure 6 by incorporating additional information from other sources.
Sharp (2008) made strong recommendations about which population estimates are likely to be the best. For April 1975 population he postulated Kiernan's estimate of7.894 min as the central value. In order to obtain the lower end population for April 1975, he corrected Kiernan 's figure down by 50,000 to take into account the difference between Kiernan and Vickery in the estimated number of ethnic Vietnamese repatriated to Vietnam in 1975 (150,000 in Kiernan's versus 200,000 in Vickery's version). Thus, as the lower end April 1975 population he suggests is 7,844 million. As the upper end, he proposes Heuveline's estimate of 7.952 min corrected up by 50,000 because of the difference in Heuveline's and his own estimate of civil war victims (300,000 in Heuveline's version versus 250,000 according to Sharp). On the top of this, he added an extra 100,000 to account for any other factors (such as for example out-migration during the civil war which was lower in some studies than in other). The upper end equals thus 8.102 min (7.952 min+ 50,000+100,000).
Figure 6. Most Common Estimates of Population Size in Cambodia, Mid-1970, April I 975 and January 1979. (In Millions)
8,500
8,000 7,662
7,500
7,000
.... ~.300 ----·-------~-~--------------~--------------------------------
7,000 "" 6 700 -------------------------------------------------~----------------·----------
~' : __ : __ : ___ :_:::::::::::::::-::--::-:::-:-:_::: ___ :_: ____ :_:s~:-5~:~~-:::::
6,500
6,000
5,500
5,000 +-------~-------,-----------.
Mid-1970 April 1975 January 1979
...,._Minimum -a-Maximum
The final outcome on the projected most likely April 1975 population of Cambodia is the interval 7.844 to 8.102 min, with the central value of 7.894 million. We fully support this conclusion as it is in line with the latest results in the area of population projections in Cambodia, i.e. projections which were based on reliable data and modern scientific methods.
JO August 2009 62

00385325
For the January 1979 (or end-1978) fsopulation, Sharp took as the upper end the figure produced by Banister and Johnson, i.e. 6.36 min, 8 slightly corrected up by 58,000 (out-migration to Thailand, Laos and remaining to Vietnam) to account for differences in out-migration estimates between Banister and Johnson and other authors. The upper end became 6.418 min (6.36 min+ 58,000). As we remember, Banister and Johnson ~roduced their figure of 6.36 min from the end-1980 administrative count of the Cambodia population. 9 For the lower end population of December 1978 Sharp assumed 6 million. The central value was decided to be 6.209 min (Sharp claims this value is close to 6.219 min, i.e. Kiernan's most likely figure for January 1979 population). No particular justification was given other than that these values fit the general picture of the population change.
All in all, according to Sharp the population of Cambodia estimated at the end of Khmer Rouge regime is contained in the interval of 6 to 6.418 min, with the central value of 6.209 million.
Compared with the estimates of the Cambodia population identified in Figure 6, which as we remember are those most commonly produced by the authors, the above intervals are:
considerably narrower for April 1975 population, concentrated around the maximum variant in Figure 6, i.e. 7.894 min which is Kiernan's most likely estimate for January 1979, concentrated around 6,209 min (again a value close to Kiernan's most likely estimate of 6.219 min), which is located somewhere between the minimum and maximum variants from Figure 6.
The above-mentioned two sizes (7.894 min and 6.209 min) should be kept in mind as the most likely estimates of the population of Cambodia on these two moments oftime. Most authors whose estimated population is reviewed in this report and shown in Table 7 of this report do not fall within the range around 7.894 min, full interval being 7.844 to 8.102 min, estimated as most likely for April 1975. As a matter of fact, only a few authors such as Kiernan (1996), Heuveline (1998), and Neupert and Virak (2005) fall within this range. For the two latter men, this conclusion is implied from the population estimates they produced for 1970 and 1980.
78 Banister and Johnson ( 1993) worked with the end-1980 administrative count of Cambodia population that was 6.89 million (comp. p.84). The count comprised only the population living in Cambodia, and it excluded the refugees. Based on the 1980 count, Banister and Johnson estimated the mid-1980 population in Cambodia to be 6.5 million (p. 85) and end-1978 population to be 6.36 million (p. 90). As we said, out-migration was excluded. In order to make this figure comparable with estimates by Kiernan, some 58,000 refugees to Thailand, Laos and remaining to Vietnam had to be included according to Sharp; the main component ofout-migration was the same in Kiernan's and Banister and Johnson's studies (150,000 to Vietnam). According to Table 8 from this report, instead of58,000, about 68,000 migrants should be added. We leave Sharp's number (58,000) unchanged, however, as the difference is insignificant. Ea Meng-Try (1987) suggested this component was about 50,000 (comp. Table 8). 79 Sharp justifies his choice by the following reasoning (comp. P. 21 ): "As difficult as it is to determine the 1975 population, it is even more difficult to accurately estimate the 1979 population. Bannister and Johnson cite an administrative count, compiled by the PRK in 1980, and estimate the population at that point to have been 6,589,954.(83) However, they note Ea Meng-Try's contention that "local and provincial officials had financial reasons to exaggerate the numbers of people in their jurisdictions." (84) Kiernan suggests that the population in January 1979 was somewhere between 6 and 6. 7 million, and his own calculations of the death rates ll'ould suggest a figure of 6. 219 million. Other sources, however, suggest that the number of survivors may have been lower. A 1990 UNlCEF publication, charting population trends in Cambodia, cites statistics from the P RK's Ministries of Health and Agriculture indicating a 1981 population, inside Cambodia, of 6, 684, 000. (85) The UNICEF analysis also cites an estimate of 6. 7 million for 1980; (86) as this is higher than the 1981 figure, it seems likely that this included some 300, 000 refugees along the Thai border. (87) These figures are probably derived from the same swwy cited by Bannister and Johnson. and Vicke1y. "
10 August 2009 63

00385326 E3/2413
PA Cf1jtos_ QI tft '/~ /1_
Note as well that Sliwinski is included in our discussion of population figures using his results from Table I in his book, which merely served as a context for his survey. He did not use these figures in producing his estimates of the overall total of excess deaths under Khmer Rouge. For this, in addition to his direct survey results, he used two hypotheses HI with 7.768 min population in April 1975 and H2 with 7.3 min population in April 1975. The HI seems to have practically passed the challenges of this review; in H l the Phnom Penh population was estimated to be 2.5 min in April 1975 (3 min in H2).
Further, the above mentioned most likely figures on the population of Cambodia in April 1975 did not also exclude Etcheson 's estimate of excess deaths under Khmer Rouge regime. Etcheson did not work with any population figures but used DC-Cam exhumation records as his source. Finally, also Renakse outcomes remain unaffected by our findings regarding the most likely population figures in April 1975.
Regarding the January 1979 population, the estimates of the authors identified so far as valid from the viewpoint of April 1975 population, also fall within the interval of 6 to 6.418 million of the most likely size at that time. Note again that Sliwinski, Etcheson and Renakse remain unaffected by any interval, for Heuveline and Neupert and Virak their implied figures are used, and Kieman's figure is obviously contained within the interval. 80
5.3 Death Toll, April 1975 to January 1979
In this report we have shown that the prevailing contemporary views indicate estimated excess deaths of Khmer Rouge regime in Cambodia to be between 1.4 to 2.2 millions. All estimates from this range (Sliwinski (1995), Kiernan (1996), Heuveline (1998), Heuveline and Poch (2007), Neupert and Virak (2005), Etcheson (2005)), belong to the most advanced methodologically. Sample survey extrapolations, deaths as a residual between two projections and mass grave statistics are all covered in this interval.
Sharp (2008) used his best population figures to produce yet another estimate of death toll under Khmer Rouge, 2.18 million with lower and upper ends being 1.747 to 2.495. 81 This estimate pushes
80 According to Sharp (2008), who based his statement on personal communication with Heuveline, the surviving population at the fall of Khmer Rouge regime was just under 6 million (p. 26). 81 Sharp (2008) obtained his estimate by using the general population loss equation. In this approach the expected January 1979 population is central which he obtained by applying the expected natural growth rate during the Khmer Rouge years to his April 1975 population. Excess deaths were thus excluded from the expected population. He obtained excess deaths by subtracting the actual January 1979 population from the expected population in the same period. Detail of the estimation of his expected population were the following (comp. p. 25):
- "Assuming a normal growth rate of 3%, and a normal crude death rate of 19 per thousand, the normal crude birth rate would have been approximately 49 per thousand. Heuveline and Poch estimated a 34% decrease in total fertility; and over a relatively short period of time, a decrease in fertility would have been accompanied by an approximately equal decline in the crude birth rate. (101) This would mean that the crude birth rate would have been around 32 births per thousand, which in turn would mean that the annual growth rate (crude births per thousand, minus crude deaths per thousand) would have been around 1. 3%. A starting population of 8. 002 million, compounded by an annual growth rate of 1.3%, would have meant an expected population of roughly 8.39 million in 1979. (102) l ivould regard this as the "most likely" figure for the expected population. Given the imprecision of the data, it is probably more reasonable to specifj; a plausible range, rather than a single figure. The high end of the range, assuming these same growth rates, but with a starting population of 8.102 million, ll'Ould yield an expected 1979 population of 8.495 million. The low end of the plausible range, meanwhile, would be fairly close to Kiernan's estimate of an expected 1979 population of 8.215 million. On the assumption that Vickery's higher estimate of the numbers exiled to Vietnam might be correct, ll'e could lower this figure by about 50, 000, yielding an expected population of 8.165 million for 1979. " (bold by ET).
10 August 2009 64

00385327 E3/2413
PM7) v.@ 'ttc=/!f,
towards higher values of the death toll. It is based on consistent population figures for 1975 and 1979. It does help to narrow down the interval we identified 1.4 to 2.2 millions. Notably, only one estimate from our interval is outside Sharp's range, i.e. 1.4 min by Neupert and Virak (2005). This confirms that 1.4 min is too low to fit the lasted views of death toll and must be skipped. Also the upper end by Sharp has little justification. Therefore the new interval could be 1.747 to 2.2 million deaths. Within this group Sliwinski (1995), Kiernan (1996), Heuveline (1998), Heuveline and Poch (2007), and Etcheson (2005) produced their major estimates (Table 15). To be, however, on the safe ground, we believe that it is rather Kiernan' s initial estimate of 1.6 min excess deaths that should be taken as the lower end for the final range of death toll under Khmer Rouge, which becomes: 1.6 to 2.2 million. The 1.6 min is the result of assuming most conservatively that the overall death toll reflects about 21 % of the lowest most likely population projected for April 1975 (7.844 min).
Table 15. Estimated Excess deaths and Projected April 1975 Population82
·Category PopApr1975 Death Toll Average Direct
Reported Direct Excess Excess
CIA 1980 7.384 0.976 75,000 50,000 to I 00,000 EA MENG-TRY 1981 7.460 1.000 120,000 120,000
RENAKSE 1983 7.098 3.314 569,000* Min 569,000*
VICKERY 1984 7.100 0.740 300,000 300,000
KILJUNEN (ED) 1984 7.300 1.000 112,500 75,000 to 150,000
BANISTER & JOHNSON 7.300 1.050 235,000 I 0% men 3% women young- to mid-age SLIWINSKI 1995 7.566 1.879 986,000 Min 39 .3 to 52.5% ofall deaths
KIERNAN, 1996, 2003 7.890 1.763 881,500 NA: estimated as 50% of the death toll
HEUVELINE 1998 7.952 2.200 1,100,000 I.I min
NEUPERT AND VIRAK 7.890 1.400 700,000 NA: estimated as 50% of the death toll
ETCHESON 2005 7.952 2.200 1,100,000 I. I min HEUVELINE AND POCH 7.952 1.750 875,000 50% (0.75-1 min)
Notes: * Renakse reported about 569.000 deaths in the forest and bodies in pits; this was assuemd here as their minimum of drect excess deaths Notes: The April 1975 population is approximated in this table and thefollowingfiguresfor: Renakse (as in UN (2008)), Etcheson (as in Heuveline (1998)), Neupert and Virak (as in Kiernan (1996)). For Heuveline and Heuveline and Poch, we used the April 1975 estimate given by Sharp (2008). All these approximations were made as to resemble the most likely figures.
In Table 15 we show the projected population size in Cambodia for April 1975 together with estimated death toll by various authors. Similar tables can be made with the population size in mid-1970 and January 1979. Table 15 makes the reading of the three following figures easier. Figures I 0 through 12 show the death toll in the Khmer Rouge period estimated by various authors plotted against the projected population in 1970, 197 5 and 1979 (or around) by the same authors. The figures integrate the information about the estimates of the population size in three years (mid-1970, April 1975 and January 1979) with the estimates of excess deaths by various authors. The data labels are the death toll estimates by various authors as listed in the above Table 15.
All three figures consistently indicate that large differences exist between the authors in projecting the population figures under which they further obtained their estimated death toll. Some authors fall within the range of population values that we identified as the most likely. Their estimates of death toll are encircled. The un-encircled estimates are those that do not satisfy the most likely population estimates criterion or must be rejected for other reasons, including the methodology on the first palace.
82Table 15 is based on Table 9 from this report. In both tables some values are approximations of the originally reported estimates of excess deaths.
10 August 2009 65

00385328 E3/2413 f>A~·~ J~ ''..J t ; ;~rt f~ ; 1__
The first figure (Figure I 0) summarizes that with the increase in the projected mid-1970 population size, also higher death toll estimates were produced. The Renakse estimate (3.314 min in the upper left corner) is an outlier and is excluded from acceptable estimates. The estimates located in the lower left corner represent the early 1980s estimates and the Banister and Johnson (1993) estimate of 1,050 min excess deaths. The group of encircled estimates to the right are those we recommend as the most reliable and well justified. Kiernan, Sliwinski, Heuveline, Heuveline and Poch, Neupert and Virak, and Etcheson belong to this group. The same group is as well encircled in the following Figures 11 and 12.
Figure I 0. Estimates of Excess Deaths in the Khmer Rouge period Plotted against Projected Population Size in Mid-1970
.,, c :JI " 0
E. 0 .... J:: 1;i .. Q
3,500 • 3,314
3,000 - - - - - - - -- - - - - - - - --- --- - -- - - - -- - - - -- - - - - - - - - - - - - - - - - - - - - -- -- - - - - - -- --
----- ---------- --------- -------- --------_:,,:;.-"'''~-==·:":':~-~~·~·:-~·:··~·::.-:;:-~_,,, ___ ~- ---
!/' 2,200 :.\ -- ---- - --- ------- -- - - -- --- - --- -- - ___ .f __ - ------ - ---- -- ---- - - - ----- - -\
; : 1,879 l
', 1,763 1,750 •
2,500
2,000
- - - - ----- -------------- ---- - -- - - - - -- -\::- -------- - - -- - - - - ------ -- --/-,, • 1,400 /
- - - - - - -•- _1:~:--+_1,~o~ - - - - - - - - - - -+- -----_'"::: _>_-,,, '' c:::<:< _ ---1,500
1,000
0,740 • 0,976 1,000
0,500
0,000 +-----,-----,--...,.----,---,-------,---~-~
6,900 7,000 7,100 7,200 7,300 7,400 7,500 7,600 7,700
Mld-1970 Population
Figure 11. Estimates of Excess Deaths in the Khmer Rouge period Plotted against Projected Population Size in April 1975
3,500 • 3,314
3,000
, -- ~-~- -~
2,500 ------------------------------------;:7ift·<: ______________ :::,,~~~·(t,
2,000 - -- - --- - - - - - - - -- - - - -- - - -- - - - - - - - - - -- - - - -- -- - - - - -- -- -- - - - - - - - - - - -- -- \ i • 1,879 \ 1,763. • 1,750 j
-------------------------------- ---~---- -------- ---------------- --'""·· • 1,400'
1,050 1,000 '·· •. ----- --------- --- --t-- ---.- ---+- ------- -- -- -- :·:-~·: :-,-,,-,.,-,-::~:-~ ---- --
1,500
1,000 • 0,740 1,000 0,976
0,500
0,000 +-------,-----,..----~---,--------,
7,000 7,200 7,400 7,600 7,800 8,000
April 1975 Population
The two first figures (for 1970 and 1975) present a similar consistent pattern. The third figure (the January 1979 population plotted against death toll estimates) is different. It indicates that much disagreement existed among the authors with regard to the projected January 1979 population and related death toll figures. The main bulk of projections (concentrated around 6.3 min population in
10 August 2009 66

00385329 E3/2413 "'"~ •• l Q 1 'I@ t9 t~ pr J I (O ~ I ) - / :__
January 1979), confirm that the projected population of 6.3 min is associated with higher estimates of death toll (1.750 to 2.2 min; comp. the green circle) and higher projected population is associated with death toll estimates of around I million. Some exceptions from this rule include for example the Banister and Johnson estimate of 1,050 min death toll and 6.36 min population in end-1978.
Two small circles, one to the left and one to the right, are associated with Sliwinski's and Neupert and Virak's estimates. As we already explained Sliwinski did not obtain his death toll estimate from the 1979 population estimate included in Table 15 and Figure 12. The April 1976 population he used was 7.768 million (HI hypothesis); Sliwinski's end-1978 population associated with the (HI) 7.768 min April 1975 population is not exactly known; we might guess it was likely higher than 5.586 min taken for Figure 12. Thus, the left red circle can be neglected. The right red circle confirms a particularly high estimate of the mid-1980 population produced by Neu pert and Virak (2005), the estimate that was one of the reasons their estimated death toll is too low to be accepted as the one of the most likely ones.
Figure 12. Estimates of Excess Deaths in the Khmer Rouge Period Plotted against Projected Population Size in January 1979 (or around)
3,500
3,000
2,500
'ii 2,000 ... .r: 1il .!: 1,500
1,000
0,500
• 3,314
_..,,.••"""'"""""""""""•~ .. ~.
/. 2,200. / \"
-e:s-----------\----1~~~~-~--~--I:;;~-)----------------·
--------------------------'·c.;_-.:-_~_:=:_:~.:.:.;.7·'-----~-----
1,050 10~ -------------+--------------------•----+------+'. ______________ _
0,976 1,000 •
0,740
0,000 +--------,--~---,-----,---,.----,------,--~
5,500 5,700 5,900 6,100 6,300 6,500 6,700 6,900 7,100
January 1979 Population (or around)
The above charts, especially Figure 12, confirm that the most likely and reliable estimates of excess deaths under Khmer Rouge regime are within the range 1.747 and 2.2 million. All these estimates were obtained by using April 1975 population of around 7.89 min and January 1979 population of around 6.36 million.
5.4 Why Vickery is Wrong?
Here we comment on some problems inherent in the estimate by Vickery (1981). 83 We have chosen his estimate as it is the lowest and most extreme among all. (It uses one of the lowest April 1975 population and one of the highest January 1979 population). Several portions of our criticism against Vickery are relevant to other low estimates produced in the early 1980s. We are not going, however, to discuss every rejected estimate one by one.
The method Vickery used to produce his estimate belongs to those with the lowest scores among other estimates produced for Khmer Rouge death toll (see Table 6). Even when used for
83 Comp. Sharp (2008) who criticizes Vickery along similar lines (p. 3-6).
JO August 2009 67

00385330 E3/2413
'f1 &r>J)v f!J ~ ~~/1 /t indicative initial estimates the method is known to have series flaws; most importantly the method does not have a unique solution in terms of excess deaths for two pre-selected population estimates. Several estimates are possible depending on the assumptions used for birth, deaths and net migration. Also Banister and Johnson (1993) worked with similar population sizes for April 1975 (7.3 min) and end-1978 (6.4 min); Vickery used 7.3 min and 6.5-6.7 min, respectively. Their estimate of excess deaths in this period is 1.050 min. This is possible as there exist more than one solutions satisfying Vickery's equation of the population change. The method of Vickery's calculation heavily depends on the population sizes in April 1975 and in January 1979 and on assumptions used to fill in the "gap" between the population size on these two different time moments. Vickery used 7.3 min and 6.5-6.7 min, for April 1975 and January 1979, respectively. If instead of 6.7 min people in January 1979, he would have taken 5.8 min population (same period; after CIA), and kept his assumptions regarding births and natural deaths unchanged, the resulting number of excess deaths, that his method had produced, would have been 1.641 min and not 740,000. Of this total, about 665,000 would be violent deaths and 976,000 indirect excess deaths. 84
Vickery accepts the CIA 1975 population estimate of 7.3 min above the estimates by others ranging between 7.9 to 8.8 min in the same period; this has a significant impact on his final results. Similarly to CIA, Vickery also assumes the death toll of civil war was around 500,000, which is questionable. As we showed, most authors believe the death toll of the civil war was much lower, and most likely around 250,000 victims. If he assumed a lower death toll in the civil war, his estimate of excess deaths during Khmer Rouge would become automatically higher. He conveniently neglects his own higher guess of the 1975-79 population decline (600,000 based on 6.5 min population in January 1979) and the resulting higher number of excess deaths (940,000). This suggests he might have some pre-determined views on what kind of outcome should be obtained. Vickery neglects completely any evidence related to mass graves. Already in 1983, Renakse published their final report on the death toll of Khmer Rouge regime. In this report the overall total of victims is 3.314 min deaths, of which 568,000 are human remains in mass graves and bodies found in the forest (i.e. executions) and 2.75 min are remaining victims of Khmer Rouge regime. This numbers are serious enough to call for investigation into their sources, methodology and reliability and to cross-reference them with any other estimate one can produce. Vickery has not done that, some authors did (e.g. Etcheson (2000, 2005) and Sharp (2008)). Having investigated the Renakse numbers, Vickery would most likely come to the same conclusions as others (i.e. that the Renakse statistics are flawed), but would have realized too that the scale of the death toll was enormous and his own low number of 740,000 excess deaths does not fit the overall picture. Finally, the latest DC-Cam statistics from the mass grave mapping project point to about 1.3 million remains in the mass graves (comp. Sharp (2008) and this report). The previously published statistics (by Etcheson (2000)) indicated about I. I min remains in the mass graves. Both these numbers are obviously higher than his estimate of 740,000 excess deaths produced by Vickery. We have not seen any notes, articles, or books from Vickery in which he would have revised his death toll.
84 The calculation is the following: "absolute population decline, 1975-79" ="actual 1975" - "actual 1979" = 7.1 min - 5.8 min= 1.3 min. The category "excess births" equals 341,000 and must be added to 1.3 min giving the overall total difference of 1,641 min. This number represents the overall excess deaths in Vickery's "model".
JO August 2009 68

00385331
5.5
E3/2413
"~~ .. ·~ H:t~ I~ ~ F' J'VJ.:r ._-
The Numbers: Estimates of Khmer Rouge Victims Recommended for Use
We came up with several main findings and conclusions:
General Observations:
There is generally a lack of reliable statistical sources on the Cambodia population for the period from April 1975 to January 1979; sources on the population itself, and sources on deaths, births and migration (internal and external) are largely non-existent. Sources that are the closest to the Khmer Rouge era include the 1962 population census, the 1980 administrative population count, and the UNT AC voters' registration for the 1993 elections in Cambodia. These statistical sources together with a number of the existing sample surveys, research reports, individual survivors' accounts, reports of international observers, journalists, NGOs and individual researchers' opinions etc. is all that can be used in estimating the death toll under Khmer Rouge regime. Estimates of the population size in mid-1970, April 1975 and January 1979 (or end-1978) are essential for any estimate of excess deaths in this period. Yet there is a wide range of estimates produced by various authors and there is a need to narrow down this range to the most likely figures. Not all estimates of the estimated population sizes are realistic; especially the early estimates produced directly after the fall of Khmer Rouge and motivated by the CIA (1980) report seem to be incorrect. Estimation methods used to produce excess deaths under Khmer Rouge are not all equally sound, transparent and reliable; some must be rejected as not satisfying the basic standard of reliability. The more reliable methods include: sample survey extrapolations used jointly with other sources, death toll as a residual of two population projections, death toll as linked to mass grave records. The largely unreliable methods include: demographic balancing equation, demographic scenarios, and naive estimates from the Renakse nation-wide survey. Estimates of Khmer Rouge victims must be placed in a broader context of war victims and migration during the civil war period (1970 until April 1975), which we summarized in the lines below. As well, migration patterns during the Khmer Rouge regime need to be taken into account when assessing demographic consequences of the Khmer Rouge regime. Finally, it is clear from our review that ethnic and religious groups suffered much more than the rest of the Democratic Kampuchea population. Relevant statistics on this subject are included below.
Detailed Results:
The following authors relied on estimates of April 1975 and January 1979 population that fall within the range of the most likely values: Kiernan (1996), Heuveline (1998), and Neupert and Virak (2005). Sliwinski (1995), Etcheson (2000, 2005) and Renakse did not explicitly estimate the population size for their excess deaths estimates, and can be thus considered as legible candidates for the most reliable figures on excess deaths under Khmer Rouge, except for Renakse that must fade out for other reasons. (Mainly because of the lack of statistical framework for their nation-wide survey and resulting problems, such as duplicates and incompleteness of their findings).
JO August 2009 69

00385332 E3/2413
ff' ~;~J :0 J f:/:£/f 7'1_
The excess deaths of about 1 million estimated for the Khmer Rouge period in the 1980s studies and early 1990s are not reliable enough; they must be rejected as not fulfilling the population size and/or appropriate methodology criterion. The following authors produces estimates of excess deaths that fall within the range of the most likely values, are methodologically sound, and transparent: Kiernan (1996), Sliwinski (1995), Heuveline (1998), Heuveline and Poch (2007), and Etcheson (2005).
Regarding the most likely estimates that we have identified in this report, the following can be reported:
Population in April 1975: 7.844 to 8.102 min, with the central value of 7.894 million Population in January 1979: 6 to 6.418 min, with the central value of 6.209 million. Civil war death toll: most likely 250,000 out of 150,000 to 310,000 likely possible. Internal and external migration during the civil war: uncertain but possibly up to 3.389 min; a majority - internal Population of Phnom Penh in April 1975: most likely 1.5 to 2.6 million Death toll under Khmer Rouge: most likely 1.747 to 2.2 min out of 1.6 to 2.2 min Violent deaths under Khmer Rouge: most likely 50% of the overall excess deaths, i.e. from 800,000 to 1.3 million Out-Migration under Khmer Rouge: 218,000 to 268,000; of which 150,000 to 200,000 to Vietnam, 34,000 to Thailand, 10,400 to Laos, and about 24,000 remaining {to Vietnam) Suffering of Ethnic and Religious groups: Chams: about 36% perished; Chinese 50%; Lao and Thais: 40%, and almost all Vietnamese perished as well; as compared with the average rate for the Khmers being on estimated 18. 7 percent.
10 August 2009 70

00385333 E3/2413
ft> 'it-IP t's:µ f 1t" l.t t1 I I I t --
LIST OF CAMBODIAN SOURCES ASSESSED IN THIS REPORT
RENAKSE, 1983: Summary report of the Research Committee on Pol Pot's Genocidal Regime -"Renakse Summary" and related.
DC-CAM, 2009: Mass Grave Mapping Project
LIST OF INTERNATIONALLY PUBLISHED RESEARCH ASSESSED IN THIS REPORT (Ordered Chronologically)
CIA, 1980: "KAMPUCHEA: A DEMOGRAPHIC CATASTROPHE". A Research Paper, 17 January 1980. http://www.mekong.net/cambodia/demcat.htm
EA MENG-TRY, 1981: "Kampuchea: A Country Adrift". Population and Development Review 7, No. 2 (June 1981).
KIM MO KILJUNEN (ed.), 1984: "Kampuchea: Decade of Genocide". Report of a Finish Inquiry Commission. Zed Books Ltd. London.
MICHAEL VICKERY, 1984: "Cambodia 1975-1982", Silkworm 1984, DI 13.2 (case file 002) (ERN: 00236060-00236064) (extract)
JUDITH BANISTER and PAIGE JOHNSON, 1993: "After the Nightmare: The Population of Cambodia". In: Ben KIERNAN, ed., Genocide and Democracy in Cambodia: The Khmer Rouge, the United Nations and the International Community;
MAREK SLIWINSKI, 1995, "Le genocide Khmer Rouge une analyse demographique'', Editions L'Harmattan, 1995, 175 p.
BEN KIERNAN, 1996: The Pol Pot Regime: Race, Power and Genocide in Cambodia under the Khmer Rouge, 1975-79. (2008 - Third Edition). Yale University Press. Chpt 11. The End of Pol Pot Regime (the Toll).
BEN KIERNAN, 2003: "The Demography of Genocide in Southeast Asia: The Death Tolls in Cambodia, 1975-79, and East Timor, 1975-80". Research note, Critical Asian Studies 35:4 (2003), pp. 585-597.
PATRICK HEUVELINE, 1998: "Between One and Three Million: Towards the Demographic Reconstruction of a Decade of Cambodian History (1970-79)". Population Studies No. 52, pp. 49-65.
PATRICK HEUVELINE and POCH BUNNAK, 2007: "The Phoenix Population: Demographic Crises and Rebound in Cambodia". Demography, Vol. 44, No. 2, p. 405-426.
CRAIG ETCHESON, 2000: "The Number" -- Quantifying Crimes Against Humanity in Cambodia. http://www.dccam.org/Projects/Maps/Mass Graves Study.htm
CRAIG ETCHESON, 2005: "After the Killing Fields: Lessons from the Cambodian Genocide", pages 107-127 and the DC-Cam mapping project.
JO August 2009 71

00385334 E3/2413 ~'"' .1' ~ • t s;;i A ~~ } ' I 1 VFv f <~Q7 7/fj :_
RICARDO NEUPERT and VIRAK PRUM, 2005: ''Cambodia: Reconstructing the Demographic Stab of the Past and Forecasting the Demographic Scar of the Future"\ European Journal of Population No. 21, pp.217-246. (not in the file)
LIST OF ADDITIONAL REFERENCES (ordered alphabet;cally)
David A. Albin and Marlowe Hood, 1987: "The Cambodian Agony". M.E. Sharpe, Inc., Armonk, New York etc.
Elizabeth Becker, 1986: "When the war was over". New York: Simon ans Schuster.
David Chandler, 2008: "A History of Cambodia". (41h edition). Westview, Colorado.
DC-Cam: "The Petition: Summary Report". March 21, 1991. DC-Cam document, contents summarized by Vanthan P. Dara, with introduction by Youk Chhang. (Available from www.dc-cam.org; "Renakse Summary Report")
DC-Cam: "Total Statistics of Genocidal Crimes of Pol Pot Regime on the People during 1975-78", Table, Dated 25 July 1983. Table signed by the members of the (national) Research Committee into the Crimes of the Pol Pot Regime: Min Khin (chairman), Tith Sunthan (vice chairman), Chea Kean (vice chairman), Kim Ly, Srun Seang Lim, and Tes Heng. Available from DC-Cam Renakse records. ("Renakse Summary Table").
DC-Cam: William J. Schulte, (around) 2007: The History of Renakse Petitions and Their Value for ECCC Proceedings (Research paper available from www.dc-cam.org)
DC-Cam: Amy Gordon, 2007: The Renakse Petitions: Background and Suggestions for Future Use. (Research paper available from www.dc-cam.org)
ECCC witness statements o~IFfl!bWllkD 125/9; translated from 00186326_00186335 _ KH)
ECCC witness statements oflf;!f P1kD125/I 6, translated from 00194417-00194426_KH). Including tables for Svay Rieng province.
Liai Duong, 2006: "Racial Discrimination in the Cambodian Genocide". Genocide Studies Program (GSP), MacMillan Center for International and Area Studies, Yale University. GSP Working Paper No. 34., 2006
Meng-Try Ea, 1987: "Recent Population Trends in Kampuchea". Chapter in: David A. Albin and Marlowe Hood, 1987: "The Cambodian Agony". M.E. Sharpe, Inc., Armonk, New York etc.
Patrick Heuveline, 2001: "The Demographic Analysis of Mortality Crises: The Case of Cambodia, 1970-1979". Chapter in: "Forced Migration and Mortality". National Academic Press, USA.
10 August 2009 72

00385335 E3/2413 ~~-~:-·WI HQ '.t ,, 19J(fG .. I/ I
Patrick Heuveline, 1998: "L'insoutenable incertitude du nombre. Estimations des deces de la periode Khmer Rouge", Population, N°6 (Nov-Dec 1998), pp. 1103-1117.
Patrick Heuveline, 1996: "Between One and Three Million: Towards the Demographic Reconstruction of a Decade of Cambodian History (1970-79)". Paper presented at the 1996 annual meeting of the Population Association of America. New Orleans, 9-11 May.
Hirschman, C., S. Preston, and M. L. Vu, 1995: Vietnamese Casualties during the American War: A New Estimate". Population and Development Review 21 ( 4): 783-812.
Marlowe Hood and David A, Albin, 1987: "The Path to Cambodia's Present". Chapter in: David A. Albin and Marlowe Hood, 1987: "The Cambodian Agony". M.E. Sharpe, Inc., Armonk, New York etc.
Jerrold W. Huguet, 1997: "The Population of Cambodia, 1980-1996 and Projected to 2020". National Institute of Statistics (NIS), Ministry of Planning, Phnom Penh, Cambodia.
Jerrold W. Huguet, 1991: "The Demographic Situation in Cambodia". Asia-Pacific Population Journal Vol. 6. No. 4, pp. 79-91.
Ben Kiernan, 1996: The Pol Pot Regime: Race, Power and Genocide in Cambodia under the Khmer Rouge, 1975-79. (2008 -Third Edition). Yale University Press.
Jacques Migozzi, 1973: Cambodge: Faits et problemes de population. Paris, Editions de Centre National de la Recherche Scientifique (CNRS, 1973).
Ysa Osman, 2006: The Cham Rebellion. Survivors' Stories from the Villages. "Searching for the Truth" Series of the Documentation Centre of Cambodia.
Ysa Osman, 2002: OUKOUBACH: Justice for the Cham Muslims under the Democratic Kampuchea Regime. Documentation Series No. 2. Documentation Centre of Cambodia.
Bruce Sharp, 2008: Counting Hell. http://www.mekong.net/cambodia/deaths.htm
George Siampos, 1970: "The Population of Cambodia, 1945-1980". Milbank Memorial Fund Quarterly Vol. 48(3), pp. 317-360.
UNTAC Registration Procedures Manual. UNTAC September 1992
UNTAC Computer System 1992 (Note)
UNTAC Cambodian Voter Registration Card (Note)
UNTAC Elections. Research paper by Michael Maley presented at the Seminar on Electoral Systems and Administration. Phnom Penh, 23-25 October 1995
Unites States Senate: Donald Goodwin and D. Merril, September 2, 1972: U.S. Assistance to Refugees and Civilian War Victims in Cambodia. Appendix II (II) to the April 16, 1973 testimony of Robert H. Nooter before the Subcommittee to Investigate Problems with Refugees and
10 August 2009 73

00385336 E3/2413
'"871 /L
Escapees of the Committee on the Judiciary of the Unites States Senate. Ninety-third Congress, First Session, April 16 1973. http://virtual.clemson.edu/caah/history/FacultyPages/EdMoise/congref.html
Unites States Senate: Jeffrey Millington, February 10, 1972: Refugees in the Khmer Republic. Appendix II (I) to the April 16, 1973 testimony of Robert H. Nooter before the Subcommittee to Investigate Problems with Refugees and Escapees of the Committee on the Judiciary of the Unites States Senate. Ninety-third Congress, First Session, April 16 1973. http://virtual.clemson.edu/caah/history/FacultyPages/EdMoise/congref.html
Unites States Senate: Report, January 27, 1975: "Humanitarian problems in South Vietnam and Cambodia: Two Years after the Cease-Fire". A Study Mission Report prepared for the use of the Subcommittee to Investigate Problems with Refugees and Escapees of the Committee on the Judiciary of the Unites States Senate. Ninety-Fomih Congress, First Session, January 27, 1975. http://virtual.clemson.edu/caah/history/FacultyPages/EdMoise/congref.html
Unites States Senate: Testimony of Wells Klein, member of the Subcommittee Study Mission to Cambodia (SSMC) and executive director, American Council for Nationalities Service (ACNS), New York, before the Subcommittee to Investigate Problems with Refugees and Escapees of the Committee on the Judiciary of the Unites States Senate. Ninety-third Congress, First Session, April 16 1973. Available from the Internet: http://virtual.clemson.edu/caah/history/FacultyPages/EdMoise/congref.html
Unites States Senate: Testimony of Father Robert Charlebois, regional director for Southeast Asia and the Pacific, Catholic Relief Services (CRS), New York, before the Subcommittee to Investigate Problems with Refugees and Escapees of the Committee on the Judiciary of the Unites States Senate. Ninety-third Congress, First Session, April 16 1973. Available from the Internet: http:/ Iv irtual .c lemson.edu/ caah/h istory/F acu ltyPages/EdMo ise/ con gref.htm I
Unites States Senate: Testimony of Hon. Robert H. Nooter, Assistant Administrator for Supporting Assistance in the Agency for International Development, USA (USAID), before the Subcommittee to Investigate Problems with Refugees and Escapees of the Committee on the Judiciary of the Unites States Senate. Ninety-third Congress, First Session, April 16 1973. Available from the Internet: http://virtual.clemson.edu/caah/history/FacultyPages/EdMoise/congref.html
Michael Vickery, 1987: "Refugee Politics: The Khmer Camp System in Thailand". Chapter in: David A. Albin and Marlowe Hood, 1987: "The Cambodian Agony". M.E. Sharpe, Inc., Armonk, New York etc.
Kenneth Vong, 1997: "Geo Explorer Operation Manual and Pfinder Guide". Manual for the project "Mapping the Killing Fields in Cambodia".
JO August 2009 74
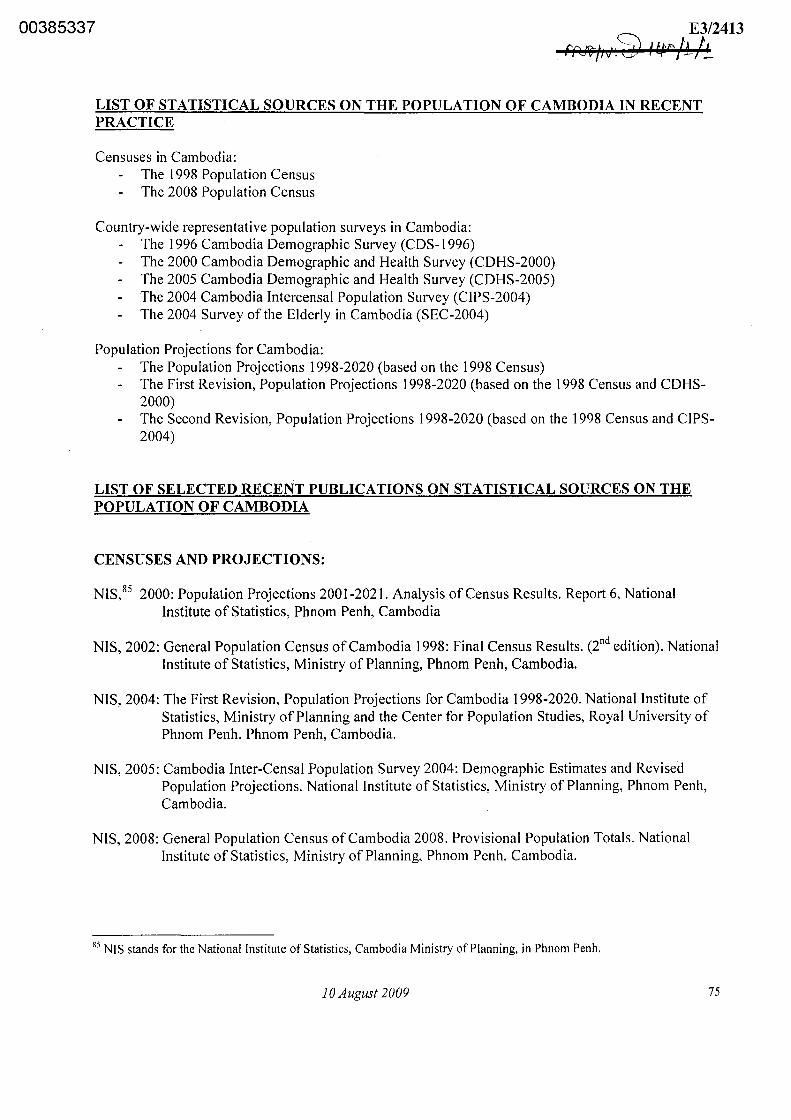
00385337 E3/2413 ffMft I cy ~ t.tr-11 t, .' ~ 10~ J ; ___
LIST OF STATISTICAL SOURCES ON THE POPULATION OF CAMBODIA IN RECENT PRACTICE
Censuses in Cambodia: The 1998 Population Census The 2008 Population Census
Country-wide representative population surveys in Cambodia: The 1996 Cambodia Demographic Survey (CDS-1996) The 2000 Cambodia Demographic and Health Survey (CDHS-2000) The 2005 Cambodia Demographic and Health Survey (CDHS-2005) The 2004 Cambodia Intercensal Population Survey (CIPS-2004) The 2004 Survey of the Elderly in Cambodia (SEC-2004)
Population Projections for Cambodia: The Population Projections 1998-2020 (based on the 1998 Census) The First Revision, Population Projections 1998-2020 (based on the 1998 Census and CDHS-2000) The Second Revision, Population Projections 1998-2020 (based on the 1998 Census and CIPS-2004)
LIST OF SELECTED RECENT PUBLICATIONS ON STATISTICAL SOURCES ON THE POPULATION OF CAMBODIA
CENSUSES AND PROJECTIONS:
NIS, 85 2000: Population Projections 2001-2021. Analysis of Census Results. Report 6, National Institute of Statistics, Phnom Penh, Cambodia
NIS, 2002: General Population Census of Cambodia 1998: Final Census Results. (2°d edition). National Institute of Statistics, Ministry of Planning, Phnom Penh, Cambodia.
NIS, 2004: The First Revision, Population Projections for Cambodia 1998-2020. National Institute of Statistics, Ministry of Planning and the Center for Population Studies, Royal University of Phnom Penh. Phnom Penh, Cambodia.
NIS, 2005: Cambodia Inter-Censal Population Survey 2004: Demographic Estimates and Revised Population Projections. National Institute of Statistics, Ministry of Planning, Phnom Penh, Cambodia.
NIS, 2008: General Population Census of Cambodia 2008. Provisional Population Totals. National Institute of Statistics, Ministry of Planning, Phnom Penh, Cambodia.
85 NIS stands for the National Institute of Statistics, Cambodia Ministry of Planning, in Phnom Penh.
10 August 2009 75

00385338
DEMOGRAPHIC AND SOCIO-ECONOMIC SURVEYES:
NIS, 1996: Demographic Survey of Cambodia: Summary Results. National Institute of Statistics, Ministry of Planning, Phnom Penh, Cambodia.
NIS, 1996: Demographic Survey of Cambodia: Instructions to Enumerators for Filling in Form A Household List and Form B: Household Questionnaire. National Institute of Statistics, Ministry of Planning, Phnom Penh, Cambodia.
NIS, 2004: Cambodia Inter-Censal Population Survey 2004, General Report. National Institute of Statistics, Ministry of Planning, Phnom Penh, Cambodia.
NIS, 2004: Cambodia Socio-Economic Survey 2004. Summary Subject Matter Report. National Institute of Statistics, Ministry of Planning, Phnom Penh, Cambodia.
Royal University of Phnom Penh (RUPP) and UNFPA, 2005: Older Persons in Cambodia: A Profile from the 2004 Survey of the Elderly in Cambodia. Secretariat of the National Committee for Population and Development (NCPD). The Office of the Council of Ministers, Phnom Penh, Cambodia.
10 August 2009 76

00385339
LIST OF ACRONIMS
CIA ECCC DC-Cam DK GAO GKR KR MIPopLAB NIS NORC
OCIJ PRK PRT RUPP UN UNDP UNECAP UNFPA UNICEF UNTAC USA USAID
Central Intelligence Agency, USA Extraordinary Chambers in the Courts of Cambodia, Phnom Penh Documentation Centre of Cambodia, Phnom Penh Democratic Kampuchea, April 1975 - January 1979 Government Accountability Office, United States Government Government of Khmer Republic Khmer Republic, March 1970 - April 1975 Mekong Island Population Laboratory, Kanda) Province, Cambodia National Institute of Statistics, Phnom Penh National Opinion Research Center, with headquarters on the University of Chicago, and offices in Chicago's downtown Loop, Washington DC, Bethesda, Maryland, and Berkeley, California Office of the Co-Investigating Judges, ECCC, Phnom Penh People's Republic of Kampuchea People's Revolutionary Tribunal Royal University of Phnom Penh United Nations United Nations Development Program United Nations Economic Commission for Asia and Pacific United Nations Population Fund United Nations Children's Fund United Nations Transitional Authority in Cambodia United States of America United States Agency for International Development
10 August 2009 77

00385340 E3/2413
ANNEX 2. UP DATE ON DC-CAM STATISTICS ON MASS GRAYES AND MASS GRAYES VICTIMS
Detailed statistics on the sites and victims are available from the "List of Mass Graves" and those on DK prisons and memorials from the tables "List of Prisons" and "List of Memorials"; all three are available from the DC-Cam home page (http://www.dccam.org/Projects/Maps/Mapping.htm). Etcheson (2000) produced a summary of these statistics for 1995-99, i.e. after five years of the mapping project, and came up with figures for the entire Cambodia and for provinces. We have updated his figures using the latest information on the DC-Cam website and present our new figures below. The new figures represent the status as of 18 February 2008.
As noted in Section 2.3 of this report, the methodology and source material ofEtcheson's and our calculations are not identical. Etcheson analyzed data covering the period 1995-99. His source were individual mass grave mapping reports from 1995-1999. We analyzed the latest available data, i.e. dated as of February 2008, from the Internet web-page of the DC-Cam. From the attached samples of this data it is clear that DC-Cam staff have processed the information from the original mass grave mapping reports and included relevant pieces of it in tabular form. Our data contain corrections and improvements of the 1995-99 data that the DC-Cam staff made in the years after 1999; Etcheson did not have these improvements. Secondly, a quantitative analysis like the one of Etcheson and ours is subject to recoding of the reported source figures on mass graves and victims. Recoding can be done in several alternative ways for the source information is qualitative in many records; i.e. it has the form of a brief narrative, such as "more than 1000", "over 300", "hundreds", "thousands'', "a few", "about", "70 families" etc. Researchers might recode these narratives in different ways as no strict rules exist for the recoding of such data. Secondly, many records provide intervals of values and not point estimates.
A third source of differences between our update and Etcheson's results is that in our approach, three variants were made; the medium variant was taken in presentation of our results:
- the minimum variant was based on lower ends of all intervals and estimated lower ends of the narratives86
- the maximum variant took upper ends of all intervals and estimated upper ends of all narratives - the medium variant was obtained as an average of the minimum and maximum.
We assume that our medium variant compares to that of Craig Etcheson. Further, we present the results based on the information from both the "Site Form" and the "Field Report". Field reports usually give lower statistics as pieces of information from the field informants are rejected as not reliable. We believe that "Site Form" contains first-hand valuable data and should be taken for analysis on the first place. For completeness, we also included statistics from the "Field Report". Our results are available from Tables A2.1 to A2.3. Etcheson's original tables are included here as Tables A2.4 to A2.6.
86 The following were our ways of coding in the minimum and maximum variants: Minimum Variant Maximum Variant
I. lower ends for intervals I. upper ends for intervals 2. thousands= I 000 2. hundreds=200, thousands=2000 etc. 3. hundreds=IOO 3. more than/over:+ 1/2* I 00or+1/2*1000 4. more than/over: lower end 4. familiy size=4 persons 5. family=4 persons 5. N/A=O 6. N/A=O
JO August 2009 78
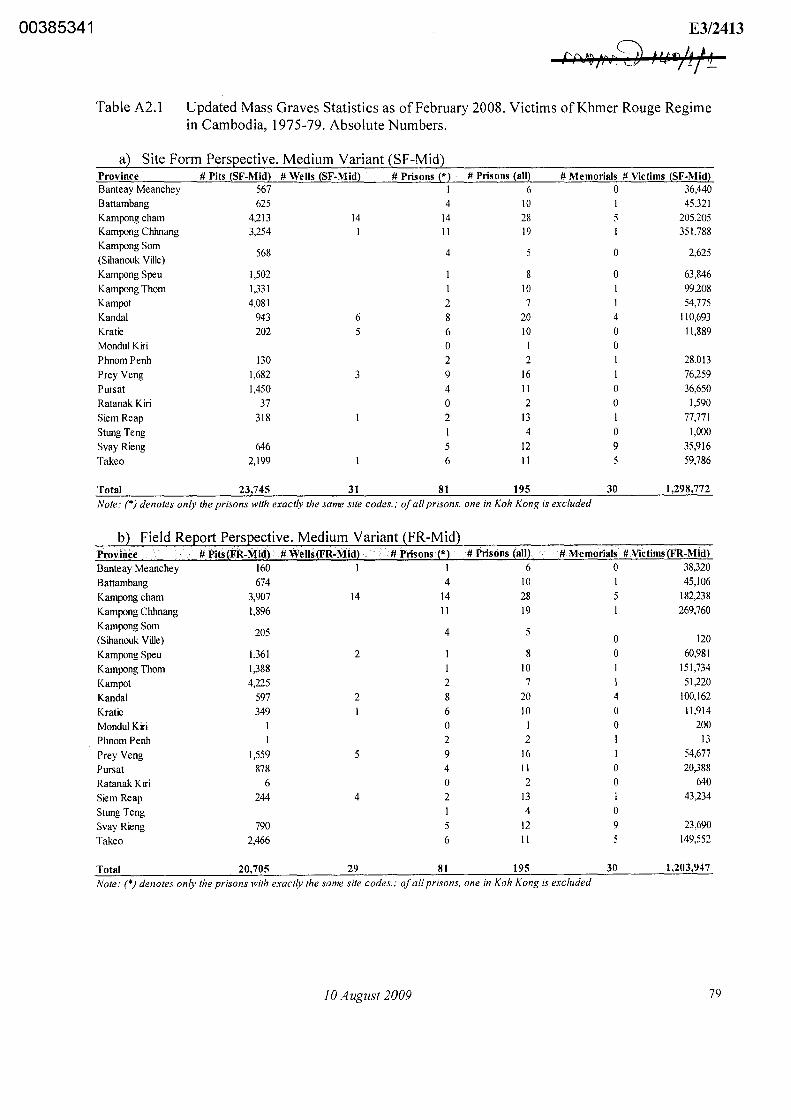
00385341
Table A2.1 Updated Mass Graves Statistics as of February 2008. Victims of Khmer Rouge Regime in Cambodia, 1975-79. Absolute Numbers.
a2 Site Form Perspective. Medium Variant ~SF-Mid) Province # Pits (SF-Mid) #Wells (SF-Mid) #Prisons (*) # Prisons (all) #Memorials #Victims (SF-Mid) Banteay Meanchey 567 I 6 0 36,440 Battambang 625 4 10 45,321 Kampong cham 4,213 14 14 28 205.205 Kampong Chhnang 3,254 II 19 351,788 KampongSom
568 4 0 2,625 (Sihanouk Ville) Kampong Speu 1,502 8 0 63,846 Kampong Thom 1,331 10 99,208 Kampot 4,081 2 7 54,775 Kanda! 943 6 8 20 4 110,693 Kratie 202 5 6 10 0 11,889 MondulKiri 0 I 0 Phnom Penh 130 2 2 28,013 Prey Veng 1,682 3 9 16 76).59
Pursat 1,450 4 II 0 36,650 Ratanak Kiri 37 0 2 0 1,590
Siem Reap 318 2 13 77,771
Stung Teng 4 0 1,000
Svay Rieng 646 5 12 9 35,916
Takeo 2,199 6 11 5 59,786
Total 23,745 31 81 195 30 1,298,772 Note: (*)denotes only the prisons with exactly the same site codes.; of all prisons, one in Koh Kong is excluded
b) Field Reeort Perseective. Medium Variant {FR-Mid) Province # Pits{FR-Mid) # Wells{ER-Mid) # Prisons {*) # Prisons (all~ # Memorials # Victims(FR-Mid) Banteay Meanchey 160 1 1 6 0 38,320
Battambang 674 4 10 1 45,106
Kampong cham 3,907 14 14 28 5 182,238
Kampong Chhnang 1,896 11 19 269,760
KampongSom 205 4 5
(Sihanouk Ville) 0 120
Kampong Speu 1,361 2 8 0 60,981
Kampong Thom 1,388 I 10 151,734
Kam pot 4,225 2 7 51).20
Kanda! 597 2 8 20 4 I00,162
Kratie 349 6 IO 0 11,914
Mondul Kiri 0 0 200
Phnom Penh 2 2 13
Prey Veng 1,559 5 9 16 54,677
Pursat 878 4 II 0 20,388
Ratanak Kiri 6 0 2 0 640
Siem Reap 244 4 2 13 43).34
Stung Teng 4 0
Svay Rieng 790 5 12 9 23,690
Takeo 2,466 6 11 149,552
Total 20,705 29 81 195 30 1,203,947
Note: (*) denotes only the prisons with exactly the same site codes.; of all prisons, one in Koh Kong is excluded
JO August 2009 79

00385342 E3/2413
rr>R;~fj} f ,.~ /L
Table A2.2 Updated Mass Graves Statistics as of February 2008. Victims of Khmer Rouge Regime in Cambodia, 1975-79. Relative Numbers.
a) Site Form PersEective. Medium Variant (SF-Mid)
Province # Districts Pits per Pits per Prison per Victims per Victims per Victims per District Prison District Pit District Prison
Banteay Meanchey 7 81 95 0.86 64 5,206 6,073 Battambang 7 89 62 1.43 73 6,474 4,532 Kampong cham 15 281 150 1.87 49 13,680 7,329 Kampong Chhnang 7 465 171 2.71 108 50,255 18.515 KampongSom
2 284 114 2.50 5 l,313 525 (Sihanouk Ville) Kampong Speu 7 215 188 1.14 43 9,121 7,981 Kampong Thom 8 166 133 1.25 75 12,401 9,921 Kampot 6 680 583 1.17 13 9,129 7,825 Kanda! 10 94 47 2.00 117 11,069 5.535 Kratie 5 40 20 2.00 59 2,378 1,189 MondulKiri I 0 NA 1.00 NA 0 NA Phnom Penh 2 65 65 1.00 215 14,006 14,006 Prey Veng II 153 105 1.45 45 6,933 4,766 Pursat 5 290 132 2.20 25 7,330 3,332 Ratanak Kiri 2 19 NA 1.00 43 795 NA Siem Reap 9 35 24 1.44 245 8,641 5,982 Stung Teng 2 0 0 2.00 NA 500 250 Svay Rieng 7 92 54 1.71 56 5,131 2,993 Takeo 8 275 200 1.38 27 7,473 5,435
Total 121 196 122 1.61 55 10,734 6,660
b) Field Report Perspective. Medium Variant (FR-Mid2
Province #Districts Pits per Pits per Prison per Victims per Victims per Victims per District Prison District Pit District Prison
Banteay Meanchey 7 23 27 0.86 240 5,474 6,387
Battambang 7 96 67 1.43 67 6,444 4,511 Kampong cham 15 260 140 1.87 47 12,149 6,509 Kampong Chhnang 7 271 100 2.71 142 38,537 14,198 Kampong Som
2 103 (Sihanouk Ville)
41 2.50 60 24
Kampong Speu 7 194 170 l.14 45 8,712 7,623 Kampong Thom 8 173 139 1.25 109 18,967 15,173 Kampot 6 704 604 1.17 12 8,537 7,317 Kanda! 10 60 30 2.00 168 10,016 5,008
Kratie 70 35 2.00 34 2,383 1,191
Mondul Kiri NA 1.00 200 200 NA Phnom Penh 2 1.00 13 6 6 Prey Veng II 142 97 1.45 35 4,971 3,417
Pursat 5 176 80 2.20 23 4,078 1,853 Ratanak Kiri 2 3 NA 1.00 107 320 NA Siem Reap 9 27 19 1.44 177 4,804 3,326
Stung Teng 2 0 0 2.00 NA 0 0 Svay Rieng 7 113 66 1.71 30 3,384 1,974 Takeo 8 308 224 1.38 61 18,694 13,596
Total 121 171 106 1.61 58 9,950 6,174
10 August 2009 80

00385343
Table A2.3 Updated Mass Graves Statistics as of February 2008. Victims of Khmer Rouge Regime in Cambodia, 1975-79. Analysis.
a) Site Form Perspective. Medium Variant (SF-Mid) Province Banteay Meanchey Battambang Kampong Cham Kampong Chhnang Kampong Som (Sihanouk Ville) Kampong Speu Kampong Thom Kampot Kanda! Kratie MondulKiri Phnom Penh Prey Veng Pursat Ratanak Kiri Siem Reap Stung Teng Svay Rieng Takeo
Koh Kong Pre ah V ihear Total
Pop June 75 na
962 1226 287
0
299 580 435 618 317
16 142 571 444
48 377 46
190 591
42 39
7,230
% Total Pop# Victims(SF-Mid) % Total Victims na
13.3 17.0 4.0
0.0
4.1 8.0 6.0 8.5 4.4 0.2 2.0 7.9 6.1 0.7 5.2 0.6 2.6 8.2
0.6 0.5
100.0
na 81,761
205,205 351,788
2,625
63,846 99,208 54,775
110,693 11,889
na 28,013 76,259 36,650
1,590 77,771
1,000 35,916 59,786
na na
1,298,772
na 6.3
15.8 27.1
0.2
4.9 7.6 4.2 8.5 0.9 na
2.2 5.9 2.8 0.1 6.0 0.1 2.8 4.6
na na
100.0
c) Field Report Perspective. Medium Variant (FR-Mid) Province Banteay Meanchey Battambang Kampong cham Kampong Chhnang KampongSom (Sihanouk Ville) Kampong Speu Kampong Thom Kampot Kanda! Kratie MondulKiri Phnom Penh Prey Veng Pursat Ratanak Kiri Siem Reap Stung Teng Svay Rieng Takeo
Koh Kong Preah Vihear Total
Pop June 75 Pop Jun 75 (%) # Victims(FR-Mid) % Total Victims na
962 1226 287
0
299 580 435 618 317
16 142 571 444
48 377 46
190 591
42 39
7,230
na
13.3 17.0 4.0
0.0
4.1 8.0 6.0 8.5 4.4
0.2 2.0 7.9 6.1 0.7 5.2 0.6 2.6 8.2
0.6 0.5
100.0
na 83,426
182,238 269,760
120
60,981 151,734 51,220
100,162 11,914
200 13
54,677 20,388
640 43,234
23,690 149,552
na na
l,203,947
JO August 2009
na 6.9
15. I 22.4
0.0
5.1 12.6 4.3 8.3 l.O 0.0 0.0 4.5 l.7 0.1 3.6 0.0 2.0
12.4
na na
100.0
Victims!Pop (°!o) Brutality Index
na 8.5
16.7 122.6
na
21.4 17.1 12.6 17.9 3.8 na
19.7 13.4
8.3 3.3
20.6 2.2
18.9 10.1
na
na 18.0
Victims/Pop na
8.7 14.9 94.0
na
20.4 26.2 11.8 16.2 3.8 1.3 0.0 9.6 4.6 1.3
11.5 0.0
12.5 25.3
na
na 16.7
na 0.47 0.93 6.82
na
1.19 0.95 0.70 1.00 0.21
na l.10 0.74 0.46 0.18 1.15 0.12 1.05 0.56
na na
l.00
Brutality Ind
na 0.52 0.89 5.64
na
1.22 1.57 0.71 0.97 0.23 0.08 0.00 0.58 0.28 0.08 0.69 0.00 0.75 1.52
na na
1.00
81

00385344
Table A2.4 Reference Mass Graves Statistics as of End-1999. By Etcheson (2000). Absolute Numbers.
Tnt>l1> 1: Summ•<Y Stall•lic» on Mass Gra..,. SUl"fflY$. !9115·1999' Oocvmcollltii:>n ~nter o! C.mbodla
·rour :r E~.~=~11{~0 w'~if!'0(JtN+" Pi .. f/,)'i V'eino'i.1: f:5H<i.-.f4N;:: "'E,s:t'l\~!M
o! Site$ # d p,ft> V$t\'0 ;&'.§: s~t&i S·l~t # 0r Vrd:''P{,, # -:;~ Ctr'to•LiW"'l~
~ 'ftw data m dra~'\l?t ttoro t1'W 199'f 19'BS ~rli.f 1999 t.A.ass G:at<e V<app.t!g Rsp.)t"S l1.:JC<J:T"'~n·ta:h:n Co<~l~= c.! Carntl>'.:1*~~c 1'9'tt5 a:M 1900 dam b $1Jmma.1ized m ttie l 9:':17 r-aµ-0rt
"'" E.iblta'~OO r;.~ n1 t.~~iajntt fro-m flOP<>i1 d R-O:i5CO-tt:~1 Cv"r"'~~·Hce ~)q GtH'i.)Clde Cr>trl-0 Ju~y 2~i 1 -8~7' .... *nctJdact ~n dw.a te:r Siem Rea,p
Table A2.5 Reference Mass Graves Statistics as of End-1999. By Etcheson (2000). Relative Numbers.
T!ll>lo 2: O<loc•ipU.. Slilfia!ic• on Mo•• Gill># Sur"")'~. 1995-11199 0GWl!let1!allOO CerMflf (If Calnbo!lia
n~a~i fra~ NY Gt.SNfit. ~"* µ'l1') ~ pe1 V<~,~t f~&t \hd.~'"h p(~: Vidi.~ p.Pr Vit1i>'H~ ;1f<' t:;'i't S~ P-.strn::t Prloon O<tt>~w G~&<t& St1a Dnwict P·,~-v~
?~ ;,-:{;M-rm:'m~n:; c:•Jw; ~;rm~tr,~
ow lli;o~nii¥ im1r1<saru::r-&
10 August 2009 82

00385345
Table A2.6
mtals averages
Reference Mass Graves Statistics as ofEnd-1999. By Etcheson (2000) Analysis.
Table 3: Analylical Statlstlcs on Mass Gmve Sur11eys, 1995-1999 Documentation Center of Cambodia
Population 7<) Tota1 Victirns PtN °~ 1 ola! Victirns.= Brut~litr
al June 75 • Popula\•on Przwmce V•ctims Popvlmion f{lde•
7 230 100.00 1.\1?.829 10000 16.30%
• Populalion m 1ooo·s ny pro'"'"C1l as o! June 1975 fo:;n1 Shwinski r1995) Tatlle 1. Page 26. " Banleay Meanchey was mcorpcrated Imo Battllmba'1)1 in 19i'fi ••• S1em Reap Cata ineludos population numbers lor Odctar Meanchoy
Differences between our and Etcheson' s results are summarized in Figures A2. l to A2.3. Both types of 2009 results are shown; those based on the "Site Form" ("SF") and those on "Field Report" ("FR"). In both cases only the medium variant is included. In case of prisons, the series labeled with (*) depicts only those prisons that have identical locations as the mass graves. "All" prisons include the prisons identified within a given province; not of all them are located exactly at the mass graves but nearby.
Figure A2.1 Number of Victims Estimated Based on DC-Cam Mass Grave Statistics: Etcheson's 2000 Statistics versus 2009 Update
400.000 ----------------------------------------------------------------------·
350~00 ---------------------------------------------------------·
300.000 ---------------------------------------------------------·
250.000 --------------------------------------------------------·
200.000 -------------------------------------------------------·
150.000
100.000
50.000
0 > QJ
.<::: u c: "' QJ
:? > "' ~ c "' co
.. c: "' .0 E ~ "' co
E .. c:
"' "' .<::: c: u .<::: .. .<::: c: u 0 a. "" c E 0
"' a. "" E
"' ""
~ ::I E 0 QJ
5 a. 0 a. V\ .<::: E f-
"' .. "' ::I c: "" "" 0 0 c 0 c a.
"' E a. .<::: E
"' Vi "" "' ""
-;;; QJ ·;: .<::: .. ~
a. "" .. 0 'O -~ ;;;: c: c: ;;;: "' c: c: QJ
QJ QJ QJ QJ QJ "' c: :; "- > ::I "' "' >- ii: "' "' "" f-"" 'O E > "- "' E ..
c: QJ c: c: > 0 ii. ~ QJ :::I "' 0 c Vi >
:? "' v; V\ .<::: tr: "-
-~2009(SF) 2009 (FR) -2000
10 August 2009 83
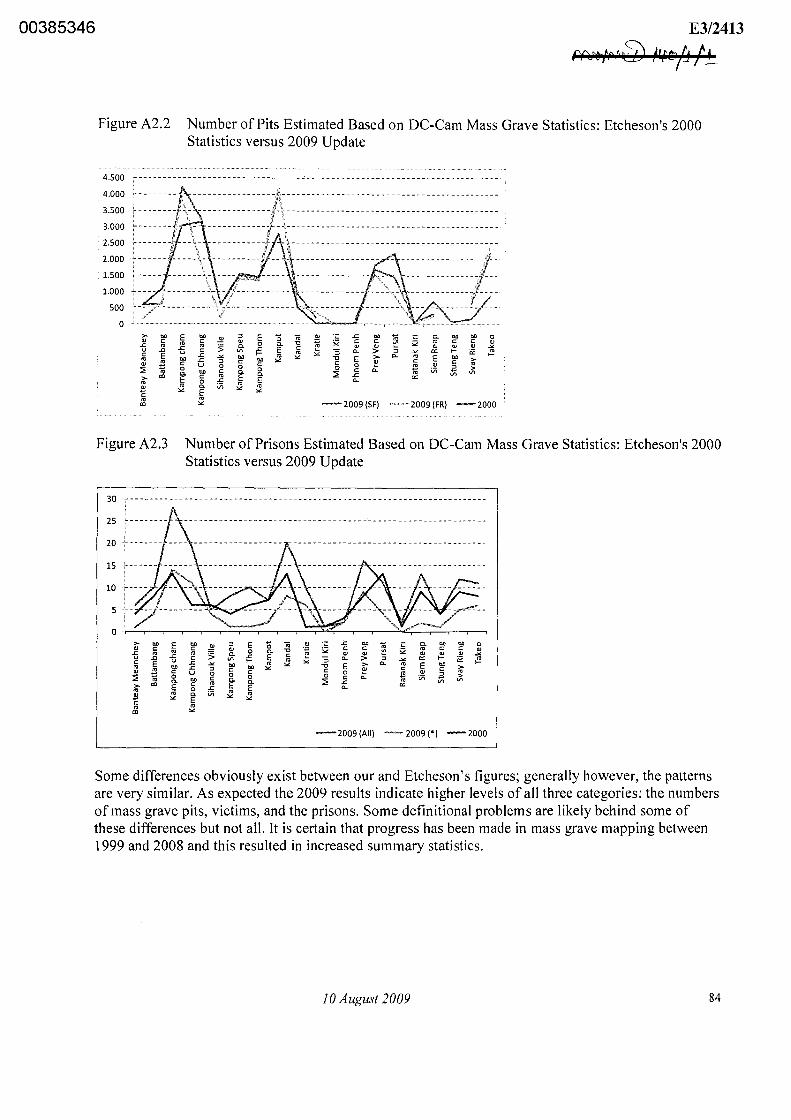
00385346 E3/2413
Figure A2.2 Number of Pits Estimated Based on DC-Cam Mass Grave Statistics: Etcheson's 2000 Statistics versus 2009 Update
4.500
4.000
3.500
3.000
2.500
2.000
1.500
1.000
500
0 > Qj
.<= u c: "' Qj
::< > "' s c: "' "'
"" c: "' -" E "' :i:::
"' "'
E "" c: "' -5 "' c: .<= .. .<= c: u 0
"" c. c: E 0
"' c. "" E
"' ""
~ ::l E ~ -;;; Qj 0
0 c. .,, > c. c:
Vl i= E "' -" "" "' "" .. ::l c: "" 0 0 c: c: c. 0
0. "' E .<=
"' E
Vi "' "" ""
Qj ·;: .<= "" ~ ·;: c. "" "" 0 ·p ;;;: c: c: ill "' c: c: Qj ;;;: "' Qj Qj
~ Qj Qj Qj -"
>< :; 0.. > -" "" >-- ii: "' > .,_ "' E .. >--"O E ~ c: ~ c: c:
0 ~
Qj i3 0 c: .,_ Vi >
::< Vl Vl .<=
"" 0..
-2009(SF) ·• 2009 (FR) -2000
Figure A2.3 Number of Prisons Estimated Based on DC-Cam Mass Grave Statistics: Etcheson's 2000 Statistics versus 2009 Update
30 ·-------------------------------------------------------------------------
0 > "" E ..
~ ::l E 0 -;;; Qj .<= .. ~
c. .. .. 0 Qj c: c: Qj ·p ;;;: c: c: "' c: c: Qj
-5 "' "' "' 5 c. 0 c. "tJ
"' Qj QJ ;;;: Qj Qj Qj -"
-" .<= c: Vl .<= E c: >< :; 0.. > ::l -" "" >-- ii: "' u >-- "' c: E .<= -" "" "' "" > 0.. "' E "" >--
"' "' "" .<= ::l c: "" "" "O E e c: c: > Qj c: u c: c: 0 Qj "' ::< :i::: 0 0 0 0 0 c: 0.. ~ Vi i3 >
"' c. .. c: c. 0. ::< Vl Vl
"' c: "' E .<= "' > E .<= E 0..
"' 0
"' "' c. Vi "' s "" E "" "" c: "' "' "' ""
-2009(All) -~ 2009(*) -2000
Some differences obviously exist between our and Etcheson's figures; generally however, the patterns are very similar. As expected the 2009 results indicate higher levels of all three categories: the numbers of mass grave pits, victims, and the prisons. Some definitional problems are likely behind some of these differences but not all. It is certain that progress has been made in mass grave mapping between 1999 and 2008 and this resulted in increased summary statistics.
JO August 2009 84

00385347 E3/2413
f¥'0°~}Po :Q /t#/1/~
ANNEX 3. SUMMARIES OF EXISTING ESTIMATES ASSESSED IN THIS REPORT
ESTIMATE BY CIA, 17 January 198087
Reported Excess Deaths
Reported Direct Excess Deaths Time Period Covered Total Number of Months Causes of Death
Affected Ethnic Groups
Data Sources
Methods for the Overall Number of Victims
Total of all deaths: 1.850 min in medium variant. This total includes 100,000 victims of executions. Note: 1,850 is not explicit in CIA report but could be calculated from projection inputs 50,000 to 100,000 (1975-1976) April 1975-January 1979 45: April 1975-January 1979 Executions explicit (same as direct excess deaths); no other causes Entire society; no mention of excess deaths for a particular ethnic or religious group 1962 Census, 1978 UN projections for Cambodia, UNHCR refugee statistics for Cambodia, intelligence and other sources including the expertise of CIA analysts specialized in this region of the world; sources not referenced one by one, except for Siampos (1970) and Willmott (1968) The primary goal was to reconstruct the Cambodia population and its losses in the entire decade of 1970s. Deaths in the Khmer Rouge regime were part of the reconstruction. The authors applied a demographic scenario technique using the standard population accounting method, i.e. the start-of-year population was increased by the number of births in one-year (or shorter) period, and decreased by the number of deaths and refugees in the same one-year (or shorter) period. The approach was exceptionally detailed: - The entire period of 1970-79 was divided into sub
periods following historical developments: • (1) 1 July 1970 to 17 April 1975 • (2) 17 April 1975 to 1 January 1979 • (3) 1 January 1979 to 1 December 1979
- The Red Khmer period was further divided into even smaller sub-periods, each six months long, except for the first 10 weeks from 17 April to I July 1975, and as well into two principal population groups, i.e. the New and Old people.
Red Khmer period projections were made for each principal group of people (New and Old) and for a number of distinguished sub-periods (each app. six months), using assumptions formulated separately for each small set of projections. Indeed, detailed knowledge of history, including demographics, was required to specify these
87 CIA, 1980: "KAMPUCHEA: A DEMOGRAPHIC CATASTROPHE". Research Paper, 17 January 1980. http://www.mekong.net/cambodia/demcat.htm
JO August 2009 85

00385348 E3/2413
assumptions. Methods for Cause of Death No formal methods used; deaths from executions as well as Distribution all remaining deaths are based on subiective assessment. Affected Population Included 7.060 min (I July 1970; after UN) in Estimate: mid-year 1970 (or around) Affected Population Included 7.384 min (17 April 1975; min 7.278 to max 7.384 min) in Estimate: April 1975 (or around) Affected Population Included 5.845 min (1 Januari 1979; min 5.452 to max 6.225 min) in Estimate: January 1979 (or around) Absolute Decline in 1.539 min (min 1.2 to max 1.8 min) Population Size between April 1975 to January 1979 (or around) Motivation for this Report Unclear. The organization that authored this scenario is the
Central Intelligence Agency of the USA, which country was present in the region in the 1st half of 1970s. They were the first ones to publish on this subject soon after the fall of Khmer Rouge in January 1979. For several years, this paper, being based on largely subjective and possibly politically biased judgments, was giving the lead to many others working in this field. The report had serious impact on their work.
Major Contribution/Failure of this Paper:
The report is extremely transparent and can easily be (and often was) used for reference purposes by other authors. Its results are highly uncertain and questionable, however. The most important reason for this is the general lack of data sources for the projection assumptions. All assumptions come from the authors' largely subjective judgments of demographic implications of historical developments in Cambodia during the 1970s. The paper is of no value from the view point of Khmer Rouge (and civil war) casualties. The lack of explanation of sources and methods of the CIA number of 50,000-100,000 Khmer Rouge executions must be seen as a major unacceptable deficiency.
Other main results include some statistics on refugees and on the Chinese population in Cambodia during Khmer Rouge; again characterized by the same deficiencies.
Refugees: • Repatriation to Vietnam: 200,000-500,000 - April 1975 • Refugees to Vietnam: 30,000 - after April 1975 • Refugees to Thailand: 20,000-55,000 - after April 1975
Chinese: • About 444,000 in April 1975 declined to 259,000 in the end of 1979; by about 200,000
Some other statistics relate to victims of civil war during the Lon Nol regime: • About 600,000 war victims in addition to natural deaths from 1970 to April 75
JO August 2009 86

00385349
Table A3.1 Estimation of Overall and Excess Deaths from CIA Data. Source: Authors of this Report
New Peoele, Medium Variant
Time Period Population Si7.e Crude Death Rate Number of Deaths Khmer Rouge (Thousands) (Perl,000) (Per Sub-Period) 17 Apr 75 to 1 Jul 75 4,000 547 518,009 1 Jul 75 to I Jan 76 3,576 240 403,740 1 Jan 76 to I Jul 76 3,153 87 134,372 1 Jul 76 to 1 Jan 77 3,025 86 127,431 1 Jan 77 to I Jul 77 2,902 50 71,750 I Jul 77 to 1 Jan 78 2.838 50 70,175 I Jan 78 to 1 Jul 78 2,776 50 68,650 I Jul 78 to 1 jan 79 2,716 50 67.163
'1 Jan 79 2,657
Total Khmer Rouge na na 1,461,289 Note: We assumed the population size is given for start of period
Old Peoele, Medium Variant
Time Period Population Sim Crude Death Rate Number of Deaths Khmer Rouge (Thousands} {Per 1,000) {Per Sub-Period} 17 Apr 75 to I Jul 75 3,134 18 14,139
I Jul 75 to I Jan 76 3,150 25 39,425
I Jan 76 to 1 Jul 76 3,158 25 39,525
I Jul 76 to 1 Jan 77 3,166 25 39,600
1 Jan 77 to 1 Jul 77 3,170 25 39,650
I Jul 77 to 1 Jan 78 3,174 25 39,706
1 Jan 78 to I Jul 78 3,179 25 39,763
I Jul 78 to I jan 79 3,183 25 39,819 ,. I Jan 79 3,188
Total Khmer Rouge na na 291,627
New and Old Peoele, Medium Variant
Time Period Population Si7.e Crude Death Rate Number of Deaths
Khmer Rouge (Thousands} (Perl,000) (Per Sub-Period)
17 Apr 75 to I Jul 75 7,134 307 532,148
1 Jul 75 to 1 Jan 76 6,726 ~ 136 443,165
I Jan 76 to 1 Jul 76 6,311 56 173,897
1 Jul 76 to I Jan 77 6,191' 54 167,031
I Jan 77 to 1 Jul 77 6,072 37 111,400
I Jul 77 to I Jan 78 6,012 37 109,881
I Jan 78 to I Jul 78 5,955 37 108,413
I Jul 78 to I jan 79 5,899 r 36 106,981
'1 Jan 79 5,845
Total Khmer Rouge na na 1,752,915
E3/2413
p' I I -
Number of Deaths Year (Per Year)
921,749 1975
261,802 1976
141,925 1977
135,813 1978
1,461,289 1975-78
Number of Deaths Year
(Per Year)
53,564 1975
79,125 1976
79,356 1977
79,581 1978
291,627 1975-78
Number of Deaths Year
(Per Year)
975,313 1975
340,927 1976
221,281 1977
215,394 1978
1,752,915 1975-78
Our approximation of the CIA estimates is done by first calculating the overall number of deaths in April 1975-January 1979 directly from the population data and death rates produced by CIA (see Table A3. l ). There were about 1.753 min such deaths. We assumed these were both natural deaths and indirect Khmer Rouge victims. We distributed these deaths fifty-fifty, applying thus the uniform distribution into natural deaths and indirect victims (0.876-0.876 min). CIA estimated in their medium variant that there were I 00,000 executions during Khmer Rouge regime (Table A3.2 below). We added
10 August 2009 87

00385350 E3/2413
the executions on the top of indirect deaths (0.876 min) and obtained the total of excess deaths being 0.976 million.
Table A3.2 Executions, Only New People, Medium Variant. Source: CIA (1980)
Year Victims 1975 80,000
1976 20,000
1977 0
1978 0 Total 100,000
Overall Deaths, April 1975-January 79 (CIA): 1,752,915 + 100,000 = 1,852,915 Excess Deaths, April 1975-January 79 (CIA): 50% of 1,752,915 + 100,000 = 976,458
JO August 2009 88

00385351 E3/2413
ESTIMATE BY EA MENG-TRY, 198188
Reported Excess Deaths 1 min (from massacres, undernourishment, hard treatment, deportation)
Reported Direct Excess Deaths 120,000 (included in 1 min); of which 35,000 (29.2%) in I 975, I 5,000 (12.5%) in 1976, 40,000 (33.3%) in 1977, 30,000 (25%) in I 978.
Time Period Covered April 1975 to December I 978 Total Number of Months 45; April 1975 to December I 978 Causes of Death Executions explicit; no other causes Affected Ethnic Groups Entire society; no mention of excess deaths for a particular
ethnic or religious group Data Sources For population size: CIA (I 980), Migozzi (I 973), official
(mainly Vietnamese) government reports, notes I statements I reports of international organizations, press reports (mainly France), historical materials/books etc. For excess deaths (including executions):
- CIA (1980): 50,000 to 100,000 of violent deaths and several hundreds of indirect deaths
- Father Ponchaud (spring I 978): 2 millions (excess) - Amnesty International (1979: "Rapport sur Ia peine de
mort"): 2 million (excess), 200,000 executions - Countries of Eastern Europe and Hanoi: 3 to 4 million
(excess) Methods for the Overall Excess deaths obtained as a residual category from a Number of Victims general demographic accounting equation. Components of
the equation obtained from author's own (predominantly qualitative) assessment of estimates by others.
Methods for Cause of Death Author's own (predominantly qualitative) assessment of Distribution estimates by others. Affected Population Included 7.3 min (after Migozzi, 1973) in Estimate: mid-year 1970 (or around) Affected Population Included 7.460 min in Estimate: April 1975 (or around) Affected Population Included 6.510 min (December 1978) in Estimate: January 1979 (or around) Absolute Decline in 950,000; the general accounting equation explaining this Population Size between April decline includes: 1975 to January 1979 (or - Excess Births: + 500,000 around) - Excess Deaths: - 1,000,000
- Refugees abroad: - 250,000 - Repatriation Vietnam: - 200,000
Motivation for this Report Article published in an international demographic journal
88 Ea Meng-Try, 1981: "Kampuchea: A Country Adrift". Population and Development Review 7, No. 2 (June 1981 ).
10 August 2009 89

00385352 E3/2413
Main Contribution/Failure of the Paper: The results of EA Meng-Try must be taken with caution. It is a very subjective assessment, based on a qualitative approach that was made in a difficult period directly after the Khmer Rouge regime ended in Cambodia and a new regime supported by Vietnam established themselves in the country. In this period, in the absence ofreliable data on the population, and in the absence of the necessary historical distance to political realities of that time, it was hard to assess the population losses in a reliable way. No uncertainty assessment is presented in this paper. Even though Ea made a serious effort to analyze views of the opposing parties on the population development, we do not believe he succeeded to present reliable figures.
Other relevant results: Population of Phnom Penh, April 1975: 3 min
Refugees, April 1975 to December 1978: Refugees to Thailand: 30,000 (until start of 1978) Refugees to Vietnam: 50,000 Repatriation to Vietnam: 200,000 (April 1976)
JO August 2009 90

00385353 E3/2413
.---~ -~t'i . .:;v 4 u" IJ,_ DJ fYFU f I I
ESTIMATE BY VICKERY, 198489
Reported Excess Deaths 740,000 Reported Direct Excess Deaths 300,000 Time Period Covered April 1975 to January 1979 Total Number of Months 45: April 1975 to January 1979 (January not counted) Causes of Death Violent (i.e. direct) versus indirect deaths"v Affected Ethnic Groups No ethnicity available Data Sources CIA (1980); some demographic rates (births 30/1000 per
year and deaths 18/1000 per year) from the period around the 1962 Census; sources unclear. Some additional population projections by individual authors and organizations for contextual ~urposes
Methods for the Overall Excess deaths obtained as a residual category from a Number of Victims general demographic accounting equation. Components of
the equation obtained from author's own (predominantly qualitative) assessment of estimates by others.
Methods for Cause of Death Author's own (predominantly qualitative) assessment of Distribution estimates by others. The overall total of excess deaths in
1975-78 obtained from the general accounting equation (740,000) was distributed into direct and indirect deaths according to subjective survivors' recollections.
Affected Population Included 7 min (CIA, 1980) in Estimate: mid-year 1970 (or around) Affected Population Included 7.1 min; obtained as CIA 7.3 min - 0.2 min (repatriation to in Estimate: April 1975 (or Vietnam); All living in Cambodia in April 1975, excluding around) those who were forced to Vietnam at the beginning of the
Khmer Rouge conflict. These would be app. 200,000 Cambodian Vietnamese that left to Vietnam.
Affected Population Included 6.5 to 6.7 min; author's own estimates in Estimate: January 1979 (or around) Absolute Decline in 400,000 to 600,000; the minimum decline of 400,000 is Population Size between April further distributed according to the general accounting 1975 to January 1979 (or equation: around) - Out-migration eliminated from 7.3 min for simplicity
- Births 1975-78: (+) 852,000 based on crude birth rate of 3011,000 per year
- Natural Deaths 1975-78: (-) 511,000 based on crude death rate of 18/1,000 per year
- Excess Births 1975-78: ( +) 341,000 - Excess Deaths 1975-78: (-) 741,000
Motivation for this Report Writing history of Cambodia and publishing it.
89 Michael Vickery, 1984: "Cambodia 1975-1982", Silkworm 1984, D 113.2 (case file 002) (ERN: 00236060-00236064; extract) 90 According to Vickery, clearly controversially, mass burial places contain mainly indirect excess deaths and hidden burial places - different from known mass graves - contain bodies from executions.
10 August 2009 91

00385354 E3/2413
r:~ra •if) l~e/±J L
Major Contribution/Failure of this Paper: The method ofVickery's calculation heavily depends on the population sizes in April 1975 and in January 1979 and on assumptions used to fill in the "gap" between the population size on these two different time moments. Vickery used 7.3 min and 6.5-6.7 min, for April 1975 and January 1979, respectively). If instead of 6.7 min people in January 1979, he would have taken 5.8 min population (same period; after CIA), and kept his assumption regarding births and natural deaths unchanged, the resulting number of excess deaths, that his method had produced, would be 1.641 min and not 740,000. Of this total, about 665,000 would be violent deaths and 976,000 indirect excess deaths. 91
Vickery's results have no source foundation other than subjective guessing and his own intuition; his reasoning is simplistic and assumptions completely unjustified. Interestingly, Vickery accepts the CIA 1975 population estimate of 7.3 min above the estimates by others ranging between 7.9 to 8.8 min in the same period; this has a significant impact on his final results. Another observation is that he conveniently neglects his own higher guess of the 1975-79 population decline (600,000 based on 6.5 min population in January 1979) and the resulting higher number of excess deaths (940,000). His writing is not transparent, and hard to follow.
Also Banister and Johnson (1993) worked with similar population sizes for 1975 (7.3 min) and end-1978 (6.4 min); Vickery used 7.3 min and 6.5-6.7 min, respectively. Their estimate of excess deaths in this period is 1.050 min. This is fully possible as there exist more than one solutions satisfying Vickery's equation of the population change.
91 The calculation is the following: "absolute population decline, 1975-79" = "actual 1975" - "actual 1979" = 7. l min - 5 .8 min= 1.3 min. The category "excess births" equals 341,000 and must be added to 1.3 min giving the overall total difference of 1,641 min. This number represents the overall excess deaths in Vickery's "model".
10 August 2009 92

00385355 E3/2413
<x>@ tN':;:u l!tC' h 14 I I I
ESTIMATE BY KILJUNEN (ED.), 198492
Reported Excess Deaths 1 min (based on comparison with a hypothetical growth rate of2.8% until 1981)
Reported Direct Excess Deaths 75,000 to 150,000 suggested as realistic Time Period Covered April 1975 to January 1978 Total Number of Months 45; April 1975 to January 1978 (January not counted) Causes of Death Not studied; but 75,000 to 150,000 of executions suggested
as realistic (sources: Kurt Jansen, the UNICEF representative in Cambodia in 1980-81, 70,000 to 100,000; likely also CIA (1980) 50,000 to I 00,000)
Affected Ethnic Groups Not studied; but perishing of Vietnamese and Chams has been assessed (250,000 Khmer Vietnamese were forcibly moved out to Vietnam and 150,000 Chams out of 200,000 before the conflict perished too).
Data Sources The Population "Census" of May 1981 by the government in Cambodia (Ministry of Planning, Phnom Penh); UN population projections; CIA (1980) projections; all these cross-referenced with Pol Pot's statistics
Methods for the Overall Method comprised a comparison of the expected and actual Number of Victims population size in 1981 (in May) and subtracting excess
deaths in 1979-81. Assumptions used:
• Expected population 1981: 8.3-8.5 mln (2.8% annual growth of7.3 mln (1975; after CIA (1980)); "no war" scenario)
• Actual population 1981: 6. 7 min (" 1981 census")
• Refugees in third countries, 1975-81: 650,000
• The 1981 actual population with refugees: 7.4 min
• Residual:"l 981 expected" - "1981 actual with refugees": about 1 min
The residual of 1 min are excess deaths in 1975-81. Excess deaths 1979-81: Assumed as negligible: main cause for excess deaths in I 979-198 I was famine estimated to cause in reality only "a few tens of thousands" of deaths, (contrary to earlier expectations). The entire excess of 1 mln can be therefore attributed to Khmer Rouge regime.
Methods for Cause of Death NA Distribution Affected Population Included 7 .1 min (UN, prior to I 980) in Estimate: mid-year 1970 (or around) Affected Population Included 7.3 min (CIA, 1980) in Estimate: April I 975 (or around) Affected Population Included 6. 7 m In ( 1981 "census")
92 Kimmo Kiljunen (ed.), 1984: "Kampuchea: Decade of Genocide". Report of the Finish Inquiry Commission. Zed Books Ltd. London.
10 August 2009 93

00385356 . E3/2413 fi"RB 4',, QI "@Ft1CJ
j I 0 · I I
in Estimate: January 1979 (or around) Absolute Decline in 600,000 Population Size between April 1975 to January 1979 (or around) Motivation for this Report Chapter in a report of the Finish Inquiry Commission into
the Khmer Rouge regime in Cambodia. The chapter and the entire book have a clearly scientific (historical) orientation.
Main Contribution/Failure of the Paper:
The results of Kiljunen (ed.) are heavily dependent on the population sizes (expected and actual) for 1981 (8.3-8.5 and 6.7, or 7.4 including refugees) respectively. No critical assessment was made of any these two sizes. The 1981 "Census" is known as actually non-existent. The "census" was merely an administrative count whose precision and reliability are unknown. Also the expected population size is very uncertain; it is the result of the assumed population size in 1975 (7.3 min after the CIA) and the 2.8% growth rate of the population in 1975-81. No justification is presented for any of these components. Developments in births are completely neglected. Note that a higher expected 1981 population (say 9 min. instead of 8.3-8.5 min.) would give far more excess deaths (1.6 min. instead of 1 min.). So would be the case ifthere were excess births in 1975-78 (i.e. all births above the natural deaths). This approach is thus extremely subjective and cannot be taken seriously.
Other results:
Migration in 1975-1981 (Kiljunen (ed.) chapter 4): Refugees to Thailand: 300,000 Refugees to Western countries: 100,000 Repatriation to and Refugees in Vietnam: 250,000 Total: 650,000
Population of Phnom Penh April 1975: 3 min (sources: July 1997 hearing in the US Congress, Committee on International Relations; interview with Ieng Sary "Der Spiegel", No. 20 1977)
Excess deaths in 1970-75: 600,000 approximately (sources: Democratic Kampuchea: 600,000-800,00; United States: 600,000-700,000; Sihanuk: 600,000)
10 August 2009 94

00385357 E3/2413
~~·~t~ '"i'il'' t• f F(f V~~ f)L/ .L
BANISTER AND JOHNSON, 199393
Reported Excess Deaths 1.05 min; 2/3 males and 1/3 females; Reported Direct Excess Deaths "For each of these four years, in addition to high
underlying mortality conditions, about 10% of men and 3% of women in these ages ("from the mid-teens through middle age") were killed". It can be calculated, 235,000 were direct excess deaths. 94
Time Period Covered April 1975 to January 1979 Total Number of Months 45; April 1975 to January 1979 (January not counted) Causes of Death Not reported Affected Ethnic Groups Not included in the reconstruction scenario but discussed
for the 1962 Census, later revisions by Sihnouk, and in the context of migrations.
• 1962 Census figures (based on "nationality"): - 93% Khmer - 4% Vietnamese (218,000) - 3% Chinese (163,000)
• Sihanouk's and other revisions in late 1960s (over 1 min minorities; 16-17 percent): - Vietnamese in Cambodia: 400,000 - Chinese in Cambodia: 300,000-435,000 - Muslim Cham: 150,000 - Hill tribes: 90,000
• Migration/killings of ethnic groups from Cambodia: - Vietnamese: most expelled by Lon-Nol in 1970-74,
the rest killed or drove out by KR in 1975-78; - Chinese: many killed or drove out by KR in 1975-
78; - Muslim Cham: They follow Kieman's view that up
to 90,000 were exterminated (killed) by KR in 1975-78
Data Sources Major sources: 1962 Census; 1980 administrative population count ( end-1980); 1982 demographic and health survey in Cambodia (Ministry of Health) Auxiliary Sources: A large number of published and unpublished studies, personal communications, results of simulations and alternative scenarios
Methods for the Overall Excess deaths were obtained within a reconstruction of the
93 Judith Banister and Paige Johnson, 1993: "After the Nightmare: The Population of Cambodia". In: Ben Kiernan, ed.: Genocide and Democracy in Cambodia: The Khmer Rouge, the United Nations and the International Community 94 Age was assumed 15-64 years; the 15-64 years old were assumed to comprise 49.5% of the April 1975 population (after Migozzi (l 973)); sex distribution at this age fifty-fifty (after Siampos (1970)). The full calculation is included below:
April 1975 Population 15-641975 Population 15-64 yean men lS-64 yean "6men Total 15-64 Men & Women
Notn:
7,300,000 7,300,000'0.495=3,613,500 1,806,750 1,806,750 3,613,500
Violent Deaths na 180,675 54,203 234,878
Migo::zi (/973)
M1w1::zi:(l973)
Siampu.~ ( 1970)
Swmpos(/970)
/5.6.Jyears· ./9.5%in /970pop11/n110n
15-6./years: 53 .J%in /962 pop11/n11rm
15·6./years: 51 7%m l9fi] pop11/a1ion
I 5-6./years: 50'Y.,men and 50%womcn m 1%2 pop11/atw11
JO August 2009 95

00385358
Number of Victims
Methods for Cause of Death Distribution Affected Population Included in Estimate: mid-year 1970 (or around) Affected Population Included in Estimate: April 1975 (or around)
E3/2413
fA*1i~ :Q I !i~1i f!
Cambodia population between 1962 and 1980 by means of a "plausible scenario". The focus of the study is on the Cambodia population just before the UNTAC supervised first democratic elections of 1993. A reconstruction of the 1970s decade is attempted, using a "plausible scenario" obtained from the interpolation of the size and structure of the Cambodia population between 1962 census and 1980 administrative count. Thereafter, an extrapolation of the 1980 count is performed up to 2050 using the usual demographic accounting approach (in medium, low and high variants). • 1962 census and 1980 count and educated guesses on
war related population losses were used for the "plausible scenario" of 1962-1980
•war related population losses (deficit of births, out-migration, and war-related excess deaths) used in the "plausible scenario" expressed the impact of civil war March 1970- April 1975 and KR regime April 1975-January 1979 on the population change
• war related population losses were not estimated but formulated a priori as educated guesses; their impact was tested by comparing the outcome of the "plausible scenario" with an alternative scenario that would have occurred ifthere was no civil war/no Khmer Rouge regime
• this comparison was crucial for obtaining the estimates of the losses
In extrapolation (1980-2050), assumptions regarding fertility and mortality were based on the 1980 administrative count and the 1982 demographic and health survey of the Cambodia Ministry of Health (comp. 83-87 and 93-95). Assumptions regarding migration came from a thorough overview of migration flows from and into Cambodia in the period 1970-1992 summarized in Appendix A and based on a variety of (un)published sources and estimates. The following types of migration are discussed: - Non-Khmer/Khmer migration to and from Vietnam - Migration to and from Thailand - Migration to and from third countries Not available
7 min ("plausible scenario")
7.3 min ("plausible scenario")
I 0 August 2009 96
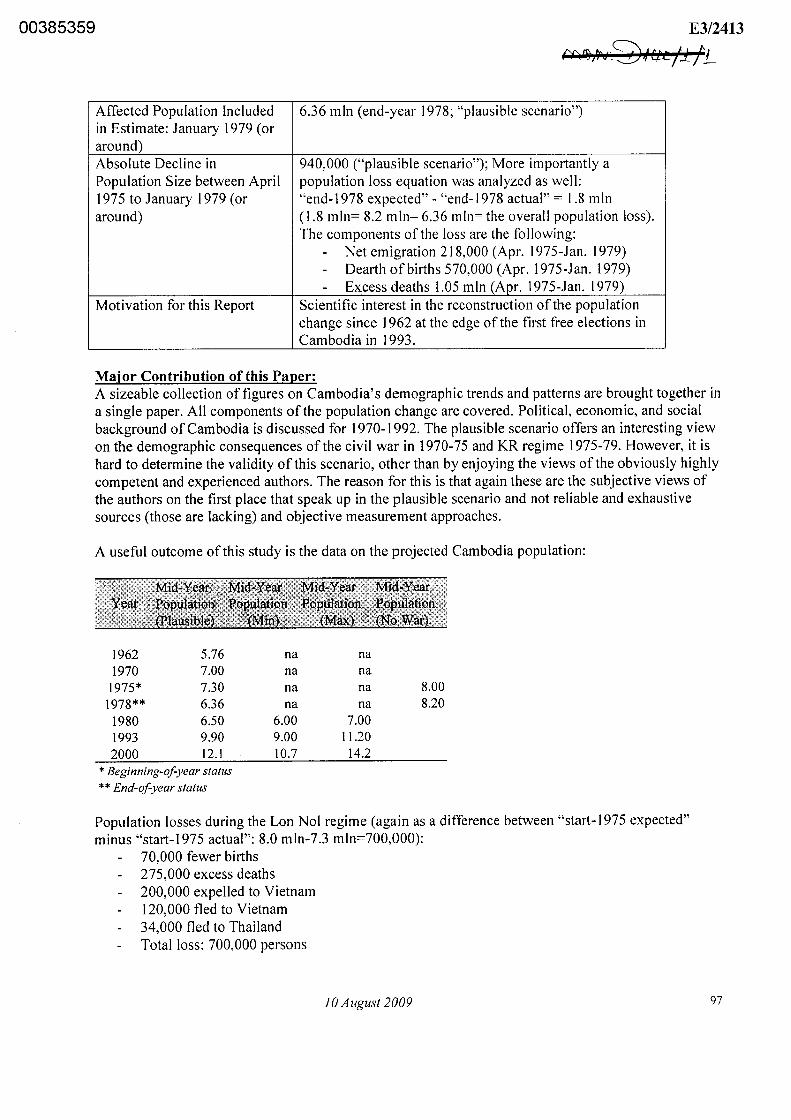
00385359 E3/2413
~~~"~1~ A:t ti ·~ , 0. '1// !__
Affected Population Included 6.36 min (end-year 1978; "plausible scenario") in Estimate: January 1979 (or around) Absolute Decline in 940,000 ("plausible scenario"); More importantly a Population Size between April population loss equation was analyzed as well: 1975 to January 1979 (or "end-1978 expected" - "end-1978 actual"= 1.8 min around) (1.8 min= 8.2 min- 6.36 min= the overall population loss).
The components of the loss are the following: - Net emigration 218,000 (Apr. 1975-Jan. 1979) - Dearth of births 570,000 (Apr. 1975-Jan. 1979) - Excess deaths 1.05 min (Aor. 1975-Jan. 1979)
Motivation for this Report Scientific interest in the reconstruction of the population change since 1962 at the edge of the first free elections in Cambodia in 1993.
Major Contribution of this Paper: A sizeable collection of figures on Cambodia's demographic trends and patterns are brought together in a single paper. All components of the population change are covered. Political, economic, and social background of Cambodia is discussed for 1970-1992. The plausible scenario offers an interesting view on the demographic consequences of the civil war in 1970-75 and KR regime 1975-79. However, it is hard to determine the validity of this scenario, other than by enjoying the views of the obviously highly competent and experienced authors. The reason for this is that again these are the subjective views of the authors on the first place that speak up in the plausible scenario and not reliable and exhaustive sources (those are lacking) and objective measurement approaches.
A useful outcome of this study is the data on the projected Cambodia population:
.' .. ' . \:' { ~ ' , '. •·· :Y~ai-
1962 1970
1975* 1978**
1980 1993 2000
5.76 7.00 7.30 6.36 6.50 9.90 12. I
* Beginning-of year status **End-of year status
na na na na na na 8.00 na na 8.20
6.00 7.00 9.00 11.20 10.7 14.2
Population losses during the Lon Nol regime (again as a difference between "start-1975 expected" minus "start-1975 actual": 8.0 m ln-7 .3 mln=700,000):
70,000 fewer births 275,000 excess deaths 200,000 expelled to Vietnam 120,000 fled to Vietnam 34,000 fled to Thailand Total loss: 700,000 persons
I 0 August 2009 97

00385360 E3/2413
"'£"9~ {y'fd~ b /t rra yv 17
The population of Phnom Penh in April 1975 is estimated at 1.5-2.6 mi II ion.
Another useful outcome is the review of migration flows (see below). For the Khmer Rouge period 1975-78, the following main flows are distinguished:
150,00 Chinese and Khmer Cambodians fled to Vietnam 34,039 Cambodians fled to Thailand 10,400 Cambodians fled to Laos (not included in Table A-1) Other out-migration: about 24,000 (not included in Table A-I) Total of218,000 (184,039 listed in Table A-1)
Table A-1. Cambodia Assumed International Migration
To/From To/From Cambodia net Year Thailand Vietnam inti. migration
1970 0 -195,000 -195,000 1971 -8,500 -30,000 -38,500 1972 -8,500 -30,000 -38,500 1973 -8,500 -30,000 -38,500 1974 -8,500 -30,000 -38,500 1975 -17,038 -37,500 -54,538 1976 -6,428 -37,500 -43,928 1977 -7,045 -37.500 -44,545 1978 -3,528 -37,500 -41,028 .1979 -137,894 100,000 -37,894 1980 -34,586 41,666 7,080 1981 -16 41,666 41,650 1982 -14 41,666 41,652 1983 0 41,666 41,666 1984 -208,995
41,666 -167,329
1985 -70,000 41,666 -28,334 1986 -4,997 41,666 36,669 1987 -5,769 41,666 35,897 1988 -4,410 41,666 37,256 1989 -6,936 41,666 34,730 1990 -1,551 41,666 40,115 1991 -1.157 11.666 40,509 1992 220,000 I 0 220,000 1993 150,000 L 0 150,000
Net Migration -174,364 134,992 -39,372
Note: A positive number indicates migration into Cambodia. A negative number indicates migration from Cambodia to other countries.
Source: Banister and Johnson (1993), Annex A (p. 121 124), Table A-1 (p. 125)
10 August 2009 98

00385361 E3/2413
ESTIMATE BY MAREK SLIWINSKI, 199595
Reported Excess Deaths 1.888 min (24.3% of 1975 population of7.768 min -Hl) or 1.869 min (25.6% of the 1975 population of 7.3 min -H2)
In 1975-1979, 31.2% (32.5%) of the 1975 Cambodian population perished due to natural and revolution-related reasons. Mortality, fertility and migration rates varied substantially across the country. The provinces from which Red Khmers originated experienced five times lower mortality rates then the southern provinces during the 1975-1979 period.
Reported Direct Excess Deaths A minimum of39.3% of all deaths (i.e. murdered; see "causes" below); more likely about 52.5% of all deaths (i.e. murdered and missing).
Time Period Covered April 1975 to January 1979; part of 1970-1989 covered by the survey
Total Number of Months 45; April 1975 to J anuarv 1979 (January not counted) Causes of Death Reported as:
Cause of death Percent of Percent of All Deaths 1975 PoEulation
Murdered 39.30% 12.50% Starved to death 36.30% 11.50% Missing 13.20% 4.20% Natural causes 9.80% 3.10% War related causes 1.60% 0.50%
Source: Sliwinski 's survev Affected Ethnic Groups Reported as:
Minority Death rate 1975-1979
Overall rate 31.2% Vietnamese 37.5% Chinese 38.4% Chams - Muslims 40.6% Khmers - Catholic 48.6%
Source: Sliwinski 's survey Data Sources For excess deaths: Sliwinski's own questionnaire survey
conducted in France, Thailand and Cambodia in 1989-1991. For population size: 1962 Census, Migozzi (1973), Kimmo Kiliunen (ed. 1984), CIA (1980)
Methods for the Overall Author used his own data collected between 1989 and Number of Victims 1991 in a questionnaire survey with respondents in France,
Thailand and Cambodia (details of the survey under this table). In order to extrapolate survey results over the entire Cambodia population he produced population estimates based on the 1962 Census and Migozzi ( 1973) projections.
95 Marek Sliwinski, 1995, "Le genocide Khmer Rouge une analyse demographique", Editions L 'Harmattan, 1995, 175 p.
I 0 August 2009 99

00385362
The projections originally made by Migozzi (until about 1970) were expanded until the end of 1989. Initial assumptions on the population size and structure in 1970 were taken from Migozzi's projections. For the later (post-1970) period, Sliwinski produced birth, deaths and migration rates from his own survey. The population size and structure during the 1970s was reconstructed using those estimated rates and the assumed size and structure of the population in 1970.
Methods for Cause of Death Reports of survey respondents Distribution Affected Population Included 7.796 min (mid-1972; after Migozzi, 1973) in Estimate: mid-year 1970 (or around) Affected Population Included 7.768 min (HI) or 7.3 min (H2) in Estimate: Apri I 197 5 (or 7.566 min (his projection in Table 1 of his book) around) Affected Population Included 5.586 min (his projection in Table I of his book) in Estimate: January 1979 (or around) Absolute Decline in 1.980 min (based on his projections from Table 1 in his Population Size between April book) 1975 to January 1979 (or around) Motivation for this Report Scientific interest and writing demographic history of
Cambodia, 1970-89.
Details of the Study
The Survey The collection of the data for the study commenced in 1989 in France and Thailand and finished in 1991 in Cambodia. The sample consisted of three distinct categories:
1. Cambodians living in France. This category consisted of former intellectual elite or so called "old emigration", people who left Cambodia during the 1960- 1975 period. There were 63 families in this category, which constituted a small, non-representative sample. They were addressed with a pilot questionnaire.
2. Cambodians living in the refugee camps in Thailand near Cambodian border. This category consisted of the former inhabitants of Cambodian provinces of Battambang, Siem Reap and d'Oddar Mean Chhey. In this category, there were also people who combated Vietnam forces -Son Sann guerrillas, Sihanouk guerrillas and Red Khmers. They originated from all Cambodian provinces. This category was represented by 589 families, living in the camp controlled by the Son Sann guerrillas.
3. Cambodia inhabitants. The study area was limited to Phnom Penh and the 150 km radius around it due to security reasons. The sample structure corresponded to the Cambodian population structure in 1970. 644 questionnaires were obtained this category.
JO August 2009 100

00385363 E3/2413
- . 9 'et~ /1 t~ n v v //IJ : 17 1 / ..__
A total number of 1,296 questionnaires were collected, with information on the fate of 13, 163 distinct individuals, as the questionnaire traced the history of the entire family of the interviewed person. The rejection rate equaled to 25%. The questionnaire was aimed to reconstruct the main demographic events of the respondents and their families. It included the following information:
- Enumeration of all family members, living, died or missing after March 1970 (including family members born after that date) - Province of inhabitancy during all major historic periods - Sex, religion, nationality, year of birth, and place of birth - Dates, places and circumstances of deaths and disappearances - Dates, places and circumstances of injuries and other traumatic experiences - Socio-economic status in the past and present - Level of education
Alternative Variants in Sliwinski's Projections The first aim of Sliwinski's analysis was to reconstruct the size and structure of the Cambodian population in the period before April 1975 and estimate the size and direction of internal migration during the 1975-1981 period. This was because the death and extermination rates were considerably different across Cambodia and forced migrations were responsible for the high mortality rate in that period. Reliable statistical estimation of internal migrations is not available for the period 1972-1981. However, it can be assumed that the migration to Phnom Penh (and other big cities) progressed geometrically, reaching up to three 3 min in 1975. Below selected results are included for illustrative purposes. All tables and charts and their numbering are original as in the book by Sliwinski (1995).
Table 1. Evolution of Cambodian Population during the Period of 1962-1981, By Province (p. 26)
sour-cc•: Ann~o ' Ho is :
Prov. /MsJ..lsm:
Phnom. Penh + a9qlom. Kandal ~
TakP.O Kampot Sud-Ou est
Kg Chhn.Jnq tK9 Spcu !Koh Kong Qy.sfil;
I llattnmbanq Pursat. HS!.r.:d-Ql.U::lt
,Siea Rc.ap 'O.M~an.Chh P. Vithcar liQl'..11
St. Tre.nq Ratanakiri Hondulk.ii:-i ~
!lr.Atil:
llr. Vang !:iv. Rieng
K.g 'l'hOln Kg Cham S&ul..<;;.1:
>:D.mb.99.ru:
(1) (1) (I) (2) (J) (2) (2) (2) (2) (2+4) 1962 1968 1972 1974 1975 197S 1975 1978 1979 19111
d6c. d6c. avr~ a.vr. juin d6c. jan.
430 570 1450 1863 3000 2500 142 96 0 281 709 775 765 707 513 604 618 499 492 U6
1139 1375 2215 2570 3513 3104 760 595' 492 897
465 541 SH 4'15 340 401 591 509 502 454 341 414 409 364 261 308 435 )4g 341 303 806 955 943 839 601 709 1026 855 843 757
273 )Jl 32'/ 291 208 245 287 203 200 189 JOO 361 357 317 228 268 299 228 225 290
45 60 59 52 38 45 42 27 27 67 ~26 752 743 660 474 558 628 458 452 546
552 685 676 814 678 798 962 794 704 615 Hl2 22J 220 196 140 165 <44 276 272 150 734 908 896 1010 018 963 1406 1070 1056 765
314 371 J66 326 233 275 334 307 303 408) 60} 50 49 44 31 l7 43 42 41
} 45 45 39 29 34 39 29 29 60 374 466 460 409 293 346 416 378 373 468
35 .. .. 39 28 33 46 .. 48 33 49 56 55 49 35 41 48. 52 51 38 l& 17 17 15 11 13 16 17 17 14 99 117 116 103 74 87 110 118 116 85
126 162 160 144 102 120 ' J17 309 305 134
488 588 581 490 35.2 414. 511 479 <\72. 57< 228 346 341 304 218 2~·1 190 142 14 0 250
f 716 934 922 794 570 671 '161 621 612 824
321 379 314 JJJ 2l9 262 580 454 44B 324 819 977 965 860 616 726 1226 901 889. 915
1140 1)56 lJJ9 1193 655 1008 180& 1J56 1JJ1 12)9
~760 6995 7796 7619 7300 7566 72)0 !>"159 5586 5715
)
'--------'--------·-·-------·-···-···-·-······-······-·····- ----*Sources: (I) Migozzi: (2) MS (cnquclc); (3) CIA; (4) Kiljuncn.
I 0 August 2009
I
I I f I
I
IOI

00385364 E3/2413 ~ •L1 ... 'A ,,
f'Ao@ps11::z; fcr-D/:Lf'
Assumptions regarding fertility, mortality and migration were made using the questionnaire study data. In case of migration, people who left Cambodia for Thailand or France were not represented in the study sample. One can find the exact numbers for migration rates for every province in Cambodia in the book. According to the author, all migrations were forced. Author does not make any assumptions on the natural migration rates.
Khmer Rouge Victims: Selected Results Sliwinski's estimates of excess deaths are computed under two distinct assumptions; so called Hypothesis 1 (Hl) which assumes: population of Cambodia before the Khmer Rouge - 7.768 min; population of Phnom Penh - 2.5 min and Hypothesis 2 (H2) which assumes: population of Cambodia -7 .3 min; population of Phnom Penh - 3 min. Most results in his book are available for the HI hypothesis. Note that neither the HI nor H2 populations are consistent with his population figures in Table 1. Table I provides the structure of the Cambodia population by province and a general context for his study; figures from Table 1 are not used in his extrapolations of survey results.
According to Table 2, the estimated proportion of displaced persons is 46,6% under HI (54, 1 % under H2). Some 2,2% of the population in 1975 managed to escape abroad. Deportation rates varied substantially across provinces. After exclusion of the capital city, only 14,6% of the population was displaced.
Table 2. Proportion of Displaced Population during Khmer Rouge Regime, 1975-1979 (p.32) First column: Proportion of Displaced in a Given Province HI, H2: Prop9rtion of1'J(l~_i5mal Population Displaced by Province under Hl and H2
Province ::
Phno• Penh + 39qloa.• Koh KnncJ•• llv. Rleng Mnda.l
Proportion des d6por~a : Proportion <le popul~tion I
natlon~le d0port6~
Hl I H2 -~·-v-··------ ---->
Kg Sp~u T'a:keo
!Kq Chhnnng Ka"'l"'t
'.Mlrs11:t Pr .. vcn9 Kq Cham Xt) Thom O.M<ian Chhny Siem R<l~P ll<lth!OIJ.l~ Kratlc 1'. Vihear••• i St. Trcnq ••• j Rat.;in.,,kiri••• i Mondu1kiri••• '
l.000 Q,)22 I O.Hl o.5!>9 o.ooJ o.oo:i 0.511 0.020 O.Olft o.471 o.ot:i. I n.oln !t.l66 0,015 tl.<IU n.104 o.oot> o.ooi; o.216 o.oon . o.Qo7 o.1?3 o.oo!I i a.oos 0.171 0,0()4 t <l.004 <;.1<>11 o.ou I o.o1>'l o.l.4-1 o.ou; 0 ... 01._ o. 102 · o. on• o.oM
~: ~:; g: g~~ j g: ~~~ o.o;r1 0.001 : o.oo'.l
? ().()()() o.ooo "! o .. ooo n.ooo '? o.ooo 0400() ? a.ooo o.ooo
0.010 0.001 l 0.(>0l
-··~--·--"'--""------+---'''" ... ~~·- --·y-'l'otal I !l.469 l 0.541 Total ll*••1i 1~xtra!"'oln~... 0.6U o, &71 ·----· --~-·------ ·--~-·---
I
Table 7 shows that during the four years of Khmer Rouge regime 31,8% of the Cambodian population perished or was reported missing and 68.2% were survivors. Among men, some 40.8% died or disappeared and among women 22.6 percent.
JO August 2009 102

00385365 E3/2413
"1"1' 2 '~ 1~ 11 11 ~v nu~/ I -
Table 7. Deaths, Survivors and Missing Persons during Khmer Rouge Regime, 1975-1979 (p. 52) (Total I - Without Missing, Total II - With Missing)
- ---- - -o- - 6 • .., ..,.,. ..... ...,. \\wlt ~UJ
~- .... Jlommes Fcmnes .Enso111blc ·~ .\90 ;
.. 111orts surv .. :mortoc ourv. morts surv. -
0 - 10 22.9 77.l 20.1 79.9 21.6 78. 4 10 - 20 18.4 U.6 14.9 ~ 17 .5 62.s 20 - 30 34.3 65.7 19.l 61.9 26.9 73 .1 30 - 40 40. 0 60.0 20.6 79.4 30.0 '/0, 0 40 - 50 43.4 56 .. 6 25.7 74.J 33.7 66.3 50 - 60 4?.6 50 .. 4 31.7 68.J 40.6 59.4 60 - + fil'.l .... -'! 41.3 47.6 n.4 53.7 46.J Total*! 31.9 li8. l 21.8 "l!l. 2 26.5 73.s Disparus 8.9 o.e 'l'otal•II '40.8 59 .. 2 22.6 77 .4 31. 8 68.2
·-
In Table 8 Sliwinski shows that the Khmer Rouge regime was responsible for the death of 24,3% of the population (Hl; 25,6% under H2).
Table 8. Deaths, Missing Persons and Survivors during Khmer Rouge Regime. By Province (p. 57)
Vict.imea des Province de Mor ts Olsp. Surv. J<h.aers Rouges I l) siijour au ' \ \ \ en 1.000 {:l!} 17.4.1975 lil H2
Pbnolll Penh 34.3 7.6 58.l )4.8 870 lOU Kandal n.2 5.0 57.11 )5. J 204 17) Kouponq Chinn 25.9 2.9 71.2 21. 7 1!17 lJ) Batta:mhang 17.8 2.1 80.l 12.7 107 91 Prey veng 22.4 2.5 7!. .1 18.0 7) 6J Svay Rienq 30.0 4.9 G5. J 27.7 71 60 Ko111pon9 Speu 29.6 2.9 67.6 I 25.5 67 59 l<onpong Chhnang 30.0 0.8 69.2 I 2:).? SB 50 Kampot 19.3 6.7 74.0
I 19. l 58 50
Tak co 18.0 2.4 79,6 D.5 SJ 44 Kon:ponq Thom 22.4 2.4 75.2 17.9 50 42 l>urs3t 20.0 2.1 77.9 lS.2 25 21 Siem Reap l4 .2 0.7 8$ .. s I 7.7 22 18 Koh Kong (J) J l. 2 9.6 ~>9. 2 I 3). 7 15 1J Kratic 8.3 6.2 !JS. S I 7.6 9 7 Oddar Menn Chh~y 9.5 0.0 90. !> ;'!, 6 l 1 Ratanakiri (4) 2.6 l l Stung Treng (4) 2.6 .l 1 Pre~h Vihcar (4) 2.6 1 l Kondulkiri (4) 2.6 0 0
TOTl\L cm 1..000 l.114) l.871 TOTAL en \ 24.)t 25.6\
During Khmer Rouge regime the sex ratio (male/female) dropped from 0,999 to 0, 767. The sex ratio for cohorts in reproductive age was disturbed even more. (Figure 7).
JO August 2009 103

00385366
Figure 7. Sex and Age Mortality Rates during Khmer Rouge Regime, 1975-1979 (p. 53)
r. de mor1s • 60 ,... .... -----------·--------------· ·······----£5!7
; "7
43.4 _,.../ ____ .......
3' 7
60 et •
Age
--··Homme• ff'lflmfll __...... Enaemb:e
Figure 10. Causes of Mortality during Khmer Rouge Regime, 1975-1979 (p. 56) (Assassines =Assassinations; Famine =Starvation; Disparus =Missing; Guerre= War)
10
0 0.50.80.2 -,it.:•
Assassines Famine Olsparus Nature lie Guerre
Causes de la mort *
- Ensemble ~ Hommes 0 Femmes
Figure 12 Mortality Rates By Profession and Education Level, 1975 - 1979 (p. 62) (Officiers - Officers; Policiers - Policemen; Professions Sante - Medical Staff; Pecheurs -Fishermen; Ouvriers - Blue Collars; Ecoliers -Teachers; Paysants - Peasants)
Metier /Education
Offiehm Policlers
Cadre a
Mllltair:t~~~~~~ F anctionnalres
Protculons unte Enso!gnant•
Soldats nan grades Tr ansponeurs
l'bcllours Ou~riers Artlaans
Commercants M<lnagerea
Ecoliers Payunts
Sans ptotession
Education sup~rieure !5555~~~1!! Education seconoai1e "" Education prim a ire u,
Sans education fl .. ...& ... !.t•~ ......... . 0 20 40 60 ao 100
10 August 2009 104

00385367 E3/2413
f0~tor5) Orr/t }'1-
Figure 17. Mortality Rates of National Minorities, 1975 - 1979 (p. 77) .,, '° -~ltl-- 0 .,,
<D ..,, 6 "' a; ~
....: "' .,.,
0 ,..,
"' 0
"'
s
:I: N <I> "' ., <I>
::i: <:: ·c; c .. c: c: "' £
.. ::>
"' ~ E 0 !' S! "" "' ::> 0 0 0 c "' JO E E o; ::> -;;; >< >< > ::;; u " :::> "' ... ,_
f-· £ :? ... ~· .r:: E u r. :.:
Figure 18. Methods of Extermination during Khmer Rouge Regime, 1975 - 1979 (p. 78)
r J
c? ,,,
I
I j
I I
I "' •<l>
"' "' 0 .. ,, "' "' c
'"' 0
(Cranes Ecrases - Skulls Crashed; Par Les Armes De Feu - Fire Weapon; Pendus, Asphyxias - Hanged, Suffocated; Egorges -Throat Cut, Battus A Mort - Beaten To Death, Supplicies En Public - Tortured Publicly)
. -.-·--····-·-···-·--··------'- . ~~·~~ 0 <O
0 l()
0 .., <O ' ro 1 "" _J 0 ,,;;
( <?
'
j 0
"'
~ '
"' ;
e2:JW!SJ ... ; 0
:;) "' .,
.!:! ~ ~ .... C;
x e> E :0 .,. ::> » 0 a. "'
.c; en . .,, "' a. UJ
"' c:
E "' "' "' ::I
::a ;;; "' 0 :S1 ., :> en -~ ~ "O c 0.
;;; ()) u a_ => 0.. (f)
JO August 2009 105
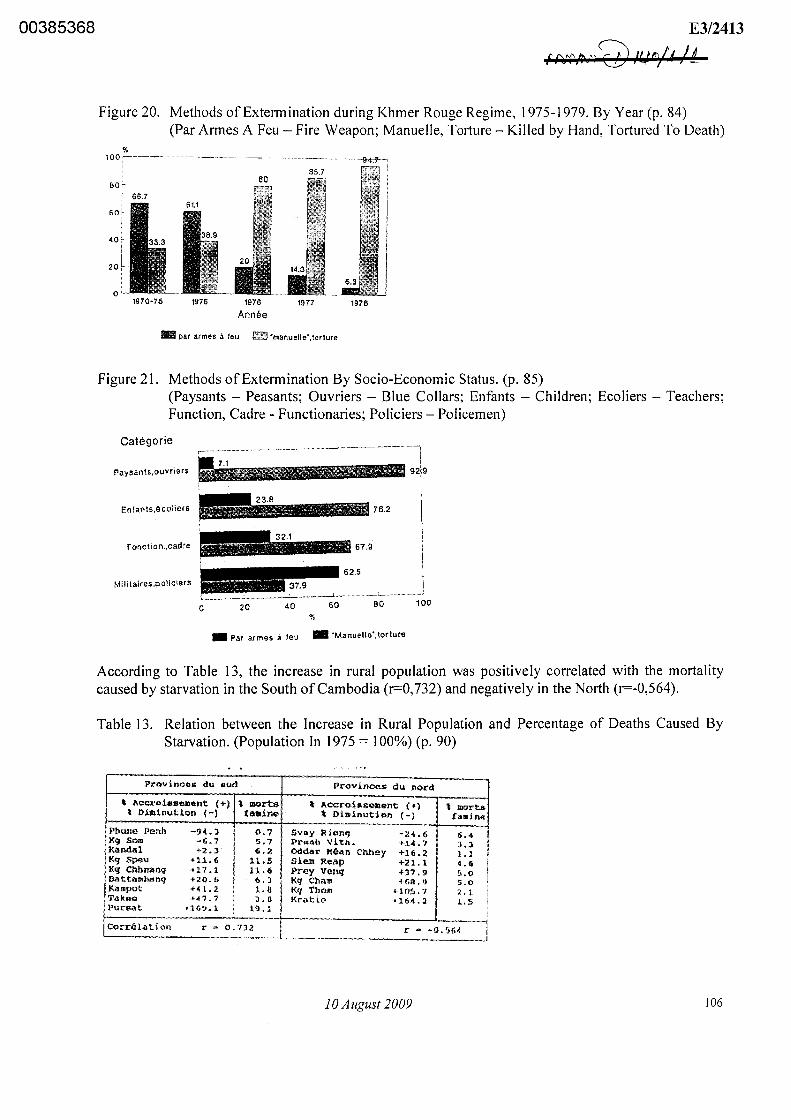
00385368 E3/2413
'"~ 'J> '?Q '~V'~' IA i LX: .. , Pf }
Figure 20. Methods of Extermination during Khmer Rouge Regime, 1975-1979. By Year (p. 84) (Par Armes A Feu - Fire Weapon; Manuelle, Torture - Killed by Hand, Tortured To Death)
')',
100 ,-------·- . -- ·-· ----
1970-76 1975
80
1976
Annee
85.7
1977
llillllll par armes a teu !'.!!~ 'manuelle',torlure
·-·~4:-7-1
1978
Figure 21. Methods of Extermination By Socio-Economic Status. (p. 85) (Paysants - Peasants; Ouvriers - Blue Collars; Enfants - Children; Ecoliers - Teachers; Function, Cadre - Functionaries; Policiers - Policemen)
Categorie ----- • "" -·-•-•• , ___ .. , _ _._ ... --N'W~··-•••~' -·•-••H~• ·-••1
~ 'l'PHi' +92ls Paysan!s,ouvriers
Enfan!s,l!coliers 23.8
r '''' '"' 76.2
Fonction .. cadre
Mili!aires.policiers •••• 62.5
0 20 40 BO 100
%
•Par armes a teu - 'Manuelle',tor!ure
According to Table 13, the increase in rural population was positively correlated with the mortality caused by starvation in the South of Cambodia (r=O, 732) and negatively in the North (r=-0,564).
Table 13. Relation between the Increase in Rural Population and Percentage of Deaths Caused By Starvation. (Population In 1975 = 100%) (p. 90)
l'rovinr;:ei;; du aud
I I \ J\c<::rois.scuaent (+) \ morts " Accro.ia&"1ment (+) ' mart"
t Diainution (-) Cllollline \ Dillliinution (-) !aminq !-P-ho_n_e-Pe-1-ih----'l-4-.-l-r--o-. 7-1-S-va_y_R j..,-n-.,-··------2-<1-. 6---i---··--
1 K9 Soni -ti-1 5.7 PrcAh Vith. ·•·14,7 6
'4
Kandal +L J 6. 2 Oddar l'!&o.n Ch.hey +16. 2 ~: i Kq Spe" +ll.6 j ll.5 Siem Reap +21.1 4.6 Kq Chhnanq +17. l ! l L 6 ! Prey Venq +37. 9 s. o ll&ttamb6nq +20.i; i 6. J 1 Kq Cham +r.11.•) s.o x.1mpot +4 l. 2 \ i. IJ I Kq 'l'bmn ·•· Ul~,.., , ' l
ITakco +47.7, J.11 Kratie "164.2 L.5 ,l•ur.aat -.169.1 ; 19.1 l
:ic~o~r_r~e~l-a __ t-!~.~-~·-;·===~r~--:-~-·-----t-~=·~~---· ________ J
JO August 2009 106

00385369 E3/2413
Main Contribution/Failure of the Paper: To some extent the criticism of small surveys remains valid here as well (see the next author Kiernan). Nevertheless this survey is exceptional:
- It is relatively big, carefully prepared, preceded by a pilot, selected from three different populations of survivors, at three different moments of time etc.
- Its representativeness of the entire country cannot be assessed but most certainly it can be seen as a broad and solid case study.
- Its scope is extensive; not only Khmer Rouge revolution is covered but as well the civil war of 1970-75; comparisons of the two are possible.
- It explores areas of victimization that are of utmost interest to a court of law, such as causes of death, timing of casualties, targeting of ethnic and professional groups, and of urban versus rural populations etc.
The extrapolation of survey results is careful; a majority of the results are reported as percentages and can be applied to any population size. The author provides his best estimates of the Cambodia population in April 1975 (HI and H2); thus obtaining absolute numbers is possible using his population statistics on the first place. Uncertainty of his population estimates is expressed by presenting two different variants (HI and H2) which, however, are quite convergent when it comes to the overall number of excess deaths during the Khmer Rouge period.
A large number of very detailed results are available on various aspects of the victimization process during the Khmer Rouge regime in 1975-1979. These results are extremely valuable from the point of view of legal proceedings. The results can be seen as a large and well documented case study on the victims of Khmer Rouge.
All the above makes this study a worthwhile candidate for recommending its results for use in court. A separate chapter in this report discusses portions of the survey related to the civil war.
10 August 2009 107

00385370 E3/2413
r-A ~ ~' .~ 'tt I, t 1
v< 1 s ~107 ! J »
ESTIMATES BY BEN KIERNAN, 199696 and 200397
Reported Excess Deaths (a) 1.671 min (b) 1.855 min Reported Direct Excess Deaths Not reported Time Period Covered April 1975 to January 1979 Total Number of Months 45; from April 1975 to January 1979 (January not counted) Causes of Death Not reported for the entire country; several surveys
referred to for reporting the percent of murdered people Affected Ethnic Groups All main ethnic and religious groups discussed (see table
below); Chams in great detail: 77,000 killed during Khmer Rouge out of 250,000 initial population of Chams in 1975, plus 10,000 missing newborn babies born (as estimated by Kiernan) in 1975-79. The overall number of killed and missing Chams is thus about 90,000 in 1975-79 (exactly 87,000).
~4~.1 ~~p'};, ···.•;'. .i197~ ':.\.:. •· Popillatloil: ft:t1f.tP~~e~~g~.:·
NEW PEOPLE urban Khmer 2,000,000 500,000 25
rural Khmer 600,000 150,000 25
Chinese (all urban) 430.000 215,000 50
Vietnamese (urban) 10,000 10.000 JOO Lao (rural) 10,000 4.000 40
Total New People 3,050,000 879,000 29
BASE PEOPLE rural Khmer 4,500,000 675,000 15 [Khmer Kron]• 5,000 2,000 40
Cham (all rural) 250,000 90,000 36
Vienamese (rural) 10,000 10,000 JOO Thai (rural) 20,000 8,000 40 upland minorities 60,000 9,000 15
Total Base People 4,840,000 792,000 16
Total Cambodia 7,890,000 1,671,000 21
Note: • nlJI included m Cambodia /o/tlf
Data Sources A number of small scale surveys (listed under this table) were used for drawing or supporting his results. Additional sources on the population size in April 1975 and January 1979: Migozzi (1980), Sampson (1977), Banister and Johnson (1993), Sliwinski (1995), Heuveline (1998), as well as UN (mid-1974; unrevised), and DK estimates.
Methods for the Overall For (a), 1.671 min, no reconstruction was made; (pre 1980 Number of Victims uncorrected) UN projections were used for April 1975, i.e.
7.890 min, and his own informed guesses for the population size of Base and New People as well as of Phnom Penh and other cities (see above). A typically historical qualitative approach was used. First, he reviewed a number of small surveys, some of which were anthropological and related to single villages. Then, the
96 Ben Kiernan, 1996: The Pol Pot Regime: Race, Power and Genocide in Cambodia under the Khmer Rouge, 1975-79. (2008 -Third Edition). Yale University Press. New Haven, London (First edition: 1996). Chpt 11. The End of Pol Pot Regime (The Toll). 97 Ben Kiernan, 2003: "The Demography of Genocide in Southeast Asia: The Death Tolls in Cambodia, 1975-79, and East Timor, 1975-80". Research note, Critical Asian Studies 35:4 (2003 ), pp. 585-597.
JO August 2009 108

00385371 E3/2413
~" ·~ 's t) '~/1 t d rvs ; r u. • :;
results from this review were extrapolated over the entire population by applying estimated rates of those who perished (i.e. were killed, died of indirect war-related causes or went missing); all was done by social group. The rates were generally taken from the reviewed surveys or were produced as his own informed guesses. Kiernan also came up with separate estimates of victims among ethnic groups (Chinese, Vietnamese, Cham, Thai, Lao and "upland minorities").
For (b ), 1.855 min, the general accounting approach was applied, by comparison of the expected and actual population size in 1979 (in January). Components:
• Expected population January 1979: 8.215 min (produced as 1 % annual growth of 7.89 min April 1975 population (his own estimate), minus 150,000 repatriated Vietnamese; 1 % growth covers only the actual natural change; NOT excess deaths)
• Actual population January 1979: 6.36 min (after Bannister and Johnson, 1993)
• Repatriation to Vietnam, 1975-79: 150,000 (already subtracted from ''expected")
• Residual:" 1979 expected" - "1979 actual" (no refugees): about 1.855 min of excess deaths
Methods for Cause of Death NA Distribution Affected Population Included 7.363 min (Migozzi, 1973) in Estimate: mid-year 1970 (or around) Affected Population Included 7.890 min (Kiernan's own) in Estimate: April 1975 (or around) Affected Population Included 6.360 min (Banister and Johnson, 1993) in Estimate: January 1979 (or around) Absolute Decline in 1.530 min Population Size between April 1975 to January 1979 (or around) Motivation for this Report Writing the history of Cambodia, 1975-79
Main Surveys Referred to by Kiernan: Ben Kiernan, 1980: A survey of 500 respondents of whom 100 interviewed in France in 1979 and 400
inside Cambodia in 1980.ln: Ben Kiernan and Chanthou Buoa, 1982: Peasants and Politics in Kampuchea, 1942-198 I. London Zed Books.
Milton Osborn, 1980: A survey of I 00 Khmers among the refugees in camps at the Thai-Cambodian border. In: M. Osborn, 1980: Pol Pot's Terrifuing Legacy. FEER, 6 June 1982, pp.20-22. (Quoted after Kiernan, p. 456).
JO August 2009 109

00385372
Stephen Heder, 1981: A survey of 1,500 refugees on the Thai-Cambodian border in 1980-81 (field data on 15,000 individuals - members of respondents' immediate families). Specific source not available. (Quoted after Kiernan, p. 456)
May Ebihara, 1993: Anthropological survey of a Khmer village of 158 inhabitants in Cambodia (Kanda! province, south of Phnom Penh). In: M. Ebihara, A Cambodian Village under the Khmer Rouge, in Kiernan, 1993: Genocide and Democracy in Cambodia, chpt. 2 (Quoted after Kiernan, p. 459)
Katuiti Honda, 1981: Two surveys in two Khmer villages (one of 168 people and one of 728 people). Journey to Cambodia: Investigation into Massacre by Pol Pot Regime. Tokyo, 1981. (Quoted after Kiernan, p. 459)
Main Contribution/Failure of the Paper: Using small surveys and extrapolation of their results over the entire populations not always can be seen as a reliable measurement method of conflict or violent regime victims. Among the most important reasons the following can be mentioned:
• No sampling mechanism exists that would ensure the sample being representative of all victims; in particular, the random sampling designed as a representation of the exposed population must fail; this is because conflicts and revolutions are not random events; they develop through planned objectives and targeting of certain groups more than the rest of the population.
• Also convenience sampling is unreliable unless many samples are integrated by crossreferencing, merging and duplicate elimination.
• Families who suffered relatively higher losses, and especially the families killed or disappeared in whole, will always be underrepresented in any sampling scheme as they are underrepresented among the survivors from whom respondents are drawn.
• Some sampling schemes can as well produce overrepresentation of clustered deaths if they are designed to be taken from clustered victims' representations.
• There exists recall error which increases with time.
Despite of the above, historical estimates based on extrapolation of sample results and integrated with other multiple sources of information are useful indications of the victimization level. Kiernan never stops in exploring new avenues for estimating the Khmer Rouge victims. His early estimate of 1.5 min victims of Khmer Rouge in 1975-78 (not discussed here), was followed by two next ones, 1.671 min and 1.855 min, each obtained from a different approach. He also integrates his own numbers with estimates of others, and so in his final conclusion the death toll of Khmer Rouge regime in 1975-79 is claimed to be between 1.671 to 1.871 min (the latter after Sliwinski). This desire to present the reader with the best available data is remarkable. The enormous experience Kiernan has as a historian makes his estimates worthwhile.
The general accounting equation he used in his latest estimate (Kiernan, 2003) is not optimal as an estimation method of victims. His earlier approach (Kiernan 1996, 2008) in which he integrated the results of several sources (sample surveys, qualitative interviews with survivors, research results, monitoring reports, personal communications with knowledgeable persons etc.) and applied the estimates rates of those perished to his April 1976 population divided into meaningful social groups is much more convincing.
10 August 2009 110

00385373 E3/2413
ESTIMATE BY PATRICK HEUVELINE, 199898
Reported Excess Deaths 2.2 min (most likely of possible 700,000 to 3.2 min) or 1.5 to 2 min (based on subjective assessment)
Reported Direct Excess Deaths 1.1 min (most likely of possible 600,000 to 2 min) Time Period Covered 1975-1979 (whole years); the famine of 1979-80 might
have caused 500,000 to 650,000 deaths according to various authors; part of these deaths is included in Heuveline's estimate of 2.2 min excess deaths in 1975-79.
Total Number of Months 60; 5 whole years 1975-79 instead 45 months from April 1975 to December 1978
Causes of Death Direct and indirect causes distinguished Affected Ethnic Groups Not distinguished Data Sources Key Sources: 1962 Population Census, 1992 electoral rolls
of the United Nations Transitional Authority in Cambodia (UNTAC) Auxiliary Sources: Large number of sources were used for formulating assumptions for the population reconstruction and large number for assessment of violent and overall excess deaths in 1970-79, 1970-75 and 1975-79 (see "Details of the Method" under this table ... ")
Methods for the Overall Excess deaths are obtained as a residual category from Number of Victims comparing two sets of separately made population
projections: forward 1962-1979, and backward 1992-1980. A well established demographic standard - the intercensal cohort component method was used. The forward projection was based on the 1962 Census and the backward one on the 1992 UNT AC voters register. Assumptions used for fertility, mortality and migration balance resembled the actual trends in 1962-1969 and in 1980-1992. For the period 1970-1979 the trends observed in the 1960s were extrapolated expressing the scenario "what if the 1960s trends continued throughout the 1970s". This approach allows for estimating the population size in Cambodia at the end of the decade 1970-1979, i.e. on 1 January 1980, in the absence of conflict/turmoil. Natural mortality is part of this projection and is accounted for. Parallel, the second projection, from 1992 backwards to 1980, allows estimating the actual population size in Cambodia on 1 January 1980 too. A considerable difference must be (and was) obtained between the population size from the forward and backward modeling; the difference represented the excess deaths in 1970-1979.
Methods for Cause of Death The overall excess deaths were initially estimated for
98 Patrick Heuveline, 1998: "Between One and Three Million: Towards the Demographic Reconstruction ofa Decade of Cambodian History ( 1970-79)". Population Studies No. 52, pp. 49-65. Or: Patrick Heuveline, 1998: "L'insoutenable incertitude du nombre. Estimations des deces de la periode Khmer Rouge", Population, N°6 (Nov-Dec 1998), pp. I I 03-1117.
I 0 August 2009 111

00385374
Distribution 1970-79. Then, a general cause of death distribution was obtained by applying selected model life tables (West model of Coal and Demeny for "Minimum" and Preston, McDaniel and Grushka (1993) high-mortality model for "Medium" and "High")99 to distinguish between non-violent increases in mortality from violent deaths. The result of this step is the distribution of the 1970-79 excess deaths according to two major causes: "violence" and "remaining excess". Both types of deaths are available by age. The estimated violent deaths in 1970-79 are further split into the (pre-Khmer Rouge) 1970-75 and (Khmer Rouge) 1975-79 violent deaths based on a review of the work of others. 300,000 violent deaths were assumed for the civil war, 1970-75 (300,000 are the most likely variant out of 150,000 to 500,000 possible). The following authors were consulted: Sihanouk, 1986; Ea, 1987; Kiljunen, 1984; Hood and Albin, 1987; Banister and Johnson, 1995; Sliwinski, 1995; Hirschman et al., 1995; Barbieri, 1995. Some victims of the 1979-80 famine should be further subtracted from 1975-79 estimates. The overall number (1979-80) might have been up to 500,000-600,000 deaths. For 1979 only a part of it should be taken (e.g. 50%).
Affected Population Included 7.662 min (January 1970) ivv
in Estimate: mid-year 1970 (or around) Affected Population Included Not reported in Estimate: April 1975 (or around) Affected Population Included 6.437 min (January 1980) in Estimate: January 1979 (or around) Absolute Decline in Not Reported Population Size between April 1975 to January 1979 (or around) Motivation for this Report Scientific article in a renowned international demographic
journal.
Details of the Method To address the uncertainty, in each model three variants were made: high, medium and low, which resembled the standard practice in official statistics. The high and low variants were made the most
99 All reference can be found in the 1998 article of Heuveline: "Between One and Three Million: Towards the Demographic Reconstruction of a Decade of Cambodian History ( 1970-79)". Population Studies No. 52, pp. 49-65. The article is the source for this table. 100 Population size in 1970 and 1980 is explicitly reported (Tab 5-1, p. 122) in: Patrick Heuveline, 2001: "The Demographic Analysis of Mortality Crises: The Case of Cambodia, 1970-1979". Chapter in: Holly Reid (ed.): "Forced Migration and Mortality". National Academic Press, USA.
JO August 2009 112

00385375 E3/2413
~ ~· ~ I 4<~ h 14 I I JI o ~ 'I r I
extreme possible, in order to address the range of all possible values of the excess deaths. The extreme maximum and extreme minimum excess variants are highly unlikely and the range of 0.7 to 3.2 min strongly overestimated. The author suggests a far more realistic is the interval of 1.5 to 2 million.
Assumptions Regarding Mortality Based on data from a number of demographic surveys in Cambodia and literate reviews. Pre-1970 period: Demographic surveys for Cambodia, 1958-59; United Nations, 1971, 1984, l 995a; Siampos, 1970. Post-1979 period: Murray and Chen, 1996; Banister and Johnson, 1993; 1982 demographic survey for Cambodia; Huguet, 1991; 1989 Census in Vietnam; Banister, 1993; Barbierie et al., 1995; Martin, 1989.
Assumptions Regarding Fertility Based on data from demographic surveys in Cambodia and literate reviews. The main challenge was in the period before 1970, and not after 1979. Siampos, 1970; Martin, 1989; United Nations, 1995a.
Assumptions Regarding Migration Migration is the main source of uncertainty in the population projections for Cambodia in 1970-79. What is needed are two numbers:
• of migrants that left Cambodia after 1962 and did not return until 1992, • of non-returnees who entered Cambodia after 1962 and were able to register in 1992 elections.
If these two components are erroneously identified (or not identified) they would inflate the residual of the 1962- and 1992-based projections, which represents the excess deaths. An assessment of the abovementioned components is done by an analysis of two types of migration; each based on literature reviews:
Non-Khmer (and Khmer) migration to and from Vietnam: Migozzi, 1973; Ea, 1987; Banister and Johnson, 1993 Migration to and from Thailand: Migozzi, 1973; Ea, 1987; Banister and Johnson, 1993; Hood and Albin, 1987
Major Contribution/Failure of this Paper: A transparent well formulated quantitative approach is presented to obtain reliable figures on excess and violent deaths in the 1970s and in 1975-79 in particular. A formal model is applied with well justified assumptions. The model represents the most up-to-date demographic standard in population projections. The level of subjectivism is relatively low compared with other authors. The author builds up on the work of others but is critical and selective of their results. The separation of violent deaths and their distribution into pre-Khmer Rouge and Khmer Rouge period is certainly convincing. Interpretation of the results could be more focused on the most likely variant as the range of all possible values of the number of victims in 1970s is extremely unrealistically large. Heuveline's estimate needs to be improved by:
including births since 1970 and their mortality separation of victims of starvation in 1979 from the estimated excess in 1975-79 narrowing down the estimated range of victims in 1970s to make it more realistic.
I 0 August 2009 113

00385376
HEUVELINE AND POCH BUNNAK, 2007101
Reported Excess Deaths 1.5-2 min, i.e. about 25% of the 1975 population Estimates related to the Khmer Rouge period were obtained from MIPopLab survey (see "Details of the Method" under this table)
- excess mortality claimed 30% of the 1975 male population
- excess mortality claimed 20% of the 1975 female population
- 45% of parental unions were disrupted by death of at least one spouse
- Shortage of men estimated at 1 man for every 2 women age 15 and more years
Reported Direct Excess Deaths 50% (0.75-1 mln) Time Period Covered Target period: April 1975 to January 1979; survey statistics
cover 1976-78 and 1979-80 Total Number of Months 45; Target period: April 1975-January 1979 (January not
counted) Causes of Death Violent and indirect deaths (fifty-fifty distribution) Affected Ethnic Groups Not discussed Data Sources Heuveline (1998), Kiernan ( 1996), Sliwinski ( 1995)
In addition to the above: - Mekong Island Population Laboratory (MlPopLab)
Methods for the Overall Extrapolation of MIPopLab estimates over the 1975 Number of Victims population of Cambodia. Methods for Cause of Death Not discussed Distribution Affected Population Included Not presented in this paper in Estimate: mid-year 1970 (or around) Affected Population Included Not presented in this paper in Estimate: April 1975 (or around) Affected Population Included Not presented in this paper in Estimate: January 1979 (or around) Absolute Decline in Not presented in this paper Population Size between April 1975 to January 1979 (or around) Motivation for this Report Scientific article in a renowned international demographic
journal
101 Patrick Heuveline and Poch Bunnak, 2007: "The Phoenix Population: Demographic Crises and Rebound in Cambodia". Demography, Vol. 44, No. 2, p. 405-426.
10 August 2009 114

00385377
Details of the Method
E3/2413
ff\;se1!Jo _@I fi-e7~ /!
This article should be seen as a continuation of Heuveline's work from 1998, this time using a micro approach, i.e. data from the Mekong Island Population Laboratory (MIPopLab). MIPopLab builds up on some pilot surveys in Cambodia supported by initial grants from the University of Pennsylvania and University of Chicago, the United States of America. Heuveline established the MIPopLab in collaboration with Cambodian researchers, mostly from the Royal University of Phnom Penh. MIPopLab activities were eventually consolidated under the National Institutes of Health (NIH) grant #R03HD41537, "Demographic Reconstruction in Post-Khmer-Rouge Cambodia." Also today NIH is the source of funding for MIPopLab. 102
MIPopLab is an on-going demographic surveillance system launched in December 2000 in a rural district of Kanda! province (located nearby Phnom Penh). The ~opulation of this district is about 10,000 persons and is questioned systematically once per year1 3 regarding their basic demographics. A special module was designed in the MIPopLab survey to explore demographic consequences of Khmer Rouge regime, including excess mortality, disruptions in marriage formation and reproductive behavior. The module includes births and marriage histories of all women aged 15 to 75 years (2,843 histories were obtained). Data on parental survivorship were collected from all respondents of the Kanda! district. Using this data, several important results were obtained not only on excess mortality but as well on declines in fertility and marriage formation during Khmer Rouge period.
Heuveline notes that regarding demographics, Kanda! district cannot be seen as representative of the entire Cambodia population and not as extreme. He places Kanda! somewhere between the Old and New people; likely closer to the Phnom Penh population than the areas populated by Base people.
Major results for the Khmer Rouge regime: 104
- Crude fertility rates (CFR) in 1976-1978 fell to about two-thirds of their pre-war levels - CFRs rebound was immediate and striking in 1979-80; from 3.7 births per woman in 1976-78 to 7.1
births per woman in 1979-80 105
- Crude marriage rates (CMR) of females aged 15 to 34 years fell to 35% of their pre-war level during 1976-78
- CMRs rebounded as early as in 1979-80 and became 86% higher than the pre-war level, mainly thanks to a significant contribution of remarriages in this period
The overall decline in fertility during Khmer Rouge was caused by a general drop in fertility of married women in reproductive ages and as well by the decline in marriage formation and high proportion of widowed women in the population (20% widows among the female survivors of Khmer Rouge).
Major Contribution/Failure of this Paper: The micro approach of MIPopLab is a worthwhile extension of earlier studies ofHeuveline on Khmer Rouge victims. It broadens and deepens his analysis. It is an important confirmation of earlier results.
102 For MJPopLab details see Heuveline: The Mekong Island Population Laboratory (MlPopLab): Project Description, and Heuveline: MIPopLab Questionnaire. (Parts of the original grant application submitted in to NIH in around 2000). Personal communication of Ewa Tabeau with Heuveline, 26 June 2009. 103 Jn the beginning they were questioned twice a year but at present only one time (personal communication of Ewa Tabeau with Patrick Heuveline and Poch Bunnak, 26 June 2009). 104 Period rates are shown for five-year periods from 1961-65 to 1996-2000, except of the Khmer Rouge period which is divided into two shorter intervals: 1976-78 and 1979-80. 105 For the recent two decades Heuveline shows that TFRs for Kanda! province remain consistently lower by about 21 to 23% than the national estimates.
10 August 2009 115

00385378 E3/2413
NEUPERT AND VIRAK, 2005106
Reported Excess Deaths 1.4 min (out of 2 min in 1970s ); specificallyl .425 min if 275,000 excess deaths in 1970-75 and 300,000 famine in 1979
Reported Direct Excess Deaths Not available Time Period Covered January 1975 to January 1980 Total Number of Months 60; 5 whole years 1975-79 instead 45 months from April
1975 to December 1978 Causes of Death Not available Affected Ethnic Groups Not discussed Data Sources 1962 General Population Census (GPS-1962)
1998 General Population Census (GPS-1998) 2000 Demographic and Health Survey of Cambodia (OHS-2000)
Methods for the Overall Excess deaths estimated as the 1980 residual change in the Number of Victims Cambodia population size as projected from two different
ends: - Forward projection from 1962 Census up until
1970 using the actual change scenario (Siampos, 1970) and continued until I 980 under "normal mortality, actual reduced fertility and actual net migration"107 scenario
- Backward projection from 1998 Census until 1980 using assumptions derived from the DHS-2000
Methods for Cause of Death Not available Distribution Affected Population Included 7.4 min in Estimate: mid-year 1970 (or around) Affected Population Included Not available in Estimate: April 1975 (or around) Affected Population Included 6.8 min (around January 1980) in Estimate: January 1979 (or around) Absolute Decline in 600,000 in 1970-79; The overall population loss between Population Size between April 1970 and 1980 adds up, however, to about 3.3min: 108
1975 to January 1979 (or - Birth deficit in I 970-79: 700,000 (about 200,000 in around) 1970-75 and 500,000 in 1975-79)
- Excess deaths in 1970-79: 2 min - Out-migration in 1970-79: 570,000
The resulting "no-war" population in 1980 would have
106 RICARDO NEUPERT and VIRAK PRUM, 2005: "Cambodia: Reconstructing the Demographic Stab of the Past and Forecasting the Demographic Scar of the Future". European Journal of Population No. 21, pp.2 I 7-246. 107 Net migration (-567,000 in 1970-79) was taken by Neupert and Virak from Banister and Johnson ( 1993). 108 The calculation of the population losses is by the authors of this report based on figures on birth deficit, excess deaths and net migration from Neupert and Virak (2205).
10 August 2009 I 16

00385379 E3/2413
been about 10.7 million. The loss in 1975-79 is about 2.3 min (500,000 births deficit+ 1.4 min excess deaths+408,000 out-migration).
Motivation for this Report Scientific article published in a (Springer) book on war demographics
Major Contribution/Failure of this Paper: The article is based on solid data sources and sound methodology. As a matter of fact, the population projection methodology is the same as that of Heuveline ( 1998). The resulting number of excess deaths in 1970s obtained by Neupert and Virak is, however, considerably different than that of Heuveline (it is lower: 2 min vs. 2.5 min in 1970-79, and 1.4 min versus 2.2 in 1975-79). The authors explain this difference as follows:
smaller volume of net migration in Heuveline (1998) lower normal mortality for the 1970s in Heuveline (1998) the 1970 population was larger in Heuveline (1998); 7.662 min in Heuveline (1998) and 7.4 min in Neupert and Virak (2005)
In addition to the above, it can be said the 1980 population obtained from the backwards approach (6.8 min) is rather high compared with the 1980 population from the Cambodia administrative count (6.6). Huguet (1997) had also run a backwards projection from the 1998 Census until 1980 and produced 6.6 min population for mid-1980. Heuveline's projection for January 1980 was 6.4 min. Thus, yet another factor behind the difference with Heuveline's number of excess deaths is the smaller 1980 population.
All in all, it seems Neupert and Virak produced a relatively low estimate of excess deaths (1.4 min in 1975-78; 1.4 min does not include the estimated 300,000 famine deaths in 1979 and not estimated 300,000 excess deaths in 1970-75), whereas Heuveline's estimate of 1.9 min excess deaths in 1975-78 belongs to higher ones (1.9 min does not include about 300,000 famine deaths in 1979 and not 300,000 during the civil war). 109
A number of similar explanations were provided about differences with other studies (e.g. Banister and Johnson, 1993). The main source of these differences is seen in the estimated 1970 population and assumptions used by various authors.
109 Calculations discussed in this paragraph are all produced by the authors of this report. Some 300,000 excess deaths were assumed in these calculations for the civil war and another 300,000 for the I 979 famine deaths. Subtracting these two components from the excess deaths estimated for I 970-79 makes it possible for us to directly compare figures for exclusively 1975-78. Note that the same assumptions were used for both authors as this was the most straightforward way of comparing these two different numbers.
I 0 August 2009 I 17
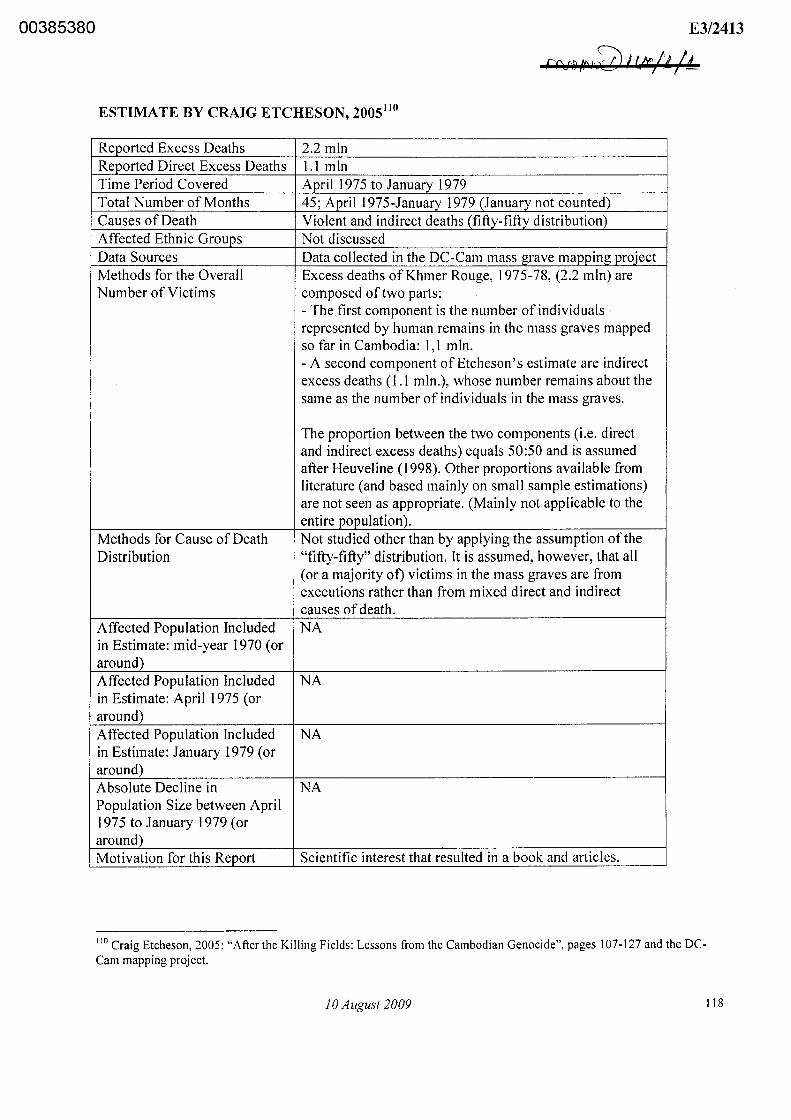
00385380 E3/2413
q;;, "» Iii I· ;:J) I ve IJ. 14 0 I ~ I 7
ESTIMATE BY CRAIG ETCHESON, 2005 110
Reported Excess Deaths 2.2 min Reported Direct Excess Deaths I.I min Time Period Covered April 1975 to January 1979 Total Number of Months 45; April 1975-January 1979 (January not counted) Causes of Death Violent and indirect deaths (fifty-fifty distribution) Affected Ethnic Groups Not discussed Data Sources Data collected in the DC-Cam mass grave mapping project Methods for the Overall Excess deaths of Khmer Rouge, 1975-78, (2.2 min) are Number of Victims composed of two parts:
- The first component is the number of individuals represented by human remains in the mass graves mapped so far in Cambodia: 1, 1 min. - A second component of Etcheson's estimate are indirect excess deaths (1.1 min.), whose number remains about the same as the number of individuals in the mass graves.
The proportion between the two components (i.e. direct and indirect excess deaths) equals 50:50 and is assumed after Heuveline (1998). Other proportions available from literature (and based mainly on small sample estimations) are not seen as appropriate. (Mainly not applicable to the entire population).
Methods for Cause of Death Not studied other than by applying the assumption of the Distribution "fifty-fifty" distribution. It is assumed, however, that all
(or a majority of) victims in the mass graves are from executions rather than from mixed direct and indirect causes of death.
Affected Population Included NA in Estimate: mid-year 1970 (or around) Affected Population Included NA in Estimate: April 1975 (or around) Affected Population Included NA in Estimate: January 1979 (or around) Absolute Decline in NA Population Size between April 1975 to January 1979 (or around) Motivation for this Report Scientific interest that resulted in a book and articles.
110 Craig Etcheson, 2005: "After the Killing Fields: Lessons from the Cambodian Genocide", pages I 07-127 and the DCCam mapping project.
JO August 2009 118

00385381 E3/2413
Main Contribution/Failure of this Paper: It is unquestionable that the data from the DC-Cam mass grave mapping are an essential source on victims of the Khmer Rouge regime in Cambodia. Thus, using this data as the basis for an estimate of victims not only makes a lot of sense but is important and needs to be done. While it is unquestionable that a majority of victims in the mass graves are Khmer Rouge victims (violent or non-violent), the assumption that all victims found in the mass graves were killed in executions or died as result of Khmer Rouge actions and policies, is not justified and might be difficult to prove. A reason for this is that the usual burial practices were forbidden by Khmer Rouge and thus not commonly exercised during this period. Thus, some "natural" deaths might be found in the mass graves too, especially in smaller graves located in a distance from detention and security centers.
Another aspect of the massive death process during the Khmer Rouge period is that many bodies were abandoned and left on the surface exposed to the devastating and quickly progressing atmospheric influences in this region of the world; thus, a large number of bodies were never buried in mass graves but decomposed on the surface. Many other bodies were dropped into rivers, wells, single pits and whatever other (often small) places which were equally strongly exposed to the hot and humid natural environment as the unburied bodies. It is therefore highly probable that the mass grave victims identified today are just a sample of all excess deaths.
The identified graves should be seen as a "burial-place-sample" of all people that died as war victims during that time. After 30 years from the end of the Khmer Rouge era the sample still contains about 1.1 million remains as estimated by the DC-Cam grave mapping project. It is fully possible that the mass graves identified so far comprise about 50% of all buried and unburied individuals. It is possible that the bodies in the graves represent both executed and indirect Khmer Rouge victims; the proportion between them will likely vary between the different graves. In any case, it is a large and important sample and must be further studied for unfolding information about how many, how and when these persons died.
For the above reasons, we consider Etcheson's estimate of2.2 million excess deaths plausible and in line with the most serious attempts of estimating the excess deaths in Cambodia. A worthwhile direction of validating this estimate would be an attempt to reconstruct the number of excess deaths from a randomly selected area using statistical methods (e.g. modeling and projections) and further compare it with the relevant data from the mass grave mapping.
JO August 2009 119

00385382 E3/2413
" ""~ ·· · · iS& J "o 1 f 11 v•v 1rv. r r ;
RENAKSE ESTIMATE, 1983111
Reported Excess Deaths 3,314, 768 excess death Reported Direct Excess Deaths Not discussed; the number of bodies in the grave pits and
in the forest (568,000) are distinguished from the remaining 2.75 min deaths
Time Period Covered April 1975 to January 1979 Total Number of Months 45; April 1975-January 1979 (January not counted) Causes of Death Not generalized; torture and other forms of violent deaths
systematically discussed Affected Ethnic Groups Not generalized Data Sources Renakse petitions collected by the National Front for the
Defense, Restoration, and Solidarity of Kampuchea between 1980 and 1983 (hereafter: the Front)
Methods for the Overall Nation-wide action of the Front; the number of petitioners Number of Victims is estimated at 1, 166,307 Methods for Cause of Death Narratives of the petitioners Distribution Affected Population Included NA in Estimate: mid-year 1970 (or around) Affected Population Included NA in Estimate: April 1975 (or around) Affected Population Included NA in Estimate: January 1979 (or around) Absolute Decline in NA Population Size between April 1975 to January 1979 (or around) Motivation for this Report To some extent political; petitioners made claims that the
Khmer Rouge representatives had to be removed from the UN General Assembly and representative of the new Vietnam-supported government should take their place.
Main Contribution/Failure of this Paper: In the Renakse survey, no preparations in statistical sense were made at all; no standardized questionnaires were used, no trained interviewers were taking statements, no professional personnel was involved in the exhumations. Collecting evidence was a spontaneous effort of the respondents and of actions taken at the initiative of every Research Committee in the country. With regard to the results, no pressure was exercised over the respondents; not over individuals and not over groups, and no instructions were given as to the outcomes of the survey. The country-level statistics in the Renakse Summary Report from 25 July 1983 are biased, however. Renakse final statistics contain duplicates (around 50% according to DC-Cam) and are incomplete at the same time.
111 RENAKSE, 1983: Summary Report of the Research Committee on Pol Pot's Genocidal Regime - "Renakse Summary" and related.
I 0 August 2009 120

00385383 E3/2413
ANNEX 4. Selected Population Projections for Cambodia: NIS and UN Population Prospects of 2008
Table A4.1 Population of Cambodia: 1962, 1970, 1981-1998 (Millions): Observed and Projected
Year NIS 2000 Annual Growth(%) Source 1962 5.700 1962 Census 1963 1964 1965 1966 1967 1968 1969 1970 6.800 unclear 1971 1972 1973 1974 1975 1976 1977 1978 1979 1980 6.590 1980 Population Count 1981 6.700 2.8 1982 6.900 2.8 1983 7.100 2.8 1984 7.300 2.8 1985 7.500 2.8 1986 7.700 2.8 1987 7.900 2.8 1988 8.100 2.4 1989 8.300 2.5 1990 8.600 3.6 1991 8.800 2.3 1992 9.000 2.3 1993 9.300 3.3 NIS Provincial reports 1994 9.869 6.1 1995 10.200 1996 10.340 SESC96 1997 10.368 CSES97 1998 11.437 2.5 1998 Cemsus
Source: NIS, 2000: Cambodia Statistical Yearbook 2000
10 August 2009 121

00385384 E3/2413 oo '@' 1.a :· (±) 'l.t"° IJ ta ~ i«S fl 0 . (} { -
Table A4.2 Cambodia, Demographic Profile, Medium Variant, 1950-2015
Pooulation <thousands) . • .. >:tk• 4 346 4 840 5 433 ti 141 6 <J38 7 O<J8 6 748 8 099 9 690 11 380 12 760 13 866 15 053 16 357 Male population (thousands) ;\:'".;• • 2 173 2 420 2 717 3 072 3473 3552 3124 3815 4615 5475 6181 6754 7374 8052 Female uopulation (thousafids) .·•· ··: .· '" ··. 2 173 2 420 2 716 3 069 3 465 3 545 3 623 4 284 5 075 5 905 6 579 7 112 7 679 8 305 Pooulation sex ratio <males nei'JOO feiiiiile~'l •· (. 100 100 100 !00.I !00.2 HI0.2 86.2 89.1 90.9 92.7 93.9 95 96 97
•· .. Percentage aged 0-4(%} 16.7 16.7 16.9 IU 17.2 15.5 14.4 20.6 18.5 17 13.7 I 13 11.1 I I.I Percentageaited 5·141%) ·· . • ·· . •.. 25.5 25.6 25.6 25.7 26 26.8 26.8 22.6 26.1 29.3 28.2 25.7 21.5 19.4 Percenta1reai!ed 15-241%1 19.4 19.4 19.2 19.1 18.9 · 19.5 21.3 20.2 18.4 16.1 19.6 23.6 23.5 21.4 Percentill(eaged60orover(%) 4.5 4.5 4.5 4.6 4.6 4.7 4.8 4.5 4.4 4.5 4.6 5.2 5.9 6.6 Percentageaged65orPYer{%) ·: ... " 2.7 2.7 2.7 2.7 2.8 2.8 2.8 2.9 2.7 2.8 3 3.1 3.6 4.1
Percenta2e of women~~@~··~··~· =· .. d::2·· ·~·· j==j4~t·~tt===~4~~:~tt===~4 °~7~~ t=::J4~~:~~t=::J4~~:~~t=::J4~~:~;t=~5~~~·~t==4~~~:~t==46~0~.~t==44~0b:~t===0~4!t==i5~C:~tt===i5~t:tt===i5~~:~ Median age (years) .. 18.7 18.7 18.6 18.5 18.3 18.7 18.8 18.1 17.9 17.3 18.3 20.3 22.3 24.2 Population density (population 11erscdanl 24 27 30 34 38 39 37 45 54 63 70 77 83 90
Indicator ..... ·:·· ....... 1950-1955. 1955-196<1 '1!)60it965 .19.~s-1910 mo-i97s; 197$~1980 1980~1985 i9~~19l>d )990~1995. 1995-1000 2900-2905 lOOS-2010 2010-2015 Population change oerve;u-(thousands) 99 119 142 159 32 -70 270 318 338 276 221 237 261 Births oeryeaf, both selies coinbined (thousands) 208 232 260 287 180 232 388 406 432 386 344 360 385 Deaths oer year, both seJ<Cs combined lthinis.inds) 109 113 118 127 158 277 118 118 124 126 125 121 123 Population growth rate(%} •, 2.15 2.31 2.45 1..14 0.46 -I.OJ 3.65 3.59 3.22 2.29 1.66 1.64 1.66 Gude birth rate !births ner l.000 nooulation) ··. o. 45.4 45.2 44.9 43.9 39.9 33.4 52.2 45.7 41 32 25.8 24.9 24 5 Crude death rate (deaths per 1,000 nouulatiori l ·' · 23.8 22.1 20.4 19.4 22.5 40 15.8 13.3 11.7 10.4 9.4 8.4 7.8 Totalfertilitv (children oerwomanl 'Y•• .. 6.29 6.29 6.29 6.2:! 5.54 4.7 6.6 6 5.55 4.45 3.41 2.96 2.7 Net reproduction rate (daughters per wuman) .. · ·. · c 1.85 1.93 2.01 2.08 1.68 0.96 2.4 2.3 2.18 1.77 1.4 1.26 1.18 Infant mortalitv.rate (infant deaths oer 1,000 live birt 165.1 152 139.5 130 180.9 263.2 116.4 97.9 89.8 83 72.4 62.3 52.8 Life exuectancY at birth, both sexes combined (year; 39.4 41.4 43.4 45.4 40.J 31.2 50.7 53.9 55.6 56.4 58.I 60.9 63.3 Life expectancy at birth. males (years) ._., 38.1 40 42 44 39 30 48.9 52 I 53.7 543 55.8 59 61.3 Life exuectancy at birth, females (years) 40.8 42.8 44.9 46.9 41.7 32.5 52.3 55.5 57.2 58.3 60 62.6 65.1
Source: Population Division of the Department of Economic and Social Affairs of the United Nations Secretariat, World Population Prospects: The 2008 Revision, http://esa. un. orglunpp, Friday, July 24, 2009; 11: 19:-16 AM
10 August 2009
2015-2020
270 397 125
1.59 233
7.3 2.53 1.13 43.9 65.6 63.5 67.5
122

00385385 E3n413
fM/f'/ {O IC!c./1 / !__
Table A4.3 Cambodia, Population (thousands), All Variants, 1950-2020
Medium High. Low Constant-Year: wriant variant variant fertility
. variant • 1950· 4346 4346 4346 4346
1955 4 840 4840 4 840 4 840
·•· 1960 ·. 5 433 5 433 5433 5 433 t1965<' .. 6141 6141 6141 6141
:.11970>•.· 6938 6938 6938 6938 T 1975 .. ·:.·· 7 098 7098 7098 7098 .·.1980 .. 6 748 "6 748 6 748 6 748
1985; 8 099 8099 8099 8 099 I ;, •199d::;:H 9 690 9690 9690 9690
j}l995• _;> 11 380 11 380 11380 11380 t~\1~:2000 .: .. ·.•·.· 12 760 12 760 12 760 12 760 :;,2005 13 866 13 866 13 866 13 866 1:;.••.::201u: · 15 053 15 053 15053 15053
.... ~: .. •.;k;J ..:5 '.ti : 16357 16525 16190 16516 ····1f,;f2Q20<··. 17707 18170 17243 18158 ···:;t202s·.···· 18973 19 819 18128 19848
~ 20100 21 331 18 871 21 519 .·
.•· 21121 22 782 19479 23 215 ·:
;2040 S: ; 22086 24292 19955 25024 •2045:::: 22 997 25 886 20288 26991
1.•2050. 23 795 27 474 20448 29092
Source: Population Division of the Department of Economic and Social Affairs of the United Nations Secretariat, World Population Prospects: The 2008 Revision, http://esa.un.org/unpp, Friday, July 24, 2009; 11:19:46 AM
JO August 2009 123