Embed Size (px)
Citation preview

5/2/2013
1
Fi t ti l Utilit I l t ti fFirst practical Utility Implementations of Monitored Withstand Diagnostics in the USA
C. L. Fletcher1, R. N. Hampton2, J. C. Hernandez3, J. Hesse1, M. G. Pearman4, J. Perkel2, C. T. Wall5, W. Zenger6
, S. Stangvik7
1 Duke Energy, 2NEETRAC, 3 Universidad de Los Andes,4 Georgia Power 5 Alabama Power 6PG&E & 7Snopud
2013 IEEE Rural Electric Power Conference (REPC)
4 Georgia Power, 5 Alabama Power, 6PG&E, & 7Snopud
1

5/2/2013
2
GTRI/DoE DisclaimerGTRI/DoE Disclaimer• The information contained herein is to our knowledge accurate and reliable at the
date of publication. • Neither GTRC nor The Georgia Institute of Technology nor NEETRAC will be
responsible for any injury to or death of persons or damage to or destruction of property or for any other loss, damage or injury of any kind whatsoever resulting from the use of the project results and/or data. GTRC, GIT and NEETRAC disclaim any and all warranties both express and implied with respect to analysis ordisclaim any and all warranties both express and implied with respect to analysis or research or results contained in this report.
• It is the user's responsibility to conduct the necessary assessments in order to satisfy themselves as to the suitability of the products or recommendations for the user's particular purposeuser s particular purpose.
• No statement herein shall be construed as an endorsement of any product or process or provider
• Any opinions, findings and conclusions or recommendations expressed in thisAny opinions, findings and conclusions or recommendations expressed in this material are those of the author(s) and do not necessarily reflect the views of the Department of Energy
• This material is based upon work supported by the Department of Energy under Award No DE-0E0000188
2013 IEEE Rural Electric Power Conference (REPC) 2
Award No DE 0E0000188
5/2/2013
3
Introduction• Simple Withstand (Pass / Fail) tests are commonly
l d b H
Introduction
employed by. However– No indication of the Pass margin– No indication if system is healthy enough for withstandNo indication if system is healthy enough for withstand– No indication if system is so healthy that withstand has
little value
• A diagnostic property that is monitored during the withstand test provides additional information– Helps to quantify the Pass margin
• Monitored Withstand data had yet to be collated and
2013 IEEE Rural Electric Power Conference (REPC)
Monitored Withstand data had yet to be collated and analyzed to give assessment criteria
3

5/2/2013
4
Preferred Test ProtocolPreferred Test ProtocolVoltage “Real Time decision
here if you wish to
HOLD
ycontinue Withstand
“Real Time decision here if you wish to curtail orif you wish to curtail or
extend Withstand
RAMP
2013 IEEE Rural Electric Power Conference (REPC) 4
Time30 Mins

5/2/2013
5
Ways Not to Pass a Monitored WithstandWays Not to Pass a Monitored Withstand
Failure – Insulation puncture
OROR
High value of Diagnostic Property
OR
High instability in Diagnostic Property – Measured by standardHigh instability in Diagnostic Property Measured by standard deviation in consecutive measurements at one voltage level
2013 IEEE Rural Electric Power Conference (REPC) 5

5/2/2013
6
Monitored Withstand Eq ipmentMonitored Withstand Equipment
2013 IEEE Rural Electric Power Conference (REPC) 6

5/2/2013
7
Example Tan δ Ramp & Monitored WithstandExample Tan δ Ramp & Monitored Withstand
180 Voltage Elb F il H t L180
160
140
0.51.01.51.7
[p.u.]Voltage
FailureSegment HL_23_22Elbow Failure Hampton Leas
elta
[1e
-3]
120
100
Tan-
de 80
60
40
76543210
40
20
2013 IEEE Rural Electric Power Conference (REPC) 7
Time [min]76543210

5/2/2013
8
After RepairAfter Repair…
180 Voltage Elb F il H t L180
160
140
0.51.01.51.7
[p.u.]Voltage
FailureSegment HL_23_22Elbow Failure Hampton Leas
elta
[1e
-3] 120
100
80
Tan-
de
80
60
40
76543210
20
0
After Failure
2013 IEEE Rural Electric Power Conference (REPC) 8
Time [min]76543210

5/2/2013
9
DukeCarolinasMid West
KeyspanKeyspan
2013 IEEE Rural Electric Power Conference (REPC) 9

5/2/2013
10
Duke
2013 IEEE Rural Electric Power Conference (REPC) 10

5/2/2013
11
Aged XLPE StableAged XLPE - StableAged XLPE
5.0 5
elta
[E-
3]
Low and stable
1.0
Tan
De Low and stable
0.5
2013 IEEE Rural Electric Power Conference (REPC) 11
302520151050Time [min]

5/2/2013
12
3 Phase PILC Not all Phases Test the Same110
100
10.03-Phase Aged PILC
3-Phase PILC – Not all Phases Test the Same
100
90
80
70
E-3
]
A
CriteriaExtension60 Min
minuteDifference 10 minute to 0
60
50
hst
an
d L
ev
el
[E
1.0
Dev
iatio
n (E
-3)
Phase A performs differently from B & C
40
30TD
@ t
he
Wit
h
ABC
Stan
dard
C
CriteriaReduction 15 Min
80604020020
76543210.1
B
magnitudeto Tan DeltacorrespondsSymbol size
2013 IEEE Rural Electric Power Conference (REPC)
806040200Measurement Sequence
7654321Difference 10 mins to 0 mins (E-3)
12

5/2/2013
13
Keyspan
2013 IEEE Rural Electric Power Conference (REPC) 13

5/2/2013
14
Aged EPR UnstableAged EPR - Unstable117
15 30 60117
Aged EPR
116
[E-3
] 116unusualdielectric loss is veryExtended cycle trends of
115
leve
l (2.
2Uo)
115
D [
E-3
]
Mean data50% of
114
D @
IEE
E400
.2
114
TD Mean
Median
boxw ithin
113
112
TD 113
112
2013 IEEE Rural Electric Power Conference (REPC) 14
6050403020100112
Time (mins)
112

5/2/2013
15
How do we know what is Stable & Unstable?
Where do the Criteria come from?
2013 IEEE Rural Electric Power Conference (REPC) 15

5/2/2013
16
Monitored Withstand Criteria• Data from multiple users of MW compiled into database
PG&E
Monitored Withstand Criteria
– PG&E– Duke – Carolinas and Midwest– Georgia Power
S d– Snopud– AEP– Ameren
NEETRAC CDFI– NEETRAC CDFI– IREQ
• Data are segregated by insulation type• Diagnostic properties (Tan δ)
– Stabilitystandard de iation
2013 IEEE Rural Electric Power Conference (REPC)
• standard deviation• difference between 0 & 10 min
– Mean value 16
5/2/2013
17
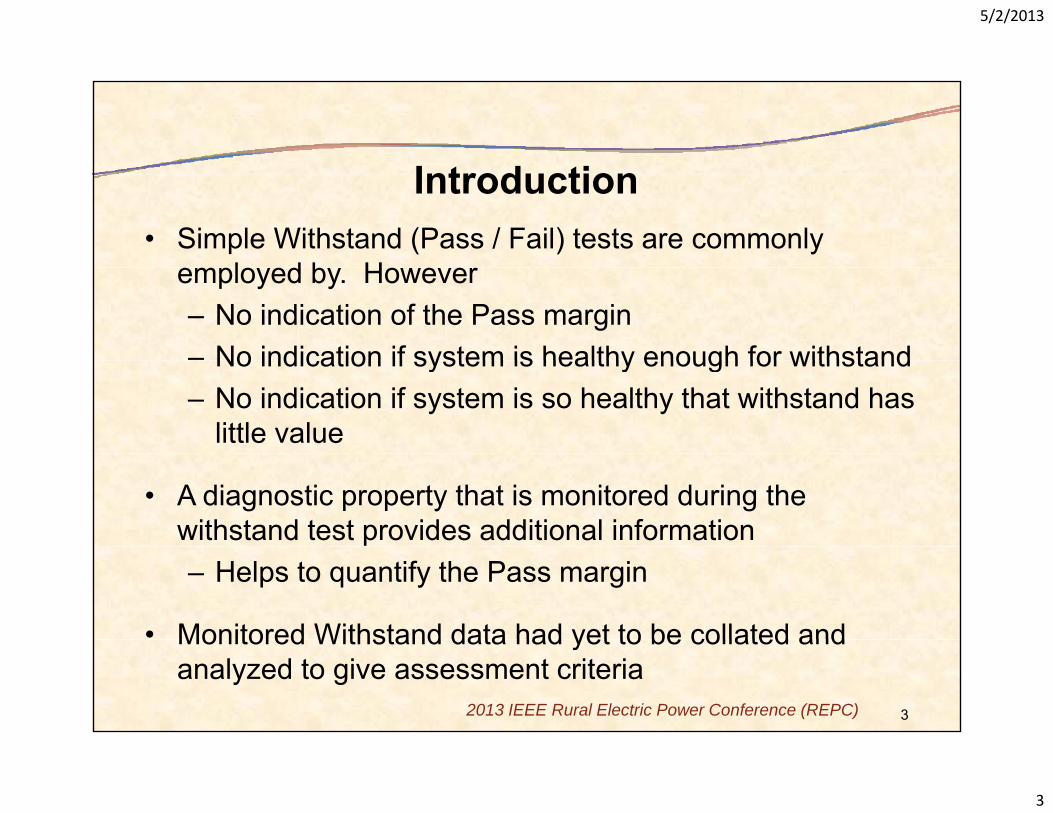
Distribution of Tan δ StabilityDistribution of Tan δ Stability
100
80 80
90
60
rcen
t
40Per
20
0 1.36
2.76
2013 IEEE Rural Electric Power Conference (REPC) 17
543210Std Dev Tan Delta for Monitored Withstand (E-3)

5/2/2013
18
PE B d d PILC R l Ti D i i M kiCondition
Assessment Test Time Tan δ Time Tan δ
PE-Based and PILC Real-Time Decision Making
Assessment after Hold
Period
Guidance within Hold
Period
Change(0 to 10 min)
[E-3]
Stability(std dev)
[E-3]
Mean Tan δ[E-3]
PE-based Insulations (i.e. PE, XLPE, WTRXLPE)( , , )No ActionRequired
Reduce to15 Mins <0.25
and<0.25
and<5
Further StudyAdvised Retain 30 Mins >0.25 and <17 >0.25 and <6 >5 and <45
ActionRequired
Extend to60 Mins >17 or >6 or >45
Paper Insulations (i.e. PILC)No Action Reduce to <1 3 <0 7 <75Required 15 Mins <1.3
and<0.7
and<75
Further StudyAdvised Retain 30 Mins >1.3 and <4 >0.7 and <3.5 >75 and <135
ActionRequired
Extend to 60 Mins >4 or >3.5 or >135
2013 IEEE Rural Electric Power Conference (REPC)
Required 60 Mins
18

5/2/2013
19
Comparison – Georgia Power
Simple Withstandversus
Monitored Withstand
2013 IEEE Rural Electric Power Conference (REPC) 19
5/2/2013
20
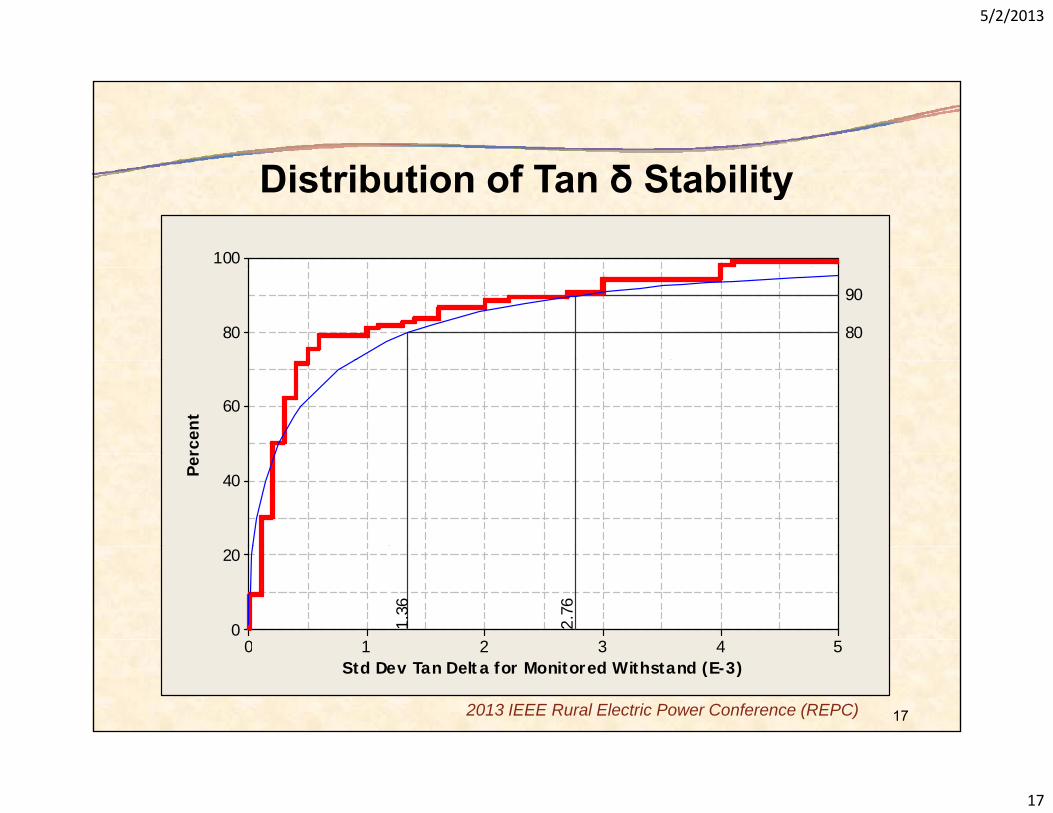
Georgia Power Roswell• Aged XLPE system
Georgia Power Roswell
– 25 kV system– 1000 kcmil conductor
LC shield– LC shield• 18 Segments (6 3-Phase runs) tested using Monitored
Withstand protocolp• All phases tested separately
2013 IEEE Rural Electric Power Conference (REPC) 20

5/2/2013
21
Simple Withstand PerspectiveSimple Withstand Perspective
Individual segment
No Failures On Test
1086420
18 Segments Tested
2013 IEEE Rural Electric Power Conference (REPC)
Length Tested (miles)1086420

5/2/2013
22
Monitored Withstand PerspectiveMonitored Withstand Perspective
Pass Un Stable Loss
Pass - Stable Loss
Pass Un Stable Loss
Pass - Stable Loss
18 Segments Tested
Pass - Un Stable LossPass - Un Stable Loss
30 min test30 min test
1086420 1086420 1086420 1086420
60 min test
1086420
60 min test
2013 IEEE Rural Electric Power Conference (REPC)
Sequence of Lengths Tested (miles)1086420
Sequence of Lengths Tested (miles)1086420
Sequence of Lengths Tested (miles)1086420
Sequence of Lengths Tested (miles)1086420
Sequence of Lengths Tested (miles)1086420

5/2/2013
23
SNOPUDTan Delta – pre test
Monitored WithstandTan Delta - post test
2013 IEEE Rural Electric Power Conference (REPC) 23
5/2/2013
24
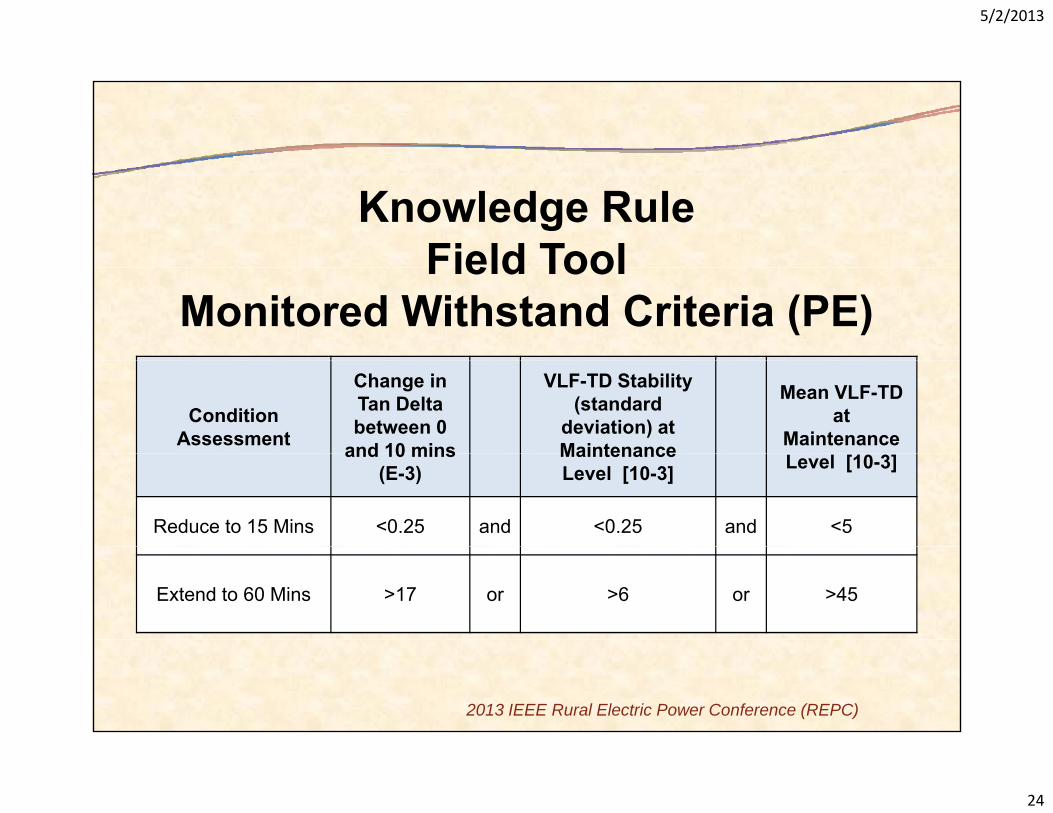
Knowledge RuleField ToolField Tool
Monitored Withstand Criteria (PE)
ConditionAssessment
Change in Tan Delta between 0
and 10 mins
VLF-TD Stability (standard
deviation) at Maintenance
Mean VLF-TD at
Maintenance and 10 mins(E-3)
Maintenance Level [10-3] Level [10-3]
Reduce to 15 Mins <0.25 and <0.25 and <5
Extend to 60 Mins >17 or >6 or >45
2013 IEEE Rural Electric Power Conference (REPC)

5/2/2013
25
Unusual Tan δUnusual Tan δ
1000T t
0.51.01.5
[Uo]Voltage
TestTan δ Stability
Tip UpMean Tan δ
100
elta
[E-
3]
1.5Mean Tan δ
10
Tan
De
302520151050
1
2013 IEEE Rural Electric Power Conference (REPC) 25
302520151050Measurement Sequence [#]

5/2/2013
26
Monitored WithstandSnopud Segment 6912
Monitored Withstand
10
0.51.0
[Uo]Voltage
Test
Tip Up on Tip Up= 12 8Tip Up = 13.4Stability@Uo = 0
10
lta
[E-3
]
1.5
[email protected]=2.7E-3
TD@Uo=1.3Tip Up on Tip Up= 12.8
Tan
Del
3022000
1
2013 IEEE Rural Electric Power Conference (REPC)
302520151050-5Test Time [min]

5/2/2013
27
0 to 10 minsSnopud Segment 6912
0 to 10 mins
0.51.0
[Uo]Voltage
Test
Difference between 10 & 0 mins= -4 5
Change in Tan Delta
b t
VLF-TD Stability
(standard deviation)
Mean VLF-TD at
10
ta [
E-3]
01.52.2
= -4.5 between 0 and 10
mins(E-3)
deviation)at
Maintenance Level[10-3]
TD at Maintenance Level [10-3]
Reduce to
Tan
Del
t Reduce to15 Mins <0.25 <0.25 <5
Extend to60 Mins >17 >6 >45
1
2013 IEEE Rural Electric Power Conference (REPC)
302520151050-5Test Time [min]

5/2/2013
28
0 to 30 mins0 to 30 minsSnopud 6912
0.51.0
[Uo]Voltage
Test
10
ta [
E-3]
01.52.2
Tan
Del
t
1
2013 IEEE Rural Electric Power Conference (REPC)
302520151050-5Test Time [min]

5/2/2013
29
Final Classification RetestFinal Classification - Retest1000
100
0.51.01 5
[Uo]_2Voltage
TestTan δ StabilityTip Up
Mean Tan δ100
elta
[E-
3]
1.5
10
Tan
De
1
2013 IEEE Rural Electric Power Conference (REPC)
302520151050Measurement Sequence [#]

5/2/2013
30
Conclusion• Monitored Withstand data enhances information
il bl f t d d di ti t
Conclusion
available from standard diagnostic measurements
• Practical criteria are available for VLF Tan δ Monitored With t d t tWithstand tests.– Currently in use at several US utilities
• Dual Monitored Withstand tests are also possible but difficult to perform.
Unclear what property/properties to look at– Unclear what property/properties to look at– Combines the benefits of all commonly used offline
diagnostics
2013 IEEE Rural Electric Power Conference (REPC)
g
30


![Abstract. arXiv:2001.02630v1 [cs.PL] 7 Jan 2020 · 2020-01-09 · Nomadic Labs, Paris, France ffirst name.last nameg@nomadic-labs.com Abstract. Tezos is a smart-contract blockchain](https://img.pdfslide.us/doc/110x75/5f05495c7e708231d4123643/abstract-arxiv200102630v1-cspl-7-jan-2020-2020-01-09-nomadic-labs-paris.jpg)