Embed Size (px)
Citation preview

Page 1 of 2
Thursday, April 17, 2014 4:00–5:30PM
6 East 6th Street Lawrence City Hall
City Commission Room
POLICY BOARD AGENDA - REGULAR MEETING
1. Call Meeting to Order and Introductions
(Bryan Culver - L-DC MPO Chair) 2. Action Item: Approval of Minutes from the March 13, 2014 MPO Meeting (see attached
draft minutes) (Bryan Culver - L-DC MPO Chair)
3. Old Business and Correspondence (see attached memo and link to TAC minutes) (Todd Girdler – MPO staff)
a. Project Updates Memo · Lawrence Transit Center Location Analysis Study · Transportation Improvement Program (TIP) Update · Multimodal Studies Project – Final Deliverables
b. Recent TAC meeting minutes
· March 4, 2014 – approved – posted online at http://www.lawrenceks.org/assets/mpo/tac/tacminNov13.pdf after TAC approval and before the MPO meeting
4. Action Item: Action Item: 2012-2015 Transportation Improvement Program – Amendment #9 (see the list of TIP changes and the entire document at www.lawrenceks.org/mpo/tipA9draft)
The MPO staff will present this draft quarterly TIP amendment to the MPO for review and approval. This amendment was posted online for the 15 day public comment period on March 28th. This amendment includes updates to several projects from human service agency/paratransit providers and KDOT.
5. Action Item: Pedestrian Plan Steering Committee (see attached member list) The MPO staff will present a draft list of persons and organizations that are being considered for receiving invitations to serve on the steering committee for this MPO

Page 2 of 2
project. The MPO staff would like the MPO to review, revise if needed, and approve this list before the invitations are sent out.
6. Discussion Item: MPO Pedestrian Plan Scope Summary and MPO Coordination with
Other Pedestrian and Bicycle Advocacy and Advisory Groups
The MPO staff will discuss their ongoing conversations with other groups in the region that are interested in bicycle and/or pedestrian transportation planning. The MPO will present the MPO with a draft scope summary for the Pedestrian Plan and a draft timeline for that project’s completion.
7. Action Item: I-70 Corridor Transit Feasibility Study (see attached final report from
KDOT and approval resolution)
The KDOT consultant presented this report and its findings to the MPO on March 13th and told the MPO at that time that the printed report would be finalized soon. That final printed report was delivered to the MPO staff on March 27th. The MPO staff will now present this final report to the MPO for approval and ask the MPO to direct staff to use this report in making future updates to the T2040-Metropolitan Transportation Plan and other MPO documents as appropriate.
8. Other Business
9. Public Comments This item is to allow brief public comments on items not listed specifically on the agenda. Comments from each individual or organization will be limited to five minutes.
10. Adjournment Next Meeting: The MPO Policy Board will meet next for its regularly scheduled meeting on May 15, 2014 or another date set by the MPO if needed.
Special Accommodations: Please notify the Lawrence-Douglas County Metropolitan Planning Organization (L-DC MPO) at (785) 832-3150 at least 72 hours in advance if you require special accommodations to attend this meeting (i.e., qualified interpreter, large print, reader, hearing assistance). We will make every effort to meet reasonable requests. The L-DC MPO programs do not discriminate against anyone on the basis of race, color or national origin, according to Title VI of the Civil Rights Act of 1964. For more information or to obtain a Title VI Complaint Form, see www.lawrenceks.org/mpo/title6 or call (785) 832-3150.

Page 1 of 2
Lawrence-Douglas County Metropolitan Planning Organization (MPO) Policy Board Meeting Minutes-Thursday, March 13, 2014 Attendance: Organization Name Present Voting Members Lawrence City Commission Michael Dever Lawrence City Commission Bob Schumm Douglas County Commission Nancy Thellman X L-DC Metropolitan Planning Commission Jim Denney X L-DC Metropolitan Planning Commission Bryan Culver X City of Baldwin City Marilyn Pearse Kansas Department of Transportation Davonna Moore X Non-Voting Members Federal Highway Administration Paul Foundoukis Federal Transit Administration Jeremiah Shuler University of Kansas Paul Graves X City of Lecompton Mary Jane Hoffer City of Eudora John Fiore Staff Lawrence - Douglas County MPO Todd Girdler, AICP-CTP X Lawrence - Douglas County MPO Jessica Mortinger, AICP X City of Lawrence-Douglas County Planning & Development Services Dept. Scott McCullough, AICP X
Others KDOT Allison Smith X Olsson Associates Mark Swope X Olsson Associates Tom Worker-Braddock X
1. Call Meeting to Order and Introductions Mr. Culver called the meeting to order at 4:05 PM and introductions were made. 2. Action Item: Approval of Minutes from the February 20, 2014 MPO Meeting Mr. Culver presented the February minutes and asked if there was any discussion. There was none. Approval of the minutes from the February 20th meeting was moved by Mr. Denney, seconded by Ms. Thellman and passed unanimously. 3. Discussion Item: Old Business and Correspondence Mr. Girdler presented the Project Updates Memo included in the agenda packet and the TAC minutes posted online and asked if any members of the Board had additional questions. Mr. Culver asked if there were any questions about the items presented. There were none. 4. Discussion/Action Item: I-70 Commuter Transit Feasibility Study Brian Culver moved this item up on the agenda for the guest presenters. Olsson Associates Consultants, Mark Swope and Tom Worker-Braddock introduced themselves and presented a summary presentation of the study findings. The study was commissioned by KDOT to explore the market demand and corridor feasibility of a commuter transit service based on recommendations

Page 2 of 2
from the 5-County Regional Transportation Study. This I-70 transit study explored a variety of routing and vehicle options based on costs of service and estimated fare box returns. Mr. Denny asked what the vehicle life is of a transit vehicle for this type of service and how the fare amount was calculated. Mr. Swope indicated that the FTA lifetime is 12 years on this type of bus and that the fare used was based on other regional services and an elasticity model. Ms. Moore noted that there is also work ongoing for a Phase 2 at KDOT to investigate opportunities for funding, operators, and to discuss future project needs as the recommendations move towards implementation. Mr. Graves asked if the study included environmental and/or societal benefits in the feasibility study. Mr. Swope indicated that this cost benefit analysis looked purely at the capital and operation costs of the service, recognizing that there are other costs but that analysis wasn’t included in the study scope. The final report is being finalized and will be provided to the MPO as soon as it is done. Following receiving the report, MPO Policy Board members will have an opportunity to review the report and consider it for acceptance and/or approval at a future meeting. 5. Action Item: Reports for the Multimodal Studies Project MPO Staff showed a slide show presentation to highlight the goals and recommendations of each of the final reports for this project. These three studies (Commuter Park & Ride Study, Fixed Route Transit and Pedestrian Accessibility Study, and the Countywide Bikeway System Plan) were created simultaneously and describe a detailed vision for greater multimodal transportation opportunities in the Lawrence-Douglas County Region. The overall goal of this planning effort is to identify and prioritize transportation needs for commuters, pedestrians, cyclists and transit riders for the next 5-to-10 years. Each of these plans/studies has a full report and an executive summary report online at http://lawrenceks.org/mpo/study. Mr. Culver thanked KDOT for the opportunity the funding provided for these studies. Members agreed that these reports are full of recommendations that can be used to improve transportation options. A motion was made to approve the resolution included in the packet for these reports by Ms. Thellman, seconded by Ms. Moore and passed unanimously. 6. Action Item: Addition of a Lawrence-Douglas County Health Department Representative
to the Technical Advisory Committee (TAC) as a Non-Voting Member The MPO staff presented a proposed change to the TAC Bylaws to add a health department representative to the list of non-voting members. This change is being proposed to recognize the close and growing coordination of transportation and public health planning for active transportation issues (e.g., walking and bicycling to school to address childhood obesity) and to provide a means to obtain a public health perspective in the MPO planning process. Mr. Culver indicated that the health department would be a great addition to MPO planning. A motion to approve this TAC Bylaws change was made by Mr. Denney, seconded by Ms. Thellman and passed unanimously. 7. Other Business There was none.
8. Public Comments There was none.
9. Adjournment The MPO Policy Board decided to meet next on April 17, 2014. The meeting was adjourned at 5:12PM.

Memorandum TO: L-DC MPO Members FROM: Todd Girdler, Senior Transportation Planner CC: Scott McCullough, Lawrence-Douglas County Planning and Development Services Director
and L-DC MPO Secretary Date: April 10, 2014 Re: MPO Activity Updates Since the last MPO meeting held on March 13, 2014 the MPO staff has been actively working on several projects. Shown below is a list of selected projects and a brief description of recent work on those items. Lawrence Transit Center Location Analysis Study – the MPO staff has discussed this study with the Lawrence Transit Administrator and it has been discussed at TAC meetings. To date the study still has two sites in consideration (the 21st/Iowa and the 9th/Iowa vicinities) and traffic studies for both of those locations are being done. KU staff and the PTAC (Public Transit Advisory Committee) have expressed their opinion that the 21st/Iowa/Stewart site is preferred. The City Commission is planning to meet soon to discuss their previous decision to prefer the 9th/Iowa/Centennial site and to consider the more recent work that has taken place between the City and KU to plan for the transit center at the 21st/Iowa site. Transportation Improvement Program (TIP) Update – the MPO and KDOT staffs have been discussing the format and timing for the next TIP update and decided to create a new five-year TIP covering 2015 through 2019 with a four-year period 2015-2018 being fiscally constrained and the last year 2019 being added for informational purposes only. This new TIP is now under development with staff now working on text and graphic updates. The TAC members have also been asked to supply project data to the MPO staff soon so the he project tables and related maps can be completed within the next few months. This new TIP is being developed and prepared for MPO approval in August or September to coincide with the ending of FFY 2014. Multimodal Studies Project-Final Deliverables and Project Closeout - the MPO staff has met recently with KDOT staff and decided to withhold the final payment to the consultant until all final deliverables are in hand and to the MPO staff’s satisfaction. The MPO has given the consultant a firm deadline of April 24th to deliver all of the needed electronic files and printed copies. At this point the situation looks like this will be completed by that date and the MPO will be able to process the final payment soon.

Name Organization Designated by1 Independence Inc. - Staff Position2 Independence Inc. Accessibility Taskforce Taskforce Appointed3 Becky Pepper KDOT Bicycle/Pedestrian Coordinator Position4 Lawrence - Douglas County Bicycle Advisory Committee Committee Appointment5 Lawrence - Douglas County MPO Policy Board Board Appointment6 Lawrence - Douglas County Traffic Safety Commission Commission Appointment7 Lawrence Pedestrian Coalition Coalition Appointment8 Livewell Healthy Built Environment Work Group Work Group Appointment9 Public Transit Advisory Committee Committee Appointment
10 Regional Transit Advisory Committee Committee Appointment11 Jamie Lloyd Simpson University of Kansas - KU Accessibility & ADA Education Position12 University of Kansas - Student Student Senate Appointment13 City of Eudora City Appointment14 Baldwin City City Appointment15
Chris Tilden Lawrence - Douglas County Health DepartmentCharlie Bryan Lawrence - Douglas County Health Department
Lawrence Public WorksLawrence Public Works
Todd Girdler Lawrence - Douglas County MPOJessica Mortinger Lawrence - Douglas County MPOBob Nugent Lawrence Transit
Proposed Regional Pedestrian Plan - Steering Committee
Staff

I-70 Transit Feasibility Report - approval
RESOLUTION WHEREAS, the Lawrence-Douglas County Metropolitan Planning Organization (L-DC MPO) is designated as the Metropolitan Planning Organization (MPO) to carry out the Continuing, Cooperative and Comprehensive planning program, including transportation planning; and, WHEREAS, the MPO regional transportation planning process is conducted in order to foster the development of a multimodal transportation system for the region that includes several forms of transportation including walking, bicycling, transit ridership, carpooling/ridesharing, automobile travel, and freight movements; and, WHEREAS, the current Metropolitan Transportation Plan (MTP) for the Lawrence- Douglas County Region (Transportation 2040) includes recommendations for the update and improvement to the region’s multimodal transportation system and recommendations for specific projects that should be made in the foreseeable future to enact those system improvements; and, WHEREAS, the MPO is charged with making changes to their MTP as needed to reflect regionally significant changes in the transportation system infrastructure and/or services, new information about the status and/or performance of the transportation system, new information about proposed projects to improve the transportation system, changes in the priorities for transport system improvements, and other reasons for revising the MTP to better reflect the region’s transportation goals; and, WHEREAS, the MPO noted in the Transportation 2040 MTP that the intent of the MPO is to encourage the development of commuter transit service between Douglas County and Topeka and Metro Kansas City. NOW, THEREFORE BE IT RESOLVED that the Lawrence-Douglas County Metropolitan Planning Organization hereby accepts the I-70 Corridor Transit Feasibility Study as complete, approves the findings and recommendations in that report, and directs the MPO staff to use this report in future work to amend the Transportation 2040 MTP. The Lawrence-Douglas County Metropolitan Planning Organization hereby approves these actions on this 17th day of April 2014.
________________________________ ______________________________ Bryan Culver, L-DC MPO Chairperson Scott McCullough, L-DC MPO Secretary

I-70 Corridor Transit Feasibility Study
I-70 Corridor Transit Feasibility Study Final | March 20th, 2014

I-70 Corridor Transit Feasibility Study
i
Table of Contents Executive Summary ...........................................................................iv
Chapter 1 Introduction ................................................................... 1
Purpose of the Study ........................................................... 1
Study Team Organization .................................................... 1
Study Area ........................................................................... 2
Existing Transit Service ....................................................... 2
K-10 Connector .................................................................... 8
Long-Range Plans ............................................................... 9
Chapter 2 Market Potential .......................................................... 11
Corridor Characteristics Population .................................... 11
Major Employers ................................................................ 12
Commuter Travel Patterns ................................................. 16
Travel Patterns on the Kansas Turnpike ............................ 21
Summary of Commute Travel ............................................ 21
Non-work Attractions .......................................................... 22
Potential Transit Ridership ................................................. 24
Chapter 3 Service Concepts ........................................................ 28
Introduction ........................................................................ 28
Range of Transit Options ................................................... 28
Range of Concepts ............................................................ 29
Initial Concept Evaluation................................................... 35
Chapter 4 Operations Strategy .................................................... 37
Introduction ........................................................................ 37
Evaluation of Route Segments ........................................... 37
Operating Plan ................................................................... 39
Facilities ............................................................................. 40
Capital Costs ..................................................................... 41
Marketing ........................................................................... 43
Chapter 5 Funding Analysis ........................................................ 46
Introduction ........................................................................ 46
Funding Sources ................................................................ 46
Project Phasing Strategies ................................................. 54

I-70 Corridor Transit Feasibility Study
ii
Transit Service Impacts ..................................................... 54
Recommendation ............................................................... 56
Appendix ......................................................................................... A-1
Operations Cost Methodology ..................................................... A-2
Operating Cost Recovery Methodology ....................................... A-3
Tables Table 1 State Employee Vanpools ..................................................... 7
Table 2 Current KCATA AdVANtage Service in the I-70 Corridor ....... 8
Table 3 K-10 Connector Route Average Daily Ridership .................... 9
Table 4 Population of Cities in I-70 Corridor ..................................... 11
Table 5 Employment of Cities in I-70 Corridor .................................. 12
Table 6 Major Employers in Topeka ................................................. 13
Table 7 Major Employers in Lawrence ............................................. 14
Table 8 Major Employers in Kansas City, Kansas ............................ 15
Table 9 Work Trip Movements ......................................................... 16
Table 10 Daily Two-Axle Vehicle Movement between KTA Toll Stations ............................................................................................ 21
Table 11 Events/Activity Centers in I-70 Corridor ............................. 24
Table 12 Coefficients of Commuter Mode Choice Model .................. 27
Table 13 Transit Ridership Forecast Home-to-Work Trip Table ........ 27
Table 14 Commuter Mode Choice User Cost Comparison ............... 29
Table 15 Potential Daily Transit Ridership Demand by Segment ..... 30
Table 16 Operating Characteristics for Concept A ........................... 32
Table 17 Operating Characteristics for Concept B ........................... 33
Table 18 Operating Characteristics for Concept C ........................... 34
Table 19 Operating Characteristics for Concept D ........................... 35
Table 20 Operating Characteristics Summary .................................. 35
Table 21 Expected Farebox Recovery ............................................. 39
Table 22 Capital Costs ..................................................................... 42
Table 23 Preferred Concept Summary ............................................. 43
Table 24 Summary of Revenue Sources .......................................... 47
Table 25 Revenue Sources .............................................................. 53
Figures Figure 1 Study Area ........................................................................... 2
Figure 2 Topeka Transit Routes ......................................................... 3
Figure 3 Lawrence Transit Routes ..................................................... 4
Figure 4 Wyandotte County Transit Routes ........................................ 5
Figure 5 Transit Routes for Downtown Kansas City, Missouri ............ 6

I-70 Corridor Transit Feasibility Study
iii
Figure 6 Rideshare van in Lawrence .................................................. 8
Figure 7 K-10 Connector Route ......................................................... 9
Figure 8 Major Employers in Topeka ................................................ 13
Figure 9 Major Employers in Lawrence ............................................ 14
Figure 10 Major Employers in Kansas City, Kansas….......... ............ 15
Figure 11 Work Trip Movement Flow Map ........................................ 17
Figure 12 State Employees Commuting to Topeka .......................... 18
Figure 13 State Employees Commuting to Lawrence ....................... 19
Figure 14 State Employees Commuting to Kansas City, Kansas ..... 20
Figure 15 Ridership Estimation Study Areas .................................... 25
Figure 16 Model Nest Structure ....................................................... 26
Figure 17 Concept A Strategy .......................................................... 31
Figure 18 Concept B Strategy .......................................................... 32
Figure 19 Concept C Strategy .......................................................... 33
Figure 20 Concept D Strategy .......................................................... 34
Figure 21 Preferred Concept ............................................................ 37
Figure 22 Over-the-Road Coach ...................................................... 42
Figure 23 JCT Brand Distinctions ..................................................... 44

Executive Summary | I-70 Corridor Transit Feasibility Study
iv
Executive Summary
The I-70 Corridor Transit Feasibility Study examined the feasibility of providing transit service operating in the I-70 corridor between downtown Kansas City, Missouri; Lawrence, Kansas; and Topeka, Kansas. Using data from major employers (included the Kansas state government), U.S. Census, and the KTA, the following major movements were identified:
There was not substantial daily travel between KU in Lawrence and KUMC in Kansas City, Kansas.
The largest commuter travel movement in the I-70 corridor is from residents of the Lawrence area to workplaces in downtown Topeka. This level of movement would support regularly scheduled commuter transit service.
There is also movement between residents of Topeka to KU and other major employers in Lawrence. This level of movement would also support regularly scheduled commuter transit service.
The movement between the CBDs of Kansas City, Kansas, and Kansas City, Missouri, with Lawrence and Topeka is less than the movement between Lawrence and Topeka. The movement between Lawrence and the Kansas City, Missouri, CBD is not large enough to consider some level of regularly scheduled transit service.
The movement between Topeka and Overland Park was larger than the movement between Topeka and the Kansas City area (Kansas City, Kansas and Kansas City, Missouri). For that reason, coordination of service between the K-10 Connector and a possible extension of service between Lawrence and Topeka could accommodate this need.
Potential transit modes for addressing this movement include expanding carpooling opportunities, working to create more vanpools, providing bus service on a fixed schedule, and providing fixed guideway options such as commuter rail. The level of transit demand is expected to be large enough to operate bus service. Commuter rail has been studied as an option in the past, and the level of demand estimated in this project is consistent with the past findings, which

Executive Summary | I-70 Corridor Transit Feasibility Study
v
suggest that bus transit would be the most cost-effective strategy in the near term. A series of bus transit options were developed that had different operating characteristics. The concept recommended in this report is a system of two independent commuter bus routes that would meet and interact in Lawrence. The recommended service levels for the initial service between Topeka and Lawrence are to provide three trips at a one hour frequency in each direction in the morning and evening peak periods. Service between Overland Park and Lawrence, already exists in the form of the K-10 Connector, which is operated by JCT. These service levels can be increased with demand.
The most important facility issue related to corridor transit service is identifying a suitable facility and location in Lawrence. Ideally, this location would accommodate the two routes, converging to allow passengers to transfer. Secondly, it would also be beneficial if the site also allowed passengers easy transfer access to the local Lawrence system.
Park and ride locations are also needed throughout this intercity transit system. This would include locations in Lawrence and Topeka. Other facilities would include two stops with bus shelters in Topeka and additional stop locations in Lawrence.
The estimated operating cost for the segment between Lawrence and Topeka is $563,000. The estimated capital cost, including the purchase of vehicles, is estimated at $2.08 million.

I-70 Corridor Transit Feasibility Study
1
Chapter 1 Introduction
Purpose of the Study The purpose of the project is to examine the feasibility of transit service operating in the I-70 corridor between downtown Kansas City, Missouri; Lawrence, Kansas; and Topeka, Kansas. In order to assess feasibility, this study examines existing travel markets along this corridor and the ridership potential generated by these markets. The report also describes potential transit service concepts, estimates operating and capital costs, describes funding alternatives, and lists marketing strategies. The Kansas Department of Transportation (KDOT) has led this project with participation from the Mid-America Regional Council (MARC), the Lawrence-Douglas County Metropolitan Planning Organization (L-DC MPO), and the Metropolitan Topeka Planning Organization (MTPO).
This project was preceded by the 5-County Regional Transportation Study, which studied transportation needs in Douglas, Johnson, Leavenworth, Miami, and Wyandotte counties. The 5-County Study provided an assessment of multimodal transportation needs for the 5-county area, prioritized those needs, and developed strategies to address the needs. Transit strategies were identified in a number of the major travel corridors. The I-70 corridor was found to have the most transit-demand potential of the major regional corridors and was identified as the next intercity corridor to be assessed.
Study Team Organization Olsson Associates is completing this project under contract to the KDOT. Two committees were formed to assist in the development and review of the feasibility study.
Core Team
A core team, comprised of KDOT, MTPO, MARC, and L-DC MPO, provided direct input on tasks being completed.
Advisory Committee
The advisory committee was comprised of current transit providers and the Kansas Turnpike Authority (KTA), which operates and oversees this section of I-70. Transit providers in the study corridor included Topeka Metropolitan Transit Authority (TMTA), Unified Government Transit (UGT), Lawrence Transit (which coordinates service with KU On Wheels, also known as KUOW), Johnson County

I-70 Corridor Transit Feasibility Study
2
Transit (JCT), and the Kansas City Area Transportation Authority (KCATA). The advisory committee provided input on transit recommendations and information on how to coordinate with local transit systems.
Study Area The study area is the I-70 corridor located between Topeka, Kansas, and Kansas City, Missouri. Olsson obtained data and information for the communities adjacent to I-70, including Topeka, Lawrence, Tonganoxie, Edwardsville, and Kansas City, Kansas; and Kansas City, Missouri. Some information has also been obtained for Overland Park, Kansas, because it is a major employment destination and because service concepts may potentially interline with the K-10 Connector transit service. The study area is shown in Figure 1.
Figure 1 Study Area
Existing Transit Service Public transportation is provided in the corridor but is primarily provided within the three metropolitan areas. A transit route does operate on K-10 between Lawrence and Overland Park. The existing transit services in individual communities are summarized below in order to indicate the potential for local circulation that could be connected with an I-70 service. The local transit service includes The Metro, which provides services in Topeka; Lawrence Transit and KUOW, which coordinate service in Lawrence; and UGT, which operates service in Kansas City, Kansas. The KCATA provides transit service in Kansas City, Missouri, as well as portions of Kansas City,

I-70 Corridor Transit Feasibility Study
3
Kansas, and Johnson County, Kansas. Vanpools provide the only commuter oriented public transportation through the corridor.
Topeka
The city of Topeka operates The Metro, which consists of 12 bus routes providing all-day service covering much of the city. The Metro is a hub-based system operating out of the Quincy Street Station in downtown Topeka. Headways are between 45 minutes and one hour. The transit system map for Topeka Transit is shown in Figure 2.
Figure 2 Topeka Transit Routes
Source: www.topekametro.org
Lawrence
The city of Lawrence operates the Lawrence Transit, which consists of nine routes providing all-day service into early evenings and on Saturdays. Lawrence Transit is a hub-based system that operates to and from Lawrence’s downtown hub currently 7th and Vermont
I-70 Corridor Transit Feasibility Study
4
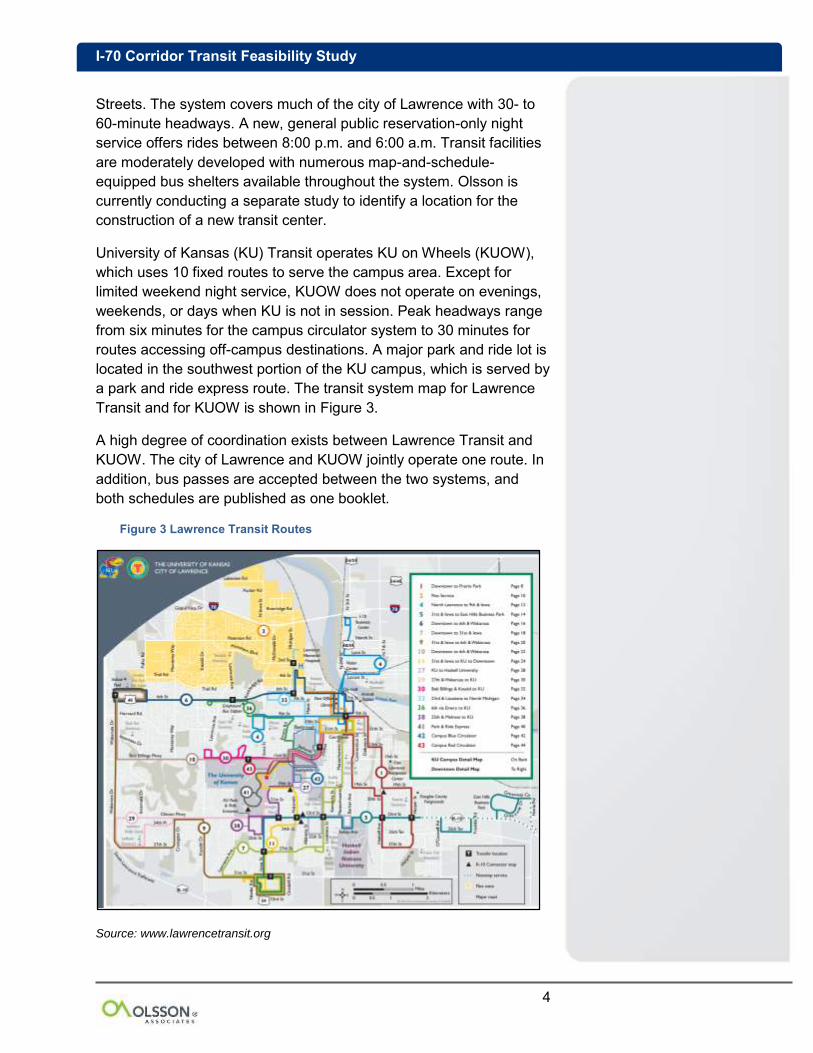
Streets. The system covers much of the city of Lawrence with 30- to 60-minute headways. A new, general public reservation-only night service offers rides between 8:00 p.m. and 6:00 a.m. Transit facilities are moderately developed with numerous map-and-schedule-equipped bus shelters available throughout the system. Olsson is currently conducting a separate study to identify a location for the construction of a new transit center.
University of Kansas (KU) Transit operates KU on Wheels (KUOW), which uses 10 fixed routes to serve the campus area. Except for limited weekend night service, KUOW does not operate on evenings, weekends, or days when KU is not in session. Peak headways range from six minutes for the campus circulator system to 30 minutes for routes accessing off-campus destinations. A major park and ride lot is located in the southwest portion of the KU campus, which is served by a park and ride express route. The transit system map for Lawrence Transit and for KUOW is shown in Figure 3.
A high degree of coordination exists between Lawrence Transit and KUOW. The city of Lawrence and KUOW jointly operate one route. In addition, bus passes are accepted between the two systems, and both schedules are published as one booklet.
Figure 3 Lawrence Transit Routes
Source: www.lawrencetransit.org

I-70 Corridor Transit Feasibility Study
5
Wyandotte County
Transit service within Wyandotte County is provided by Unified Government Transit’s (UGT) “The Bus” and through service contracted to the KCATA. Through both service providers, the more-urbanized areas within the county have all-day transit service with weekend and evening service. The Bus operates four fixed routes and jointly operates one route with KCATA. The KCATA service operates five routes into Wyandotte County that connect with Jackson County, Missouri. A route with many of the characteristics of Bus Rapid Transit (BRT)—branded as a Connex Route—operates between Village West (Kansas City, Kansas) and downtown Kansas City, Missouri, primarily along State Avenue in Kansas City, Kansas. Transit stations are located along the route, with a route transfer center located near I-635 and State Avenue and in downtown Kansas City, Kansas. The transit routes servicing Wyandotte County are shown on the map in Figure 4.
Figure 4 Wyandotte County Transit Routes
Source: www.kcata.org

I-70 Corridor Transit Feasibility Study
6
Kansas City Downtown Area
Transit service in the downtown area of Kansas City, Missouri, is provided by the KCATA. The KCATA operates transit routes throughout much of Kansas City, Missouri, and other communities. Two BRT lines operate out of downtown Kansas City, Missouri on Main Street and Troost Avenue. A downtown transfer station is located at 10th and Main streets. A two-mile-long streetcar line is now under construction, extending between Third Street and Grand Boulevard to Union Station at Main and Pershing. All of these services will provide circulation to many destinations in the Kansas City downtown area. Figure 5 displays the downtown route system.
Figure 5 Transit Routes for Downtown Kansas City, Missouri
Source: www.kcata.org
I-70 Corridor Transit Feasibility Study
7
Vanpools and Carpools
Current transit service between Topeka and Kansas City is provided by ridesharing. Ridesharing includes both carpooling and vanpooling. A carpool is where two or more people share a ride in a private vehicle. Carpools generally have two or more passengers who live in the same neighborhood or along the same route and who use a private vehicle to travel to common or nearby destinations. A vanpool is a larger group of people who share a ride in a prearranged vehicle.
MARC’s RideShare program provides resources for commuters to organize either carpools or vanpools. Commuters interested in carpooling can be matched with commuters of similar travel patterns using the free web portal “RideShare Connection.”
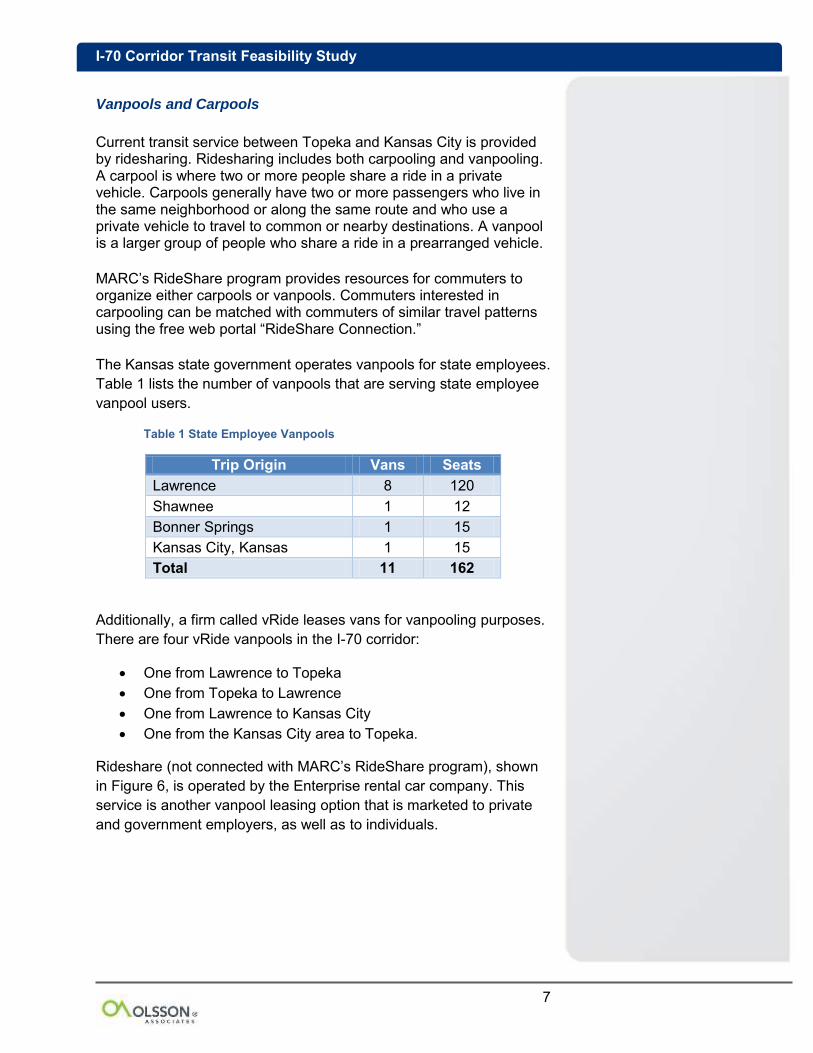
The Kansas state government operates vanpools for state employees. Table 1 lists the number of vanpools that are serving state employee vanpool users.
Table 1 State Employee Vanpools
Trip Origin Vans Seats Lawrence 8 120 Shawnee 1 12 Bonner Springs 1 15 Kansas City, Kansas 1 15 Total 11 162
Additionally, a firm called vRide leases vans for vanpooling purposes. There are four vRide vanpools in the I-70 corridor:
One from Lawrence to Topeka One from Topeka to Lawrence One from Lawrence to Kansas City One from the Kansas City area to Topeka.
Rideshare (not connected with MARC’s RideShare program), shown in Figure 6, is operated by the Enterprise rental car company. This service is another vanpool leasing option that is marketed to private and government employers, as well as to individuals.

I-70 Corridor Transit Feasibility Study
8
Figure 6 Rideshare van in Lawrence
The KCATA operates the AdVANtage vanpool program. Participants can utilize the commuter service if there are at least six participants and if one of the trip ends occurs in the KCATA service area.
Table 2 Current KCATA AdVANtage Service in the I-70 Corridor
Trip # of Seats Lawrence to Hallmark in Kansas City, Missouri 8
Lawrence to Aptuit (102nd and Hickman Mills) 11
Leavenworth to Crown Center 7 Lawrence to downtown Kansas City 8 Topeka to Kansas City Social Security Administration 8
Topeka to Hallmark 7 Lawrence to Hallmark 7 Leavenworth to Federal Building in Kansas City, Missouri 7
K-10 Connector The transit service in the K-10 corridor between Lawrence and Overland Park provides an example of a regional intercity public transit service that could be emulated in the I-70 corridor. The K-10 Connector is an all-day, limited-access, long-haul route between
Source: Olsson AAssAssociates

I-70 Corridor Transit Feasibility Study
9
Lawrence and Overland Park. The service connects the KU main campus in Lawrence with the KU Edwards Campus located at 127th Street and Quivira Road in Overland Park. The service also provides a connection to the Johnson County Community College, as well as being available for other trip types for the general public. The route has 30-minute peak frequency and 60-minute off-peak frequency, with a service span of 6:00 a.m. to 11:20 p.m. from Monday to Thursday. Night service is not offered on Fridays. Reduced schedules operate during the summer and other school breaks. While average daily ridership was 606 in 2013, it ranged, depending on the time of year, from 1,100 during the first few weeks of the school semester to 90 on Spring Break. This success has led to the consideration of additional regional connection routes, such as service within the I-70 corridor being evaluated as part of this project. Additional ridership information for the K-10 Connector Route can be found in Table 3.
Table 3 K-10 Connector Route Average Daily Ridership
Time of Year Average Daily Ridership Regular Schedule 813 Summer Schedule 330 Spring Break 90 Average Daily Ridership 606
Source: Johnson County Transit
Long-Range Plans Each of the long-range transportation plans completed by the three Metropolitan Planning Organizations located in the I-70 corridor (MTPO, MARC, and L-DC MPO) includes consideration of commuter transit service on I-70.
Transit service on I-70 is specifically identified in the MTPO 2040
Long-Range Transportation Plan. This service is shown as part of a regional transit concept. The full-service concept includes regional transit connections between Topeka and Manhattan, Emporia, Lawrence, and Kansas City.
The L-DC MPO Long-Range Transportation Plan encourages developing and funding commuter bus services between Douglas County and the Topeka and Kansas City metropolitan areas. The plan also notes that there have been local/regional discussions in recent years about the desire for commuter rail services between Topeka, Lawrence, and metro Kansas City locations. Service options with a Kansas City rail hub have been mentioned, but commuter-oriented passenger rail service running through Lawrence has not moved
Figure 7 K-10 Connector Route
Source: www.thejo.com

I-70 Corridor Transit Feasibility Study
10
beyond initial feasibility discussions. The Long-Range Transportation
Plan concludes that the focus of commuter services for the foreseeable future will be in the form of express bus services instead of rail.
MARC developed the Kansas City area long-range transportation plan and transit plan entitled Smart Moves, which indicates express transit service along I-70 from the western edge of the metropolitan area and potentially further west to Lawrence and Topeka, to the Central Business District (CBD) of Kansas City, Missouri. MARC and member organizations are moving to implement corridors identified in Smart
Moves. The I-70 service and the connections provided are important to the implementation of the overall Smart Moves plan.

I-70 Corridor Transit Feasibility Study
11
Chapter 2 Market Potential
The purpose of this chapter is to describe the potential use of public commuter-oriented transportation in the I-70 corridor. This includes an overview of population and employment characteristics. Information has been obtained from major employers (including the Kansas state government), U.S. Census, and the KTA that shows current commuter travel patterns with particular attention given to longer-distance travel in the I-70 corridor. From this information, potential markets along the I-70 corridor have been identified and potential ridership estimated.
Corridor Characteristics Population The population of the cities located in the I-70 corridor is listed in Table 4. City population provides a broad indication of the overall scale and potential related to the origin trip end for transit service. Populations for the Village West area in Kansas City, Kansas, and the downtown core areas of Kansas City, Missouri, Kansas City, Kansas, and Lawrence, are also provided.
Table 4 Population of Cities in I-70 Corridor
Location Population Kansas City, Missouri 459,787 Downtown Area1 8,393 Kansas City, Kansas 145,786
Downtown Area2 1,507 Village West Area3 19 Edwardsville 4,340
Bonner Springs 7,314
Tonganoxie 4,996
Lawrence 87,643
Core Area4 8,600 Topeka 127,473
Total (excluding sub-areas) 837,339 Source: 2010 U.S. Census
(1) Geographical Boundary: Within the I-670 downtown loop
(2) Geographical Boundary: Washington Boulevard, I-70,
Tauromee Avenue, and N. 10th Street
(3) Geographical Boundary: Parallel Parkway, I-435, I-70, and
N. 118th Street
(4) Includes portions of North Lawrence, downtown, and west campus of KU

I-70 Corridor Transit Feasibility Study
12
Employment
Since the potential service would cater primarily to commuters, attention has been given to the type and location of employment in the I-70 corridor. The number of employees who work in the cities located in the I-70 corridor is listed in Table 5. These figures provide broad indication of the overall scale and potential related to the destination trip end for transit service. The employment in the downtown areas has been listed separately for the larger communities and indicates a higher employment concentration in these areas.
Table 5 Employment of Cities in I-70 Corridor
Location Employment Kansas City, Missouri 265,472 Downtown Area1 69,677
Kansas City, Kansas 64,170 Downtown Area2 9,494 Village West Area3 5,237 Edwardsville 1,993
Bonner Springs 2,912
Tonganoxie 1,072
Lawrence 43,480
Core Area4 14,140 Topeka 89,446
Downtown Area5 14,623 Total (excluding sub-areas) 468,545 Source: U.S. Census Bureau. 2013. OnTheMap Application.
Longitudinal-Employer Household Dynamics Program.
http://onthemap.ces.census.gov/
Notes:
(1) Geographical Boundary: Within the I-670 downtown loop
(2) Geographical Boundary: Washington Boulevard, I-70,
Tauromee Avenue, and N. 10th Street
(3) Geographical Boundary: Parallel Parkway, I-435, I-70,
and N. 118th Street
(4) Includes portions of North Lawrence, downtown, west campus of KU
(5) Per MTPO and U.S. Census
Major Employers Table 6 through Table 8 list the major employers in the I-70 corridor, and Figure 8 through Figure 10 show where they are located. Larger concentrations of employment provide additional opportunities for commuter-related transit. The largest employer is the State of Kansas in Topeka, KU in Lawrence, and the University of Kansas Hospital and Medical Center (KUMC) in Kansas City, Kansas. Other large employers include Stormont-Vail HealthCare and General Motors.

I-70 Corridor Transit Feasibility Study
13
Major employers in each city were approached to gather additional information about potential employee demand for transit service in the corridor. Through discussions, the employers were supportive of the project, and provided basic information on commuting patterns. As this project moves forward, the major employers should be contacted to further coordinate operational details.
Table 6 Major Employers in Topeka
Rank Name Employees 1 State of Kansas 6,438 2 Stormont-Vail HealthCare 4,418 3 Topeka USD 501 (public schools) 2,418 4 U.S. Government 2,069 5 St. Francis Health Care 1,700 6 Goodyear Tire and Rubber 1,550 7 Joint Force Headquarters 1,325
8 Blue Cross and Blue Shield of Kansas 1,355
9 Wal-Mart and Sam's Club 1,175 10 Washburn University 1,220
Total 23,668 Source: CJOnline, 2013-03-09
Figure 8 Major Employers in Topeka
Source: CJOnline. 2013-03-09

I-70 Corridor Transit Feasibility Study
14
Table 7 Major Employers in Lawrence
Rank Name Employees 1 KU 9,881 2 Lawrence Public Schools 1,650 3 Vangent 1,500 4 City of Lawrence 1,455
5 Lawrence Memorial Hospital (LMH) 1,322
6 Berry Plastics 739 7 Hallmark Cards, Inc. 525 8 Amarr Garage Doors 461 9 Douglas County 435 10 The Olivia Collection 320
Total 18,288 Source: www.businessforlawrence.com
Figure 9 Major Employers in Lawrence
Source: www.businessforlawrence.com www.businessforlawrence.com

I-70 Corridor Transit Feasibility Study
15
Table 8 Major Employers in Kansas City, Kansas
Rank Name Employees 1 University of Kansas Hospital 4,500 2 General Motors 3,957
3 Kansas City, Kansas, Public Schools, USD #500 3,500
4 University of Kansas Medical Center (KU Med) 3,100
5 Unified Government of Wyandotte County/Kansas City, Kansas 2,100
6 Associated Wholesale Grocers 1,300 7 Burlington Northern-Santa Fe Railroad 1,200 8 United Parcel Service 907 9 Teletech 825
10 Kansas City, Kansas, Community College 750
Total 22,139 Source: www.wycokck.org
Figure 10 Major Employers in Kansas City, Kansas
Source: www.wycokck.org

I-70 Corridor Transit Feasibility Study
16
Commuter Travel Patterns Commuter travel patterns indicate the connection between where people live and where they work. These patterns were determined from the Year 2010 Census Longitudinal Employer-Household Dynamics (LEHD) program. The LEHD program produces public-use information combining federal, state, and Census Bureau data on employers and employees under the Local Employment Dynamics (LED) Partnership. The LEHD data provides a dataset that describes geographic patterns of employees by their employment locations and residential locations as well as the connections between the two locations.
The work trip travel movements reported by LEHD for communities located in the I-70 corridor are shown in Table 9 and Figure 11. The information shows the number of workers living in each community and then the location of their employment. The larger intercity movements are Lawrence to Topeka (2,611), Lawrence to Overland Park (2,049), Topeka to Lawrence (1,611), Overland Park to Topeka (1,054), and Overland Park to Lawrence (1,042).
Table 9 Work Trip Movements

I-70 Corridor Transit Feasibility Study
17
Figure 11 Work Trip Movement Flow Map
Trip Patterns of Selected Major Employers
Additional information on commuting patterns was obtained from the home zip codes of state agency employees. This information provided residence zip codes for state employees who work in Topeka, Lawrence, and Kansas City. The pattern of employment distribution is similar to that provided by the 2010 Census. However, the information provides additional detail and specific commuting information for specific employers. Figure 12, Figure 13 and Figure 14 display the state employee commuting patterns to Topeka, Lawrence, and Kansas City. In addition, the major employers of the corridor—St. Francis Medical Center and Stormont-Vail Healthcare in Topeka, Barry Plastic in Lawrence, and Cerner Corporation in the Village West area of Kansas City, Kansas—were inquired regarding the trip patterns of their employees.

I-70 Corridor Transit Feasibility Study
18
Figure 12 displays the home zip code locations in the I-70 corridor for state employees working in Topeka. The map indicates that the largest concentration of employees live in Topeka, with another sizable concentration of several hundred in Lawrence. The numbers of employees working in Topeka and living east of Lawrence are significantly fewer than those living in Topeka or Lawrence.
Figure 12 State Employees Commuting to Topeka

I-70 Corridor Transit Feasibility Study
19
Figure 13 displays the home zip code locations in the I-70 corridor for state employees working in Lawrence. The map indicates that the largest concentration of employees live in Lawrence, with concentrations in both Topeka and the area east of Lawrence and a fewer number in Kansas City, Missouri.
Figure 13 State Employees Commuting to Lawrence

I-70 Corridor Transit Feasibility Study
20
Figure 14 displays the home zip code locations in the I-70 corridor for state employees working in Kansas City, Kansas. The map indicates that the largest concentration of employees live in Kansas City, Kansas, and Kansas City, Missouri. Some employees live in Lawrence, and few employees who work in Kansas City, Kansas, live in Topeka.
Figure 14 State Employees Commuting to Kansas City, Kansas

I-70 Corridor Transit Feasibility Study
21
Travel Patterns on the Kansas Turnpike Information on travel between toll stations was provided by the KTA and is presented in Table 10. This represents the movement on an average weekday during 2012 for two-axle vehicles. The data highlights a major movement through each end of the I-70 corridor (stations 183 and 236) as well as a major movement between Lecompton (station 197) and East Topeka (station 183).
Table 10 Daily Two-Axle Vehicle Movement between KTA Toll Stations
Source: KTA
Summary of Commute Travel A market analysis was completed in order to estimate transit service needs between Lawrence and Topeka, between Overland Park and Topeka, and between Topeka/Lawrence and Kansas City. This market analysis used input from state employee commuting patterns, employer surveys, census data, and major non-commuter destinations. The primary focus of this project is longer-distance commute trips in the I-70 corridor. Beginning at a larger scale, the higher place-to-place movements for daily person trips in the I-70 corridor are:
Lawrence to Topeka (2,611) Lawrence to Overland Park (2,049) Topeka to Lawrence (1,611) Overland Park to Topeka (1,054) Overland Park to Lawrence (1,042) Lawrence to Kansas City, Kansas (784)
KTA Station
177 So
uth T
opeka
183 E
ast T
opeka
197 Le
com
pton
202 W
est L
awre
nce
204 E
ast L
awrence
212 T
onganox
ie
224 B
onner Sprin
gs
236 E
aste
rn T
erm
inal
177 South Topeka - 8 1,328 697 285 106 113 1,951
183 East Topeka 7 - 3,509 1,844 664 273 259 7,209
197 Lecompton 1,343 3,592 - 56 135 62 36 572
202 West Lawrence 668 1,843 49 - 620 236 156 2,758
204 East Lawrence 296 686 124 352 - 64 72 1,831
212 Tonganoxie 103 286 62 222 47 - 16 314
224 Bonner Springs 131 304 42 161 78 18 - 0
236 Eastern Terminal 1,885 7,057 554 2,607 1,757 324 0 -

I-70 Corridor Transit Feasibility Study
22
Looking closer at movement to employment centers, these are the larger travel markets:
Between residential areas in the Lawrence area to employment in the Topeka core area (930 workers)
Between residential areas in Topeka to employment in Lawrence at KU or downtown (480 workers)
Between residential areas in Kansas City, Kansas, to employment in Lawrence at KU or downtown (450 workers)
Between residential areas in Overland Park to employment in the Topeka core area (376 workers)
Between residential areas in Kansas City, Kansas, to employment in Topeka CBD (284 workers)
Between residential areas in the Lawrence area to employment in the Kansas City core area (279 workers)
Between residential areas in Topeka to employment in Kansas City, Kansas/Missouri CBD (130 workers)
Review of the state employee data indicated a number of employees by travel movements. This data provides specific employer-based location information, which can be representative of other employment-home distributions. This information shows the following travel movements:
State workers to Topeka – from Lawrence and Tonganoxie (566 employees)
State workers to Lawrence – from the Village West area, with connections from the State Avenue BRT (171 employees)
To KUMC (the portion of this travel market that is outside the local transit service area is small, with 159 employees located west of I-435)
Non-work Attractions While this feasibility study is primarily focused on commuter travel, a secondary market for non-work travel to major activities or destinations is possible. Retail and recreational activities are also located in the I-70 corridor. The largest activities where large numbers of patrons gather at a concentrated time are primarily sporting events.
Table 11 displays the attendance data or other information for the various events or major attractions in the I-70 corridor.

I-70 Corridor Transit Feasibility Study
23
The percentage share of transit riders has been taken from area experience and with comparison of mode share at major events.1
Several events within the I-70 corridor area have potential for attracting riders onto a transit service scheduled to coincide with the event. Sporting events such as races at the Kansas Speedway or football and basketball at KU could potentially be served by transit service. These events would not coincide with commuter transit service, and so additional service would need to be provided if the riders to these events are to be served.
The strongest market for non-commute transit travel is university-related trips to KU in Lawrence not currently being served by the K-10 Connector. The other markets do not appear as strong. A separate study completed for KUMC indicated very limited student travel from outside the Kansas City metropolitan area. Likewise, travel to Washburn University is concentrated in the Topeka area. There also does not appear to be significant movement between KUMC or Washburn and KU.
1 Studies in Milwaukee, Wisconsin, and Cedar Rapids, Iowa

I-70 Corridor Transit Feasibility Study
24
Table 11 Events/Activity Centers in I-70 Corridor
Name Time Period Measure Daily Trips
Mode Share
Transit Trips
Kansas City Legends Outlets Kansas City Year-round 1.2 million square
feet (sq. ft.) 31,908 1% 319
Nebraska Furniture Mart Year-round 450,000 sq. ft. 2,277 1% 23
Cabela’s Year-round 180,000 sq. ft. 752 1% 8
Hollywood Casino Year-round 128,000 sq. ft. 1,719 1% 17
Kansas Speedway
Two weekends annually 72,000 (capacity) 82,000 0.25% 205
Schlitterbahn Waterpark
Late May to early September 26-acre park 2,960 1% 30
Sporting Park 19 home games 18,467 (capacity
for soccer games) 18,400 1% 184
Additional concerts
25,000 (capacity for concerts) 25,000 1% 250
Community America Ballpark 54 home games 6,537 (capacity) 6,530 1% 65
Lawrence KU Football 7 home games 50,250 (capacity) 50,250 2% 1,005
KU Basketball 16 home games 16,300 (capacity) 16,300 2% 326
Lied Center Year-round 2,020 (capacity) 2,020 0% 5
KU Lawrence Campus Academic Year 27,939
(2012 enrollment) 24,939 4% 1,118
Topeka Landon Arena Year-round 7,450 (capacity) 7,450 2% 149 Washburn University Academic Year 7,204 (2012
enrollment) 7,204 4% 288
Sources: www.wikipedia.org http://www.legendsshopping.com/about/ http://www.nfm.com/default.aspx http://www.cabelas.com/stores/store_info.jsp?pageName=008 http://www.tbonesbaseball.com/ http://www.kansasspeedway.com/Articles/2010/04/HC-groundbreaking.aspx www.kuathletics.com
http://www2.ljworld.com/news/2012/sep/27/ku-enrollment-falls-freshman-class-grows-first-tim/
http://www.oursportscentral.com/services/releases/?id=3586091
http://lied.ku.edu/about/technicalSpecs.shtml
http://www.washburn.edu/about/facts/institutional-research/enrollment.html

I-70 Corridor Transit Feasibility Study
25
Potential Transit Ridership Once the overall person commuting trip travel movements were understood, the next step was to estimate the share of the trips that could potentially use the public transit mode of travel. The daily commuter ridership forecast estimated the number of daily boardings that would be anticipated if commuter bus service were provided between Topeka, Lawrence, and Kansas City, Kansas; and Kansas City, Missouri. This initial forecast was used to identify general levels of transit demand and the movement by transit between districts. As transit operating plans are refined, the ridership forecasts will also be refined.
The ridership forecast was conducted at a district level to meet the needs of the feasibility study. The districts are aggregations of census blocks along the I-70 corridor within Topeka, Lawrence, and Kansas City, Kansas; and Kansas City, Missouri. The use of districts facilitated an abbreviated travel demand model process in which district-to-district travel times, trip interactions, and mode decisions could be estimated. The six districts comprising the ridership estimation study area are shown in Figure 15.
Figure 15 Ridership Estimation Study Areas
Ridership Forecast Methodology
The mode analysis was conducted using methodologies outlined in the National Cooperative Highway Research Program (NCHRP) Report 716, Travel Demand Forecasting: Parameters and
Techniques. The functional form known as a nested logit model was used for the mode choice analysis. The estimation of commuter bus ridership requires an estimation of the sensitivity of the area’s commuters to the differential between the utility of the competing

I-70 Corridor Transit Feasibility Study
26
modes, such as drive along and carpool. The nest structure for this model is shown in Figure 16.
Figure 16 Model Nest Structure
The equation to calculate the potential of district-to-district commuter trips using the different modes is as follows:
𝑃𝑛 = exp(𝑉𝑛)
∑ (𝑉𝑛,)𝐴𝑙𝑡𝑒𝑟𝑛𝑎𝑡𝑖𝑣𝑒𝑠_𝑛,
Where:
𝑃𝑛: the probability that alternative n is chosen
𝑉𝑛′: utility of alternative n
𝑉𝑛 = 𝛽𝑛 − 0.025(𝑖𝑛 𝑣𝑒ℎ𝑖𝑐𝑙𝑒 𝑡𝑖𝑚𝑒) − 0.0021(𝑎𝑐𝑐𝑒𝑠𝑠 𝑡𝑖𝑚𝑒) −
0.053 (𝑊𝑎𝑖𝑡𝑖𝑛𝑔 𝑇𝑖𝑚𝑒) − 0.0031 (𝑓𝑎𝑟𝑒 𝑐𝑜𝑠𝑡) − .0031 (𝑑𝑟𝑖𝑣𝑒 𝑐𝑜𝑠𝑡)
The probabilities are then applied as shares of the market segments to which they apply; that is, if a mode has a 75-percent probability of being chosen by a market segment (e.g., work trips for an origin destination zone pair), 75 percent of the travelers in that segment are allocated to that mode.
The decision to utilize the commuter bus service depends upon the utility of that service compared to other available services, namely the personal automobile (drive alone or carpool). The utility is a function of the explanatory variables used in the 5-county regional travel demand model. These variables used in the ridership forecast model are shown in Table 12.

I-70 Corridor Transit Feasibility Study
27
Table 12 Coefficients of Commuter Mode Choice Model
In-Vehicle Time Varied Travel Time (station to station) Varied Transit Wait Time 10 Minutes Access Time to/from Station (including bus, auto, and walk) 5 - 7 Minutes
Fare $3.00 - $4.00 Vehicle Operating Cost $0.28 per mile Toll Cost $0.75 - $2.25
Ridership Forecasts
The transit ridership was estimated for a transit service that provided connections between all of the districts. The methodology found that there is a general transit demand for between 500 – 600 daily commuter transit trips, depending on the combination of service and travel time assumptions. This equated to approximately 3 to 4 percent of the daily commuter trips within the study area. A typical mode share for a metropolitan area can be assumed to be between 3 to 5 percent. The home-to-work trip table for projected transit riders is shown in Table 13. The work-to-home would be the reverse of these tables.
The greatest potential for transit demand was shown between Lawrence and the Topeka CBD in both directions, with the larger share being the Lawrence-to-Topeka CBD movement. There also appears to be aggregated peak demand movement in the direction east from Topeka and Lawrence, to the CBDs of Kansas City, Kansas, and Kansas City, Missouri. Another key movement was between Topeka and Overland Park. There appears to be less movement from the Kansas City area west to Lawrence or Topeka.
Table 13 Transit Ridership Forecast Home-to-Work Trip Table
Origin / Destination – Return Forecasted Trips
Lawrence to Topeka / Return 145 Topeka to Lawrence / Return 90 Lawrence to Kansas City, Missouri, CBD / Return 70
Topeka to Kansas City, Kansas, CBD / Return 40 Lawrence to Kansas City, Kansas, CBD / Return 35
Topeka to Kansas City, Missouri, CBD / Return 20 Topeka to Overland Park / Return 80 Overland Park to Topeka / Return 80 Tonganoxie to Topeka / Return 20

I-70 Corridor Transit Feasibility Study
28
Chapter 3 Service Concepts Introduction
This chapter describes a range of possible fixed-route transit service concepts for the I-70 corridor. Once the overall commuting trip movements using transit were understood, the study team looked at a range of transit concepts, which were described in terms of mode, market served, route frequency, and cost. A cost model utilizing local operational costing factors was used to project future operating costs based on service level assumptions. Based upon this evaluation, operational assumptions were further explored.
Range of Transit Options Public transit can be provided in a number of forms. The service can vary from operating formal bus routes, to providing transit routes for pre-arranged passengers, to more informal methods such as carpooling or vanpooling. All these options address commuter travel, but guaranteed midday service can be provided for each option. A cost comparison of commuter mode options is summarized in Table 14. Each option is described below:
Ridesharing
Ridesharing includes both carpooling and vanpooling. A carpool is where two or more people share a ride in a private vehicle to a common destination. A vanpool is where a larger group of people share a ride in a prearranged vehicle. A longer-distance commute, such as that along the I-70 corridor, provides incentives for ridesharing. Travel costs can be significantly reduced by carpooling and vanpooling. Cost estimates prepared by AAA indicate the total costs of driving alone for a 30-mile roundtrip commute to be approximately $4,500 annually using current fuel costs. If carpooling participants take turns driving, the operating costs can be reduced by nearly half. A typical vanpool arrangement is usually a fixed monthly cost to cover operating expenses. A six-person vanpool would cost approximately $850 a year per person.
Fixed-Route Transit
Fixed-route transit provides designated public transportation that is operated along a prescribed route according to a fixed schedule. For the I-70 corridor, fixed-route transit would have the characteristics of express bus transit, having limited stops and providing for higher travel speeds and travel times that would be close to that provided by

I-70 Corridor Transit Feasibility Study
29
drive-alone vehicles. Fixed-route transit can use existing or new transit amenities such as bus shelters, park and ride lots and technology that provide real-time information on bus arrival times. Buses can also be equipped with on-board Wi-Fi capabilities. A $3.75 one-way fare would result in an annual direct-cost to the user of $1,910, which does not include the amount saved by not driving a car.
Commuter Rail Transit
Commuter rail passenger transportation moves along railway tracks, with scheduled service on fixed routes on a non-reservation basis. Travel is primarily regional between cities, often connecting to a city center or CBD. Commuter rail connections between Lawrence and Kansas City have been previously studied. This study focuses on lower-cost, more-flexible transit service such as fixed-route transit or ridesharing, both of which can be implemented in a shorter time than commuter rail. Commuter rail costs would depend on the fare charged. Costs to the user would be similar to fixed-route transit unless a higher fare was required.
Table 14 compares the annual and monthly user costs by commuter mode.
Table 14 Commuter Mode Choice User Cost Comparison
Commuting Mode Cost/Rider/Month Cost/Rider/Year Drive-alone $375 $4,505 Carpool $190 $2,250 Fixed Route ($3.75 Fare) $150 $1,910 Vanpool $70 $840
Source <www.rideshareonline.com>
Range of Concepts Four fixed-route transit concepts were developed to examine service options for the corridor. Each includes three segments that are part of the overall corridor concept:
Between Topeka and Lawrence Between Lawrence and Overland Park Between Lawrence and Kansas City
An estimated ridership by segment was obtained by adding together the individual place-to-place transit demand listed in Table 13 and assigning the trips to the relevant service segment. Table 15 shows the estimated total ridership for each segment as well as the origins and destinations of these riders.

I-70 Corridor Transit Feasibility Study
30
The service concepts were developed based upon this general level of transit demand with the understanding that these estimates, which are based on the census, appear to be conservative. The service concepts developed also reflect other market information such as the state employee zip code data that indicate a higher level of travel between communities than captured by the census.
The forecasts provide an indication of the potential transit demand for commuter travel. It is also recognized that ridership would be influenced by a number of operating characteristics such as service frequency and ease of transfers, the location of stops, and other factors. These factors will need to be further considered in project implementation.
Table 15 Potential Daily Transit Ridership Demand by Segment
Segment Ridership Boardings
Topeka – Lawrence 455 Lawrence – Topeka Topeka – Overland Park Topeka – Kansas City
235 160 60
Lawrence – Kansas City 165 Lawrence – Kansas City
Topeka – Kansas City 105 60
Lawrence – Overland Park 450 Lawrence – Overland Park
Topeka – Overland Park 290 160
Operating cost estimates for each concept were developed using the KCATA’s cost allocation model, which provides for the full allocation of both direct and indirect costs associated with operating this type of transit service. For this analysis, all potential indirect costs were considered and accounted for in the allocation methodology. It is possible that the indirect costs associated with each concept could be less, depending on who the service operator is and where the service is operated from.

I-70 Corridor Transit Feasibility Study
31
Concept A
This concept, presented in Figure 17, represents a system serving I-70 and connecting three separate routes at a major transfer point in Lawrence. The three routes would include a route between Topeka and Lawrence, a route between Lawrence and Kansas City, and a route between Lawrence and Overland Park. This concept involves the most transfers, but it has the greatest flexibility. The segment between Lawrence and Overland Park is already in service now, operated by JCT as the K-10 Connector.
Figure 17 Concept A Strategy
As the Lawrence/Overland Park and Topeka/Lawrence segments have higher forecasted ridership than the Lawrence/Kansas City segment, these two segments could potentially be operated more frequently. The service level included in this concept is three trips in each direction in both the morning peak and afternoon peak between Topeka and Lawrence. Two trips would run in each direction for both morning and afternoon peaks between Lawrence and Kansas City. The Lawrence to Overland Park service would remain as currently provided. Table 16 lists the operating characteristics of this concept. The cost per rider designated for the Topeka – Lawrence segment is lower than that of the segment connecting Lawrence with Kansas City, due to a higher forecasted ridership between Topeka and Lawrence.

I-70 Corridor Transit Feasibility Study
32
Table 16 Operating Characteristics for Concept A
Segments Headway Total Trips Buses Cost (per rider)
Total Operating
Cost Topeka - Lawrence 1 hour 12 2 $4.85 $563,000 Lawrence - Kansas City 1 hour 8 2 $12.62 $531,000 Lawrence - Overland Park
30 minutes to 1 hour N/A N/A N/A N/A
Total 20 4 $6.92 $1,094,000
Concept B
Concept B provides continuous routes that would provide one-seat rides through Lawrence between Topeka and Kansas City and Topeka and Overland Park. This would allow riders in Topeka, for example, to choose between a one-seat ride to Kansas City and a one-seat ride to Overland Park. Figure 18 displays the concept; operating characteristics are displayed in Table 17.
Figure 18 Concept B Strategy
This concept provides a similar level of transit service for all the route segments. In this concept, three trips would run in each direction in the morning and in the afternoon peak periods. In order to provide hourly service, eight buses would be in use, with four buses originating in Lawrence, two in Topeka and one each in Kansas City and Overland Park.

I-70 Corridor Transit Feasibility Study
33
Table 17 Operating Characteristics for Concept B
Segment Headway Total Trips Buses Cost (per rider)
Total Operating
Cost Overland Park - Lawrence – Topeka - Kansas City
1 hour 12 8 $8.34 $2,614,000
Concept C
Concept C operates a single route along I-70 connecting Topeka, Lawrence, and Kansas City. This route is assumed to coordinate with the operations of the K-10 Connector to enable riders wanting to commute between Topeka and Overland Park. This concept relies on a central transfer location in Lawrence. Figure 19 displays the concept; operating characteristics are displayed in Table 18.
Figure 19 Concept C Strategy
In this concept, three trips would run in each direction in the morning and in the afternoon peak periods. In order to provide hourly service, four buses would be in use.

I-70 Corridor Transit Feasibility Study
34
Table 18 Operating Characteristics for Concept C
Segments Headway Total Trips Buses Cost (per rider) Total
Operating Cost
Topeka - Lawrence- Kansas City 1 hour 12 4 $8.59 $1,358,000
K-10 Connector 30 minutes to 1 hour N/A N/A N/A N/A
Concept D
Concept D assumes two separate routes will operate, allowing connections to all four of the major destination cities. One route would travel between Topeka, Lawrence, and Overland Park, while the other route would travel between Lawrence and Kansas City, Missouri. Those wanting to travel between Topeka and the Kansas City area would transfer at a designated transfer location in Lawrence. Figure 20 displays the concept; operating characteristics are displayed in Table 19.
Figure 20 Concept D Strategy
In order to limit the amount of transfers where there is strong ridership and allow for more flexibility to accommodate changes in ridership, Concept D combines aspects of each of the first three alignment options. While three trips would be made in each direction in both the morning peak and afternoon peak between Topeka, Lawrence, and Overland Park, only two trips would run in each direction between

I-70 Corridor Transit Feasibility Study
35
Lawrence and Kansas City, as was done in Concept A. The operating characteristics are shown in Table 19.
Table 19 Operating Characteristics for Concept D
Segments Headway Total Trips Buses Cost
(per rider) Total
Operating Cost
Topeka - Lawrence - Overland Park 1 hour 12 4 $4.85 $563,000
Lawrence - Kansas City 1 hour 8 2 $12.62 $531,000
Total 20 6 $6.92 $1,094,000
Initial Concept Evaluation Table 20 summarizes the operating characteristics for each concept, followed by a description of benefits and disadvantages of each concept:
Table 20 Operating Characteristics Summary
Concepts Total Trips Buses Cost
(per rider) Total Operating Cost
Concept A 20 4 $6.92 $1,094,000 Concept B 12 8 $8.34 $2,614,000 Concept C 12 4 $8.59 $1,358,000 Concept D 20 6 $6.92 $1,094,000
Concept A
Concept A is designed to match the level of service provided with the estimated ridership, leading to the lowest cost per rider. Passengers traveling between Topeka and Kansas City or between Topeka and Overland Park would be required to transfer in Lawrence, adding time and inconvenience to riders. Transferring would likely result in a reduction in forecasted ridership between Kansas City and Topeka of approximately 8 percent. The service would build upon the existing K-10 Connector service, with alignment modifications in Lawrence. This concept may also face the fewest administrative and jurisdictional hurdles, as each segment can be developed, funded, and operated relatively independently of the other segments. Modifications to the

I-70 Corridor Transit Feasibility Study
36
existing K-10 Connector would be relatively minor and may consist of minimal route or timing adjustments to facilitate passenger transfer to other segments.
Concept B
Concept B requires more vehicles than Concept A and has the highest cost to operate. It would require changes to the operations of the K-10 Connector, as the morning and afternoon runs would not terminate in Lawrence but would continue through to Topeka and Kansas City.
Concept C
Concept C would provide a one-seat ride between Topeka, Lawrence, and the Kansas City area. The K-10 Connector service would be unchanged. The operating costs would be higher than Concept A, as the service level for the route segment between Lawrence and Kansas City would be the same as between Lawrence and Topeka, even though there would be fewer riders.
Concept D
Concept D would provide a one-seat ride between Topeka, Lawrence, and Overland Park. This would provide the segments of the highest forecasted ridership with a one-seat ride, while still providing for travel between Lawrence and Kansas City. Along with Concept A, this concept would be less expensive than either Concept B or Concept C. To be successfully implemented, this concept would require a higher degree of coordination and inter-governmental cooperation between several different entities and jurisdictions.
Concept Evaluation Outcome
After evaluating the four concepts, the study team agreed that Concept A, which involves three separate routes connecting Topeka and Lawrence, Lawrence and the Kansas City area, and Lawrence and Overland Park, would be the commuter transit concept to be further evaluated. This concept would face the fewest administrative and jurisdictional hurdles, as each segment can be developed, funded, and operated relatively independently of the other segments. Modifications to the existing K-10 Connector would be relatively minor and may consist of minimal route or timing adjustments to facilitate passenger transfer to other segments.

I-70 Corridor Transit Feasibility Study
37
Chapter 4 Operations Strategy Introduction
The purpose of this chapter is to determine appropriate service levels of the preferred concept and present an operating strategy. This operation strategy describes the operating details, potential facilities, costs, and general marketing strategies associated with this service. Figure 21 displays the preferred concept.
Figure 21 Preferred Concept
Evaluation of Route Segments As part of this further evaluation, the projected performance of each segment was examined to determine the appropriate type and amount of service that could be applied to each segment. Each segment’s projected performance was determined by calculating the expected fare box recovery (the percentage of cost covered by fare revenue) and comparing it to the actual fare box recovery. This analysis assumes that a $3.752 fare would equate to a $2.33 net fare after monthly pass discounts and reduced fares for senior citizens, youth,
2 The current K-10 Connector fare is $3.50. A $3.75 regional fare could result from policy decisions and/or inflation.

I-70 Corridor Transit Feasibility Study
38
and persons with disabilities are taken into account. Refer to the Appendix for the methodology used in acquiring the final net fare.
The results of the fare box recovery analysis were compared to similar long-distance commuter express routes operated by the KCATA in the Kansas City Metro. Two commuter routes operated by the KCATA were chosen for comparative purposes; however, both KCATA routes only provide service in one direction, correlated to the peak commute movement, while the concept routes would provide bi-directional service. To account for this difference, comparisons were made only to the productive trips of the KCATA routes. The results showed the KCATA service was then similar and comparable to the recommended concept routes. These two KCATA commuter routes were determined to have an average cost recovery of 40 percent. These results are consistent with industry standards for expected commuter route cost recovery rates in the Midwest. The expected standards would likely increase in regions where urbanized density is far greater.
The estimated cost recovery of the two Concept A segments showed that the Lawrence-Topeka and the Lawrence-Overland Park segments are comparable to the KCATA commuter routes with recovery rates of 48 percent and 40 percent, respectively. Using the initial operating level assumptions, the Lawrence-Kansas City segment had a fare recovery rate of 18 percent.
Given this lower fare recovery rate, service level modifications were considered for the Lawrence-Kansas City segment. When the service level assumptions on the Lawrence-Kansas City segment were modified by reducing the number of transit round trips from four (two a.m. and two p.m.) to two (one a.m. and one p.m.) to match with transit demand, this yielded a projected fare box recovery of 37 percent. While this results in a higher recovery rate than initially estimated, it is still marginal in terms of financial viability. Additionally, one round trip per peak period will severely limit the appeal of the service to passengers that may desire a wider choice of trip times. Therefore, an introduction of service along this segment, even at the reduced service level, should not be considered as part of a near-term commuter transit strategy in the corridor. Table 21 provides a summary of these various routes. The midpoint from the forecasted range of ridership presented in Chapter 3 was utilized to obtain the cost per rider and a cost-recovery ratio. For a more comprehensive explanation of the operating cost methodology, refer to the Appendix.

I-70 Corridor Transit Feasibility Study
39
Table 21 Expected Farebox Recovery
Route Daily Ridership
Yearly Ridership Peak Freq. Daily
Hours Daily Miles
Daily Trips
Cost/Rider
Cost Recovery
Ratio Recommended Concept Routes
Topeka - Lawrence 455 116,025 ~60 min 12 354 12 $4.85 48%
Lawrence - Kansas City 165 42,075
1 roundtrip per peak period
4 174 4 $6.32 37%
*Lawrence - Overland Park (existing K-10 Connector)
450 114,750 ~60 min 12 428 12 $5.90 40%
Current KCATA Metro Routes Lee's Summit/ Raytown Express
224 57,120 ~30 min 6.55 165 10 $3.50 40%
Blue Springs Express 253 64,515 ~30 min 8.1 184 8 $3.70 40%
Notes: Deadhead multiplier of 1.1, Regular fare of $3.75, Net fare of $2.33 *Only K-10 Connector trips that would meet Lawrence-Topeka trips are presented
and analyzed. The actual peak frequency for the K-10 Connector is currently at 30
minutes.
Operating Plan Development of the operating plan involved determining operating details such as amount of service and general locations of major stops for new service along the route segment operating between Topeka and Lawrence. The preferred concept assumes that the K-10 Connector will continue its current frequency and general alignment.
The Topeka to Lawrence route segment is described below:
Topeka - Lawrence
This route segment would operate as a fixed-route transit service between a new transit station in Lawrence (likely located along Iowa Street) and the hospital/medical center in Topeka (located along 10th Street). Three westbound trips and three eastbound trips would be provided in the morning, and three westbound trips and three eastbound trips would be provided in the evening. The stops assumed for this route segment are:
I-70 Corridor Transit Feasibility Study
40
Stormont-Vail Rehab Institute, Eighth Street and SW Washburn Avenue, Topeka, Kansas
Quincy Street Station, Eighth Street and Quincy, Topeka, Kansas
Lawrence Transit Center, Iowa Street, Lawrence, Kansas. This location would function as the transfer point between the two new routes serving Topeka and the Kansas City, Kansas, and Kansas City, Missouri area; and the existing K-10 Connector serving Overland Park
Operating Hours: 6:00 a.m. – 9:00 a.m. / 3:30 p.m. – 6:30 p.m.
Number of Trips: Six morning / six afternoon
Frequency: Approximately 1 hour
Number of Buses: 2
Annual Operating Cost: $563,000
Annual Net Operating Cost: $294,600
These costs include $4,100 in annual turnpike tolls necessary for the Topeka – Lawrence segment in annual. The current toll rates for a three-axle bus traveling on the Kansas Turnpike (I-70) in the Topeka-Lawrence corridor are described below. These toll rates were included in the operating costs identified throughout this report.
Topeka to/from Lawrence
$1.05 – East Topeka (183) to/from Lecompton (197) $1.35 – East Topeka (183) to/from West Lawrence (202) $1.35 – East Topeka (183) to/from East Lawrence (204)
Facilities Facilities needed to serve the routes would range from simple street-side stop markers, to more substantial stations, to full park and ride lots with amenities. The routes could use many facilities that already exist to serve the existing transit system in Lawrence and Topeka.
The largest facility issue related to corridor transit service is in Lawrence where the three routes would converge at a centralized location to allow for riders to transfer to other segments of the service or to transfer to the local Lawrence transit service. Currently, Lawrence Transit is evaluating the location of a new transit center and is focusing search efforts on a corridor centered on Iowa Street, bounded by Ninth Street and 23rd Street. This facility may feature on-

I-70 Corridor Transit Feasibility Study
41
street bus pull-outs in addition to a transit center, which could serve as a safe point for passengers transferring between these different regional service segments and/or to local transit routes in Lawrence. Currently, conceptual plans for this facility do not include park and ride elements such as off-street parking. An existing 1,500 space park and ride lot at Clinton Parkway and Iowa Street serves KU students, but this space may be redeveloped into another use in the relatively near future. Additional off-street parking and pedestrian connections can be added to a future transit center to facilitate its use as a park and ride. Additional locations where the commuter service can be accessed may also be needed. This could include a proposed park and ride lot in North Lawrence near the I-70/KTA/US 59/40 interchange.
In Topeka, the service would serve the Quincy Street station as well as the medical cluster along Washburn Avenue between Sixth Avenue and 10th Street. Washburn Avenue currently has a basic stop (pole-sign only) at the southwest corner of Washburn Avenue and Eighth Avenue. In addition, the service would stop at the capitol complex along Eighth Street.
Currently, TMTA does not have designated park and ride facilities. TMTA maintains a staff parking lot with approximately 12 parking spaces at the Quincy Street station. In addition, several city-owned parking garages exist in the immediate vicinity around the Quincy Street Station. These include the Ninth Street garage at 215 SE Ninth Street, directly across the street from the Quincy Street Station; the Coronado Garage, which is a half a block south of the transit station; and the Centre City Garage one block west of the garage. Current monthly parking rates for these garages range from $35.00 to $68.00. Spare capacity at these parking garages has not been evaluated.
Capital Costs Capital costs would include costs for the facilities described above plus the costs of acquiring buses. Two buses would be needed for the proposed service levels between Topeka and Lawrence. A third bus would serve as a spare.
The buses assumed to operate this service are 40-foot-long over-the-road coaches, each costing approximately $600,0003. These buses
3 Kansas City Smart Moves Implementation Plan, Phase III

I-70 Corridor Transit Feasibility Study
42
generally have seating and features more suitable and comfortable for longer trips at highway speeds than low-floor variants. It should be noted that using over-the-road coaches, while more comfortable for passengers than standard coaches, limits the operational flexibility of transit agencies as these vehicles could not be reassigned to local routes. Figure 22 shows an over-the-road coach utilized on the K-10 Connector.
Figure 22 Over-the-Road Coach
Total capital costs are identified below in Table 22. These costs include developing park and ride elements and minimal upgrades to existing stop locations to add amenities for commuters. Table 23 summarizes the operating characteristics and costs of the preferred concept.
Table 22 Capital Costs
Location Item Quantity Unit Cost Total Comment
Topeka Basic shelter and pole sign 2 $15,000 $30,000 To serve the capitol complex,
medical cluster, and local routes
Lawrence Pole sign 2 $100 $200 For signs at transit center and one other location
Lawrence Park and ride 1 $250,000 $250,000 To add park and ride elements to future transit center
Corridor-wide
Over-the-road coaches 3 $600,000 $1.8
million
Project Total Capital Costs: $2.08 million Note: For totals, Lawrence capital costs are evenly split between the two segments.
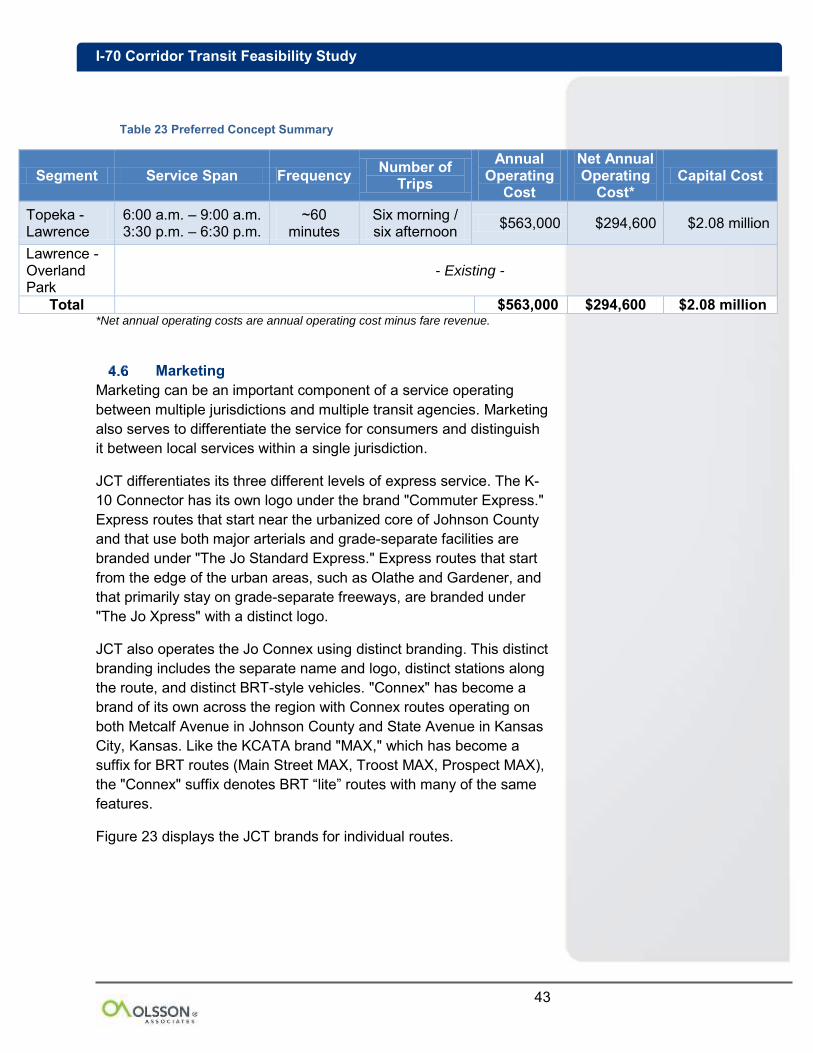
I-70 Corridor Transit Feasibility Study
43
Table 23 Preferred Concept Summary
Segment Service Span Frequency Number of Trips
Annual Operating
Cost
Net Annual Operating
Cost* Capital Cost
Topeka - Lawrence
6:00 a.m. – 9:00 a.m. 3:30 p.m. – 6:30 p.m.
~60 minutes
Six morning / six afternoon $563,000 $294,600 $2.08 million
Lawrence - Overland Park
- Existing -
Total $563,000 $294,600 $2.08 million *Net annual operating costs are annual operating cost minus fare revenue.
Marketing Marketing can be an important component of a service operating between multiple jurisdictions and multiple transit agencies. Marketing also serves to differentiate the service for consumers and distinguish it between local services within a single jurisdiction.
JCT differentiates its three different levels of express service. The K-10 Connector has its own logo under the brand "Commuter Express." Express routes that start near the urbanized core of Johnson County and that use both major arterials and grade-separate facilities are branded under "The Jo Standard Express." Express routes that start from the edge of the urban areas, such as Olathe and Gardener, and that primarily stay on grade-separate freeways, are branded under "The Jo Xpress" with a distinct logo.
JCT also operates the Jo Connex using distinct branding. This distinct branding includes the separate name and logo, distinct stations along the route, and distinct BRT-style vehicles. "Connex" has become a brand of its own across the region with Connex routes operating on both Metcalf Avenue in Johnson County and State Avenue in Kansas City, Kansas. Like the KCATA brand "MAX," which has become a suffix for BRT routes (Main Street MAX, Troost MAX, Prospect MAX), the "Connex" suffix denotes BRT “lite” routes with many of the same features.
Figure 23 displays the JCT brands for individual routes.

I-70 Corridor Transit Feasibility Study
44
Figure 23 JCT Brand Distinctions
KCATA brands their peak-oriented, limited-stop trips as "Express." These include a variety of routes, some of which have significant portions of their alignment on major arterials before accessing grade-separated freeways, and others with the majority of alignment on arterials. KCATA generally identifies these routes as "Express" through the incorporation of "X" after the route number, such as 36X or 28X. The "X" suffix distinguishes those commuter-oriented routes that have limited stops in the peak periods from their counterparts, which may have much the same alignment but more-frequent stops and an overall lower travel speed.
Neither Topeka Metro, Lawrence Transit, nor UGT currently operates express service. Topeka Metro identifies its routes through a color designation, number, and descriptor, such as the "Green #4 - West 10th." Routes with the "S" suffix generally indicate routes with one or two daily runs oriented toward specific demand peaks such as school end times and whose alignments are variants of regular routes.
Transit in Lawrence operates under two brands: Lawrence Transit ("The T") or KUOW. Generally, routes funded by KU are operated with KU-colored buses, and routes funded by the city have their own color scheme. The joint systems share a map book and website.
The service recommendations could be marketed as individual routes or as a system of routes. A system operating between Topeka, Lawrence, Kansas City, and Overland Park would have taken into account the transit brands already existing in each jurisdiction. The recommended concept may operate as separate routes, but may—at a later phase—incorporate interlining to increase efficiency or to meet increased demand. This could involve a new branding or simply a continuation of branding individual routes.

I-70 Corridor Transit Feasibility Study
45
The brand for this system could have a geographical tie-in similar to how the K-10 Connector denotes a service operating on K-10. Service operating on I-70 could then note the I-70 connection. A system-wide brand encompassing all transit service on I-70 could be created, with sub-brands created for individual route segments. Doing this would also allow any commuter bus service that eventually connects Manhattan / Junction City to Topeka to be introduced into the system. A possible brand name is identified below:
I-70 Connector Topeka – Lawrence
On trips interlined to Topeka, the K-10 Connector could be newly identified as the K-10 / I-70 Connector Overland Park – Lawrence-Topeka.
The I-70 Connector brand could be conveyed to users primarily through route stickers applied to existing bus stop signs and through logos in the existing systems brochures. The brand could also be conveyed through route-specific, branded bus passes that are unique from other area agencies. The system brand could be applied to vehicles, but that begins to require addressing operational issues such as which agency would operate the system. Route-specific brand application to vehicles removes operational flexibility to reassign vehicles to different routes to change frequency or to address maintenance issues. Having a branded, route-specific vehicle may also make it difficult to balance resources in the off-peak period. A vehicle branded in vehicle wrap for the I-70 Connector may create passenger confusion if it’s used for local routes in off-peak service.
Social media can act both as a public relations conduit to market the route and also as a method to contact riders regarding operational issues such as detours or route delays. JCT currently utilizes Facebook and Twitter.
To make sure that potential riders are aware of the route, outreach efforts can be targeted to potential beneficiaries of the route, including the chambers of commerce in all three urban areas, major employers, cycling groups, students, and the existing transit community. In addition, major employers in the corridors should be made aware of what's commonly referred to as the "Commuter Tax Benefits" under Section 132(f) of the Internal Revenue Code. This section allows employers to provide transit and vanpool tax-free benefits to their employees up to $245 a month. These targeted outreach efforts can be coordinated as part of a broader campaign to spread awareness about all transit options in a community, not just the commuter route.

I-70 Corridor Transit Feasibility Study
46
Chapter 5 Funding Analysis Introduction
The purpose of this chapter is to discuss funding options for implementing and operating new transit service in the I-70 corridor. This includes a review of funding sources from federal, state, and local levels. The chapter also discusses fare recovery, project phasing, and the economic impact of this potential investment in transit.
Funding Sources This section discusses possible federal, state, and local government funding sources and expected fare recovery that could be allocated toward the commuter transit route. Table 24 summarizes the opportunities and how they could apply to each individual route. The table also summarizes funding types and identifies whether program funds can be applied toward capital or operating costs.
Federal
The Congestion Mitigation and Air Quality (CMAQ) Improvement
Program
The primary purpose of the CMAQ program is to fund projects and programs which reduce transportation-related emissions in air quality nonattainment and maintenance areas for ozone, carbon monoxide (CO), and small particulate matter (PM-10).
CMAQ funds may be used to establish new or expanded transportation projects or programs that reduce emissions, including capital investments in transportation infrastructure, congestion relief efforts, diesel engine retrofits, or other capital projects. These funds can be used for capital expenditures related to the creation of a commuter transit route, and they would be applicable as match to any federal capital funding awarded to the project. CMAQ funds may also be used for operating assistance, including all costs of providing new transportation services. Previously, CMAQ funding was limited to three years. Interim guidance for the new federal transportation program, MAP-21, allows the same amount of funding to be spread out over five years. Applications for this program would be sent from the transit provider to the appropriate MPO.

I-70 Corridor Transit Feasibility Study
47
Table 24 Summary of Revenue Sources
Route Topeka – Lawrence
Lawrence – Overland Park
Total Annual Operating Cost $563,000 N/A
Cost Recovery 48% N/A Cost Remaining $294,600 N/A Total Capital Costs $2.08 million N/A
Funding Source
Ope
ratin
g
Cap
ital
Ope
ratin
g
Cap
ital
Comments
FEDERAL
TIGER - X - X
TIGGER - X - X
CMAQ X X X X 80/20 local match
FTA Section 5307 X X X X
Federal match: - 80% net project cost - 90% vehicle equipment - 50% operating cost
FTA Section 5339 - X - X Federal match is 80%, but is flexible for certain Americans with Disabilities (ADA), Clean Air, or bicycle projects.
STP - X - X
STATE
T-WORKS X X X X Diverse eligibility requirements
LOCAL TDD - X - X TIF - X - X CID - X - X Sales Tax X X X X Property Tax X X X X Income Tax X X X X General Fund X X X X Fuel Tax X X X X Business Tax X - X - Special Assessments - X - X
Impact Fees - X - X Farebox X - X - Consider elasticity of fare rates Notes: Transportation Investment Generating Economic Recovery program (TIGER) Transit Investment for Greenhouse Gas & Energy Reduction program (TIGGER) Congestion Mitigation and Air Quality Improvement program (CMAQ) Federal Transit Administration (FTA) Surface Transportation Program (STP) Transportation Works for Kansas (T-WORKS) Transportation Development District (TDD) Tax Increment Financing (TIF) Community Improvement District (CID)
I-70 Corridor Transit Feasibility Study
48
The K-10 Connector was initially implemented and operated using CMAQ funding. In fiscal year (FY) 2013, the State of Kansas received $9.5 million from this program, before set asides4. Typically, most of these funds go toward the Kansas City and Wichita metropolitan areas. For the federal fiscal year (FFY) 2013 – 2014, MARC anticipates $3.4 million per year from Kansas, with 34 percent of funds going toward transit5.
Federal Transit Administration Section 5307 Urban Area Formula Grants
This program provides funding to urban areas for transit capital, job access and reverse commute projects, transportation-related planning, and operating expenses in some cases. Funds from this source could be used for such capital expenditures as vehicle acquisition, station development, traffic signal priority, other technology infrastructure, and park and ride facilities. Federal shares cover 80 percent for capital assistance and 50 percent for operating assistance6. The former FTA Section 5316 Job Access and Reverse Commute (JARC) projects are now eligible under the MAP-21 Section 5307 funding program. JARC was designed to help address unique transportation issues of low-income workers who are attracted to an increasing number of jobs located in suburban areas away from the inner city, urban, or rural areas where they may reside.
Allocation of Section 5307 funds depends on an urban area's size. Funding for urban areas of 50,000 to 199,999 in population is based on population, population density, and number of low-income individuals; whereas, areas over 200,000 in population receive funds based on the level of public transportation service provision in addition to population levels.
4 Federal Highway Administration. Revised Apportionment of Federal-aid Highway Program Funds for FY 2013. <http://www.fhwa.dot.gov/legsregs/directives/notices/n4510765/n4510765_t1.cfm>
5 Mid-America Regional Council. Congestion Mitigation/Air Quality Program. <http://www.marc.org/transportation/cmaq/index.htm>
6 Federal Transit Administration. MAP-21: Urbanized Area Formula Grants. <http://www.fta.dot.gov/documents/MAP-21_Fact_Sheet_-_Urbanized_Area_Formula_Grants.pdf>

I-70 Corridor Transit Feasibility Study
49
In FY 2012, MARC received over $15.4 million for the Kansas City urbanized area, while Lawrence received over $1.8 million and Topeka received nearly $2 million7.
Localities or transit providers can send applications for these funds to their MPO or to KDOT if their area's population is between 50,000 and 200,000.
Federal Transit Administration Section 5339 Bus and Bus Facilities
Program
The Bus and Bus Facilities program provides capital assistance for new and replacement buses, related equipment, and facilities. Eligible capital projects include the purchasing of buses for fleet and service expansion, bus maintenance and administrative facilities, transfer facilities, bus malls, transportation centers, intermodal terminals, park and ride stations, acquisition of replacement vehicles, bus rebuilds, bus preventive maintenance, passenger amenities such as passenger shelters and bus stop signs, accessory and miscellaneous equipment such as mobile radio units, supervisory vehicles, fare boxes, computers, and shop and garage equipment. FY 2014 has authorized funding for $428 million. Annually, $65.5 million is to be allocated, where a minimum of $1.25 million is available for each state. Remaining funds are distributed by a formula based on population, vehicle revenue miles, and passenger miles8.
Applications for this program should be sent from the transit provider directly to the FTA and would require a 20 percent local match.
Surface Transportation Program (STP)
The Federal Highway Administration (FHWA) allocates STP funds to be used toward various types of multimodal and roadway projects on federal-aid highways. These funds can be used for transit capital costs, Intelligent Transportation Systems (ITS) capital improvements, bicycle/pedestrian infrastructure, car and vanpool projects, fringe and corridor parking facilities, and intercity/intracity bus terminals and facilities. After deductions for Transportation Alternatives (TA) and State Planning and Research (SPR), the FHWA sub-allocates 50 percent of
7 Federal Transit Administration. FY 2012 Funding by State. http://www.fta.dot.gov/grants/12853.html 8Federal Transit Administration. MAP-21 Transit Programs Summary. http://www.fta.dot.gov/documents/MAP21_essay_style_summary_v5_MASTER.pdf

I-70 Corridor Transit Feasibility Study
50
the state’s remaining funds to areas based on their share of the state’s population. The remaining 50 percent is allocated to any area of the state. Transit typically competes with other road and bridge projects for these funds.
MARC typically allocates an annual amount of $12 – 14 million from Kansas and $24 – 30 million from Missouri. No Kansas STP funds are programmed for transit projects currently, but past projects have received funds from around $1 – 16 million. In 2014, funds are expected near $6.4 million for MTPO and $1.6 million for the city of Lawrence. Both state and local governments are eligible for funds. While MARC is responsible for awarding funds to communities in their region, Topeka and Lawrence receive funds from KDOT.
State
State of Kansas Transit Program Funding
The Kansas Urban Public Transit component of the state Coordinated Transportation Program (CTP) provides annual funding for transit operators. Starting in 2013, transit funding will increase from $6 million to $11 million annually through T-WORKS. These funds can be used for capital and/or operations costs related to the creation of a commuter transit route, and they would be applicable as match to any federal capital funding awarded to the project. Annual statewide funding of $825,000 is available for funding commuter services9.
Local
Numerous sources of local funding could be used for transit operations and/or capital investments. These include sales taxes, property taxes, general fund transfers, or special taxing districts. Coordinating funding from the different local entities throughout the project corridor would be a challenge. A funding allocation formula deemed fair and equitable would have to be determined and agreed upon by city and county governments as well as the involved transit agencies that would interact with the service in the corridor. Each entity would then have to determine the locally preferred option for generating the agreed-upon amount.
9 Kansas Department of Transportation. http://kdotapp.ksdot.org/TWorks/docs/doing-biz_transit.pdf

I-70 Corridor Transit Feasibility Study
51
Sales taxes, property taxes, or transfers from general funds
Local funding strategies could include funds from dedicated sales taxes, property taxes, or the general fund.
Currently, the local funding for the city transit system in Lawrence comes from a quarter-cent sales tax. KU students pay a $73.50 semester fee to support the KU on Wheels portion of the coordinated KU – City transit system in Lawrence.
The first three years of the K-10 Connector operating costs were funded through the CMAQ program. Currently the route is funded, along with the rest of the JCT system, through transfers from the Johnson County general fund. Discussions continue with the city of Lawrence, Douglas County, KU, and Johnson County Community College regarding financial commitment to fund the K-10 Connector.
The local portion of TMTA funding comes from a $4.2 million property tax. This property tax will be reduced for 2015 and subsequent years to $3 million10.
The local portion of UGT funding comes from appropriations from the general revenue fund. KCATA also provides service in Kansas City, Kansas. The primary source of local KCATA funding is a 3/8-cent sales tax in Kansas City, Missouri.
Taxing Districts
A Transportation Development District (TDD) is a special taxing district whereby a petitioner of 100 percent of the landowners in an area request either the levy of special assessments or the imposition of a sales tax of up to 1 percent on goods and services sold within a given area. Upon creation of a TDD by a municipality, the revenue generated by TDD special assessments or sales taxes under Kansas law may pay the costs of transportation infrastructure improvements in and around the new development or as match to any federal capital funding awarded to the project.
In Kansas, Tax Increment Financing (TIF) can use city sales taxes, city franchise fees, and increased property taxes that have been generated by a real estate development within a tax increment financing district to pay for certain eligible costs associated with that development. Eligible
10 Section A9-2, Levy of Tax, of The Code of the City of Topeka

I-70 Corridor Transit Feasibility Study
52
project costs that may be subsidized in TIF districts include land acquisition, demolition, public and site improvements, and certain consulting and administrative costs. Sales Tax Revenue bonds, commonly known as STAR bonds, may also be issued prior to the redevelopment of a TIF district if financing assistance is required before construction begins. The bonds would then be paid off with the additional revenue generated by that district. This source of funding is not typically used for fixed-route type transit operations.
A Community Improvement District (CID) enables financing of certain projects through special assessments or a sales tax. Eligible projects include the acquisition, construction, and refurbishing and equipping of transportation facilities, streetscaping, and landscaping. Projects can be funded with general or special obligation bonds or on a pay-as-you-go basis.
Traditionally, special taxing districts such as TDDs, TIFs, or CIDs have not been used to fund highway-oriented commuter transit services.
Table 25 summarizes the possible local funding sources. Included in the table are the local revenue sources, whether those sources can be used toward capital or operating costs, and both the advantages and disadvantages of each source of revenue.

I-70 Corridor Transit Feasibility Study
53
Table 25 Revenue Sources11
Revenue Source Use Advantages Disadvantages Sales Tax Operating
Capital Generates significant revenue at
low rates Easy to administer Successfully implemented by
many transit agencies
Requires state action and/or voter approval
Hurts retailers Can be regressive Subject to economic cycles
Wage/Income Tax Operating Capital
Generates significant revenue at low rates
Long-run growth potential Wage tax can capture commuter
beneficiaries
Unpopular with voters and the business community
Subject to economic cycles Difficult to administer
Property Tax Operating Capital
Broad coverage of business and individuals
Easy to administer Generates significant revenue at
low rates More reliable than sales tax
Requires voter approval Generally unpopular with
taxpayers Heavy competition from school
districts and other beneficiaries of tax
Motor Fuel Tax Operating Capital
Possible deterrent to driving Less visible to taxpayers Significant revenues from small
increment Easy to administer
Requires state action (constitutional amendment in Missouri)
Revenues subject to decline as fuel economies improve
Vehicle Registration Fee/Tax
Operating Capital
Possible deterrent to driving Easy to administer
Requires state action No direct link to transit Regressive, depending on
structure
Fare Box Revenue Operating Direct users pay Ease of revenue collection
Limited revenues Regressive
Business Tax(es) Operating Employers pay for labor force mobility
Unpopular with business Disincentive for business
location decisions Special Assessments Capital Revenue tied to development
Direct beneficiaries of improvement pay
Small base of opposition
May counter location incentives
Limited revenues Complex administration
Impact Fees Capital Revenues tied to development Direct users pay Small base of opposition
Possible legal challenges Limited revenues
Tax Increment Financing
Capital Revenue tied to economic development
Can tie to transit development specifically
No direct new effect on taxpayers
Limited and less-certain revenues
Complex administration Competition from school and
other local governments
11 TCRP Report 89, Financing Capital Investment: A Primer for the Transit Practitioner. Washington D.C.: TRB. 2003.

I-70 Corridor Transit Feasibility Study
54
Project Phasing Strategies The near-term strategy for introducing commuter bus transit service in the project study area would include the following:
Service between Topeka and Lawrence operating on a 60-minute frequency for three hours in the morning peak period and for the same amount of time in the afternoon peak period
Continuation of the existing Overland Park to Lawrence service at current service levels
As demand for the service in each corridor increases, longer-term opportunities to introduce new service or increase service levels to meet the increasing demand would be considered. In the Kansas City-Lawrence segment, the introduction of a base level of service may be re-evaluated, followed by increasing service frequency in all three segments to meet demand.
Coordination opportunities between the Overland Park-Lawrence service and the Topeka-Lawrence service should be explored and pursued with the idea of eventually creating a single route that would operate between Overland Park and Topeka via Lawrence. This would make the service more attractive to commuters making the trip in either direction between Overland Park and Topeka, without affecting trips between Overland Park and Lawrence or Topeka and Lawrence.
Finally, as demand for midday travel along the corridor grows, the introduction of some level of midday service should be considered. Midday service would also make the peak service more attractive by providing commuters an alternative if they had to leave work early and return home if needed.
Transit Service Impacts Transit services can have diverse economic impacts including both impacts to those using the service and to the community at large. Some economic benefits result from the existence of the service, some from reduced automobile travel, and others from the effects that transit has on land use development patterns. Conventional transportation economic evaluation tends to overlook some of the transit benefits, focusing primarily on vehicle travel speeds and operating costs. Transit benefits can extend beyond vehicle metrics to include mobility benefits, vehicle ownership and parking cost savings, or efficient land development benefits.

I-70 Corridor Transit Feasibility Study
55
A commuter express service serves a relatively low level of demand but would provide mobility for non-drivers and an opportunity for users to reduce the high cost of private vehicle operation over a long-distance commute. High-capacity transit can provide additional benefits of stimulating transit-oriented development in compact, multimodal neighborhoods where residents tend to own fewer vehicles, drive less, and rely more on alternative modes than in more automobile-oriented communities. This synergy between land use and transit can leverage additional travel reductions and benefits (besides just the travel shifted to transit).
Direct economic impacts can be relatively straightforward. According to www.publictransportation.org, a Kansas City to Topeka commuter would have an annual savings of $3,971.7212. The annual savings would increase to $9,547.72 if the household reduced their number of cars by one. This savings could result in a higher consumption of consumer goods or services or higher rates of savings.
Transit impacts and benefits also tend to increase if transit improvements are implemented with support strategies such as walking and cycling improvements, commuter trip reduction programs, parking incentives, and improved user information. Even transit serving a lower level of demand can have an impact on the costs of providing parking. Another societal benefit is that active transport (walking and cycling) and public transit are complements to one another; transit travel tends to increase public fitness and health13.
Both the aging generation and the most recent generation entering the labor force tend to resist rising fuel prices, increasing urbanization, increasing traffic congestion, and rising roadway expansion costs. These changing consumer preferences and increasing health and environmental concerns are shifting travel demand from automobile to alternative modes.
Economic benefits of the commuter express options include:
User benefits related to lower transportation costs
12 Assumption of 126-mile round trip in a medium-sized car that gets 22 miles per gallon, with a $7.50 round trip bus fare, no parking charges, and a cost of $3.00/gallon gasoline. 13 Litman, Todd. (2010). Evaluating Public Transportation Health Benefits. Victoria Transport Policy Institute for The American Public Transportation Association. Downloaded at http://www.apta.com/resources/reportsandpublications/Documents/APTA_Health_Benefits_Litman.pdf
I-70 Corridor Transit Feasibility Study
56
Improved mobility that makes people who are also economically, socially, or physically disadvantaged relatively better off
Reduced parking problems and non-residential parking facility costs
Changes in crash costs, personal security, and improved health and fitness due to increased walking and cycling
Changes in energy consumption, air, noise, and water pollution
Recommendation This project examined the feasibility of providing transit service operating in the I-70 corridor between downtown Kansas City, Missouri; Lawrence, Kansas; and Topeka, Kansas. For transit to be effective, concentrations of activity are needed particularly at the destination end of the trip. Work travel provides the greatest opportunity for this concentration both in terms of location and in terms of travel times. The origins can be dispersed for a commuter service if served by a park and ride lot. The transit need is enhanced if there are parking limitations at the destination end, traffic congestion on the route, or if the service provides an opportunity to reduce vehicle operation costs for longer-distance travel. To be successful, however, the service needs to be frequent enough, provide a good location point to access the system, and then deliver the passengers near the ultimate destination. Commuter travel provides the largest concentration of potential transit use. Non-commute travel was investigated and could be provided on a case-by-case basis, but the feasibility of transit service will be determined by service to commute travel. The largest concentrations of employment activity that could be served by transit in the I-70 corridor are the Kansas City CBD, KU, and the state and medical employees located in or near the Topeka CBD. Trip movements in the corridor are summarized below:
There was not substantial daily travel between KU in Lawrence and KUMC in Kansas City, Kansas.
The largest commuter travel movement in the I-70 corridor is from residents of the Lawrence area to workplaces in downtown Topeka. This level of movement would support regularly scheduled commuter transit service.

I-70 Corridor Transit Feasibility Study
57
There is also movement between residents of Topeka to KU and other major employers in Lawrence. This level of movement would also support regularly scheduled commuter transit service.
The movement between the CBDs of Kansas City, Kansas, and Kansas City, Missouri, with Lawrence and Topeka is less than the movement between Lawrence and Topeka. The movement between Lawrence and the Kansas City, Missouri, CBD is not currently large enough to consider some level of regularly scheduled transit service.
The movement between Topeka and Overland Park was larger than the movement between Topeka, Kansas and the Kansas City, Kansas or Kansas City, Missouri area. For that reason, coordination of service between the K-10 Connector and a possible extension of service between Lawrence and Topeka could accommodate this need.
Potential transit modes for addressing this movement include expanding carpooling opportunities, working to create more vanpools, providing bus service on a fixed schedule, and providing fixed guideway options such as commuter rail. The level of transit demand between Topeka, Kansas and Lawrence, Kansas is expected to be large enough to operate bus service. Commuter rail has been studied as an option in the past, and the level of demand estimated in this project is consistent with the past findings, which suggest that bus transit would be the most cost-effective strategy in the near term. A series of bus transit options were developed that had different operating characteristics. The concept recommended in this report is a system of two independent commuter bus routes that would meet and interact in Lawrence. The recommended service levels for the initial service between Topeka and Lawrence are to provide three trips at a one hour frequency in each direction in the morning and evening peak periodsThe second segment, between Overland Park and Lawrence, already exists in the form of the K-10 Connector, which is operated by JCT. These service levels can be increased with demand.
The most important facility issue related to corridor transit service is identifying a suitable facility and location in Lawrence. Ideally, this location would accommodate the two routes, converging to allow passengers to transfer. Secondly, it would also be beneficial if the site also allowed passengers easy transfer access to the local Lawrence system.
Park and ride locations are also needed throughout this intercity transit system. This would include locations in Lawrence and Topeka. Other

I-70 Corridor Transit Feasibility Study
58
facilities would include two stops with bus shelters in Topeka and additional stop locations in Lawrence.
The estimated operating cost for the segment between Lawrence and Topeka is $563,000. The estimated capital cost, including the purchase of vehicles, is estimated at $2.08 million.

Appendix | I-70 Corridor Transit Feasibility Study
A-1
Appendix

Appendix | I-70 Corridor Transit Feasibility Study
A-2
Operations Cost Methodology
For the purpose of developing operating cost estimates for the service concepts that were evaluated as part of the study effort, the Kansas City Area Transportation Authority (KCATA) service cost allocation model was utilized. The KCATA operates four commuter express routes in the Kansas City metro. These routes have operating characteristics similar to the study concepts. Direct operating costs and indirect operating costs were determined for each of these routes using the KCATA cost allocation model. A cost-per-service mile was calculated for each route (see Table A1). These costs per mile were then used to calculate an estimated operating cost for the study concepts seen in Table A2.
Table A1 KCATA Commuter Route Operating Costs
KCATA Route Direct Cost
Indirect Cost Total Cost Annual
Miles Direct
Cost per Mile
Indirect Cost
per Mile
Total Cost
per Mile Indirect
Cost Rate
Liberty Express $92,186 $136,782 $228,968 37,995 $2.43 $3.60 $6.03 60% Lee's Summit/ Raytown Express $187,055 $302,022 $489,077 83,895 $2.23 $3.60 $5.83 62%
Blue Springs Express $224,115 $336,906 $561,021 93,585 $2.39 $3.60 $5.99 60%
71 Highway Express $197,866 $282,744 $480,610 78,540 $2.52 $3.60 $6.12 59%
Total $701,222 $1,058,454 $1,759,676 294,015 $2.38 $3.60 $5.98 60%
Table A2 Recommended Concept Route Operating Costs
Concept Route Annual Miles
Direct Cost per Mile
Indirect Cost per
Mile Total Cost
per Mile Estimated
Annual Cost
Lawrence/Topeka 93,506 $2.38 $3.60 $5.98 $559,167 Lawrence/Kansas City 44,243 $2.38 $3.60 $5.98 $264,310

Appendix | I-70 Corridor Transit Feasibility Study
A-3
Operating Cost Recovery Methodology
Route – The routes are separated into two groups. The first group includes KCATA commuter routes. These routes were selected because they are both a good comparison to the operational characteristics of the recommended concept routes. The second group includes the three recommended concept routes for the I-70 and K-10 corridors.
Annual Operating Cost – The annual operating cost is defined as the funds needed to operate a given route on a weekday only schedule for one calendar year.
Operating Cost Recovery Rate – The operating cost recovery rate shows what rate of the operating cost is recovered by the total amount of fares paid by riders.
Potential Revenue (Full Fare) – The potential revenue is the amount of funds collected if all riders paid the full fare.
Full Fare – The full fare is the amount charged for a one-way trip for riders who are ineligible for reduced fares. While the full fare for the KCATA routes differ depending on the route, the fares for the recommended concept routes all use the current full-fare charge for a one-way trip on the K-10 Connector, plus an additional 25 cents to accommodate for any future inflation and/or fare increase.
Actual Revenue – The actual revenue shows the total amount of money recovered from the fares paid by riders.
Net Fare – The net fare is the average amount charged for each rider when including those paying reduced fares (e.g., riders who have a monthly pass, senior citizens, youths, and those with disabilities). This amount was found by multiplying the net fare ratio by each route’s full fare cost.
Net Fare Ratio – The net fare ratio is the ratio of the full fare received when the reduced fares are included. The ratios for the KCATA were found by dividing the actual revenue by the potential revenue. The average of the four KCATA net fare ratios were used in determining which net fare ratio should be used for the recommended concept routes. The average net fare ratio of 62 percent was also used to determine the expected revenue and the operating cost recovery rate for each of the three recommended concept routes.
Refer to Table A3 for a comparison of the four KCATA routes and the recommended concept routes in reference to operating cost recovery.

Appendix | I-70 Corridor Transit Feasibility Study
A-4
Table A3 Operating Cost Recovery
Route Annual Cost
Op. Cost Recovery
Rate
Potential Revenue
(Full Fare) Full Fare
Actual Revenue (Net Fare)
Net Fare Net Fare Ratio
KCATA COMMUTER ROUTES 71-Hwy Express $211,186 24% $81,855 $2 $51,107 $0.94 62%
Blue Springs Express $239,351 49% $193,545 $3 $117,282 $1.82 61%
Lee's Summit/ Raytown Express
$199,920 51% $171,360 $3 $102,759 $1.80 60%
Liberty Express $98,175 40% $58,905 $3 $38,779 $1.98 66% Average 62%
RECOMMENDED CONCEPT ROUTES Topeka - Lawrence $559,167 48% $435,094 $3.75 $270,338 $2.33 62%
Lawrence - Kansas City $264,310 37% $157,781 $3.75 $98,035 $2.33 62%
Lawrence -Overland Park $677,587 40% $430,313 $3.75 $267,368 $2.33 62%


![CLASSIC LEGEND TIMES - northernchapter.com1].pdf · CHAPTER H.O.G. Let s Ride! Chapter Dinner Rides Thursday, August 21st 6:30pm Off Menu Thursday, August 14th 6:30pm Off Menu Line](https://img.pdfslide.us/doc/110x75/5f134f0a3626e25f9055c25f/classic-legend-times-1pdf-chapter-hog-let-s-ride-chapter-dinner-rides.jpg)