Embed Size (px)
Citation preview

Abstract. From late November 1996 to early July 1998 velocity mea-surements were made at two moorings within a constriction inMakassar Strait near 3°S. The 1997 average throughflow is 9.3 Sv,with an uncertainty of about ± 2.5 Sv depending on how the surfaceflow is taken into account. The results show that throughflow withinMakassar Strait can account for all of the Pacific to Indian interoceantransport. The correlation of transport to ENSO may be as high as0.73, though the time series is too short to say this with assurance.Most of the remaining variance is explained by the annual cycle, witha June maximum and December minimum. A strong intra-seasonalevent occurs from late May to July, 1997.
Introduction
Velocity and temperature were measured at various depthswithin Makassar Strait as part of the Indonesian-US Arlindo program[Gordon et al., 1998]. This was accomplished at two moorings, MAK-1 (23 November 1996 to 8 July 1998) and MAK-2 (1 December 1996to 21 February 1998), deployed near 3°S within the Labani Channel,a 2000 m deep, 45 km wide constriction in Makassar Strait (Figure1). West of the Labani channel is a <10 m deep coral reef rimming abroad promontory of generally <30 m deep, confining the throughflowto the Labani channel. This paper presents the along channel currentsand transport estimates for Makassar Strait based on the time seriesrecords from Aanderaa current meters on each mooring, set at depthsof 200, 250, 350, 750 and 1500 db (for zero wire angle; the 1500 dbinstrument was only on MAK-1). Each mooring had an upward look-ing ADCP at 150 m, but only a partial record at MAK-2 was recov-ered. Temperature and pressure sensors were attached to the mooringline [Ffield, A., K. Vranes, A. Gordon, R. Susanto, S. Garzoli, Tem-perature variability within Makassar Strait, submitted to Geophys.Res. Lett.]. Blowover of the moorings, primarily a result of strongsemi-diurnal tides, was substantial. For example, 90% of the MAK-1200 m instrument values varied from 204 db to 336 db depth, with amean depth of 248 db.
Background
Model research reveals dependence of Pacific and IndianOcean heat and freshwater budgets on the Indonesian Sea throughflow[Toole and Raymer, 1985; Wijffels et al., 1992; Hirst and Godfrey,1993; Gordon and McClean, 1999]. Heat and freshwater flux into theIndian Ocean at the expense of the Pacific may affect tropical SSTpatterns and atmosphere-ocean coupling with potential impacts onthe ENSO and monsoon phenomena [Schneider, 1998; Webster et al.,1998]. Observations indicate that the throughflow is composed mostlyof North Pacific thermocline and intermediate water flowing throughMakassar Strait [Gordon and Fine, 1996]. In the deep channels eastof Sulawesi, South Pacific water infiltrates into the lower thermocline
of the Banda Sea and dominates the deeper layers, through densitydriven overflow [Ilahude and Gordon, 1996; Hautala et al., 1996].Wajsowicz [1996] model throughflow is carried by the western most(friction-determined) channel; Makassar Strait is the westernmost deepchannel.
Indonesian throughflow transport estimates based on obser-vations and models range from near zero to 30 Sv [Lukas et al., 1996;Godfrey, 1996]. Measurements in the Lombok Strait [Murray and
Throughflow within Makassar Strait
Arnold L. Gordon, R. Dwi Susanto1, and Amy Ffield
Lamont-Doherty Earth Observatory of Columbia University, Palisades, New York
Lom
bok
x
x x xx
x
x
xxx
x
x x x x
x
x
x
x
xx
x
x
x
xxxxxxxxxxx x x x x xxxxxx
x
x
xx
x
x
x
x
x
xxxx
xxxxxx
x
x
x
xxxx
x
x
x
x
x x
x
x
x
x
xx
x
x
xx
116 E 118 E 120 E 122 E
8 S
6 S
4 S
2 S
0
2 N
Java Sea
LabaniChannel
Flores Sea
Mak
assa
r Stra
itDewakang
Sill
Sulawesi Sea
Sulawesi
Kalimantan
MAK-1
MAK-2
11
2
2
2
4
Figure 1. The position (triangles) of the 1996-98 moorings in Makassar Strait,MAK-1 (2° 52' S, 118°27' E) and MAK-2 (2°51’S; 118°38’E). Posi-tion of bottom pressure and inverted echo sounders sensors (PIES)are shown by the solid box symbols. Arlindo CTD stations obtainedfrom 1993 to 1998 are shown by solid circles The shaded area is lessthan 500 m depth. The isobaths are labeled in km.
Arief, 1988] from January 1985 to January 1986 show an averagetransport of 1.7 Sv. The mean transport between the sea surface and1250 m in the Timor Passage from March 1992 to April 1993 is 4.3Sv [Molcard et al., 1996]. The throughflow within the upper 400meters passing westward between Java and Australia is estimated from1983 to 1989 XBT data [Meyers, 1996] to be 5 Sv, with a 12 SvAugust-September maximum, and essentially zero transport in May-June and again in October-November. Potemra et al. [1997] modelstudy finds a northern summer maximum of 11 Sv, and a winter mini-mum of 4 Sv, with a 7.4 Sv 9-year mean. Gordon et al. [1997] find 9Sv of Indonesian throughflow water embedded within the Indian OceanSouth Equatorial Current.
Makassar Currents and Transport
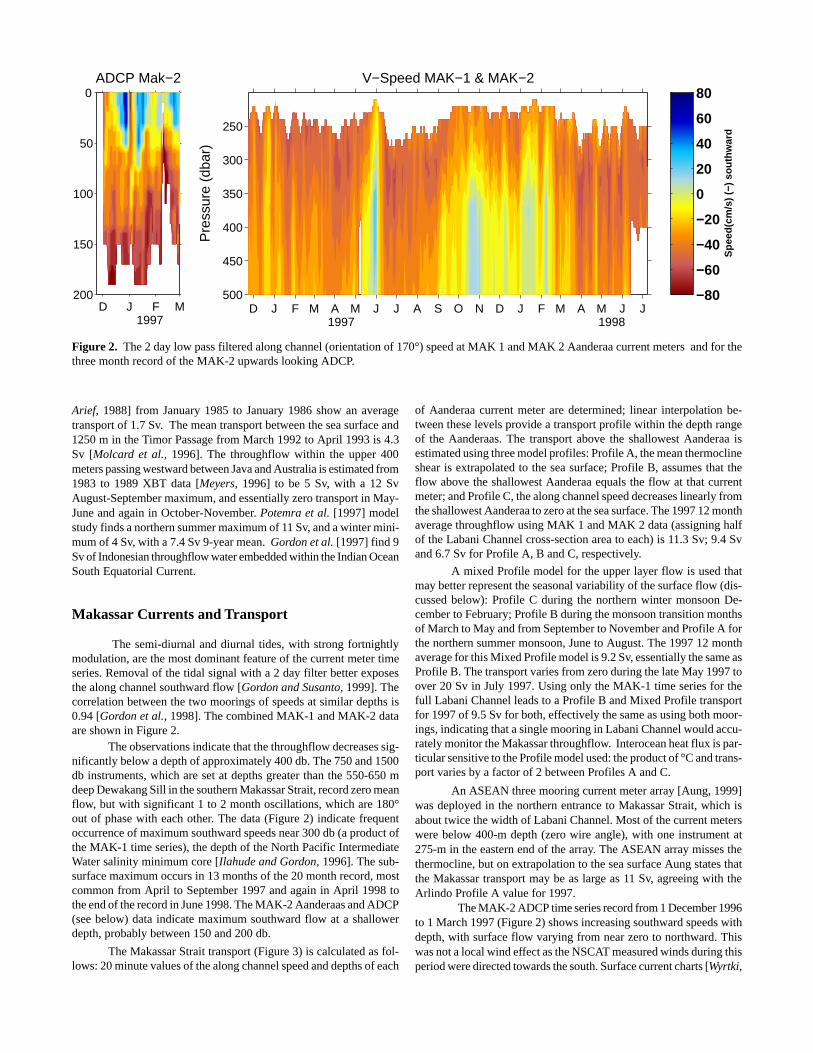
The semi-diurnal and diurnal tides, with strong fortnightlymodulation, are the most dominant feature of the current meter timeseries. Removal of the tidal signal with a 2 day filter better exposesthe along channel southward flow [Gordon and Susanto, 1999]. Thecorrelation between the two moorings of speeds at similar depths is0.94 [Gordon et al., 1998]. The combined MAK-1 and MAK-2 dataare shown in Figure 2.
The observations indicate that the throughflow decreases sig-nificantly below a depth of approximately 400 db. The 750 and 1500db instruments, which are set at depths greater than the 550-650 mdeep Dewakang Sill in the southern Makassar Strait, record zero meanflow, but with significant 1 to 2 month oscillations, which are 180°out of phase with each other. The data (Figure 2) indicate frequentoccurrence of maximum southward speeds near 300 db (a product ofthe MAK-1 time series), the depth of the North Pacific IntermediateWater salinity minimum core [Ilahude and Gordon, 1996]. The sub-surface maximum occurs in 13 months of the 20 month record, mostcommon from April to September 1997 and again in April 1998 tothe end of the record in June 1998. The MAK-2 Aanderaas and ADCP(see below) data indicate maximum southward flow at a shallowerdepth, probably between 150 and 200 db.
The Makassar Strait transport (Figure 3) is calculated as fol-lows: 20 minute values of the along channel speed and depths of each
of Aanderaa current meter are determined; linear interpolation be-tween these levels provide a transport profile within the depth rangeof the Aanderaas. The transport above the shallowest Aanderaa isestimated using three model profiles: Profile A, the mean thermoclineshear is extrapolated to the sea surface; Profile B, assumes that theflow above the shallowest Aanderaa equals the flow at that currentmeter; and Profile C, the along channel speed decreases linearly fromthe shallowest Aanderaa to zero at the sea surface. The 1997 12 monthaverage throughflow using MAK 1 and MAK 2 data (assigning halfof the Labani Channel cross-section area to each) is 11.3 Sv; 9.4 Svand 6.7 Sv for Profile A, B and C, respectively.
A mixed Profile model for the upper layer flow is used thatmay better represent the seasonal variability of the surface flow (dis-cussed below): Profile C during the northern winter monsoon De-cember to February; Profile B during the monsoon transition monthsof March to May and from September to November and Profile A forthe northern summer monsoon, June to August. The 1997 12 monthaverage for this Mixed Profile model is 9.2 Sv, essentially the same asProfile B. The transport varies from zero during the late May 1997 toover 20 Sv in July 1997. Using only the MAK-1 time series for thefull Labani Channel leads to a Profile B and Mixed Profile transportfor 1997 of 9.5 Sv for both, effectively the same as using both moor-ings, indicating that a single mooring in Labani Channel would accu-rately monitor the Makassar throughflow. Interocean heat flux is par-ticular sensitive to the Profile model used: the product of °C and trans-port varies by a factor of 2 between Profiles A and C.
An ASEAN three mooring current meter array [Aung, 1999]was deployed in the northern entrance to Makassar Strait, which isabout twice the width of Labani Channel. Most of the current meterswere below 400-m depth (zero wire angle), with one instrument at275-m in the eastern end of the array. The ASEAN array misses thethermocline, but on extrapolation to the sea surface Aung states thatthe Makassar transport may be as large as 11 Sv, agreeing with theArlindo Profile A value for 1997.
The MAK-2 ADCP time series record from 1 December 1996to 1 March 1997 (Figure 2) shows increasing southward speeds withdepth, with surface flow varying from near zero to northward. Thiswas not a local wind effect as the NSCAT measured winds during thisperiod were directed towards the south. Surface current charts [Wyrtki,
D J F M A M J J A S O N D J F M A M J J500
450
400
350
300
250
1997 1998
Pre
ssur
e (d
bar)
V−Speed MAK−1 & MAK−2
Spe
ed(c
m/s
) (−
) so
uthw
ard
−80
−60
−40
−20
0
20
40
60
80
D J F M200
150
100
50
0
1997
ADCP Mak−2
Figure 2. The 2 day low pass filtered along channel (orientation of 170°) speed at MAK 1 and MAK 2 Aanderaa current meters and for thethree month record of the MAK-2 upwards looking ADCP.

1961; Defense Mapping Agency, 1993] show weak flow to the southin the northern winter monsoon, with strong flow to the south in thesummer monsoon. Five satellite tracked drifters launched in the Pa-cific passed into Makassar Strait, before disappearing at the southernlimits of the Strait [p.c., Don Olson, January 1999]. Observationssuggest that the surface flow is weak in the winter, strong to the southin the summer. Model results suggest similar temporal dependence.Potemra et al. [1997] using the POCM model driven by ECMWFwinds, find that Ekman transport in the Indonesian Seas is near zeroor directed towards the Pacific in the winter months, with strong In-dian Ocean bound Ekman transport in summer. The POP model re-sults display a surface (upper 100 m) flow towards the north inMakassar Strait during the winter, and towards the south in the sum-mer months [p.c. McClean, February 1999]. Surface flow reversalmay be due to the strong monsoonal zonal wind across the southernboundary of Makassar Strait [Java and Flores Seas; Wyrtki, 1961]relative to the weak monsoonal winds in the northern boundary ofMakassar Strait (Sulawesi Sea).
The MAK moorings were deployed during a La Niña phase.An El Niño condition began in March 1997, becoming extreme dur-ing 1997 summer and fall, relaxing in early 1998. Observational andmodel studies suggest the throughflow is modulated by ENSO, withlarger transports during La Niña and smaller transports during El Niño[Meyers, 1996; Fieux et al., 1996; Potemra et al., 1997; Gordon andMcClean, 1999]. The monthly transport determined from MAK-1reveals some correspondence to the Nino3 SST anomaly (Figure 4a).During the El Niño months December 1997 to February 1998 theProfile B transport average is 5.1 Sv, while during the La Niña monthsof December 1996 to February 1997 the average is 12.5 Sv, a 2.5 folddifference. The correlation of throughflow transport to ENSO (ex-pressed as the negative of its Nino3 proxy, Figure 4b) for Profile B is0.73, and 0.53 for the Mixed Profile model, though the time series isfar too short to say this with assurance. In Figure 4b, a zero Nino3anomaly value corresponds to a mean transport of approximately 12
Sv. Fitting an annual curve to the transport residual after the meantransport and the ENSO dependence are removed (Figure 4c) sug-gests a maximum transport in June, minimum in December. Others[Meyers, 1996; Potemra et al., 1997] have found a summer maxi-mum, winter minimum in the throughflow. Removing the mean trans-port, the ENSO dependence and the annual influence (Figure 4d)leaves a near zero residual except for a large negative anomaly (mini-mum throughflow) in May 1997 and positive anomaly in July 1997.From early June to mid-June the throughflow transport increases(Mixed Profile) from near zero to 18 Sv. It is suggested that these twohigher frequency features are linked. Averaging the negative and posi-tive anomaly transports leads to a zero anomaly for May to July. Thisfeature may be driven by Indian Ocean Kelvin Waves [Murtugudde etal., 1998]. The slight reduction of the residual transport (Figure 4d)in May to June 1998 and that Meyers [1996] finds minimumthroughflow in May-June and again in October-November, suggeststhat a spring relaxation of the throughflow may be an annual event.
D J F M A M J J A S O N D J F M A M J-5
0
5
10
15
20
25T
rans
port
(S
v)
1997 1998
Throughflow transport within Labani Channel, (+) SOUTHWARD
Mak1 & Mak2, Profile A Mak1 & Mak2, Profile B Mak1 & Mak2, Profile C Mak1 & Mak2 Mixed Profile
Figure 3. Throughflow transport based on 1 week low pass filter val-ues within Makassar Strait, for the four speed versus depth modelprofiles described in the text. Data from both moorings are used to theend of the MAK-2 record in February 1998, after which only the MAK-1 data is used. The throughflow transport towards the Indian Ocean,towards the south, is displayed as positive values.
D J F M A M J J A S O N D J F M A M J0
5
10
15
20(a)
Tra
nspo
rt (
Sv)
1997 1998
Transport MAK1 Profile BTransport MAK1 Mixed 2.5*NINO3+13
4 3.5 3 2.5 2 1.5 1 0.5 0 0.5 10
5
10
15
20(b)
Tra
nspo
rt (
Sv)
Nino3
Transport Profile B Transport Mixed Nino3 fit Profile B, r=0.73Nino3 fit Mixed, r=0.53
D J F M A M J J A S O N D J F M A M J10
5
0
5
10(c)
Res
idua
l Tra
nspo
rt (
Sv)
1997 1998
Profile B (Nino3 + MT) Mixed (Nino3 + MT) Ann fitted B, rms=2.59Sv Ann fitted Mixed, rms=2.97Sv
D J F M A M J J A S O N D J F M A M J-10
-5
0
5
10(d)
Res
idua
l Tra
nspo
rt (
Sv)
1997 1998
Profile B (Nino3 + Ann + MT)Mixed (Nino3 + Ann + MT)
Figure 4. a) Monthly volume transport (Profile B and Mixed Profilemodels) based on MAK-1 time series and its relation to Nino3 SSTanomaly. As a positive Nino3 SST anomaly (El Niño) correspondsto low throughflow transport the Nino3 value is adjusted and expressedas a negative to allow its representation on the transport versus timeplot. b) Linear fit of monthly transport to Nino3 SST anomaly forProfile B and for the Mixed Profile models. c) Residual transportafter the mean throughflow (MT) and the Nino3 dependence are re-moved. An annual curve (Ann) is fit to the residual for both Profiles.d) Residual monthly transport with the mean throughflow, the Nino3dependence and annual curve removed.

Conclusions
Along channel currents and transport measured by the MAK-1 and MAK-2 current meters indicate the presence of large southwardtransport within Makassar Strait including variability over a wide rangeof scales. A throughflow maximum often occurs within the ther-mocline, mostly during the times of high throughflow. Our resultsindicate that the Indonesian throughflow for 1997 within MakassarStrait is about 9 to 10 Sv, which can account for all of the interoceantransport as estimated from (albeit scant) observations and models.
Many questions remain: How typical are the 1996-98 MakassarStrait results of the longer term climatic condition? And how doesthe flow within the upper 200 m vary relative to the thermocline flow?To quantify the climatic importance of the throughflow both the mag-nitude and source and their variability must be measured over ENSOtime scales. The data indicate that within Labani channel a singlemooring may be used to capture the Makassar throughflow and itsthermal field.
Acknowledgments. The research is funded by NSF: OCE95-29648 and the Office of Naval Research: N00014-98-1-0270. Weare much appreciative of the support of Dale Pillsbury’s mooring group(Walt Waldorf, Jay Simpkins and Dennis Root) at Oregon State Uni-versity. We thank Bruce Huber and Phil Mele for the support in datacollection and processing. Gratitude is extended to Dr. IndroyonoSoesilo and Basri M. Ganie of BPPT for arranging for the joint pro-gram. Lamont-Doherty Contribution Number 5976.
References
Defense Mapping Agency, Sailing Directions for Borneo, Jawa, Sulawesiand Nusa Tenggara, publication 163 Defense Mapping Agency of the USA,1993.
Aung, T.H., Indo-Pacific throughflow and its seasonal variations. Proc. ofThe ASEAN-Australia Regional Ocean Dynamics Expeditions 1993-1995,symposium in Lombok, Indonesia in June 1995, edited by G. Cresswelland G. Wells, Australian Marine Science and Technology Limited. In Press,1999.
Fieux M., R. Molcard, and A.G. Ilahude, Geostrophic transport of the Pa-cific-Indian Oceans throughflow, J. Geophys.Res., 101(5), 12421-12432,1996.
Godfrey, J.S., The effect of the Indonesian throughflow on ocean circulationand heat exchange with the atmosphere: A review, J. Geophys. Res.,
101(C5), 12,217-12,238, 1996.Gordon, A.L., and R. Fine, Pathways of water between the Pacific and Indian
oceans in the Indonesian seas, Nature, 379(6561), 146-149, 1996.Gordon, A.L., S. Ma, D.B. Olson, P. Hacker, A. Ffield, L.D. Talley, D. Wil-
son, and M. Baringer, Advection and Diffusion of Indonesian Throughflowwithin the Indian Ocean South Equatorial Current, Geophys. Res. Lett.,
24(21), 2573-2576, 1997.Gordon, A.L., R.D. Susanto, A. Ffield, and D. Pillsbury, Makassar Strait Trans-
port: Preliminary Arlindo results from MAK-1 and MAK-2, International
WOCE News-letter, 33, 30-32, 1998.Gordon, A.L., and J. McClean, Thermohaline Stratification of the Indone-
sian Seas-Model and Observations, J. Phys. Oceanogr., 29(2),198-216,1999.
Gordon, A.L., and R.D. Susanto, Makassar Strait Transport: Initial estimatebased on Arlindo Results, Marine Technology Society, 32(4), 34-45, 1999.
Hautala, S., J. Reid, and N. Bray, The distribution and mixing of Pacificwater masses in the Indonesian Seas, J. Geophys. Res., 101(C5), 12375-12389, 1996.
Hirst, A.C., and J.S. Godfrey, The Role of Indonesian Throughflow in aGlobal Ocean GCM, J. Phys. Oceanogr., 23(6), 1057-1086, 1993.
Ilahude, A.G., and A.L. Gordon, Thermocline Stratification Within the Indo-nesian Seas, J. Geophys. Res., 101(C5), 12401- 12409, 1996.
Lukas, R., T. Yamagata, and J.P. McCreary, Pacific low-latitude westernboundary currents and the Indonesian throughflow, J. Geophys. Res., 101(C5), 12209-12216, 1996.
Meyers, G., Variation of Indonesian throughflow and the El Niño SouthernOscillation, J. Geophys. Res., 101, 12,255-12,263, 1996.
Molcard R., M. Fieux, and A.G. Ilahude, The Indo-Pacific throughflow inthe Timor Passage, J. Geophys. Res., 101(5), 12411- 12420, 1996.
Murray, S.P., and D. Arief, Throughflow into the Indian Ocean through theLombok Strait. January 1985-January 1986, Nature, 333, 444-447, 1988.
Murtugudde, R., A.J. Busalacchi, and J. Beauchamp, Seasonal-to-interannualeffects of the Indonesian throughflow on the tropical Indo-Pacific Basin,J. Geophys. Res., 103(C10), 21425-21441, 1998.
Potemra, J., R. Lukas, and G. Mitchum, Large-scale estimation of transportfrom the Pacific to the Indian Ocean, J. Geophys. Res., 102(C13), 27,795-27,812, 1997.
Schneider, N., The Indonesian throughflow and the global climate system, J.
Climate, 11(4), 676-689, 1998.Toole, J., and M. Raymer, Heat and fresh water budgets of the Indian Ocean—
revisited, Deep-Sea Res., 32, 917-928, 1985.Wajsowicz, R.C., Flow of a western boundary current through multiple straits:
An electrical circuit analogy for the Indonesian throughflow and archi-pelago, J. Geophys. Res., 101(C5), 12,295-12,300, 1996.
Webster, P., V. Magaña, T. Palmer, J. Shukla, R. Tomas, M. Yanai, and T.Yasunari, Monsoon: processes, predictability, and the prospects for pre-diction, J. Geophys. Res., 103(C7), 14,451-14,510, 1998.
Wijffels, S., R. Schmitt, H. Bryden, and A. Stigebrandt, On the transport offreshwater by the oceans, J. Phys. Oceanogr., 22(2), 155-162, 1992.
Wyrtki, K., Physical oceanography of Southeast Asian waters, NAGA Rep.2, 195 pp, 1961.
A.Gordon, R. Susanto and A. Ffield, Lamont-Doherty Earth Observtoryof Columbia University, Route 9W, Palisades, NY 10964(agordon, dwi or [email protected])


![Throughflow within Makassar Straitagordon/publications/grl...1961; Defense Mapping Agency, 1993] show weak flow to the south in the northern winter monsoon, with strong flow to the](https://img.pdfslide.us/doc/110x75/5c9bb3b009d3f2ee128ba86b/throughflow-within-makassar-strait-agordonpublicationsgrl1961-defense-mapping.jpg)